New Haven, IN Map & Demographics
New Haven Map
New Haven Overview
$30,755
PER CAPITA INCOME
$74,273
AVG FAMILY INCOME
$63,744
AVG HOUSEHOLD INCOME
28.2%
WAGE / INCOME GAP [ % ]
71.8¢/ $1
WAGE / INCOME GAP [ $ ]
0.36
INEQUALITY / GINI INDEX
15,552
TOTAL POPULATION
7,354
MALE POPULATION
8,198
FEMALE POPULATION
89.70
MALES / 100 FEMALES
111.48
FEMALES / 100 MALES
38.4
MEDIAN AGE
3.0
AVG FAMILY SIZE
2.4
AVG HOUSEHOLD SIZE
7,934
LABOR FORCE [ PEOPLE ]
66.8%
PERCENT IN LABOR FORCE
4.4%
UNEMPLOYMENT RATE
New Haven Zip Codes
New Haven Area Codes
Income in New Haven
Income Overview in New Haven
Per Capita Income in New Haven is $30,755, while median incomes of families and households are $74,273 and $63,744 respectively.
| Characteristic | Number | Measure |
| Per Capita Income | 15,552 | $30,755 |
| Median Family Income | 3,996 | $74,273 |
| Mean Family Income | 3,996 | $83,202 |
| Median Household Income | 6,398 | $63,744 |
| Mean Household Income | 6,398 | $73,630 |
| Income Deficit | 3,996 | $0 |
| Wage / Income Gap (%) | 15,552 | 28.22% |
| Wage / Income Gap ($) | 15,552 | 71.78¢ per $1 |
| Gini / Inequality Index | 15,552 | 0.36 |
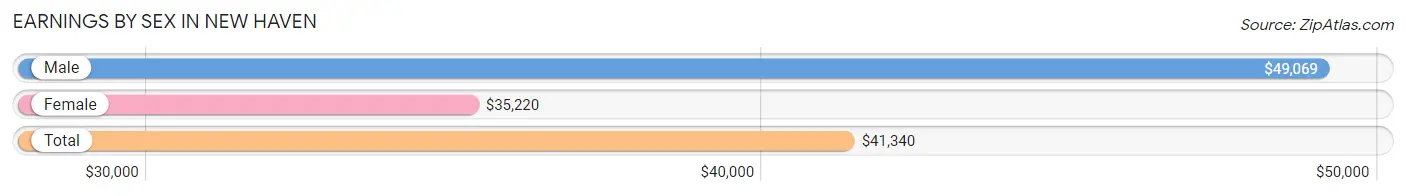
Earnings by Sex in New Haven
Average Earnings in New Haven are $41,340, $49,069 for men and $35,220 for women, a difference of 28.2%.
| Sex | Number | Average Earnings |
| Male | 4,123 (50.7%) | $49,069 |
| Female | 4,001 (49.2%) | $35,220 |
| Total | 8,124 (100.0%) | $41,340 |
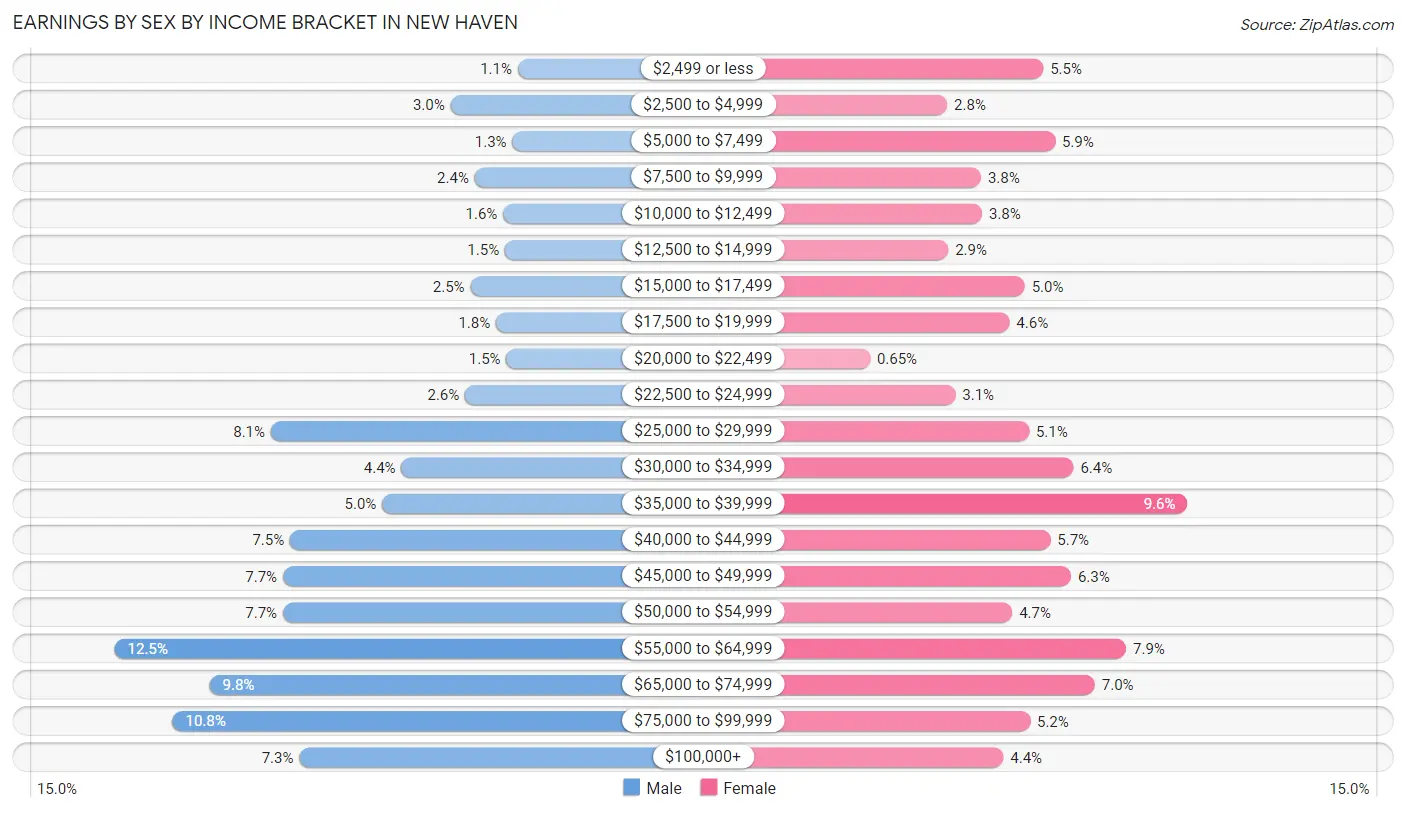
Earnings by Sex by Income Bracket in New Haven
The most common earnings brackets in New Haven are $55,000 to $64,999 for men (514 | 12.5%) and $35,000 to $39,999 for women (383 | 9.6%).
| Income | Male | Female |
| $2,499 or less | 47 (1.1%) | 221 (5.5%) |
| $2,500 to $4,999 | 125 (3.0%) | 113 (2.8%) |
| $5,000 to $7,499 | 53 (1.3%) | 234 (5.9%) |
| $7,500 to $9,999 | 97 (2.4%) | 151 (3.8%) |
| $10,000 to $12,499 | 64 (1.5%) | 152 (3.8%) |
| $12,500 to $14,999 | 62 (1.5%) | 114 (2.9%) |
| $15,000 to $17,499 | 102 (2.5%) | 200 (5.0%) |
| $17,500 to $19,999 | 72 (1.8%) | 183 (4.6%) |
| $20,000 to $22,499 | 60 (1.5%) | 26 (0.6%) |
| $22,500 to $24,999 | 108 (2.6%) | 122 (3.0%) |
| $25,000 to $29,999 | 333 (8.1%) | 205 (5.1%) |
| $30,000 to $34,999 | 182 (4.4%) | 255 (6.4%) |
| $35,000 to $39,999 | 204 (5.0%) | 383 (9.6%) |
| $40,000 to $44,999 | 311 (7.5%) | 229 (5.7%) |
| $45,000 to $49,999 | 319 (7.7%) | 252 (6.3%) |
| $50,000 to $54,999 | 319 (7.7%) | 186 (4.6%) |
| $55,000 to $64,999 | 514 (12.5%) | 314 (7.9%) |
| $65,000 to $74,999 | 404 (9.8%) | 279 (7.0%) |
| $75,000 to $99,999 | 447 (10.8%) | 206 (5.1%) |
| $100,000+ | 300 (7.3%) | 176 (4.4%) |
| Total | 4,123 (100.0%) | 4,001 (100.0%) |
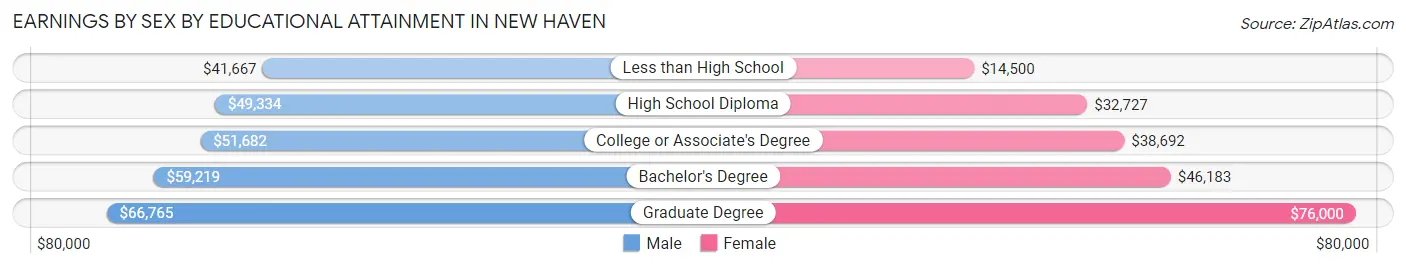
Earnings by Sex by Educational Attainment in New Haven
Average earnings in New Haven are $51,774 for men and $40,121 for women, a difference of 22.5%. Men with an educational attainment of graduate degree enjoy the highest average annual earnings of $66,765, while those with less than high school education earn the least with $41,667. Women with an educational attainment of graduate degree earn the most with the average annual earnings of $76,000, while those with less than high school education have the smallest earnings of $14,500.
| Educational Attainment | Male Income | Female Income |
| Less than High School | $41,667 | $14,500 |
| High School Diploma | $49,334 | $32,727 |
| College or Associate's Degree | $51,682 | $38,692 |
| Bachelor's Degree | $59,219 | $46,183 |
| Graduate Degree | $66,765 | $76,000 |
| Total | $51,774 | $40,121 |
Family Income in New Haven
Family Income Brackets in New Haven
According to the New Haven family income data, there are 1,091 families falling into the $50,000 to $74,999 income range, which is the most common income bracket and makes up 27.3% of all families. Conversely, the less than $10,000 income bracket is the least frequent group with only 36 families (0.9%) belonging to this category.
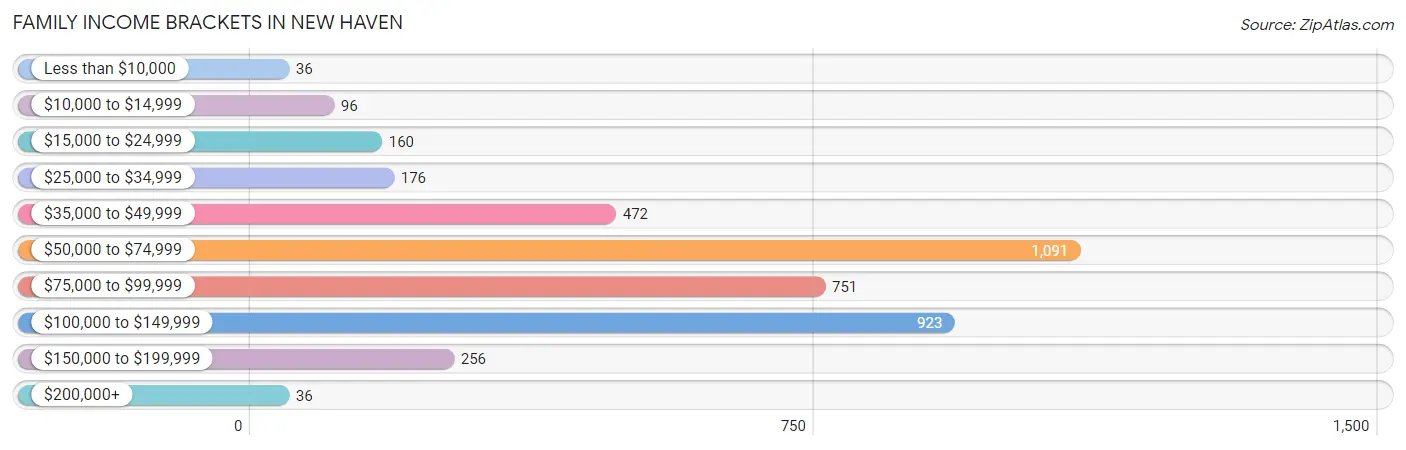
| Income Bracket | # Families | % Families |
| Less than $10,000 | 36 | 0.9% |
| $10,000 to $14,999 | 96 | 2.4% |
| $15,000 to $24,999 | 160 | 4.0% |
| $25,000 to $34,999 | 176 | 4.4% |
| $35,000 to $49,999 | 472 | 11.8% |
| $50,000 to $74,999 | 1,091 | 27.3% |
| $75,000 to $99,999 | 751 | 18.8% |
| $100,000 to $149,999 | 923 | 23.1% |
| $150,000 to $199,999 | 256 | 6.4% |
| $200,000+ | 36 | 0.9% |
Family Income by Famaliy Size in New Haven
6-person families (173 | 4.3%) account for the highest median family income in New Haven with $128,463 per family, while 2-person families (2,023 | 50.6%) have the highest median income of $33,800 per family member.
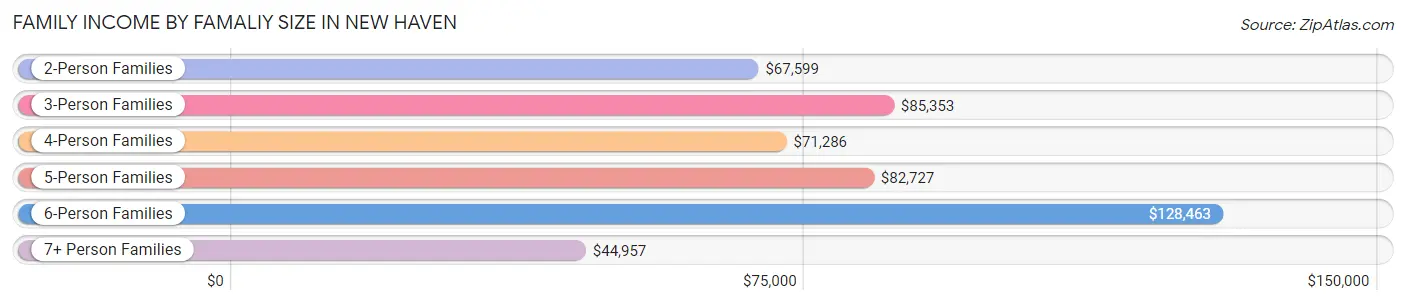
| Income Bracket | # Families | Median Income |
| 2-Person Families | 2,023 (50.6%) | $67,599 |
| 3-Person Families | 783 (19.6%) | $85,353 |
| 4-Person Families | 538 (13.5%) | $71,286 |
| 5-Person Families | 422 (10.6%) | $82,727 |
| 6-Person Families | 173 (4.3%) | $128,463 |
| 7+ Person Families | 57 (1.4%) | $44,957 |
| Total | 3,996 (100.0%) | $74,273 |
Family Income by Number of Earners in New Haven
The median family income in New Haven is $74,273, with families comprising 3+ earners (427) having the highest median family income of $126,705, while families with 1 earner (1,170) have the lowest median family income of $51,865, accounting for 10.7% and 29.3% of families, respectively.
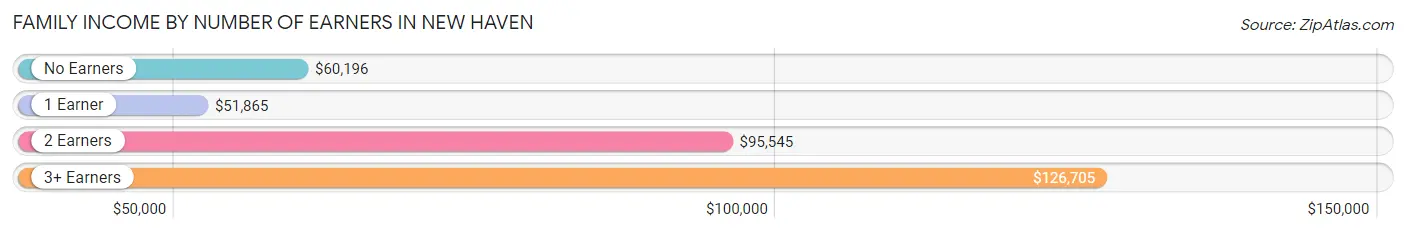
| Number of Earners | # Families | Median Income |
| No Earners | 646 (16.2%) | $60,196 |
| 1 Earner | 1,170 (29.3%) | $51,865 |
| 2 Earners | 1,753 (43.9%) | $95,545 |
| 3+ Earners | 427 (10.7%) | $126,705 |
| Total | 3,996 (100.0%) | $74,273 |
Household Income in New Haven
Household Income Brackets in New Haven
With 1,433 households falling in the category, the $50,000 to $74,999 income range is the most frequent in New Haven, accounting for 22.4% of all households. In contrast, only 90 households (1.4%) fall into the $200,000+ income bracket, making it the least populous group.
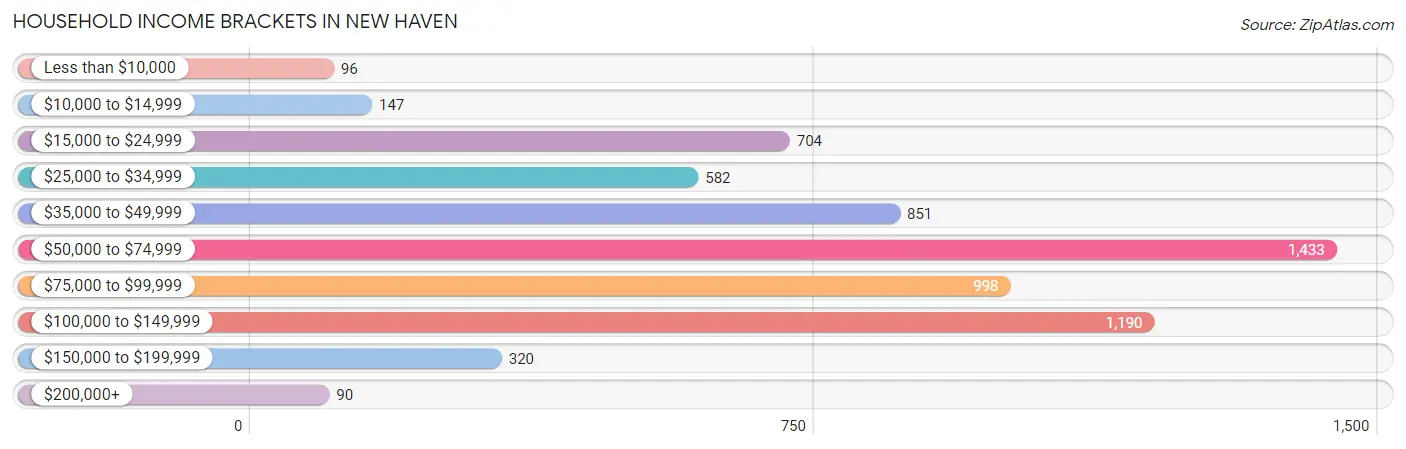
| Income Bracket | # Households | % Households |
| Less than $10,000 | 96 | 1.5% |
| $10,000 to $14,999 | 147 | 2.3% |
| $15,000 to $24,999 | 704 | 11.0% |
| $25,000 to $34,999 | 582 | 9.1% |
| $35,000 to $49,999 | 851 | 13.3% |
| $50,000 to $74,999 | 1,433 | 22.4% |
| $75,000 to $99,999 | 998 | 15.6% |
| $100,000 to $149,999 | 1,190 | 18.6% |
| $150,000 to $199,999 | 320 | 5.0% |
| $200,000+ | 90 | 1.4% |
Household Income by Householder Age in New Haven
The median household income in New Haven is $63,744, with the highest median household income of $76,087 found in the 25 to 44 years age bracket for the primary householder. A total of 2,050 households (32.0%) fall into this category. Meanwhile, the 65+ years age bracket for the primary householder has the lowest median household income of $41,294, with 1,791 households (28.0%) in this group.
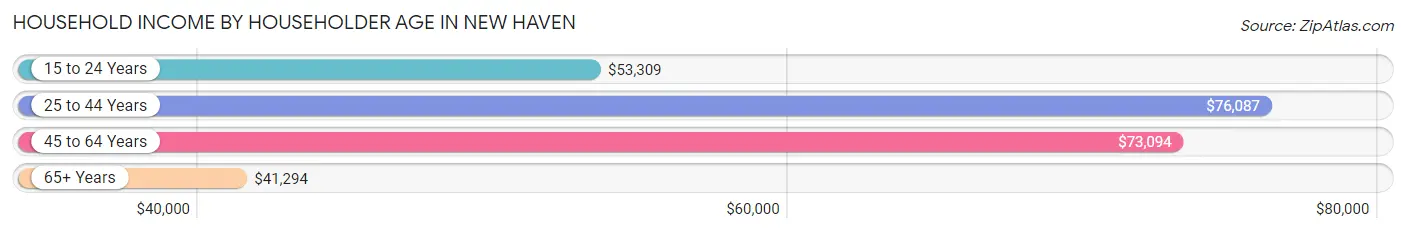
| Income Bracket | # Households | Median Income |
| 15 to 24 Years | 326 (5.1%) | $53,309 |
| 25 to 44 Years | 2,050 (32.0%) | $76,087 |
| 45 to 64 Years | 2,231 (34.9%) | $73,094 |
| 65+ Years | 1,791 (28.0%) | $41,294 |
| Total | 6,398 (100.0%) | $63,744 |
Poverty in New Haven
Income Below Poverty by Sex and Age in New Haven
With 7.0% poverty level for males and 8.3% for females among the residents of New Haven, 12 to 14 year old males and under 5 year old females are the most vulnerable to poverty, with 79 males (25.0%) and 82 females (13.3%) in their respective age groups living below the poverty level.
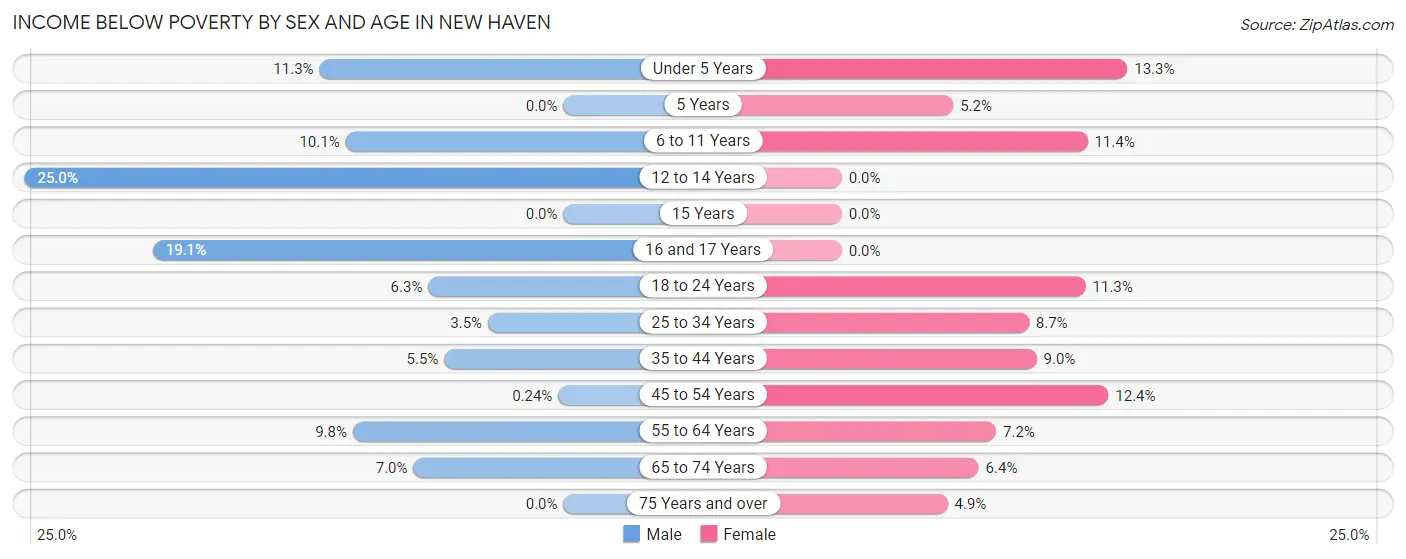
| Age Bracket | Male | Female |
| Under 5 Years | 71 (11.3%) | 82 (13.3%) |
| 5 Years | 0 (0.0%) | 3 (5.2%) |
| 6 to 11 Years | 72 (10.1%) | 65 (11.4%) |
| 12 to 14 Years | 79 (25.0%) | 0 (0.0%) |
| 15 Years | 0 (0.0%) | 0 (0.0%) |
| 16 and 17 Years | 16 (19.1%) | 0 (0.0%) |
| 18 to 24 Years | 33 (6.3%) | 71 (11.3%) |
| 25 to 34 Years | 32 (3.5%) | 93 (8.7%) |
| 35 to 44 Years | 51 (5.5%) | 89 (9.0%) |
| 45 to 54 Years | 2 (0.2%) | 107 (12.4%) |
| 55 to 64 Years | 102 (9.8%) | 71 (7.2%) |
| 65 to 74 Years | 55 (7.0%) | 53 (6.4%) |
| 75 Years and over | 0 (0.0%) | 34 (4.9%) |
| Total | 513 (7.0%) | 668 (8.3%) |
Income Above Poverty by Sex and Age in New Haven
According to the poverty statistics in New Haven, males aged 5 years and females aged 12 to 14 years are the age groups that are most secure financially, with 100.0% of males and 100.0% of females in these age groups living above the poverty line.
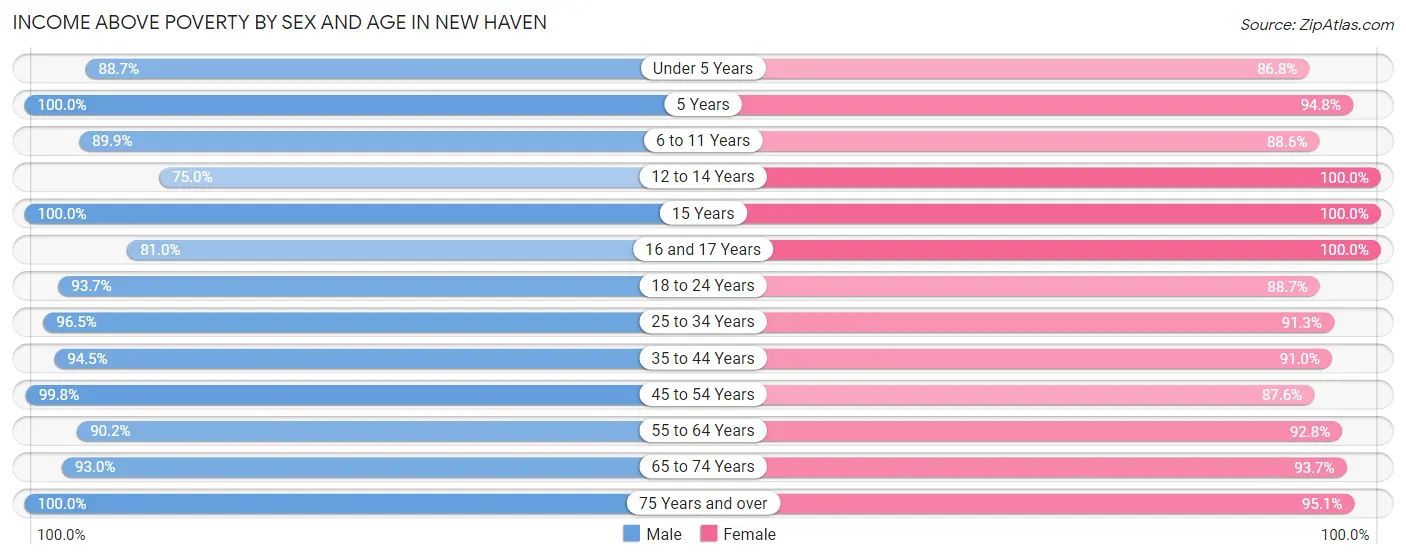
| Age Bracket | Male | Female |
| Under 5 Years | 556 (88.7%) | 537 (86.8%) |
| 5 Years | 85 (100.0%) | 55 (94.8%) |
| 6 to 11 Years | 640 (89.9%) | 505 (88.6%) |
| 12 to 14 Years | 237 (75.0%) | 438 (100.0%) |
| 15 Years | 115 (100.0%) | 80 (100.0%) |
| 16 and 17 Years | 68 (80.9%) | 249 (100.0%) |
| 18 to 24 Years | 493 (93.7%) | 557 (88.7%) |
| 25 to 34 Years | 882 (96.5%) | 978 (91.3%) |
| 35 to 44 Years | 872 (94.5%) | 896 (91.0%) |
| 45 to 54 Years | 838 (99.8%) | 758 (87.6%) |
| 55 to 64 Years | 942 (90.2%) | 920 (92.8%) |
| 65 to 74 Years | 735 (93.0%) | 781 (93.6%) |
| 75 Years and over | 327 (100.0%) | 658 (95.1%) |
| Total | 6,790 (93.0%) | 7,412 (91.7%) |
Income Below Poverty Among Married-Couple Families in New Haven
The poverty statistics for married-couple families in New Haven show that 0.4% or 13 of the total 2,989 families live below the poverty line. Families with 1 or 2 children have the highest poverty rate of 1.1%, comprising of 9 families. On the other hand, families with 3 or 4 children have the lowest poverty rate of 0.0%, which includes 0 families.
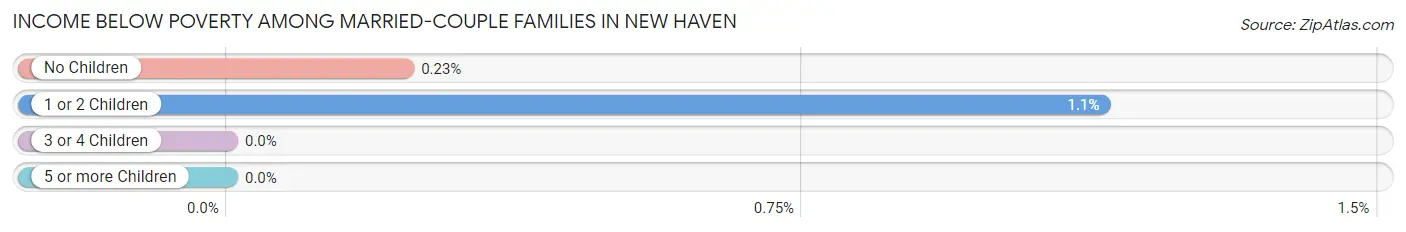
| Children | Above Poverty | Below Poverty |
| No Children | 1,713 (99.8%) | 4 (0.2%) |
| 1 or 2 Children | 783 (98.9%) | 9 (1.1%) |
| 3 or 4 Children | 434 (100.0%) | 0 (0.0%) |
| 5 or more Children | 46 (100.0%) | 0 (0.0%) |
| Total | 2,976 (99.6%) | 13 (0.4%) |
Income Below Poverty Among Single-Parent Households in New Haven
According to the poverty data in New Haven, 4.9% or 17 single-father households and 32.3% or 214 single-mother households are living below the poverty line. Among single-father households, those with 1 or 2 children have the highest poverty rate, with 17 households (8.3%) experiencing poverty. Likewise, among single-mother households, those with 1 or 2 children have the highest poverty rate, with 196 households (53.3%) falling below the poverty line.
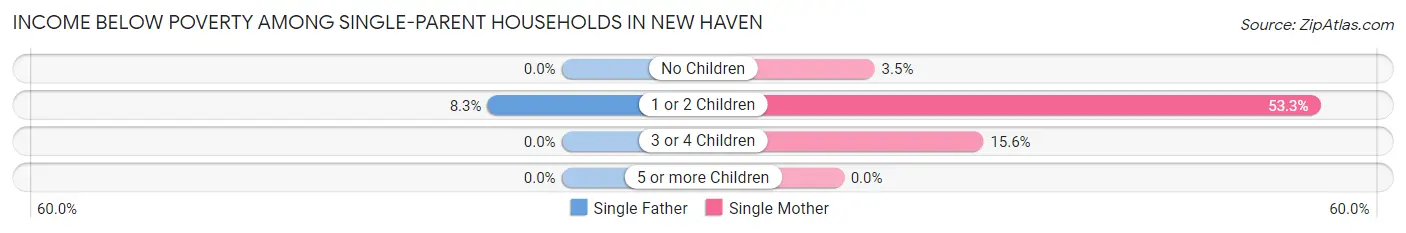
| Children | Single Father | Single Mother |
| No Children | 0 (0.0%) | 8 (3.5%) |
| 1 or 2 Children | 17 (8.3%) | 196 (53.3%) |
| 3 or 4 Children | 0 (0.0%) | 10 (15.6%) |
| 5 or more Children | 0 (0.0%) | 0 (0.0%) |
| Total | 17 (4.9%) | 214 (32.3%) |
Income Below Poverty Among Married-Couple vs Single-Parent Households in New Haven
The poverty data for New Haven shows that 13 of the married-couple family households (0.4%) and 231 of the single-parent households (22.9%) are living below the poverty level. Within the married-couple family households, those with 1 or 2 children have the highest poverty rate, with 9 households (1.1%) falling below the poverty line. Among the single-parent households, those with 1 or 2 children have the highest poverty rate, with 213 household (37.2%) living below poverty.
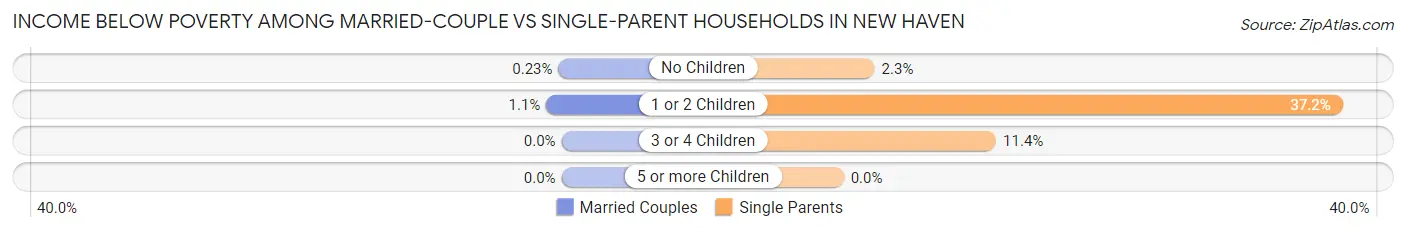
| Children | Married-Couple Families | Single-Parent Households |
| No Children | 4 (0.2%) | 8 (2.3%) |
| 1 or 2 Children | 9 (1.1%) | 213 (37.2%) |
| 3 or 4 Children | 0 (0.0%) | 10 (11.4%) |
| 5 or more Children | 0 (0.0%) | 0 (0.0%) |
| Total | 13 (0.4%) | 231 (22.9%) |
Race in New Haven
The most populous races in New Haven are White / Caucasian (13,950 | 89.7%), Hispanic or Latino (707 | 4.5%), and Black / African American (650 | 4.2%).
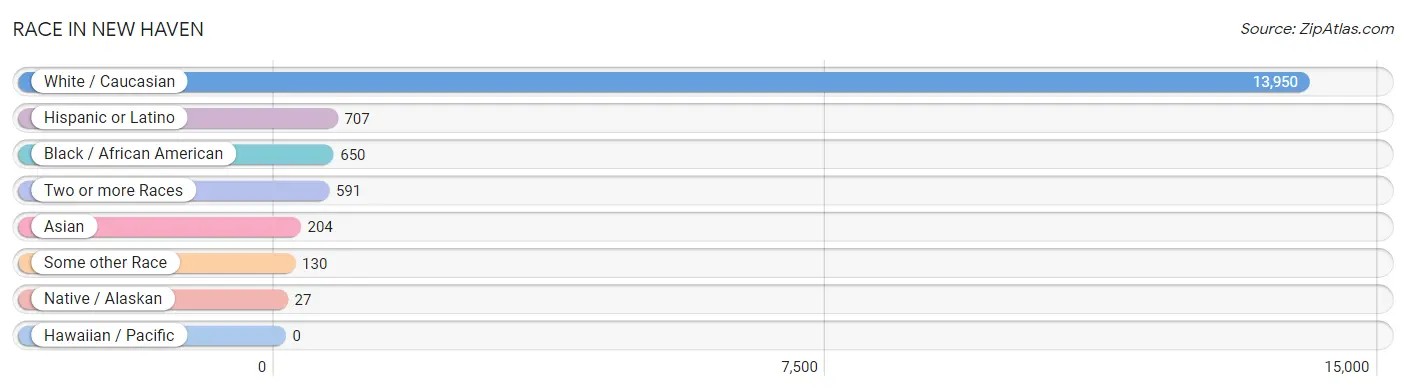
| Race | # Population | % Population |
| Asian | 204 | 1.3% |
| Black / African American | 650 | 4.2% |
| Hawaiian / Pacific | 0 | 0.0% |
| Hispanic or Latino | 707 | 4.5% |
| Native / Alaskan | 27 | 0.2% |
| White / Caucasian | 13,950 | 89.7% |
| Two or more Races | 591 | 3.8% |
| Some other Race | 130 | 0.8% |
| Total | 15,552 | 100.0% |
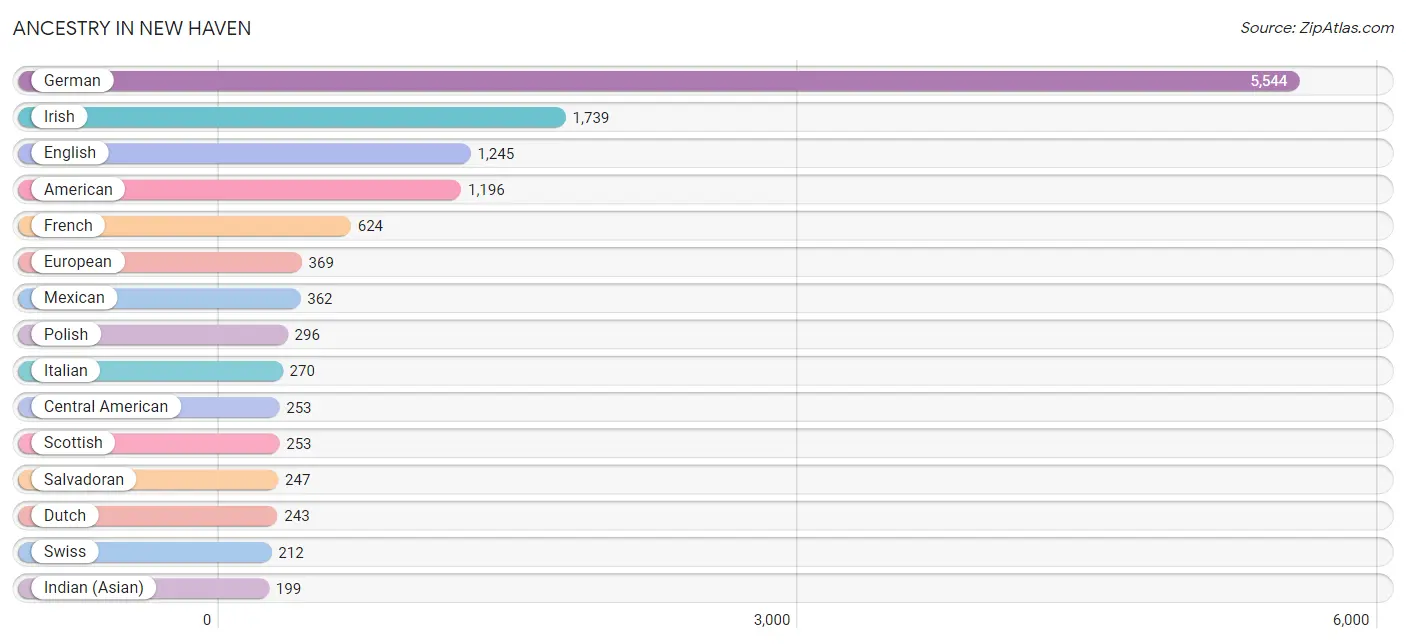
Ancestry in New Haven
The most populous ancestries reported in New Haven are German (5,544 | 35.6%), Irish (1,739 | 11.2%), English (1,245 | 8.0%), American (1,196 | 7.7%), and French (624 | 4.0%), together accounting for 66.5% of all New Haven residents.
| Ancestry | # Population | % Population |
| American | 1,196 | 7.7% |
| Apache | 12 | 0.1% |
| Arab | 94 | 0.6% |
| Belgian | 20 | 0.1% |
| British | 33 | 0.2% |
| Burmese | 7 | 0.1% |
| Canadian | 32 | 0.2% |
| Central American | 253 | 1.6% |
| Cherokee | 29 | 0.2% |
| Colombian | 15 | 0.1% |
| Croatian | 11 | 0.1% |
| Cuban | 14 | 0.1% |
| Czechoslovakian | 20 | 0.1% |
| Danish | 42 | 0.3% |
| Dutch | 243 | 1.6% |
| English | 1,245 | 8.0% |
| European | 369 | 2.4% |
| French | 624 | 4.0% |
| French Canadian | 89 | 0.6% |
| German | 5,544 | 35.6% |
| Greek | 10 | 0.1% |
| Guatemalan | 5 | 0.0% |
| Haitian | 24 | 0.2% |
| Hungarian | 123 | 0.8% |
| Indian (Asian) | 199 | 1.3% |
| Irish | 1,739 | 11.2% |
| Italian | 270 | 1.7% |
| Korean | 24 | 0.2% |
| Lebanese | 10 | 0.1% |
| Macedonian | 29 | 0.2% |
| Mexican | 362 | 2.3% |
| Mexican American Indian | 11 | 0.1% |
| Navajo | 1 | 0.0% |
| Northern European | 88 | 0.6% |
| Norwegian | 94 | 0.6% |
| Panamanian | 1 | 0.0% |
| Pennsylvania German | 32 | 0.2% |
| Polish | 296 | 1.9% |
| Portuguese | 4 | 0.0% |
| Puerto Rican | 11 | 0.1% |
| Romanian | 30 | 0.2% |
| Russian | 9 | 0.1% |
| Salvadoran | 247 | 1.6% |
| Scotch-Irish | 73 | 0.5% |
| Scottish | 253 | 1.6% |
| South American | 15 | 0.1% |
| Spaniard | 27 | 0.2% |
| Spanish | 25 | 0.2% |
| Swedish | 165 | 1.1% |
| Swiss | 212 | 1.4% |
| Syrian | 84 | 0.5% |
| Ukrainian | 1 | 0.0% |
| Welsh | 76 | 0.5% |
| Yaqui | 6 | 0.0% |
| Yugoslavian | 5 | 0.0% | View All 55 Rows |
Immigrants in New Haven
The most numerous immigrant groups reported in New Haven came from Latin America (335 | 2.1%), Central America (303 | 1.9%), El Salvador (217 | 1.4%), Asia (125 | 0.8%), and Eastern Asia (96 | 0.6%), together accounting for 6.9% of all New Haven residents.
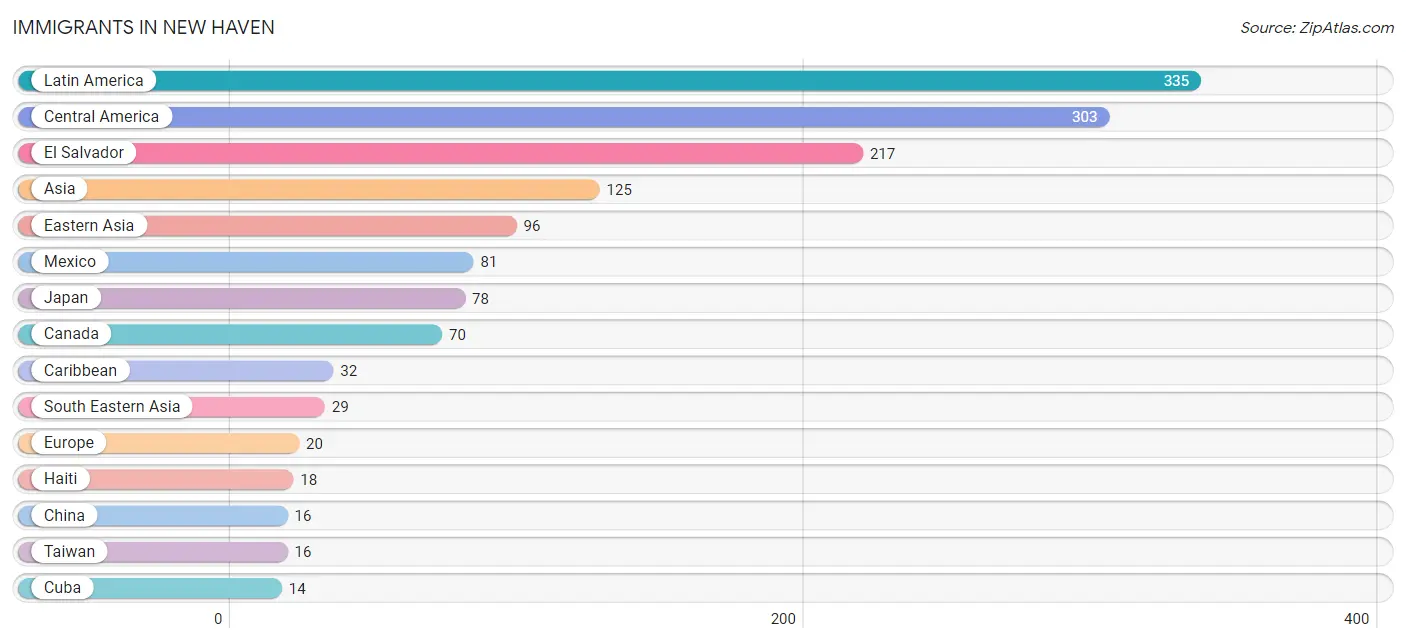
| Immigration Origin | # Population | % Population |
| Africa | 5 | 0.0% |
| Asia | 125 | 0.8% |
| Cameroon | 5 | 0.0% |
| Canada | 70 | 0.4% |
| Caribbean | 32 | 0.2% |
| Central America | 303 | 1.9% |
| China | 16 | 0.1% |
| Cuba | 14 | 0.1% |
| Eastern Asia | 96 | 0.6% |
| El Salvador | 217 | 1.4% |
| Europe | 20 | 0.1% |
| Germany | 9 | 0.1% |
| Guatemala | 5 | 0.0% |
| Haiti | 18 | 0.1% |
| Japan | 78 | 0.5% |
| Korea | 2 | 0.0% |
| Latin America | 335 | 2.1% |
| Mexico | 81 | 0.5% |
| Middle Africa | 5 | 0.0% |
| Northern Europe | 11 | 0.1% |
| Philippines | 4 | 0.0% |
| Scotland | 11 | 0.1% |
| South Eastern Asia | 29 | 0.2% |
| Taiwan | 16 | 0.1% |
| Western Europe | 9 | 0.1% | View All 25 Rows |
Sex and Age in New Haven
Sex and Age in New Haven
The most populous age groups in New Haven are Under 5 Years (637 | 8.7%) for men and Under 5 Years (619 | 7.5%) for women.
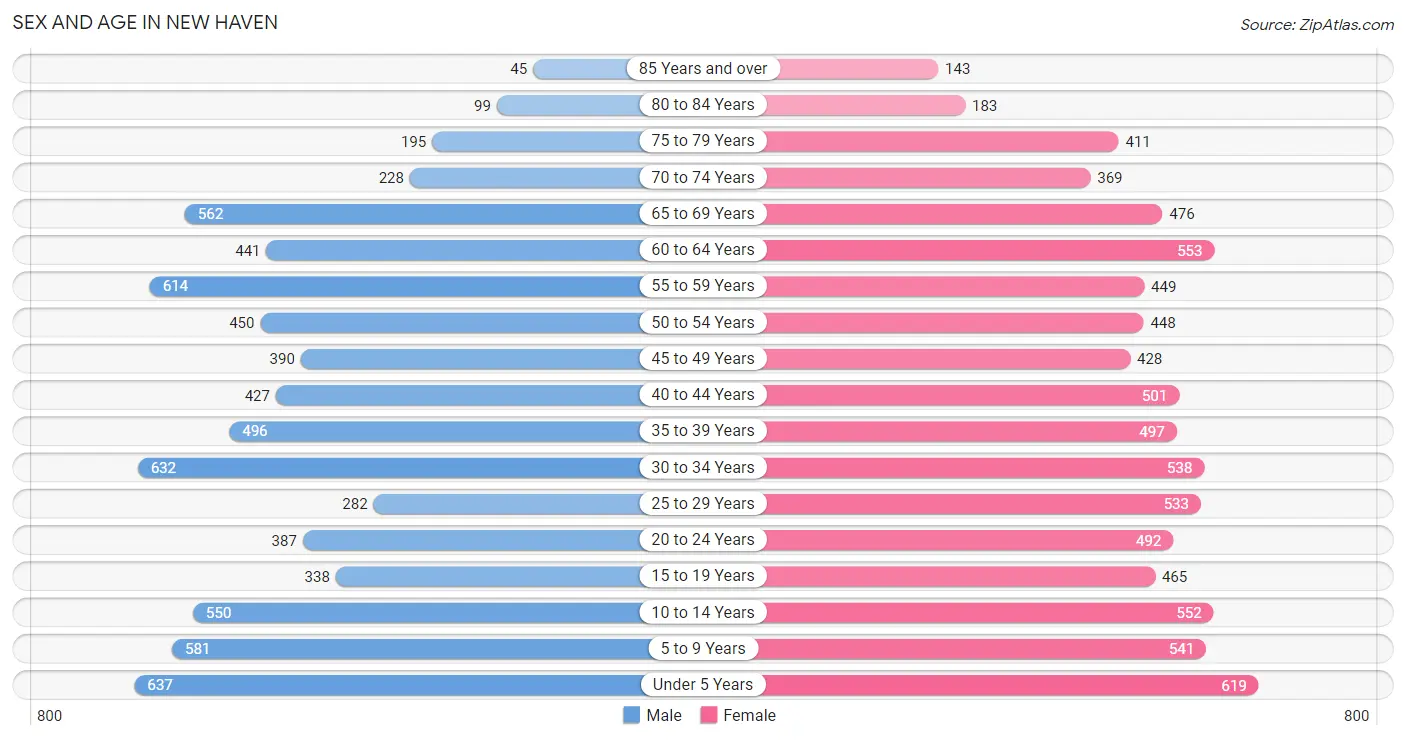
| Age Bracket | Male | Female |
| Under 5 Years | 637 (8.7%) | 619 (7.5%) |
| 5 to 9 Years | 581 (7.9%) | 541 (6.6%) |
| 10 to 14 Years | 550 (7.5%) | 552 (6.7%) |
| 15 to 19 Years | 338 (4.6%) | 465 (5.7%) |
| 20 to 24 Years | 387 (5.3%) | 492 (6.0%) |
| 25 to 29 Years | 282 (3.8%) | 533 (6.5%) |
| 30 to 34 Years | 632 (8.6%) | 538 (6.6%) |
| 35 to 39 Years | 496 (6.7%) | 497 (6.1%) |
| 40 to 44 Years | 427 (5.8%) | 501 (6.1%) |
| 45 to 49 Years | 390 (5.3%) | 428 (5.2%) |
| 50 to 54 Years | 450 (6.1%) | 448 (5.5%) |
| 55 to 59 Years | 614 (8.4%) | 449 (5.5%) |
| 60 to 64 Years | 441 (6.0%) | 553 (6.8%) |
| 65 to 69 Years | 562 (7.6%) | 476 (5.8%) |
| 70 to 74 Years | 228 (3.1%) | 369 (4.5%) |
| 75 to 79 Years | 195 (2.6%) | 411 (5.0%) |
| 80 to 84 Years | 99 (1.3%) | 183 (2.2%) |
| 85 Years and over | 45 (0.6%) | 143 (1.7%) |
| Total | 7,354 (100.0%) | 8,198 (100.0%) |
Families and Households in New Haven
Median Family Size in New Haven
The median family size in New Haven is 3.05 persons per family, with married-couple families (2,989 | 74.8%) accounting for the largest median family size of 3.17 persons per family. On the other hand, single male/father families (344 | 8.6%) represent the smallest median family size with 2.58 persons per family.
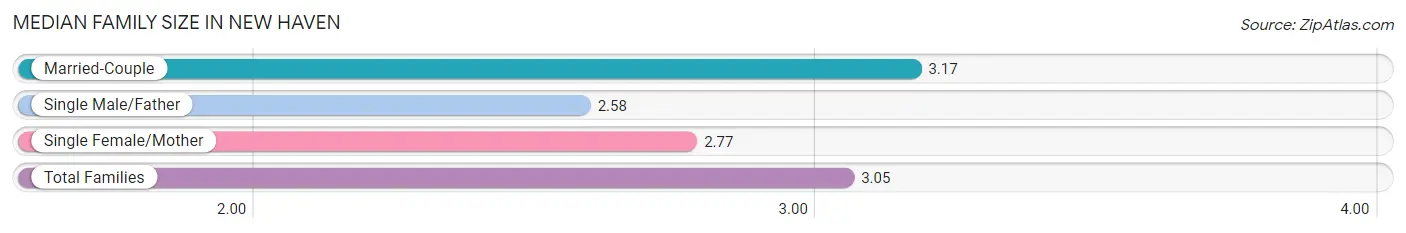
| Family Type | # Families | Family Size |
| Married-Couple | 2,989 (74.8%) | 3.17 |
| Single Male/Father | 344 (8.6%) | 2.58 |
| Single Female/Mother | 663 (16.6%) | 2.77 |
| Total Families | 3,996 (100.0%) | 3.05 |
Median Household Size in New Haven
The median household size in New Haven is 2.41 persons per household, with single male/father households (344 | 5.4%) accounting for the largest median household size of 3.19 persons per household. non-family households (2,402 | 37.5%) represent the smallest median household size with 1.17 persons per household.
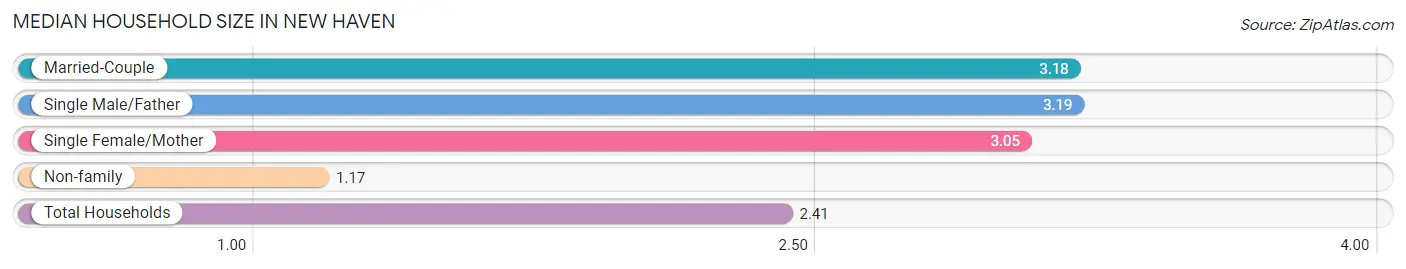
| Household Type | # Households | Household Size |
| Married-Couple | 2,989 (46.7%) | 3.18 |
| Single Male/Father | 344 (5.4%) | 3.19 |
| Single Female/Mother | 663 (10.4%) | 3.05 |
| Non-family | 2,402 (37.5%) | 1.17 |
| Total Households | 6,398 (100.0%) | 2.41 |
Household Size by Marriage Status in New Haven
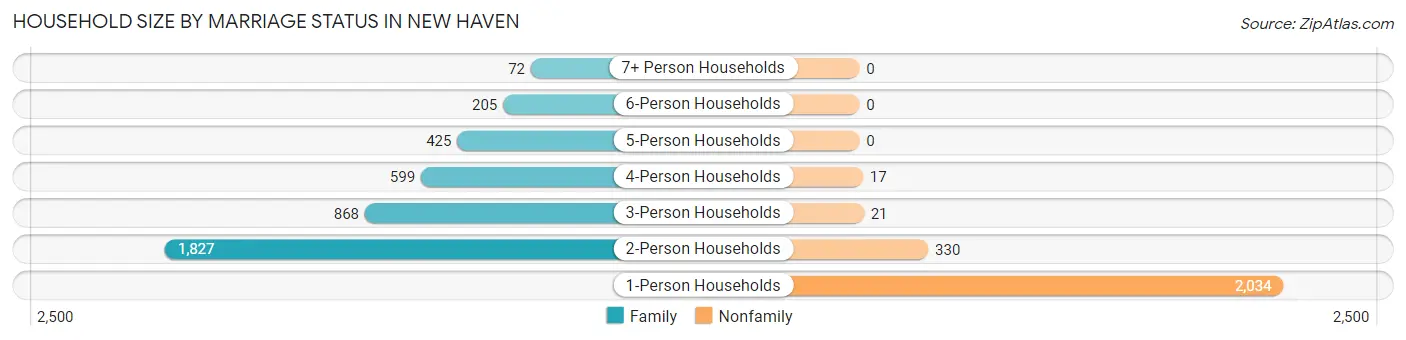
Out of a total of 6,398 households in New Haven, 3,996 (62.5%) are family households, while 2,402 (37.5%) are nonfamily households. The most numerous type of family households are 2-person households, comprising 1,827, and the most common type of nonfamily households are 1-person households, comprising 2,034.
| Household Size | Family Households | Nonfamily Households |
| 1-Person Households | - | 2,034 (31.8%) |
| 2-Person Households | 1,827 (28.6%) | 330 (5.2%) |
| 3-Person Households | 868 (13.6%) | 21 (0.3%) |
| 4-Person Households | 599 (9.4%) | 17 (0.3%) |
| 5-Person Households | 425 (6.6%) | 0 (0.0%) |
| 6-Person Households | 205 (3.2%) | 0 (0.0%) |
| 7+ Person Households | 72 (1.1%) | 0 (0.0%) |
| Total | 3,996 (62.5%) | 2,402 (37.5%) |
Female Fertility in New Haven
Fertility by Age in New Haven
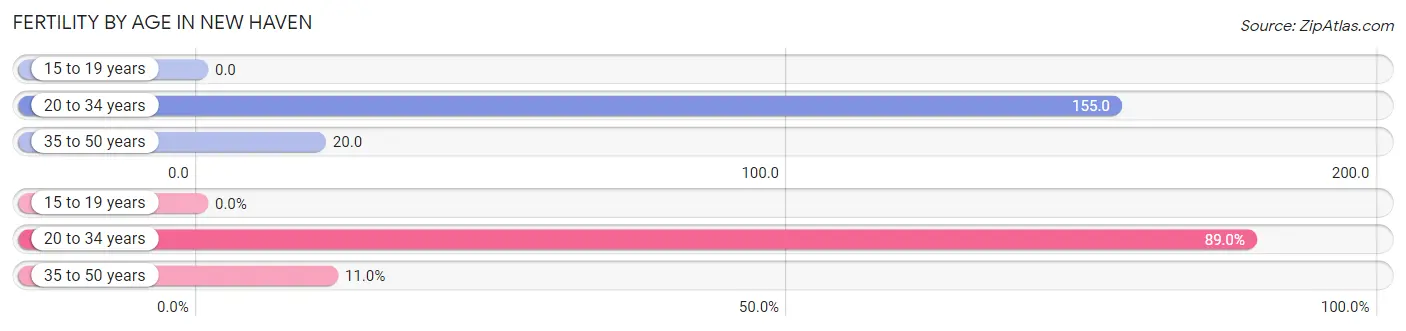
Average fertility rate in New Haven is 77.0 births per 1,000 women. Women in the age bracket of 20 to 34 years have the highest fertility rate with 155.0 births per 1,000 women. Women in the age bracket of 20 to 34 years acount for 89.0% of all women with births.
| Age Bracket | Women with Births | Births / 1,000 Women |
| 15 to 19 years | 0 (0.0%) | 0.0 |
| 20 to 34 years | 242 (89.0%) | 155.0 |
| 35 to 50 years | 30 (11.0%) | 20.0 |
| Total | 272 (100.0%) | 77.0 |
Fertility by Age by Marriage Status in New Haven
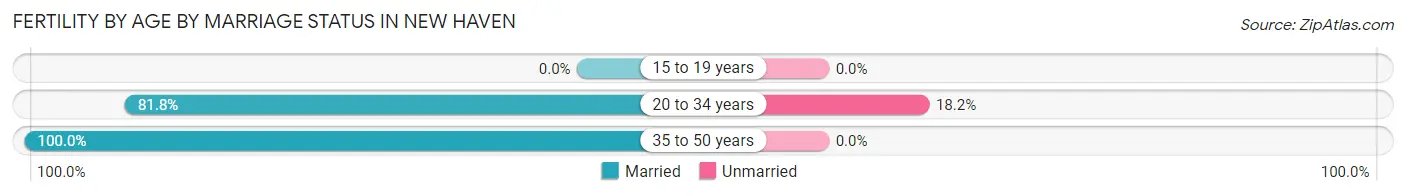
83.8% of women with births (272) in New Haven are married. The highest percentage of unmarried women with births falls into 20 to 34 years age bracket with 18.2% of them unmarried at the time of birth, while the lowest percentage of unmarried women with births belong to 35 to 50 years age bracket with 0.0% of them unmarried.
| Age Bracket | Married | Unmarried |
| 15 to 19 years | 0 (0.0%) | 0 (0.0%) |
| 20 to 34 years | 198 (81.8%) | 44 (18.2%) |
| 35 to 50 years | 30 (100.0%) | 0 (0.0%) |
| Total | 228 (83.8%) | 44 (16.2%) |
Fertility by Education in New Haven
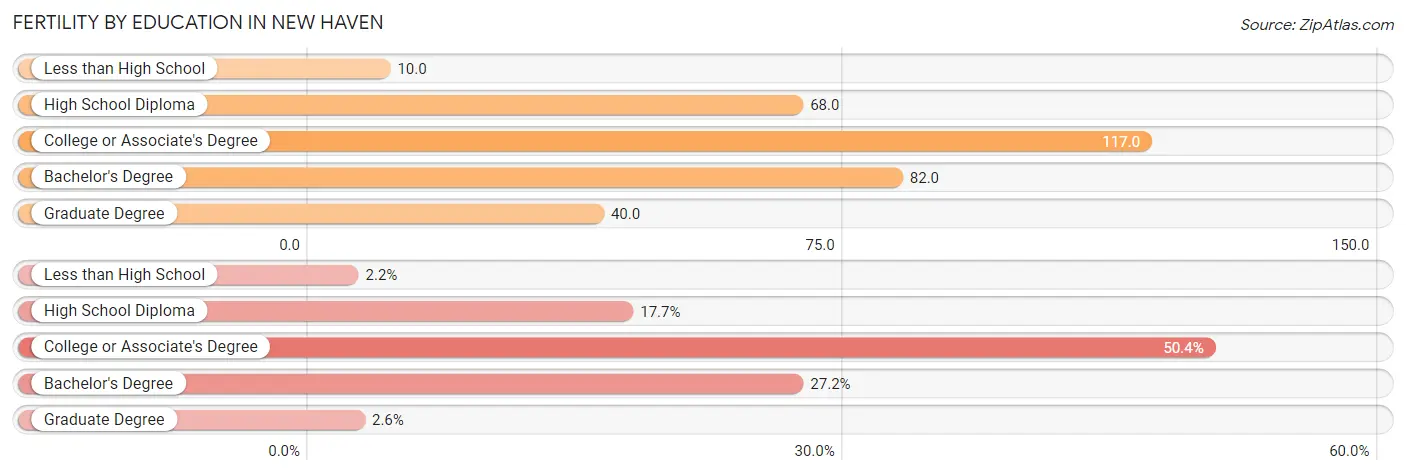
Average fertility rate in New Haven is 77.0 births per 1,000 women. Women with the education attainment of college or associate's degree have the highest fertility rate of 117.0 births per 1,000 women, while women with the education attainment of less than high school have the lowest fertility at 10.0 births per 1,000 women. Women with the education attainment of college or associate's degree represent 50.4% of all women with births.
| Educational Attainment | Women with Births | Births / 1,000 Women |
| Less than High School | 6 (2.2%) | 10.0 |
| High School Diploma | 48 (17.6%) | 68.0 |
| College or Associate's Degree | 137 (50.4%) | 117.0 |
| Bachelor's Degree | 74 (27.2%) | 82.0 |
| Graduate Degree | 7 (2.6%) | 40.0 |
| Total | 272 (100.0%) | 77.0 |
Fertility by Education by Marriage Status in New Haven
16.2% of women with births in New Haven are unmarried. Women with the educational attainment of bachelor's degree are most likely to be married with 100.0% of them married at childbirth, while women with the educational attainment of less than high school are least likely to be married with 100.0% of them unmarried at childbirth.
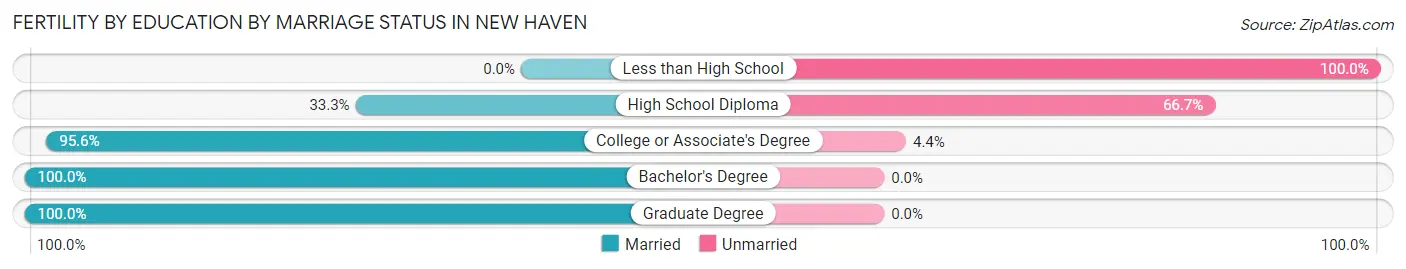
| Educational Attainment | Married | Unmarried |
| Less than High School | 0 (0.0%) | 6 (100.0%) |
| High School Diploma | 16 (33.3%) | 32 (66.7%) |
| College or Associate's Degree | 131 (95.6%) | 6 (4.4%) |
| Bachelor's Degree | 74 (100.0%) | 0 (0.0%) |
| Graduate Degree | 7 (100.0%) | 0 (0.0%) |
| Total | 228 (83.8%) | 44 (16.2%) |
Employment Characteristics in New Haven
Employment by Class of Employer in New Haven
Among the 7,458 employed individuals in New Haven, private company employees (4,911 | 65.8%), not-for-profit organizations (1,239 | 16.6%), and local government employees (516 | 6.9%) make up the most common classes of employment.
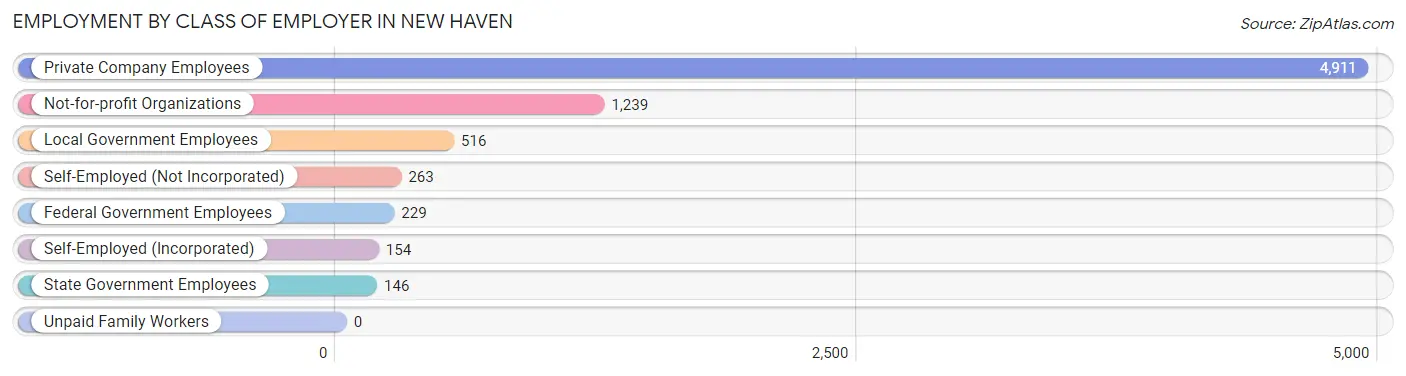
| Employer Class | # Employees | % Employees |
| Private Company Employees | 4,911 | 65.8% |
| Self-Employed (Incorporated) | 154 | 2.1% |
| Self-Employed (Not Incorporated) | 263 | 3.5% |
| Not-for-profit Organizations | 1,239 | 16.6% |
| Local Government Employees | 516 | 6.9% |
| State Government Employees | 146 | 2.0% |
| Federal Government Employees | 229 | 3.1% |
| Unpaid Family Workers | 0 | 0.0% |
| Total | 7,458 | 100.0% |
Employment Status by Age in New Haven
According to the labor force statistics for New Haven, out of the total population over 16 years of age (11,877), 66.8% or 7,934 individuals are in the labor force, with 4.4% or 349 of them unemployed. The age group with the highest labor force participation rate is 25 to 29 years, with 92.9% or 757 individuals in the labor force. Within the labor force, the 20 to 24 years age range has the highest percentage of unemployed individuals, with 13.0% or 100 of them being unemployed.
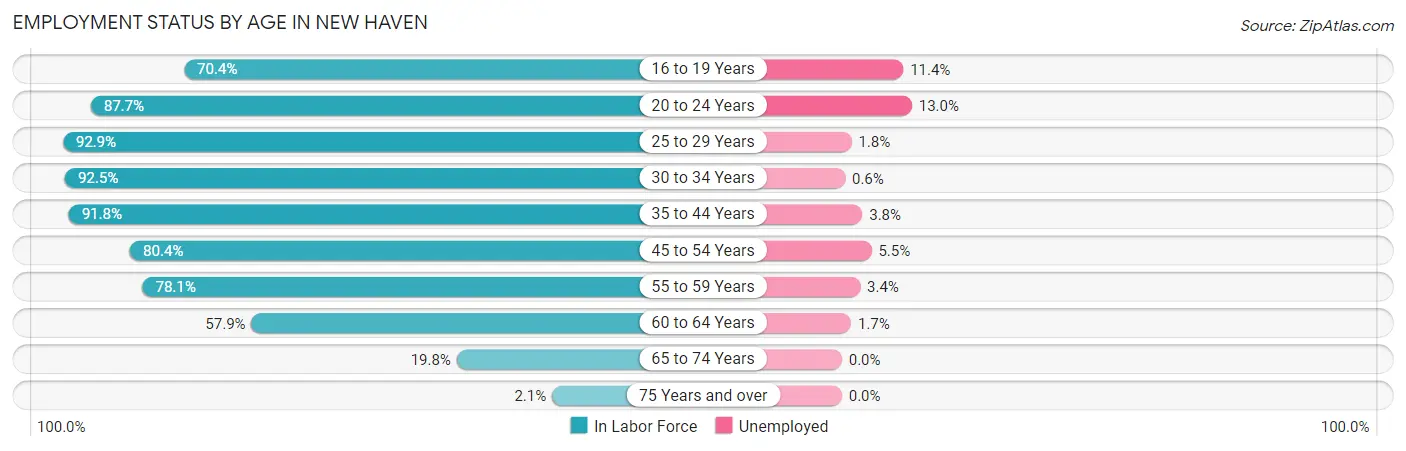
| Age Bracket | In Labor Force | Unemployed |
| 16 to 19 Years | 428 (70.4%) | 49 (11.4%) |
| 20 to 24 Years | 771 (87.7%) | 100 (13.0%) |
| 25 to 29 Years | 757 (92.9%) | 14 (1.8%) |
| 30 to 34 Years | 1,082 (92.5%) | 6 (0.6%) |
| 35 to 44 Years | 1,763 (91.8%) | 67 (3.8%) |
| 45 to 54 Years | 1,380 (80.4%) | 76 (5.5%) |
| 55 to 59 Years | 830 (78.1%) | 28 (3.4%) |
| 60 to 64 Years | 576 (57.9%) | 10 (1.7%) |
| 65 to 74 Years | 324 (19.8%) | 0 (0.0%) |
| 75 Years and over | 23 (2.1%) | 0 (0.0%) |
| Total | 7,934 (66.8%) | 349 (4.4%) |
Employment Status by Educational Attainment in New Haven
According to labor force statistics for New Haven, 83.2% of individuals (6,389) out of the total population between 25 and 64 years of age (7,679) are in the labor force, with 3.2% or 204 of them being unemployed. The group with the highest labor force participation rate are those with the educational attainment of bachelor's degree or higher, with 94.1% or 2,049 individuals in the labor force. Within the labor force, individuals with high school diploma education have the highest percentage of unemployment, with 6.1% or 101 of them being unemployed.
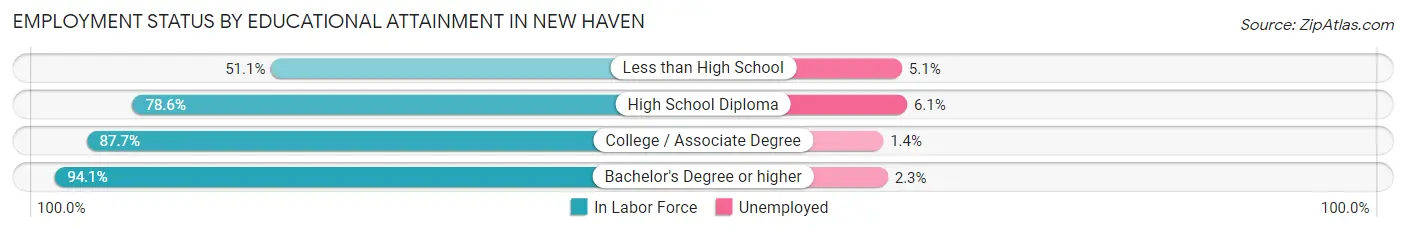
| Educational Attainment | In Labor Force | Unemployed |
| Less than High School | 413 (51.1%) | 41 (5.1%) |
| High School Diploma | 1,655 (78.6%) | 128 (6.1%) |
| College / Associate Degree | 2,268 (87.7%) | 36 (1.4%) |
| Bachelor's Degree or higher | 2,049 (94.1%) | 50 (2.3%) |
| Total | 6,389 (83.2%) | 246 (3.2%) |
Employment Occupations by Sex in New Haven
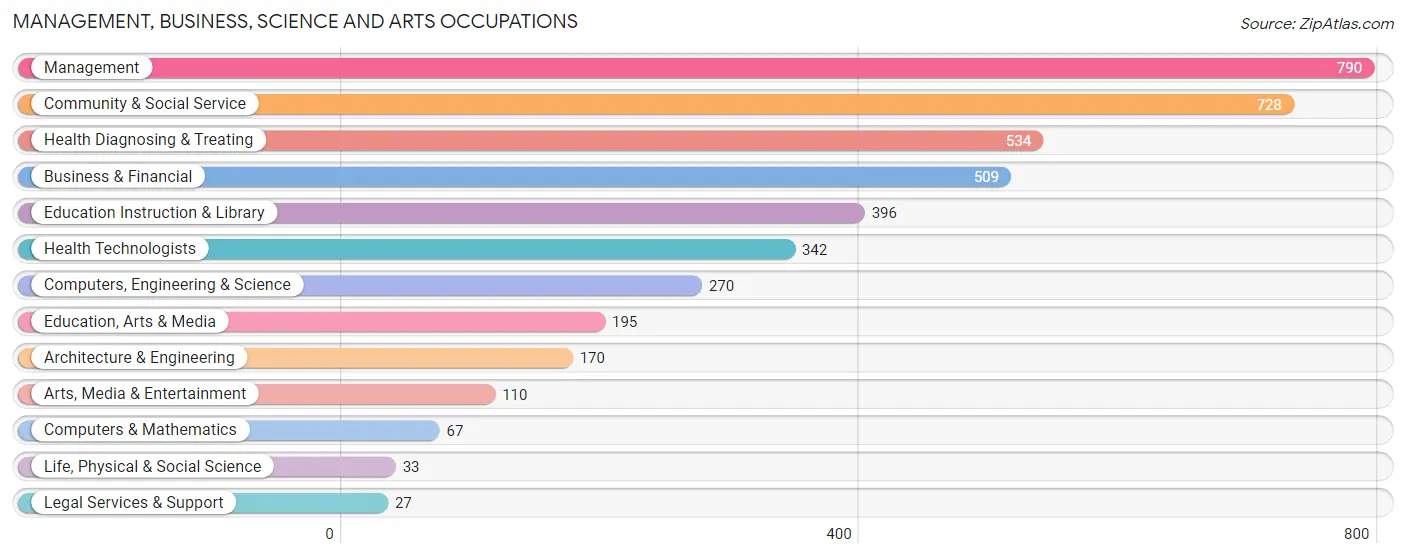
Management, Business, Science and Arts Occupations
The most common Management, Business, Science and Arts occupations in New Haven are Management (790 | 10.4%), Community & Social Service (728 | 9.6%), Health Diagnosing & Treating (534 | 7.0%), Business & Financial (509 | 6.7%), and Education Instruction & Library (396 | 5.2%).
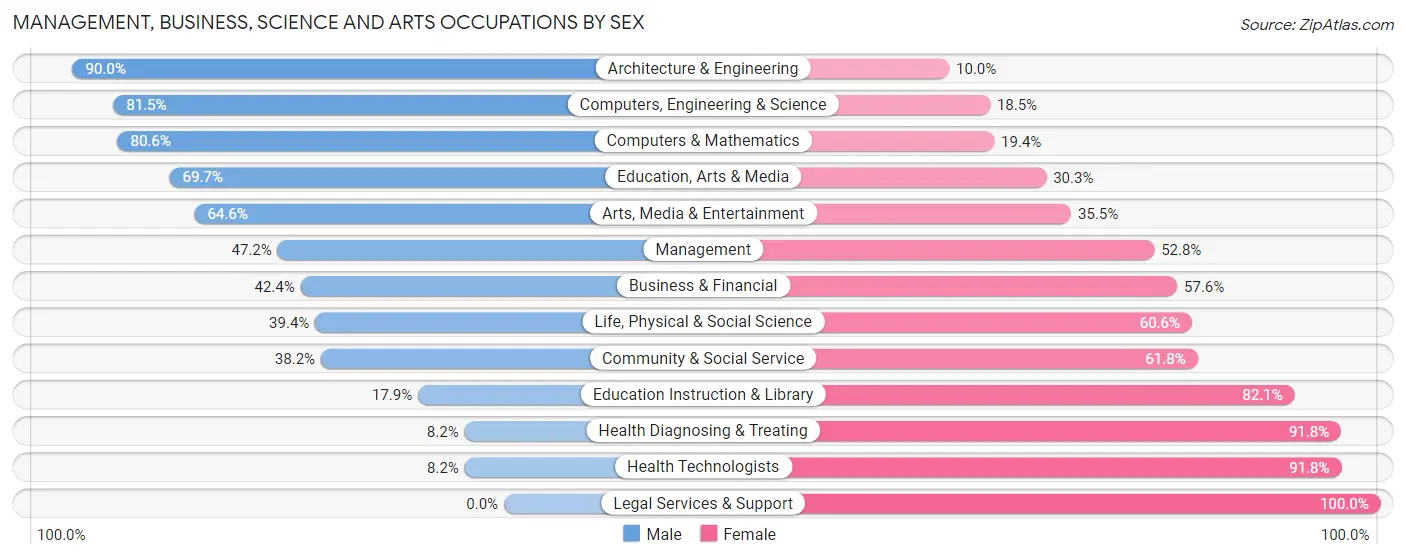
Management, Business, Science and Arts Occupations by Sex
Within the Management, Business, Science and Arts occupations in New Haven, the most male-oriented occupations are Architecture & Engineering (90.0%), Computers, Engineering & Science (81.5%), and Computers & Mathematics (80.6%), while the most female-oriented occupations are Legal Services & Support (100.0%), Health Technologists (91.8%), and Health Diagnosing & Treating (91.8%).
| Occupation | Male | Female |
| Management | 373 (47.2%) | 417 (52.8%) |
| Business & Financial | 216 (42.4%) | 293 (57.6%) |
| Computers, Engineering & Science | 220 (81.5%) | 50 (18.5%) |
| Computers & Mathematics | 54 (80.6%) | 13 (19.4%) |
| Architecture & Engineering | 153 (90.0%) | 17 (10.0%) |
| Life, Physical & Social Science | 13 (39.4%) | 20 (60.6%) |
| Community & Social Service | 278 (38.2%) | 450 (61.8%) |
| Education, Arts & Media | 136 (69.7%) | 59 (30.3%) |
| Legal Services & Support | 0 (0.0%) | 27 (100.0%) |
| Education Instruction & Library | 71 (17.9%) | 325 (82.1%) |
| Arts, Media & Entertainment | 71 (64.5%) | 39 (35.4%) |
| Health Diagnosing & Treating | 44 (8.2%) | 490 (91.8%) |
| Health Technologists | 28 (8.2%) | 314 (91.8%) |
| Total (Category) | 1,131 (40.0%) | 1,700 (60.1%) |
| Total (Overall) | 3,913 (51.7%) | 3,657 (48.3%) |
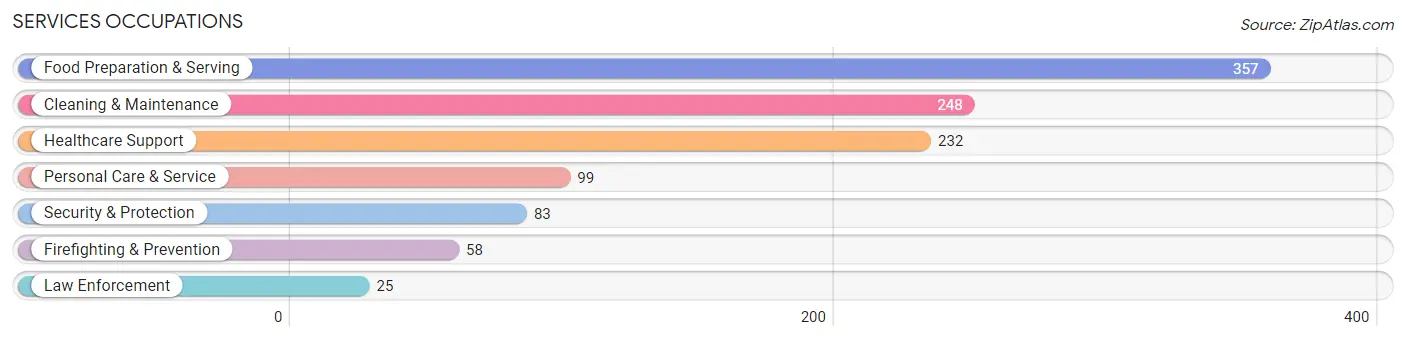
Services Occupations
The most common Services occupations in New Haven are Food Preparation & Serving (357 | 4.7%), Cleaning & Maintenance (248 | 3.3%), Healthcare Support (232 | 3.1%), Personal Care & Service (99 | 1.3%), and Security & Protection (83 | 1.1%).
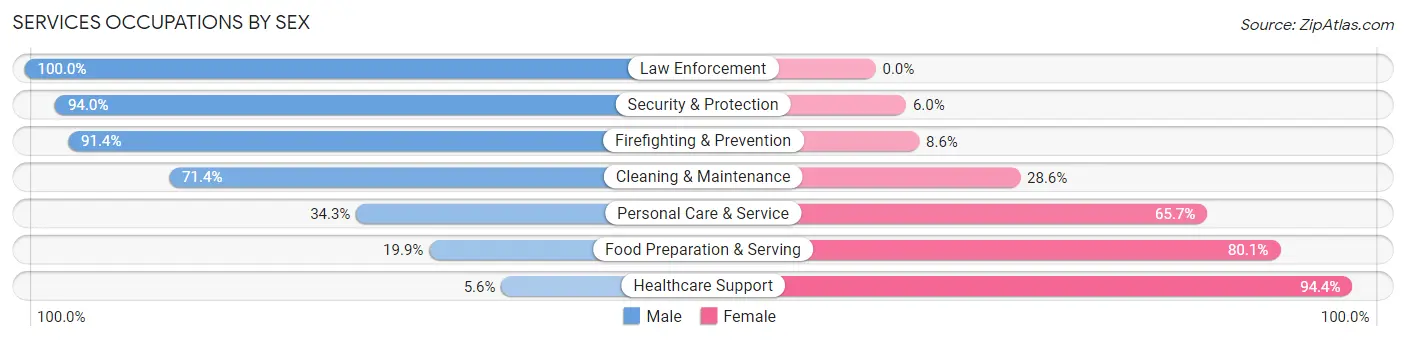
Services Occupations by Sex
Within the Services occupations in New Haven, the most male-oriented occupations are Law Enforcement (100.0%), Security & Protection (94.0%), and Firefighting & Prevention (91.4%), while the most female-oriented occupations are Healthcare Support (94.4%), Food Preparation & Serving (80.1%), and Personal Care & Service (65.7%).
| Occupation | Male | Female |
| Healthcare Support | 13 (5.6%) | 219 (94.4%) |
| Security & Protection | 78 (94.0%) | 5 (6.0%) |
| Firefighting & Prevention | 53 (91.4%) | 5 (8.6%) |
| Law Enforcement | 25 (100.0%) | 0 (0.0%) |
| Food Preparation & Serving | 71 (19.9%) | 286 (80.1%) |
| Cleaning & Maintenance | 177 (71.4%) | 71 (28.6%) |
| Personal Care & Service | 34 (34.3%) | 65 (65.7%) |
| Total (Category) | 373 (36.6%) | 646 (63.4%) |
| Total (Overall) | 3,913 (51.7%) | 3,657 (48.3%) |
Sales and Office Occupations
The most common Sales and Office occupations in New Haven are Office & Administration (816 | 10.8%), and Sales & Related (682 | 9.0%).

Sales and Office Occupations by Sex
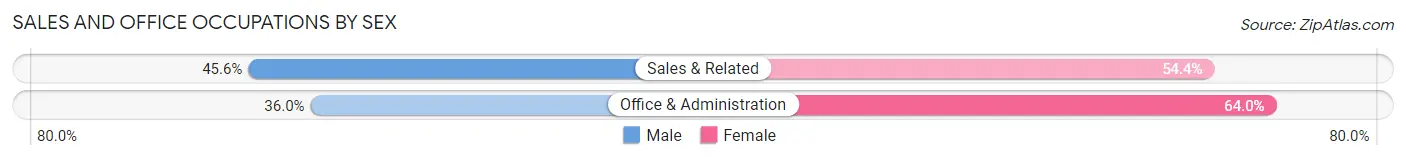
| Occupation | Male | Female |
| Sales & Related | 311 (45.6%) | 371 (54.4%) |
| Office & Administration | 294 (36.0%) | 522 (64.0%) |
| Total (Category) | 605 (40.4%) | 893 (59.6%) |
| Total (Overall) | 3,913 (51.7%) | 3,657 (48.3%) |
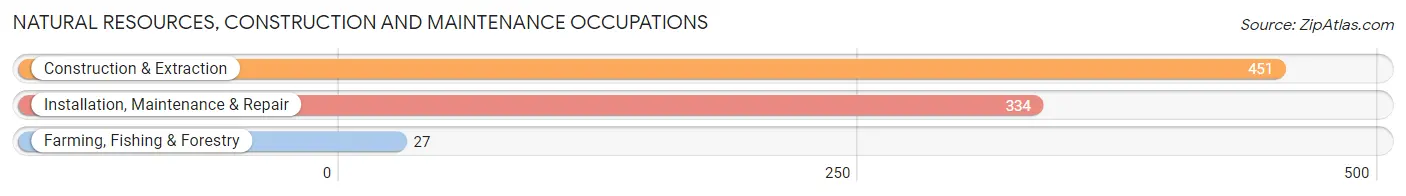
Natural Resources, Construction and Maintenance Occupations
The most common Natural Resources, Construction and Maintenance occupations in New Haven are Construction & Extraction (451 | 6.0%), Installation, Maintenance & Repair (334 | 4.4%), and Farming, Fishing & Forestry (27 | 0.4%).
Natural Resources, Construction and Maintenance Occupations by Sex
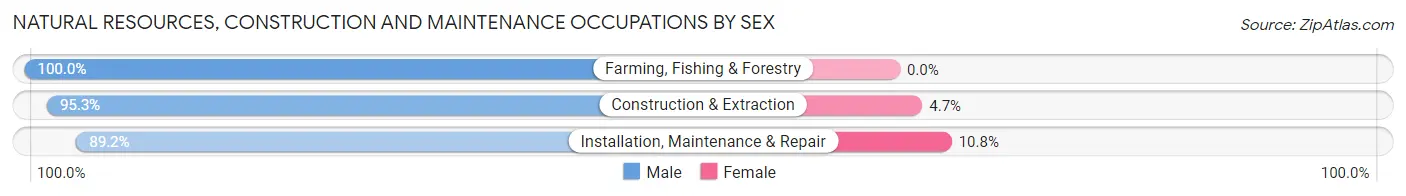
| Occupation | Male | Female |
| Farming, Fishing & Forestry | 27 (100.0%) | 0 (0.0%) |
| Construction & Extraction | 430 (95.3%) | 21 (4.7%) |
| Installation, Maintenance & Repair | 298 (89.2%) | 36 (10.8%) |
| Total (Category) | 755 (93.0%) | 57 (7.0%) |
| Total (Overall) | 3,913 (51.7%) | 3,657 (48.3%) |
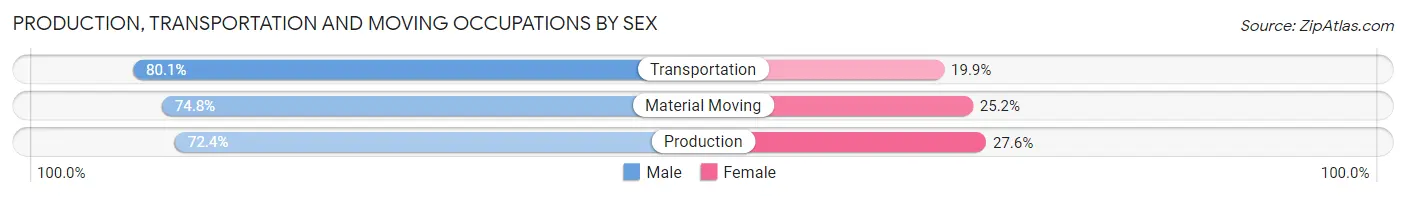
Production, Transportation and Moving Occupations
The most common Production, Transportation and Moving occupations in New Haven are Production (786 | 10.4%), Material Moving (373 | 4.9%), and Transportation (251 | 3.3%).
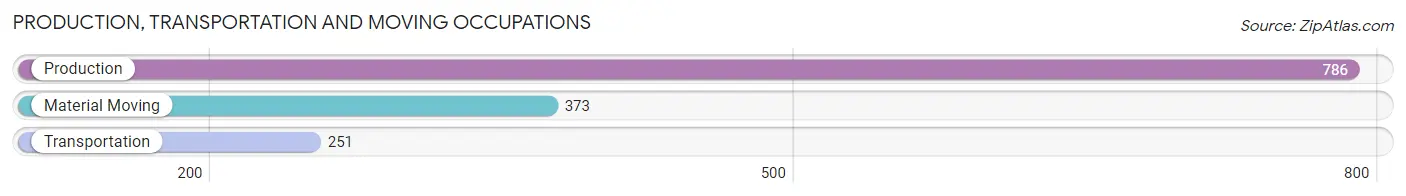
Production, Transportation and Moving Occupations by Sex
| Occupation | Male | Female |
| Production | 569 (72.4%) | 217 (27.6%) |
| Transportation | 201 (80.1%) | 50 (19.9%) |
| Material Moving | 279 (74.8%) | 94 (25.2%) |
| Total (Category) | 1,049 (74.4%) | 361 (25.6%) |
| Total (Overall) | 3,913 (51.7%) | 3,657 (48.3%) |
Employment Industries by Sex in New Haven
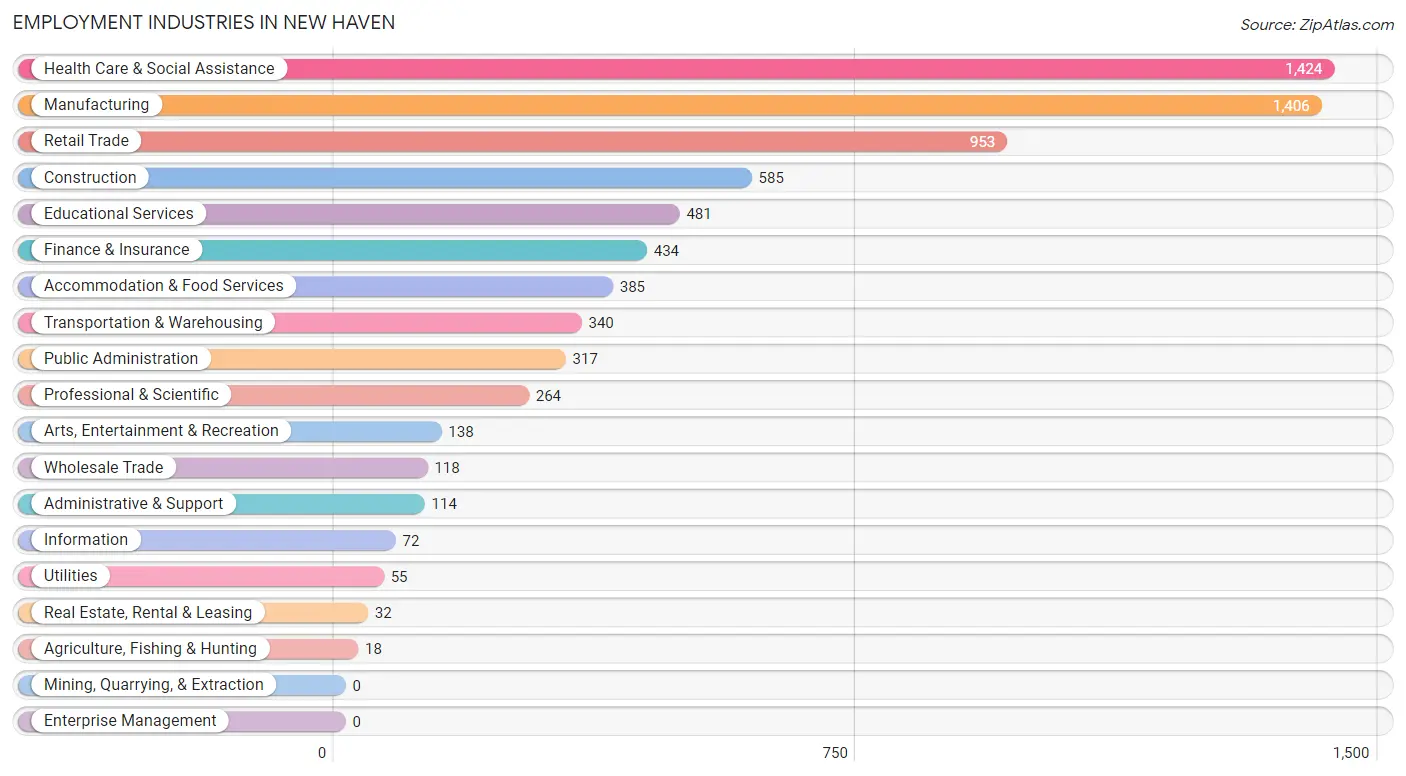
Employment Industries in New Haven
The major employment industries in New Haven include Health Care & Social Assistance (1,424 | 18.8%), Manufacturing (1,406 | 18.6%), Retail Trade (953 | 12.6%), Construction (585 | 7.7%), and Educational Services (481 | 6.4%).
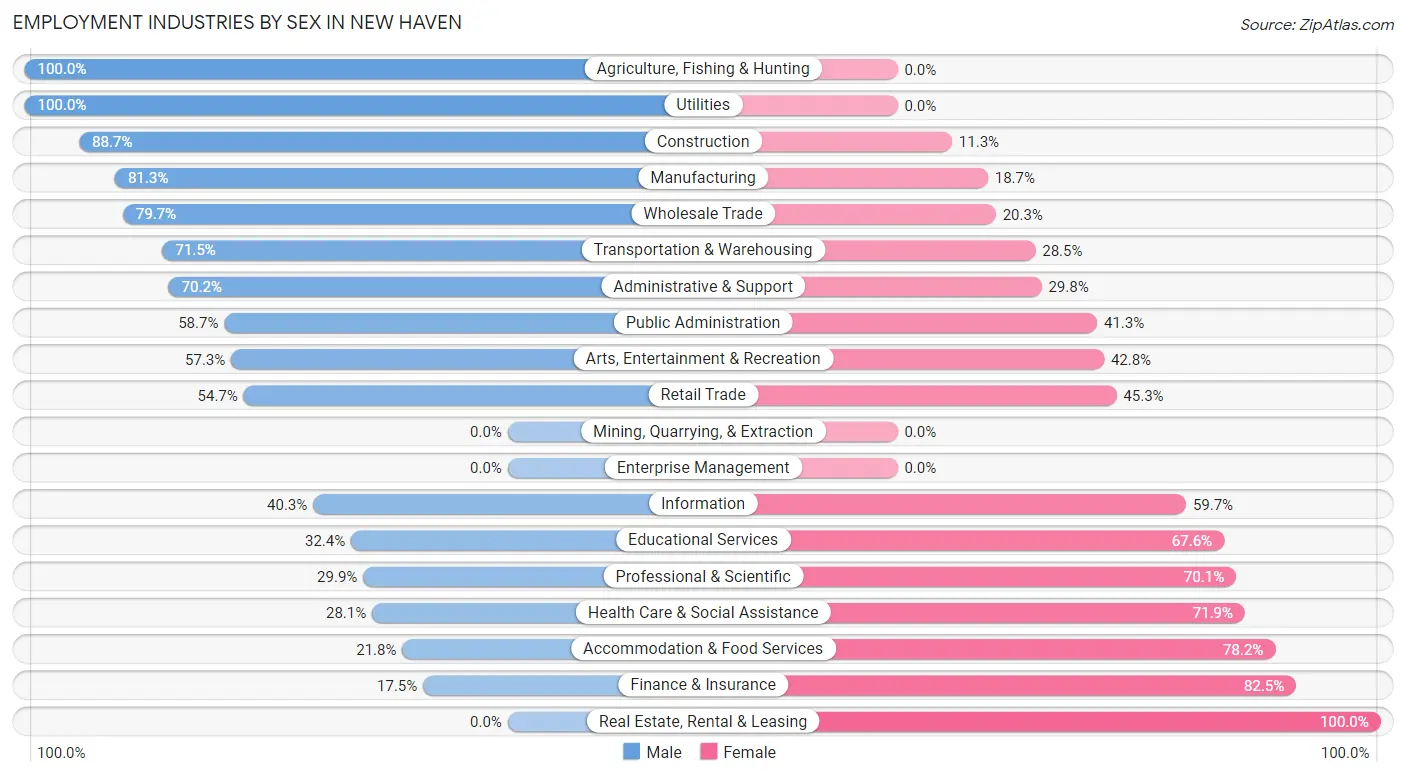
Employment Industries by Sex in New Haven
The New Haven industries that see more men than women are Agriculture, Fishing & Hunting (100.0%), Utilities (100.0%), and Construction (88.7%), whereas the industries that tend to have a higher number of women are Real Estate, Rental & Leasing (100.0%), Finance & Insurance (82.5%), and Accommodation & Food Services (78.2%).
| Industry | Male | Female |
| Agriculture, Fishing & Hunting | 18 (100.0%) | 0 (0.0%) |
| Mining, Quarrying, & Extraction | 0 (0.0%) | 0 (0.0%) |
| Construction | 519 (88.7%) | 66 (11.3%) |
| Manufacturing | 1,143 (81.3%) | 263 (18.7%) |
| Wholesale Trade | 94 (79.7%) | 24 (20.3%) |
| Retail Trade | 521 (54.7%) | 432 (45.3%) |
| Transportation & Warehousing | 243 (71.5%) | 97 (28.5%) |
| Utilities | 55 (100.0%) | 0 (0.0%) |
| Information | 29 (40.3%) | 43 (59.7%) |
| Finance & Insurance | 76 (17.5%) | 358 (82.5%) |
| Real Estate, Rental & Leasing | 0 (0.0%) | 32 (100.0%) |
| Professional & Scientific | 79 (29.9%) | 185 (70.1%) |
| Enterprise Management | 0 (0.0%) | 0 (0.0%) |
| Administrative & Support | 80 (70.2%) | 34 (29.8%) |
| Educational Services | 156 (32.4%) | 325 (67.6%) |
| Health Care & Social Assistance | 400 (28.1%) | 1,024 (71.9%) |
| Arts, Entertainment & Recreation | 79 (57.3%) | 59 (42.7%) |
| Accommodation & Food Services | 84 (21.8%) | 301 (78.2%) |
| Public Administration | 186 (58.7%) | 131 (41.3%) |
| Total | 3,913 (51.7%) | 3,657 (48.3%) |
Education in New Haven
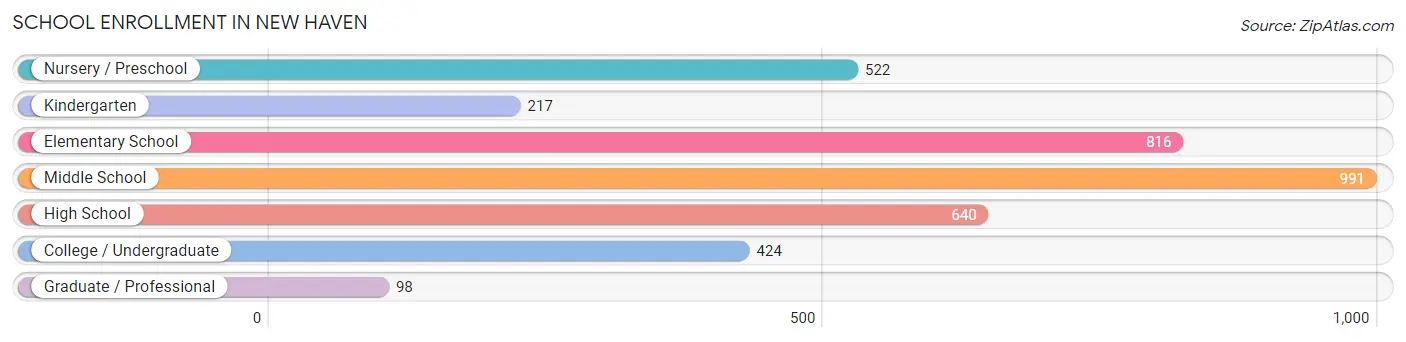
School Enrollment in New Haven
The most common levels of schooling among the 3,708 students in New Haven are middle school (991 | 26.7%), elementary school (816 | 22.0%), and high school (640 | 17.3%).
| School Level | # Students | % Students |
| Nursery / Preschool | 522 | 14.1% |
| Kindergarten | 217 | 5.9% |
| Elementary School | 816 | 22.0% |
| Middle School | 991 | 26.7% |
| High School | 640 | 17.3% |
| College / Undergraduate | 424 | 11.4% |
| Graduate / Professional | 98 | 2.6% |
| Total | 3,708 | 100.0% |
School Enrollment by Age by Funding Source in New Haven
Out of a total of 3,708 students who are enrolled in schools in New Haven, 1,313 (35.4%) attend a private institution, while the remaining 2,395 (64.6%) are enrolled in public schools. The age group of 3 to 4 year olds has the highest likelihood of being enrolled in private schools, with 379 (88.3% in the age bracket) enrolled. Conversely, the age group of 18 to 19 year olds has the lowest likelihood of being enrolled in a private school, with 163 (86.7% in the age bracket) attending a public institution.
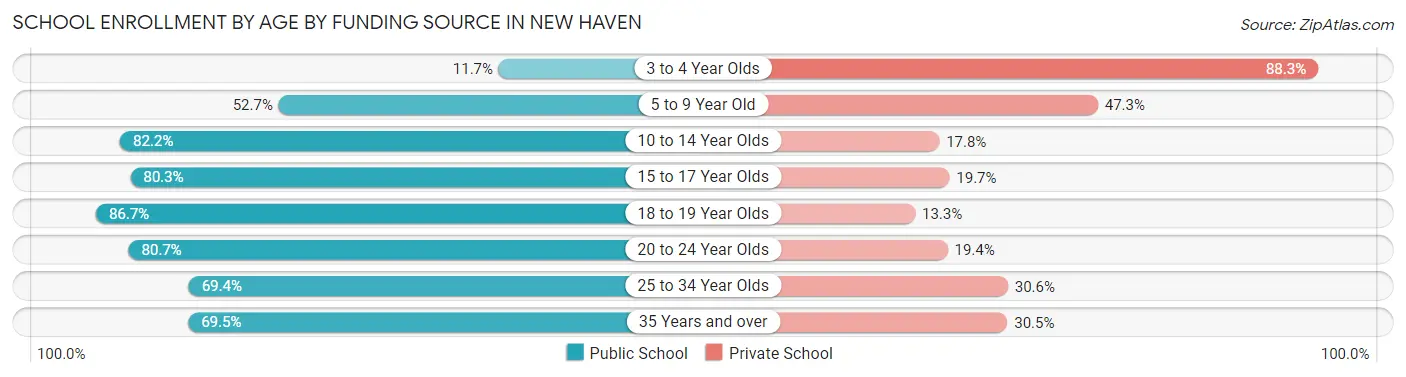
| Age Bracket | Public School | Private School |
| 3 to 4 Year Olds | 50 (11.7%) | 379 (88.3%) |
| 5 to 9 Year Old | 555 (52.7%) | 499 (47.3%) |
| 10 to 14 Year Olds | 906 (82.2%) | 196 (17.8%) |
| 15 to 17 Year Olds | 416 (80.3%) | 102 (19.7%) |
| 18 to 19 Year Olds | 163 (86.7%) | 25 (13.3%) |
| 20 to 24 Year Olds | 125 (80.6%) | 30 (19.4%) |
| 25 to 34 Year Olds | 109 (69.4%) | 48 (30.6%) |
| 35 Years and over | 73 (69.5%) | 32 (30.5%) |
| Total | 2,395 (64.6%) | 1,313 (35.4%) |
Educational Attainment by Field of Study in New Haven
Business (726 | 26.2%), education (529 | 19.1%), science & technology (361 | 13.0%), arts & humanities (204 | 7.3%), and liberal arts & history (171 | 6.2%) are the most common fields of study among 2,775 individuals in New Haven who have obtained a bachelor's degree or higher.
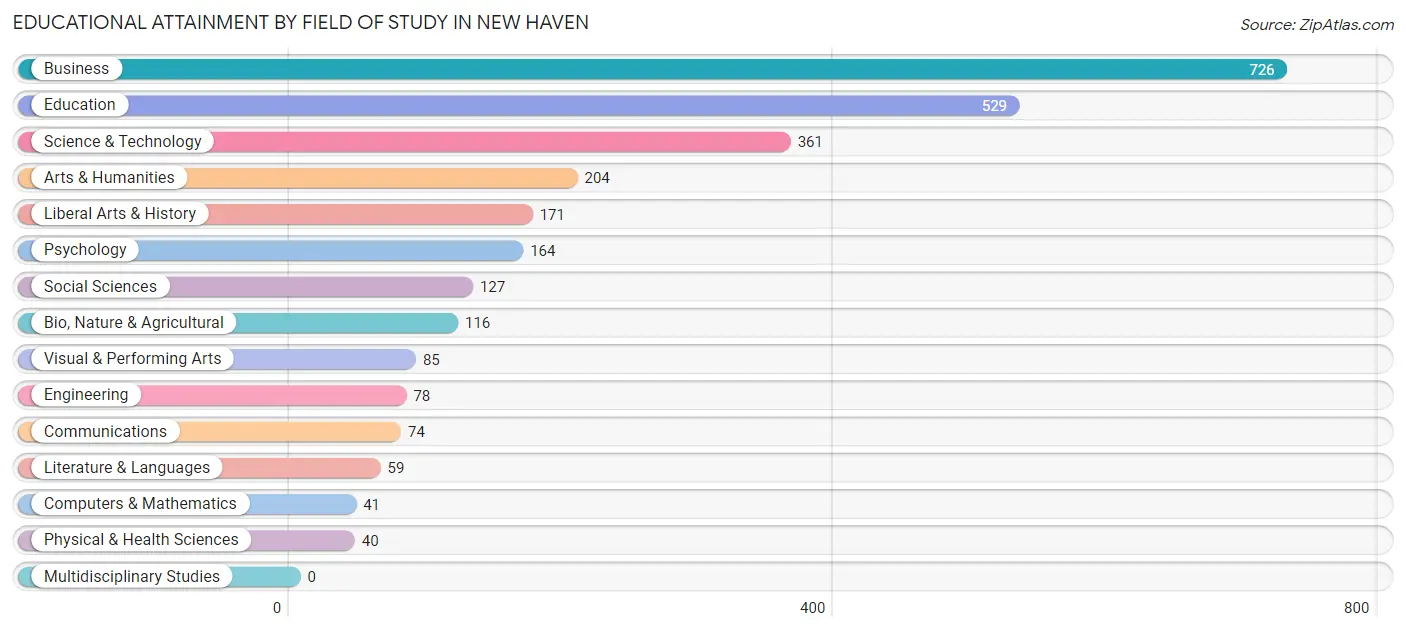
| Field of Study | # Graduates | % Graduates |
| Computers & Mathematics | 41 | 1.5% |
| Bio, Nature & Agricultural | 116 | 4.2% |
| Physical & Health Sciences | 40 | 1.4% |
| Psychology | 164 | 5.9% |
| Social Sciences | 127 | 4.6% |
| Engineering | 78 | 2.8% |
| Multidisciplinary Studies | 0 | 0.0% |
| Science & Technology | 361 | 13.0% |
| Business | 726 | 26.2% |
| Education | 529 | 19.1% |
| Literature & Languages | 59 | 2.1% |
| Liberal Arts & History | 171 | 6.2% |
| Visual & Performing Arts | 85 | 3.1% |
| Communications | 74 | 2.7% |
| Arts & Humanities | 204 | 7.3% |
| Total | 2,775 | 100.0% |
Transportation & Commute in New Haven
Vehicle Availability by Sex in New Haven
The most prevalent vehicle ownership categories in New Haven are males with 2 vehicles (1,862, accounting for 48.4%) and females with 2 vehicles (1,742, making up 51.7%).
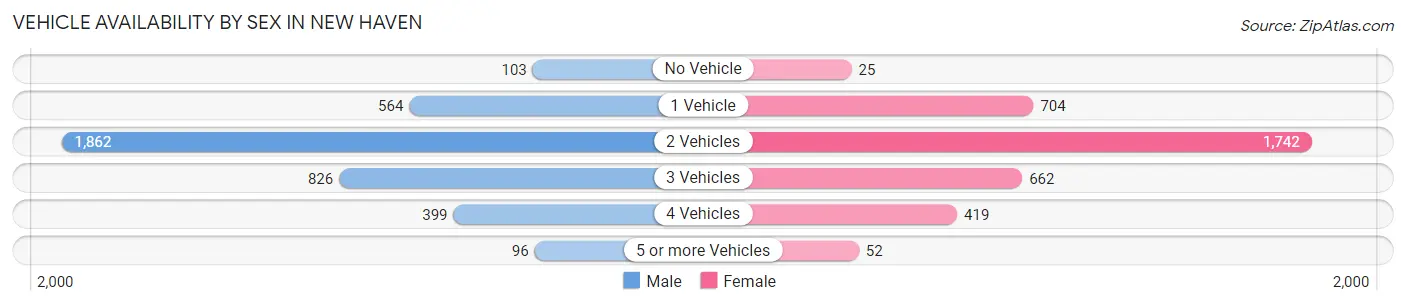
| Vehicles Available | Male | Female |
| No Vehicle | 103 (2.7%) | 25 (0.7%) |
| 1 Vehicle | 564 (14.6%) | 704 (19.5%) |
| 2 Vehicles | 1,862 (48.4%) | 1,742 (48.3%) |
| 3 Vehicles | 826 (21.4%) | 662 (18.4%) |
| 4 Vehicles | 399 (10.4%) | 419 (11.6%) |
| 5 or more Vehicles | 96 (2.5%) | 52 (1.4%) |
| Total | 3,850 (100.0%) | 3,604 (100.0%) |
Commute Time in New Haven
The most frequently occuring commute durations in New Haven are 20 to 24 minutes (1,840 commuters, 25.7%), 15 to 19 minutes (1,303 commuters, 18.2%), and 30 to 34 minutes (797 commuters, 11.2%).
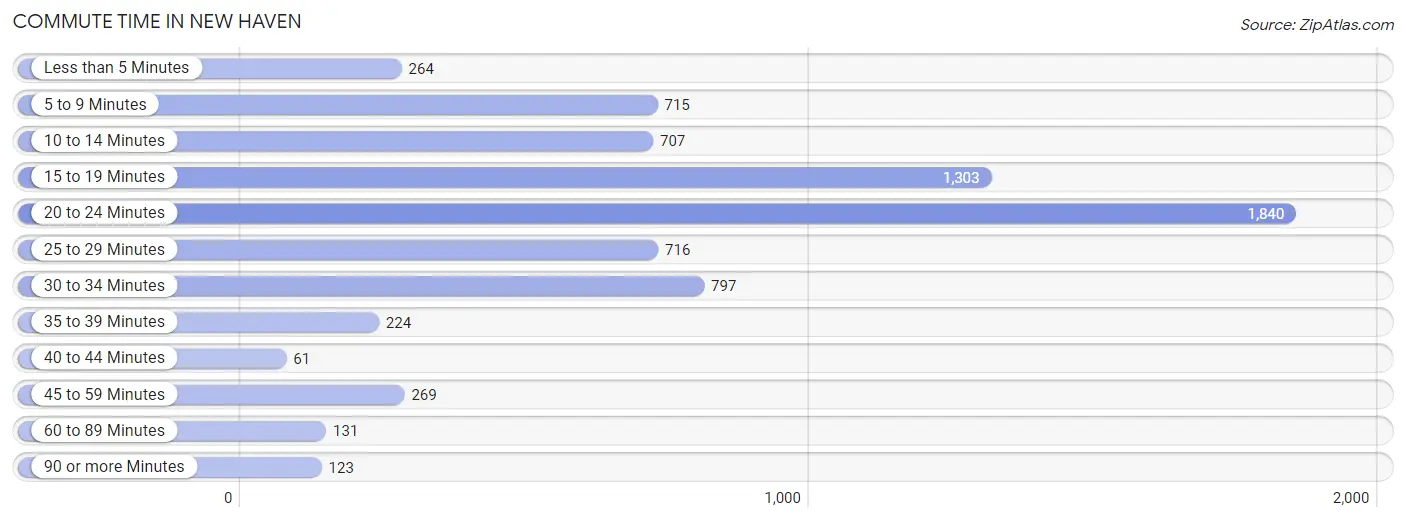
| Commute Time | # Commuters | % Commuters |
| Less than 5 Minutes | 264 | 3.7% |
| 5 to 9 Minutes | 715 | 10.0% |
| 10 to 14 Minutes | 707 | 9.9% |
| 15 to 19 Minutes | 1,303 | 18.2% |
| 20 to 24 Minutes | 1,840 | 25.7% |
| 25 to 29 Minutes | 716 | 10.0% |
| 30 to 34 Minutes | 797 | 11.2% |
| 35 to 39 Minutes | 224 | 3.1% |
| 40 to 44 Minutes | 61 | 0.9% |
| 45 to 59 Minutes | 269 | 3.8% |
| 60 to 89 Minutes | 131 | 1.8% |
| 90 or more Minutes | 123 | 1.7% |
Commute Time by Sex in New Haven
The most common commute times in New Haven are 20 to 24 minutes (1,035 commuters, 27.7%) for males and 20 to 24 minutes (805 commuters, 23.6%) for females.
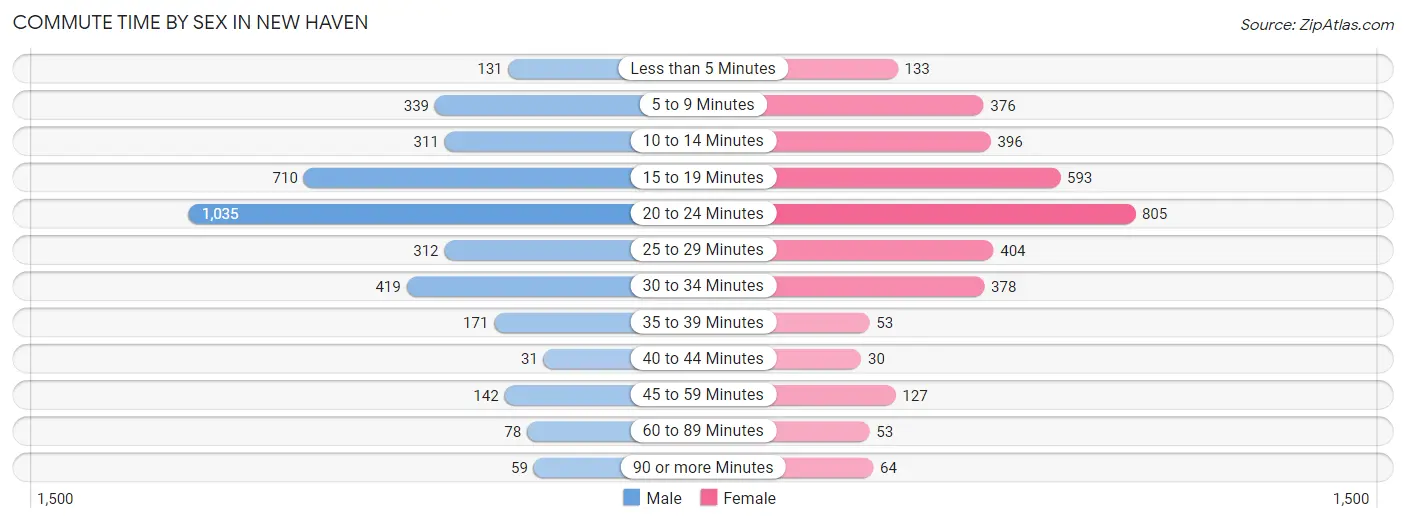
| Commute Time | Male | Female |
| Less than 5 Minutes | 131 (3.5%) | 133 (3.9%) |
| 5 to 9 Minutes | 339 (9.1%) | 376 (11.0%) |
| 10 to 14 Minutes | 311 (8.3%) | 396 (11.6%) |
| 15 to 19 Minutes | 710 (19.0%) | 593 (17.4%) |
| 20 to 24 Minutes | 1,035 (27.7%) | 805 (23.6%) |
| 25 to 29 Minutes | 312 (8.4%) | 404 (11.8%) |
| 30 to 34 Minutes | 419 (11.2%) | 378 (11.1%) |
| 35 to 39 Minutes | 171 (4.6%) | 53 (1.5%) |
| 40 to 44 Minutes | 31 (0.8%) | 30 (0.9%) |
| 45 to 59 Minutes | 142 (3.8%) | 127 (3.7%) |
| 60 to 89 Minutes | 78 (2.1%) | 53 (1.5%) |
| 90 or more Minutes | 59 (1.6%) | 64 (1.9%) |
Time of Departure to Work by Sex in New Haven
The most frequent times of departure to work in New Haven are 6:30 AM to 6:59 AM (635, 17.0%) for males and 7:00 AM to 7:29 AM (491, 14.4%) for females.
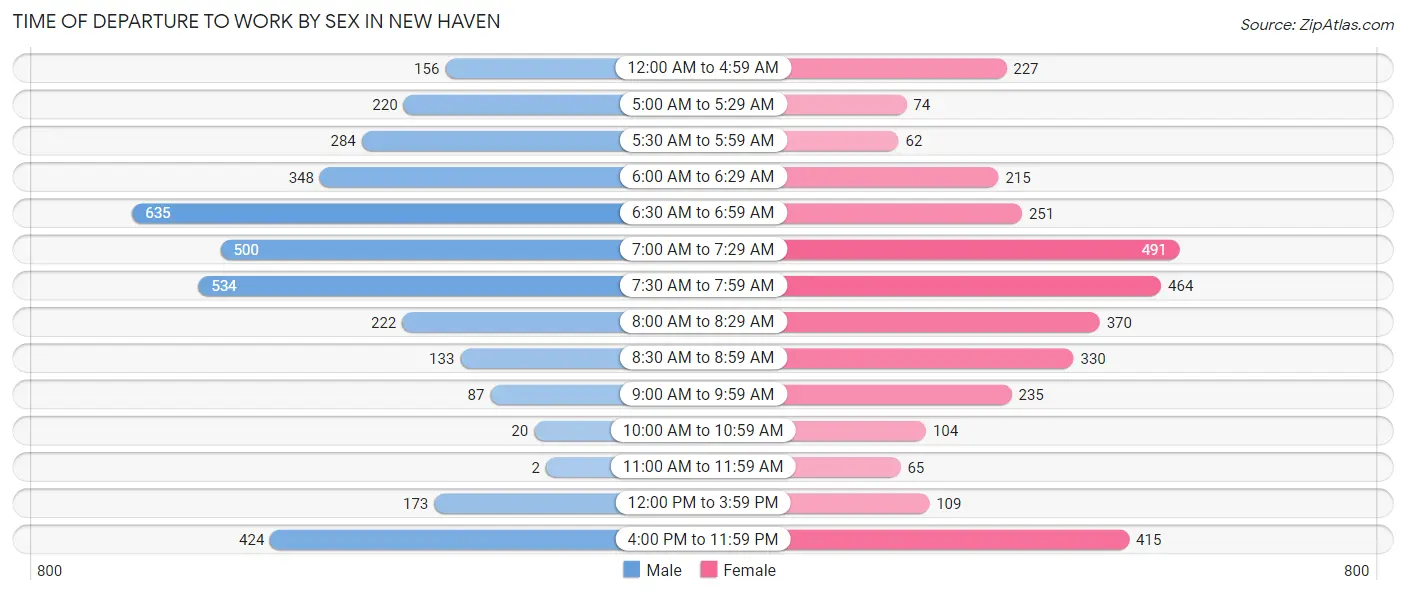
| Time of Departure | Male | Female |
| 12:00 AM to 4:59 AM | 156 (4.2%) | 227 (6.7%) |
| 5:00 AM to 5:29 AM | 220 (5.9%) | 74 (2.2%) |
| 5:30 AM to 5:59 AM | 284 (7.6%) | 62 (1.8%) |
| 6:00 AM to 6:29 AM | 348 (9.3%) | 215 (6.3%) |
| 6:30 AM to 6:59 AM | 635 (17.0%) | 251 (7.4%) |
| 7:00 AM to 7:29 AM | 500 (13.4%) | 491 (14.4%) |
| 7:30 AM to 7:59 AM | 534 (14.3%) | 464 (13.6%) |
| 8:00 AM to 8:29 AM | 222 (5.9%) | 370 (10.8%) |
| 8:30 AM to 8:59 AM | 133 (3.6%) | 330 (9.7%) |
| 9:00 AM to 9:59 AM | 87 (2.3%) | 235 (6.9%) |
| 10:00 AM to 10:59 AM | 20 (0.5%) | 104 (3.0%) |
| 11:00 AM to 11:59 AM | 2 (0.1%) | 65 (1.9%) |
| 12:00 PM to 3:59 PM | 173 (4.6%) | 109 (3.2%) |
| 4:00 PM to 11:59 PM | 424 (11.3%) | 415 (12.2%) |
| Total | 3,738 (100.0%) | 3,412 (100.0%) |
Housing Occupancy in New Haven
Occupancy by Ownership in New Haven
Of the total 6,398 dwellings in New Haven, owner-occupied units account for 4,871 (76.1%), while renter-occupied units make up 1,527 (23.9%).
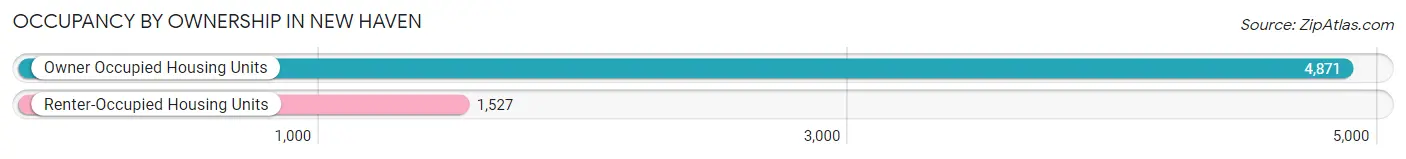
| Occupancy | # Housing Units | % Housing Units |
| Owner Occupied Housing Units | 4,871 | 76.1% |
| Renter-Occupied Housing Units | 1,527 | 23.9% |
| Total Occupied Housing Units | 6,398 | 100.0% |
Occupancy by Household Size in New Haven
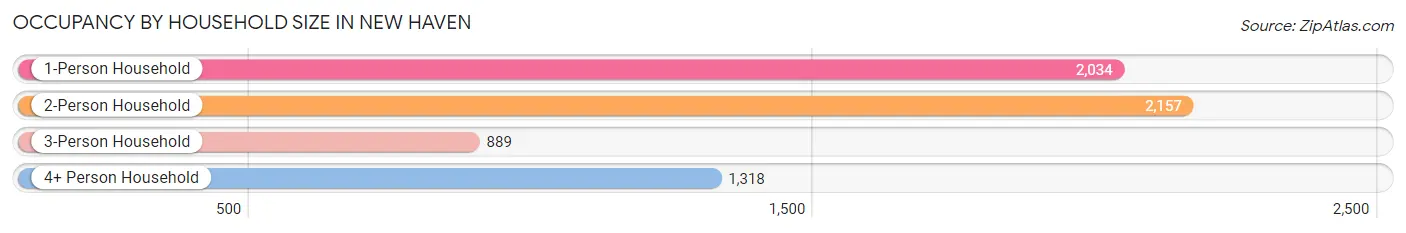
| Household Size | # Housing Units | % Housing Units |
| 1-Person Household | 2,034 | 31.8% |
| 2-Person Household | 2,157 | 33.7% |
| 3-Person Household | 889 | 13.9% |
| 4+ Person Household | 1,318 | 20.6% |
| Total Housing Units | 6,398 | 100.0% |
Occupancy by Ownership by Household Size in New Haven
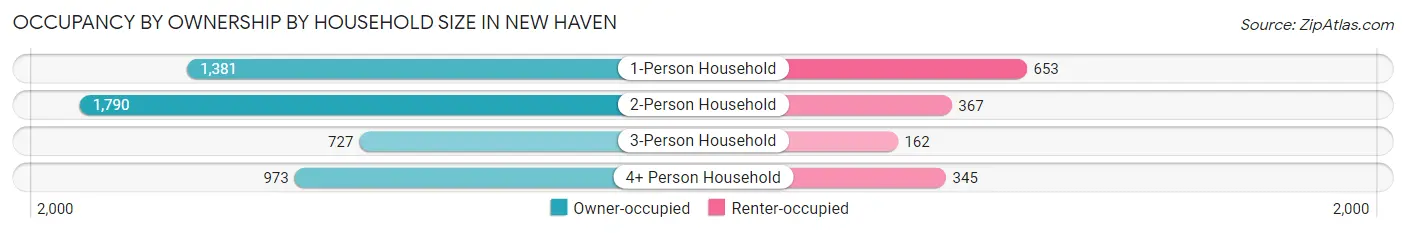
| Household Size | Owner-occupied | Renter-occupied |
| 1-Person Household | 1,381 (67.9%) | 653 (32.1%) |
| 2-Person Household | 1,790 (83.0%) | 367 (17.0%) |
| 3-Person Household | 727 (81.8%) | 162 (18.2%) |
| 4+ Person Household | 973 (73.8%) | 345 (26.2%) |
| Total Housing Units | 4,871 (76.1%) | 1,527 (23.9%) |
Occupancy by Educational Attainment in New Haven
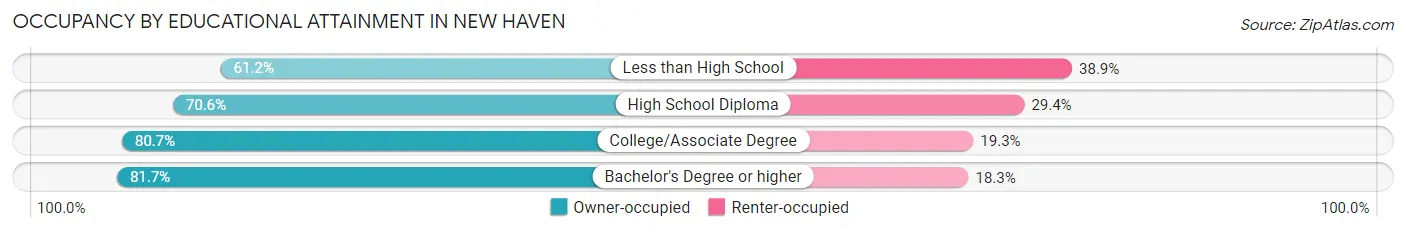
| Household Size | Owner-occupied | Renter-occupied |
| Less than High School | 362 (61.2%) | 230 (38.9%) |
| High School Diploma | 1,359 (70.6%) | 566 (29.4%) |
| College/Associate Degree | 1,683 (80.7%) | 402 (19.3%) |
| Bachelor's Degree or higher | 1,467 (81.7%) | 329 (18.3%) |
Occupancy by Age of Householder in New Haven
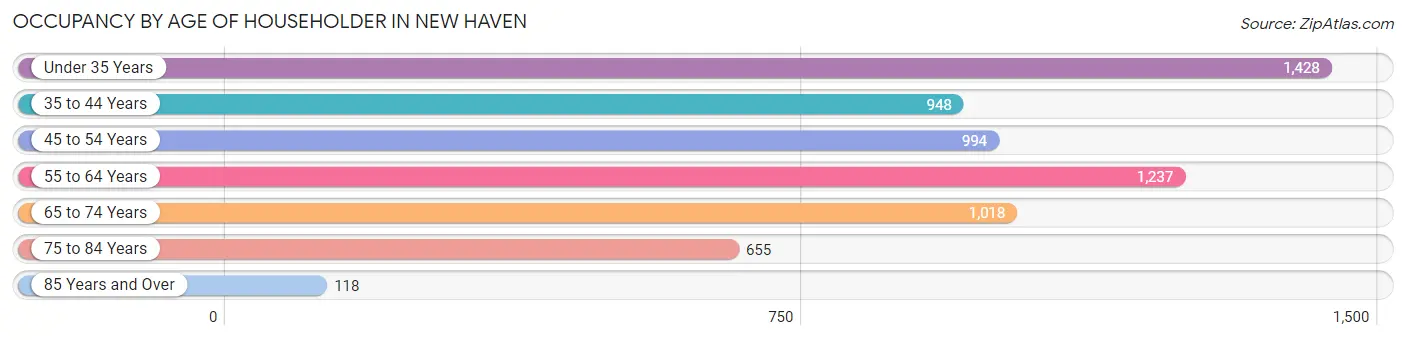
| Age Bracket | # Households | % Households |
| Under 35 Years | 1,428 | 22.3% |
| 35 to 44 Years | 948 | 14.8% |
| 45 to 54 Years | 994 | 15.5% |
| 55 to 64 Years | 1,237 | 19.3% |
| 65 to 74 Years | 1,018 | 15.9% |
| 75 to 84 Years | 655 | 10.2% |
| 85 Years and Over | 118 | 1.8% |
| Total | 6,398 | 100.0% |
Housing Finances in New Haven
Median Income by Occupancy in New Haven
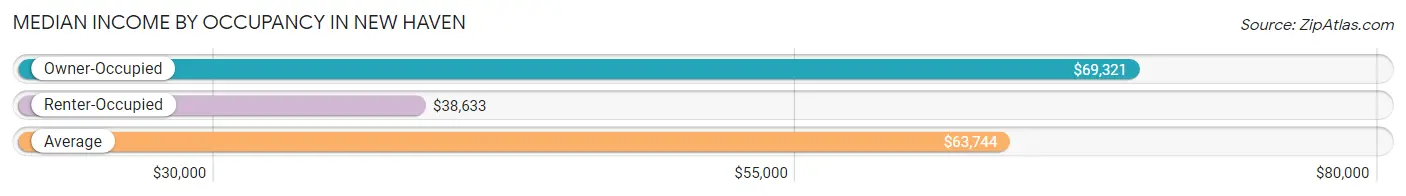
| Occupancy Type | # Households | Median Income |
| Owner-Occupied | 4,871 (76.1%) | $69,321 |
| Renter-Occupied | 1,527 (23.9%) | $38,633 |
| Average | 6,398 (100.0%) | $63,744 |
Occupancy by Householder Income Bracket in New Haven
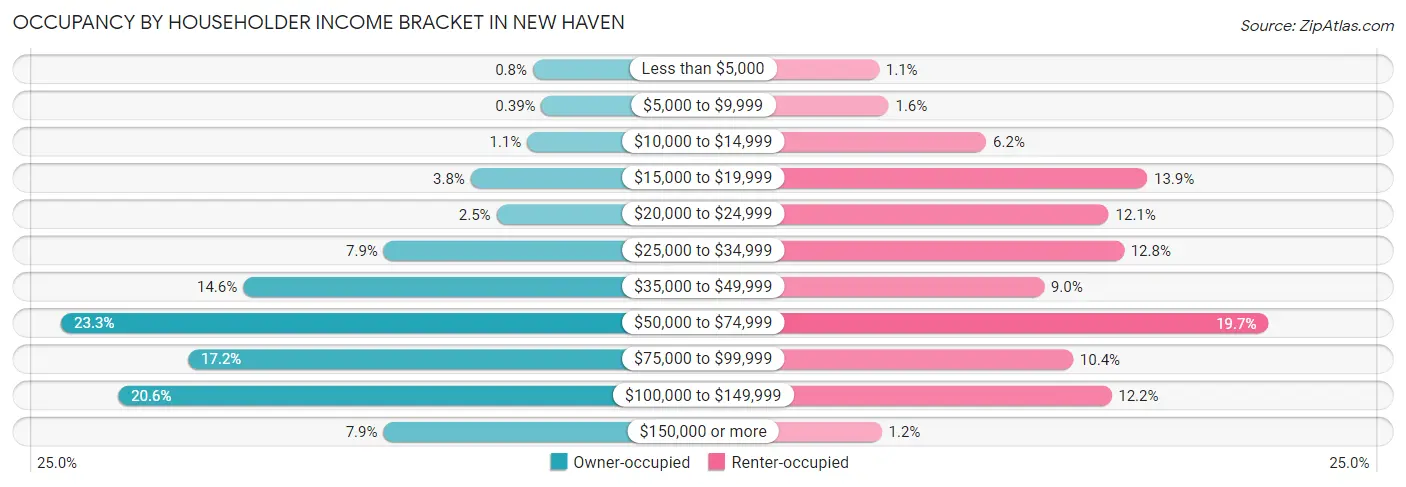
| Income Bracket | Owner-occupied | Renter-occupied |
| Less than $5,000 | 39 (0.8%) | 17 (1.1%) |
| $5,000 to $9,999 | 19 (0.4%) | 24 (1.6%) |
| $10,000 to $14,999 | 52 (1.1%) | 95 (6.2%) |
| $15,000 to $19,999 | 183 (3.8%) | 212 (13.9%) |
| $20,000 to $24,999 | 123 (2.5%) | 184 (12.0%) |
| $25,000 to $34,999 | 385 (7.9%) | 195 (12.8%) |
| $35,000 to $49,999 | 711 (14.6%) | 137 (9.0%) |
| $50,000 to $74,999 | 1,133 (23.3%) | 300 (19.7%) |
| $75,000 to $99,999 | 839 (17.2%) | 158 (10.3%) |
| $100,000 to $149,999 | 1,001 (20.5%) | 186 (12.2%) |
| $150,000 or more | 386 (7.9%) | 19 (1.2%) |
| Total | 4,871 (100.0%) | 1,527 (100.0%) |
Monthly Housing Cost Tiers in New Haven
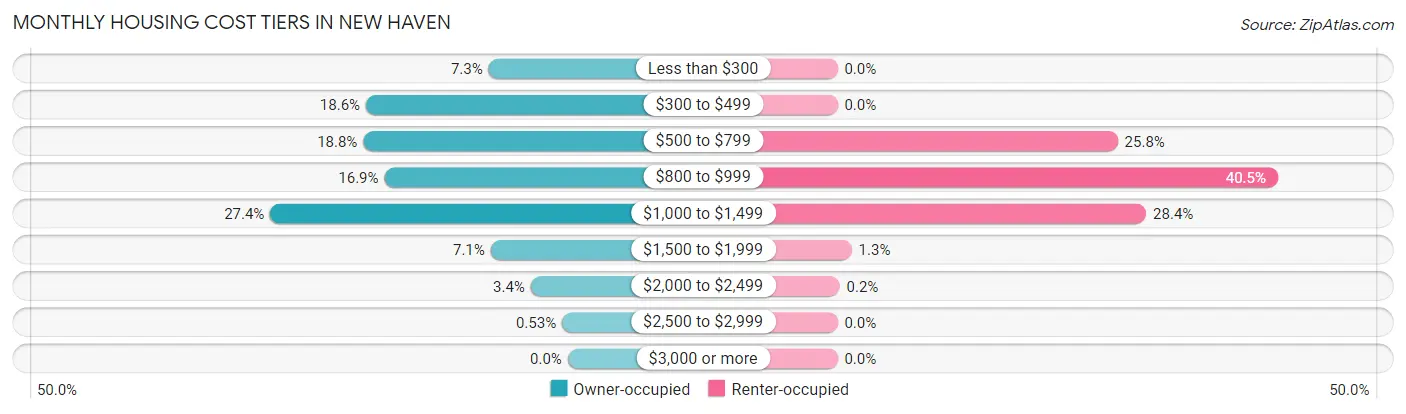
| Monthly Cost | Owner-occupied | Renter-occupied |
| Less than $300 | 355 (7.3%) | 0 (0.0%) |
| $300 to $499 | 905 (18.6%) | 0 (0.0%) |
| $500 to $799 | 917 (18.8%) | 394 (25.8%) |
| $800 to $999 | 822 (16.9%) | 619 (40.5%) |
| $1,000 to $1,499 | 1,334 (27.4%) | 434 (28.4%) |
| $1,500 to $1,999 | 346 (7.1%) | 20 (1.3%) |
| $2,000 to $2,499 | 166 (3.4%) | 3 (0.2%) |
| $2,500 to $2,999 | 26 (0.5%) | 0 (0.0%) |
| $3,000 or more | 0 (0.0%) | 0 (0.0%) |
| Total | 4,871 (100.0%) | 1,527 (100.0%) |
Physical Housing Characteristics in New Haven
Housing Structures in New Haven
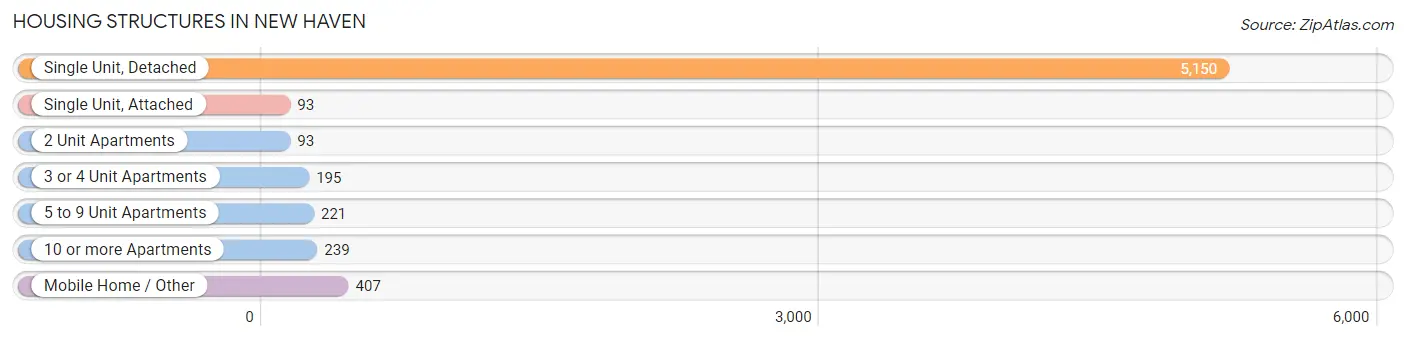
| Structure Type | # Housing Units | % Housing Units |
| Single Unit, Detached | 5,150 | 80.5% |
| Single Unit, Attached | 93 | 1.5% |
| 2 Unit Apartments | 93 | 1.5% |
| 3 or 4 Unit Apartments | 195 | 3.0% |
| 5 to 9 Unit Apartments | 221 | 3.5% |
| 10 or more Apartments | 239 | 3.7% |
| Mobile Home / Other | 407 | 6.4% |
| Total | 6,398 | 100.0% |
Housing Structures by Occupancy in New Haven
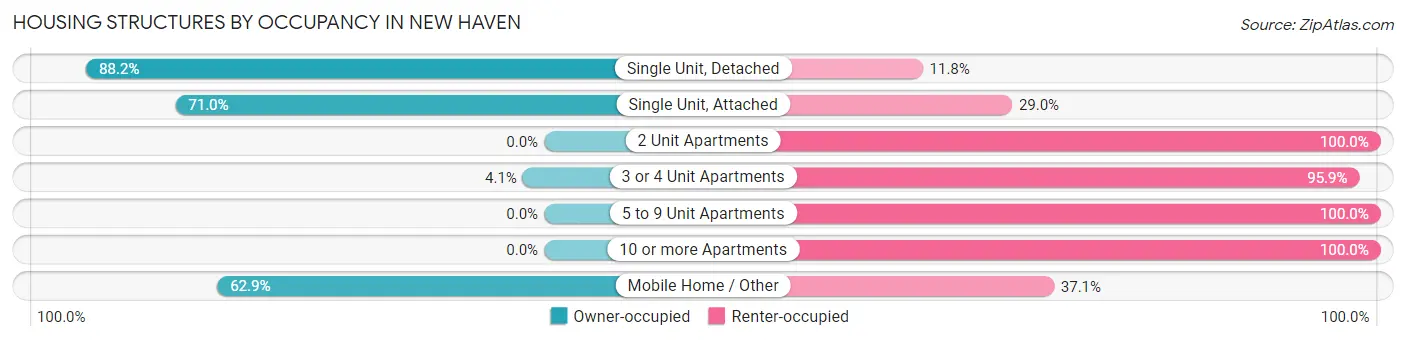
| Structure Type | Owner-occupied | Renter-occupied |
| Single Unit, Detached | 4,541 (88.2%) | 609 (11.8%) |
| Single Unit, Attached | 66 (71.0%) | 27 (29.0%) |
| 2 Unit Apartments | 0 (0.0%) | 93 (100.0%) |
| 3 or 4 Unit Apartments | 8 (4.1%) | 187 (95.9%) |
| 5 to 9 Unit Apartments | 0 (0.0%) | 221 (100.0%) |
| 10 or more Apartments | 0 (0.0%) | 239 (100.0%) |
| Mobile Home / Other | 256 (62.9%) | 151 (37.1%) |
| Total | 4,871 (76.1%) | 1,527 (23.9%) |
Housing Structures by Number of Rooms in New Haven
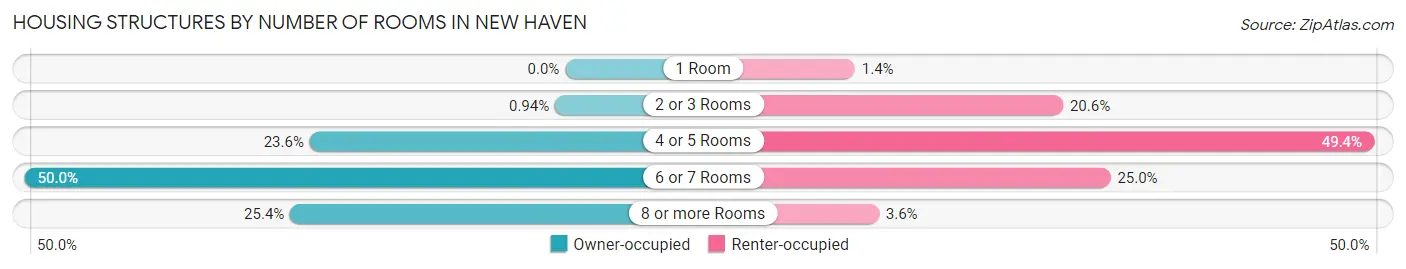
| Number of Rooms | Owner-occupied | Renter-occupied |
| 1 Room | 0 (0.0%) | 21 (1.4%) |
| 2 or 3 Rooms | 46 (0.9%) | 315 (20.6%) |
| 4 or 5 Rooms | 1,151 (23.6%) | 754 (49.4%) |
| 6 or 7 Rooms | 2,435 (50.0%) | 382 (25.0%) |
| 8 or more Rooms | 1,239 (25.4%) | 55 (3.6%) |
| Total | 4,871 (100.0%) | 1,527 (100.0%) |
Housing Structure by Heating Type in New Haven
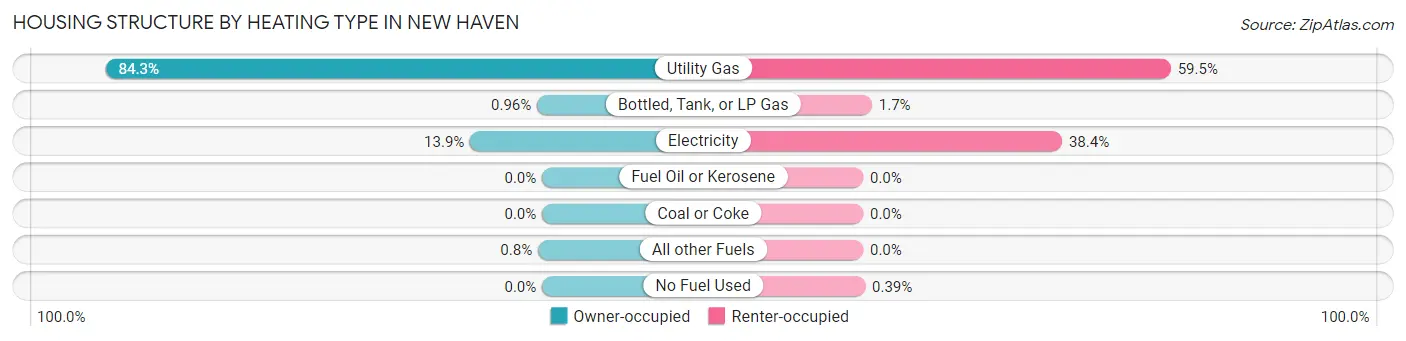
| Heating Type | Owner-occupied | Renter-occupied |
| Utility Gas | 4,108 (84.3%) | 908 (59.5%) |
| Bottled, Tank, or LP Gas | 47 (1.0%) | 26 (1.7%) |
| Electricity | 677 (13.9%) | 587 (38.4%) |
| Fuel Oil or Kerosene | 0 (0.0%) | 0 (0.0%) |
| Coal or Coke | 0 (0.0%) | 0 (0.0%) |
| All other Fuels | 39 (0.8%) | 0 (0.0%) |
| No Fuel Used | 0 (0.0%) | 6 (0.4%) |
| Total | 4,871 (100.0%) | 1,527 (100.0%) |
Household Vehicle Usage in New Haven
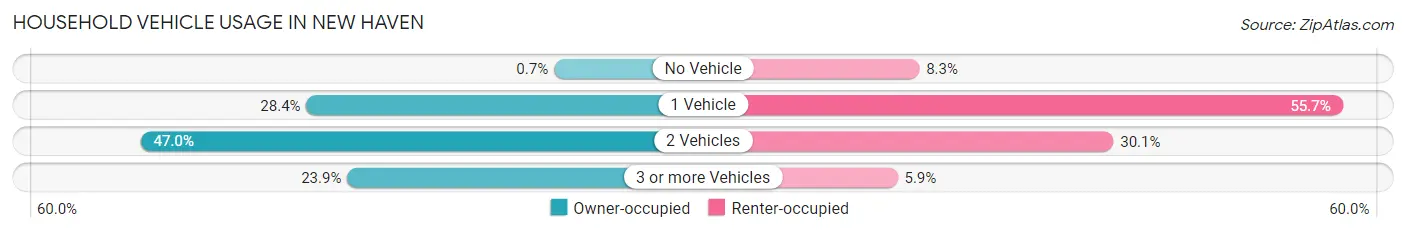
| Vehicles per Household | Owner-occupied | Renter-occupied |
| No Vehicle | 34 (0.7%) | 127 (8.3%) |
| 1 Vehicle | 1,385 (28.4%) | 851 (55.7%) |
| 2 Vehicles | 2,290 (47.0%) | 459 (30.1%) |
| 3 or more Vehicles | 1,162 (23.9%) | 90 (5.9%) |
| Total | 4,871 (100.0%) | 1,527 (100.0%) |
Real Estate & Mortgages in New Haven
Real Estate and Mortgage Overview in New Haven
| Characteristic | Without Mortgage | With Mortgage |
| Housing Units | 1,606 | 3,265 |
| Median Property Value | $132,700 | $146,900 |
| Median Household Income | $56,806 | $223 |
| Monthly Housing Costs | $399 | $0 |
| Real Estate Taxes | $1,043 | $149 |
Property Value by Mortgage Status in New Haven
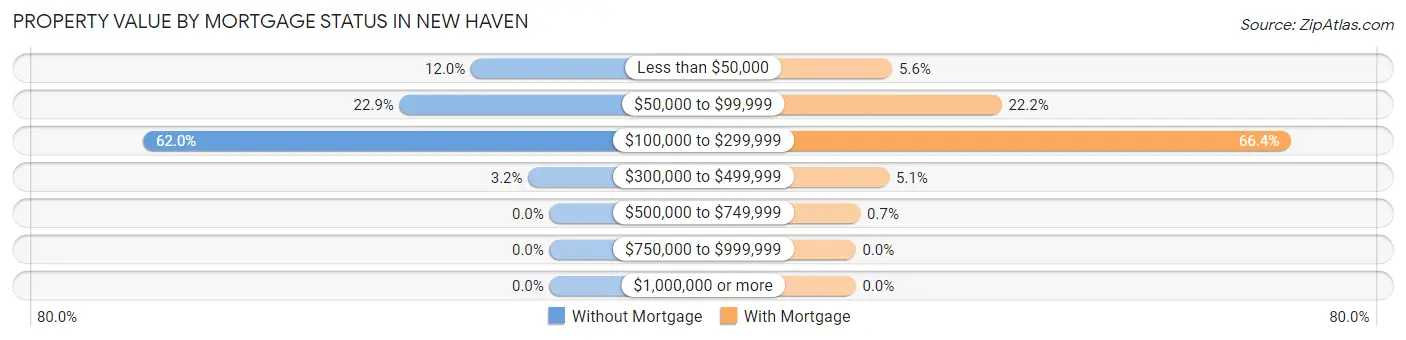
| Property Value | Without Mortgage | With Mortgage |
| Less than $50,000 | 192 (12.0%) | 182 (5.6%) |
| $50,000 to $99,999 | 367 (22.9%) | 726 (22.2%) |
| $100,000 to $299,999 | 995 (62.0%) | 2,167 (66.4%) |
| $300,000 to $499,999 | 52 (3.2%) | 167 (5.1%) |
| $500,000 to $749,999 | 0 (0.0%) | 23 (0.7%) |
| $750,000 to $999,999 | 0 (0.0%) | 0 (0.0%) |
| $1,000,000 or more | 0 (0.0%) | 0 (0.0%) |
| Total | 1,606 (100.0%) | 3,265 (100.0%) |
Household Income by Mortgage Status in New Haven
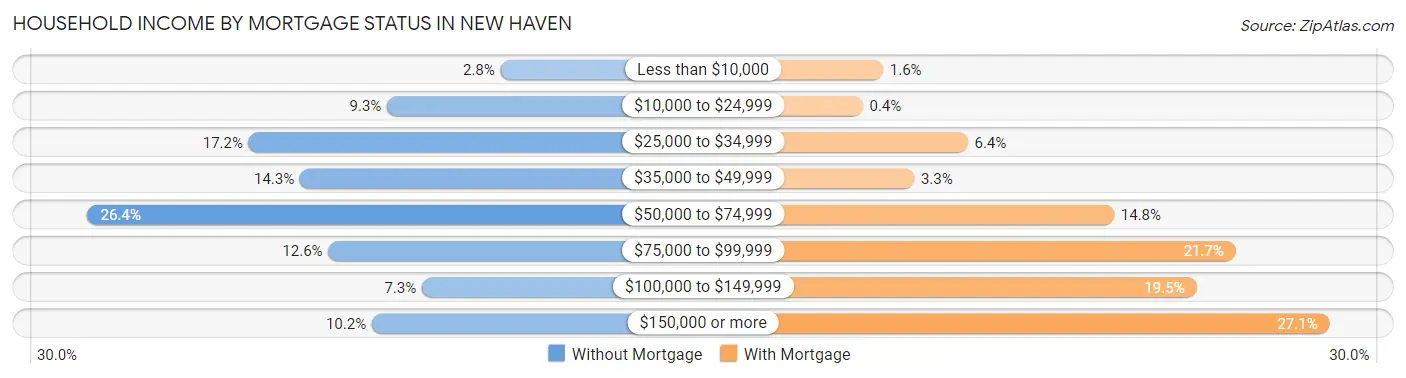
| Household Income | Without Mortgage | With Mortgage |
| Less than $10,000 | 45 (2.8%) | 51 (1.6%) |
| $10,000 to $24,999 | 149 (9.3%) | 13 (0.4%) |
| $25,000 to $34,999 | 276 (17.2%) | 209 (6.4%) |
| $35,000 to $49,999 | 229 (14.3%) | 109 (3.3%) |
| $50,000 to $74,999 | 424 (26.4%) | 482 (14.8%) |
| $75,000 to $99,999 | 203 (12.6%) | 709 (21.7%) |
| $100,000 to $149,999 | 117 (7.3%) | 636 (19.5%) |
| $150,000 or more | 163 (10.2%) | 884 (27.1%) |
| Total | 1,606 (100.0%) | 3,265 (100.0%) |
Property Value to Household Income Ratio in New Haven
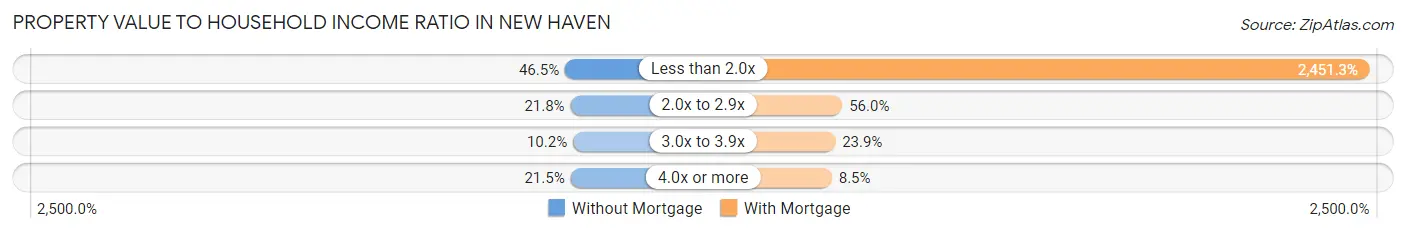
| Value-to-Income Ratio | Without Mortgage | With Mortgage |
| Less than 2.0x | 747 (46.5%) | 80,034 (2,451.3%) |
| 2.0x to 2.9x | 350 (21.8%) | 1,828 (56.0%) |
| 3.0x to 3.9x | 163 (10.2%) | 779 (23.9%) |
| 4.0x or more | 346 (21.5%) | 277 (8.5%) |
| Total | 1,606 (100.0%) | 3,265 (100.0%) |
Real Estate Taxes by Mortgage Status in New Haven
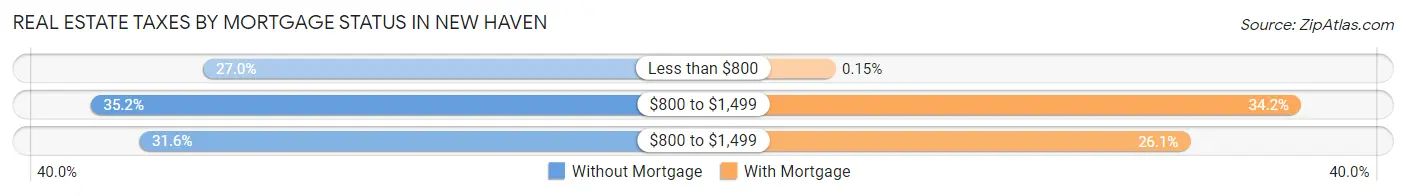
| Property Taxes | Without Mortgage | With Mortgage |
| Less than $800 | 433 (27.0%) | 5 (0.2%) |
| $800 to $1,499 | 565 (35.2%) | 1,116 (34.2%) |
| $800 to $1,499 | 508 (31.6%) | 852 (26.1%) |
| Total | 1,606 (100.0%) | 3,265 (100.0%) |
Health & Disability in New Haven
Health Insurance Coverage by Age in New Haven
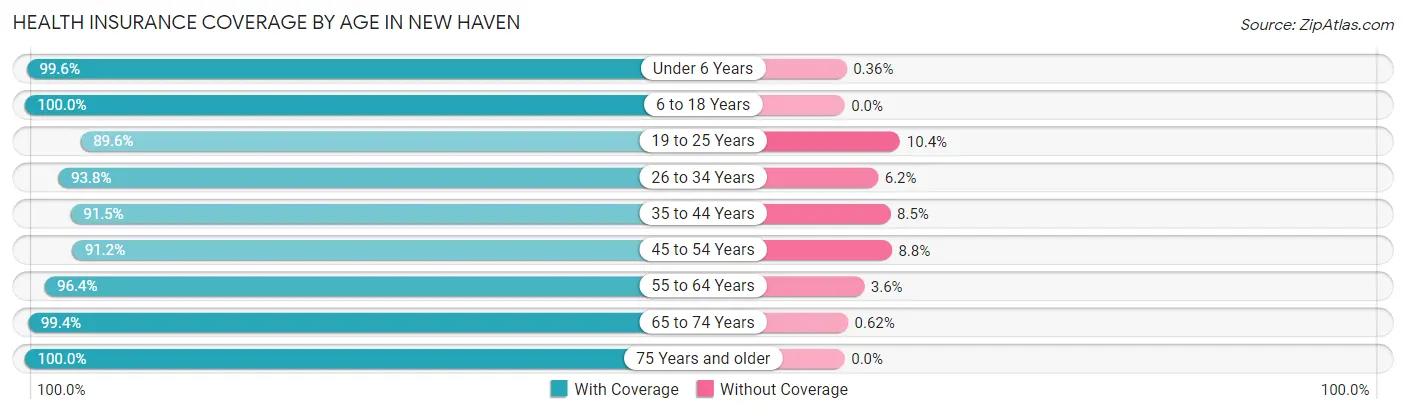
| Age Bracket | With Coverage | Without Coverage |
| Under 6 Years | 1,401 (99.6%) | 5 (0.4%) |
| 6 to 18 Years | 2,754 (100.0%) | 0 (0.0%) |
| 19 to 25 Years | 1,028 (89.6%) | 119 (10.4%) |
| 26 to 34 Years | 1,714 (93.8%) | 114 (6.2%) |
| 35 to 44 Years | 1,745 (91.5%) | 163 (8.5%) |
| 45 to 54 Years | 1,555 (91.2%) | 150 (8.8%) |
| 55 to 64 Years | 1,961 (96.4%) | 74 (3.6%) |
| 65 to 74 Years | 1,614 (99.4%) | 10 (0.6%) |
| 75 Years and older | 1,019 (100.0%) | 0 (0.0%) |
| Total | 14,791 (95.9%) | 635 (4.1%) |
Health Insurance Coverage by Citizenship Status in New Haven
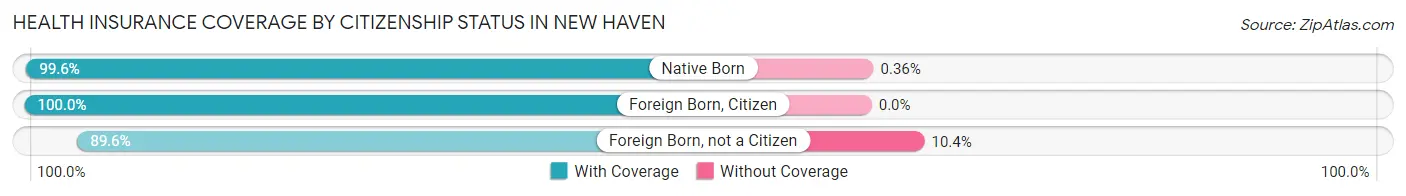
| Citizenship Status | With Coverage | Without Coverage |
| Native Born | 1,401 (99.6%) | 5 (0.4%) |
| Foreign Born, Citizen | 2,754 (100.0%) | 0 (0.0%) |
| Foreign Born, not a Citizen | 1,028 (89.6%) | 119 (10.4%) |
Health Insurance Coverage by Household Income in New Haven
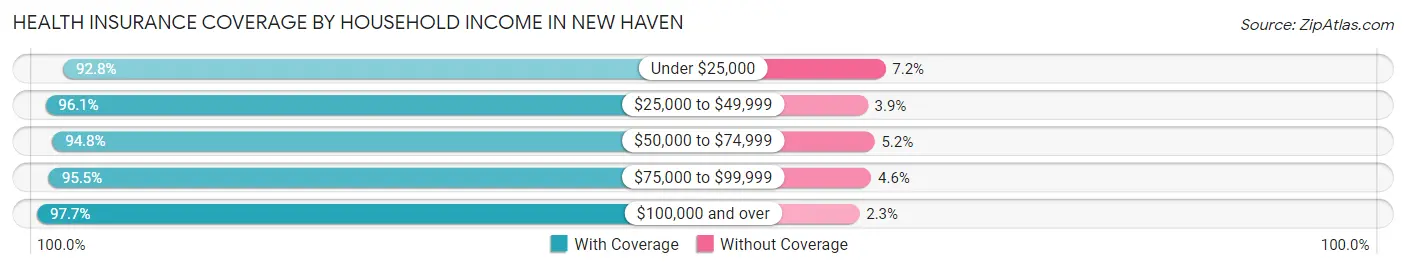
| Household Income | With Coverage | Without Coverage |
| Under $25,000 | 1,360 (92.8%) | 106 (7.2%) |
| $25,000 to $49,999 | 2,562 (96.1%) | 104 (3.9%) |
| $50,000 to $74,999 | 3,399 (94.8%) | 186 (5.2%) |
| $75,000 to $99,999 | 2,537 (95.5%) | 121 (4.5%) |
| $100,000 and over | 4,927 (97.7%) | 118 (2.3%) |
Public vs Private Health Insurance Coverage by Age in New Haven
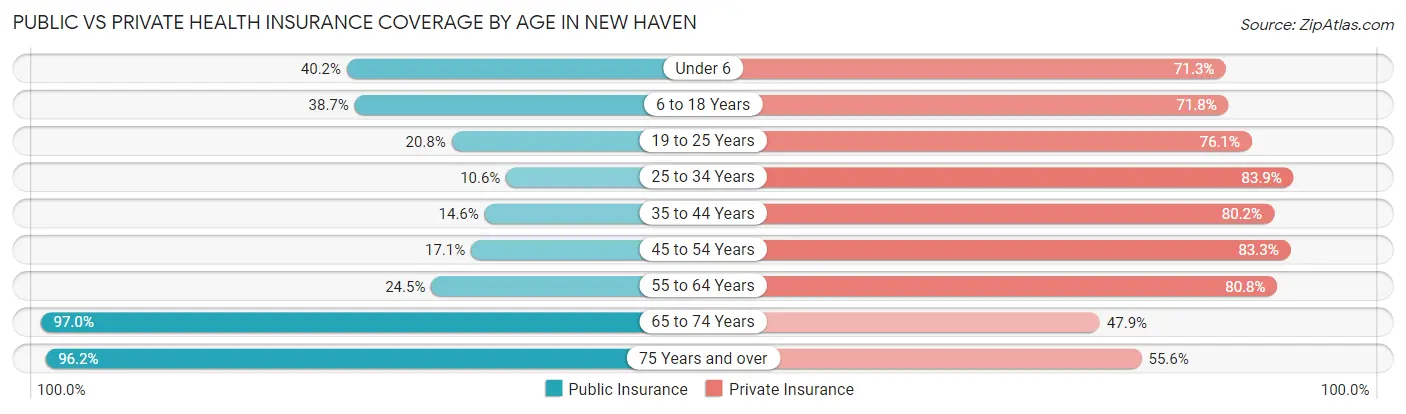
| Age Bracket | Public Insurance | Private Insurance |
| Under 6 | 565 (40.2%) | 1,003 (71.3%) |
| 6 to 18 Years | 1,067 (38.7%) | 1,977 (71.8%) |
| 19 to 25 Years | 238 (20.7%) | 873 (76.1%) |
| 25 to 34 Years | 194 (10.6%) | 1,533 (83.9%) |
| 35 to 44 Years | 279 (14.6%) | 1,530 (80.2%) |
| 45 to 54 Years | 292 (17.1%) | 1,420 (83.3%) |
| 55 to 64 Years | 499 (24.5%) | 1,645 (80.8%) |
| 65 to 74 Years | 1,576 (97.0%) | 778 (47.9%) |
| 75 Years and over | 980 (96.2%) | 567 (55.6%) |
| Total | 5,690 (36.9%) | 11,326 (73.4%) |
Disability Status by Sex by Age in New Haven
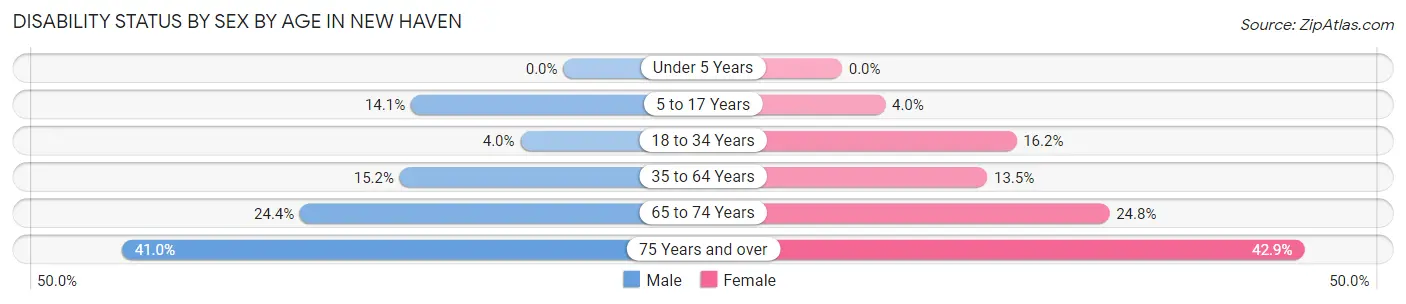
| Age Bracket | Male | Female |
| Under 5 Years | 0 (0.0%) | 0 (0.0%) |
| 5 to 17 Years | 188 (14.1%) | 57 (4.0%) |
| 18 to 34 Years | 57 (4.0%) | 275 (16.2%) |
| 35 to 64 Years | 426 (15.2%) | 383 (13.5%) |
| 65 to 74 Years | 193 (24.4%) | 207 (24.8%) |
| 75 Years and over | 134 (41.0%) | 297 (42.9%) |
Disability Class by Sex by Age in New Haven
Disability Class: Hearing Difficulty
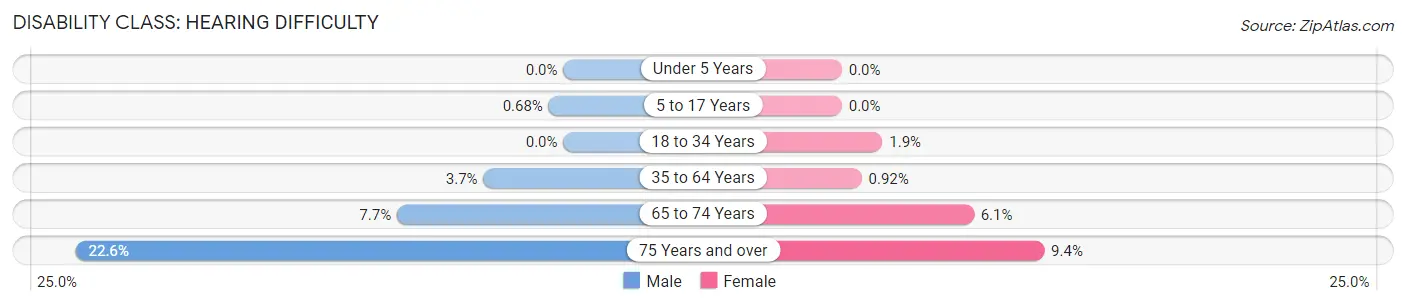
| Age Bracket | Male | Female |
| Under 5 Years | 0 (0.0%) | 0 (0.0%) |
| 5 to 17 Years | 9 (0.7%) | 0 (0.0%) |
| 18 to 34 Years | 0 (0.0%) | 32 (1.9%) |
| 35 to 64 Years | 104 (3.7%) | 26 (0.9%) |
| 65 to 74 Years | 61 (7.7%) | 51 (6.1%) |
| 75 Years and over | 74 (22.6%) | 65 (9.4%) |
Disability Class: Vision Difficulty
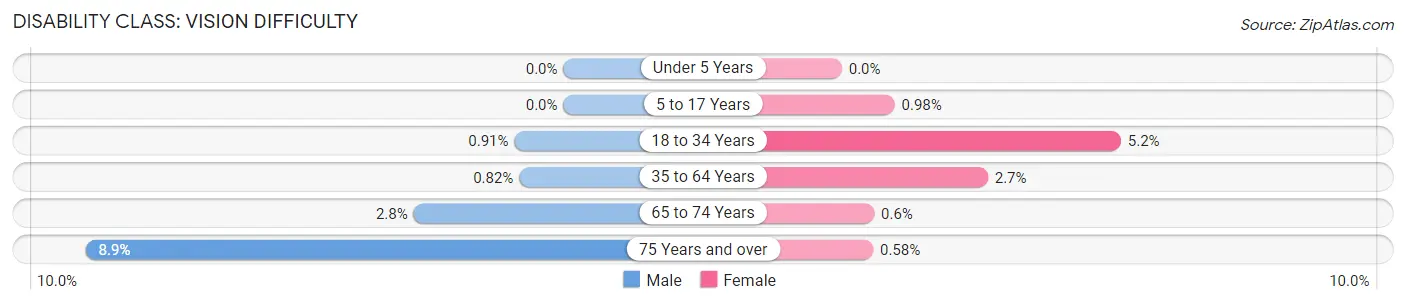
| Age Bracket | Male | Female |
| Under 5 Years | 0 (0.0%) | 0 (0.0%) |
| 5 to 17 Years | 0 (0.0%) | 14 (1.0%) |
| 18 to 34 Years | 13 (0.9%) | 88 (5.2%) |
| 35 to 64 Years | 23 (0.8%) | 77 (2.7%) |
| 65 to 74 Years | 22 (2.8%) | 5 (0.6%) |
| 75 Years and over | 29 (8.9%) | 4 (0.6%) |
Disability Class: Cognitive Difficulty
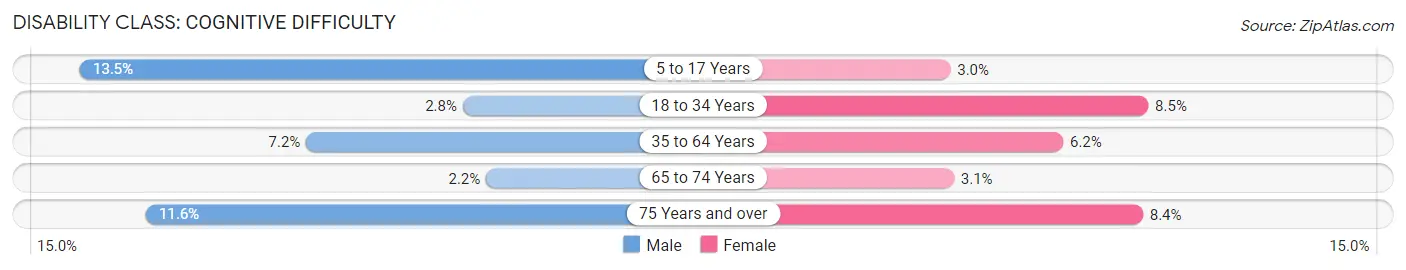
| Age Bracket | Male | Female |
| 5 to 17 Years | 179 (13.5%) | 43 (3.0%) |
| 18 to 34 Years | 40 (2.8%) | 145 (8.5%) |
| 35 to 64 Years | 201 (7.2%) | 175 (6.2%) |
| 65 to 74 Years | 17 (2.1%) | 26 (3.1%) |
| 75 Years and over | 38 (11.6%) | 58 (8.4%) |
Disability Class: Ambulatory Difficulty
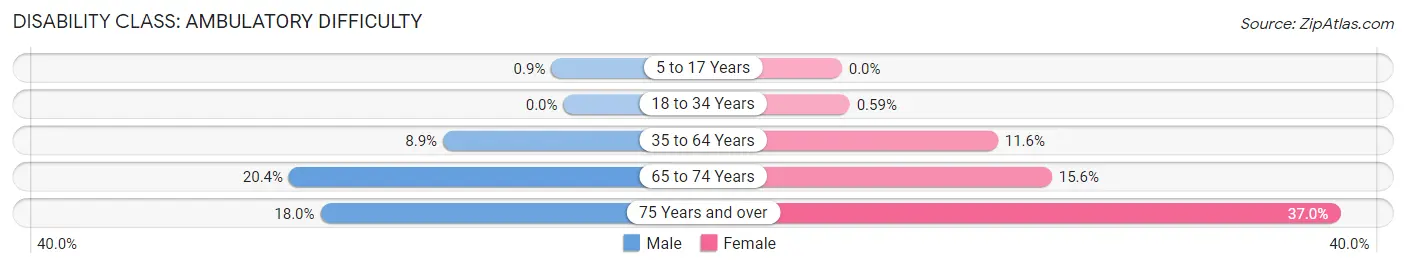
| Age Bracket | Male | Female |
| 5 to 17 Years | 12 (0.9%) | 0 (0.0%) |
| 18 to 34 Years | 0 (0.0%) | 10 (0.6%) |
| 35 to 64 Years | 251 (8.9%) | 329 (11.6%) |
| 65 to 74 Years | 161 (20.4%) | 130 (15.6%) |
| 75 Years and over | 59 (18.0%) | 256 (37.0%) |
Disability Class: Self-Care Difficulty
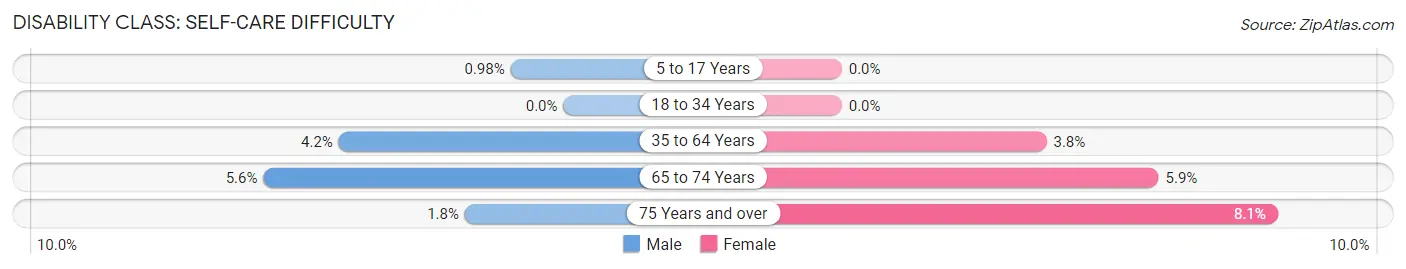
| Age Bracket | Male | Female |
| 5 to 17 Years | 13 (1.0%) | 0 (0.0%) |
| 18 to 34 Years | 0 (0.0%) | 0 (0.0%) |
| 35 to 64 Years | 117 (4.2%) | 108 (3.8%) |
| 65 to 74 Years | 44 (5.6%) | 49 (5.9%) |
| 75 Years and over | 6 (1.8%) | 56 (8.1%) |
Technology Access in New Haven
Computing Device Access in New Haven
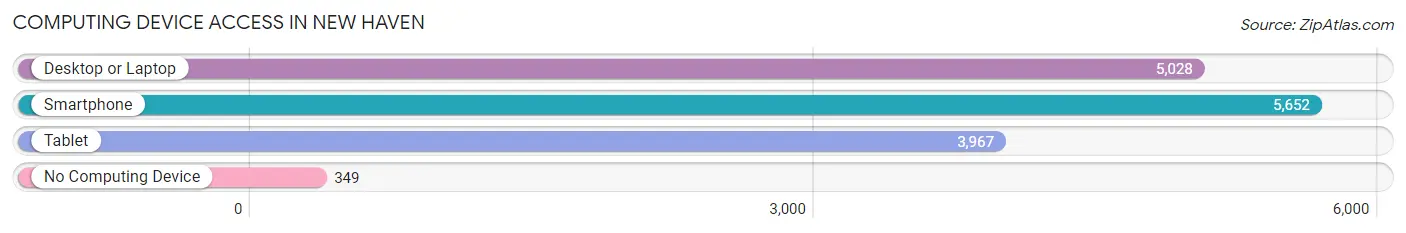
| Device Type | # Households | % Households |
| Desktop or Laptop | 5,028 | 78.6% |
| Smartphone | 5,652 | 88.3% |
| Tablet | 3,967 | 62.0% |
| No Computing Device | 349 | 5.4% |
| Total | 6,398 | 100.0% |
Internet Access in New Haven
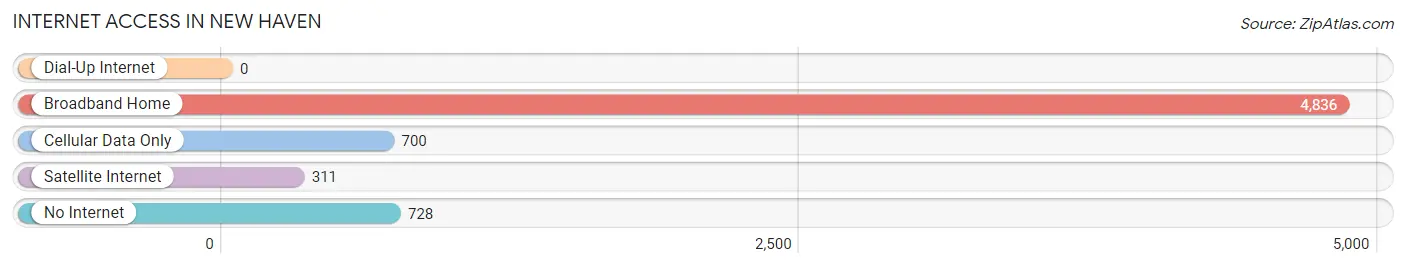
| Internet Type | # Households | % Households |
| Dial-Up Internet | 0 | 0.0% |
| Broadband Home | 4,836 | 75.6% |
| Cellular Data Only | 700 | 10.9% |
| Satellite Internet | 311 | 4.9% |
| No Internet | 728 | 11.4% |
| Total | 6,398 | 100.0% |
New Haven Summary
New Haven, Indiana is a small city located in Allen County, Indiana, United States. It is part of the Fort Wayne metropolitan area and is located just east of the city of Fort Wayne. The city has a population of 16,350 as of the 2010 census, making it the second largest city in Allen County.
History
New Haven was founded in 1837 by a group of settlers from New Haven, Connecticut. The settlers were led by John B. Turpie, who had previously served as a member of the Indiana General Assembly. The town was originally known as Turpie, but was later renamed New Haven in 1839.
The city was incorporated in 1867 and has since grown to become the second largest city in Allen County. The city has a rich history and is home to several historic sites, including the New Haven Historic District, which is listed on the National Register of Historic Places.
Geography
New Haven is located in the northeastern corner of Allen County, Indiana, at the intersection of U.S. Route 24 and State Road 930. The city is situated on the banks of the Maumee River, which forms the border between Allen County and neighboring DeKalb County.
The city has a total area of 8.2 square miles, of which 8.1 square miles is land and 0.1 square miles is water. The city is located in the humid continental climate zone, with hot summers and cold winters.
Economy
New Haven is a small city with a diverse economy. The city is home to several manufacturing companies, including a steel mill, a paper mill, and a plastics plant. The city is also home to several retail stores, restaurants, and other businesses.
The city is also home to several educational institutions, including the New Haven Community School Corporation, which serves the city and surrounding areas. The city is also home to the New Haven Public Library, which serves the city and surrounding areas.
Demographics
As of the 2010 census, the city had a population of 16,350. The racial makeup of the city was 87.3% White, 8.2% African American, 0.3% Native American, 0.7% Asian, 0.1% Pacific Islander, 1.2% from other races, and 2.4% from two or more races. Hispanic or Latino of any race were 3.3% of the population.
The median income for a household in the city was $45,945, and the median income for a family was $54,945. The per capita income for the city was $21,945. About 8.2% of families and 10.3% of the population were below the poverty line, including 14.2% of those under age 18 and 6.2% of those age 65 or over.
New Haven is a small city with a rich history and a diverse economy. The city is home to several manufacturing companies, educational institutions, and other businesses. The city has a population of 16,350 as of the 2010 census, making it the second largest city in Allen County.
Common Questions
What is Per Capita Income in New Haven?
Per Capita income in New Haven is $30,755.
What is the Median Family Income in New Haven?
Median Family Income in New Haven is $74,273.
What is the Median Household income in New Haven?
Median Household Income in New Haven is $63,744.
What is Income or Wage Gap in New Haven?
Income or Wage Gap in New Haven is 28.2%.
Women in New Haven earn 71.8 cents for every dollar earned by a man.
What is Inequality or Gini Index in New Haven?
Inequality or Gini Index in New Haven is 0.36.
What is the Total Population of New Haven?
Total Population of New Haven is 15,552.
What is the Total Male Population of New Haven?
Total Male Population of New Haven is 7,354.
What is the Total Female Population of New Haven?
Total Female Population of New Haven is 8,198.
What is the Ratio of Males per 100 Females in New Haven?
There are 89.70 Males per 100 Females in New Haven.
What is the Ratio of Females per 100 Males in New Haven?
There are 111.48 Females per 100 Males in New Haven.
What is the Median Population Age in New Haven?
Median Population Age in New Haven is 38.4 Years.
What is the Average Family Size in New Haven
Average Family Size in New Haven is 3.0 People.
What is the Average Household Size in New Haven
Average Household Size in New Haven is 2.4 People.
How Large is the Labor Force in New Haven?
There are 7,934 People in the Labor Forcein in New Haven.
What is the Percentage of People in the Labor Force in New Haven?
66.8% of People are in the Labor Force in New Haven.
What is the Unemployment Rate in New Haven?
Unemployment Rate in New Haven is 4.4%.