Morocco, IN Map & Demographics
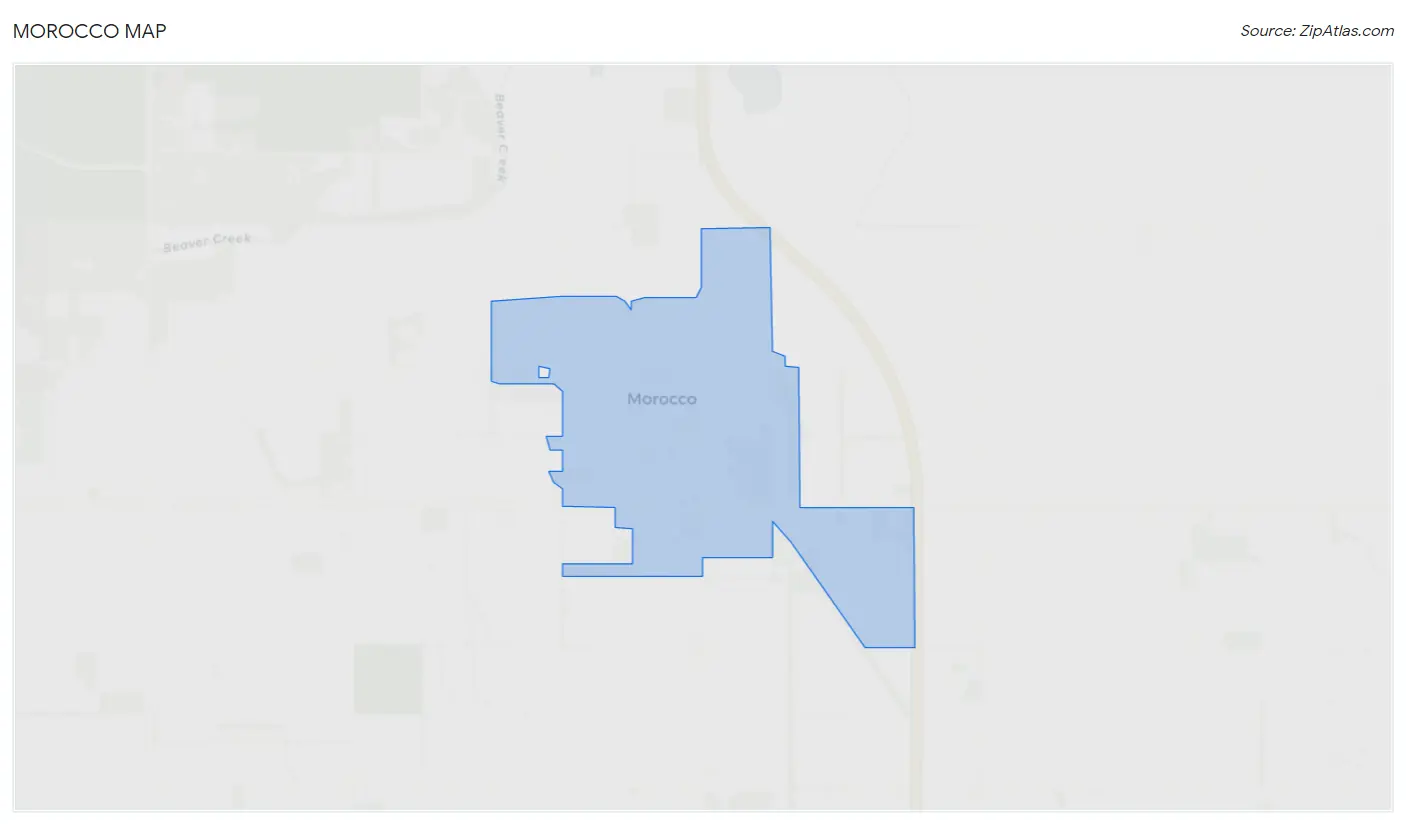
Morocco Map
Morocco Overview
$28,265
PER CAPITA INCOME
$71,667
AVG FAMILY INCOME
$53,472
AVG HOUSEHOLD INCOME
44.7%
WAGE / INCOME GAP [ % ]
55.3¢/ $1
WAGE / INCOME GAP [ $ ]
0.35
INEQUALITY / GINI INDEX
1,107
TOTAL POPULATION
545
MALE POPULATION
562
FEMALE POPULATION
96.98
MALES / 100 FEMALES
103.12
FEMALES / 100 MALES
37.3
MEDIAN AGE
3.0
AVG FAMILY SIZE
2.4
AVG HOUSEHOLD SIZE
525
LABOR FORCE [ PEOPLE ]
60.4%
PERCENT IN LABOR FORCE
8.2%
UNEMPLOYMENT RATE
Morocco Zip Codes
Morocco Area Codes
Income in Morocco
Income Overview in Morocco
Per Capita Income in Morocco is $28,265, while median incomes of families and households are $71,667 and $53,472 respectively.
| Characteristic | Number | Measure |
| Per Capita Income | 1,107 | $28,265 |
| Median Family Income | 286 | $71,667 |
| Mean Family Income | 286 | $80,966 |
| Median Household Income | 455 | $53,472 |
| Mean Household Income | 455 | $69,734 |
| Income Deficit | 286 | $0 |
| Wage / Income Gap (%) | 1,107 | 44.72% |
| Wage / Income Gap ($) | 1,107 | 55.28¢ per $1 |
| Gini / Inequality Index | 1,107 | 0.35 |
Earnings by Sex in Morocco
Average Earnings in Morocco are $41,576, $50,000 for men and $27,639 for women, a difference of 44.7%.
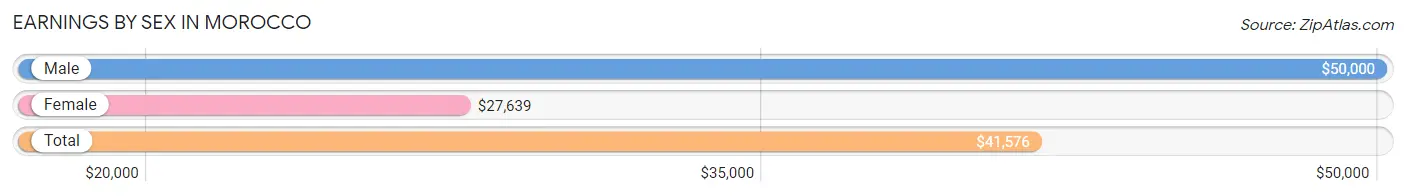
| Sex | Number | Average Earnings |
| Male | 294 (52.4%) | $50,000 |
| Female | 267 (47.6%) | $27,639 |
| Total | 561 (100.0%) | $41,576 |
Earnings by Sex by Income Bracket in Morocco
The most common earnings brackets in Morocco are $45,000 to $49,999 for men (46 | 15.7%) and $15,000 to $17,499 for women (35 | 13.1%).
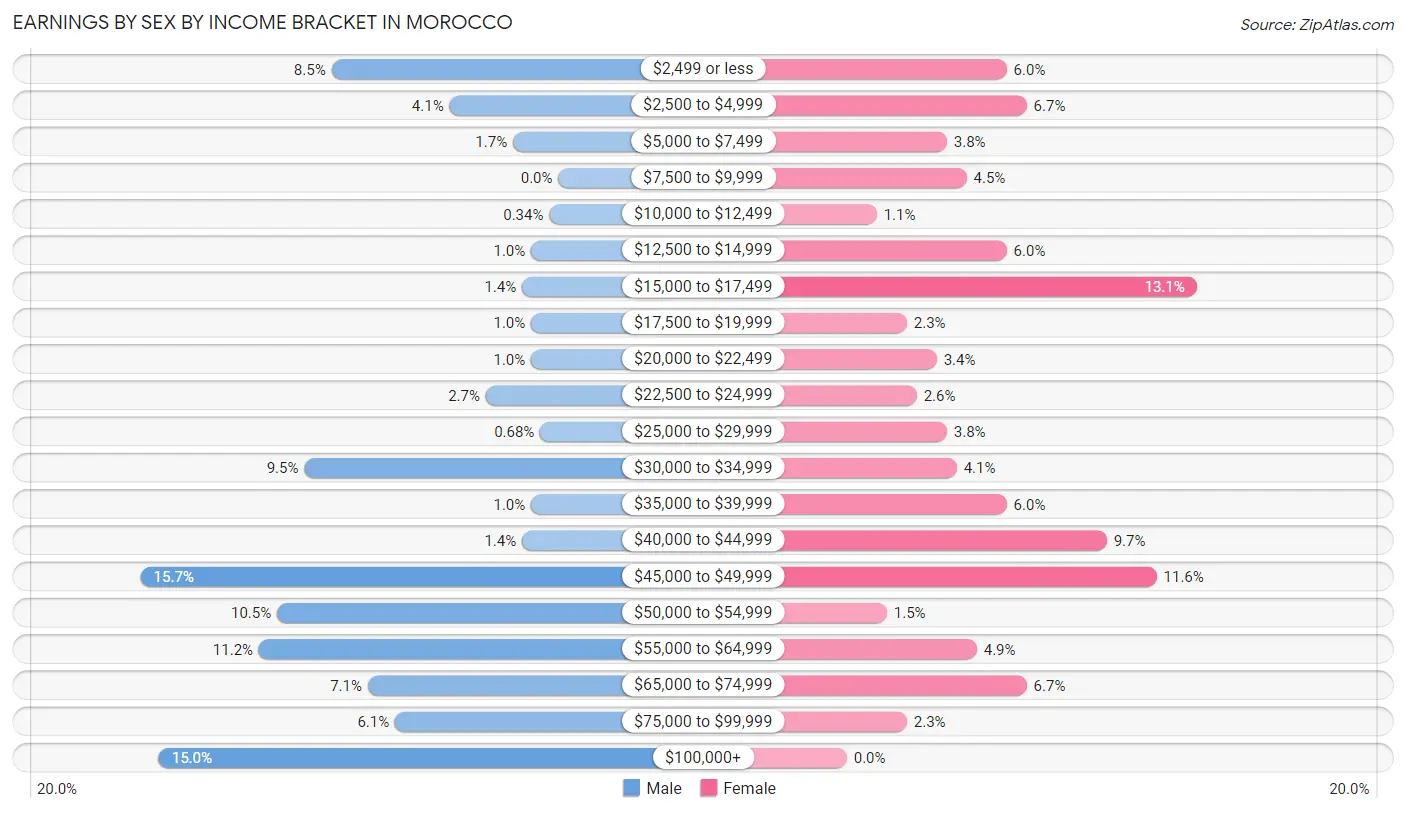
| Income | Male | Female |
| $2,499 or less | 25 (8.5%) | 16 (6.0%) |
| $2,500 to $4,999 | 12 (4.1%) | 18 (6.7%) |
| $5,000 to $7,499 | 5 (1.7%) | 10 (3.7%) |
| $7,500 to $9,999 | 0 (0.0%) | 12 (4.5%) |
| $10,000 to $12,499 | 1 (0.3%) | 3 (1.1%) |
| $12,500 to $14,999 | 3 (1.0%) | 16 (6.0%) |
| $15,000 to $17,499 | 4 (1.4%) | 35 (13.1%) |
| $17,500 to $19,999 | 3 (1.0%) | 6 (2.2%) |
| $20,000 to $22,499 | 3 (1.0%) | 9 (3.4%) |
| $22,500 to $24,999 | 8 (2.7%) | 7 (2.6%) |
| $25,000 to $29,999 | 2 (0.7%) | 10 (3.7%) |
| $30,000 to $34,999 | 28 (9.5%) | 11 (4.1%) |
| $35,000 to $39,999 | 3 (1.0%) | 16 (6.0%) |
| $40,000 to $44,999 | 4 (1.4%) | 26 (9.7%) |
| $45,000 to $49,999 | 46 (15.7%) | 31 (11.6%) |
| $50,000 to $54,999 | 31 (10.5%) | 4 (1.5%) |
| $55,000 to $64,999 | 33 (11.2%) | 13 (4.9%) |
| $65,000 to $74,999 | 21 (7.1%) | 18 (6.7%) |
| $75,000 to $99,999 | 18 (6.1%) | 6 (2.2%) |
| $100,000+ | 44 (15.0%) | 0 (0.0%) |
| Total | 294 (100.0%) | 267 (100.0%) |
Earnings by Sex by Educational Attainment in Morocco
Average earnings in Morocco are $53,864 for men and $35,938 for women, a difference of 33.3%. Men with an educational attainment of college or associate's degree enjoy the highest average annual earnings of $63,333, while those with high school diploma education earn the least with $51,094. Women with an educational attainment of bachelor's degree earn the most with the average annual earnings of $60,417, while those with college or associate's degree education have the smallest earnings of $35,938.
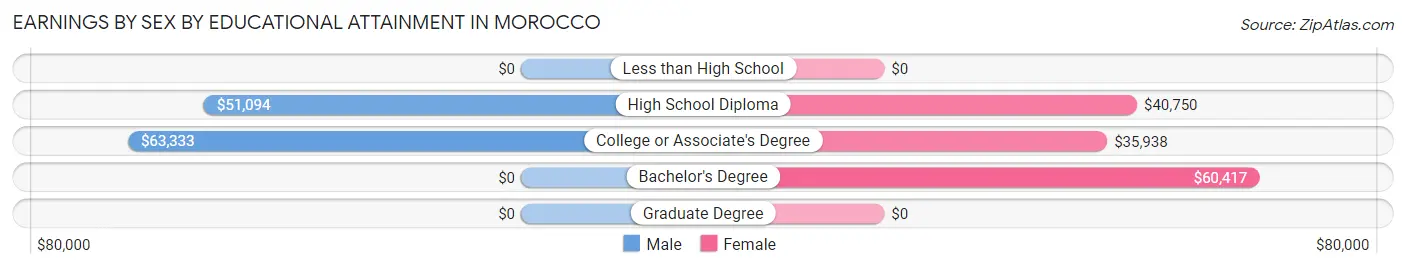
| Educational Attainment | Male Income | Female Income |
| Less than High School | - | - |
| High School Diploma | $51,094 | $40,750 |
| College or Associate's Degree | $63,333 | $35,938 |
| Bachelor's Degree | - | - |
| Graduate Degree | - | - |
| Total | $53,864 | $35,938 |
Family Income in Morocco
Family Income Brackets in Morocco
According to the Morocco family income data, there are 68 families falling into the $50,000 to $74,999 income range, which is the most common income bracket and makes up 23.8% of all families.
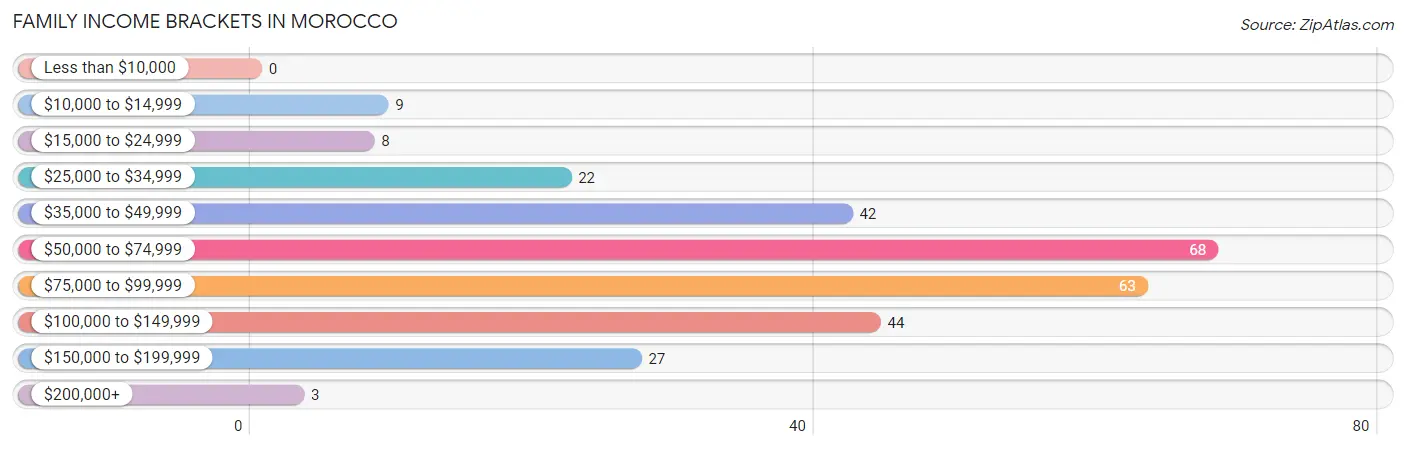
| Income Bracket | # Families | % Families |
| Less than $10,000 | 0 | 0.0% |
| $10,000 to $14,999 | 9 | 3.1% |
| $15,000 to $24,999 | 8 | 2.8% |
| $25,000 to $34,999 | 22 | 7.7% |
| $35,000 to $49,999 | 42 | 14.7% |
| $50,000 to $74,999 | 68 | 23.8% |
| $75,000 to $99,999 | 63 | 22.0% |
| $100,000 to $149,999 | 44 | 15.4% |
| $150,000 to $199,999 | 27 | 9.4% |
| $200,000+ | 3 | 1.0% |
Family Income by Famaliy Size in Morocco
3-person families (49 | 17.1%) account for the highest median family income in Morocco with $69,583 per family, while 2-person families (132 | 46.2%) have the highest median income of $34,250 per family member.
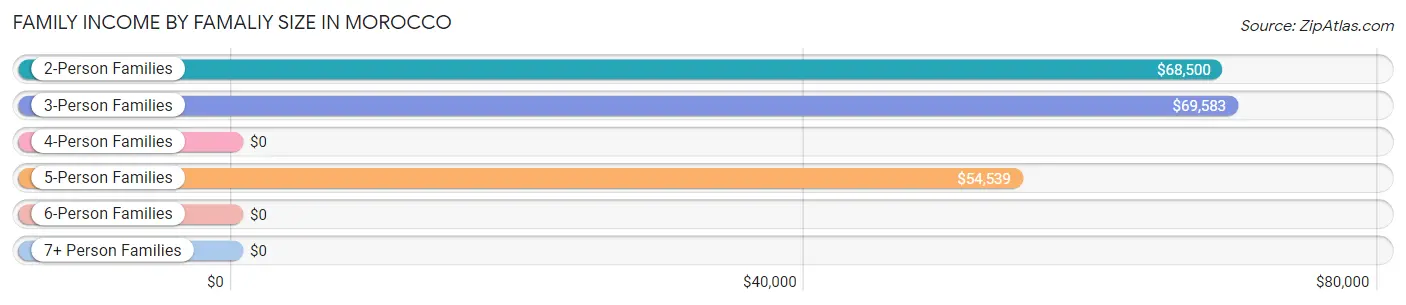
| Income Bracket | # Families | Median Income |
| 2-Person Families | 132 (46.2%) | $68,500 |
| 3-Person Families | 49 (17.1%) | $69,583 |
| 4-Person Families | 57 (19.9%) | $0 |
| 5-Person Families | 47 (16.4%) | $54,539 |
| 6-Person Families | 1 (0.4%) | $0 |
| 7+ Person Families | 0 (0.0%) | $0 |
| Total | 286 (100.0%) | $71,667 |
Family Income by Number of Earners in Morocco
The median family income in Morocco is $71,667, with families comprising 3+ earners (28) having the highest median family income of $90,000, while families with no earners (48) have the lowest median family income of $42,500, accounting for 9.8% and 16.8% of families, respectively.
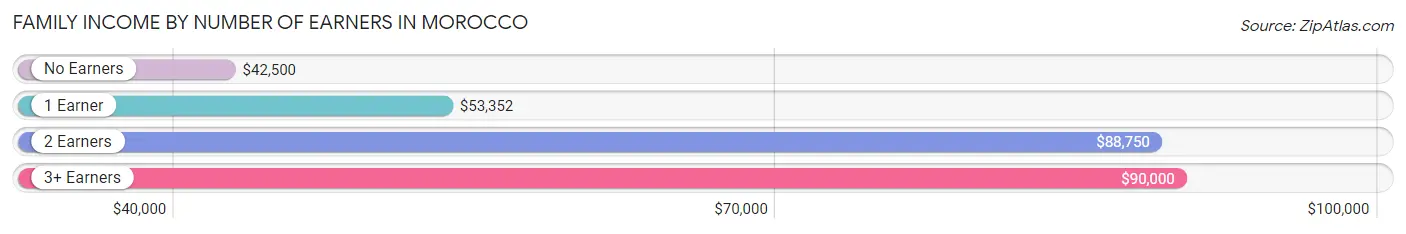
| Number of Earners | # Families | Median Income |
| No Earners | 48 (16.8%) | $42,500 |
| 1 Earner | 109 (38.1%) | $53,352 |
| 2 Earners | 101 (35.3%) | $88,750 |
| 3+ Earners | 28 (9.8%) | $90,000 |
| Total | 286 (100.0%) | $71,667 |
Household Income in Morocco
Household Income Brackets in Morocco
With 103 households falling in the category, the $35,000 to $49,999 income range is the most frequent in Morocco, accounting for 22.6% of all households.
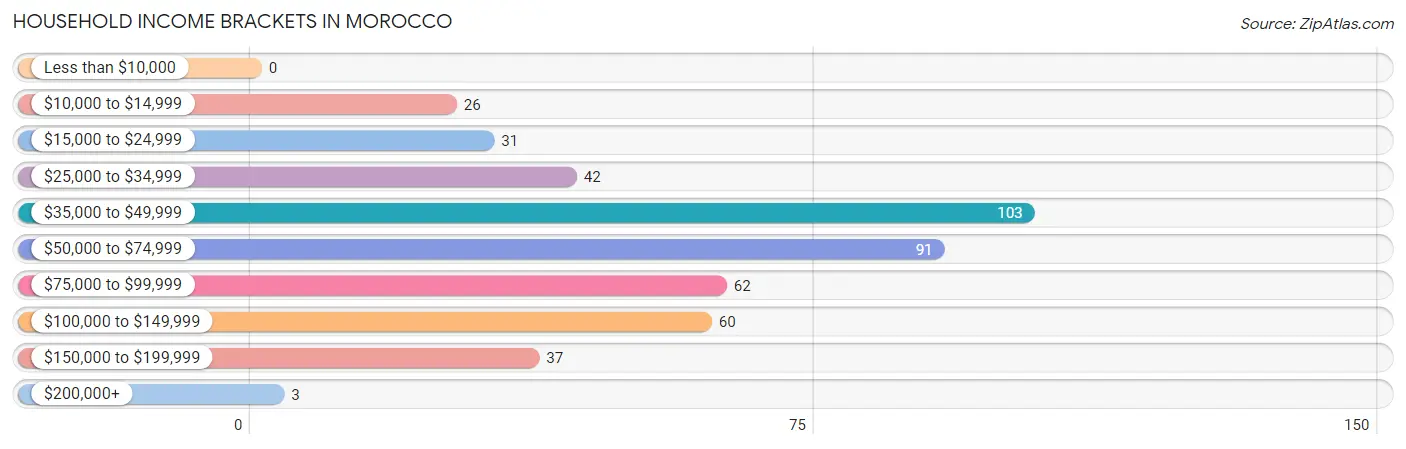
| Income Bracket | # Households | % Households |
| Less than $10,000 | 0 | 0.0% |
| $10,000 to $14,999 | 26 | 5.7% |
| $15,000 to $24,999 | 31 | 6.8% |
| $25,000 to $34,999 | 42 | 9.2% |
| $35,000 to $49,999 | 103 | 22.6% |
| $50,000 to $74,999 | 91 | 20.0% |
| $75,000 to $99,999 | 62 | 13.6% |
| $100,000 to $149,999 | 60 | 13.2% |
| $150,000 to $199,999 | 37 | 8.1% |
| $200,000+ | 3 | 0.7% |
Household Income by Householder Age in Morocco
The median household income in Morocco is $53,472, with the highest median household income of $70,972 found in the 45 to 64 years age bracket for the primary householder. A total of 165 households (36.3%) fall into this category. Meanwhile, the 15 to 24 years age bracket for the primary householder has the lowest median household income of $0, with 14 households (3.1%) in this group.
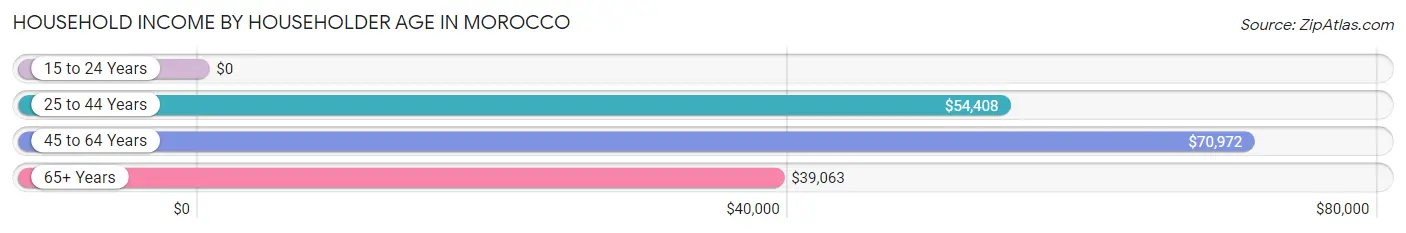
| Income Bracket | # Households | Median Income |
| 15 to 24 Years | 14 (3.1%) | $0 |
| 25 to 44 Years | 155 (34.1%) | $54,408 |
| 45 to 64 Years | 165 (36.3%) | $70,972 |
| 65+ Years | 121 (26.6%) | $39,063 |
| Total | 455 (100.0%) | $53,472 |
Poverty in Morocco
Income Below Poverty by Sex and Age in Morocco
With 3.3% poverty level for males and 7.3% for females among the residents of Morocco, 15 year old males and 15 year old females are the most vulnerable to poverty, with 3 males (12.5%) and 5 females (20.0%) in their respective age groups living below the poverty level.
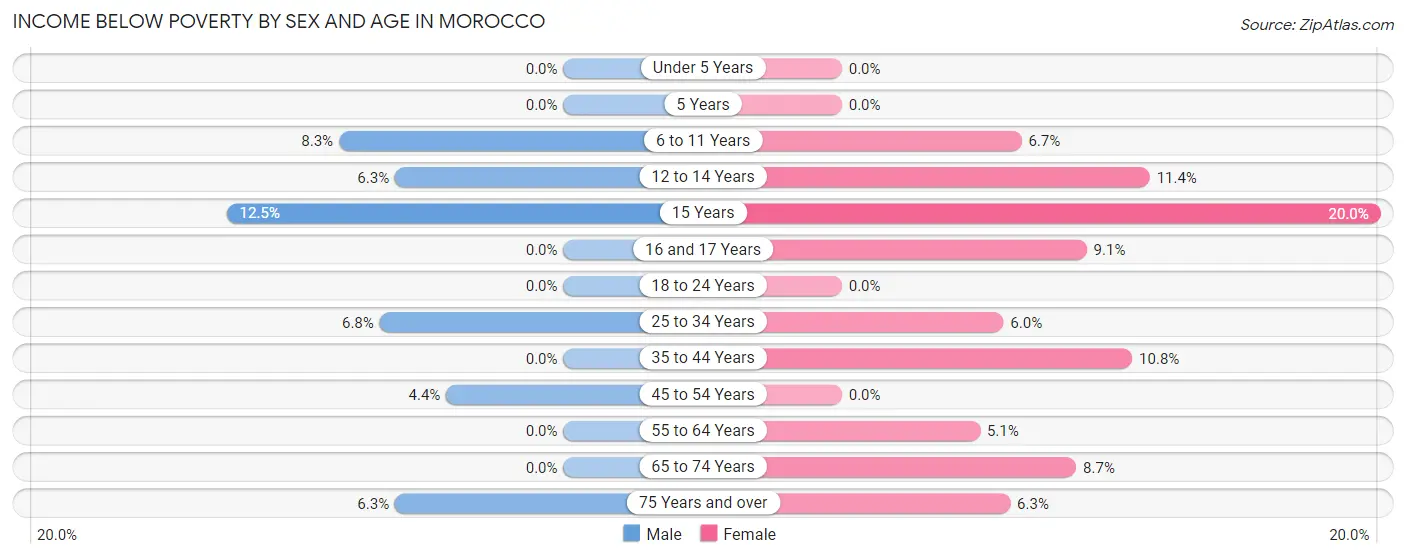
| Age Bracket | Male | Female |
| Under 5 Years | 0 (0.0%) | 0 (0.0%) |
| 5 Years | 0 (0.0%) | 0 (0.0%) |
| 6 to 11 Years | 4 (8.3%) | 2 (6.7%) |
| 12 to 14 Years | 2 (6.2%) | 4 (11.4%) |
| 15 Years | 3 (12.5%) | 5 (20.0%) |
| 16 and 17 Years | 0 (0.0%) | 4 (9.1%) |
| 18 to 24 Years | 0 (0.0%) | 0 (0.0%) |
| 25 to 34 Years | 3 (6.8%) | 3 (6.0%) |
| 35 to 44 Years | 0 (0.0%) | 11 (10.8%) |
| 45 to 54 Years | 3 (4.3%) | 0 (0.0%) |
| 55 to 64 Years | 0 (0.0%) | 4 (5.1%) |
| 65 to 74 Years | 0 (0.0%) | 4 (8.7%) |
| 75 Years and over | 3 (6.2%) | 3 (6.2%) |
| Total | 18 (3.3%) | 40 (7.3%) |
Income Above Poverty by Sex and Age in Morocco
According to the poverty statistics in Morocco, males aged under 5 years and females aged under 5 years are the age groups that are most secure financially, with 100.0% of males and 100.0% of females in these age groups living above the poverty line.
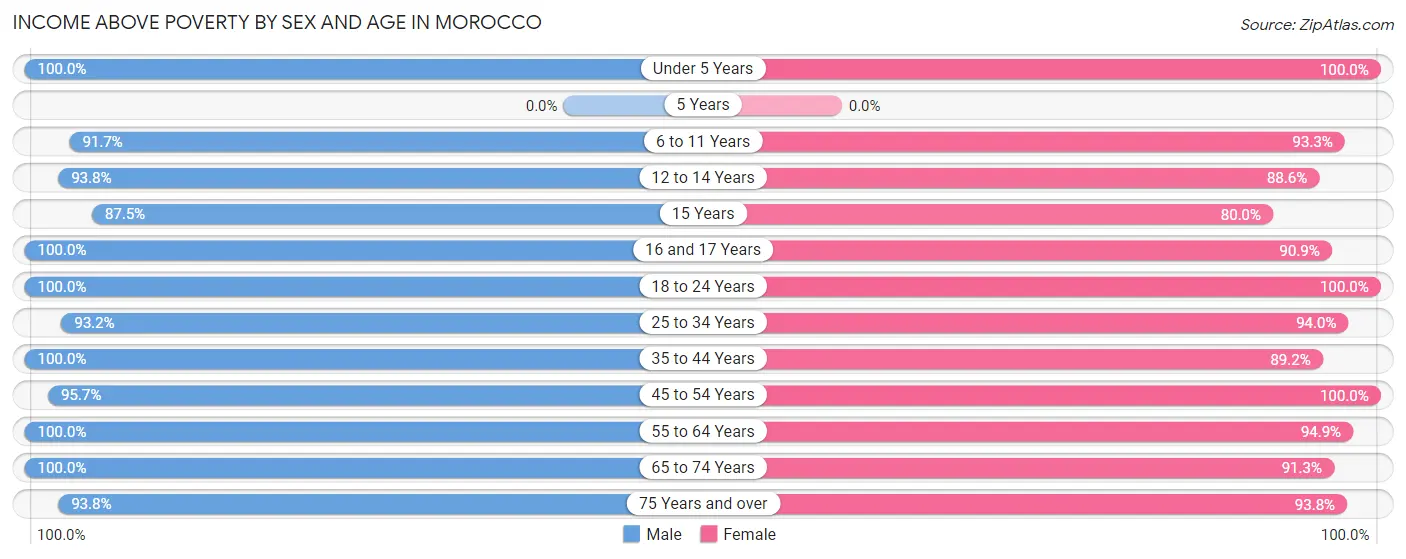
| Age Bracket | Male | Female |
| Under 5 Years | 15 (100.0%) | 14 (100.0%) |
| 5 Years | 0 (0.0%) | 0 (0.0%) |
| 6 to 11 Years | 44 (91.7%) | 28 (93.3%) |
| 12 to 14 Years | 30 (93.8%) | 31 (88.6%) |
| 15 Years | 21 (87.5%) | 20 (80.0%) |
| 16 and 17 Years | 13 (100.0%) | 40 (90.9%) |
| 18 to 24 Years | 67 (100.0%) | 43 (100.0%) |
| 25 to 34 Years | 41 (93.2%) | 47 (94.0%) |
| 35 to 44 Years | 68 (100.0%) | 91 (89.2%) |
| 45 to 54 Years | 66 (95.7%) | 32 (100.0%) |
| 55 to 64 Years | 72 (100.0%) | 74 (94.9%) |
| 65 to 74 Years | 45 (100.0%) | 42 (91.3%) |
| 75 Years and over | 45 (93.8%) | 45 (93.8%) |
| Total | 527 (96.7%) | 507 (92.7%) |
Income Below Poverty Among Married-Couple Families in Morocco
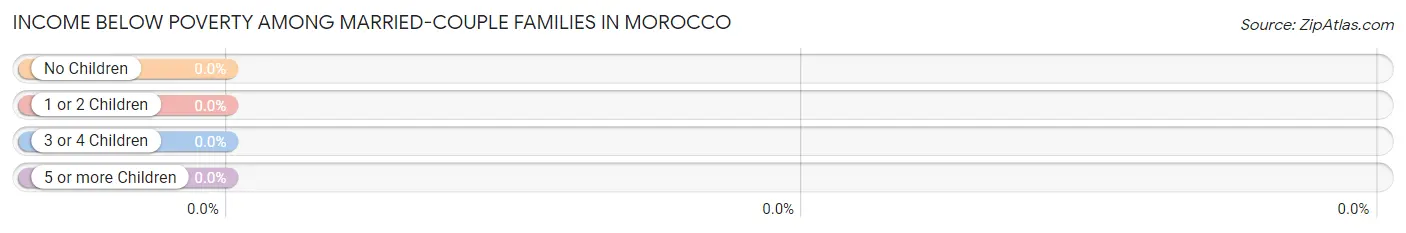
| Children | Above Poverty | Below Poverty |
| No Children | 128 (100.0%) | 0 (0.0%) |
| 1 or 2 Children | 44 (100.0%) | 0 (0.0%) |
| 3 or 4 Children | 19 (100.0%) | 0 (0.0%) |
| 5 or more Children | 0 (0.0%) | 0 (0.0%) |
| Total | 191 (100.0%) | 0 (0.0%) |
Income Below Poverty Among Single-Parent Households in Morocco
According to the poverty data in Morocco, 7.3% or 3 single-father households and 16.7% or 9 single-mother households are living below the poverty line. Among single-father households, those with 1 or 2 children have the highest poverty rate, with 3 households (9.4%) experiencing poverty. Likewise, among single-mother households, those with 1 or 2 children have the highest poverty rate, with 6 households (25.0%) falling below the poverty line.
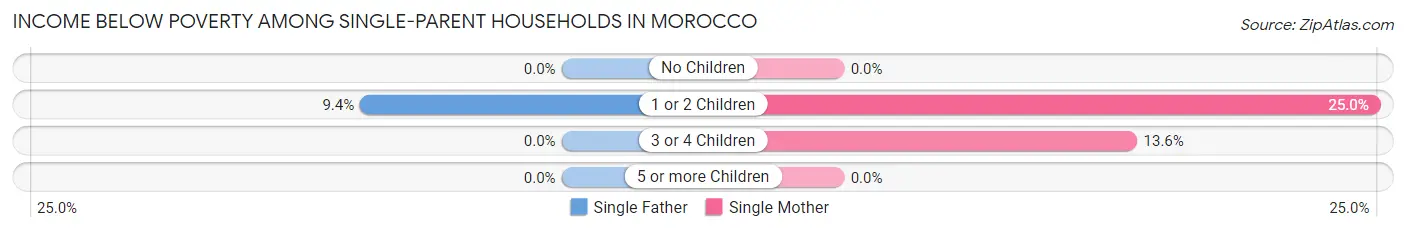
| Children | Single Father | Single Mother |
| No Children | 0 (0.0%) | 0 (0.0%) |
| 1 or 2 Children | 3 (9.4%) | 6 (25.0%) |
| 3 or 4 Children | 0 (0.0%) | 3 (13.6%) |
| 5 or more Children | 0 (0.0%) | 0 (0.0%) |
| Total | 3 (7.3%) | 9 (16.7%) |
Income Below Poverty Among Married-Couple vs Single-Parent Households in Morocco
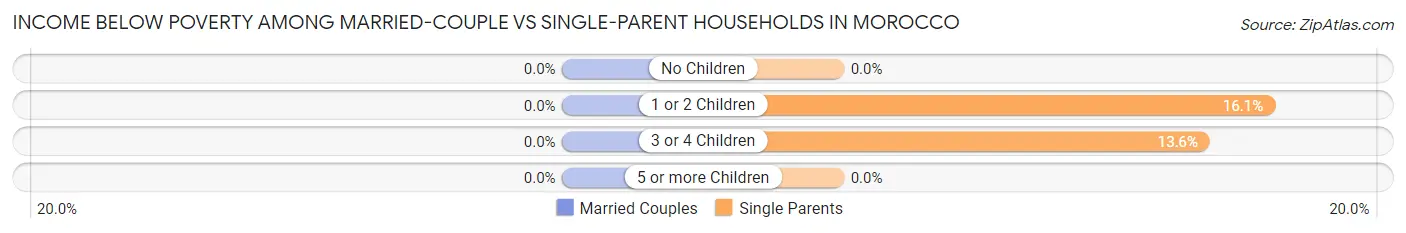
| Children | Married-Couple Families | Single-Parent Households |
| No Children | 0 (0.0%) | 0 (0.0%) |
| 1 or 2 Children | 0 (0.0%) | 9 (16.1%) |
| 3 or 4 Children | 0 (0.0%) | 3 (13.6%) |
| 5 or more Children | 0 (0.0%) | 0 (0.0%) |
| Total | 0 (0.0%) | 12 (12.6%) |
Race in Morocco
The most populous races in Morocco are White / Caucasian (978 | 88.3%), Two or more Races (111 | 10.0%), and Hispanic or Latino (88 | 8.0%).
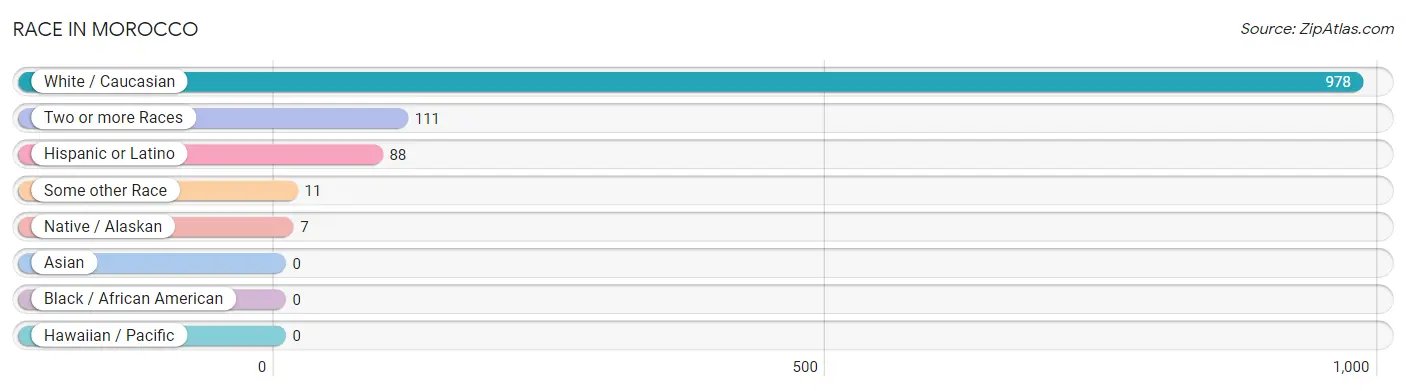
| Race | # Population | % Population |
| Asian | 0 | 0.0% |
| Black / African American | 0 | 0.0% |
| Hawaiian / Pacific | 0 | 0.0% |
| Hispanic or Latino | 88 | 8.0% |
| Native / Alaskan | 7 | 0.6% |
| White / Caucasian | 978 | 88.3% |
| Two or more Races | 111 | 10.0% |
| Some other Race | 11 | 1.0% |
| Total | 1,107 | 100.0% |
Ancestry in Morocco
The most populous ancestries reported in Morocco are German (202 | 18.2%), Irish (175 | 15.8%), Mexican (88 | 8.0%), American (81 | 7.3%), and English (81 | 7.3%), together accounting for 56.7% of all Morocco residents.
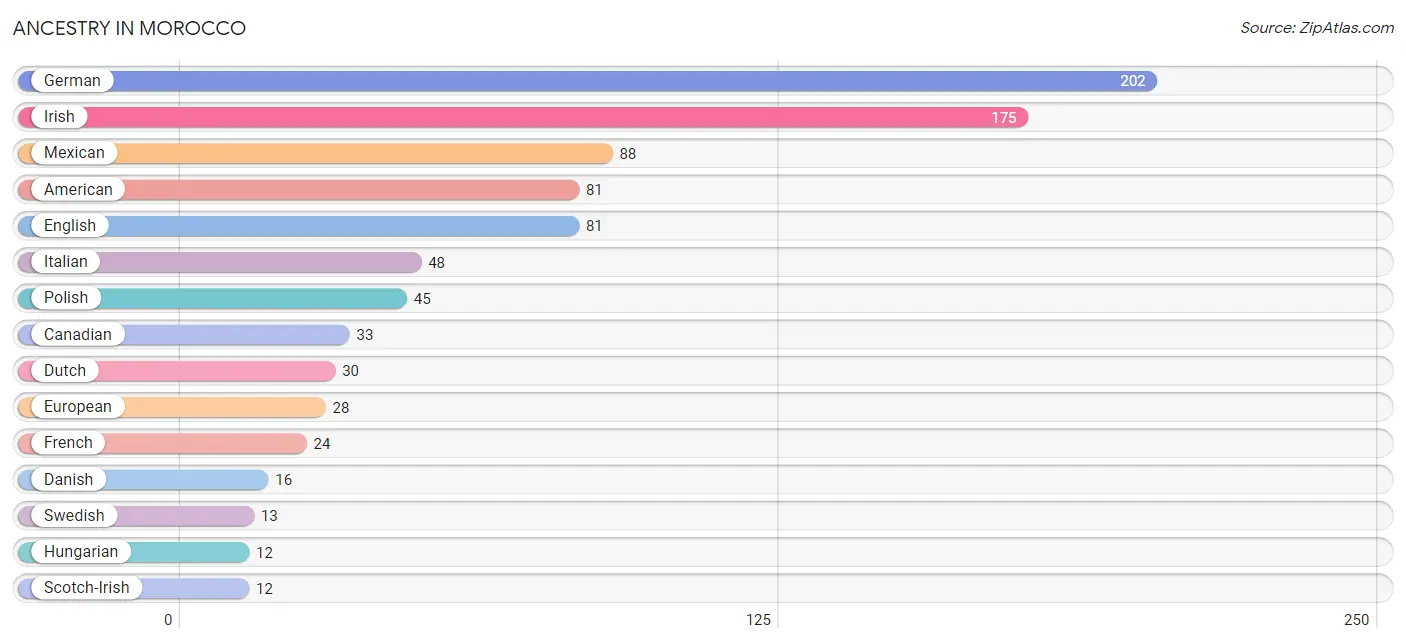
| Ancestry | # Population | % Population |
| American | 81 | 7.3% |
| Austrian | 7 | 0.6% |
| British | 3 | 0.3% |
| Canadian | 33 | 3.0% |
| Chippewa | 5 | 0.4% |
| Croatian | 2 | 0.2% |
| Danish | 16 | 1.5% |
| Dutch | 30 | 2.7% |
| English | 81 | 7.3% |
| European | 28 | 2.5% |
| French | 24 | 2.2% |
| French Canadian | 5 | 0.4% |
| German | 202 | 18.2% |
| Hungarian | 12 | 1.1% |
| Irish | 175 | 15.8% |
| Italian | 48 | 4.3% |
| Lithuanian | 2 | 0.2% |
| Mexican | 88 | 8.0% |
| Polish | 45 | 4.1% |
| Scotch-Irish | 12 | 1.1% |
| Scottish | 4 | 0.4% |
| Swedish | 13 | 1.2% |
| Welsh | 7 | 0.6% | View All 23 Rows |
Immigrants in Morocco
The most numerous immigrant groups reported in Morocco came from Europe (6 | 0.5%), Italy (4 | 0.4%), Southern Europe (4 | 0.4%), Netherlands (2 | 0.2%), and Western Europe (2 | 0.2%), together accounting for 1.6% of all Morocco residents.
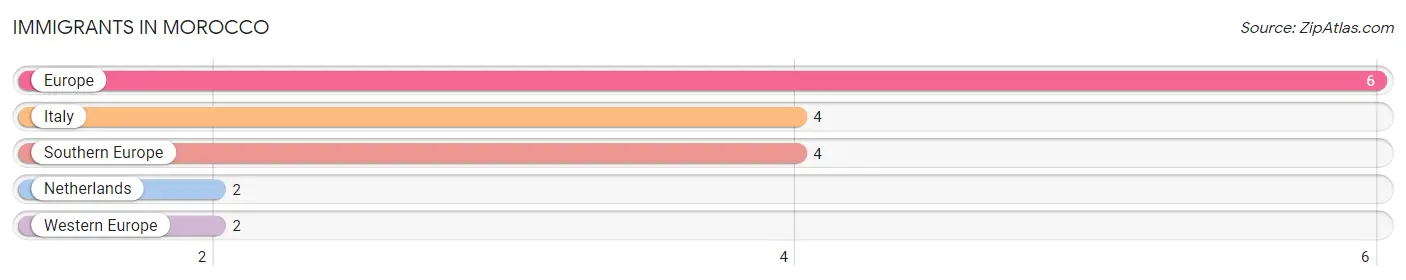
| Immigration Origin | # Population | % Population |
| Europe | 6 | 0.5% |
| Italy | 4 | 0.4% |
| Netherlands | 2 | 0.2% |
| Southern Europe | 4 | 0.4% |
| Western Europe | 2 | 0.2% | View All 5 Rows |
Sex and Age in Morocco
Sex and Age in Morocco
The most populous age groups in Morocco are 20 to 24 Years (56 | 10.3%) for men and 15 to 19 Years (95 | 16.9%) for women.
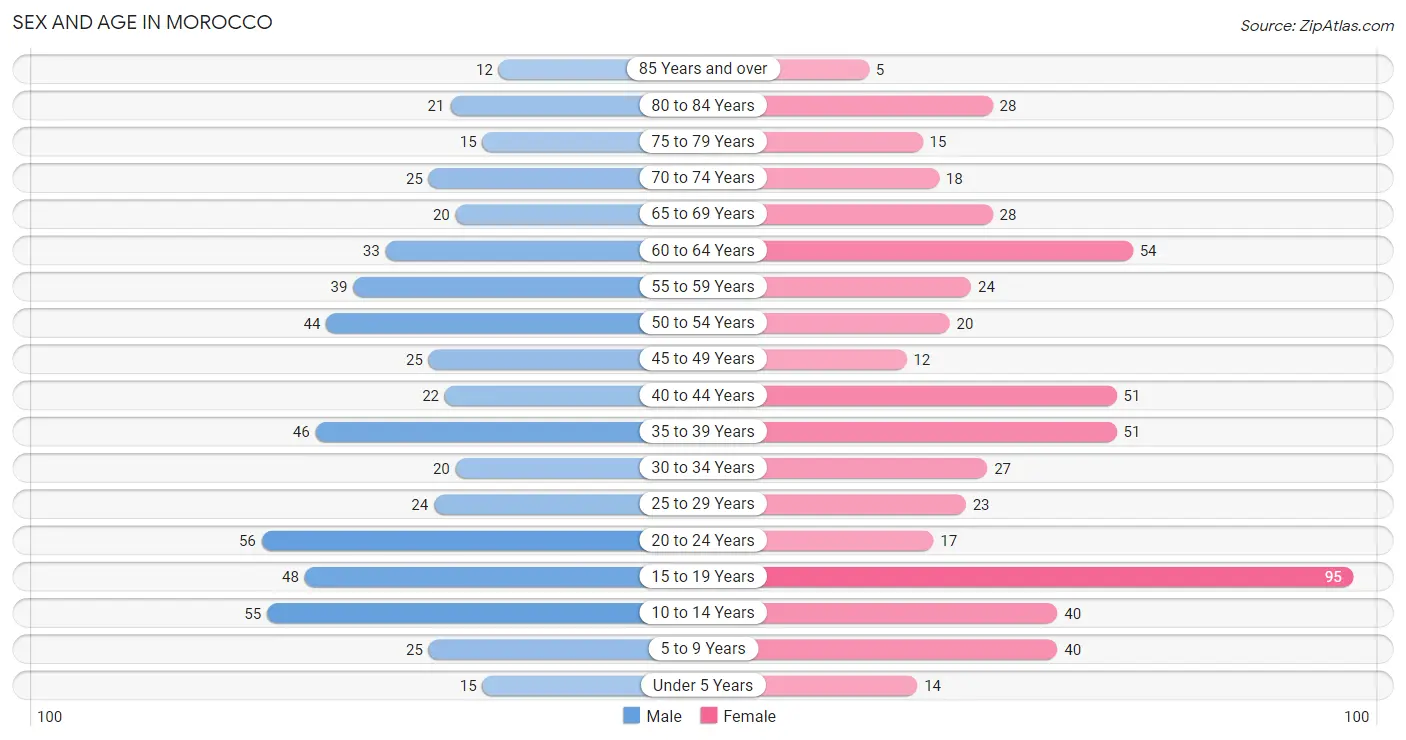
| Age Bracket | Male | Female |
| Under 5 Years | 15 (2.8%) | 14 (2.5%) |
| 5 to 9 Years | 25 (4.6%) | 40 (7.1%) |
| 10 to 14 Years | 55 (10.1%) | 40 (7.1%) |
| 15 to 19 Years | 48 (8.8%) | 95 (16.9%) |
| 20 to 24 Years | 56 (10.3%) | 17 (3.0%) |
| 25 to 29 Years | 24 (4.4%) | 23 (4.1%) |
| 30 to 34 Years | 20 (3.7%) | 27 (4.8%) |
| 35 to 39 Years | 46 (8.4%) | 51 (9.1%) |
| 40 to 44 Years | 22 (4.0%) | 51 (9.1%) |
| 45 to 49 Years | 25 (4.6%) | 12 (2.1%) |
| 50 to 54 Years | 44 (8.1%) | 20 (3.6%) |
| 55 to 59 Years | 39 (7.2%) | 24 (4.3%) |
| 60 to 64 Years | 33 (6.1%) | 54 (9.6%) |
| 65 to 69 Years | 20 (3.7%) | 28 (5.0%) |
| 70 to 74 Years | 25 (4.6%) | 18 (3.2%) |
| 75 to 79 Years | 15 (2.8%) | 15 (2.7%) |
| 80 to 84 Years | 21 (3.8%) | 28 (5.0%) |
| 85 Years and over | 12 (2.2%) | 5 (0.9%) |
| Total | 545 (100.0%) | 562 (100.0%) |
Families and Households in Morocco
Median Family Size in Morocco
The median family size in Morocco is 3.02 persons per family, with single male/father families (41 | 14.3%) accounting for the largest median family size of 3.27 persons per family. On the other hand, married-couple families (191 | 66.8%) represent the smallest median family size with 2.94 persons per family.
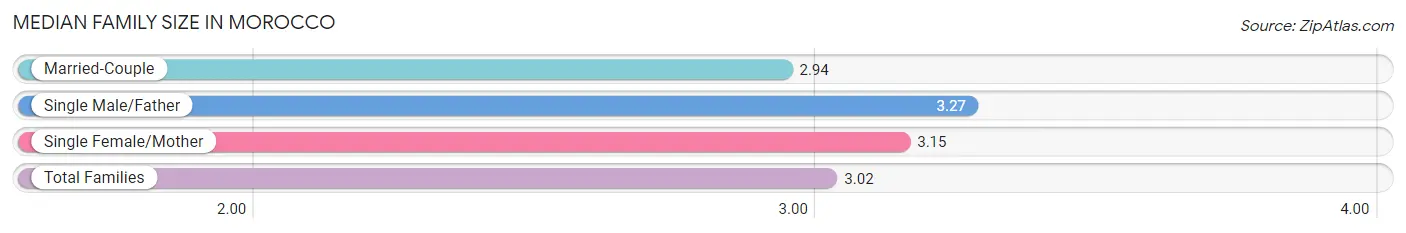
| Family Type | # Families | Family Size |
| Married-Couple | 191 (66.8%) | 2.94 |
| Single Male/Father | 41 (14.3%) | 3.27 |
| Single Female/Mother | 54 (18.9%) | 3.15 |
| Total Families | 286 (100.0%) | 3.02 |
Median Household Size in Morocco
The median household size in Morocco is 2.43 persons per household, with single male/father households (41 | 9.0%) accounting for the largest median household size of 4.44 persons per household. non-family households (169 | 37.1%) represent the smallest median household size with 1.13 persons per household.
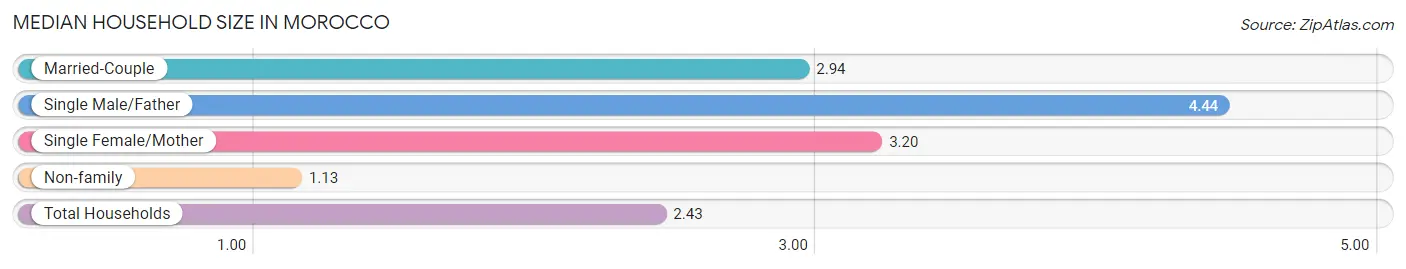
| Household Type | # Households | Household Size |
| Married-Couple | 191 (42.0%) | 2.94 |
| Single Male/Father | 41 (9.0%) | 4.44 |
| Single Female/Mother | 54 (11.9%) | 3.20 |
| Non-family | 169 (37.1%) | 1.13 |
| Total Households | 455 (100.0%) | 2.43 |
Household Size by Marriage Status in Morocco
Out of a total of 455 households in Morocco, 286 (62.9%) are family households, while 169 (37.1%) are nonfamily households. The most numerous type of family households are 2-person households, comprising 129, and the most common type of nonfamily households are 1-person households, comprising 158.
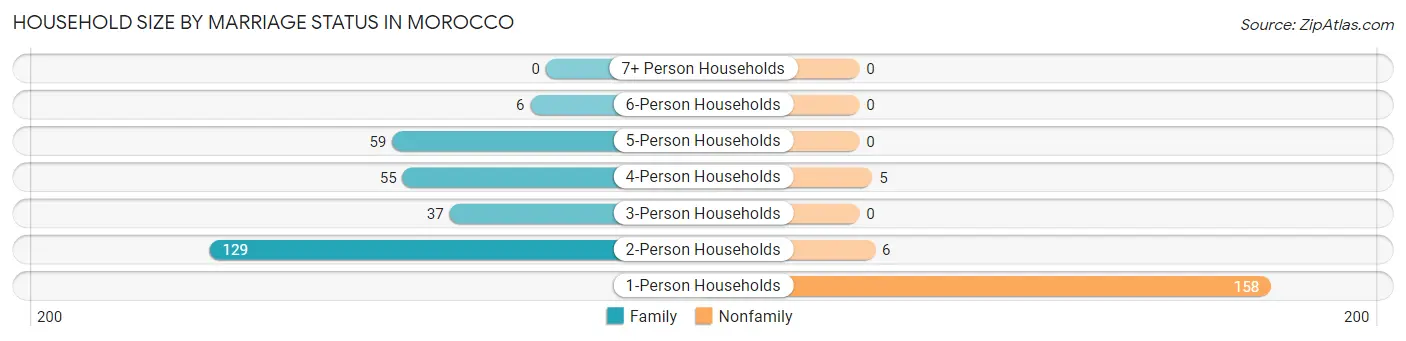
| Household Size | Family Households | Nonfamily Households |
| 1-Person Households | - | 158 (34.7%) |
| 2-Person Households | 129 (28.3%) | 6 (1.3%) |
| 3-Person Households | 37 (8.1%) | 0 (0.0%) |
| 4-Person Households | 55 (12.1%) | 5 (1.1%) |
| 5-Person Households | 59 (13.0%) | 0 (0.0%) |
| 6-Person Households | 6 (1.3%) | 0 (0.0%) |
| 7+ Person Households | 0 (0.0%) | 0 (0.0%) |
| Total | 286 (62.9%) | 169 (37.1%) |
Female Fertility in Morocco
Fertility by Age in Morocco
Average fertility rate in Morocco is 56.0 births per 1,000 women. Women in the age bracket of 20 to 34 years have the highest fertility rate with 239.0 births per 1,000 women. Women in the age bracket of 20 to 34 years acount for 100.0% of all women with births.
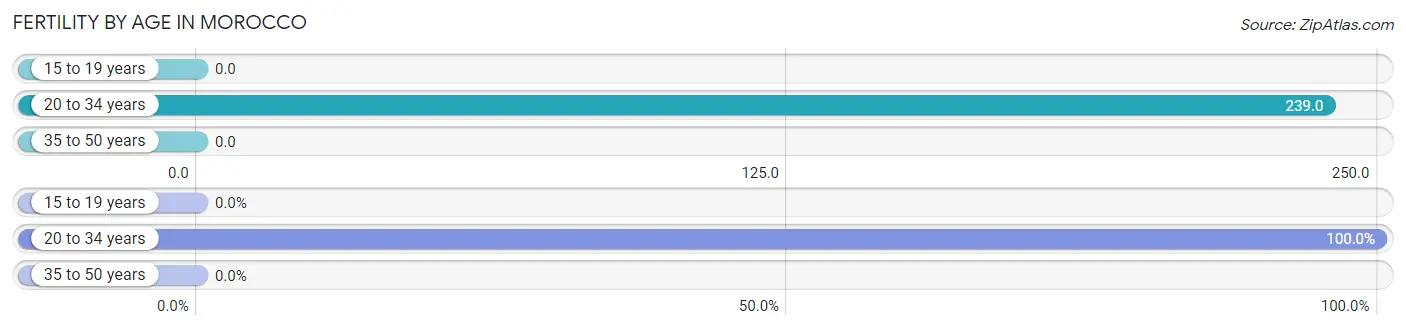
| Age Bracket | Women with Births | Births / 1,000 Women |
| 15 to 19 years | 0 (0.0%) | 0.0 |
| 20 to 34 years | 16 (100.0%) | 239.0 |
| 35 to 50 years | 0 (0.0%) | 0.0 |
| Total | 16 (100.0%) | 56.0 |
Fertility by Age by Marriage Status in Morocco
68.8% of women with births (16) in Morocco are married. The highest percentage of unmarried women with births falls into 20 to 34 years age bracket with 31.2% of them unmarried at the time of birth, while the lowest percentage of unmarried women with births belong to 20 to 34 years age bracket with 31.2% of them unmarried.
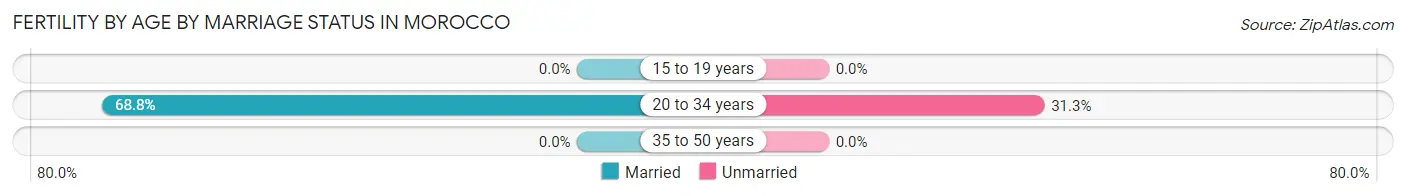
| Age Bracket | Married | Unmarried |
| 15 to 19 years | 0 (0.0%) | 0 (0.0%) |
| 20 to 34 years | 11 (68.8%) | 5 (31.2%) |
| 35 to 50 years | 0 (0.0%) | 0 (0.0%) |
| Total | 11 (68.8%) | 5 (31.2%) |
Fertility by Education in Morocco
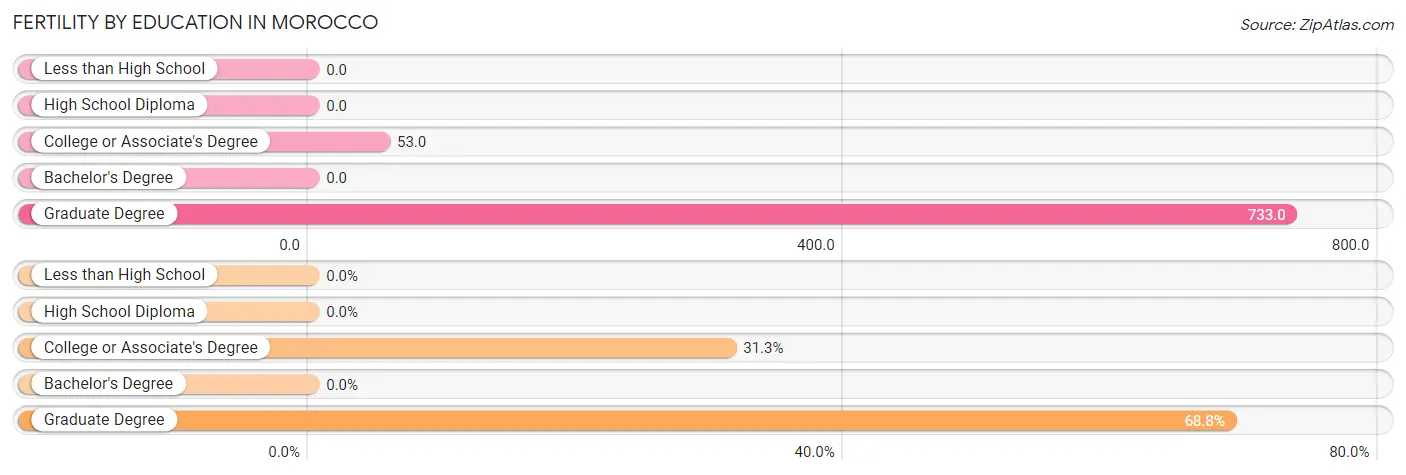
| Educational Attainment | Women with Births | Births / 1,000 Women |
| Less than High School | 0 (0.0%) | 0.0 |
| High School Diploma | 0 (0.0%) | 0.0 |
| College or Associate's Degree | 5 (31.2%) | 53.0 |
| Bachelor's Degree | 0 (0.0%) | 0.0 |
| Graduate Degree | 11 (68.8%) | 733.0 |
| Total | 16 (100.0%) | 56.0 |
Fertility by Education by Marriage Status in Morocco
31.2% of women with births in Morocco are unmarried. Women with the educational attainment of graduate degree are most likely to be married with 100.0% of them married at childbirth, while women with the educational attainment of college or associate's degree are least likely to be married with 100.0% of them unmarried at childbirth.
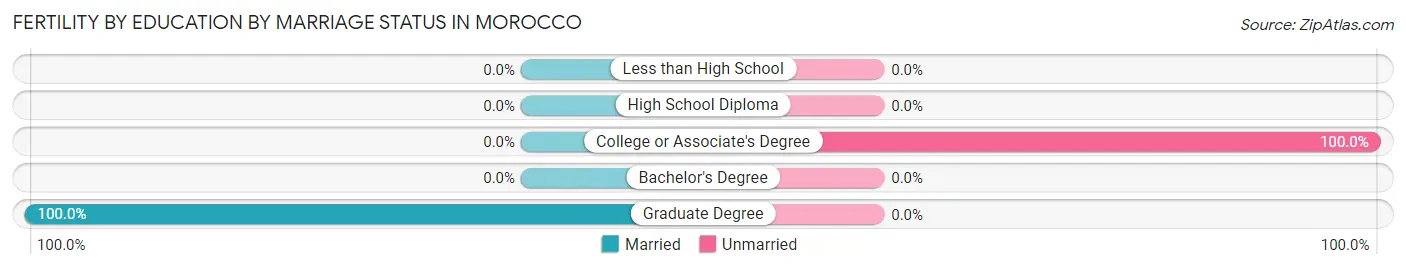
| Educational Attainment | Married | Unmarried |
| Less than High School | 0 (0.0%) | 0 (0.0%) |
| High School Diploma | 0 (0.0%) | 0 (0.0%) |
| College or Associate's Degree | 0 (0.0%) | 5 (100.0%) |
| Bachelor's Degree | 0 (0.0%) | 0 (0.0%) |
| Graduate Degree | 11 (100.0%) | 0 (0.0%) |
| Total | 11 (68.8%) | 5 (31.2%) |
Employment Characteristics in Morocco
Employment by Class of Employer in Morocco
Among the 466 employed individuals in Morocco, private company employees (370 | 79.4%), not-for-profit organizations (37 | 7.9%), and self-employed (not incorporated) (21 | 4.5%) make up the most common classes of employment.
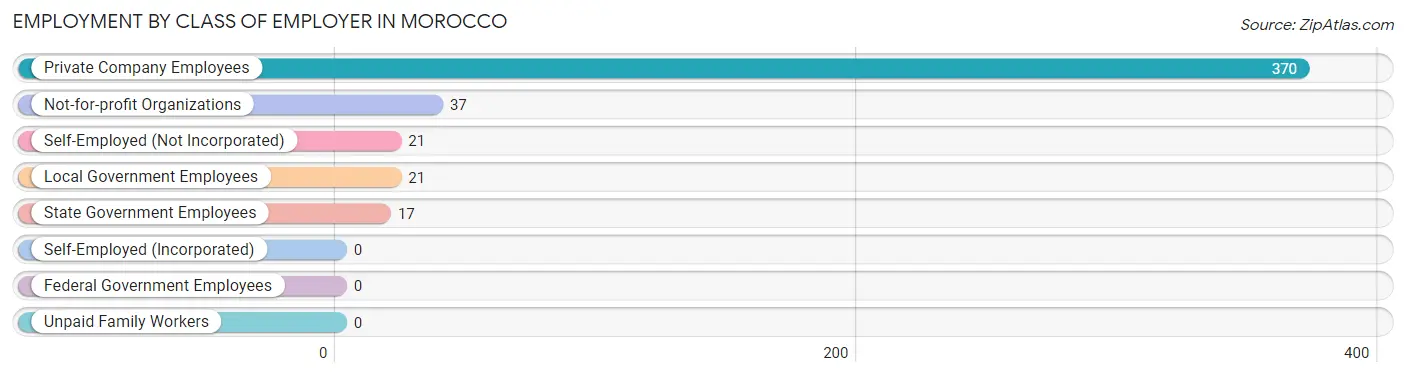
| Employer Class | # Employees | % Employees |
| Private Company Employees | 370 | 79.4% |
| Self-Employed (Incorporated) | 0 | 0.0% |
| Self-Employed (Not Incorporated) | 21 | 4.5% |
| Not-for-profit Organizations | 37 | 7.9% |
| Local Government Employees | 21 | 4.5% |
| State Government Employees | 17 | 3.6% |
| Federal Government Employees | 0 | 0.0% |
| Unpaid Family Workers | 0 | 0.0% |
| Total | 466 | 100.0% |
Employment Status by Age in Morocco
According to the labor force statistics for Morocco, out of the total population over 16 years of age (869), 60.4% or 525 individuals are in the labor force, with 8.2% or 43 of them unemployed. The age group with the highest labor force participation rate is 35 to 44 years, with 92.4% or 157 individuals in the labor force. Within the labor force, the 16 to 19 years age range has the highest percentage of unemployed individuals, with 57.1% or 20 of them being unemployed.
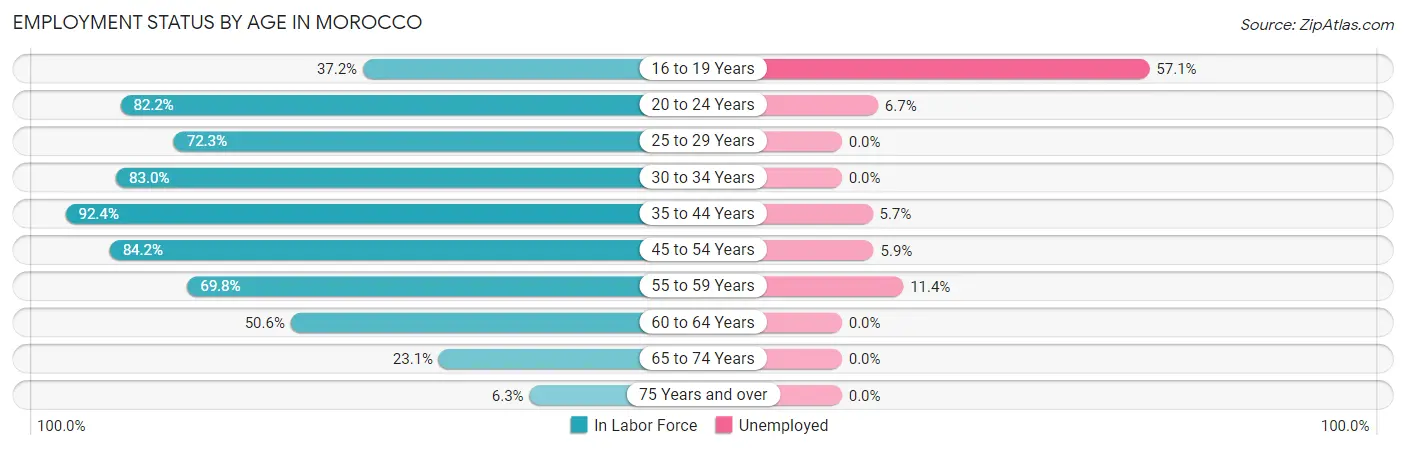
| Age Bracket | In Labor Force | Unemployed |
| 16 to 19 Years | 35 (37.2%) | 20 (57.1%) |
| 20 to 24 Years | 60 (82.2%) | 4 (6.7%) |
| 25 to 29 Years | 34 (72.3%) | 0 (0.0%) |
| 30 to 34 Years | 39 (83.0%) | 0 (0.0%) |
| 35 to 44 Years | 157 (92.4%) | 9 (5.7%) |
| 45 to 54 Years | 85 (84.2%) | 5 (5.9%) |
| 55 to 59 Years | 44 (69.8%) | 5 (11.4%) |
| 60 to 64 Years | 44 (50.6%) | 0 (0.0%) |
| 65 to 74 Years | 21 (23.1%) | 0 (0.0%) |
| 75 Years and over | 6 (6.3%) | 0 (0.0%) |
| Total | 525 (60.4%) | 43 (8.2%) |
Employment Status by Educational Attainment in Morocco
According to labor force statistics for Morocco, 78.3% of individuals (403) out of the total population between 25 and 64 years of age (515) are in the labor force, with 4.7% or 19 of them being unemployed. The group with the highest labor force participation rate are those with the educational attainment of bachelor's degree or higher, with 100.0% or 45 individuals in the labor force. Within the labor force, individuals with less than high school education have the highest percentage of unemployment, with 52.9% or 9 of them being unemployed.
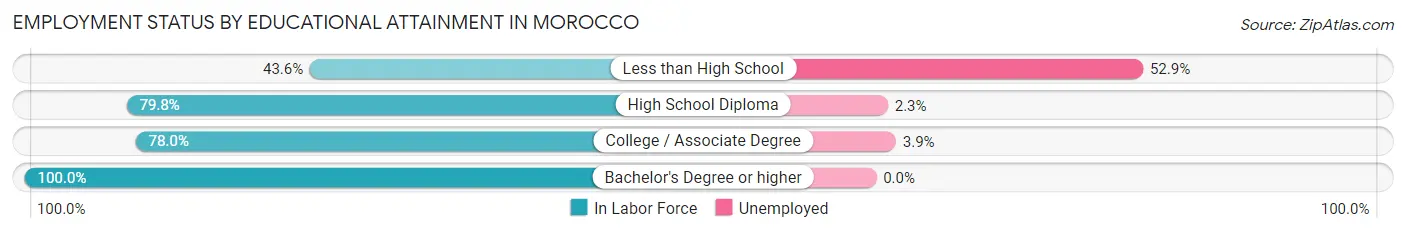
| Educational Attainment | In Labor Force | Unemployed |
| Less than High School | 17 (43.6%) | 21 (52.9%) |
| High School Diploma | 213 (79.8%) | 6 (2.3%) |
| College / Associate Degree | 128 (78.0%) | 6 (3.9%) |
| Bachelor's Degree or higher | 45 (100.0%) | 0 (0.0%) |
| Total | 403 (78.3%) | 24 (4.7%) |
Employment Occupations by Sex in Morocco
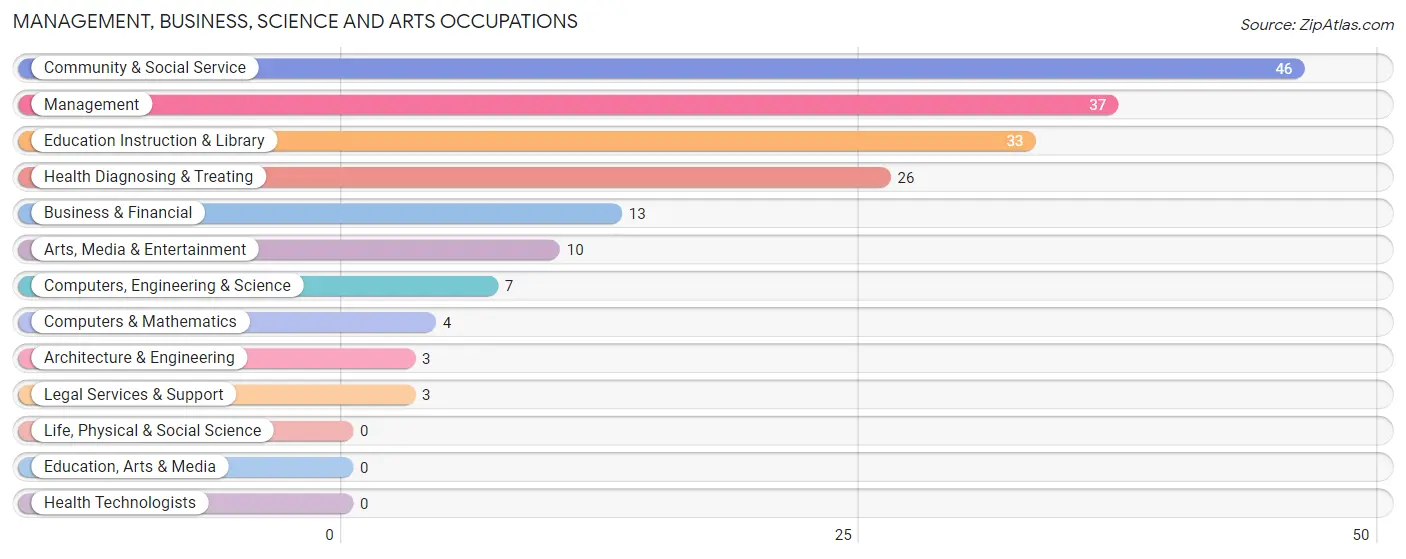
Management, Business, Science and Arts Occupations
The most common Management, Business, Science and Arts occupations in Morocco are Community & Social Service (46 | 9.5%), Management (37 | 7.7%), Education Instruction & Library (33 | 6.9%), Health Diagnosing & Treating (26 | 5.4%), and Business & Financial (13 | 2.7%).
Management, Business, Science and Arts Occupations by Sex
Within the Management, Business, Science and Arts occupations in Morocco, the most male-oriented occupations are Architecture & Engineering (100.0%), Legal Services & Support (100.0%), and Management (62.2%), while the most female-oriented occupations are Computers & Mathematics (100.0%), Education Instruction & Library (93.9%), and Business & Financial (76.9%).
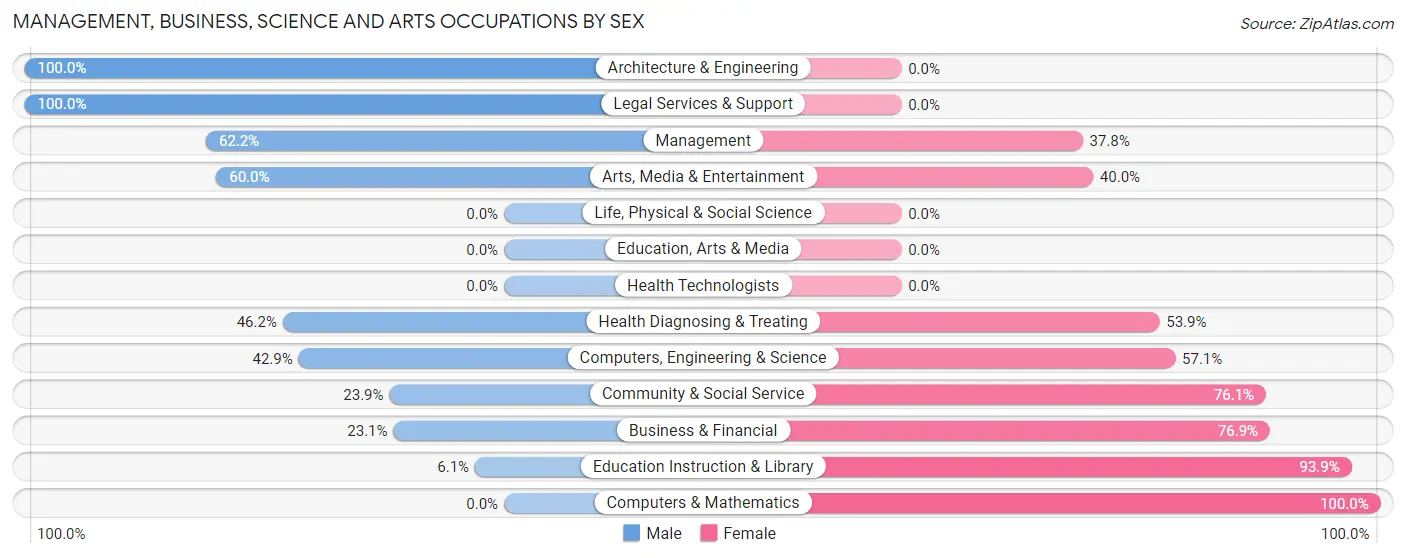
| Occupation | Male | Female |
| Management | 23 (62.2%) | 14 (37.8%) |
| Business & Financial | 3 (23.1%) | 10 (76.9%) |
| Computers, Engineering & Science | 3 (42.9%) | 4 (57.1%) |
| Computers & Mathematics | 0 (0.0%) | 4 (100.0%) |
| Architecture & Engineering | 3 (100.0%) | 0 (0.0%) |
| Life, Physical & Social Science | 0 (0.0%) | 0 (0.0%) |
| Community & Social Service | 11 (23.9%) | 35 (76.1%) |
| Education, Arts & Media | 0 (0.0%) | 0 (0.0%) |
| Legal Services & Support | 3 (100.0%) | 0 (0.0%) |
| Education Instruction & Library | 2 (6.1%) | 31 (93.9%) |
| Arts, Media & Entertainment | 6 (60.0%) | 4 (40.0%) |
| Health Diagnosing & Treating | 12 (46.2%) | 14 (53.8%) |
| Health Technologists | 0 (0.0%) | 0 (0.0%) |
| Total (Category) | 52 (40.3%) | 77 (59.7%) |
| Total (Overall) | 269 (55.8%) | 213 (44.2%) |
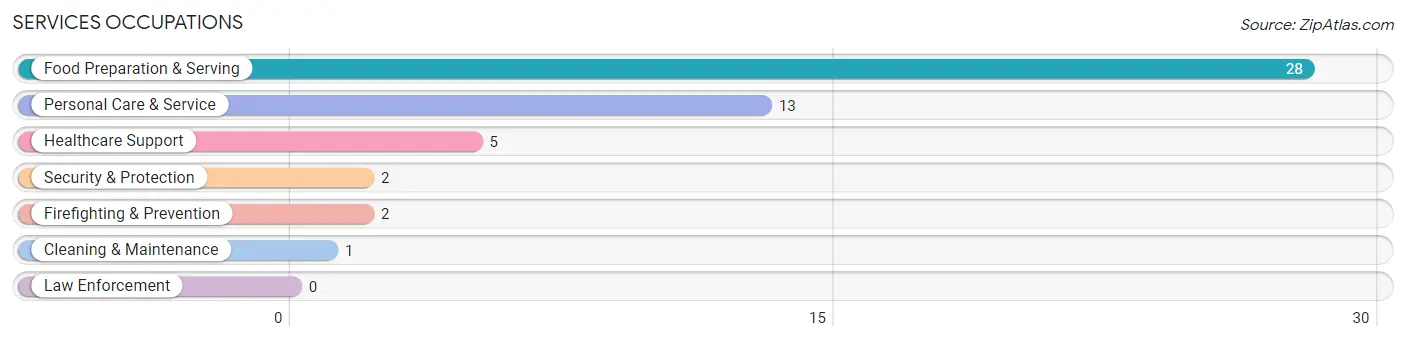
Services Occupations
The most common Services occupations in Morocco are Food Preparation & Serving (28 | 5.8%), Personal Care & Service (13 | 2.7%), Healthcare Support (5 | 1.0%), Security & Protection (2 | 0.4%), and Firefighting & Prevention (2 | 0.4%).
Services Occupations by Sex
Within the Services occupations in Morocco, the most male-oriented occupations are Personal Care & Service (84.6%), and Food Preparation & Serving (50.0%), while the most female-oriented occupations are Healthcare Support (100.0%), Security & Protection (100.0%), and Firefighting & Prevention (100.0%).
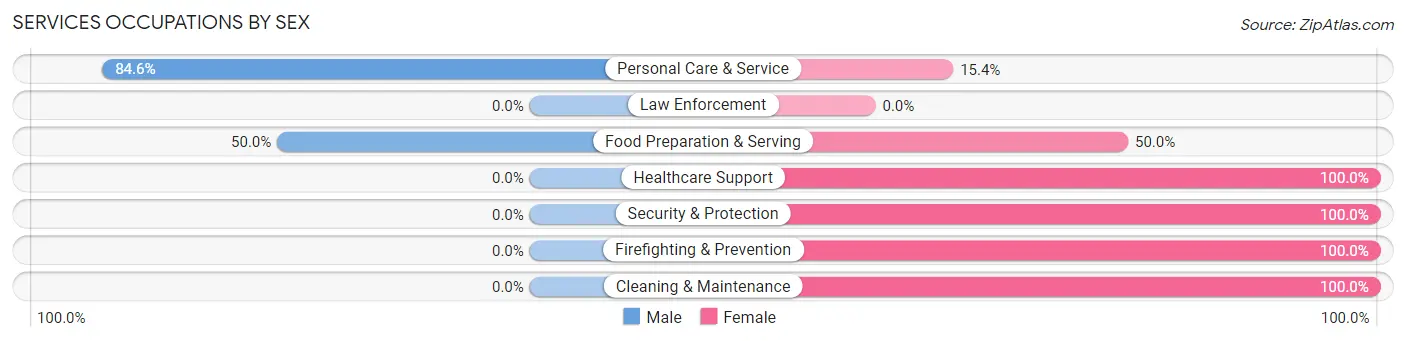
| Occupation | Male | Female |
| Healthcare Support | 0 (0.0%) | 5 (100.0%) |
| Security & Protection | 0 (0.0%) | 2 (100.0%) |
| Firefighting & Prevention | 0 (0.0%) | 2 (100.0%) |
| Law Enforcement | 0 (0.0%) | 0 (0.0%) |
| Food Preparation & Serving | 14 (50.0%) | 14 (50.0%) |
| Cleaning & Maintenance | 0 (0.0%) | 1 (100.0%) |
| Personal Care & Service | 11 (84.6%) | 2 (15.4%) |
| Total (Category) | 25 (51.0%) | 24 (49.0%) |
| Total (Overall) | 269 (55.8%) | 213 (44.2%) |
Sales and Office Occupations
The most common Sales and Office occupations in Morocco are Office & Administration (85 | 17.6%), and Sales & Related (47 | 9.8%).
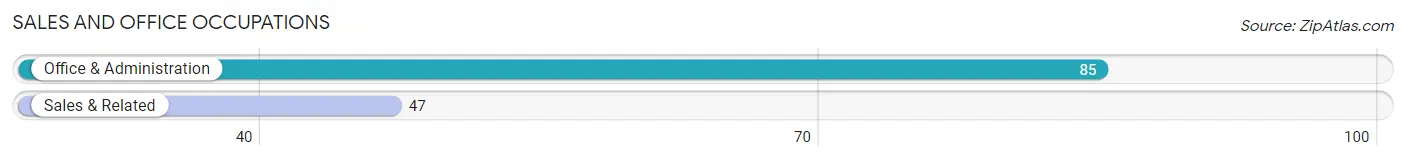
Sales and Office Occupations by Sex
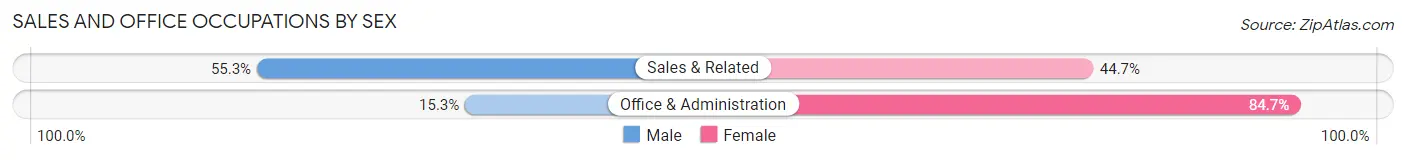
| Occupation | Male | Female |
| Sales & Related | 26 (55.3%) | 21 (44.7%) |
| Office & Administration | 13 (15.3%) | 72 (84.7%) |
| Total (Category) | 39 (29.5%) | 93 (70.5%) |
| Total (Overall) | 269 (55.8%) | 213 (44.2%) |
Natural Resources, Construction and Maintenance Occupations
The most common Natural Resources, Construction and Maintenance occupations in Morocco are Construction & Extraction (45 | 9.3%), Installation, Maintenance & Repair (16 | 3.3%), and Farming, Fishing & Forestry (12 | 2.5%).
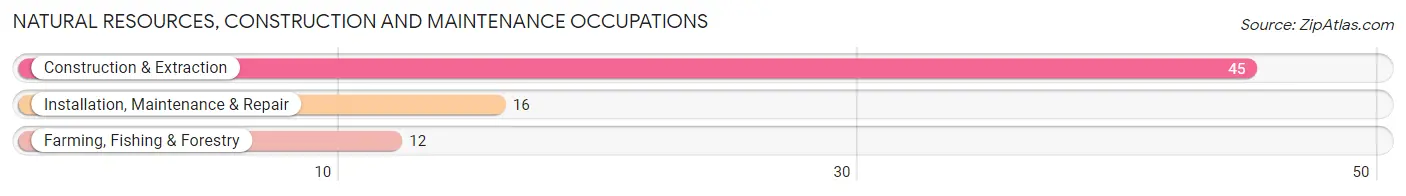
Natural Resources, Construction and Maintenance Occupations by Sex
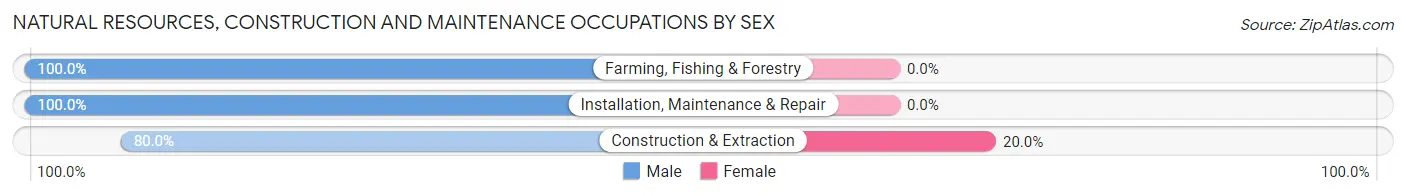
| Occupation | Male | Female |
| Farming, Fishing & Forestry | 12 (100.0%) | 0 (0.0%) |
| Construction & Extraction | 36 (80.0%) | 9 (20.0%) |
| Installation, Maintenance & Repair | 16 (100.0%) | 0 (0.0%) |
| Total (Category) | 64 (87.7%) | 9 (12.3%) |
| Total (Overall) | 269 (55.8%) | 213 (44.2%) |
Production, Transportation and Moving Occupations
The most common Production, Transportation and Moving occupations in Morocco are Production (65 | 13.5%), Transportation (30 | 6.2%), and Material Moving (4 | 0.8%).
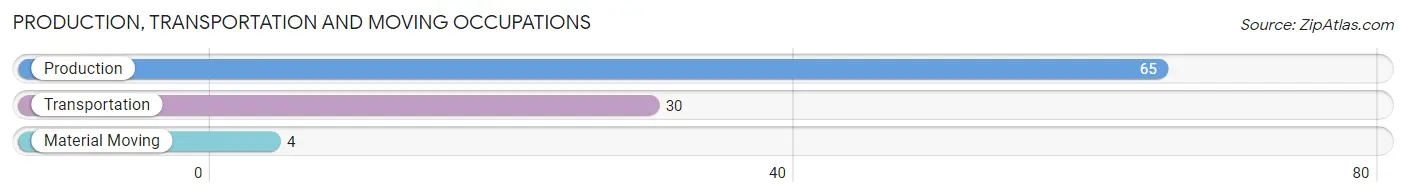
Production, Transportation and Moving Occupations by Sex
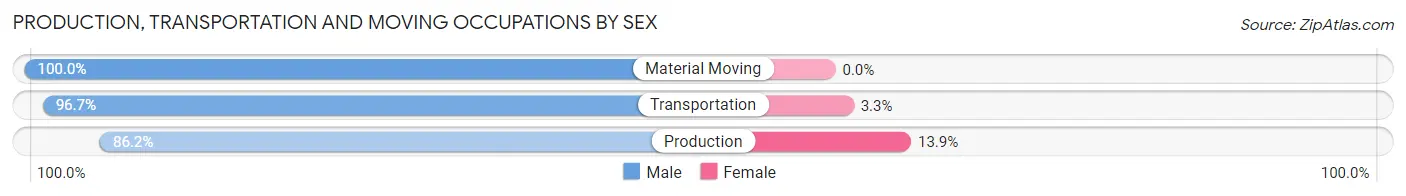
| Occupation | Male | Female |
| Production | 56 (86.2%) | 9 (13.9%) |
| Transportation | 29 (96.7%) | 1 (3.3%) |
| Material Moving | 4 (100.0%) | 0 (0.0%) |
| Total (Category) | 89 (89.9%) | 10 (10.1%) |
| Total (Overall) | 269 (55.8%) | 213 (44.2%) |
Employment Industries by Sex in Morocco
Employment Industries in Morocco
The major employment industries in Morocco include Manufacturing (70 | 14.5%), Construction (61 | 12.7%), Accommodation & Food Services (49 | 10.2%), Retail Trade (41 | 8.5%), and Educational Services (41 | 8.5%).
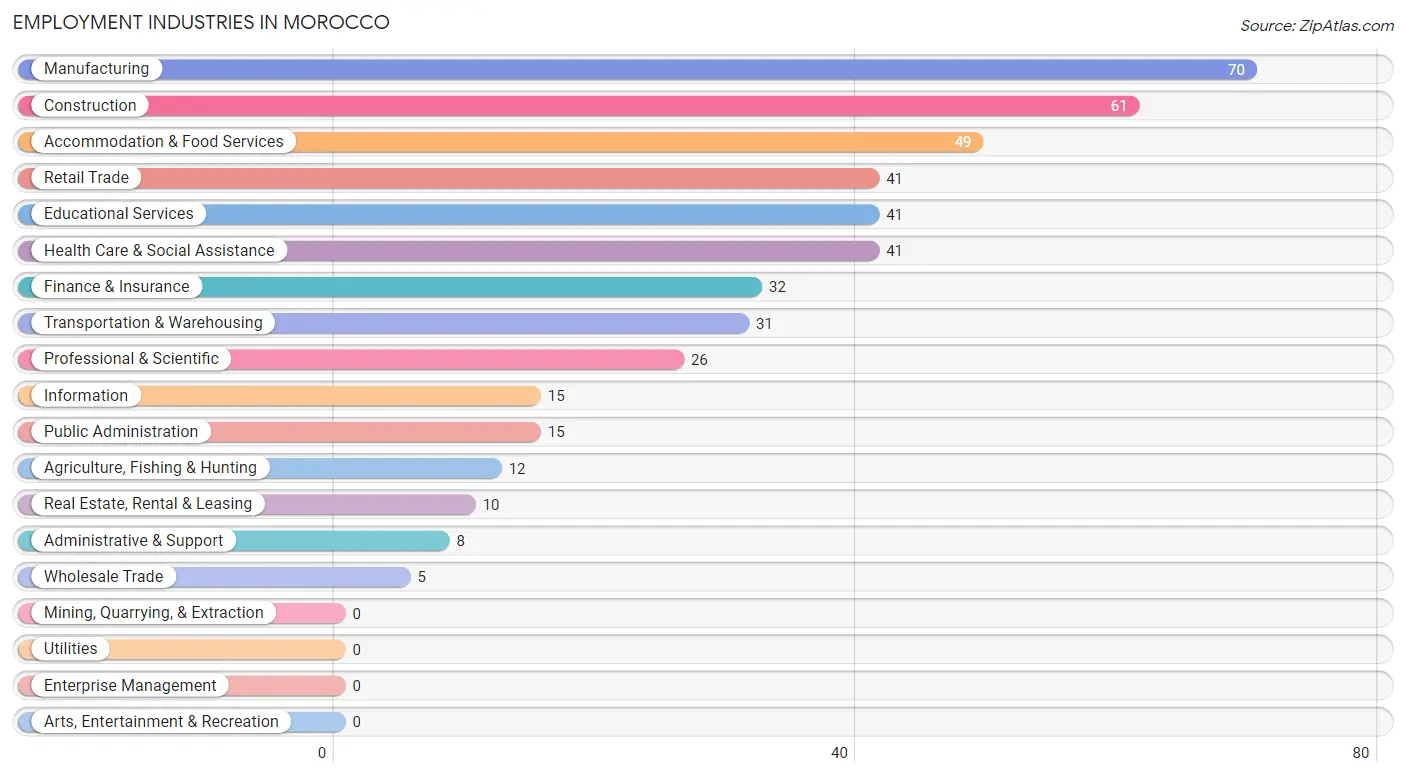
Employment Industries by Sex in Morocco
The Morocco industries that see more men than women are Agriculture, Fishing & Hunting (100.0%), Transportation & Warehousing (100.0%), and Manufacturing (90.0%), whereas the industries that tend to have a higher number of women are Finance & Insurance (87.5%), Retail Trade (80.5%), and Educational Services (75.6%).
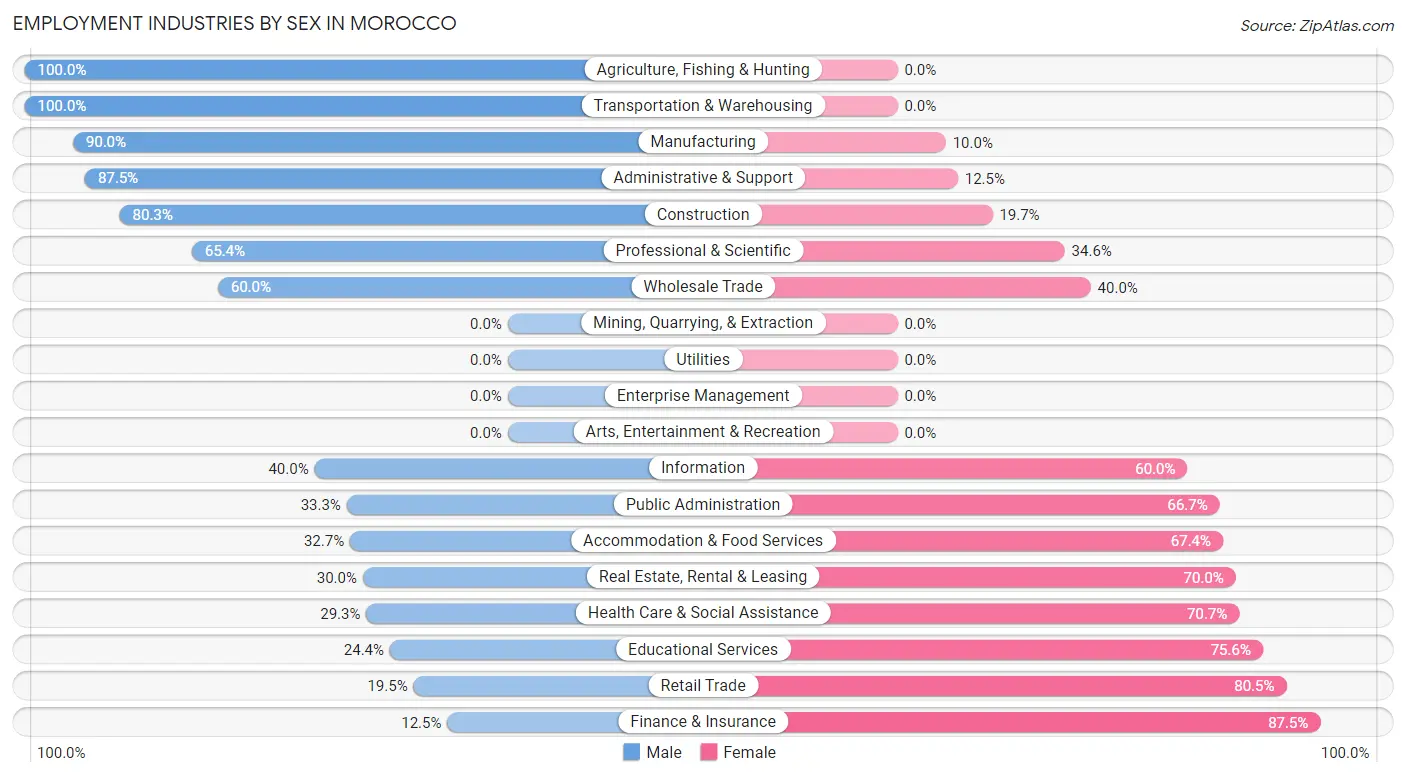
| Industry | Male | Female |
| Agriculture, Fishing & Hunting | 12 (100.0%) | 0 (0.0%) |
| Mining, Quarrying, & Extraction | 0 (0.0%) | 0 (0.0%) |
| Construction | 49 (80.3%) | 12 (19.7%) |
| Manufacturing | 63 (90.0%) | 7 (10.0%) |
| Wholesale Trade | 3 (60.0%) | 2 (40.0%) |
| Retail Trade | 8 (19.5%) | 33 (80.5%) |
| Transportation & Warehousing | 31 (100.0%) | 0 (0.0%) |
| Utilities | 0 (0.0%) | 0 (0.0%) |
| Information | 6 (40.0%) | 9 (60.0%) |
| Finance & Insurance | 4 (12.5%) | 28 (87.5%) |
| Real Estate, Rental & Leasing | 3 (30.0%) | 7 (70.0%) |
| Professional & Scientific | 17 (65.4%) | 9 (34.6%) |
| Enterprise Management | 0 (0.0%) | 0 (0.0%) |
| Administrative & Support | 7 (87.5%) | 1 (12.5%) |
| Educational Services | 10 (24.4%) | 31 (75.6%) |
| Health Care & Social Assistance | 12 (29.3%) | 29 (70.7%) |
| Arts, Entertainment & Recreation | 0 (0.0%) | 0 (0.0%) |
| Accommodation & Food Services | 16 (32.7%) | 33 (67.3%) |
| Public Administration | 5 (33.3%) | 10 (66.7%) |
| Total | 269 (55.8%) | 213 (44.2%) |
Education in Morocco
School Enrollment in Morocco
The most common levels of schooling among the 312 students in Morocco are high school (121 | 38.8%), elementary school (81 | 26.0%), and middle school (75 | 24.0%).
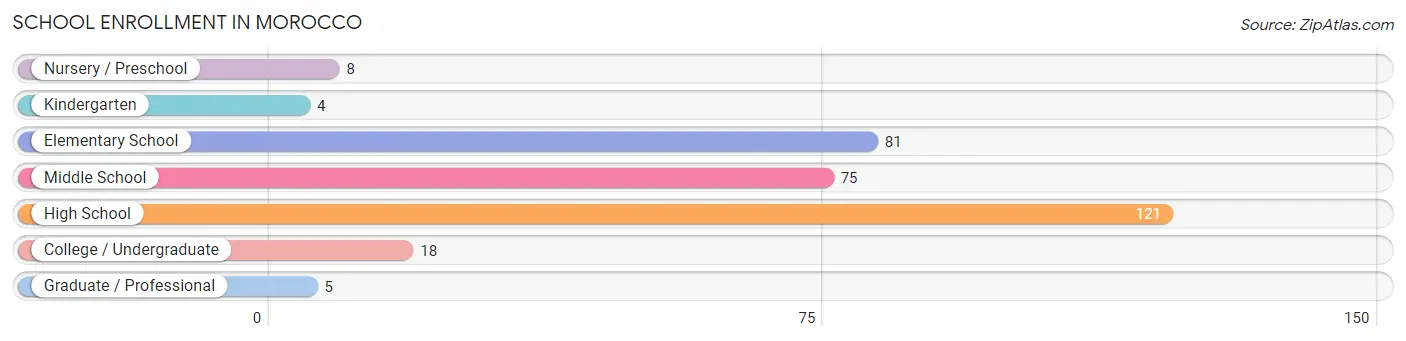
| School Level | # Students | % Students |
| Nursery / Preschool | 8 | 2.6% |
| Kindergarten | 4 | 1.3% |
| Elementary School | 81 | 26.0% |
| Middle School | 75 | 24.0% |
| High School | 121 | 38.8% |
| College / Undergraduate | 18 | 5.8% |
| Graduate / Professional | 5 | 1.6% |
| Total | 312 | 100.0% |
School Enrollment by Age by Funding Source in Morocco
Out of a total of 312 students who are enrolled in schools in Morocco, 25 (8.0%) attend a private institution, while the remaining 287 (92.0%) are enrolled in public schools. The age group of 10 to 14 year olds has the highest likelihood of being enrolled in private schools, with 20 (21.0% in the age bracket) enrolled. Conversely, the age group of 3 to 4 year olds has the lowest likelihood of being enrolled in a private school, with 8 (100.0% in the age bracket) attending a public institution.
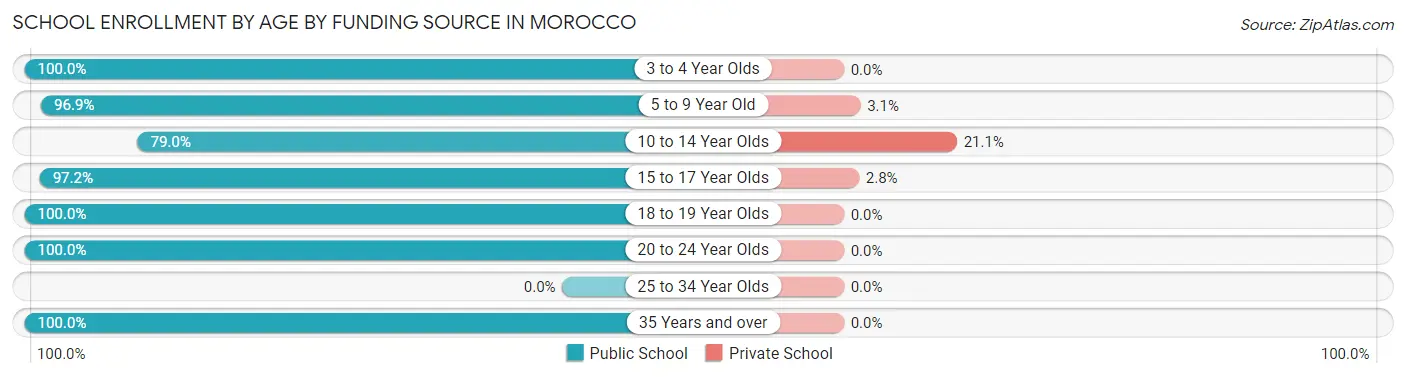
| Age Bracket | Public School | Private School |
| 3 to 4 Year Olds | 8 (100.0%) | 0 (0.0%) |
| 5 to 9 Year Old | 63 (96.9%) | 2 (3.1%) |
| 10 to 14 Year Olds | 75 (78.9%) | 20 (21.0%) |
| 15 to 17 Year Olds | 103 (97.2%) | 3 (2.8%) |
| 18 to 19 Year Olds | 26 (100.0%) | 0 (0.0%) |
| 20 to 24 Year Olds | 10 (100.0%) | 0 (0.0%) |
| 25 to 34 Year Olds | 0 (0.0%) | 0 (0.0%) |
| 35 Years and over | 2 (100.0%) | 0 (0.0%) |
| Total | 287 (92.0%) | 25 (8.0%) |
Educational Attainment by Field of Study in Morocco
Bio, nature & agricultural (21 | 24.7%), education (20 | 23.5%), engineering (10 | 11.8%), social sciences (8 | 9.4%), and psychology (7 | 8.2%) are the most common fields of study among 85 individuals in Morocco who have obtained a bachelor's degree or higher.
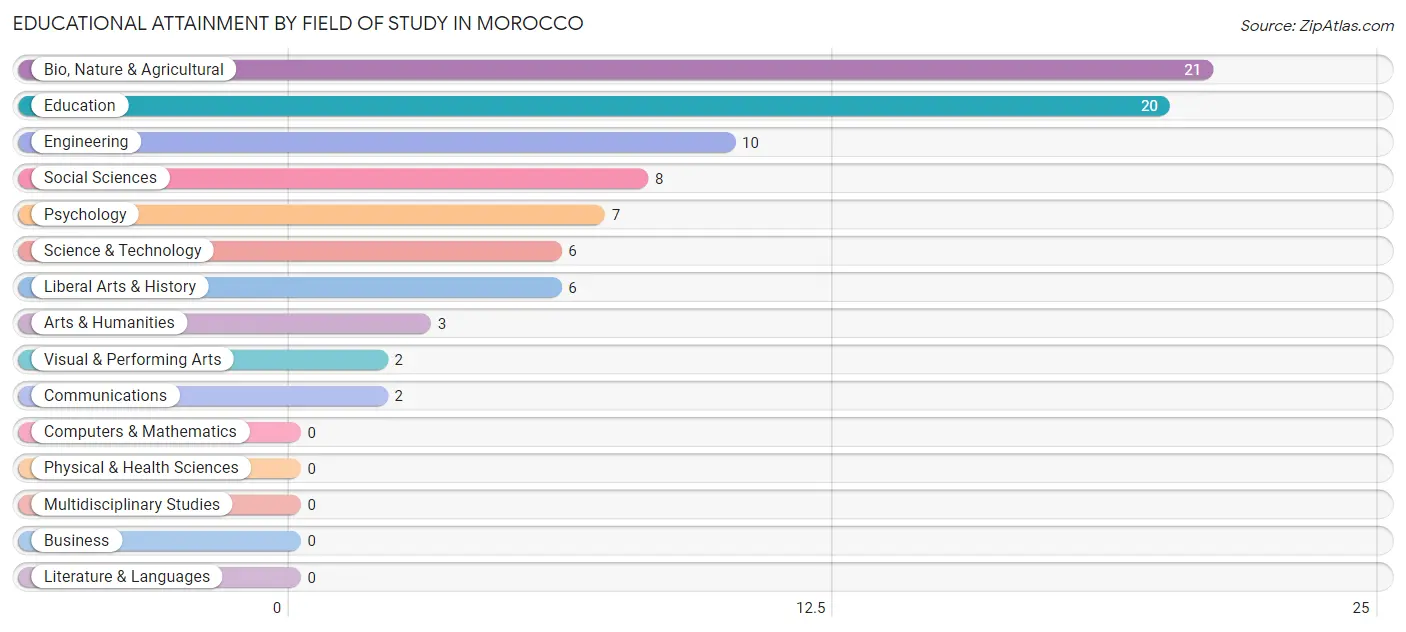
| Field of Study | # Graduates | % Graduates |
| Computers & Mathematics | 0 | 0.0% |
| Bio, Nature & Agricultural | 21 | 24.7% |
| Physical & Health Sciences | 0 | 0.0% |
| Psychology | 7 | 8.2% |
| Social Sciences | 8 | 9.4% |
| Engineering | 10 | 11.8% |
| Multidisciplinary Studies | 0 | 0.0% |
| Science & Technology | 6 | 7.1% |
| Business | 0 | 0.0% |
| Education | 20 | 23.5% |
| Literature & Languages | 0 | 0.0% |
| Liberal Arts & History | 6 | 7.1% |
| Visual & Performing Arts | 2 | 2.4% |
| Communications | 2 | 2.4% |
| Arts & Humanities | 3 | 3.5% |
| Total | 85 | 100.0% |
Transportation & Commute in Morocco
Vehicle Availability by Sex in Morocco
The most prevalent vehicle ownership categories in Morocco are males with 2 vehicles (110, accounting for 42.8%) and females with 2 vehicles (67, making up 52.6%).
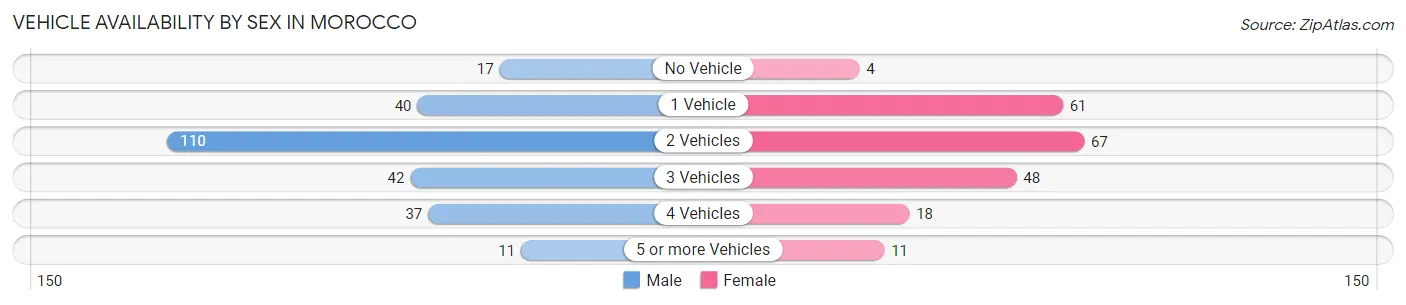
| Vehicles Available | Male | Female |
| No Vehicle | 17 (6.6%) | 4 (1.9%) |
| 1 Vehicle | 40 (15.6%) | 61 (29.2%) |
| 2 Vehicles | 110 (42.8%) | 67 (32.1%) |
| 3 Vehicles | 42 (16.3%) | 48 (23.0%) |
| 4 Vehicles | 37 (14.4%) | 18 (8.6%) |
| 5 or more Vehicles | 11 (4.3%) | 11 (5.3%) |
| Total | 257 (100.0%) | 209 (100.0%) |
Commute Time in Morocco
The most frequently occuring commute durations in Morocco are 60 to 89 minutes (87 commuters, 19.2%), 10 to 14 minutes (52 commuters, 11.5%), and 5 to 9 minutes (47 commuters, 10.3%).
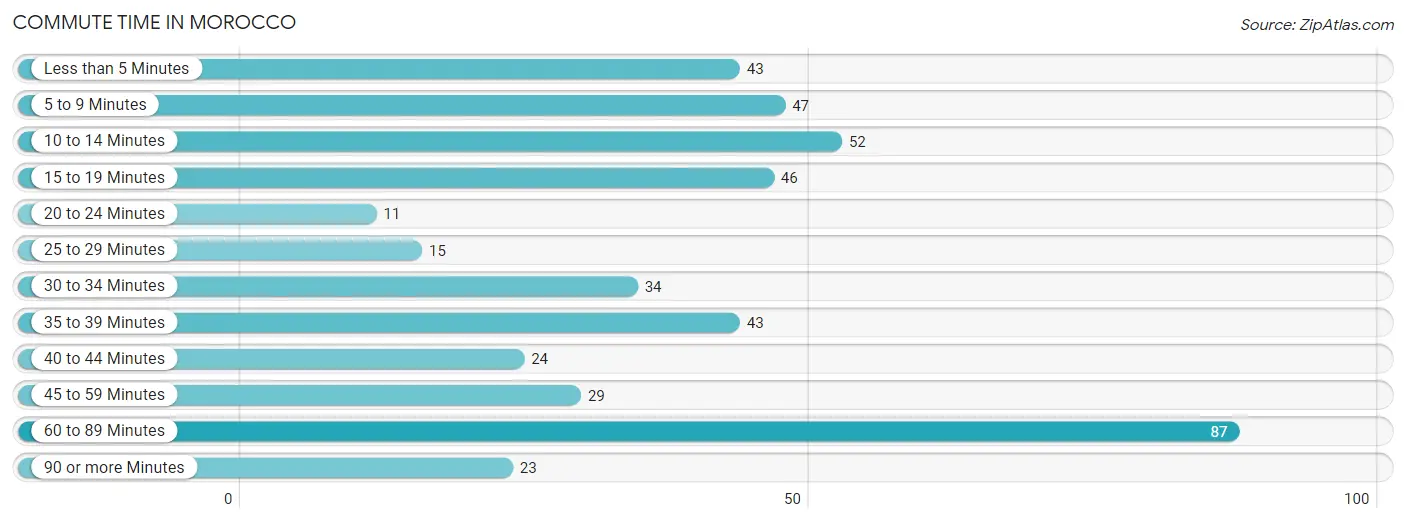
| Commute Time | # Commuters | % Commuters |
| Less than 5 Minutes | 43 | 9.5% |
| 5 to 9 Minutes | 47 | 10.3% |
| 10 to 14 Minutes | 52 | 11.5% |
| 15 to 19 Minutes | 46 | 10.1% |
| 20 to 24 Minutes | 11 | 2.4% |
| 25 to 29 Minutes | 15 | 3.3% |
| 30 to 34 Minutes | 34 | 7.5% |
| 35 to 39 Minutes | 43 | 9.5% |
| 40 to 44 Minutes | 24 | 5.3% |
| 45 to 59 Minutes | 29 | 6.4% |
| 60 to 89 Minutes | 87 | 19.2% |
| 90 or more Minutes | 23 | 5.1% |
Commute Time by Sex in Morocco
The most common commute times in Morocco are 60 to 89 minutes (48 commuters, 19.4%) for males and 60 to 89 minutes (39 commuters, 18.9%) for females.
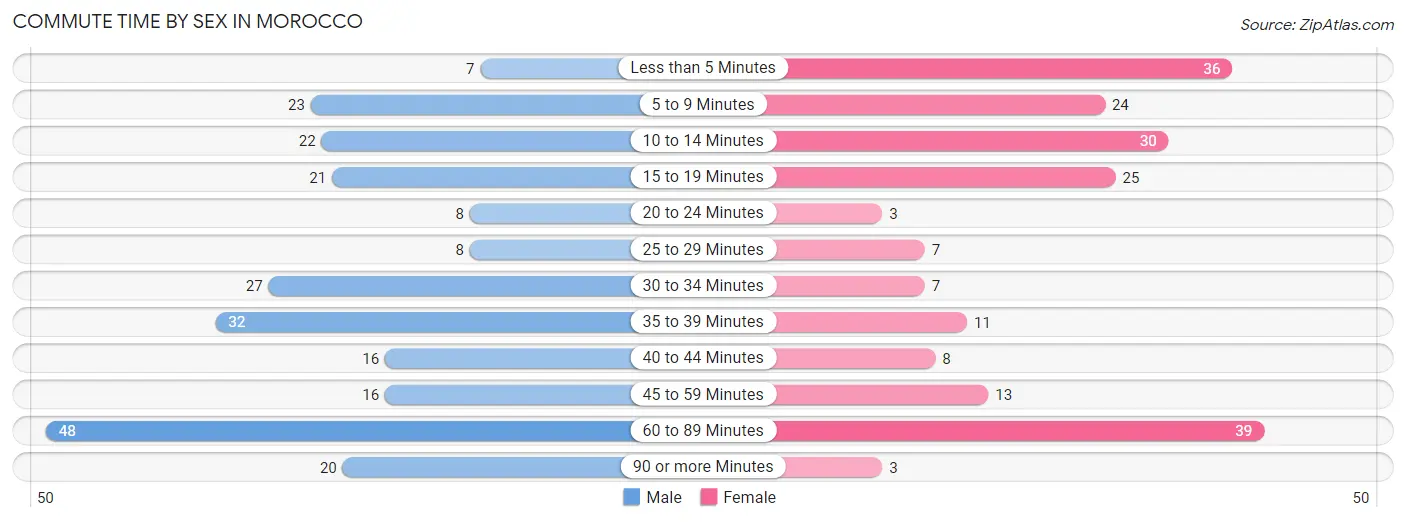
| Commute Time | Male | Female |
| Less than 5 Minutes | 7 (2.8%) | 36 (17.5%) |
| 5 to 9 Minutes | 23 (9.3%) | 24 (11.7%) |
| 10 to 14 Minutes | 22 (8.9%) | 30 (14.6%) |
| 15 to 19 Minutes | 21 (8.5%) | 25 (12.1%) |
| 20 to 24 Minutes | 8 (3.2%) | 3 (1.5%) |
| 25 to 29 Minutes | 8 (3.2%) | 7 (3.4%) |
| 30 to 34 Minutes | 27 (10.9%) | 7 (3.4%) |
| 35 to 39 Minutes | 32 (12.9%) | 11 (5.3%) |
| 40 to 44 Minutes | 16 (6.5%) | 8 (3.9%) |
| 45 to 59 Minutes | 16 (6.5%) | 13 (6.3%) |
| 60 to 89 Minutes | 48 (19.4%) | 39 (18.9%) |
| 90 or more Minutes | 20 (8.1%) | 3 (1.5%) |
Time of Departure to Work by Sex in Morocco
The most frequent times of departure to work in Morocco are 12:00 AM to 4:59 AM (67, 27.0%) for males and 7:30 AM to 7:59 AM (49, 23.8%) for females.
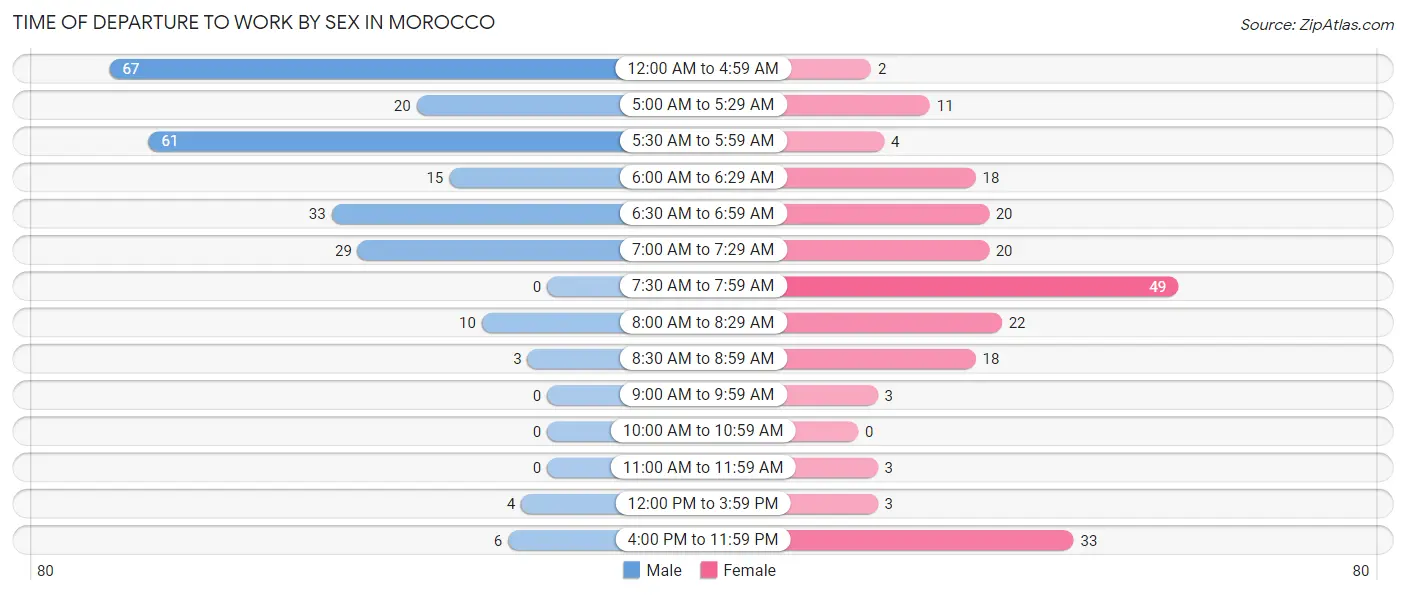
| Time of Departure | Male | Female |
| 12:00 AM to 4:59 AM | 67 (27.0%) | 2 (1.0%) |
| 5:00 AM to 5:29 AM | 20 (8.1%) | 11 (5.3%) |
| 5:30 AM to 5:59 AM | 61 (24.6%) | 4 (1.9%) |
| 6:00 AM to 6:29 AM | 15 (6.0%) | 18 (8.7%) |
| 6:30 AM to 6:59 AM | 33 (13.3%) | 20 (9.7%) |
| 7:00 AM to 7:29 AM | 29 (11.7%) | 20 (9.7%) |
| 7:30 AM to 7:59 AM | 0 (0.0%) | 49 (23.8%) |
| 8:00 AM to 8:29 AM | 10 (4.0%) | 22 (10.7%) |
| 8:30 AM to 8:59 AM | 3 (1.2%) | 18 (8.7%) |
| 9:00 AM to 9:59 AM | 0 (0.0%) | 3 (1.5%) |
| 10:00 AM to 10:59 AM | 0 (0.0%) | 0 (0.0%) |
| 11:00 AM to 11:59 AM | 0 (0.0%) | 3 (1.5%) |
| 12:00 PM to 3:59 PM | 4 (1.6%) | 3 (1.5%) |
| 4:00 PM to 11:59 PM | 6 (2.4%) | 33 (16.0%) |
| Total | 248 (100.0%) | 206 (100.0%) |
Housing Occupancy in Morocco
Occupancy by Ownership in Morocco
Of the total 455 dwellings in Morocco, owner-occupied units account for 342 (75.2%), while renter-occupied units make up 113 (24.8%).
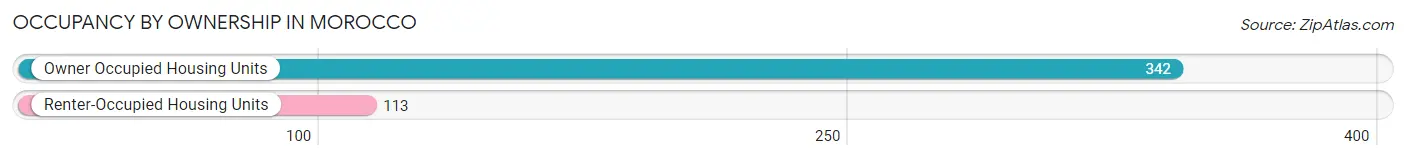
| Occupancy | # Housing Units | % Housing Units |
| Owner Occupied Housing Units | 342 | 75.2% |
| Renter-Occupied Housing Units | 113 | 24.8% |
| Total Occupied Housing Units | 455 | 100.0% |
Occupancy by Household Size in Morocco
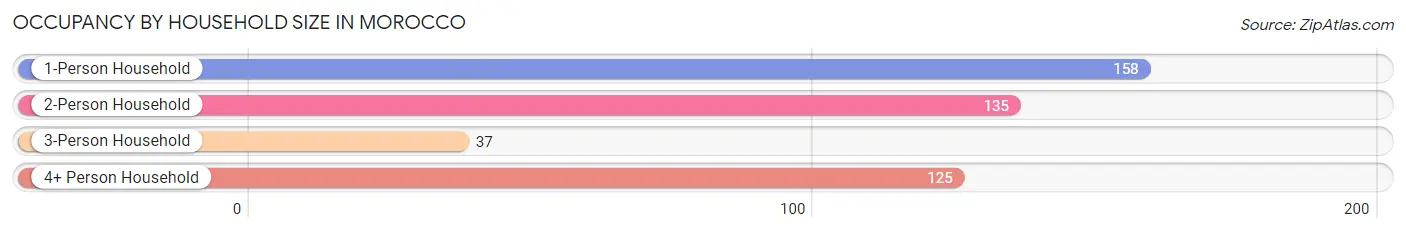
| Household Size | # Housing Units | % Housing Units |
| 1-Person Household | 158 | 34.7% |
| 2-Person Household | 135 | 29.7% |
| 3-Person Household | 37 | 8.1% |
| 4+ Person Household | 125 | 27.5% |
| Total Housing Units | 455 | 100.0% |
Occupancy by Ownership by Household Size in Morocco
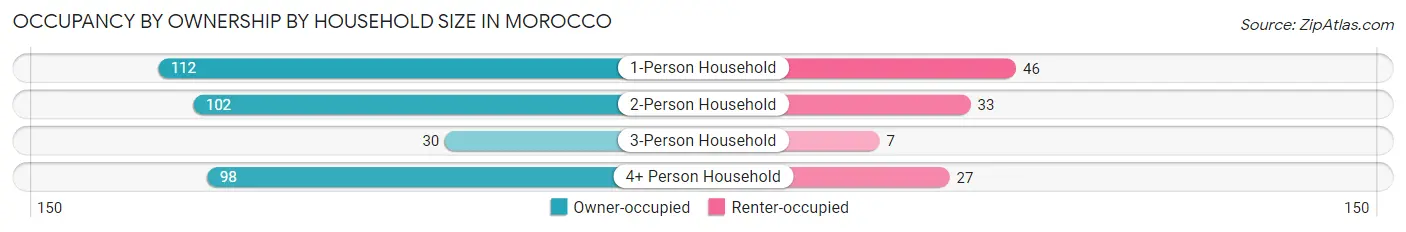
| Household Size | Owner-occupied | Renter-occupied |
| 1-Person Household | 112 (70.9%) | 46 (29.1%) |
| 2-Person Household | 102 (75.6%) | 33 (24.4%) |
| 3-Person Household | 30 (81.1%) | 7 (18.9%) |
| 4+ Person Household | 98 (78.4%) | 27 (21.6%) |
| Total Housing Units | 342 (75.2%) | 113 (24.8%) |
Occupancy by Educational Attainment in Morocco
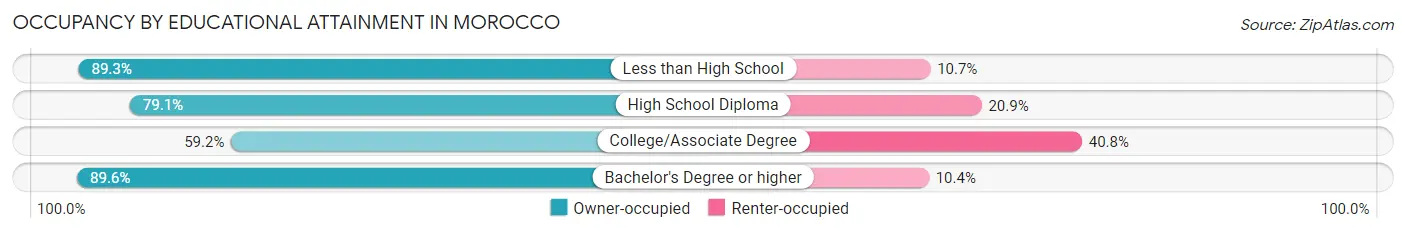
| Household Size | Owner-occupied | Renter-occupied |
| Less than High School | 25 (89.3%) | 3 (10.7%) |
| High School Diploma | 197 (79.1%) | 52 (20.9%) |
| College/Associate Degree | 77 (59.2%) | 53 (40.8%) |
| Bachelor's Degree or higher | 43 (89.6%) | 5 (10.4%) |
Occupancy by Age of Householder in Morocco
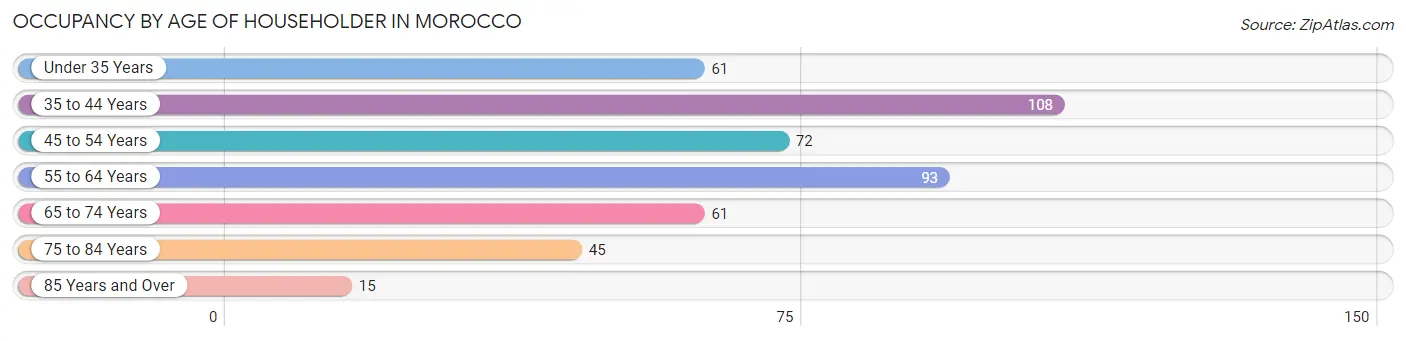
| Age Bracket | # Households | % Households |
| Under 35 Years | 61 | 13.4% |
| 35 to 44 Years | 108 | 23.7% |
| 45 to 54 Years | 72 | 15.8% |
| 55 to 64 Years | 93 | 20.4% |
| 65 to 74 Years | 61 | 13.4% |
| 75 to 84 Years | 45 | 9.9% |
| 85 Years and Over | 15 | 3.3% |
| Total | 455 | 100.0% |
Housing Finances in Morocco
Median Income by Occupancy in Morocco
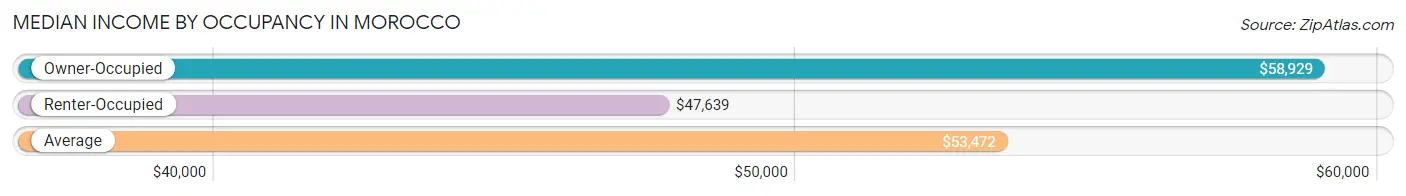
| Occupancy Type | # Households | Median Income |
| Owner-Occupied | 342 (75.2%) | $58,929 |
| Renter-Occupied | 113 (24.8%) | $47,639 |
| Average | 455 (100.0%) | $53,472 |
Occupancy by Householder Income Bracket in Morocco
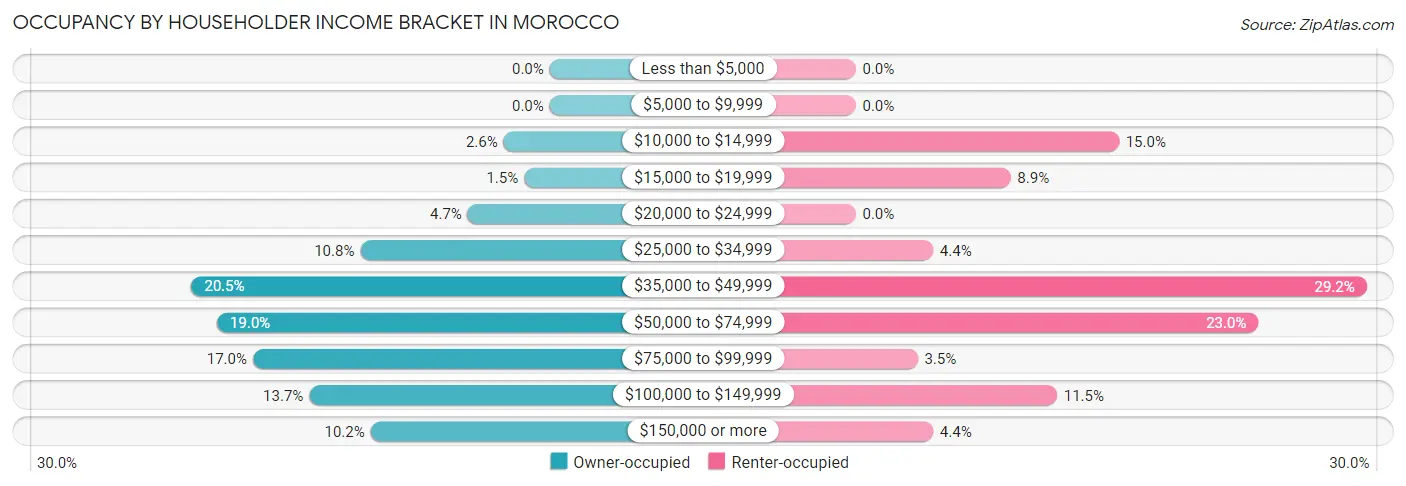
| Income Bracket | Owner-occupied | Renter-occupied |
| Less than $5,000 | 0 (0.0%) | 0 (0.0%) |
| $5,000 to $9,999 | 0 (0.0%) | 0 (0.0%) |
| $10,000 to $14,999 | 9 (2.6%) | 17 (15.0%) |
| $15,000 to $19,999 | 5 (1.5%) | 10 (8.8%) |
| $20,000 to $24,999 | 16 (4.7%) | 0 (0.0%) |
| $25,000 to $34,999 | 37 (10.8%) | 5 (4.4%) |
| $35,000 to $49,999 | 70 (20.5%) | 33 (29.2%) |
| $50,000 to $74,999 | 65 (19.0%) | 26 (23.0%) |
| $75,000 to $99,999 | 58 (17.0%) | 4 (3.5%) |
| $100,000 to $149,999 | 47 (13.7%) | 13 (11.5%) |
| $150,000 or more | 35 (10.2%) | 5 (4.4%) |
| Total | 342 (100.0%) | 113 (100.0%) |
Monthly Housing Cost Tiers in Morocco
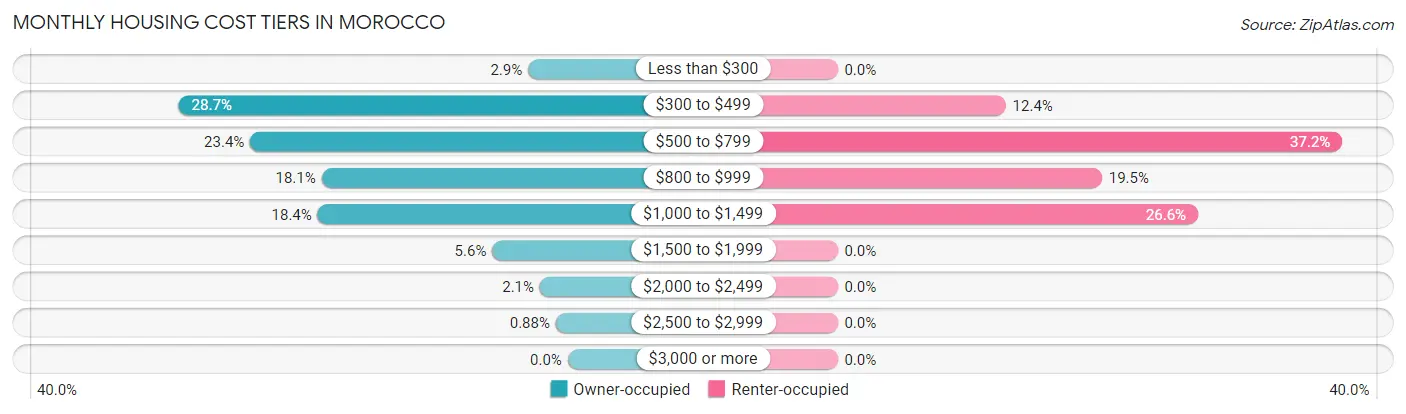
| Monthly Cost | Owner-occupied | Renter-occupied |
| Less than $300 | 10 (2.9%) | 0 (0.0%) |
| $300 to $499 | 98 (28.6%) | 14 (12.4%) |
| $500 to $799 | 80 (23.4%) | 42 (37.2%) |
| $800 to $999 | 62 (18.1%) | 22 (19.5%) |
| $1,000 to $1,499 | 63 (18.4%) | 30 (26.6%) |
| $1,500 to $1,999 | 19 (5.6%) | 0 (0.0%) |
| $2,000 to $2,499 | 7 (2.1%) | 0 (0.0%) |
| $2,500 to $2,999 | 3 (0.9%) | 0 (0.0%) |
| $3,000 or more | 0 (0.0%) | 0 (0.0%) |
| Total | 342 (100.0%) | 113 (100.0%) |
Physical Housing Characteristics in Morocco
Housing Structures in Morocco
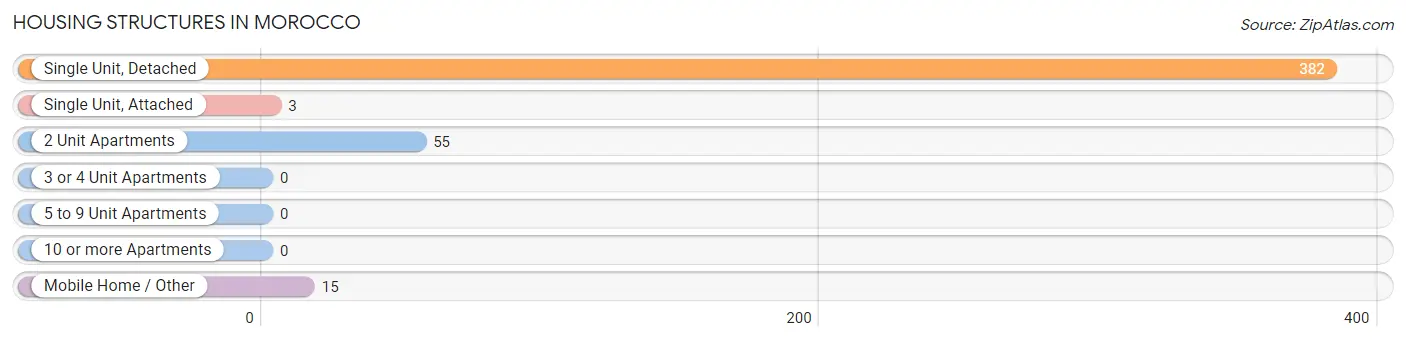
| Structure Type | # Housing Units | % Housing Units |
| Single Unit, Detached | 382 | 84.0% |
| Single Unit, Attached | 3 | 0.7% |
| 2 Unit Apartments | 55 | 12.1% |
| 3 or 4 Unit Apartments | 0 | 0.0% |
| 5 to 9 Unit Apartments | 0 | 0.0% |
| 10 or more Apartments | 0 | 0.0% |
| Mobile Home / Other | 15 | 3.3% |
| Total | 455 | 100.0% |
Housing Structures by Occupancy in Morocco
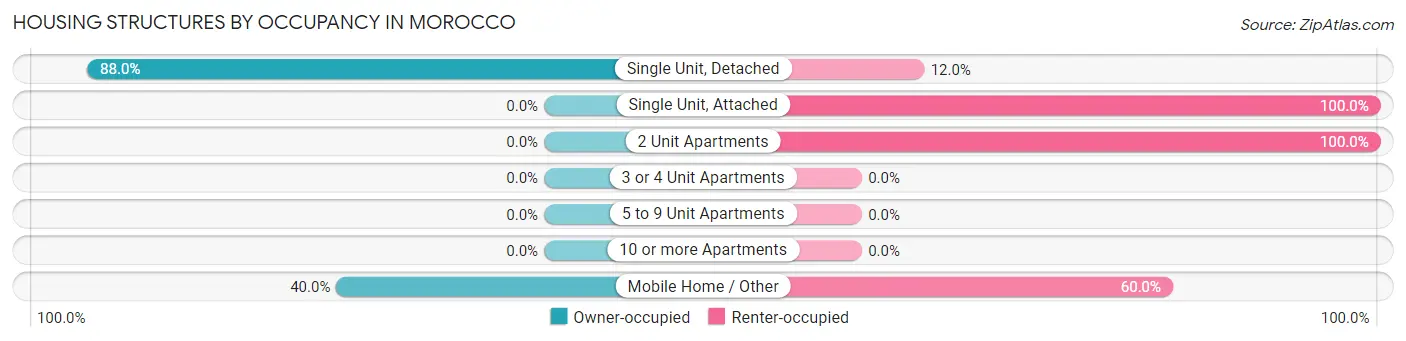
| Structure Type | Owner-occupied | Renter-occupied |
| Single Unit, Detached | 336 (88.0%) | 46 (12.0%) |
| Single Unit, Attached | 0 (0.0%) | 3 (100.0%) |
| 2 Unit Apartments | 0 (0.0%) | 55 (100.0%) |
| 3 or 4 Unit Apartments | 0 (0.0%) | 0 (0.0%) |
| 5 to 9 Unit Apartments | 0 (0.0%) | 0 (0.0%) |
| 10 or more Apartments | 0 (0.0%) | 0 (0.0%) |
| Mobile Home / Other | 6 (40.0%) | 9 (60.0%) |
| Total | 342 (75.2%) | 113 (24.8%) |
Housing Structures by Number of Rooms in Morocco
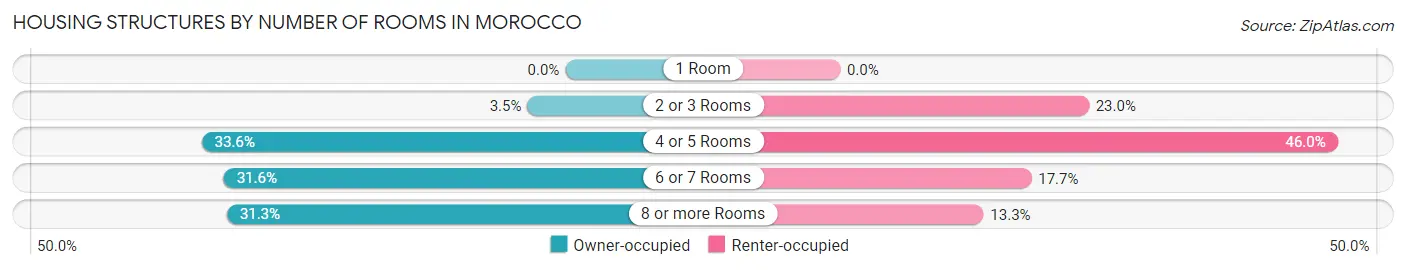
| Number of Rooms | Owner-occupied | Renter-occupied |
| 1 Room | 0 (0.0%) | 0 (0.0%) |
| 2 or 3 Rooms | 12 (3.5%) | 26 (23.0%) |
| 4 or 5 Rooms | 115 (33.6%) | 52 (46.0%) |
| 6 or 7 Rooms | 108 (31.6%) | 20 (17.7%) |
| 8 or more Rooms | 107 (31.3%) | 15 (13.3%) |
| Total | 342 (100.0%) | 113 (100.0%) |
Housing Structure by Heating Type in Morocco
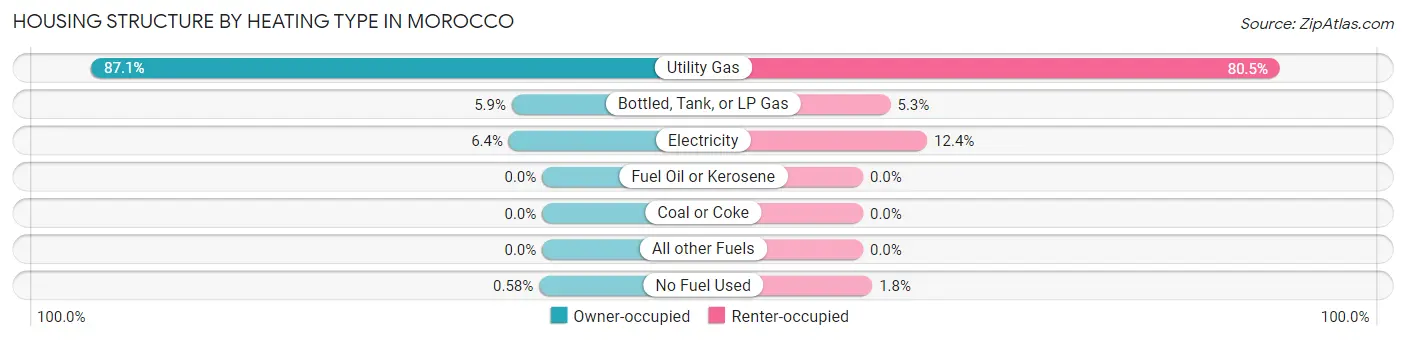
| Heating Type | Owner-occupied | Renter-occupied |
| Utility Gas | 298 (87.1%) | 91 (80.5%) |
| Bottled, Tank, or LP Gas | 20 (5.9%) | 6 (5.3%) |
| Electricity | 22 (6.4%) | 14 (12.4%) |
| Fuel Oil or Kerosene | 0 (0.0%) | 0 (0.0%) |
| Coal or Coke | 0 (0.0%) | 0 (0.0%) |
| All other Fuels | 0 (0.0%) | 0 (0.0%) |
| No Fuel Used | 2 (0.6%) | 2 (1.8%) |
| Total | 342 (100.0%) | 113 (100.0%) |
Household Vehicle Usage in Morocco
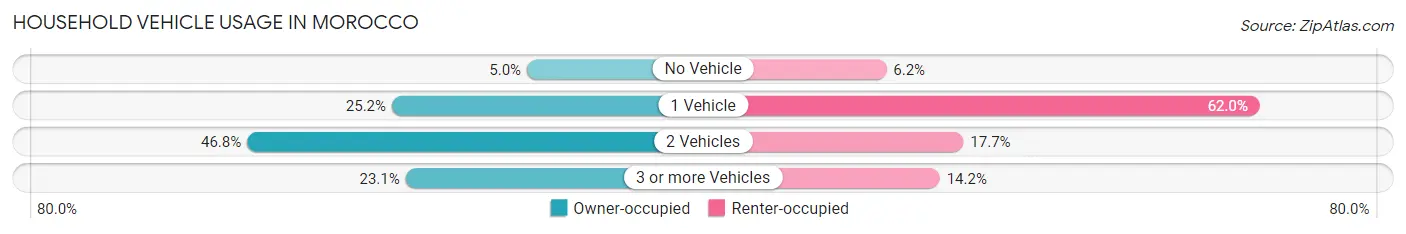
| Vehicles per Household | Owner-occupied | Renter-occupied |
| No Vehicle | 17 (5.0%) | 7 (6.2%) |
| 1 Vehicle | 86 (25.2%) | 70 (62.0%) |
| 2 Vehicles | 160 (46.8%) | 20 (17.7%) |
| 3 or more Vehicles | 79 (23.1%) | 16 (14.2%) |
| Total | 342 (100.0%) | 113 (100.0%) |
Real Estate & Mortgages in Morocco
Real Estate and Mortgage Overview in Morocco
| Characteristic | Without Mortgage | With Mortgage |
| Housing Units | 160 | 182 |
| Median Property Value | $102,100 | $117,900 |
| Median Household Income | $46,563 | $28 |
| Monthly Housing Costs | $453 | $0 |
| Real Estate Taxes | $1,143 | $3 |
Property Value by Mortgage Status in Morocco
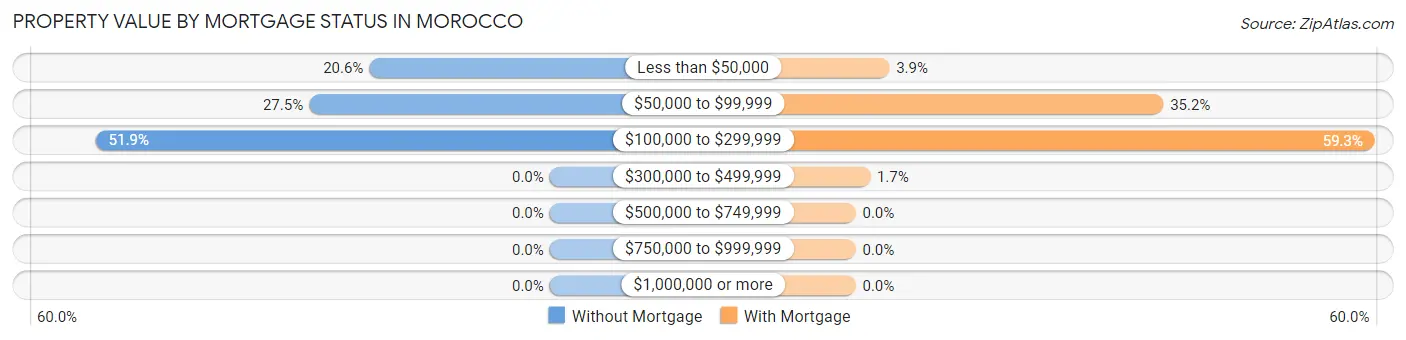
| Property Value | Without Mortgage | With Mortgage |
| Less than $50,000 | 33 (20.6%) | 7 (3.8%) |
| $50,000 to $99,999 | 44 (27.5%) | 64 (35.2%) |
| $100,000 to $299,999 | 83 (51.9%) | 108 (59.3%) |
| $300,000 to $499,999 | 0 (0.0%) | 3 (1.7%) |
| $500,000 to $749,999 | 0 (0.0%) | 0 (0.0%) |
| $750,000 to $999,999 | 0 (0.0%) | 0 (0.0%) |
| $1,000,000 or more | 0 (0.0%) | 0 (0.0%) |
| Total | 160 (100.0%) | 182 (100.0%) |
Household Income by Mortgage Status in Morocco
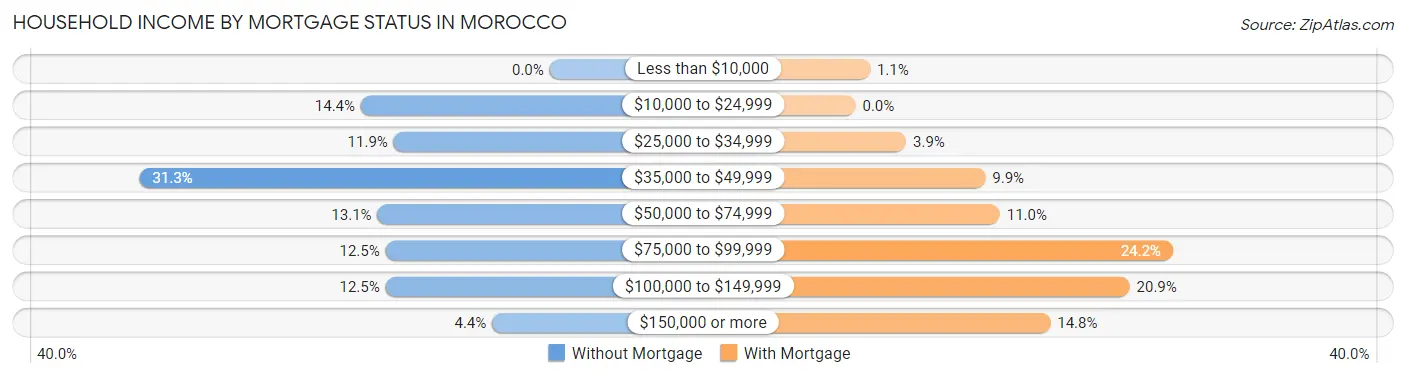
| Household Income | Without Mortgage | With Mortgage |
| Less than $10,000 | 0 (0.0%) | 2 (1.1%) |
| $10,000 to $24,999 | 23 (14.4%) | 0 (0.0%) |
| $25,000 to $34,999 | 19 (11.9%) | 7 (3.8%) |
| $35,000 to $49,999 | 50 (31.2%) | 18 (9.9%) |
| $50,000 to $74,999 | 21 (13.1%) | 20 (11.0%) |
| $75,000 to $99,999 | 20 (12.5%) | 44 (24.2%) |
| $100,000 to $149,999 | 20 (12.5%) | 38 (20.9%) |
| $150,000 or more | 7 (4.4%) | 27 (14.8%) |
| Total | 160 (100.0%) | 182 (100.0%) |
Property Value to Household Income Ratio in Morocco
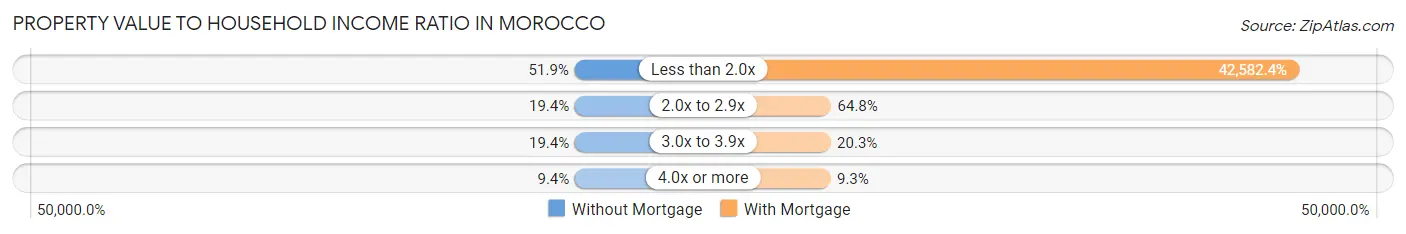
| Value-to-Income Ratio | Without Mortgage | With Mortgage |
| Less than 2.0x | 83 (51.9%) | 77,500 (42,582.4%) |
| 2.0x to 2.9x | 31 (19.4%) | 118 (64.8%) |
| 3.0x to 3.9x | 31 (19.4%) | 37 (20.3%) |
| 4.0x or more | 15 (9.4%) | 17 (9.3%) |
| Total | 160 (100.0%) | 182 (100.0%) |
Real Estate Taxes by Mortgage Status in Morocco
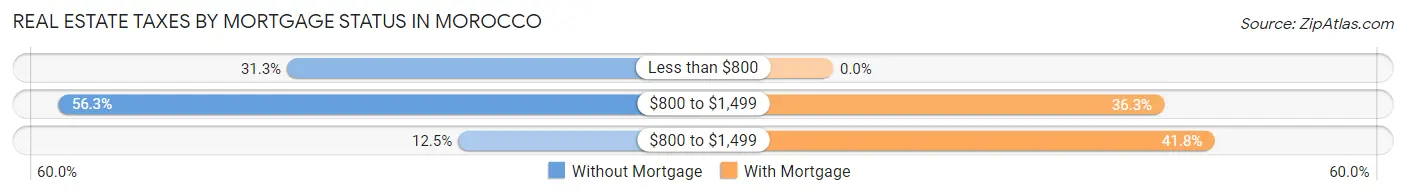
| Property Taxes | Without Mortgage | With Mortgage |
| Less than $800 | 50 (31.2%) | 0 (0.0%) |
| $800 to $1,499 | 90 (56.2%) | 66 (36.3%) |
| $800 to $1,499 | 20 (12.5%) | 76 (41.8%) |
| Total | 160 (100.0%) | 182 (100.0%) |
Health & Disability in Morocco
Health Insurance Coverage by Age in Morocco
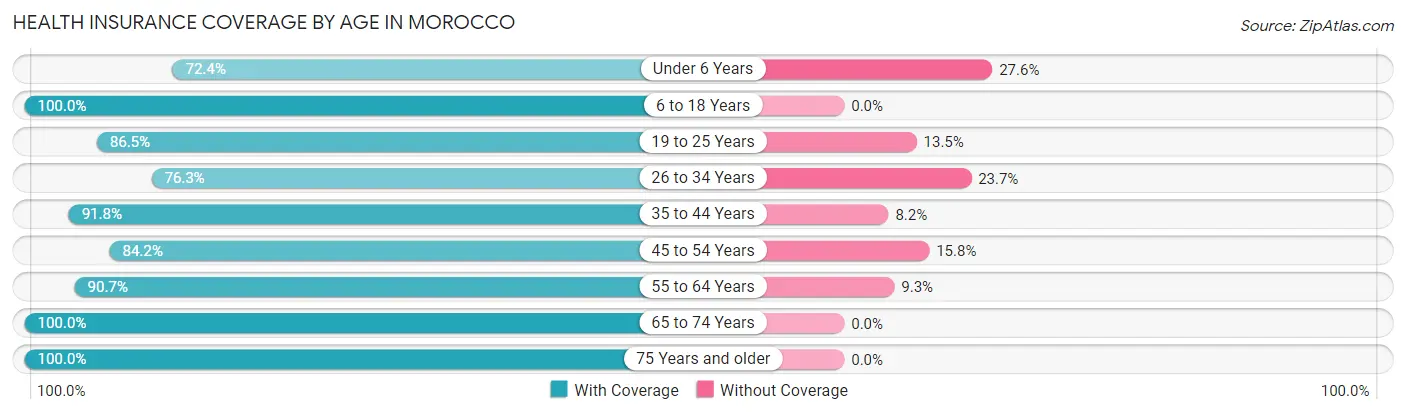
| Age Bracket | With Coverage | Without Coverage |
| Under 6 Years | 21 (72.4%) | 8 (27.6%) |
| 6 to 18 Years | 288 (100.0%) | 0 (0.0%) |
| 19 to 25 Years | 77 (86.5%) | 12 (13.5%) |
| 26 to 34 Years | 71 (76.3%) | 22 (23.7%) |
| 35 to 44 Years | 156 (91.8%) | 14 (8.2%) |
| 45 to 54 Years | 85 (84.2%) | 16 (15.8%) |
| 55 to 64 Years | 136 (90.7%) | 14 (9.3%) |
| 65 to 74 Years | 91 (100.0%) | 0 (0.0%) |
| 75 Years and older | 96 (100.0%) | 0 (0.0%) |
| Total | 1,021 (92.2%) | 86 (7.8%) |
Health Insurance Coverage by Citizenship Status in Morocco
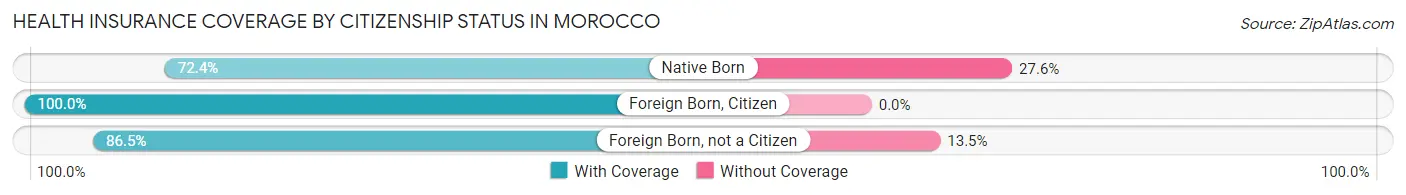
| Citizenship Status | With Coverage | Without Coverage |
| Native Born | 21 (72.4%) | 8 (27.6%) |
| Foreign Born, Citizen | 288 (100.0%) | 0 (0.0%) |
| Foreign Born, not a Citizen | 77 (86.5%) | 12 (13.5%) |
Health Insurance Coverage by Household Income in Morocco
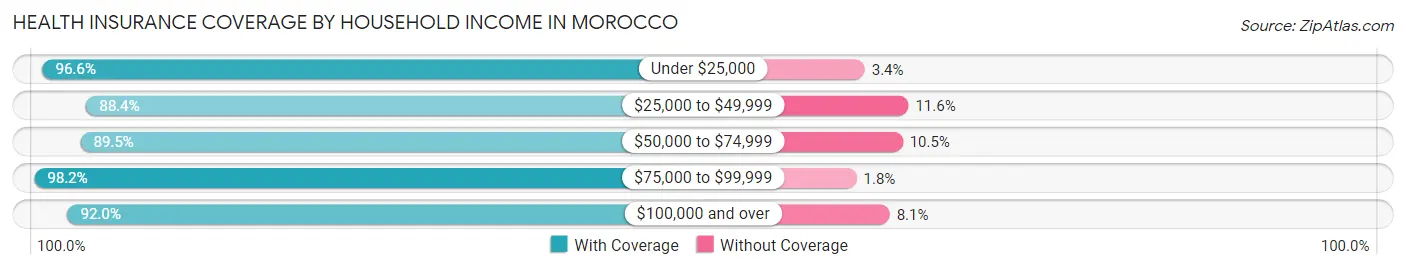
| Household Income | With Coverage | Without Coverage |
| Under $25,000 | 86 (96.6%) | 3 (3.4%) |
| $25,000 to $49,999 | 199 (88.4%) | 26 (11.6%) |
| $50,000 to $74,999 | 248 (89.5%) | 29 (10.5%) |
| $75,000 to $99,999 | 214 (98.2%) | 4 (1.8%) |
| $100,000 and over | 274 (91.9%) | 24 (8.1%) |
Public vs Private Health Insurance Coverage by Age in Morocco
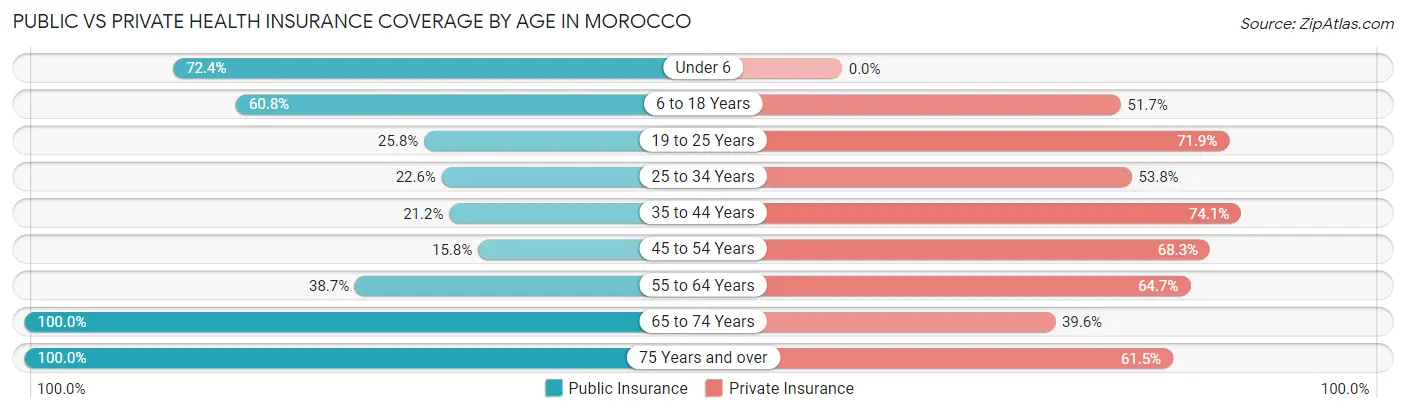
| Age Bracket | Public Insurance | Private Insurance |
| Under 6 | 21 (72.4%) | 0 (0.0%) |
| 6 to 18 Years | 175 (60.8%) | 149 (51.7%) |
| 19 to 25 Years | 23 (25.8%) | 64 (71.9%) |
| 25 to 34 Years | 21 (22.6%) | 50 (53.8%) |
| 35 to 44 Years | 36 (21.2%) | 126 (74.1%) |
| 45 to 54 Years | 16 (15.8%) | 69 (68.3%) |
| 55 to 64 Years | 58 (38.7%) | 97 (64.7%) |
| 65 to 74 Years | 91 (100.0%) | 36 (39.6%) |
| 75 Years and over | 96 (100.0%) | 59 (61.5%) |
| Total | 537 (48.5%) | 650 (58.7%) |
Disability Status by Sex by Age in Morocco
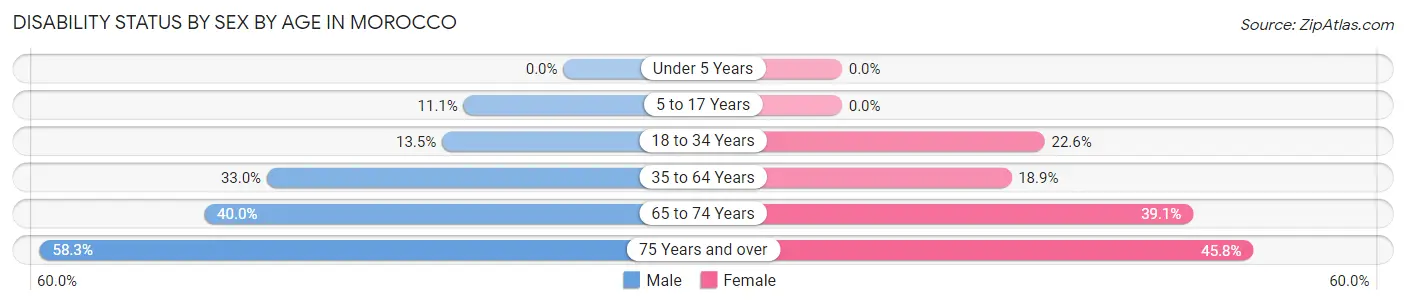
| Age Bracket | Male | Female |
| Under 5 Years | 0 (0.0%) | 0 (0.0%) |
| 5 to 17 Years | 13 (11.1%) | 0 (0.0%) |
| 18 to 34 Years | 15 (13.5%) | 21 (22.6%) |
| 35 to 64 Years | 69 (33.0%) | 40 (18.9%) |
| 65 to 74 Years | 18 (40.0%) | 18 (39.1%) |
| 75 Years and over | 28 (58.3%) | 22 (45.8%) |
Disability Class by Sex by Age in Morocco
Disability Class: Hearing Difficulty
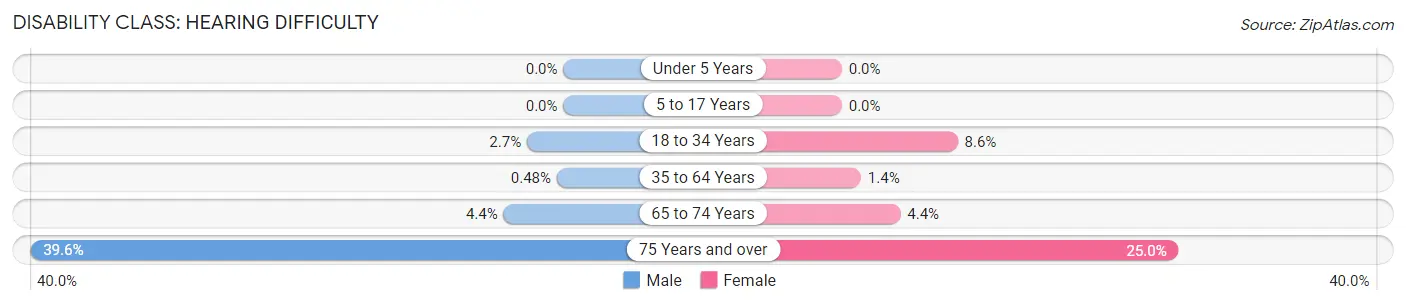
| Age Bracket | Male | Female |
| Under 5 Years | 0 (0.0%) | 0 (0.0%) |
| 5 to 17 Years | 0 (0.0%) | 0 (0.0%) |
| 18 to 34 Years | 3 (2.7%) | 8 (8.6%) |
| 35 to 64 Years | 1 (0.5%) | 3 (1.4%) |
| 65 to 74 Years | 2 (4.4%) | 2 (4.3%) |
| 75 Years and over | 19 (39.6%) | 12 (25.0%) |
Disability Class: Vision Difficulty
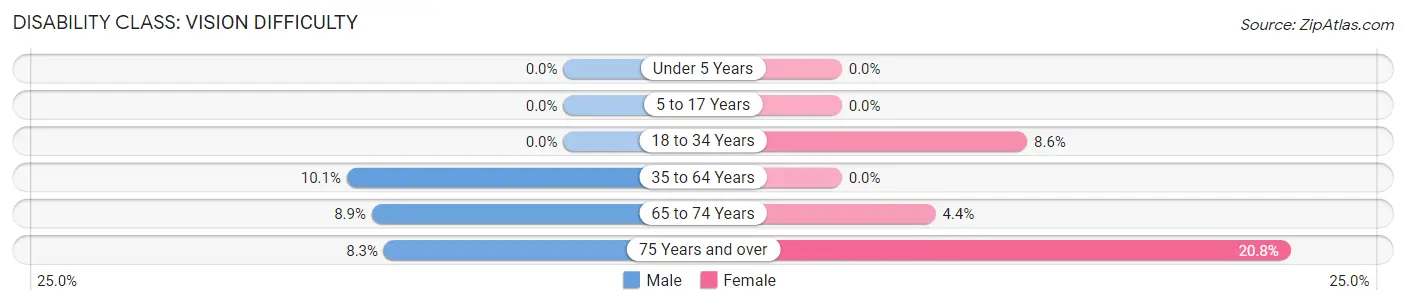
| Age Bracket | Male | Female |
| Under 5 Years | 0 (0.0%) | 0 (0.0%) |
| 5 to 17 Years | 0 (0.0%) | 0 (0.0%) |
| 18 to 34 Years | 0 (0.0%) | 8 (8.6%) |
| 35 to 64 Years | 21 (10.1%) | 0 (0.0%) |
| 65 to 74 Years | 4 (8.9%) | 2 (4.3%) |
| 75 Years and over | 4 (8.3%) | 10 (20.8%) |
Disability Class: Cognitive Difficulty
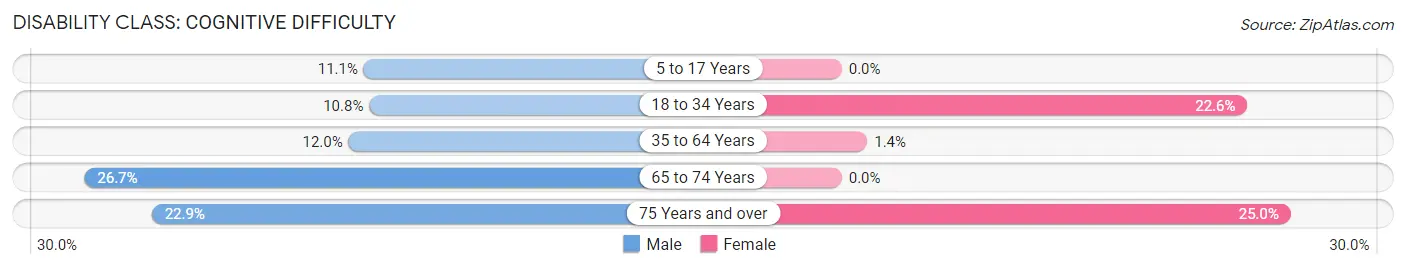
| Age Bracket | Male | Female |
| 5 to 17 Years | 13 (11.1%) | 0 (0.0%) |
| 18 to 34 Years | 12 (10.8%) | 21 (22.6%) |
| 35 to 64 Years | 25 (12.0%) | 3 (1.4%) |
| 65 to 74 Years | 12 (26.7%) | 0 (0.0%) |
| 75 Years and over | 11 (22.9%) | 12 (25.0%) |
Disability Class: Ambulatory Difficulty
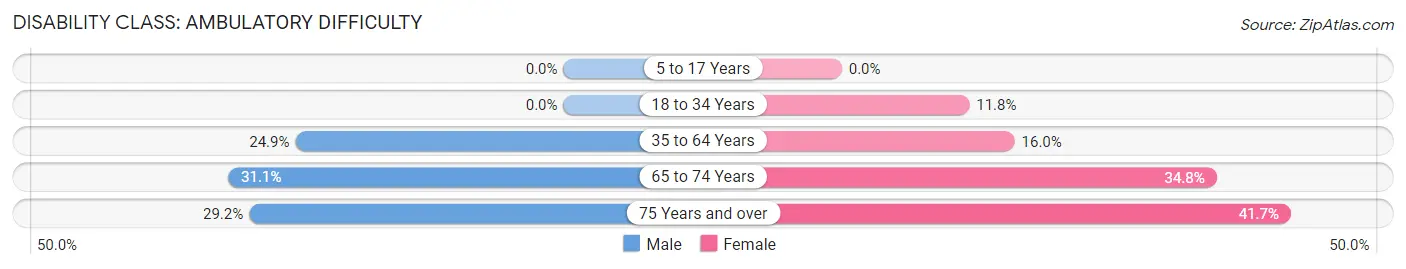
| Age Bracket | Male | Female |
| 5 to 17 Years | 0 (0.0%) | 0 (0.0%) |
| 18 to 34 Years | 0 (0.0%) | 11 (11.8%) |
| 35 to 64 Years | 52 (24.9%) | 34 (16.0%) |
| 65 to 74 Years | 14 (31.1%) | 16 (34.8%) |
| 75 Years and over | 14 (29.2%) | 20 (41.7%) |
Disability Class: Self-Care Difficulty
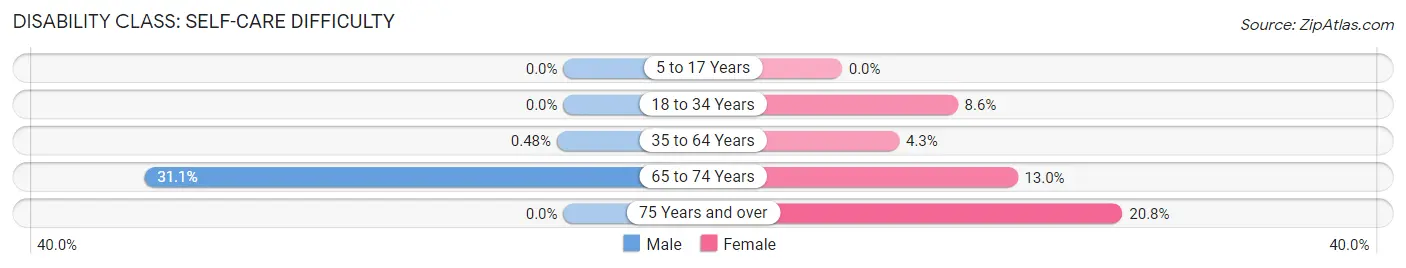
| Age Bracket | Male | Female |
| 5 to 17 Years | 0 (0.0%) | 0 (0.0%) |
| 18 to 34 Years | 0 (0.0%) | 8 (8.6%) |
| 35 to 64 Years | 1 (0.5%) | 9 (4.3%) |
| 65 to 74 Years | 14 (31.1%) | 6 (13.0%) |
| 75 Years and over | 0 (0.0%) | 10 (20.8%) |
Technology Access in Morocco
Computing Device Access in Morocco
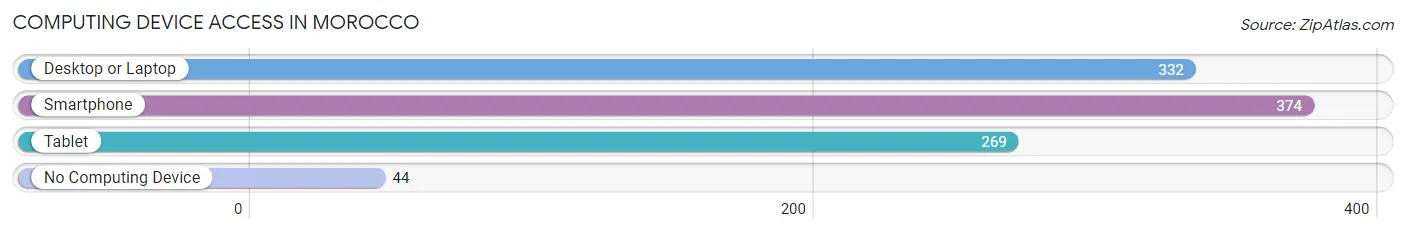
| Device Type | # Households | % Households |
| Desktop or Laptop | 332 | 73.0% |
| Smartphone | 374 | 82.2% |
| Tablet | 269 | 59.1% |
| No Computing Device | 44 | 9.7% |
| Total | 455 | 100.0% |
Internet Access in Morocco
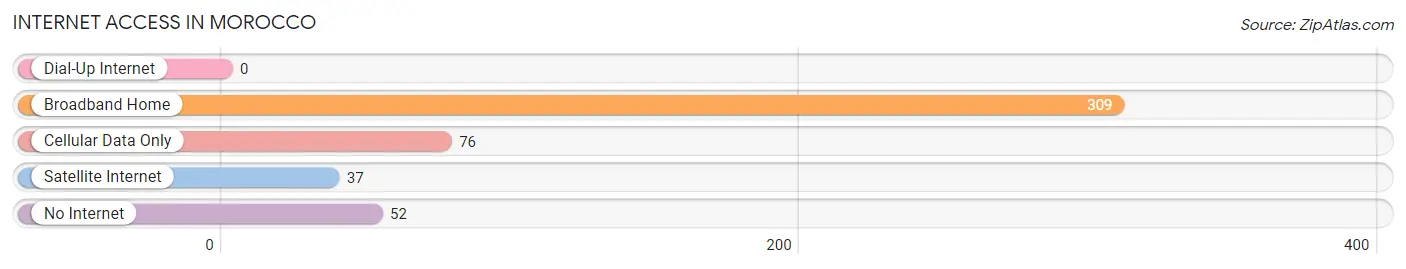
| Internet Type | # Households | % Households |
| Dial-Up Internet | 0 | 0.0% |
| Broadband Home | 309 | 67.9% |
| Cellular Data Only | 76 | 16.7% |
| Satellite Internet | 37 | 8.1% |
| No Internet | 52 | 11.4% |
| Total | 455 | 100.0% |
Morocco Summary
Morocco is a country located in the northwest corner of Africa, bordered by the Atlantic Ocean and the Mediterranean Sea. It is the only African country to have both Atlantic and Mediterranean coastlines. Morocco is a constitutional monarchy with an elected parliament. The official language is Arabic, although French and Spanish are also widely spoken. The population of Morocco in 2000 was estimated to be around 30 million people.
Geography
Morocco is located in the northwest corner of Africa, bordered by the Atlantic Ocean and the Mediterranean Sea. It is the only African country to have both Atlantic and Mediterranean coastlines. Morocco is divided into four distinct regions: the Rif Mountains in the north, the Middle Atlas Mountains in the center, the High Atlas Mountains in the south, and the Sahara Desert in the east. The highest point in Morocco is Mount Toubkal, which stands at 4,167 meters (13,671 feet).
The climate in Morocco is generally temperate, with hot summers and mild winters. Rainfall is generally low, with the majority of the country receiving less than 200 mm (7.9 inches) of precipitation annually.
Economy
Morocco’s economy is largely based on agriculture, with the majority of the population employed in the sector. The main crops grown in Morocco are wheat, barley, olives, citrus fruits, and vegetables. Morocco is also a major producer of phosphates, which are used in fertilizer and other industrial products.
The manufacturing sector is also important to the Moroccan economy, with the production of textiles, leather goods, and processed foods being the main industries. Tourism is also an important source of income for Morocco, with the country receiving over 10 million visitors annually.
Demographics
The population of Morocco in 2000 was estimated to be around 30 million people. The majority of the population is of Arab-Berber descent, with a small minority of Europeans and Jews. The official language is Arabic, although French and Spanish are also widely spoken. The majority of the population is Muslim, with a small minority of Christians and Jews.
Morocco has a relatively young population, with over half of the population under the age of 25. The literacy rate in Morocco is estimated to be around 60%, with the majority of the population having at least a basic education.
Conclusion
Morocco is a country located in the northwest corner of Africa, bordered by the Atlantic Ocean and the Mediterranean Sea. It is the only African country to have both Atlantic and Mediterranean coastlines. The population of Morocco in 2000 was estimated to be around 30 million people, with the majority of the population being of Arab-Berber descent. The economy of Morocco is largely based on agriculture, with the manufacturing sector and tourism also being important sources of income. The official language is Arabic, although French and Spanish are also widely spoken. The majority of the population is Muslim, with a small minority of Christians and Jews.
Common Questions
What is Per Capita Income in Morocco?
Per Capita income in Morocco is $28,265.
What is the Median Family Income in Morocco?
Median Family Income in Morocco is $71,667.
What is the Median Household income in Morocco?
Median Household Income in Morocco is $53,472.
What is Income or Wage Gap in Morocco?
Income or Wage Gap in Morocco is 44.7%.
Women in Morocco earn 55.3 cents for every dollar earned by a man.
What is Inequality or Gini Index in Morocco?
Inequality or Gini Index in Morocco is 0.35.
What is the Total Population of Morocco?
Total Population of Morocco is 1,107.
What is the Total Male Population of Morocco?
Total Male Population of Morocco is 545.
What is the Total Female Population of Morocco?
Total Female Population of Morocco is 562.
What is the Ratio of Males per 100 Females in Morocco?
There are 96.98 Males per 100 Females in Morocco.
What is the Ratio of Females per 100 Males in Morocco?
There are 103.12 Females per 100 Males in Morocco.
What is the Median Population Age in Morocco?
Median Population Age in Morocco is 37.3 Years.
What is the Average Family Size in Morocco
Average Family Size in Morocco is 3.0 People.
What is the Average Household Size in Morocco
Average Household Size in Morocco is 2.4 People.
How Large is the Labor Force in Morocco?
There are 525 People in the Labor Forcein in Morocco.
What is the Percentage of People in the Labor Force in Morocco?
60.4% of People are in the Labor Force in Morocco.
What is the Unemployment Rate in Morocco?
Unemployment Rate in Morocco is 8.2%.