Montpelier, IN Map & Demographics
Montpelier Map
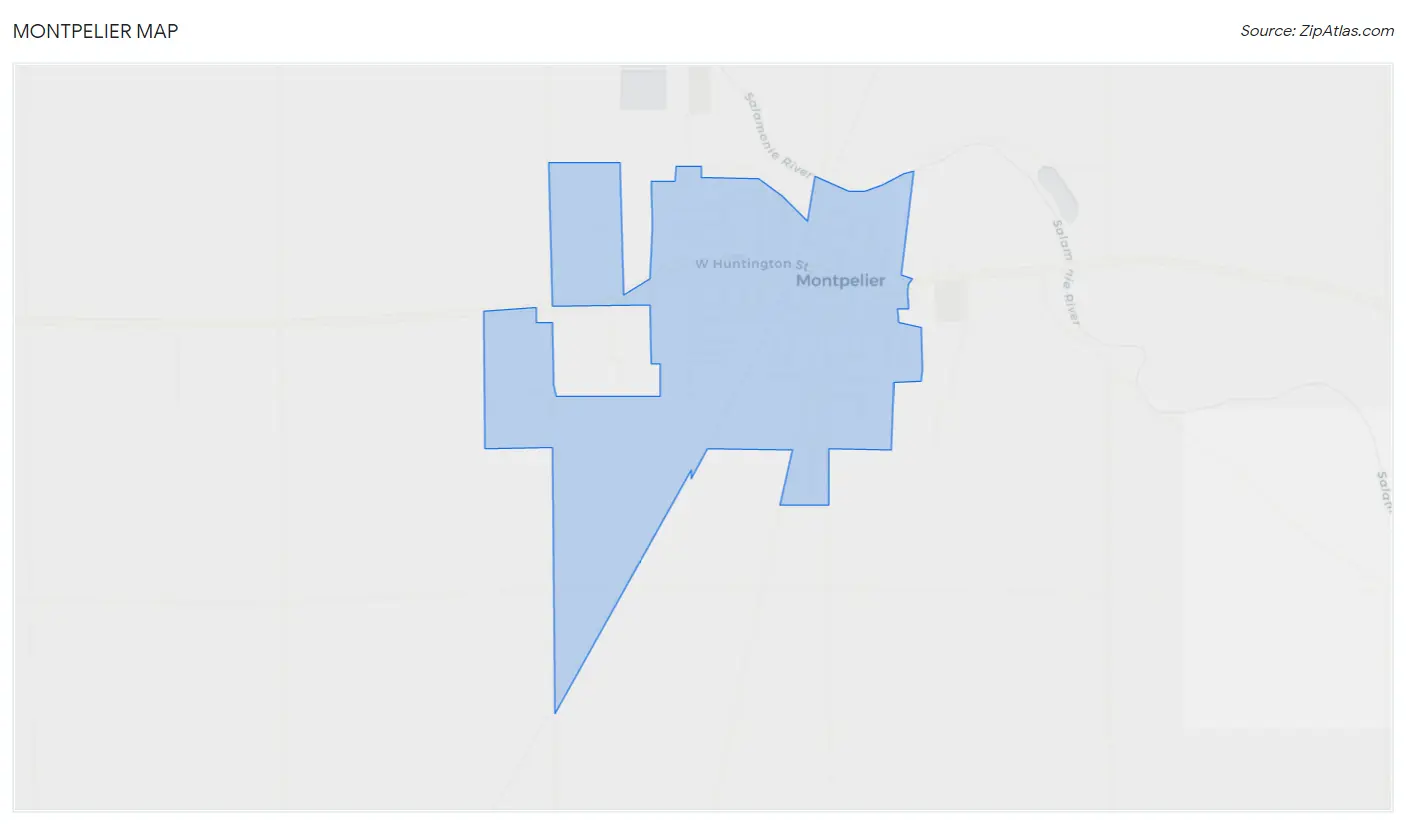
Montpelier Overview
$36,390
PER CAPITA INCOME
$65,893
AVG FAMILY INCOME
$47,734
AVG HOUSEHOLD INCOME
24.2%
WAGE / INCOME GAP [ % ]
75.8¢/ $1
WAGE / INCOME GAP [ $ ]
0.53
INEQUALITY / GINI INDEX
1,470
TOTAL POPULATION
736
MALE POPULATION
734
FEMALE POPULATION
100.27
MALES / 100 FEMALES
99.73
FEMALES / 100 MALES
48.6
MEDIAN AGE
3.0
AVG FAMILY SIZE
2.2
AVG HOUSEHOLD SIZE
821
LABOR FORCE [ PEOPLE ]
65.7%
PERCENT IN LABOR FORCE
5.1%
UNEMPLOYMENT RATE
Montpelier Zip Codes
Montpelier Area Codes
Income in Montpelier
Income Overview in Montpelier
Per Capita Income in Montpelier is $36,390, while median incomes of families and households are $65,893 and $47,734 respectively.
| Characteristic | Number | Measure |
| Per Capita Income | 1,470 | $36,390 |
| Median Family Income | 372 | $65,893 |
| Mean Family Income | 372 | $83,153 |
| Median Household Income | 669 | $47,734 |
| Mean Household Income | 669 | $75,890 |
| Income Deficit | 372 | $0 |
| Wage / Income Gap (%) | 1,470 | 24.22% |
| Wage / Income Gap ($) | 1,470 | 75.78¢ per $1 |
| Gini / Inequality Index | 1,470 | 0.53 |
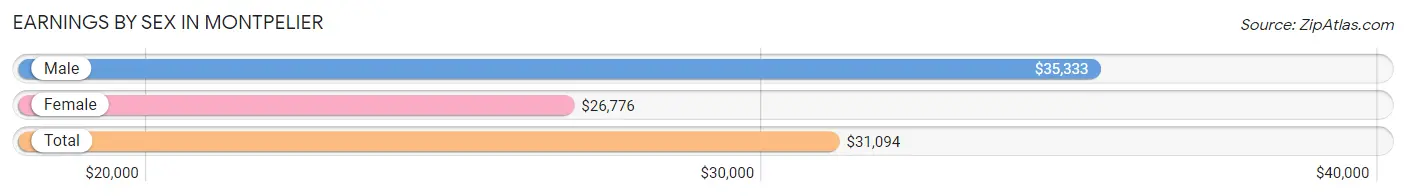
Earnings by Sex in Montpelier
Average Earnings in Montpelier are $31,094, $35,333 for men and $26,776 for women, a difference of 24.2%.
| Sex | Number | Average Earnings |
| Male | 450 (53.2%) | $35,333 |
| Female | 395 (46.8%) | $26,776 |
| Total | 845 (100.0%) | $31,094 |
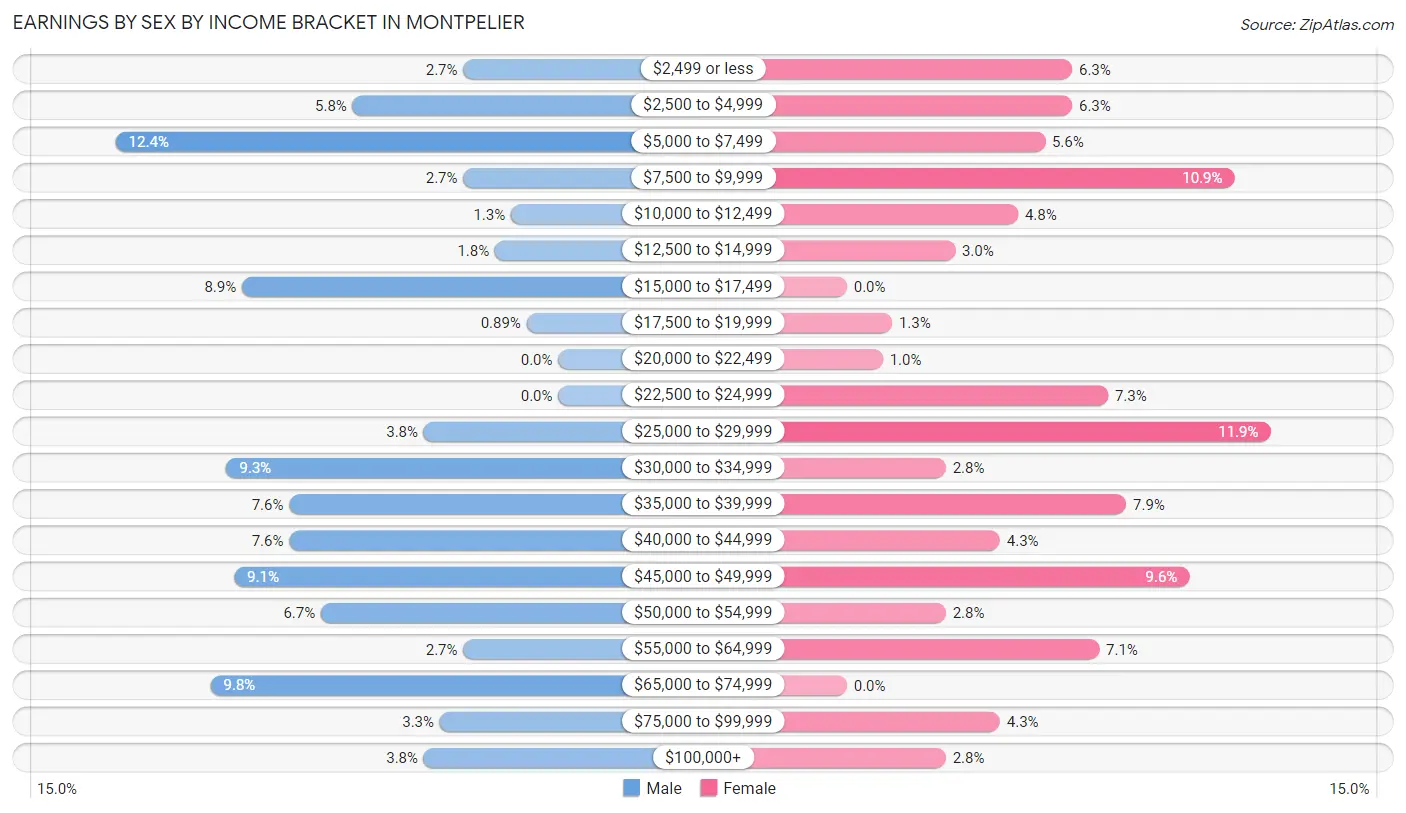
Earnings by Sex by Income Bracket in Montpelier
The most common earnings brackets in Montpelier are $5,000 to $7,499 for men (56 | 12.4%) and $25,000 to $29,999 for women (47 | 11.9%).
| Income | Male | Female |
| $2,499 or less | 12 (2.7%) | 25 (6.3%) |
| $2,500 to $4,999 | 26 (5.8%) | 25 (6.3%) |
| $5,000 to $7,499 | 56 (12.4%) | 22 (5.6%) |
| $7,500 to $9,999 | 12 (2.7%) | 43 (10.9%) |
| $10,000 to $12,499 | 6 (1.3%) | 19 (4.8%) |
| $12,500 to $14,999 | 8 (1.8%) | 12 (3.0%) |
| $15,000 to $17,499 | 40 (8.9%) | 0 (0.0%) |
| $17,500 to $19,999 | 4 (0.9%) | 5 (1.3%) |
| $20,000 to $22,499 | 0 (0.0%) | 4 (1.0%) |
| $22,500 to $24,999 | 0 (0.0%) | 29 (7.3%) |
| $25,000 to $29,999 | 17 (3.8%) | 47 (11.9%) |
| $30,000 to $34,999 | 42 (9.3%) | 11 (2.8%) |
| $35,000 to $39,999 | 34 (7.6%) | 31 (7.9%) |
| $40,000 to $44,999 | 34 (7.6%) | 17 (4.3%) |
| $45,000 to $49,999 | 41 (9.1%) | 38 (9.6%) |
| $50,000 to $54,999 | 30 (6.7%) | 11 (2.8%) |
| $55,000 to $64,999 | 12 (2.7%) | 28 (7.1%) |
| $65,000 to $74,999 | 44 (9.8%) | 0 (0.0%) |
| $75,000 to $99,999 | 15 (3.3%) | 17 (4.3%) |
| $100,000+ | 17 (3.8%) | 11 (2.8%) |
| Total | 450 (100.0%) | 395 (100.0%) |
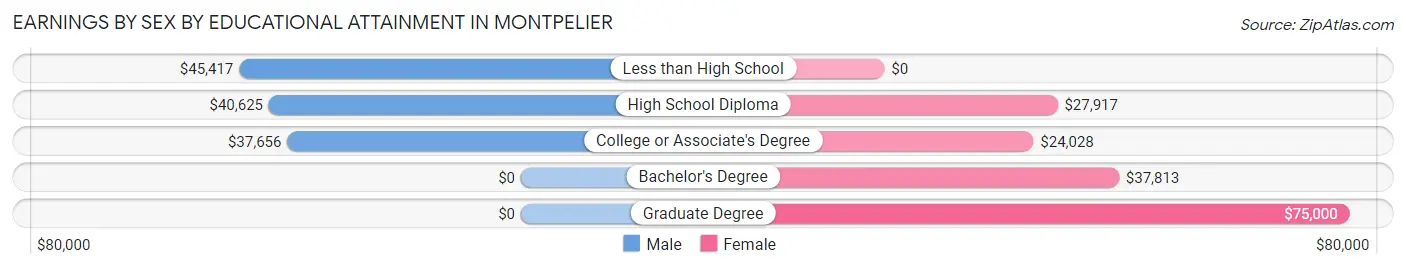
Earnings by Sex by Educational Attainment in Montpelier
Average earnings in Montpelier are $38,421 for men and $28,700 for women, a difference of 25.3%. Men with an educational attainment of less than high school enjoy the highest average annual earnings of $45,417, while those with college or associate's degree education earn the least with $37,656. Women with an educational attainment of graduate degree earn the most with the average annual earnings of $75,000, while those with college or associate's degree education have the smallest earnings of $24,028.
| Educational Attainment | Male Income | Female Income |
| Less than High School | $45,417 | $0 |
| High School Diploma | $40,625 | $27,917 |
| College or Associate's Degree | $37,656 | $24,028 |
| Bachelor's Degree | - | - |
| Graduate Degree | - | - |
| Total | $38,421 | $28,700 |
Family Income in Montpelier
Family Income Brackets in Montpelier
According to the Montpelier family income data, there are 94 families falling into the $50,000 to $74,999 income range, which is the most common income bracket and makes up 25.3% of all families. Conversely, the $10,000 to $14,999 income bracket is the least frequent group with only 5 families (1.3%) belonging to this category.
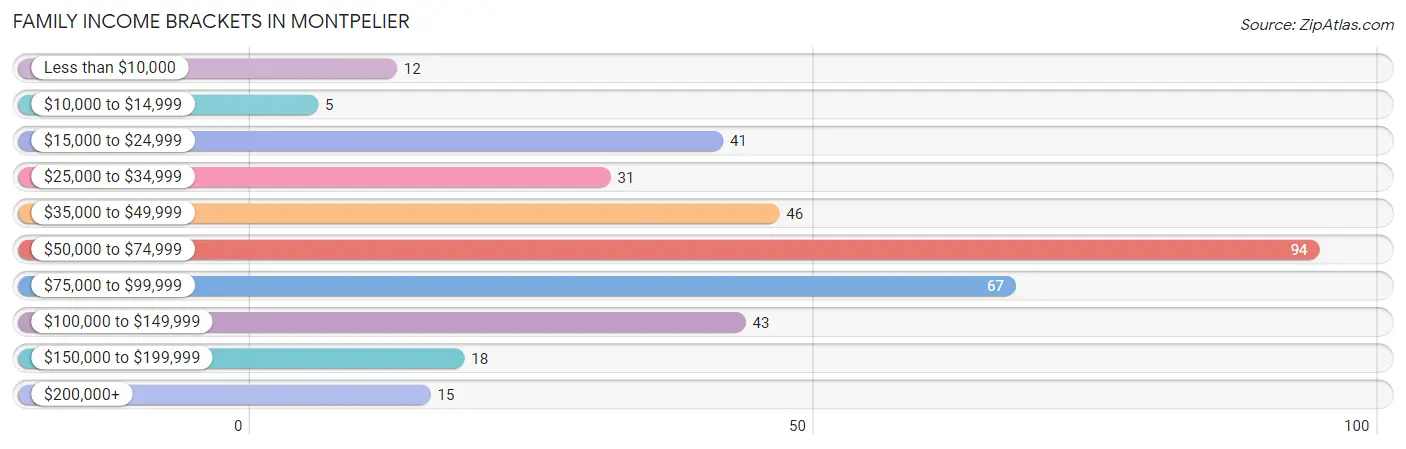
| Income Bracket | # Families | % Families |
| Less than $10,000 | 12 | 3.2% |
| $10,000 to $14,999 | 5 | 1.3% |
| $15,000 to $24,999 | 41 | 11.0% |
| $25,000 to $34,999 | 31 | 8.3% |
| $35,000 to $49,999 | 46 | 12.4% |
| $50,000 to $74,999 | 94 | 25.3% |
| $75,000 to $99,999 | 67 | 18.0% |
| $100,000 to $149,999 | 43 | 11.6% |
| $150,000 to $199,999 | 18 | 4.8% |
| $200,000+ | 15 | 4.0% |
Family Income by Famaliy Size in Montpelier
2-person families (185 | 49.7%) account for the highest median family income in Montpelier with $73,594 per family, while 2-person families (185 | 49.7%) have the highest median income of $36,797 per family member.
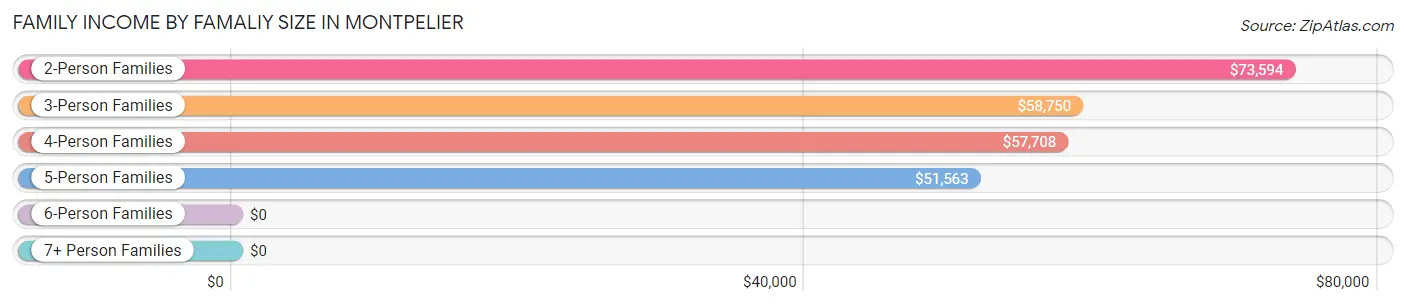
| Income Bracket | # Families | Median Income |
| 2-Person Families | 185 (49.7%) | $73,594 |
| 3-Person Families | 100 (26.9%) | $58,750 |
| 4-Person Families | 76 (20.4%) | $57,708 |
| 5-Person Families | 11 (3.0%) | $51,563 |
| 6-Person Families | 0 (0.0%) | $0 |
| 7+ Person Families | 0 (0.0%) | $0 |
| Total | 372 (100.0%) | $65,893 |
Family Income by Number of Earners in Montpelier
The median family income in Montpelier is $65,893, with families comprising 3+ earners (27) having the highest median family income of $108,750, while families with 1 earner (125) have the lowest median family income of $58,229, accounting for 7.3% and 33.6% of families, respectively.
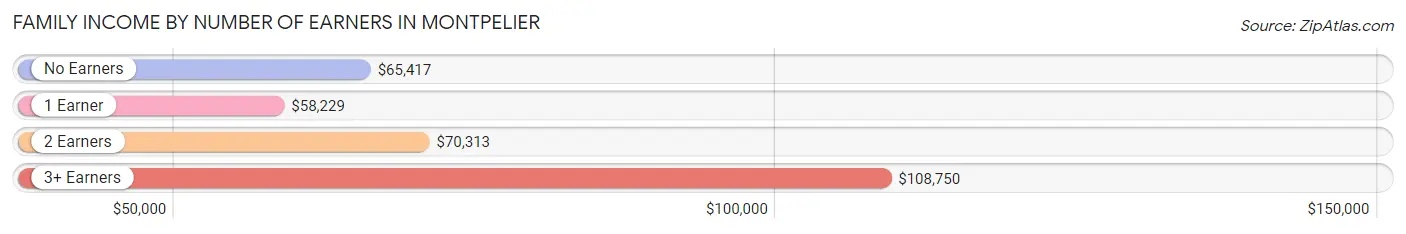
| Number of Earners | # Families | Median Income |
| No Earners | 33 (8.9%) | $65,417 |
| 1 Earner | 125 (33.6%) | $58,229 |
| 2 Earners | 187 (50.3%) | $70,313 |
| 3+ Earners | 27 (7.3%) | $108,750 |
| Total | 372 (100.0%) | $65,893 |
Household Income in Montpelier
Household Income Brackets in Montpelier
With 137 households falling in the category, the $50,000 to $74,999 income range is the most frequent in Montpelier, accounting for 20.5% of all households. In contrast, only 19 households (2.8%) fall into the $200,000+ income bracket, making it the least populous group.
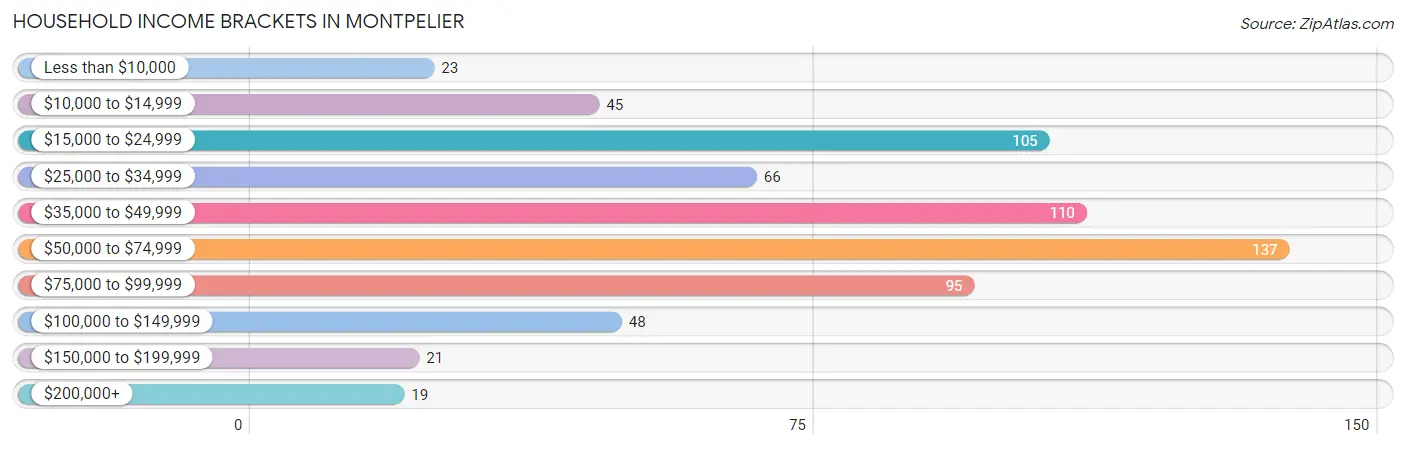
| Income Bracket | # Households | % Households |
| Less than $10,000 | 23 | 3.4% |
| $10,000 to $14,999 | 45 | 6.7% |
| $15,000 to $24,999 | 105 | 15.7% |
| $25,000 to $34,999 | 66 | 9.9% |
| $35,000 to $49,999 | 110 | 16.4% |
| $50,000 to $74,999 | 137 | 20.5% |
| $75,000 to $99,999 | 95 | 14.2% |
| $100,000 to $149,999 | 48 | 7.2% |
| $150,000 to $199,999 | 21 | 3.1% |
| $200,000+ | 19 | 2.8% |
Household Income by Householder Age in Montpelier
The median household income in Montpelier is $47,734, with the highest median household income of $61,250 found in the 25 to 44 years age bracket for the primary householder. A total of 120 households (17.9%) fall into this category. Meanwhile, the 65+ years age bracket for the primary householder has the lowest median household income of $40,398, with 271 households (40.5%) in this group.
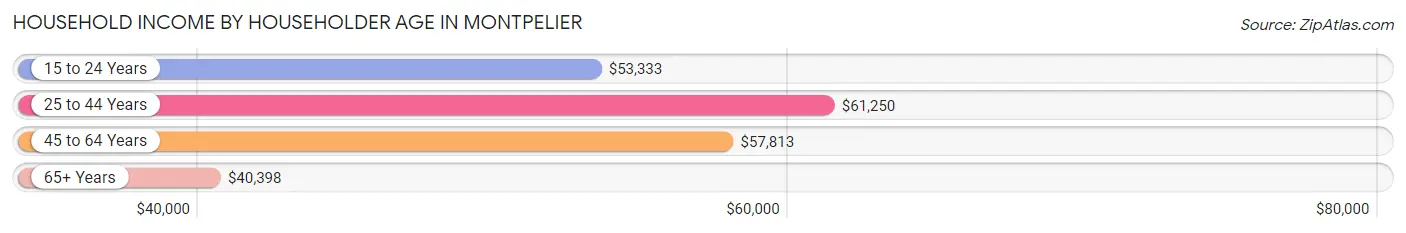
| Income Bracket | # Households | Median Income |
| 15 to 24 Years | 28 (4.2%) | $53,333 |
| 25 to 44 Years | 120 (17.9%) | $61,250 |
| 45 to 64 Years | 250 (37.4%) | $57,813 |
| 65+ Years | 271 (40.5%) | $40,398 |
| Total | 669 (100.0%) | $47,734 |
Poverty in Montpelier
Income Below Poverty by Sex and Age in Montpelier
With 21.7% poverty level for males and 22.8% for females among the residents of Montpelier, 5 year old males and 6 to 11 year old females are the most vulnerable to poverty, with 9 males (75.0%) and 29 females (78.4%) in their respective age groups living below the poverty level.
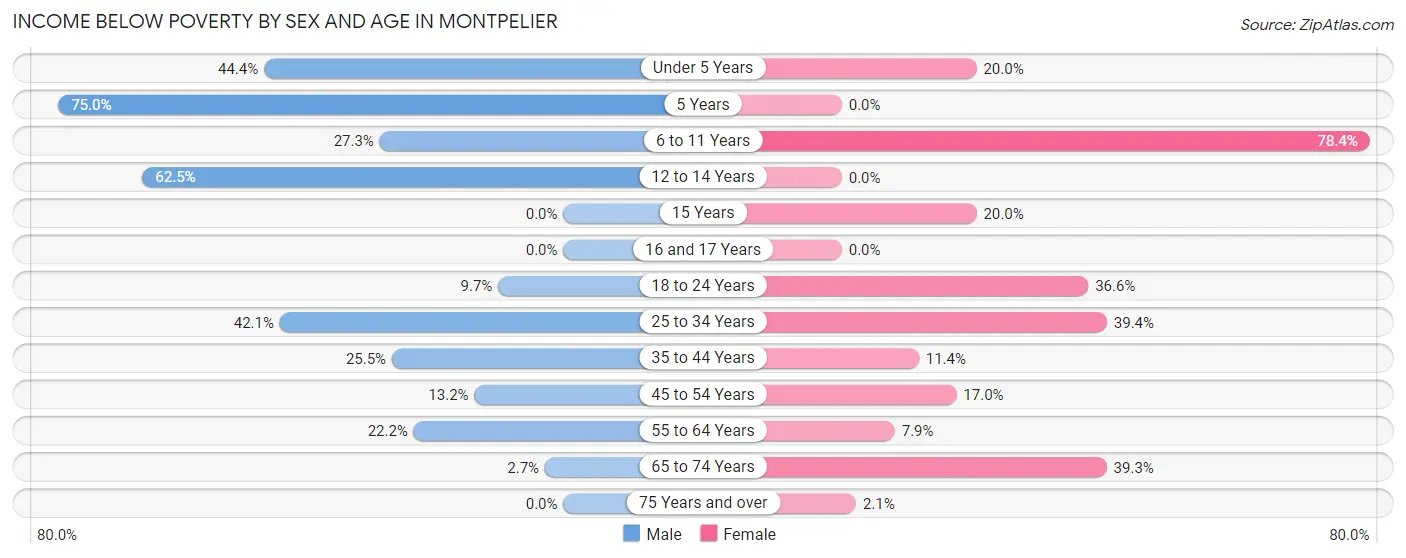
| Age Bracket | Male | Female |
| Under 5 Years | 20 (44.4%) | 3 (20.0%) |
| 5 Years | 9 (75.0%) | 0 (0.0%) |
| 6 to 11 Years | 12 (27.3%) | 29 (78.4%) |
| 12 to 14 Years | 20 (62.5%) | 0 (0.0%) |
| 15 Years | 0 (0.0%) | 4 (20.0%) |
| 16 and 17 Years | 0 (0.0%) | 0 (0.0%) |
| 18 to 24 Years | 6 (9.7%) | 15 (36.6%) |
| 25 to 34 Years | 40 (42.1%) | 37 (39.4%) |
| 35 to 44 Years | 14 (25.5%) | 8 (11.4%) |
| 45 to 54 Years | 14 (13.2%) | 24 (17.0%) |
| 55 to 64 Years | 22 (22.2%) | 10 (7.9%) |
| 65 to 74 Years | 3 (2.7%) | 35 (39.3%) |
| 75 Years and over | 0 (0.0%) | 2 (2.1%) |
| Total | 160 (21.7%) | 167 (22.8%) |
Income Above Poverty by Sex and Age in Montpelier
According to the poverty statistics in Montpelier, males aged 15 years and females aged 12 to 14 years are the age groups that are most secure financially, with 100.0% of males and 100.0% of females in these age groups living above the poverty line.
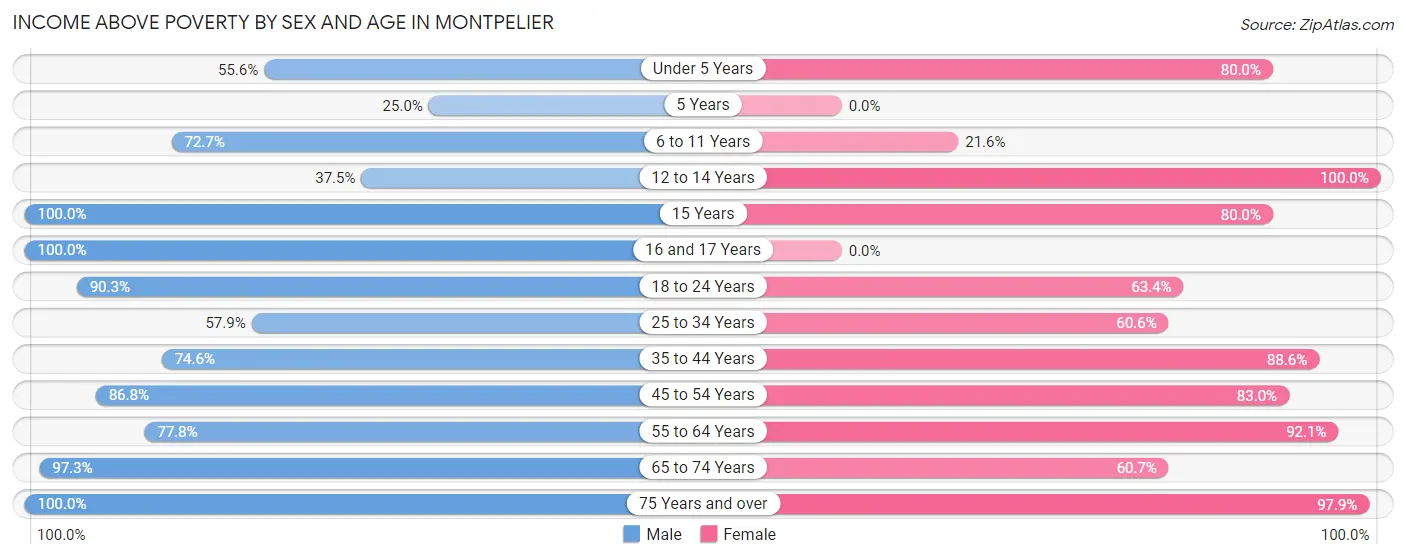
| Age Bracket | Male | Female |
| Under 5 Years | 25 (55.6%) | 12 (80.0%) |
| 5 Years | 3 (25.0%) | 0 (0.0%) |
| 6 to 11 Years | 32 (72.7%) | 8 (21.6%) |
| 12 to 14 Years | 12 (37.5%) | 5 (100.0%) |
| 15 Years | 10 (100.0%) | 16 (80.0%) |
| 16 and 17 Years | 14 (100.0%) | 0 (0.0%) |
| 18 to 24 Years | 56 (90.3%) | 26 (63.4%) |
| 25 to 34 Years | 55 (57.9%) | 57 (60.6%) |
| 35 to 44 Years | 41 (74.6%) | 62 (88.6%) |
| 45 to 54 Years | 92 (86.8%) | 117 (83.0%) |
| 55 to 64 Years | 77 (77.8%) | 117 (92.1%) |
| 65 to 74 Years | 107 (97.3%) | 54 (60.7%) |
| 75 Years and over | 52 (100.0%) | 93 (97.9%) |
| Total | 576 (78.3%) | 567 (77.2%) |
Income Below Poverty Among Married-Couple Families in Montpelier
The poverty statistics for married-couple families in Montpelier show that 5.7% or 14 of the total 245 families live below the poverty line. Families with 3 or 4 children have the highest poverty rate of 42.9%, comprising of 3 families. On the other hand, families with no children have the lowest poverty rate of 2.9%, which includes 5 families.
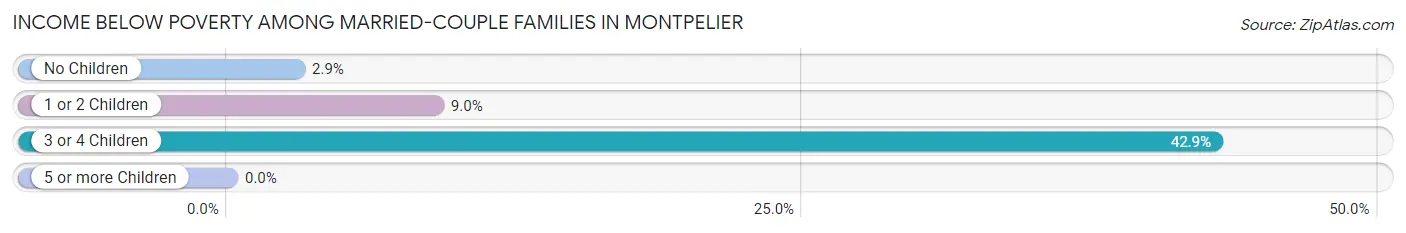
| Children | Above Poverty | Below Poverty |
| No Children | 166 (97.1%) | 5 (2.9%) |
| 1 or 2 Children | 61 (91.0%) | 6 (9.0%) |
| 3 or 4 Children | 4 (57.1%) | 3 (42.9%) |
| 5 or more Children | 0 (0.0%) | 0 (0.0%) |
| Total | 231 (94.3%) | 14 (5.7%) |
Income Below Poverty Among Single-Parent Households in Montpelier
According to the poverty data in Montpelier, 28.9% or 11 single-father households and 43.8% or 39 single-mother households are living below the poverty line. Among single-father households, those with 1 or 2 children have the highest poverty rate, with 11 households (47.8%) experiencing poverty. Likewise, among single-mother households, those with 1 or 2 children have the highest poverty rate, with 39 households (76.5%) falling below the poverty line.
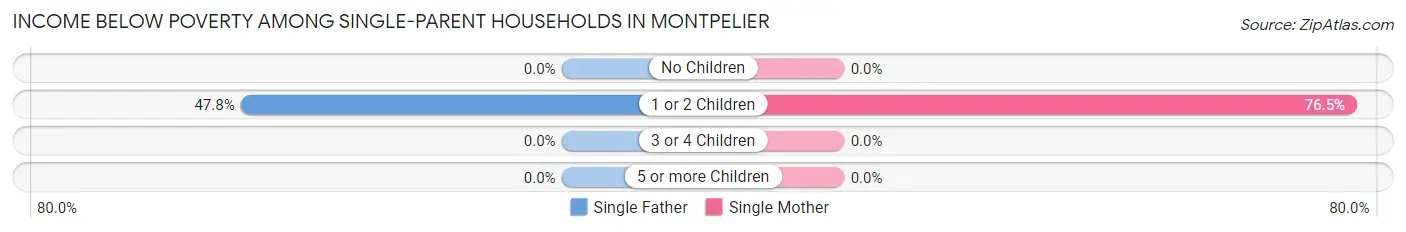
| Children | Single Father | Single Mother |
| No Children | 0 (0.0%) | 0 (0.0%) |
| 1 or 2 Children | 11 (47.8%) | 39 (76.5%) |
| 3 or 4 Children | 0 (0.0%) | 0 (0.0%) |
| 5 or more Children | 0 (0.0%) | 0 (0.0%) |
| Total | 11 (28.9%) | 39 (43.8%) |
Income Below Poverty Among Married-Couple vs Single-Parent Households in Montpelier
The poverty data for Montpelier shows that 14 of the married-couple family households (5.7%) and 50 of the single-parent households (39.4%) are living below the poverty level. Within the married-couple family households, those with 3 or 4 children have the highest poverty rate, with 3 households (42.9%) falling below the poverty line. Among the single-parent households, those with 1 or 2 children have the highest poverty rate, with 50 household (67.6%) living below poverty.
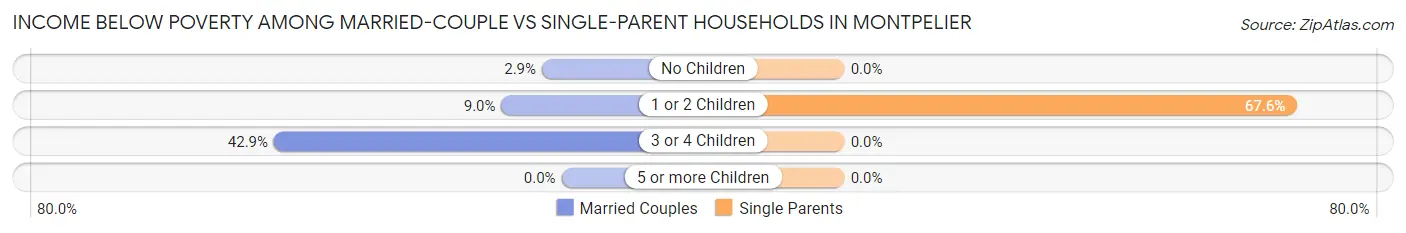
| Children | Married-Couple Families | Single-Parent Households |
| No Children | 5 (2.9%) | 0 (0.0%) |
| 1 or 2 Children | 6 (9.0%) | 50 (67.6%) |
| 3 or 4 Children | 3 (42.9%) | 0 (0.0%) |
| 5 or more Children | 0 (0.0%) | 0 (0.0%) |
| Total | 14 (5.7%) | 50 (39.4%) |
Race in Montpelier
The most populous races in Montpelier are White / Caucasian (1,403 | 95.4%), Two or more Races (34 | 2.3%), and Hispanic or Latino (26 | 1.8%).
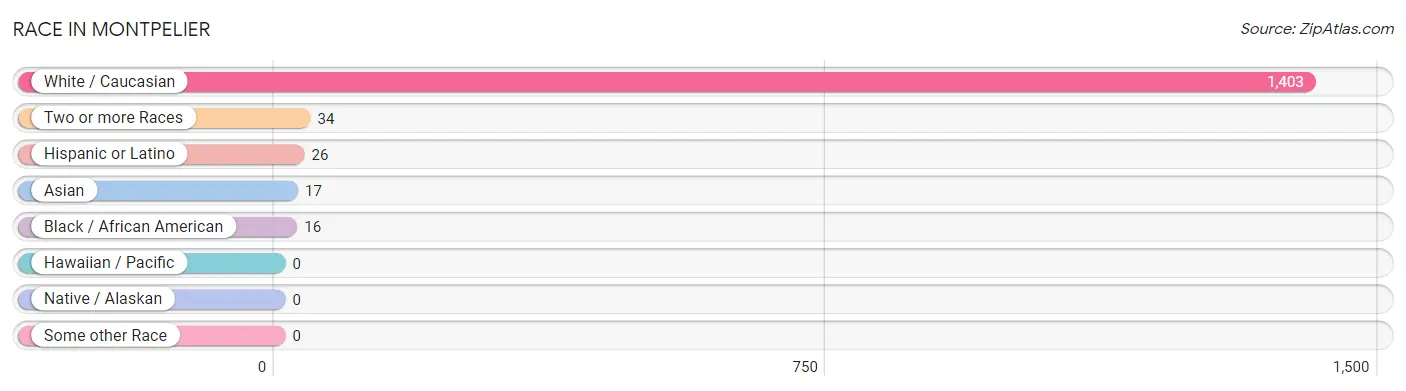
| Race | # Population | % Population |
| Asian | 17 | 1.2% |
| Black / African American | 16 | 1.1% |
| Hawaiian / Pacific | 0 | 0.0% |
| Hispanic or Latino | 26 | 1.8% |
| Native / Alaskan | 0 | 0.0% |
| White / Caucasian | 1,403 | 95.4% |
| Two or more Races | 34 | 2.3% |
| Some other Race | 0 | 0.0% |
| Total | 1,470 | 100.0% |
Ancestry in Montpelier
The most populous ancestries reported in Montpelier are Irish (230 | 15.7%), German (219 | 14.9%), American (210 | 14.3%), English (164 | 11.2%), and Dutch (37 | 2.5%), together accounting for 58.5% of all Montpelier residents.
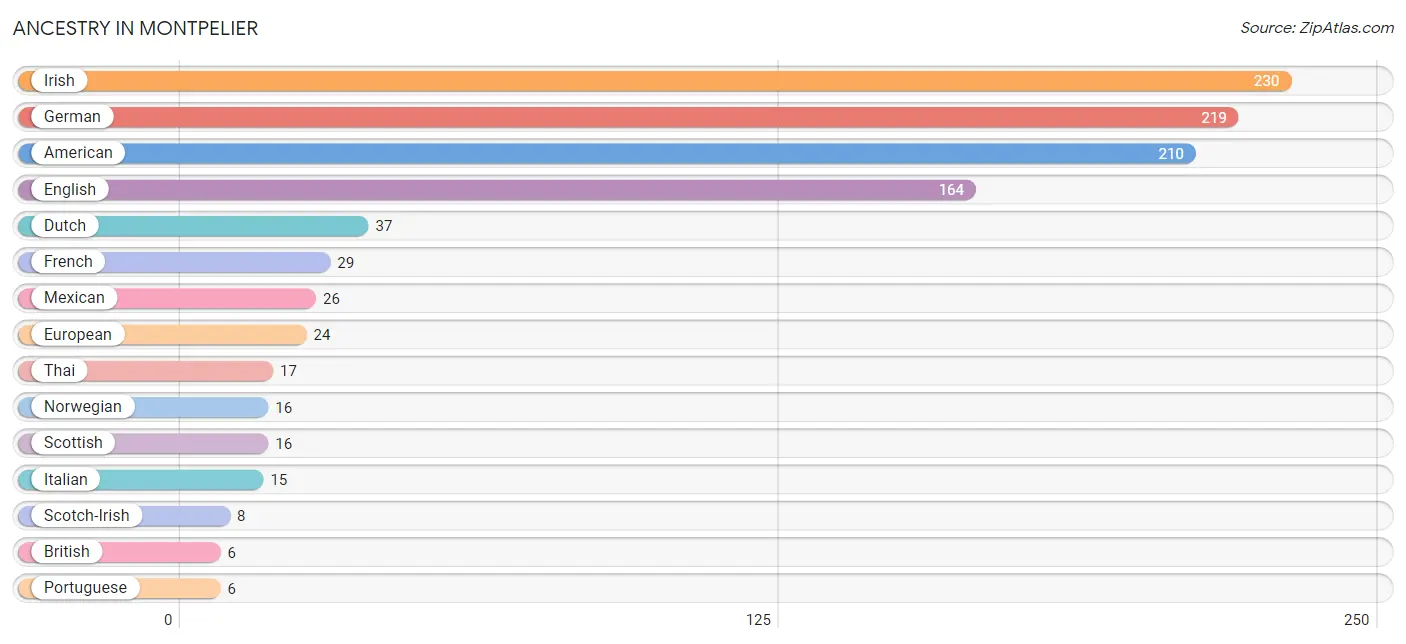
| Ancestry | # Population | % Population |
| American | 210 | 14.3% |
| British | 6 | 0.4% |
| Cherokee | 4 | 0.3% |
| Dutch | 37 | 2.5% |
| English | 164 | 11.2% |
| European | 24 | 1.6% |
| French | 29 | 2.0% |
| German | 219 | 14.9% |
| Irish | 230 | 15.7% |
| Italian | 15 | 1.0% |
| Mexican | 26 | 1.8% |
| Norwegian | 16 | 1.1% |
| Portuguese | 6 | 0.4% |
| Scotch-Irish | 8 | 0.5% |
| Scottish | 16 | 1.1% |
| Thai | 17 | 1.2% | View All 16 Rows |
Immigrants in Montpelier
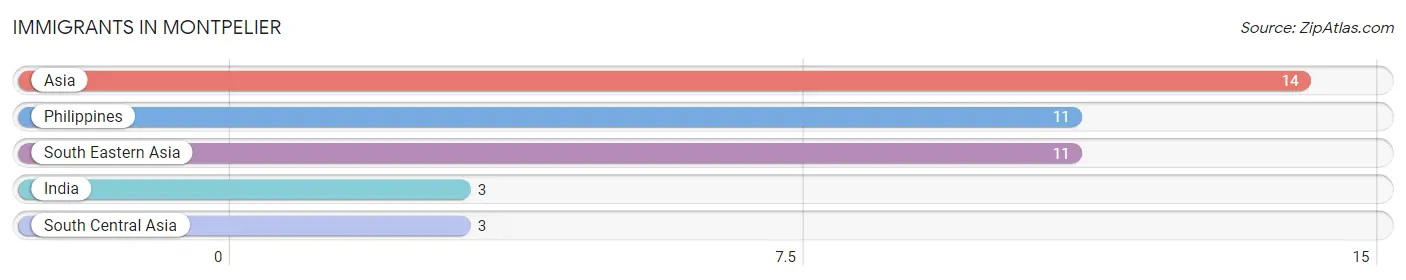
The most numerous immigrant groups reported in Montpelier came from Asia (14 | 0.9%), Philippines (11 | 0.7%), South Eastern Asia (11 | 0.7%), India (3 | 0.2%), and South Central Asia (3 | 0.2%), together accounting for 2.9% of all Montpelier residents.
| Immigration Origin | # Population | % Population |
| Asia | 14 | 0.9% |
| India | 3 | 0.2% |
| Philippines | 11 | 0.7% |
| South Central Asia | 3 | 0.2% |
| South Eastern Asia | 11 | 0.7% | View All 5 Rows |
Sex and Age in Montpelier
Sex and Age in Montpelier
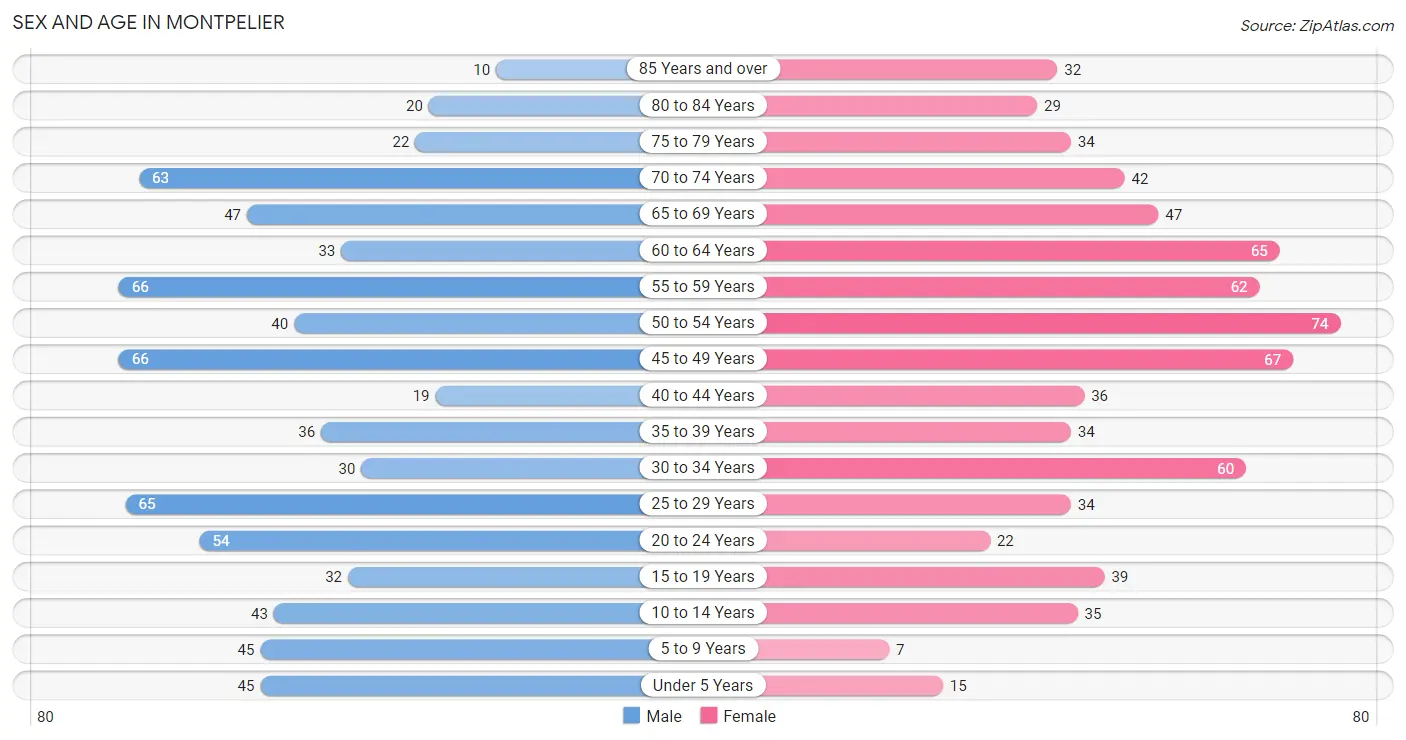
The most populous age groups in Montpelier are 45 to 49 Years (66 | 9.0%) for men and 50 to 54 Years (74 | 10.1%) for women.
| Age Bracket | Male | Female |
| Under 5 Years | 45 (6.1%) | 15 (2.0%) |
| 5 to 9 Years | 45 (6.1%) | 7 (0.9%) |
| 10 to 14 Years | 43 (5.8%) | 35 (4.8%) |
| 15 to 19 Years | 32 (4.3%) | 39 (5.3%) |
| 20 to 24 Years | 54 (7.3%) | 22 (3.0%) |
| 25 to 29 Years | 65 (8.8%) | 34 (4.6%) |
| 30 to 34 Years | 30 (4.1%) | 60 (8.2%) |
| 35 to 39 Years | 36 (4.9%) | 34 (4.6%) |
| 40 to 44 Years | 19 (2.6%) | 36 (4.9%) |
| 45 to 49 Years | 66 (9.0%) | 67 (9.1%) |
| 50 to 54 Years | 40 (5.4%) | 74 (10.1%) |
| 55 to 59 Years | 66 (9.0%) | 62 (8.5%) |
| 60 to 64 Years | 33 (4.5%) | 65 (8.9%) |
| 65 to 69 Years | 47 (6.4%) | 47 (6.4%) |
| 70 to 74 Years | 63 (8.6%) | 42 (5.7%) |
| 75 to 79 Years | 22 (3.0%) | 34 (4.6%) |
| 80 to 84 Years | 20 (2.7%) | 29 (4.0%) |
| 85 Years and over | 10 (1.4%) | 32 (4.4%) |
| Total | 736 (100.0%) | 734 (100.0%) |
Families and Households in Montpelier
Median Family Size in Montpelier
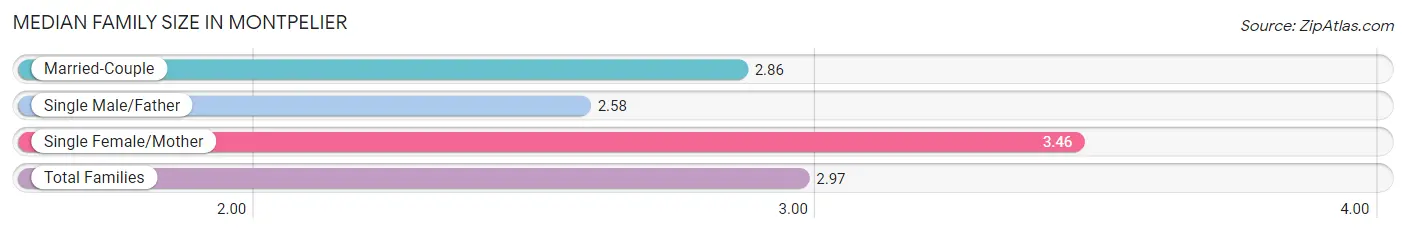
The median family size in Montpelier is 2.97 persons per family, with single female/mother families (89 | 23.9%) accounting for the largest median family size of 3.46 persons per family. On the other hand, single male/father families (38 | 10.2%) represent the smallest median family size with 2.58 persons per family.
| Family Type | # Families | Family Size |
| Married-Couple | 245 (65.9%) | 2.86 |
| Single Male/Father | 38 (10.2%) | 2.58 |
| Single Female/Mother | 89 (23.9%) | 3.46 |
| Total Families | 372 (100.0%) | 2.97 |
Median Household Size in Montpelier
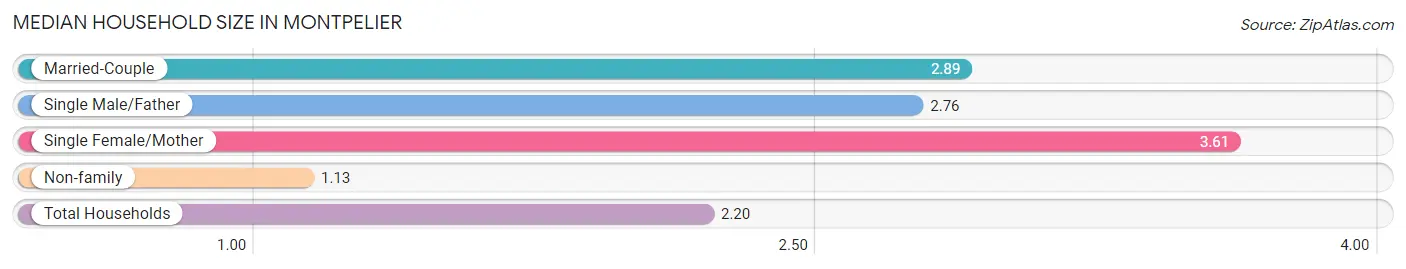
The median household size in Montpelier is 2.20 persons per household, with single female/mother households (89 | 13.3%) accounting for the largest median household size of 3.61 persons per household. non-family households (297 | 44.4%) represent the smallest median household size with 1.13 persons per household.
| Household Type | # Households | Household Size |
| Married-Couple | 245 (36.6%) | 2.89 |
| Single Male/Father | 38 (5.7%) | 2.76 |
| Single Female/Mother | 89 (13.3%) | 3.61 |
| Non-family | 297 (44.4%) | 1.13 |
| Total Households | 669 (100.0%) | 2.20 |
Household Size by Marriage Status in Montpelier
Out of a total of 669 households in Montpelier, 372 (55.6%) are family households, while 297 (44.4%) are nonfamily households. The most numerous type of family households are 2-person households, comprising 165, and the most common type of nonfamily households are 1-person households, comprising 255.
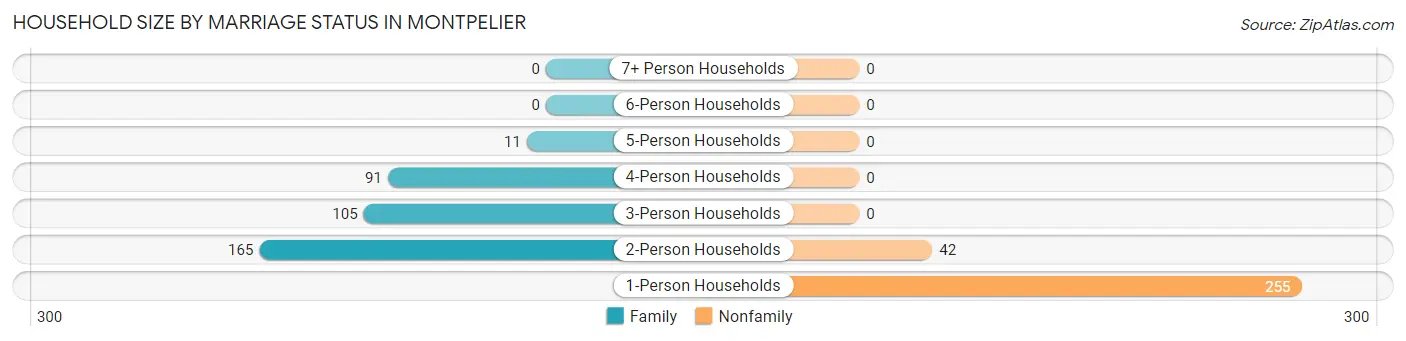
| Household Size | Family Households | Nonfamily Households |
| 1-Person Households | - | 255 (38.1%) |
| 2-Person Households | 165 (24.7%) | 42 (6.3%) |
| 3-Person Households | 105 (15.7%) | 0 (0.0%) |
| 4-Person Households | 91 (13.6%) | 0 (0.0%) |
| 5-Person Households | 11 (1.6%) | 0 (0.0%) |
| 6-Person Households | 0 (0.0%) | 0 (0.0%) |
| 7+ Person Households | 0 (0.0%) | 0 (0.0%) |
| Total | 372 (55.6%) | 297 (44.4%) |
Female Fertility in Montpelier
Fertility by Age in Montpelier
Average fertility rate in Montpelier is 17.0 births per 1,000 women. Women in the age bracket of 20 to 34 years have the highest fertility rate with 43.0 births per 1,000 women. Women in the age bracket of 20 to 34 years acount for 100.0% of all women with births.
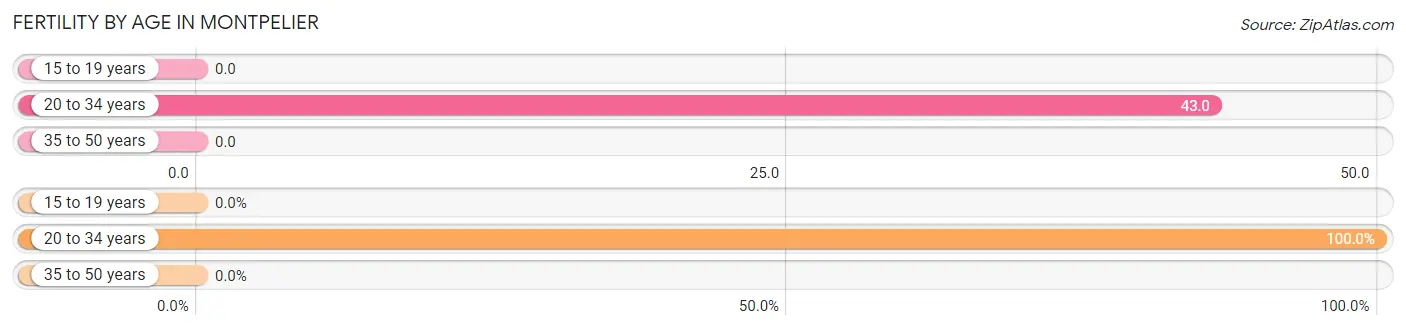
| Age Bracket | Women with Births | Births / 1,000 Women |
| 15 to 19 years | 0 (0.0%) | 0.0 |
| 20 to 34 years | 5 (100.0%) | 43.0 |
| 35 to 50 years | 0 (0.0%) | 0.0 |
| Total | 5 (100.0%) | 17.0 |
Fertility by Age by Marriage Status in Montpelier
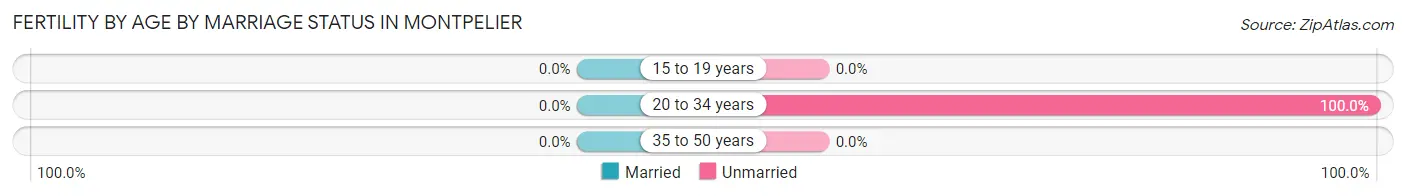
| Age Bracket | Married | Unmarried |
| 15 to 19 years | 0 (0.0%) | 0 (0.0%) |
| 20 to 34 years | 0 (0.0%) | 5 (100.0%) |
| 35 to 50 years | 0 (0.0%) | 0 (0.0%) |
| Total | 0 (0.0%) | 5 (100.0%) |
Fertility by Education in Montpelier
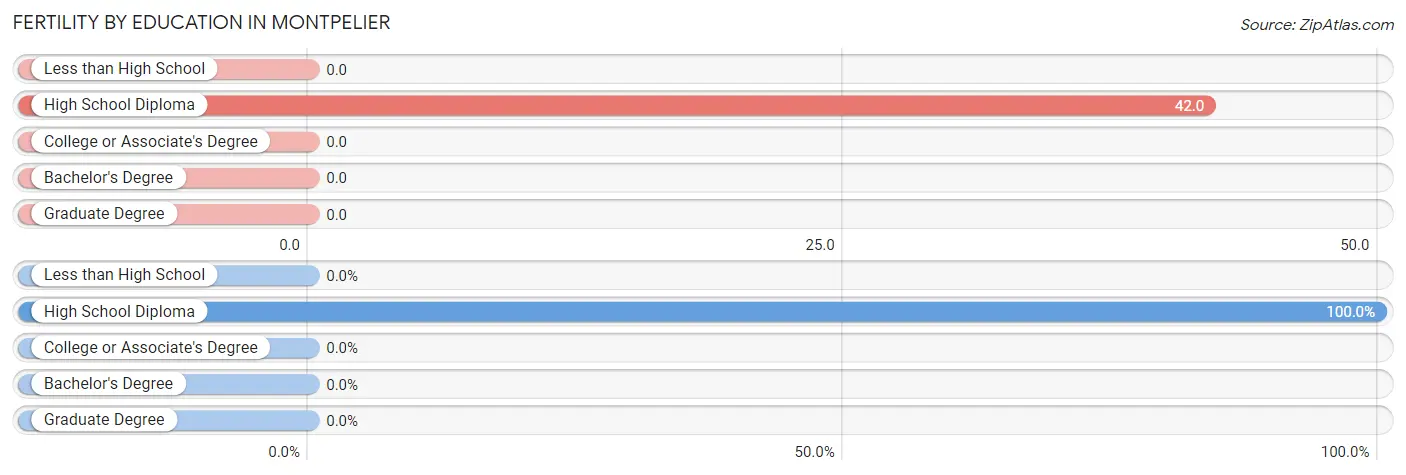
| Educational Attainment | Women with Births | Births / 1,000 Women |
| Less than High School | 0 (0.0%) | 0.0 |
| High School Diploma | 5 (100.0%) | 42.0 |
| College or Associate's Degree | 0 (0.0%) | 0.0 |
| Bachelor's Degree | 0 (0.0%) | 0.0 |
| Graduate Degree | 0 (0.0%) | 0.0 |
| Total | 5 (100.0%) | 17.0 |
Fertility by Education by Marriage Status in Montpelier
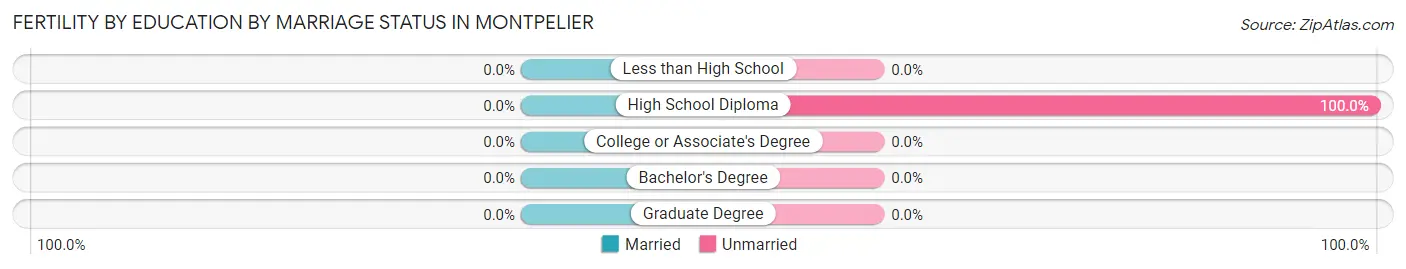
| Educational Attainment | Married | Unmarried |
| Less than High School | 0 (0.0%) | 0 (0.0%) |
| High School Diploma | 0 (0.0%) | 5 (100.0%) |
| College or Associate's Degree | 0 (0.0%) | 0 (0.0%) |
| Bachelor's Degree | 0 (0.0%) | 0 (0.0%) |
| Graduate Degree | 0 (0.0%) | 0 (0.0%) |
| Total | 0 (0.0%) | 5 (100.0%) |
Employment Characteristics in Montpelier
Employment by Class of Employer in Montpelier
Among the 779 employed individuals in Montpelier, private company employees (626 | 80.4%), local government employees (49 | 6.3%), and self-employed (not incorporated) (39 | 5.0%) make up the most common classes of employment.
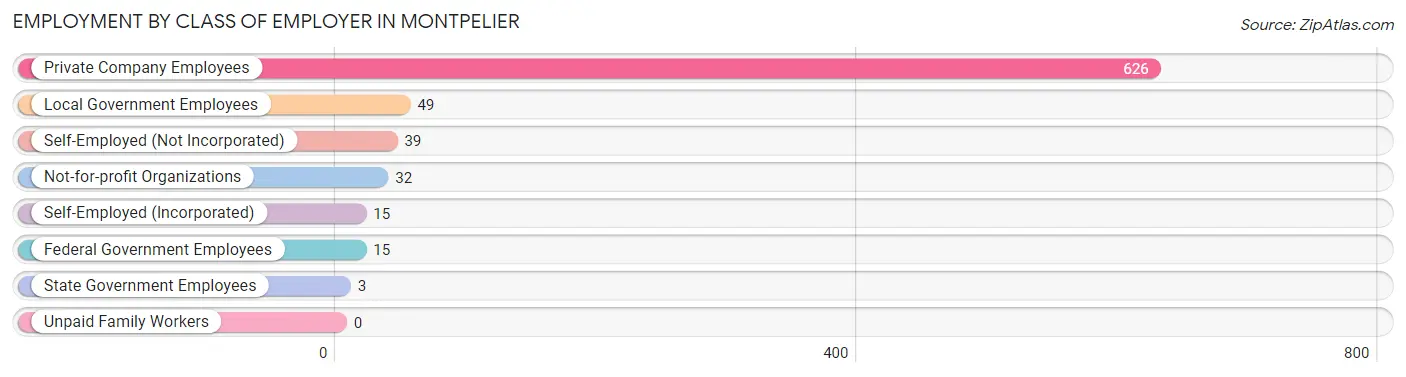
| Employer Class | # Employees | % Employees |
| Private Company Employees | 626 | 80.4% |
| Self-Employed (Incorporated) | 15 | 1.9% |
| Self-Employed (Not Incorporated) | 39 | 5.0% |
| Not-for-profit Organizations | 32 | 4.1% |
| Local Government Employees | 49 | 6.3% |
| State Government Employees | 3 | 0.4% |
| Federal Government Employees | 15 | 1.9% |
| Unpaid Family Workers | 0 | 0.0% |
| Total | 779 | 100.0% |
Employment Status by Age in Montpelier
According to the labor force statistics for Montpelier, out of the total population over 16 years of age (1,250), 65.7% or 821 individuals are in the labor force, with 5.1% or 42 of them unemployed. The age group with the highest labor force participation rate is 25 to 29 years, with 100.0% or 99 individuals in the labor force. Within the labor force, the 16 to 19 years age range has the highest percentage of unemployed individuals, with 40.5% or 15 of them being unemployed.
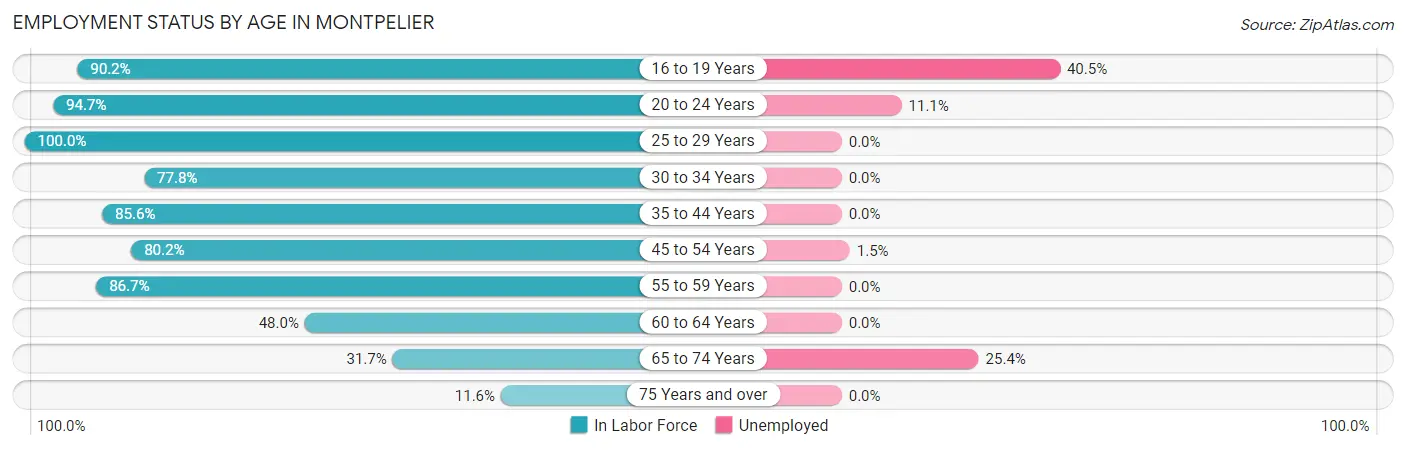
| Age Bracket | In Labor Force | Unemployed |
| 16 to 19 Years | 37 (90.2%) | 15 (40.5%) |
| 20 to 24 Years | 72 (94.7%) | 8 (11.1%) |
| 25 to 29 Years | 99 (100.0%) | 0 (0.0%) |
| 30 to 34 Years | 70 (77.8%) | 0 (0.0%) |
| 35 to 44 Years | 107 (85.6%) | 0 (0.0%) |
| 45 to 54 Years | 198 (80.2%) | 3 (1.5%) |
| 55 to 59 Years | 111 (86.7%) | 0 (0.0%) |
| 60 to 64 Years | 47 (48.0%) | 0 (0.0%) |
| 65 to 74 Years | 63 (31.7%) | 16 (25.4%) |
| 75 Years and over | 17 (11.6%) | 0 (0.0%) |
| Total | 821 (65.7%) | 42 (5.1%) |
Employment Status by Educational Attainment in Montpelier
According to labor force statistics for Montpelier, 80.3% of individuals (632) out of the total population between 25 and 64 years of age (787) are in the labor force, with 0.5% or 3 of them being unemployed. The group with the highest labor force participation rate are those with the educational attainment of college / associate degree, with 90.3% or 278 individuals in the labor force. Within the labor force, individuals with high school diploma education have the highest percentage of unemployment, with 1.1% or 3 of them being unemployed.
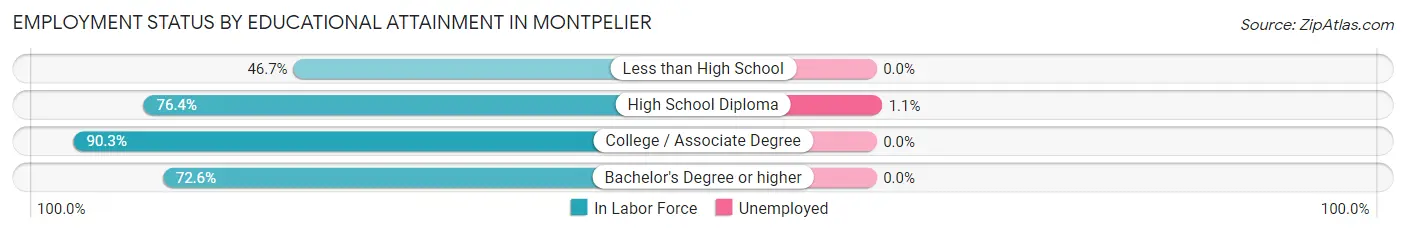
| Educational Attainment | In Labor Force | Unemployed |
| Less than High School | 14 (46.7%) | 0 (0.0%) |
| High School Diploma | 279 (76.4%) | 4 (1.1%) |
| College / Associate Degree | 278 (90.3%) | 0 (0.0%) |
| Bachelor's Degree or higher | 61 (72.6%) | 0 (0.0%) |
| Total | 632 (80.3%) | 4 (0.5%) |
Employment Occupations by Sex in Montpelier
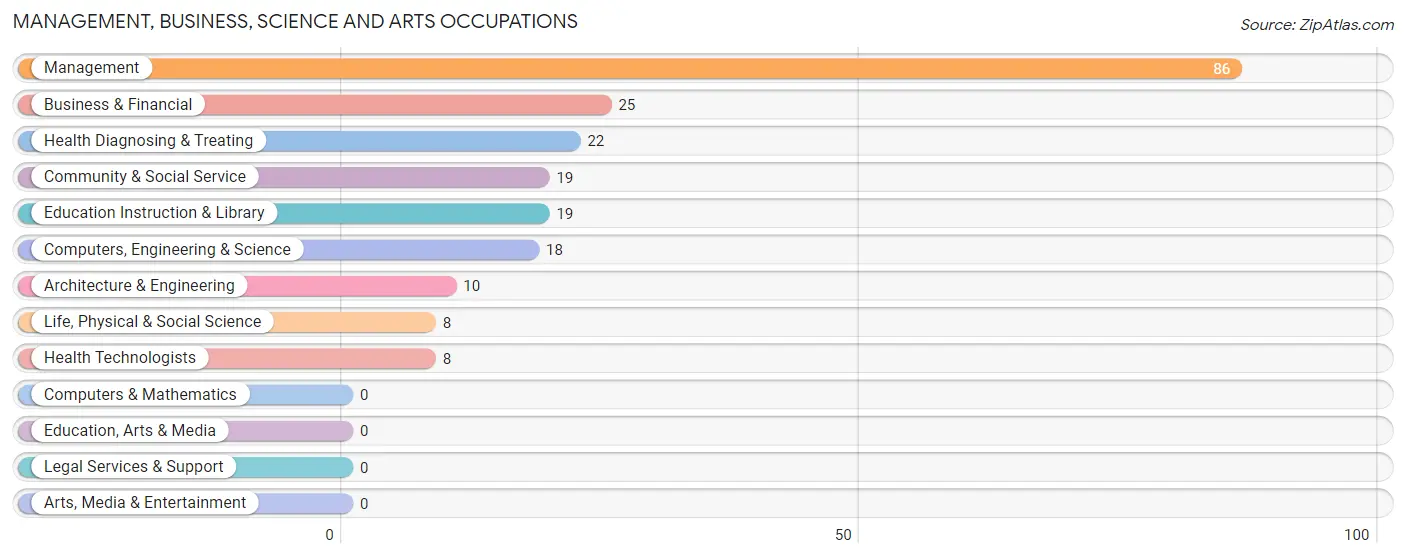
Management, Business, Science and Arts Occupations
The most common Management, Business, Science and Arts occupations in Montpelier are Management (86 | 11.0%), Business & Financial (25 | 3.2%), Health Diagnosing & Treating (22 | 2.8%), Community & Social Service (19 | 2.4%), and Education Instruction & Library (19 | 2.4%).
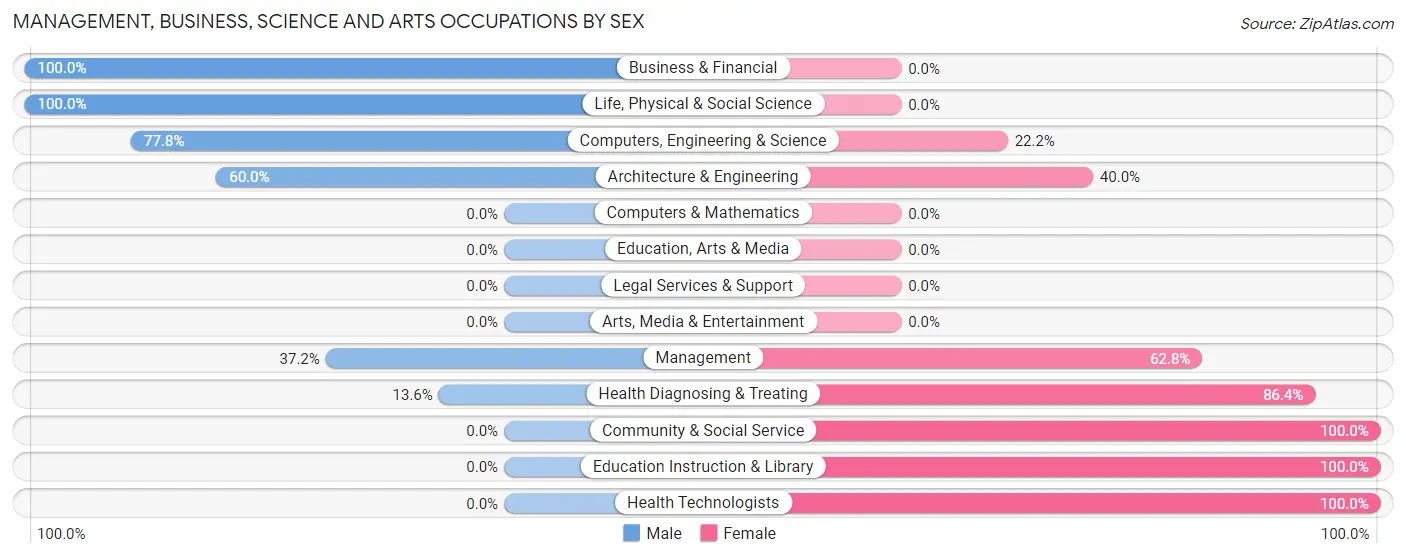
Management, Business, Science and Arts Occupations by Sex
Within the Management, Business, Science and Arts occupations in Montpelier, the most male-oriented occupations are Business & Financial (100.0%), Life, Physical & Social Science (100.0%), and Computers, Engineering & Science (77.8%), while the most female-oriented occupations are Community & Social Service (100.0%), Education Instruction & Library (100.0%), and Health Technologists (100.0%).
| Occupation | Male | Female |
| Management | 32 (37.2%) | 54 (62.8%) |
| Business & Financial | 25 (100.0%) | 0 (0.0%) |
| Computers, Engineering & Science | 14 (77.8%) | 4 (22.2%) |
| Computers & Mathematics | 0 (0.0%) | 0 (0.0%) |
| Architecture & Engineering | 6 (60.0%) | 4 (40.0%) |
| Life, Physical & Social Science | 8 (100.0%) | 0 (0.0%) |
| Community & Social Service | 0 (0.0%) | 19 (100.0%) |
| Education, Arts & Media | 0 (0.0%) | 0 (0.0%) |
| Legal Services & Support | 0 (0.0%) | 0 (0.0%) |
| Education Instruction & Library | 0 (0.0%) | 19 (100.0%) |
| Arts, Media & Entertainment | 0 (0.0%) | 0 (0.0%) |
| Health Diagnosing & Treating | 3 (13.6%) | 19 (86.4%) |
| Health Technologists | 0 (0.0%) | 8 (100.0%) |
| Total (Category) | 74 (43.5%) | 96 (56.5%) |
| Total (Overall) | 418 (53.7%) | 361 (46.3%) |
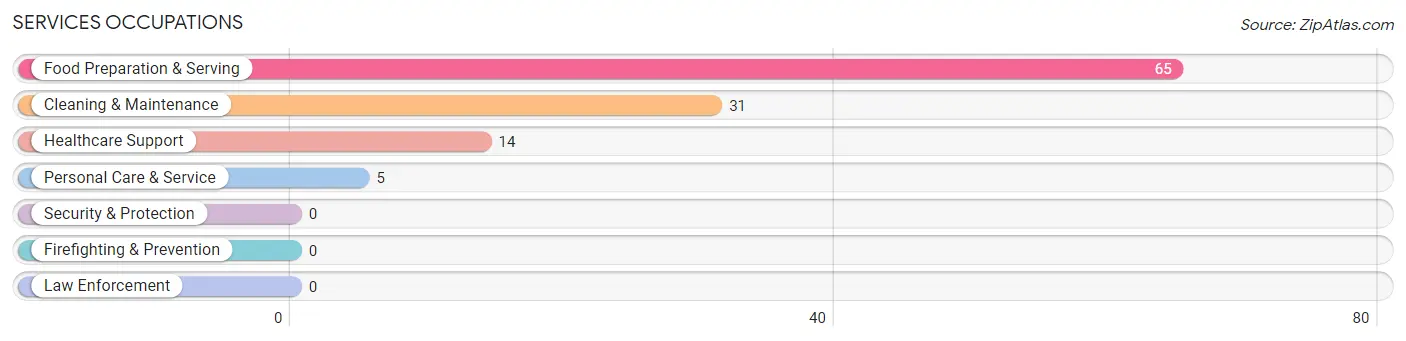
Services Occupations
The most common Services occupations in Montpelier are Food Preparation & Serving (65 | 8.3%), Cleaning & Maintenance (31 | 4.0%), Healthcare Support (14 | 1.8%), and Personal Care & Service (5 | 0.6%).
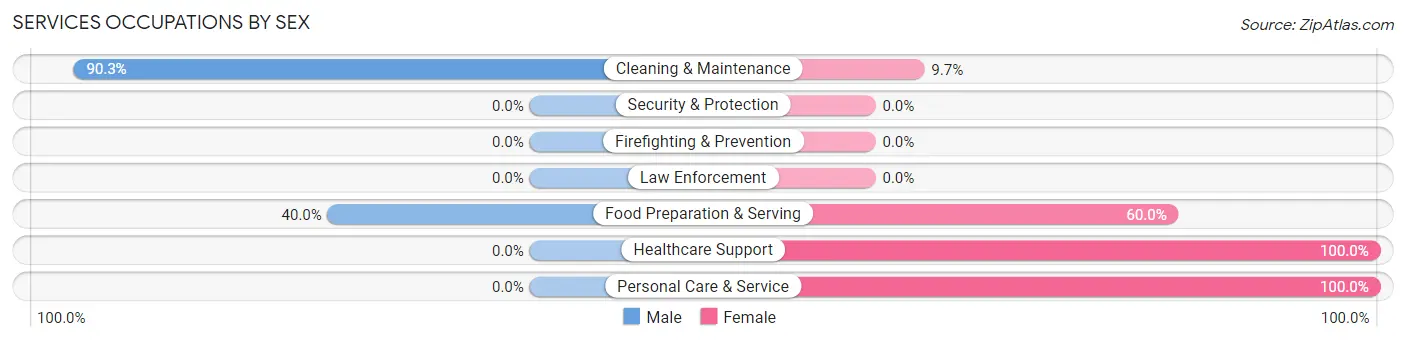
Services Occupations by Sex
Within the Services occupations in Montpelier, the most male-oriented occupations are Cleaning & Maintenance (90.3%), and Food Preparation & Serving (40.0%), while the most female-oriented occupations are Healthcare Support (100.0%), Personal Care & Service (100.0%), and Food Preparation & Serving (60.0%).
| Occupation | Male | Female |
| Healthcare Support | 0 (0.0%) | 14 (100.0%) |
| Security & Protection | 0 (0.0%) | 0 (0.0%) |
| Firefighting & Prevention | 0 (0.0%) | 0 (0.0%) |
| Law Enforcement | 0 (0.0%) | 0 (0.0%) |
| Food Preparation & Serving | 26 (40.0%) | 39 (60.0%) |
| Cleaning & Maintenance | 28 (90.3%) | 3 (9.7%) |
| Personal Care & Service | 0 (0.0%) | 5 (100.0%) |
| Total (Category) | 54 (47.0%) | 61 (53.0%) |
| Total (Overall) | 418 (53.7%) | 361 (46.3%) |
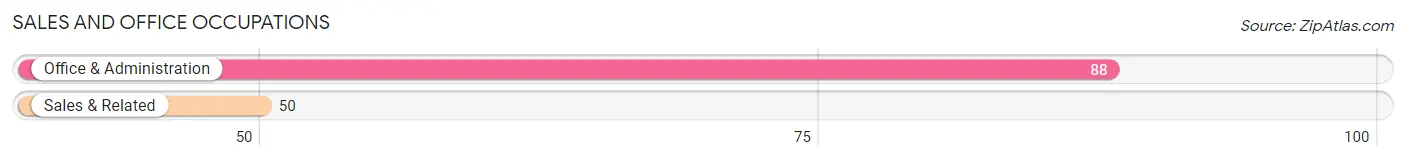
Sales and Office Occupations
The most common Sales and Office occupations in Montpelier are Office & Administration (88 | 11.3%), and Sales & Related (50 | 6.4%).
Sales and Office Occupations by Sex
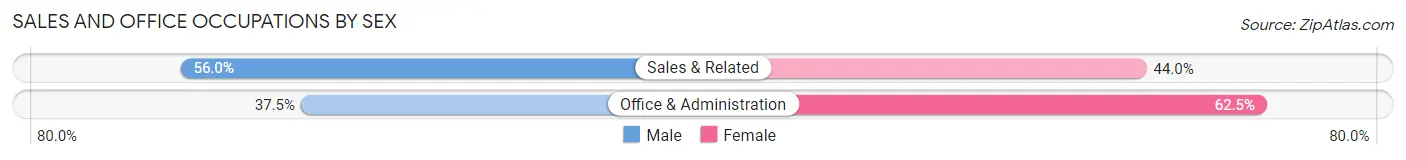
| Occupation | Male | Female |
| Sales & Related | 28 (56.0%) | 22 (44.0%) |
| Office & Administration | 33 (37.5%) | 55 (62.5%) |
| Total (Category) | 61 (44.2%) | 77 (55.8%) |
| Total (Overall) | 418 (53.7%) | 361 (46.3%) |
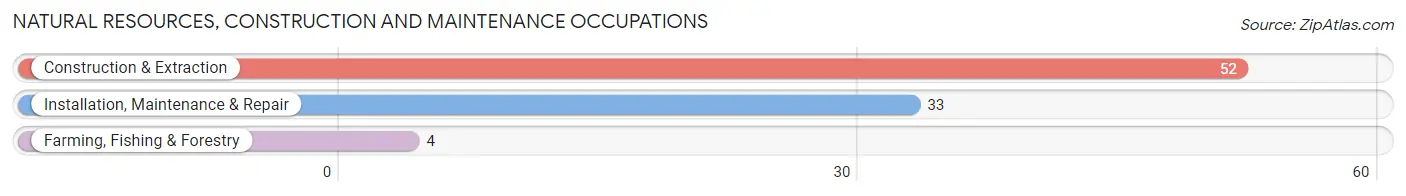
Natural Resources, Construction and Maintenance Occupations
The most common Natural Resources, Construction and Maintenance occupations in Montpelier are Construction & Extraction (52 | 6.7%), Installation, Maintenance & Repair (33 | 4.2%), and Farming, Fishing & Forestry (4 | 0.5%).
Natural Resources, Construction and Maintenance Occupations by Sex
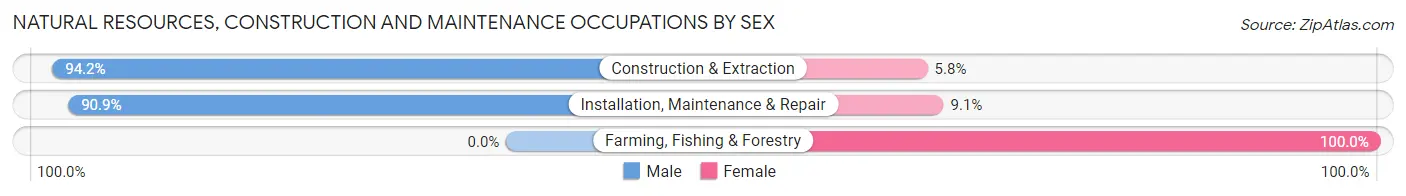
| Occupation | Male | Female |
| Farming, Fishing & Forestry | 0 (0.0%) | 4 (100.0%) |
| Construction & Extraction | 49 (94.2%) | 3 (5.8%) |
| Installation, Maintenance & Repair | 30 (90.9%) | 3 (9.1%) |
| Total (Category) | 79 (88.8%) | 10 (11.2%) |
| Total (Overall) | 418 (53.7%) | 361 (46.3%) |
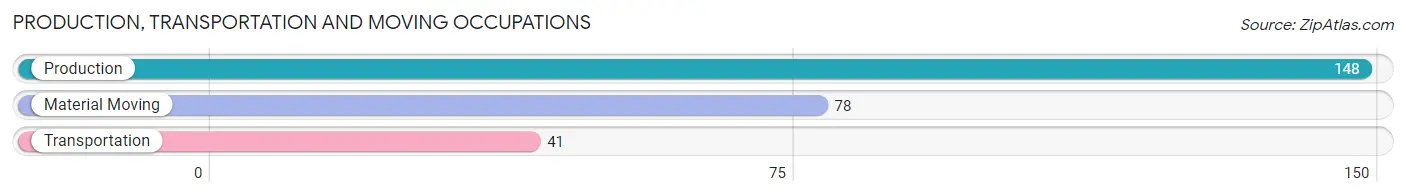
Production, Transportation and Moving Occupations
The most common Production, Transportation and Moving occupations in Montpelier are Production (148 | 19.0%), Material Moving (78 | 10.0%), and Transportation (41 | 5.3%).
Production, Transportation and Moving Occupations by Sex
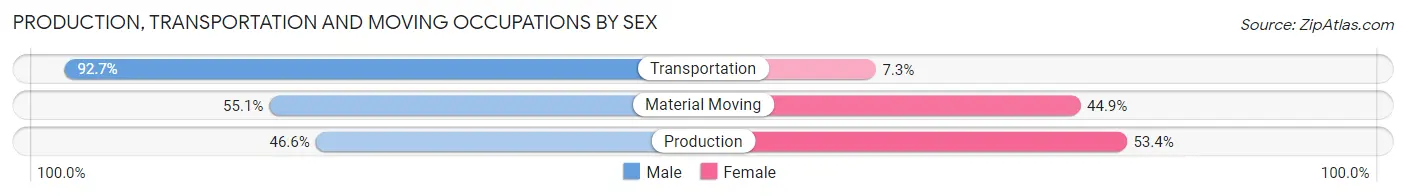
| Occupation | Male | Female |
| Production | 69 (46.6%) | 79 (53.4%) |
| Transportation | 38 (92.7%) | 3 (7.3%) |
| Material Moving | 43 (55.1%) | 35 (44.9%) |
| Total (Category) | 150 (56.2%) | 117 (43.8%) |
| Total (Overall) | 418 (53.7%) | 361 (46.3%) |
Employment Industries by Sex in Montpelier
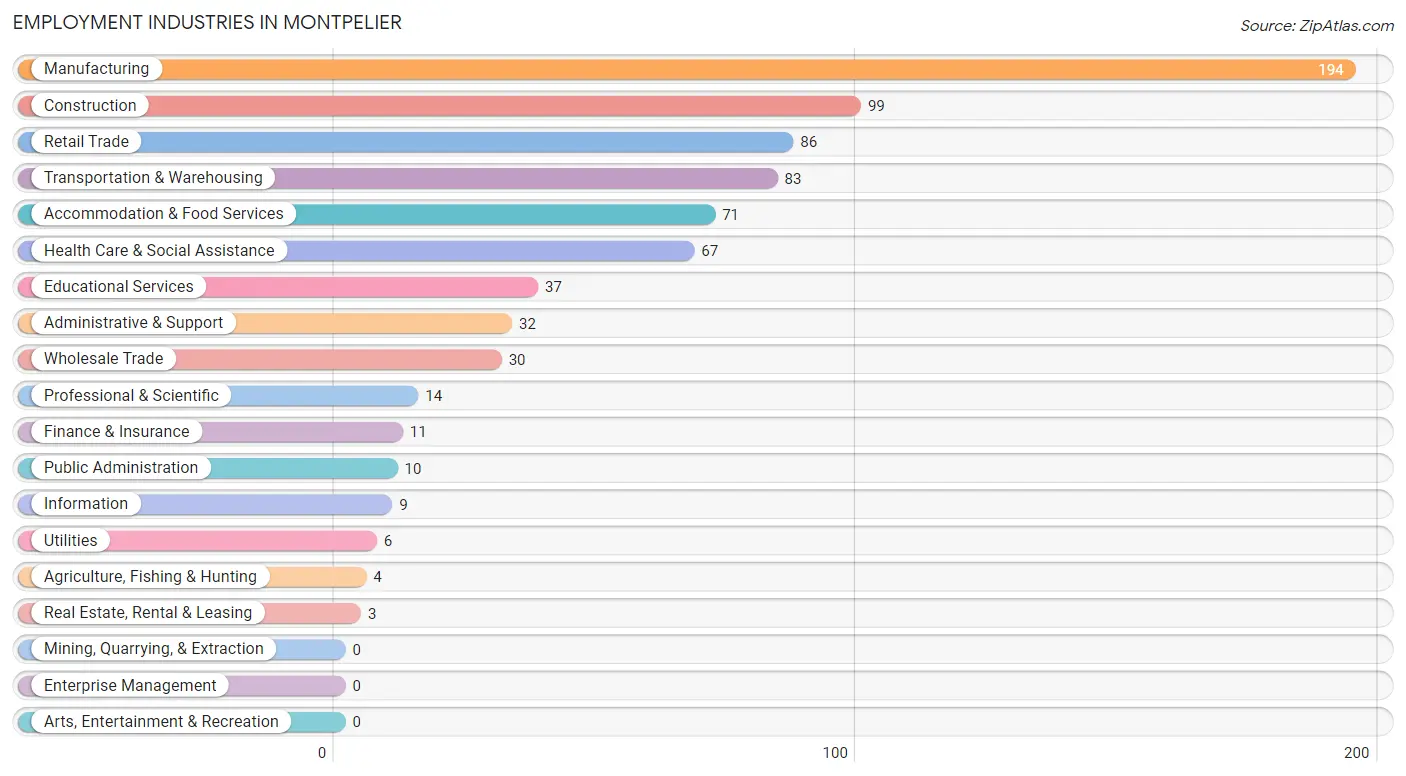
Employment Industries in Montpelier
The major employment industries in Montpelier include Manufacturing (194 | 24.9%), Construction (99 | 12.7%), Retail Trade (86 | 11.0%), Transportation & Warehousing (83 | 10.6%), and Accommodation & Food Services (71 | 9.1%).
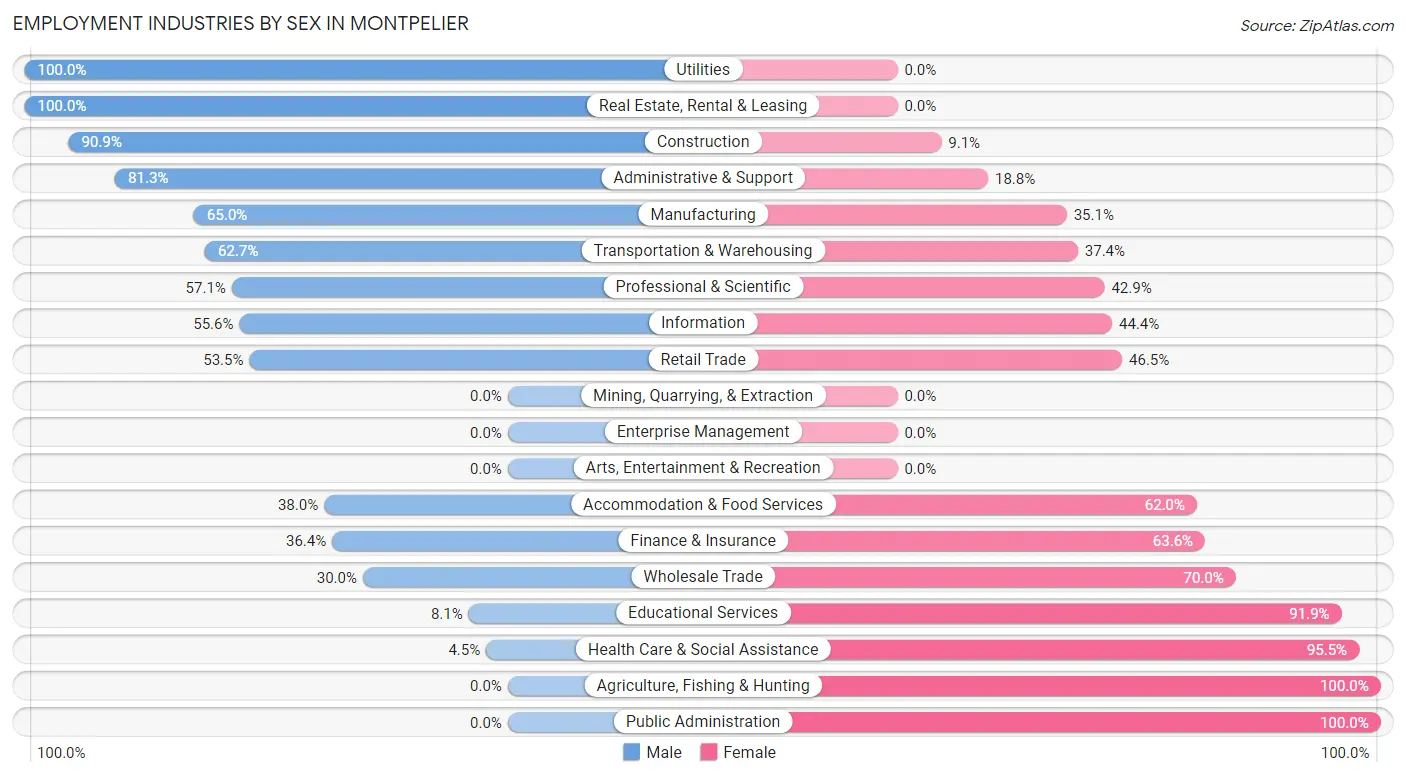
Employment Industries by Sex in Montpelier
The Montpelier industries that see more men than women are Utilities (100.0%), Real Estate, Rental & Leasing (100.0%), and Construction (90.9%), whereas the industries that tend to have a higher number of women are Agriculture, Fishing & Hunting (100.0%), Public Administration (100.0%), and Health Care & Social Assistance (95.5%).
| Industry | Male | Female |
| Agriculture, Fishing & Hunting | 0 (0.0%) | 4 (100.0%) |
| Mining, Quarrying, & Extraction | 0 (0.0%) | 0 (0.0%) |
| Construction | 90 (90.9%) | 9 (9.1%) |
| Manufacturing | 126 (64.9%) | 68 (35.0%) |
| Wholesale Trade | 9 (30.0%) | 21 (70.0%) |
| Retail Trade | 46 (53.5%) | 40 (46.5%) |
| Transportation & Warehousing | 52 (62.6%) | 31 (37.3%) |
| Utilities | 6 (100.0%) | 0 (0.0%) |
| Information | 5 (55.6%) | 4 (44.4%) |
| Finance & Insurance | 4 (36.4%) | 7 (63.6%) |
| Real Estate, Rental & Leasing | 3 (100.0%) | 0 (0.0%) |
| Professional & Scientific | 8 (57.1%) | 6 (42.9%) |
| Enterprise Management | 0 (0.0%) | 0 (0.0%) |
| Administrative & Support | 26 (81.2%) | 6 (18.8%) |
| Educational Services | 3 (8.1%) | 34 (91.9%) |
| Health Care & Social Assistance | 3 (4.5%) | 64 (95.5%) |
| Arts, Entertainment & Recreation | 0 (0.0%) | 0 (0.0%) |
| Accommodation & Food Services | 27 (38.0%) | 44 (62.0%) |
| Public Administration | 0 (0.0%) | 10 (100.0%) |
| Total | 418 (53.7%) | 361 (46.3%) |
Education in Montpelier
School Enrollment in Montpelier
The most common levels of schooling among the 263 students in Montpelier are college / undergraduate (76 | 28.9%), elementary school (62 | 23.6%), and middle school (55 | 20.9%).
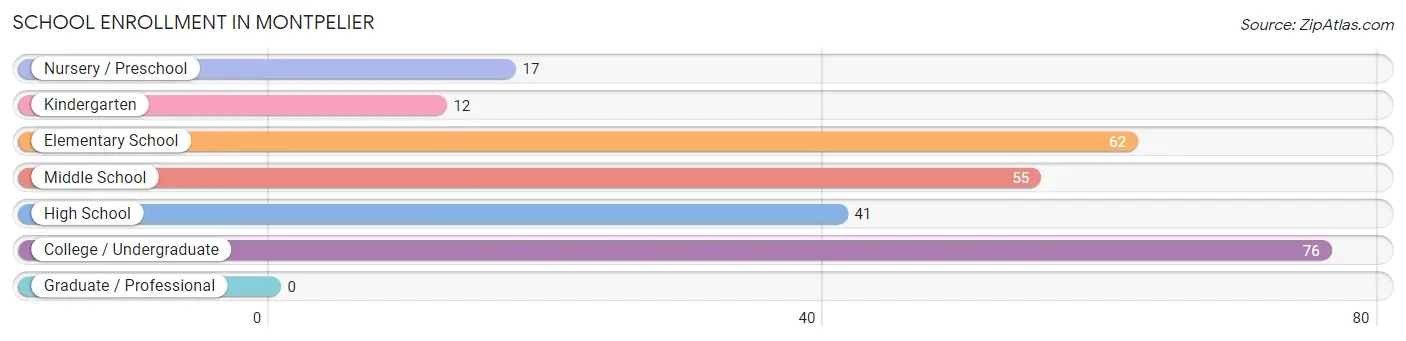
| School Level | # Students | % Students |
| Nursery / Preschool | 17 | 6.5% |
| Kindergarten | 12 | 4.6% |
| Elementary School | 62 | 23.6% |
| Middle School | 55 | 20.9% |
| High School | 41 | 15.6% |
| College / Undergraduate | 76 | 28.9% |
| Graduate / Professional | 0 | 0.0% |
| Total | 263 | 100.0% |
School Enrollment by Age by Funding Source in Montpelier
Out of a total of 263 students who are enrolled in schools in Montpelier, 24 (9.1%) attend a private institution, while the remaining 239 (90.9%) are enrolled in public schools. The age group of 35 years and over has the highest likelihood of being enrolled in private schools, with 16 (51.6% in the age bracket) enrolled. Conversely, the age group of 5 to 9 year old has the lowest likelihood of being enrolled in a private school, with 44 (100.0% in the age bracket) attending a public institution.
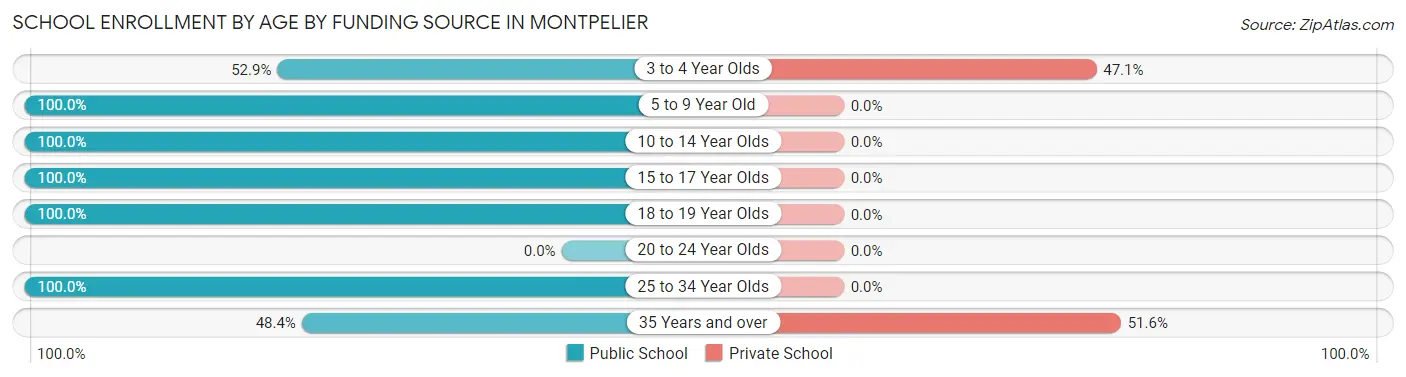
| Age Bracket | Public School | Private School |
| 3 to 4 Year Olds | 9 (52.9%) | 8 (47.1%) |
| 5 to 9 Year Old | 44 (100.0%) | 0 (0.0%) |
| 10 to 14 Year Olds | 78 (100.0%) | 0 (0.0%) |
| 15 to 17 Year Olds | 44 (100.0%) | 0 (0.0%) |
| 18 to 19 Year Olds | 4 (100.0%) | 0 (0.0%) |
| 20 to 24 Year Olds | 0 (0.0%) | 0 (0.0%) |
| 25 to 34 Year Olds | 45 (100.0%) | 0 (0.0%) |
| 35 Years and over | 15 (48.4%) | 16 (51.6%) |
| Total | 239 (90.9%) | 24 (9.1%) |
Educational Attainment by Field of Study in Montpelier
Education (43 | 38.7%), business (27 | 24.3%), science & technology (11 | 9.9%), computers & mathematics (7 | 6.3%), and physical & health sciences (7 | 6.3%) are the most common fields of study among 111 individuals in Montpelier who have obtained a bachelor's degree or higher.
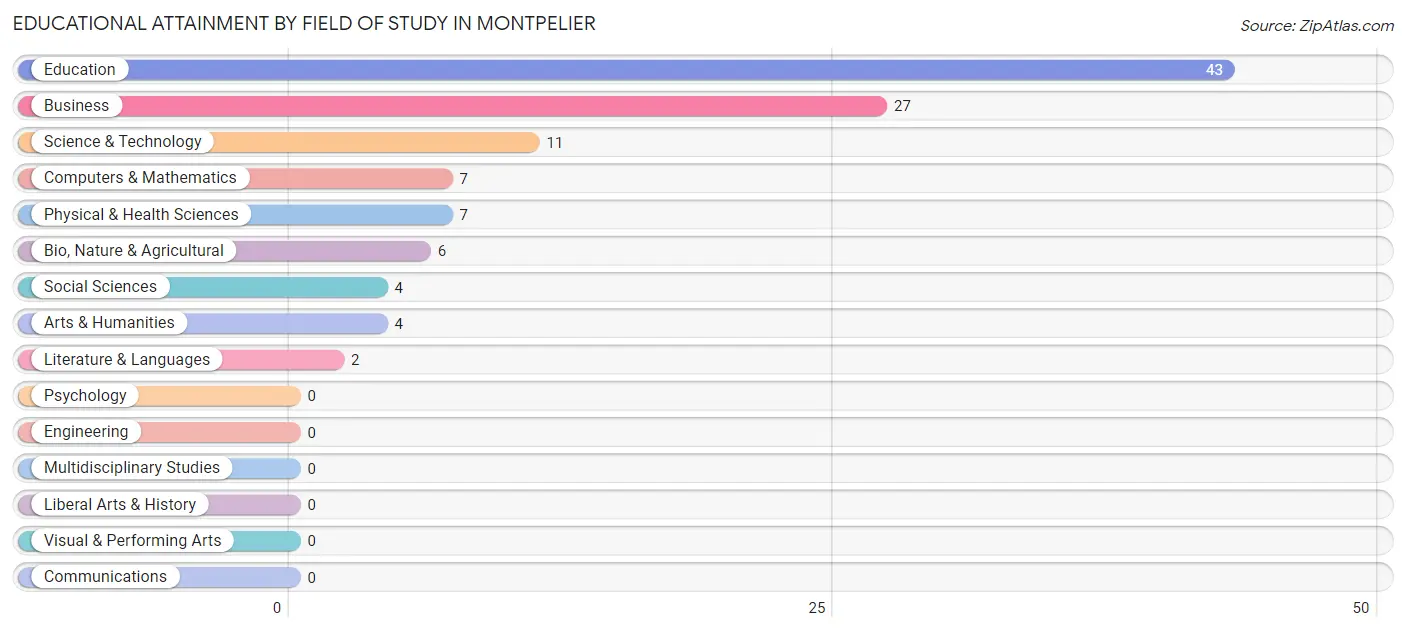
| Field of Study | # Graduates | % Graduates |
| Computers & Mathematics | 7 | 6.3% |
| Bio, Nature & Agricultural | 6 | 5.4% |
| Physical & Health Sciences | 7 | 6.3% |
| Psychology | 0 | 0.0% |
| Social Sciences | 4 | 3.6% |
| Engineering | 0 | 0.0% |
| Multidisciplinary Studies | 0 | 0.0% |
| Science & Technology | 11 | 9.9% |
| Business | 27 | 24.3% |
| Education | 43 | 38.7% |
| Literature & Languages | 2 | 1.8% |
| Liberal Arts & History | 0 | 0.0% |
| Visual & Performing Arts | 0 | 0.0% |
| Communications | 0 | 0.0% |
| Arts & Humanities | 4 | 3.6% |
| Total | 111 | 100.0% |
Transportation & Commute in Montpelier
Vehicle Availability by Sex in Montpelier
The most prevalent vehicle ownership categories in Montpelier are males with 2 vehicles (182, accounting for 43.5%) and females with 2 vehicles (168, making up 50.4%).
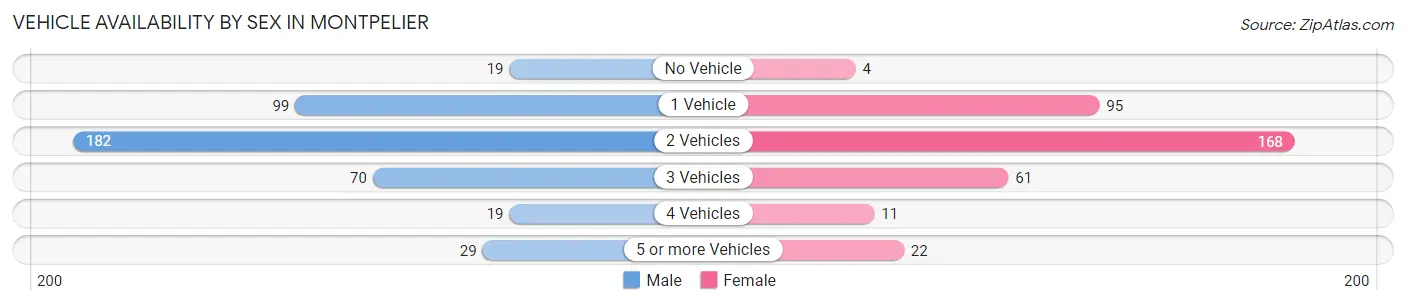
| Vehicles Available | Male | Female |
| No Vehicle | 19 (4.5%) | 4 (1.1%) |
| 1 Vehicle | 99 (23.7%) | 95 (26.3%) |
| 2 Vehicles | 182 (43.5%) | 168 (46.5%) |
| 3 Vehicles | 70 (16.8%) | 61 (16.9%) |
| 4 Vehicles | 19 (4.5%) | 11 (3.0%) |
| 5 or more Vehicles | 29 (6.9%) | 22 (6.1%) |
| Total | 418 (100.0%) | 361 (100.0%) |
Commute Time in Montpelier
The most frequently occuring commute durations in Montpelier are 30 to 34 minutes (167 commuters, 21.9%), 5 to 9 minutes (133 commuters, 17.4%), and 25 to 29 minutes (117 commuters, 15.3%).
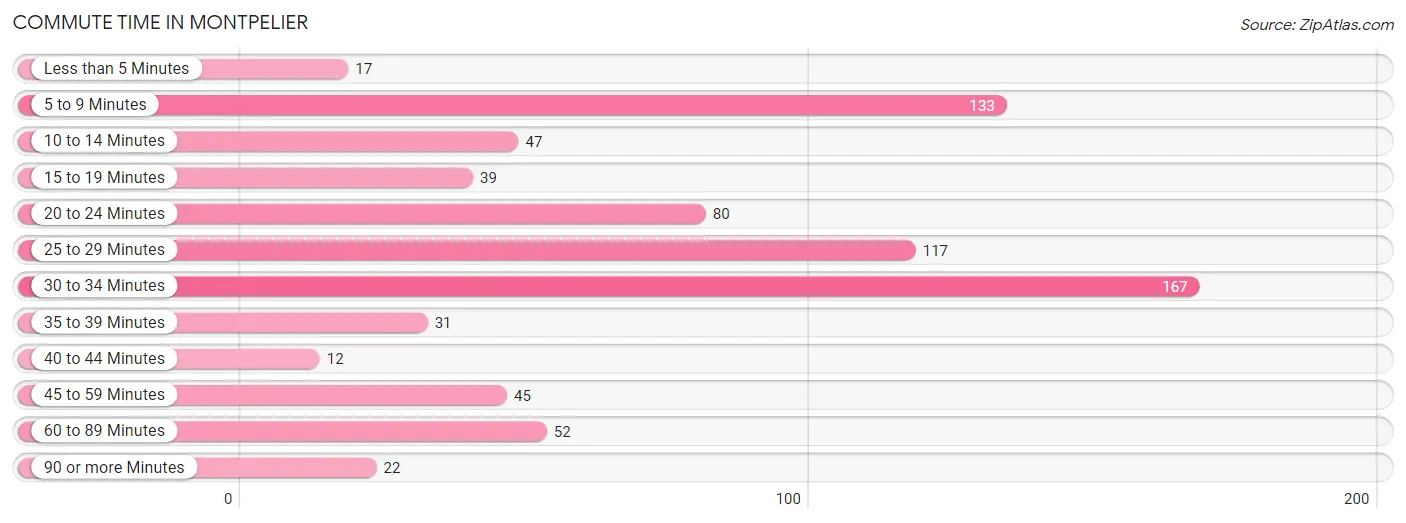
| Commute Time | # Commuters | % Commuters |
| Less than 5 Minutes | 17 | 2.2% |
| 5 to 9 Minutes | 133 | 17.4% |
| 10 to 14 Minutes | 47 | 6.2% |
| 15 to 19 Minutes | 39 | 5.1% |
| 20 to 24 Minutes | 80 | 10.5% |
| 25 to 29 Minutes | 117 | 15.3% |
| 30 to 34 Minutes | 167 | 21.9% |
| 35 to 39 Minutes | 31 | 4.1% |
| 40 to 44 Minutes | 12 | 1.6% |
| 45 to 59 Minutes | 45 | 5.9% |
| 60 to 89 Minutes | 52 | 6.8% |
| 90 or more Minutes | 22 | 2.9% |
Commute Time by Sex in Montpelier
The most common commute times in Montpelier are 30 to 34 minutes (111 commuters, 27.7%) for males and 25 to 29 minutes (87 commuters, 24.1%) for females.
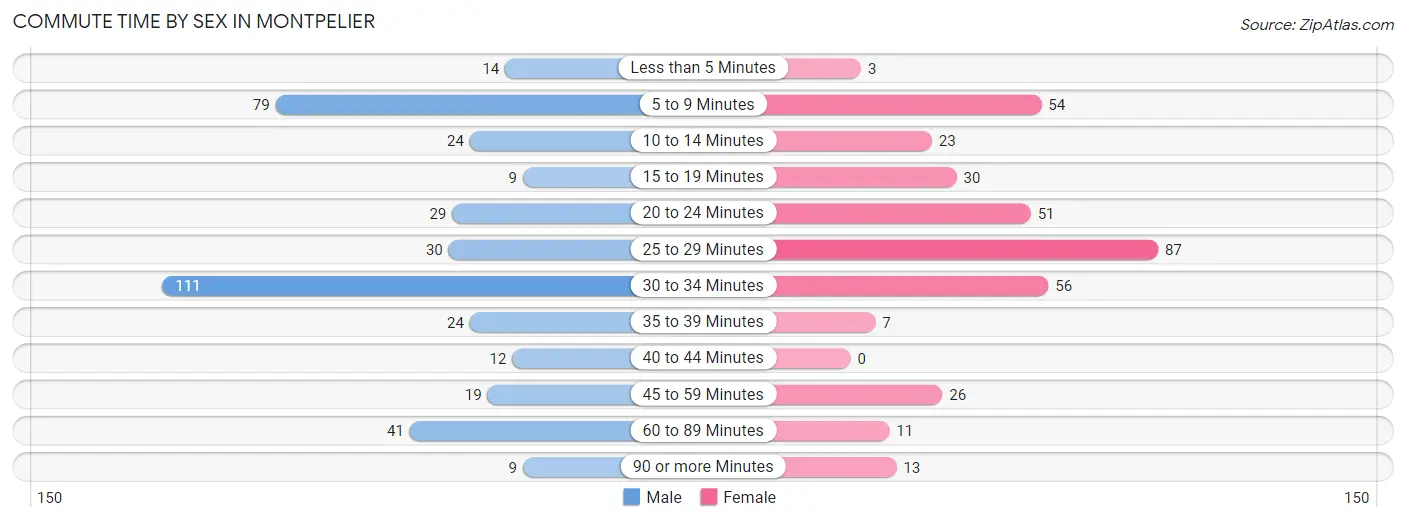
| Commute Time | Male | Female |
| Less than 5 Minutes | 14 (3.5%) | 3 (0.8%) |
| 5 to 9 Minutes | 79 (19.7%) | 54 (15.0%) |
| 10 to 14 Minutes | 24 (6.0%) | 23 (6.4%) |
| 15 to 19 Minutes | 9 (2.2%) | 30 (8.3%) |
| 20 to 24 Minutes | 29 (7.2%) | 51 (14.1%) |
| 25 to 29 Minutes | 30 (7.5%) | 87 (24.1%) |
| 30 to 34 Minutes | 111 (27.7%) | 56 (15.5%) |
| 35 to 39 Minutes | 24 (6.0%) | 7 (1.9%) |
| 40 to 44 Minutes | 12 (3.0%) | 0 (0.0%) |
| 45 to 59 Minutes | 19 (4.7%) | 26 (7.2%) |
| 60 to 89 Minutes | 41 (10.2%) | 11 (3.0%) |
| 90 or more Minutes | 9 (2.2%) | 13 (3.6%) |
Time of Departure to Work by Sex in Montpelier
The most frequent times of departure to work in Montpelier are 12:00 PM to 3:59 PM (65, 16.2%) for males and 4:00 PM to 11:59 PM (66, 18.3%) for females.
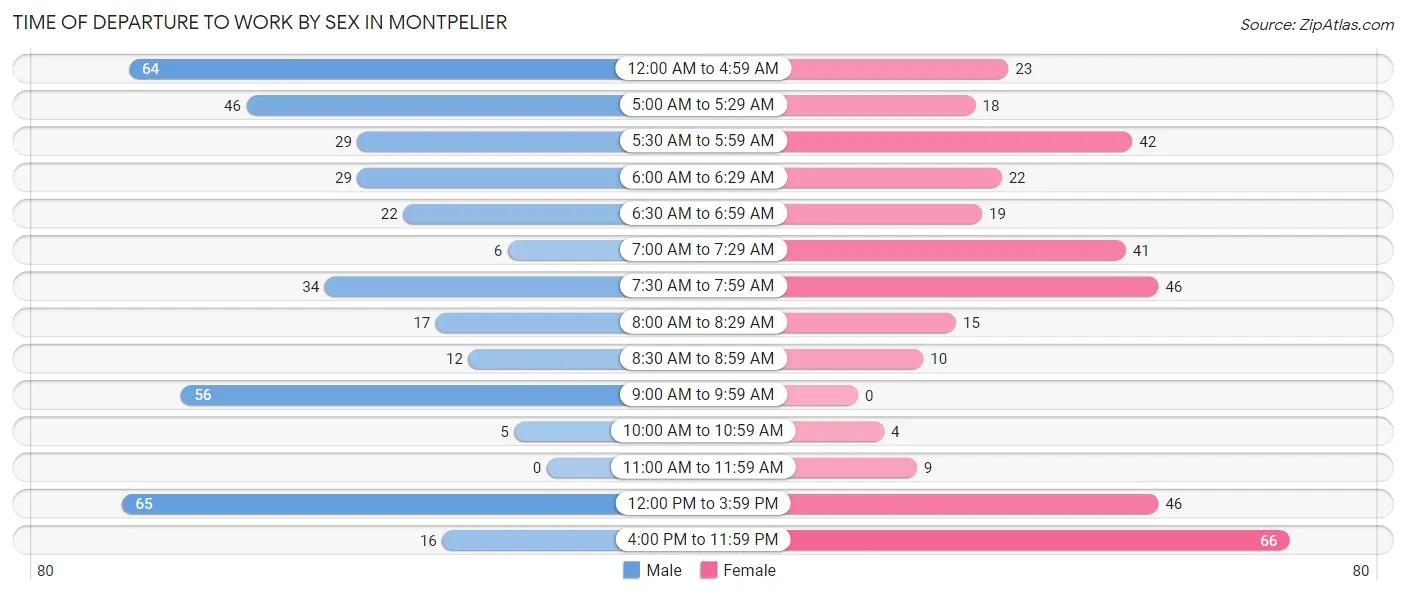
| Time of Departure | Male | Female |
| 12:00 AM to 4:59 AM | 64 (16.0%) | 23 (6.4%) |
| 5:00 AM to 5:29 AM | 46 (11.5%) | 18 (5.0%) |
| 5:30 AM to 5:59 AM | 29 (7.2%) | 42 (11.6%) |
| 6:00 AM to 6:29 AM | 29 (7.2%) | 22 (6.1%) |
| 6:30 AM to 6:59 AM | 22 (5.5%) | 19 (5.3%) |
| 7:00 AM to 7:29 AM | 6 (1.5%) | 41 (11.4%) |
| 7:30 AM to 7:59 AM | 34 (8.5%) | 46 (12.7%) |
| 8:00 AM to 8:29 AM | 17 (4.2%) | 15 (4.2%) |
| 8:30 AM to 8:59 AM | 12 (3.0%) | 10 (2.8%) |
| 9:00 AM to 9:59 AM | 56 (14.0%) | 0 (0.0%) |
| 10:00 AM to 10:59 AM | 5 (1.3%) | 4 (1.1%) |
| 11:00 AM to 11:59 AM | 0 (0.0%) | 9 (2.5%) |
| 12:00 PM to 3:59 PM | 65 (16.2%) | 46 (12.7%) |
| 4:00 PM to 11:59 PM | 16 (4.0%) | 66 (18.3%) |
| Total | 401 (100.0%) | 361 (100.0%) |
Housing Occupancy in Montpelier
Occupancy by Ownership in Montpelier
Of the total 669 dwellings in Montpelier, owner-occupied units account for 437 (65.3%), while renter-occupied units make up 232 (34.7%).
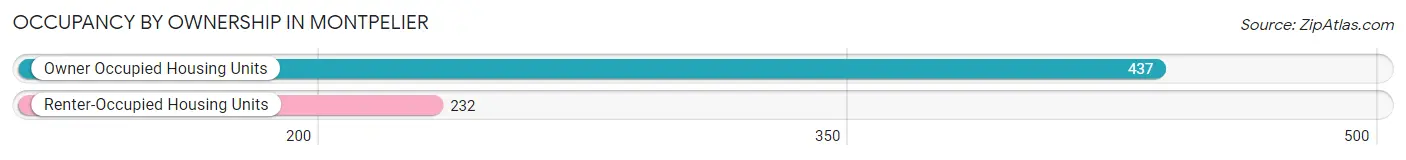
| Occupancy | # Housing Units | % Housing Units |
| Owner Occupied Housing Units | 437 | 65.3% |
| Renter-Occupied Housing Units | 232 | 34.7% |
| Total Occupied Housing Units | 669 | 100.0% |
Occupancy by Household Size in Montpelier
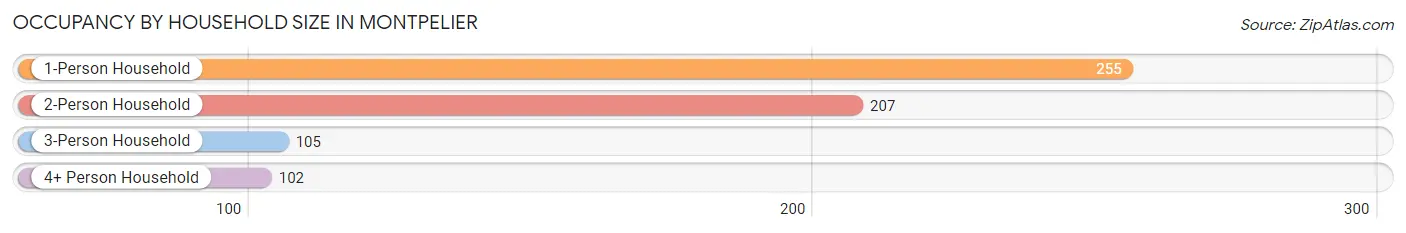
| Household Size | # Housing Units | % Housing Units |
| 1-Person Household | 255 | 38.1% |
| 2-Person Household | 207 | 30.9% |
| 3-Person Household | 105 | 15.7% |
| 4+ Person Household | 102 | 15.2% |
| Total Housing Units | 669 | 100.0% |
Occupancy by Ownership by Household Size in Montpelier
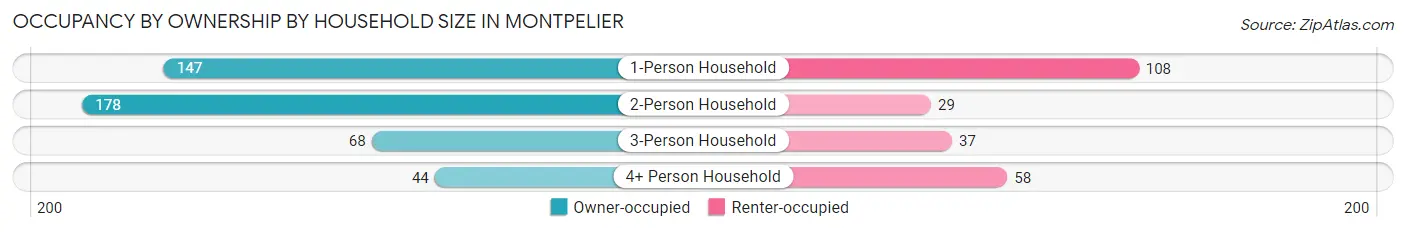
| Household Size | Owner-occupied | Renter-occupied |
| 1-Person Household | 147 (57.7%) | 108 (42.3%) |
| 2-Person Household | 178 (86.0%) | 29 (14.0%) |
| 3-Person Household | 68 (64.8%) | 37 (35.2%) |
| 4+ Person Household | 44 (43.1%) | 58 (56.9%) |
| Total Housing Units | 437 (65.3%) | 232 (34.7%) |
Occupancy by Educational Attainment in Montpelier
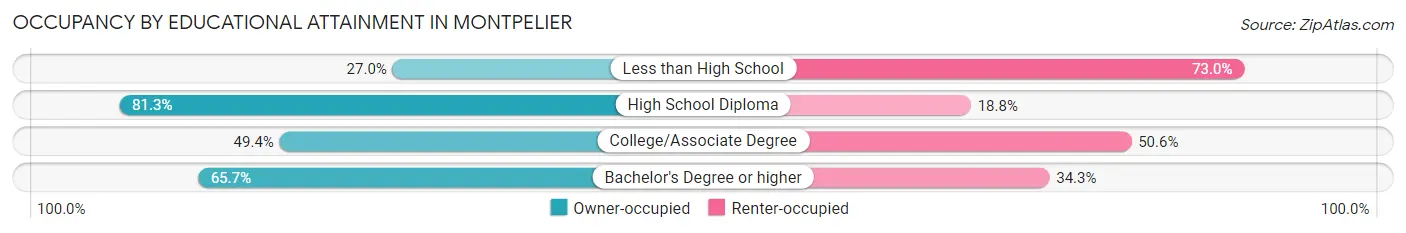
| Household Size | Owner-occupied | Renter-occupied |
| Less than High School | 20 (27.0%) | 54 (73.0%) |
| High School Diploma | 286 (81.2%) | 66 (18.8%) |
| College/Associate Degree | 87 (49.4%) | 89 (50.6%) |
| Bachelor's Degree or higher | 44 (65.7%) | 23 (34.3%) |
Occupancy by Age of Householder in Montpelier
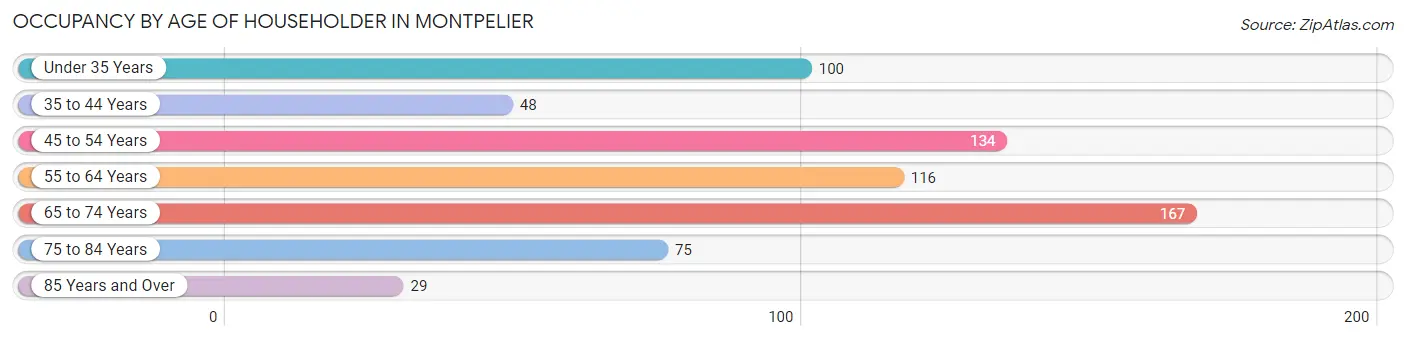
| Age Bracket | # Households | % Households |
| Under 35 Years | 100 | 14.9% |
| 35 to 44 Years | 48 | 7.2% |
| 45 to 54 Years | 134 | 20.0% |
| 55 to 64 Years | 116 | 17.3% |
| 65 to 74 Years | 167 | 25.0% |
| 75 to 84 Years | 75 | 11.2% |
| 85 Years and Over | 29 | 4.3% |
| Total | 669 | 100.0% |
Housing Finances in Montpelier
Median Income by Occupancy in Montpelier
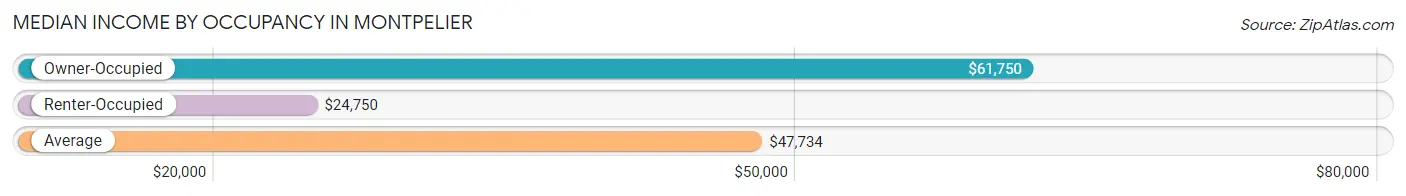
| Occupancy Type | # Households | Median Income |
| Owner-Occupied | 437 (65.3%) | $61,750 |
| Renter-Occupied | 232 (34.7%) | $24,750 |
| Average | 669 (100.0%) | $47,734 |
Occupancy by Householder Income Bracket in Montpelier
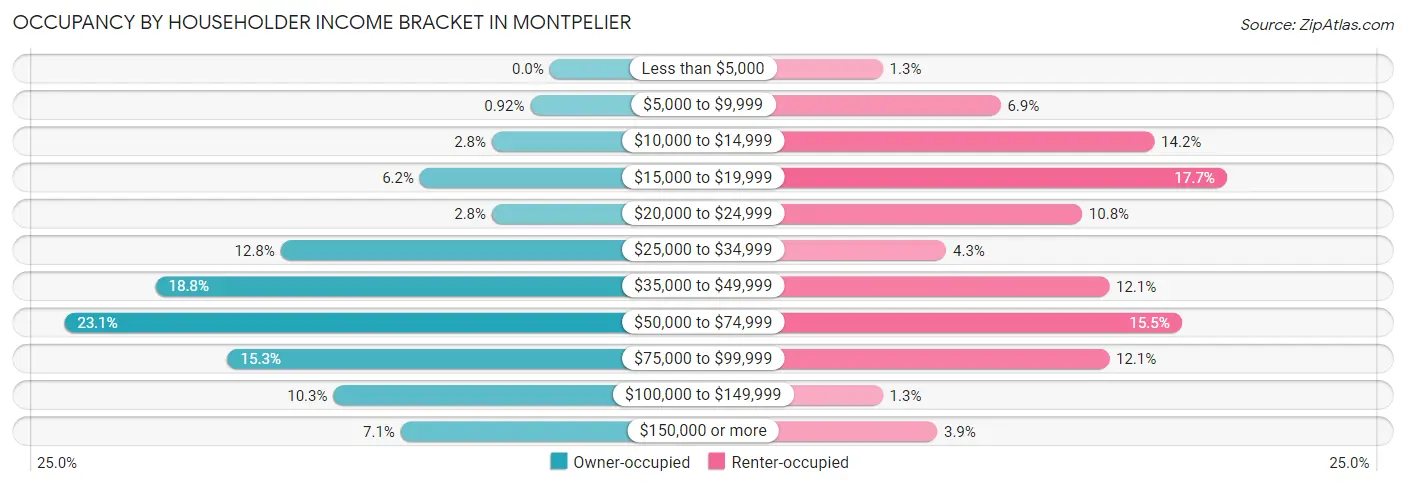
| Income Bracket | Owner-occupied | Renter-occupied |
| Less than $5,000 | 0 (0.0%) | 3 (1.3%) |
| $5,000 to $9,999 | 4 (0.9%) | 16 (6.9%) |
| $10,000 to $14,999 | 12 (2.8%) | 33 (14.2%) |
| $15,000 to $19,999 | 27 (6.2%) | 41 (17.7%) |
| $20,000 to $24,999 | 12 (2.8%) | 25 (10.8%) |
| $25,000 to $34,999 | 56 (12.8%) | 10 (4.3%) |
| $35,000 to $49,999 | 82 (18.8%) | 28 (12.1%) |
| $50,000 to $74,999 | 101 (23.1%) | 36 (15.5%) |
| $75,000 to $99,999 | 67 (15.3%) | 28 (12.1%) |
| $100,000 to $149,999 | 45 (10.3%) | 3 (1.3%) |
| $150,000 or more | 31 (7.1%) | 9 (3.9%) |
| Total | 437 (100.0%) | 232 (100.0%) |
Monthly Housing Cost Tiers in Montpelier
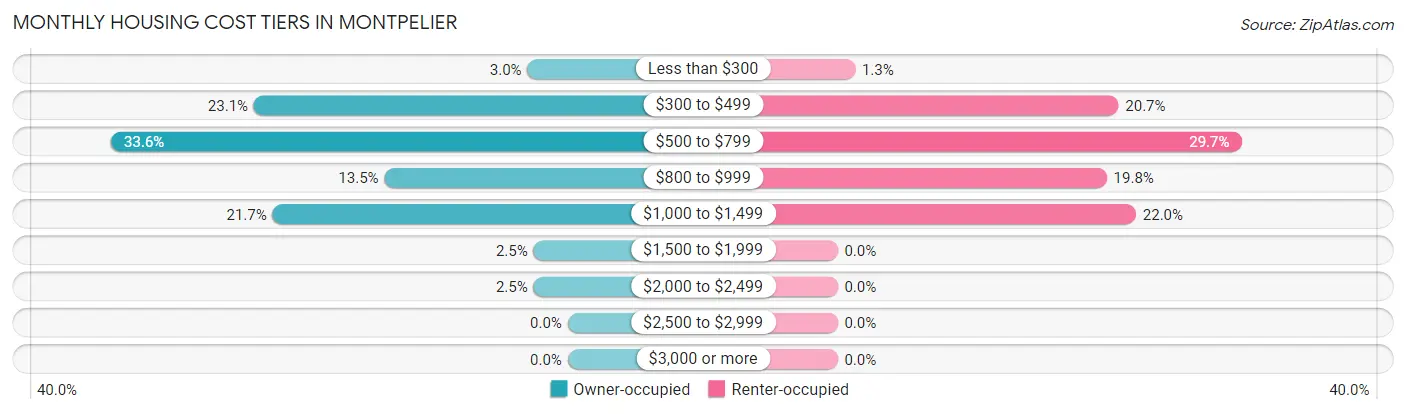
| Monthly Cost | Owner-occupied | Renter-occupied |
| Less than $300 | 13 (3.0%) | 3 (1.3%) |
| $300 to $499 | 101 (23.1%) | 48 (20.7%) |
| $500 to $799 | 147 (33.6%) | 69 (29.7%) |
| $800 to $999 | 59 (13.5%) | 46 (19.8%) |
| $1,000 to $1,499 | 95 (21.7%) | 51 (22.0%) |
| $1,500 to $1,999 | 11 (2.5%) | 0 (0.0%) |
| $2,000 to $2,499 | 11 (2.5%) | 0 (0.0%) |
| $2,500 to $2,999 | 0 (0.0%) | 0 (0.0%) |
| $3,000 or more | 0 (0.0%) | 0 (0.0%) |
| Total | 437 (100.0%) | 232 (100.0%) |
Physical Housing Characteristics in Montpelier
Housing Structures in Montpelier
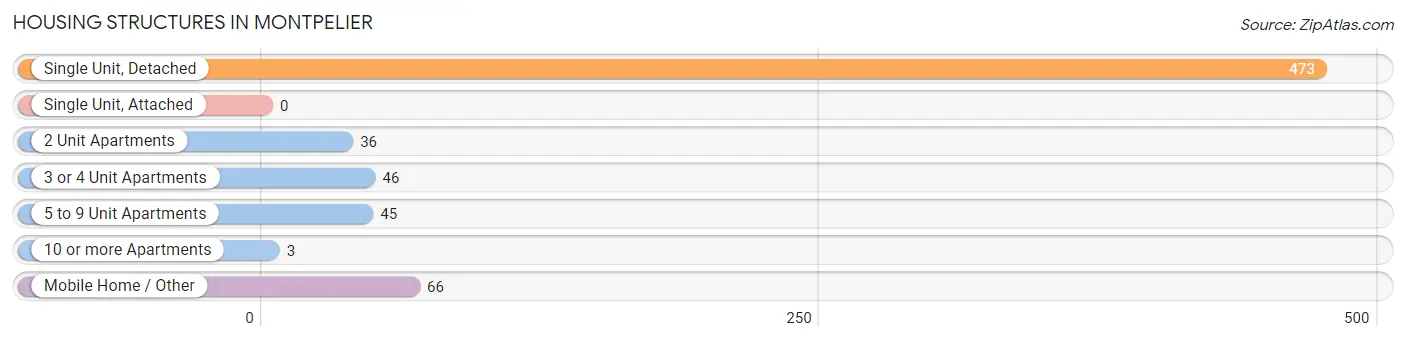
| Structure Type | # Housing Units | % Housing Units |
| Single Unit, Detached | 473 | 70.7% |
| Single Unit, Attached | 0 | 0.0% |
| 2 Unit Apartments | 36 | 5.4% |
| 3 or 4 Unit Apartments | 46 | 6.9% |
| 5 to 9 Unit Apartments | 45 | 6.7% |
| 10 or more Apartments | 3 | 0.4% |
| Mobile Home / Other | 66 | 9.9% |
| Total | 669 | 100.0% |
Housing Structures by Occupancy in Montpelier
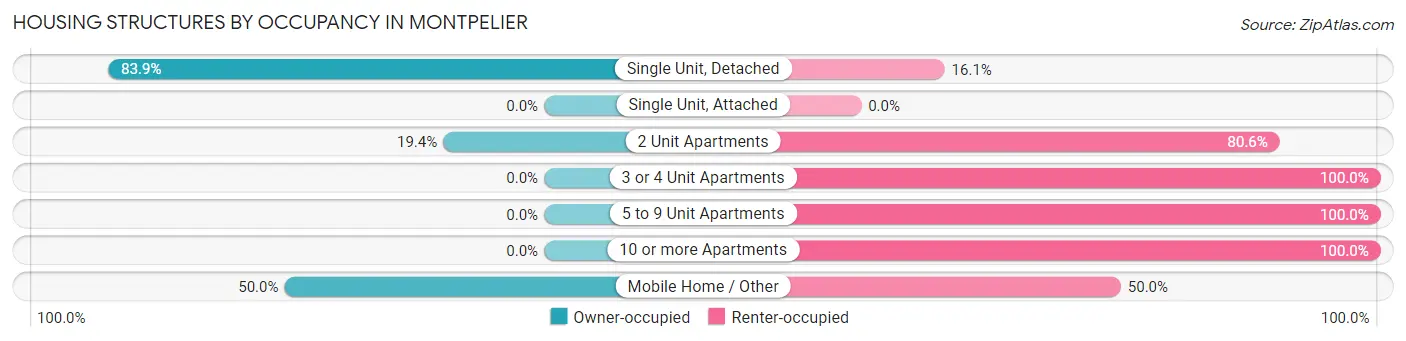
| Structure Type | Owner-occupied | Renter-occupied |
| Single Unit, Detached | 397 (83.9%) | 76 (16.1%) |
| Single Unit, Attached | 0 (0.0%) | 0 (0.0%) |
| 2 Unit Apartments | 7 (19.4%) | 29 (80.6%) |
| 3 or 4 Unit Apartments | 0 (0.0%) | 46 (100.0%) |
| 5 to 9 Unit Apartments | 0 (0.0%) | 45 (100.0%) |
| 10 or more Apartments | 0 (0.0%) | 3 (100.0%) |
| Mobile Home / Other | 33 (50.0%) | 33 (50.0%) |
| Total | 437 (65.3%) | 232 (34.7%) |
Housing Structures by Number of Rooms in Montpelier
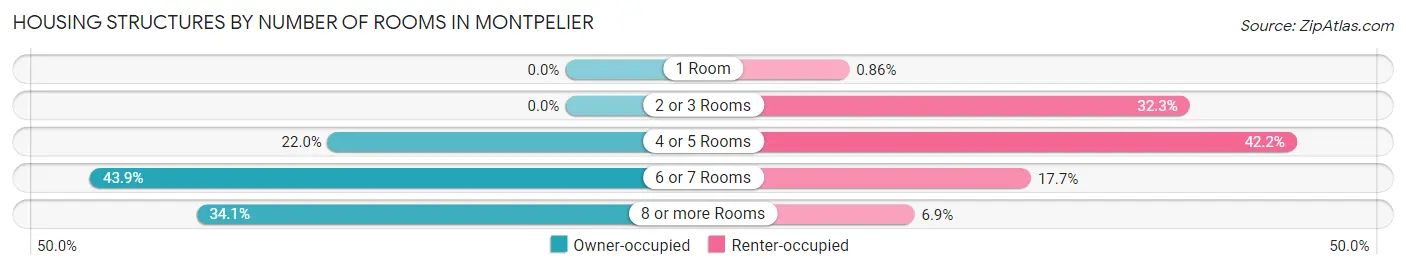
| Number of Rooms | Owner-occupied | Renter-occupied |
| 1 Room | 0 (0.0%) | 2 (0.9%) |
| 2 or 3 Rooms | 0 (0.0%) | 75 (32.3%) |
| 4 or 5 Rooms | 96 (22.0%) | 98 (42.2%) |
| 6 or 7 Rooms | 192 (43.9%) | 41 (17.7%) |
| 8 or more Rooms | 149 (34.1%) | 16 (6.9%) |
| Total | 437 (100.0%) | 232 (100.0%) |
Housing Structure by Heating Type in Montpelier
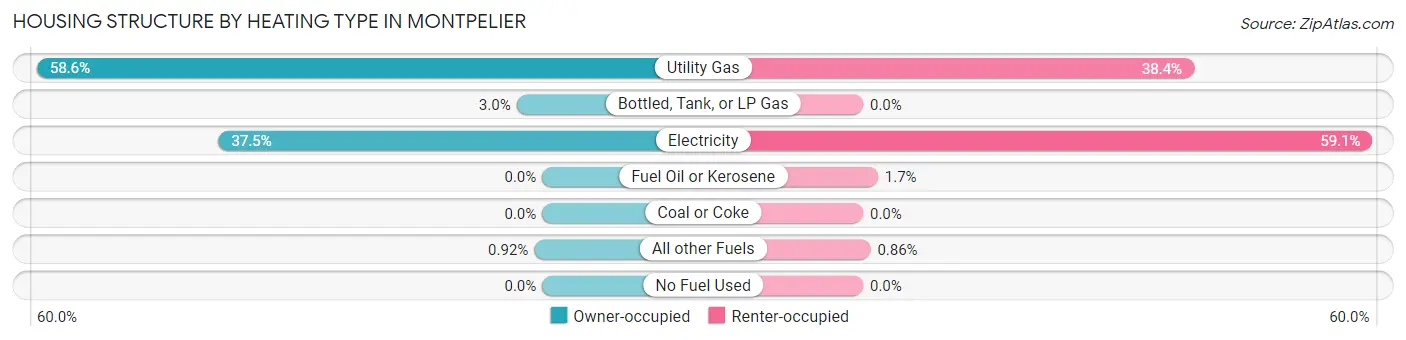
| Heating Type | Owner-occupied | Renter-occupied |
| Utility Gas | 256 (58.6%) | 89 (38.4%) |
| Bottled, Tank, or LP Gas | 13 (3.0%) | 0 (0.0%) |
| Electricity | 164 (37.5%) | 137 (59.1%) |
| Fuel Oil or Kerosene | 0 (0.0%) | 4 (1.7%) |
| Coal or Coke | 0 (0.0%) | 0 (0.0%) |
| All other Fuels | 4 (0.9%) | 2 (0.9%) |
| No Fuel Used | 0 (0.0%) | 0 (0.0%) |
| Total | 437 (100.0%) | 232 (100.0%) |
Household Vehicle Usage in Montpelier
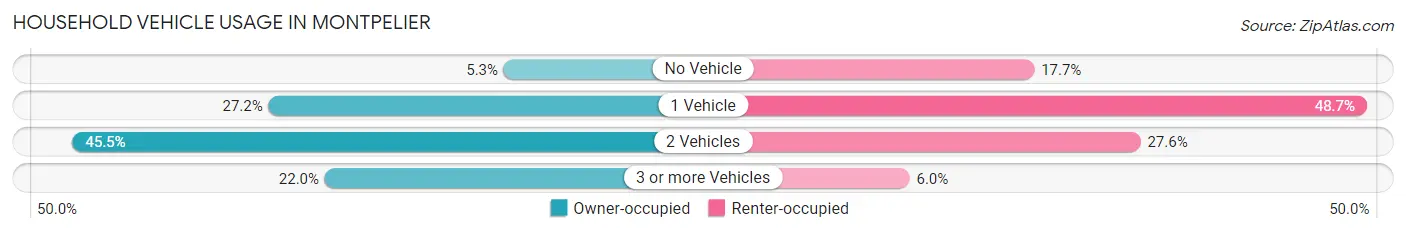
| Vehicles per Household | Owner-occupied | Renter-occupied |
| No Vehicle | 23 (5.3%) | 41 (17.7%) |
| 1 Vehicle | 119 (27.2%) | 113 (48.7%) |
| 2 Vehicles | 199 (45.5%) | 64 (27.6%) |
| 3 or more Vehicles | 96 (22.0%) | 14 (6.0%) |
| Total | 437 (100.0%) | 232 (100.0%) |
Real Estate & Mortgages in Montpelier
Real Estate and Mortgage Overview in Montpelier
| Characteristic | Without Mortgage | With Mortgage |
| Housing Units | 167 | 270 |
| Median Property Value | $60,800 | $77,000 |
| Median Household Income | $47,375 | $28 |
| Monthly Housing Costs | $439 | $0 |
| Real Estate Taxes | $628 | $39 |
Property Value by Mortgage Status in Montpelier
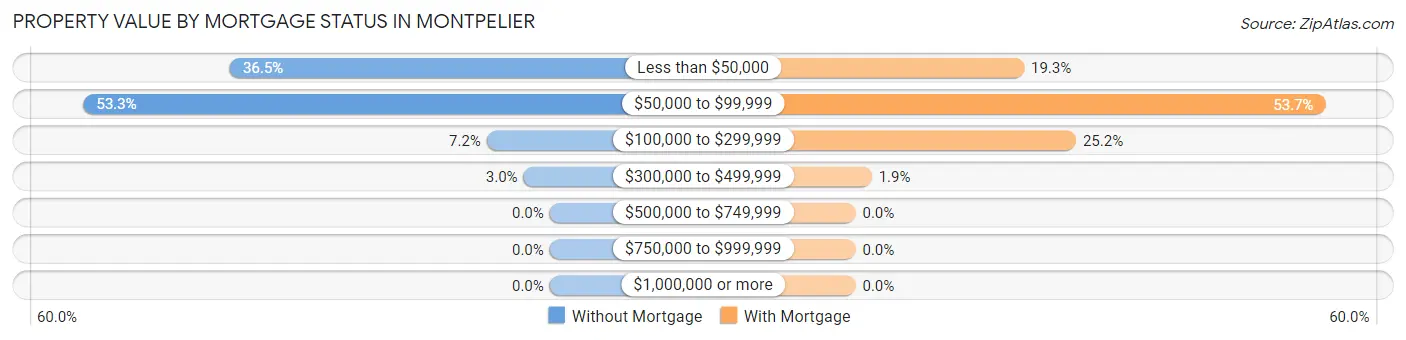
| Property Value | Without Mortgage | With Mortgage |
| Less than $50,000 | 61 (36.5%) | 52 (19.3%) |
| $50,000 to $99,999 | 89 (53.3%) | 145 (53.7%) |
| $100,000 to $299,999 | 12 (7.2%) | 68 (25.2%) |
| $300,000 to $499,999 | 5 (3.0%) | 5 (1.8%) |
| $500,000 to $749,999 | 0 (0.0%) | 0 (0.0%) |
| $750,000 to $999,999 | 0 (0.0%) | 0 (0.0%) |
| $1,000,000 or more | 0 (0.0%) | 0 (0.0%) |
| Total | 167 (100.0%) | 270 (100.0%) |
Household Income by Mortgage Status in Montpelier
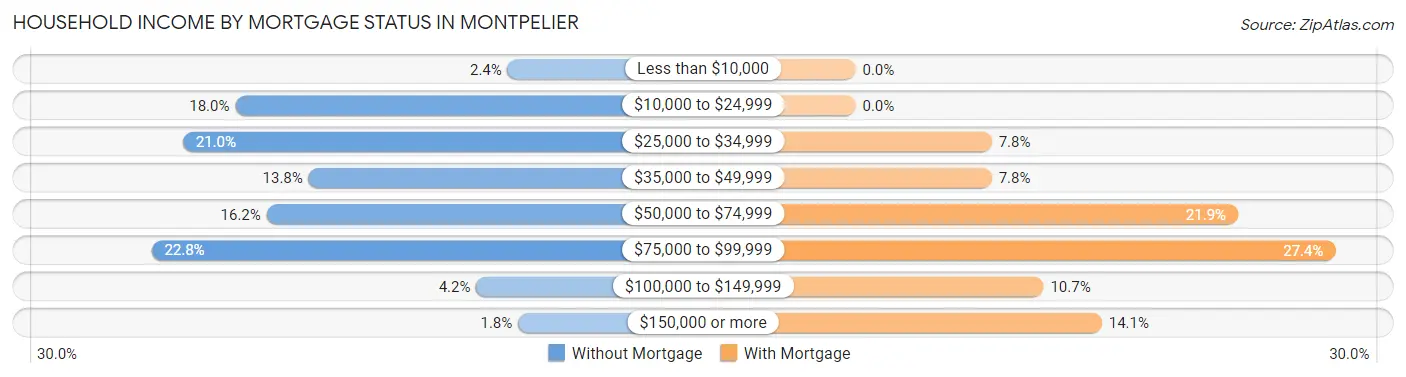
| Household Income | Without Mortgage | With Mortgage |
| Less than $10,000 | 4 (2.4%) | 0 (0.0%) |
| $10,000 to $24,999 | 30 (18.0%) | 0 (0.0%) |
| $25,000 to $34,999 | 35 (21.0%) | 21 (7.8%) |
| $35,000 to $49,999 | 23 (13.8%) | 21 (7.8%) |
| $50,000 to $74,999 | 27 (16.2%) | 59 (21.8%) |
| $75,000 to $99,999 | 38 (22.8%) | 74 (27.4%) |
| $100,000 to $149,999 | 7 (4.2%) | 29 (10.7%) |
| $150,000 or more | 3 (1.8%) | 38 (14.1%) |
| Total | 167 (100.0%) | 270 (100.0%) |
Property Value to Household Income Ratio in Montpelier
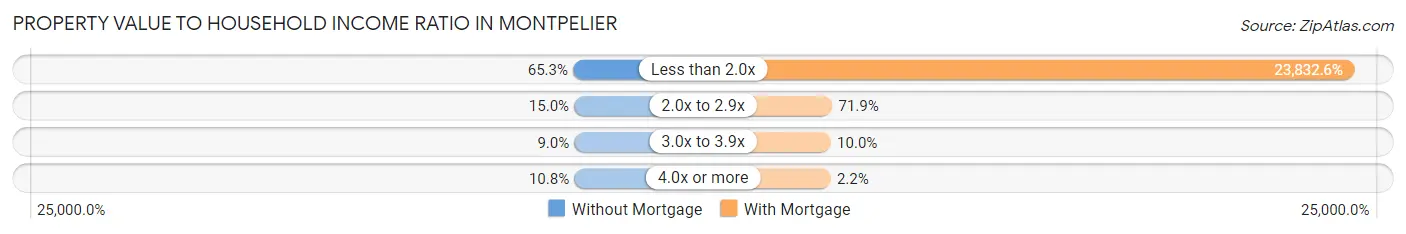
| Value-to-Income Ratio | Without Mortgage | With Mortgage |
| Less than 2.0x | 109 (65.3%) | 64,348 (23,832.6%) |
| 2.0x to 2.9x | 25 (15.0%) | 194 (71.9%) |
| 3.0x to 3.9x | 15 (9.0%) | 27 (10.0%) |
| 4.0x or more | 18 (10.8%) | 6 (2.2%) |
| Total | 167 (100.0%) | 270 (100.0%) |
Real Estate Taxes by Mortgage Status in Montpelier
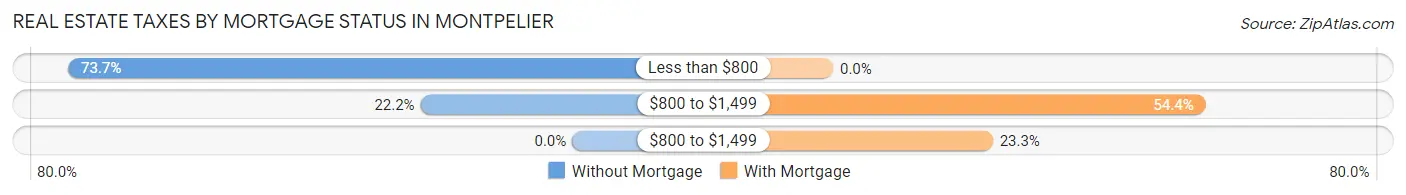
| Property Taxes | Without Mortgage | With Mortgage |
| Less than $800 | 123 (73.7%) | 0 (0.0%) |
| $800 to $1,499 | 37 (22.2%) | 147 (54.4%) |
| $800 to $1,499 | 0 (0.0%) | 63 (23.3%) |
| Total | 167 (100.0%) | 270 (100.0%) |
Health & Disability in Montpelier
Health Insurance Coverage by Age in Montpelier
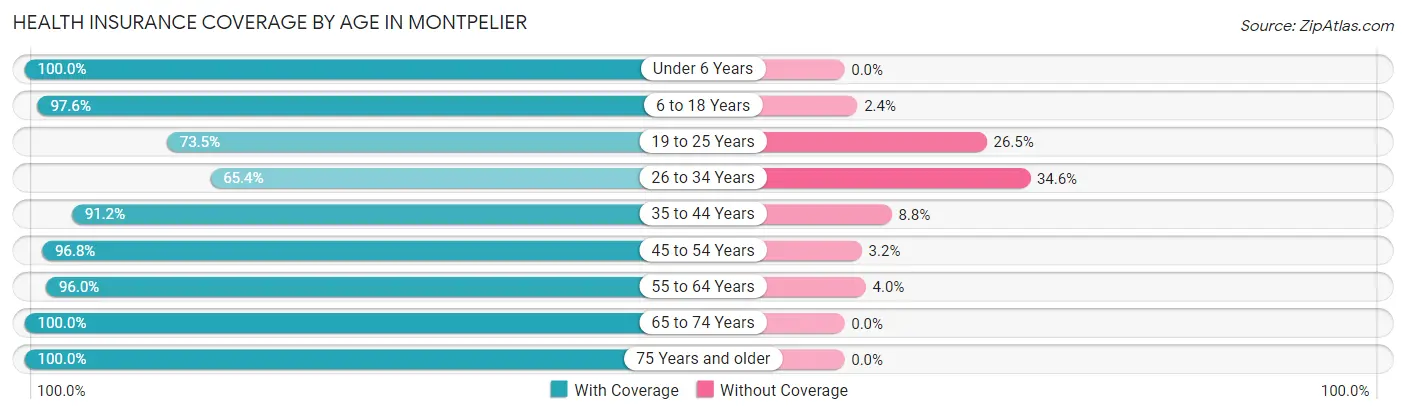
| Age Bracket | With Coverage | Without Coverage |
| Under 6 Years | 72 (100.0%) | 0 (0.0%) |
| 6 to 18 Years | 162 (97.6%) | 4 (2.4%) |
| 19 to 25 Years | 97 (73.5%) | 35 (26.5%) |
| 26 to 34 Years | 102 (65.4%) | 54 (34.6%) |
| 35 to 44 Years | 114 (91.2%) | 11 (8.8%) |
| 45 to 54 Years | 239 (96.8%) | 8 (3.2%) |
| 55 to 64 Years | 217 (96.0%) | 9 (4.0%) |
| 65 to 74 Years | 199 (100.0%) | 0 (0.0%) |
| 75 Years and older | 147 (100.0%) | 0 (0.0%) |
| Total | 1,349 (91.8%) | 121 (8.2%) |
Health Insurance Coverage by Citizenship Status in Montpelier
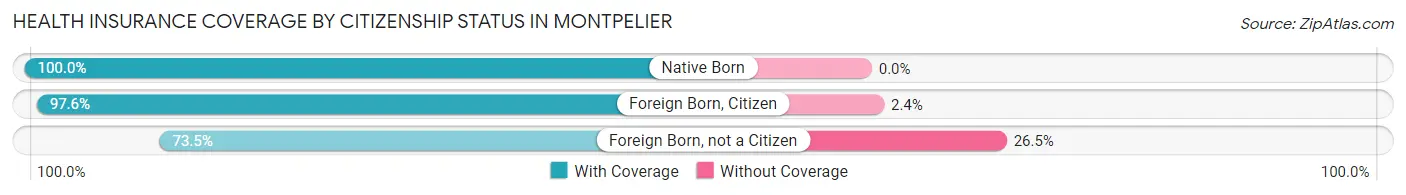
| Citizenship Status | With Coverage | Without Coverage |
| Native Born | 72 (100.0%) | 0 (0.0%) |
| Foreign Born, Citizen | 162 (97.6%) | 4 (2.4%) |
| Foreign Born, not a Citizen | 97 (73.5%) | 35 (26.5%) |
Health Insurance Coverage by Household Income in Montpelier
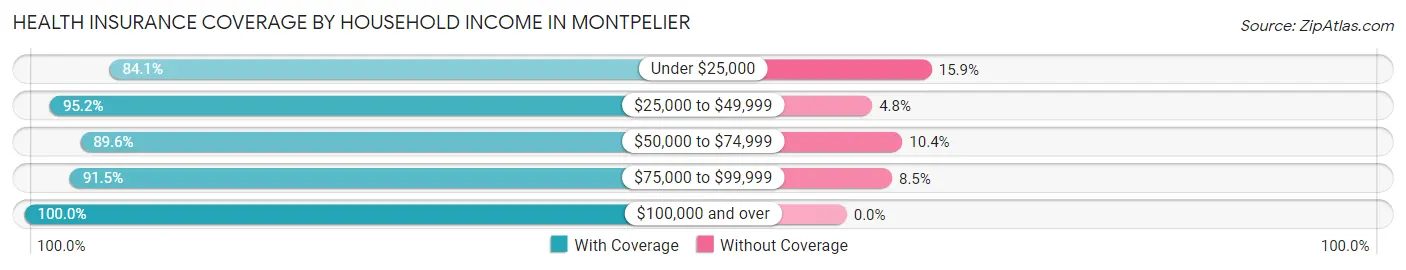
| Household Income | With Coverage | Without Coverage |
| Under $25,000 | 243 (84.1%) | 46 (15.9%) |
| $25,000 to $49,999 | 320 (95.2%) | 16 (4.8%) |
| $50,000 to $74,999 | 301 (89.6%) | 35 (10.4%) |
| $75,000 to $99,999 | 259 (91.5%) | 24 (8.5%) |
| $100,000 and over | 226 (100.0%) | 0 (0.0%) |
Public vs Private Health Insurance Coverage by Age in Montpelier
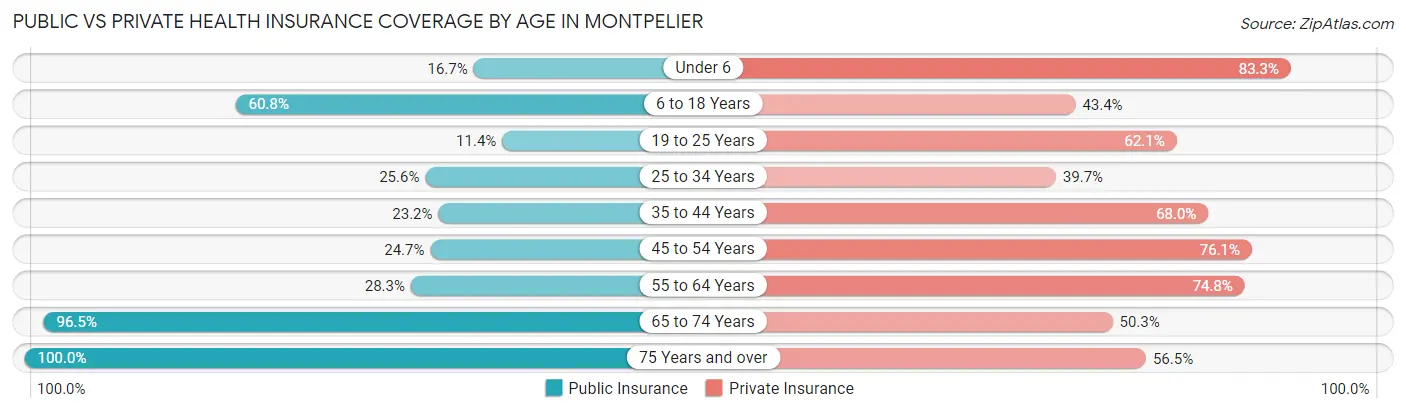
| Age Bracket | Public Insurance | Private Insurance |
| Under 6 | 12 (16.7%) | 60 (83.3%) |
| 6 to 18 Years | 101 (60.8%) | 72 (43.4%) |
| 19 to 25 Years | 15 (11.4%) | 82 (62.1%) |
| 25 to 34 Years | 40 (25.6%) | 62 (39.7%) |
| 35 to 44 Years | 29 (23.2%) | 85 (68.0%) |
| 45 to 54 Years | 61 (24.7%) | 188 (76.1%) |
| 55 to 64 Years | 64 (28.3%) | 169 (74.8%) |
| 65 to 74 Years | 192 (96.5%) | 100 (50.2%) |
| 75 Years and over | 147 (100.0%) | 83 (56.5%) |
| Total | 661 (45.0%) | 901 (61.3%) |
Disability Status by Sex by Age in Montpelier
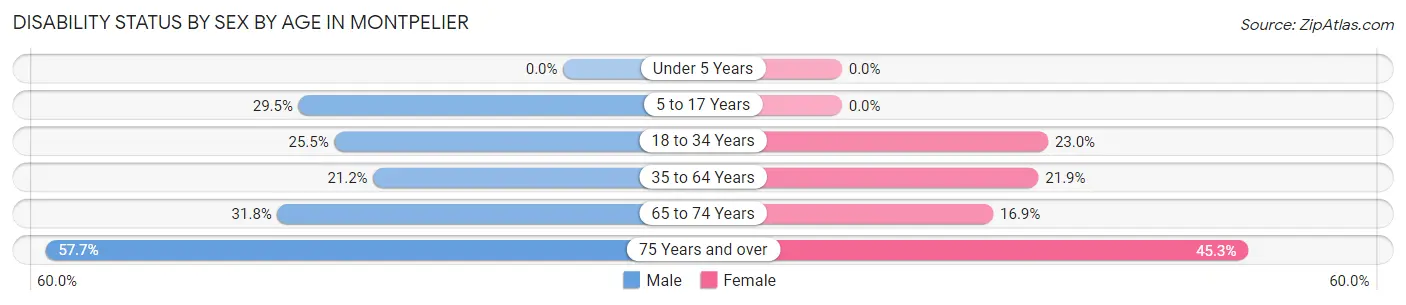
| Age Bracket | Male | Female |
| Under 5 Years | 0 (0.0%) | 0 (0.0%) |
| 5 to 17 Years | 33 (29.5%) | 0 (0.0%) |
| 18 to 34 Years | 40 (25.5%) | 31 (23.0%) |
| 35 to 64 Years | 55 (21.1%) | 74 (21.9%) |
| 65 to 74 Years | 35 (31.8%) | 15 (16.9%) |
| 75 Years and over | 30 (57.7%) | 43 (45.3%) |
Disability Class by Sex by Age in Montpelier
Disability Class: Hearing Difficulty
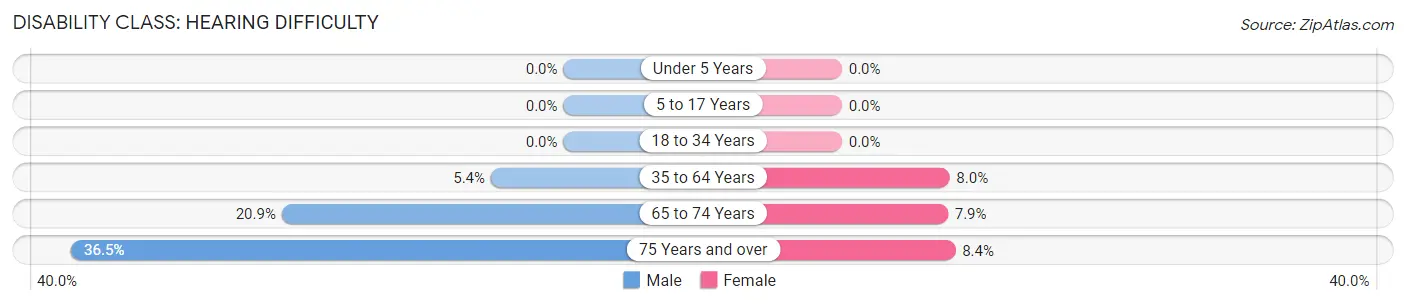
| Age Bracket | Male | Female |
| Under 5 Years | 0 (0.0%) | 0 (0.0%) |
| 5 to 17 Years | 0 (0.0%) | 0 (0.0%) |
| 18 to 34 Years | 0 (0.0%) | 0 (0.0%) |
| 35 to 64 Years | 14 (5.4%) | 27 (8.0%) |
| 65 to 74 Years | 23 (20.9%) | 7 (7.9%) |
| 75 Years and over | 19 (36.5%) | 8 (8.4%) |
Disability Class: Vision Difficulty
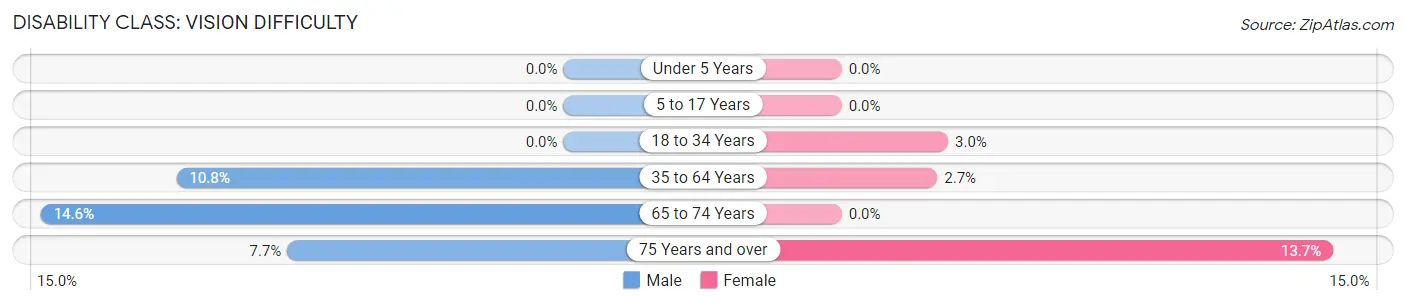
| Age Bracket | Male | Female |
| Under 5 Years | 0 (0.0%) | 0 (0.0%) |
| 5 to 17 Years | 0 (0.0%) | 0 (0.0%) |
| 18 to 34 Years | 0 (0.0%) | 4 (3.0%) |
| 35 to 64 Years | 28 (10.8%) | 9 (2.7%) |
| 65 to 74 Years | 16 (14.5%) | 0 (0.0%) |
| 75 Years and over | 4 (7.7%) | 13 (13.7%) |
Disability Class: Cognitive Difficulty
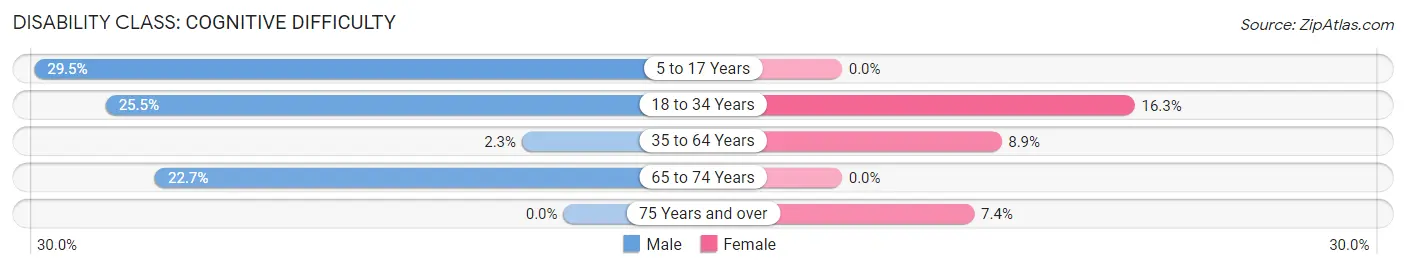
| Age Bracket | Male | Female |
| 5 to 17 Years | 33 (29.5%) | 0 (0.0%) |
| 18 to 34 Years | 40 (25.5%) | 22 (16.3%) |
| 35 to 64 Years | 6 (2.3%) | 30 (8.9%) |
| 65 to 74 Years | 25 (22.7%) | 0 (0.0%) |
| 75 Years and over | 0 (0.0%) | 7 (7.4%) |
Disability Class: Ambulatory Difficulty
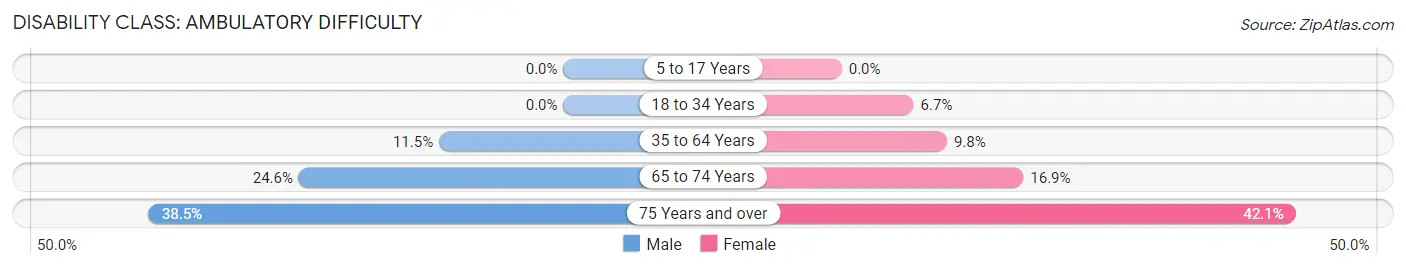
| Age Bracket | Male | Female |
| 5 to 17 Years | 0 (0.0%) | 0 (0.0%) |
| 18 to 34 Years | 0 (0.0%) | 9 (6.7%) |
| 35 to 64 Years | 30 (11.5%) | 33 (9.8%) |
| 65 to 74 Years | 27 (24.5%) | 15 (16.9%) |
| 75 Years and over | 20 (38.5%) | 40 (42.1%) |
Disability Class: Self-Care Difficulty
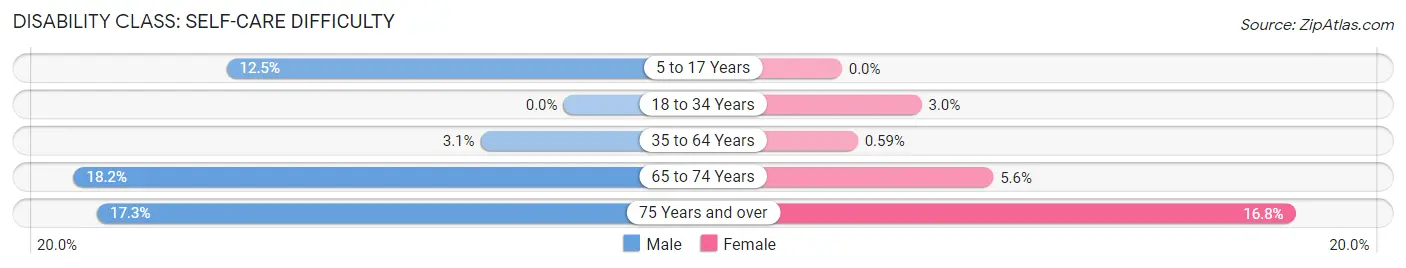
| Age Bracket | Male | Female |
| 5 to 17 Years | 14 (12.5%) | 0 (0.0%) |
| 18 to 34 Years | 0 (0.0%) | 4 (3.0%) |
| 35 to 64 Years | 8 (3.1%) | 2 (0.6%) |
| 65 to 74 Years | 20 (18.2%) | 5 (5.6%) |
| 75 Years and over | 9 (17.3%) | 16 (16.8%) |
Technology Access in Montpelier
Computing Device Access in Montpelier
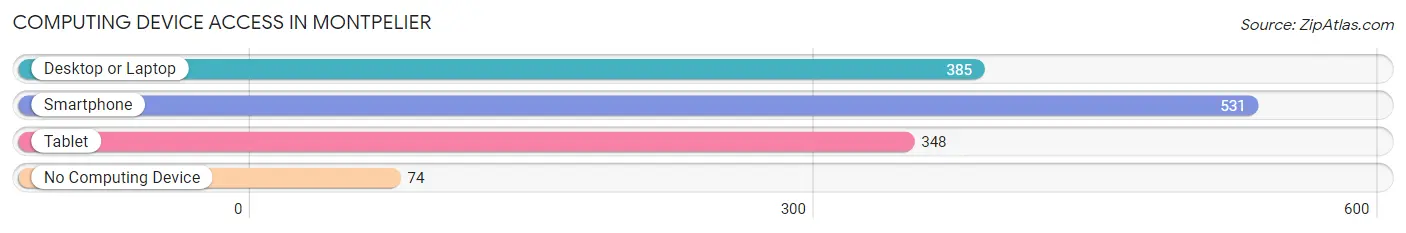
| Device Type | # Households | % Households |
| Desktop or Laptop | 385 | 57.6% |
| Smartphone | 531 | 79.4% |
| Tablet | 348 | 52.0% |
| No Computing Device | 74 | 11.1% |
| Total | 669 | 100.0% |
Internet Access in Montpelier
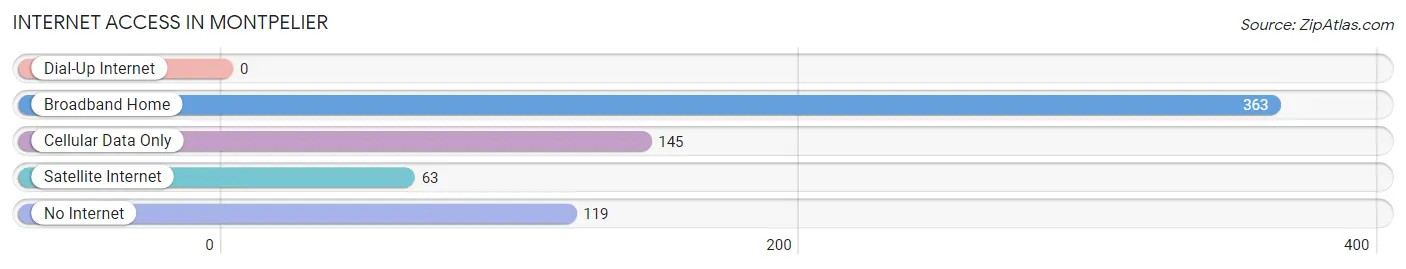
| Internet Type | # Households | % Households |
| Dial-Up Internet | 0 | 0.0% |
| Broadband Home | 363 | 54.3% |
| Cellular Data Only | 145 | 21.7% |
| Satellite Internet | 63 | 9.4% |
| No Internet | 119 | 17.8% |
| Total | 669 | 100.0% |
Montpelier Summary
Montpelier, Indiana is a small town located in Blackford County, Indiana. It is situated in the east-central part of the state, about 40 miles northeast of Indianapolis. The town has a population of around 3,000 people and is the county seat of Blackford County.
History
Montpelier was founded in 1837 by a group of settlers from Ohio. The town was named after the French city of Montpellier, which was the birthplace of one of the settlers. The town was incorporated in 1845 and was the first town in Blackford County.
In the late 19th century, Montpelier was a thriving agricultural center. The town was home to several grain mills, a sawmill, a flour mill, and a woolen mill. The town also had a number of stores, a bank, and a hotel.
In the early 20th century, Montpelier was a major railroad hub. The town was served by the Pennsylvania Railroad, the Baltimore & Ohio Railroad, and the Chicago & Eastern Illinois Railroad. The railroads brought a great deal of economic activity to the town, and it became a major shipping center for the region.
Geography
Montpelier is located in east-central Indiana, about 40 miles northeast of Indianapolis. The town is situated in the Blackford County, which is part of the Central Indiana region. The town is located on the banks of the Mississinewa River, which flows through the town.
The town has a total area of 1.7 square miles, all of which is land. The town is located in a flat, low-lying area, with an elevation of around 800 feet. The climate in Montpelier is humid continental, with hot summers and cold winters.
Economy
Montpelier’s economy is largely based on agriculture and manufacturing. The town is home to several grain mills, a sawmill, a flour mill, and a woolen mill. The town also has a number of stores, a bank, and a hotel.
The town is also home to several manufacturing companies, including a plastics manufacturer, a metal fabricator, and a machine shop. The town is also home to a number of small businesses, including restaurants, retail stores, and service providers.
Demographics
As of the 2010 census, Montpelier had a population of 3,037 people. The racial makeup of the town was 97.3% White, 0.7% African American, 0.2% Native American, 0.3% Asian, 0.1% Pacific Islander, 0.4% from other races, and 1.0% from two or more races. Hispanic or Latino of any race were 1.2% of the population.
The median household income in Montpelier was $41,944, and the median family income was $50,938. The per capita income for the town was $20,845. About 11.2% of families and 14.2% of the population were below the poverty line, including 19.2% of those under age 18 and 8.2% of those age 65 or over.
Common Questions
What is Per Capita Income in Montpelier?
Per Capita income in Montpelier is $36,390.
What is the Median Family Income in Montpelier?
Median Family Income in Montpelier is $65,893.
What is the Median Household income in Montpelier?
Median Household Income in Montpelier is $47,734.
What is Income or Wage Gap in Montpelier?
Income or Wage Gap in Montpelier is 24.2%.
Women in Montpelier earn 75.8 cents for every dollar earned by a man.
What is Inequality or Gini Index in Montpelier?
Inequality or Gini Index in Montpelier is 0.53.
What is the Total Population of Montpelier?
Total Population of Montpelier is 1,470.
What is the Total Male Population of Montpelier?
Total Male Population of Montpelier is 736.
What is the Total Female Population of Montpelier?
Total Female Population of Montpelier is 734.
What is the Ratio of Males per 100 Females in Montpelier?
There are 100.27 Males per 100 Females in Montpelier.
What is the Ratio of Females per 100 Males in Montpelier?
There are 99.73 Females per 100 Males in Montpelier.
What is the Median Population Age in Montpelier?
Median Population Age in Montpelier is 48.6 Years.
What is the Average Family Size in Montpelier
Average Family Size in Montpelier is 3.0 People.
What is the Average Household Size in Montpelier
Average Household Size in Montpelier is 2.2 People.
How Large is the Labor Force in Montpelier?
There are 821 People in the Labor Forcein in Montpelier.
What is the Percentage of People in the Labor Force in Montpelier?
65.7% of People are in the Labor Force in Montpelier.
What is the Unemployment Rate in Montpelier?
Unemployment Rate in Montpelier is 5.1%.