Monroe, IN Map & Demographics
Monroe Map
Monroe Overview
$28,167
PER CAPITA INCOME
$82,583
AVG FAMILY INCOME
$68,125
AVG HOUSEHOLD INCOME
35.2%
WAGE / INCOME GAP [ % ]
64.8¢/ $1
WAGE / INCOME GAP [ $ ]
0.34
INEQUALITY / GINI INDEX
640
TOTAL POPULATION
314
MALE POPULATION
326
FEMALE POPULATION
96.32
MALES / 100 FEMALES
103.82
FEMALES / 100 MALES
29.5
MEDIAN AGE
3.4
AVG FAMILY SIZE
2.8
AVG HOUSEHOLD SIZE
360
LABOR FORCE [ PEOPLE ]
76.4%
PERCENT IN LABOR FORCE
0.3%
UNEMPLOYMENT RATE
Monroe Zip Codes
Monroe Area Codes
Income in Monroe
Income Overview in Monroe
Per Capita Income in Monroe is $28,167, while median incomes of families and households are $82,583 and $68,125 respectively.
| Characteristic | Number | Measure |
| Per Capita Income | 640 | $28,167 |
| Median Family Income | 165 | $82,583 |
| Mean Family Income | 165 | $90,192 |
| Median Household Income | 233 | $68,125 |
| Mean Household Income | 233 | $77,014 |
| Income Deficit | 165 | $0 |
| Wage / Income Gap (%) | 640 | 35.17% |
| Wage / Income Gap ($) | 640 | 64.83¢ per $1 |
| Gini / Inequality Index | 640 | 0.34 |
Earnings by Sex in Monroe
Average Earnings in Monroe are $37,614, $45,313 for men and $29,375 for women, a difference of 35.2%.

| Sex | Number | Average Earnings |
| Male | 177 (47.4%) | $45,313 |
| Female | 196 (52.5%) | $29,375 |
| Total | 373 (100.0%) | $37,614 |
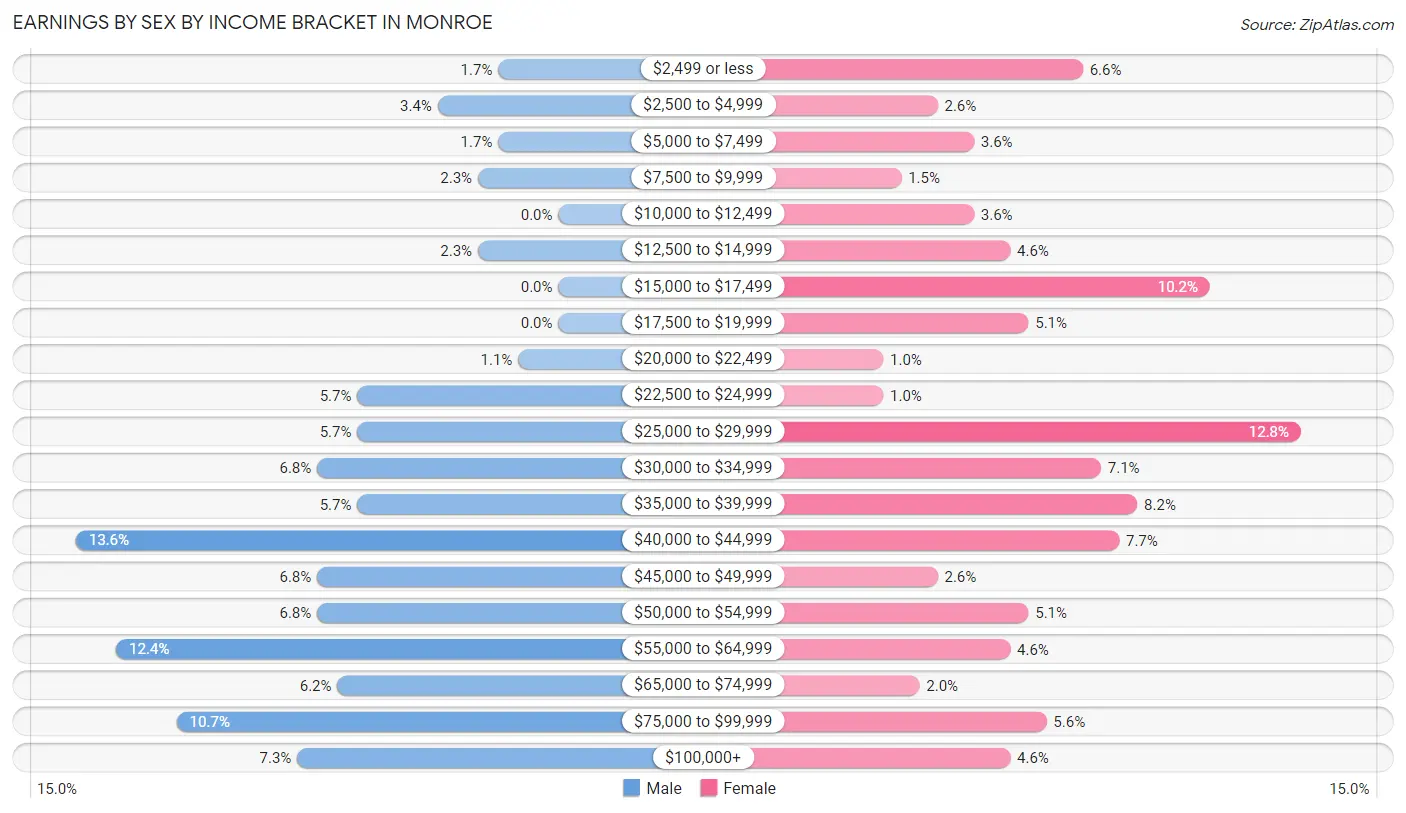
Earnings by Sex by Income Bracket in Monroe
The most common earnings brackets in Monroe are $40,000 to $44,999 for men (24 | 13.6%) and $25,000 to $29,999 for women (25 | 12.8%).
| Income | Male | Female |
| $2,499 or less | 3 (1.7%) | 13 (6.6%) |
| $2,500 to $4,999 | 6 (3.4%) | 5 (2.5%) |
| $5,000 to $7,499 | 3 (1.7%) | 7 (3.6%) |
| $7,500 to $9,999 | 4 (2.3%) | 3 (1.5%) |
| $10,000 to $12,499 | 0 (0.0%) | 7 (3.6%) |
| $12,500 to $14,999 | 4 (2.3%) | 9 (4.6%) |
| $15,000 to $17,499 | 0 (0.0%) | 20 (10.2%) |
| $17,500 to $19,999 | 0 (0.0%) | 10 (5.1%) |
| $20,000 to $22,499 | 2 (1.1%) | 2 (1.0%) |
| $22,500 to $24,999 | 10 (5.7%) | 2 (1.0%) |
| $25,000 to $29,999 | 10 (5.7%) | 25 (12.8%) |
| $30,000 to $34,999 | 12 (6.8%) | 14 (7.1%) |
| $35,000 to $39,999 | 10 (5.7%) | 16 (8.2%) |
| $40,000 to $44,999 | 24 (13.6%) | 15 (7.6%) |
| $45,000 to $49,999 | 12 (6.8%) | 5 (2.5%) |
| $50,000 to $54,999 | 12 (6.8%) | 10 (5.1%) |
| $55,000 to $64,999 | 22 (12.4%) | 9 (4.6%) |
| $65,000 to $74,999 | 11 (6.2%) | 4 (2.0%) |
| $75,000 to $99,999 | 19 (10.7%) | 11 (5.6%) |
| $100,000+ | 13 (7.3%) | 9 (4.6%) |
| Total | 177 (100.0%) | 196 (100.0%) |
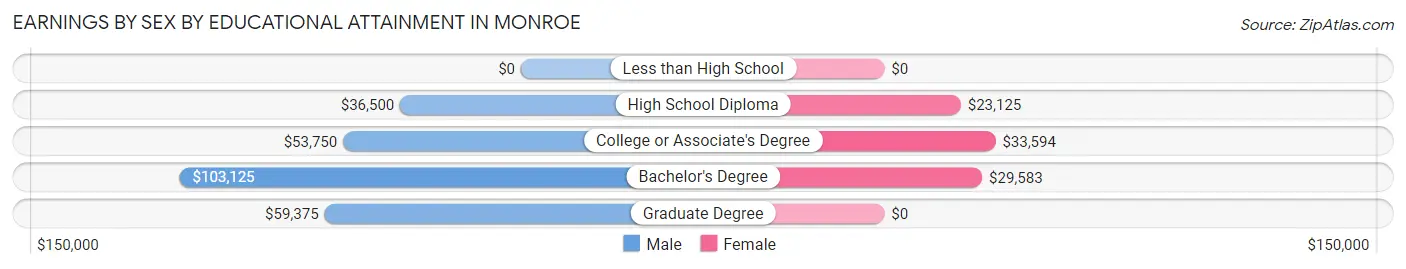
Earnings by Sex by Educational Attainment in Monroe
Average earnings in Monroe are $50,357 for men and $33,295 for women, a difference of 33.9%. Men with an educational attainment of bachelor's degree enjoy the highest average annual earnings of $103,125, while those with high school diploma education earn the least with $36,500. Women with an educational attainment of college or associate's degree earn the most with the average annual earnings of $33,594, while those with high school diploma education have the smallest earnings of $23,125.
| Educational Attainment | Male Income | Female Income |
| Less than High School | - | - |
| High School Diploma | $36,500 | $23,125 |
| College or Associate's Degree | $53,750 | $33,594 |
| Bachelor's Degree | $103,125 | $29,583 |
| Graduate Degree | $59,375 | $0 |
| Total | $50,357 | $33,295 |
Family Income in Monroe
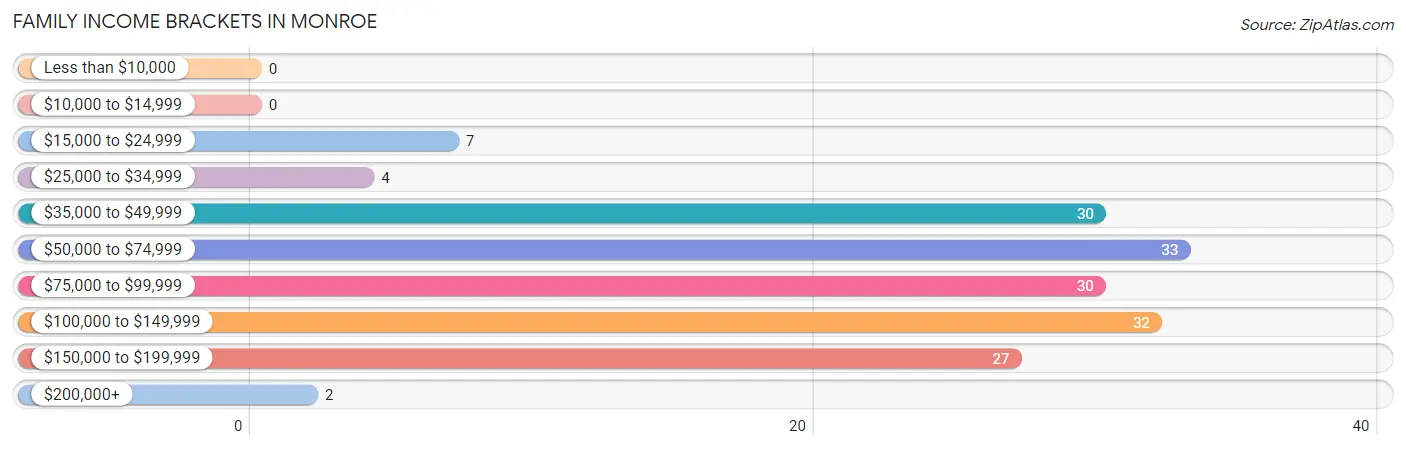
Family Income Brackets in Monroe
According to the Monroe family income data, there are 33 families falling into the $50,000 to $74,999 income range, which is the most common income bracket and makes up 20.0% of all families.
| Income Bracket | # Families | % Families |
| Less than $10,000 | 0 | 0.0% |
| $10,000 to $14,999 | 0 | 0.0% |
| $15,000 to $24,999 | 7 | 4.2% |
| $25,000 to $34,999 | 4 | 2.4% |
| $35,000 to $49,999 | 30 | 18.2% |
| $50,000 to $74,999 | 33 | 20.0% |
| $75,000 to $99,999 | 30 | 18.2% |
| $100,000 to $149,999 | 32 | 19.4% |
| $150,000 to $199,999 | 27 | 16.4% |
| $200,000+ | 2 | 1.2% |
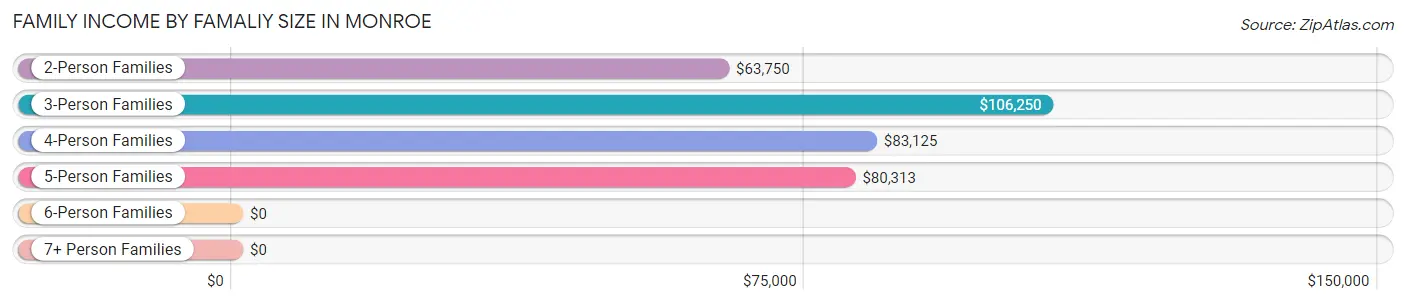
Family Income by Famaliy Size in Monroe
3-person families (26 | 15.8%) account for the highest median family income in Monroe with $106,250 per family, while 3-person families (26 | 15.8%) have the highest median income of $35,417 per family member.
| Income Bracket | # Families | Median Income |
| 2-Person Families | 53 (32.1%) | $63,750 |
| 3-Person Families | 26 (15.8%) | $106,250 |
| 4-Person Families | 56 (33.9%) | $83,125 |
| 5-Person Families | 23 (13.9%) | $80,313 |
| 6-Person Families | 7 (4.2%) | $0 |
| 7+ Person Families | 0 (0.0%) | $0 |
| Total | 165 (100.0%) | $82,583 |
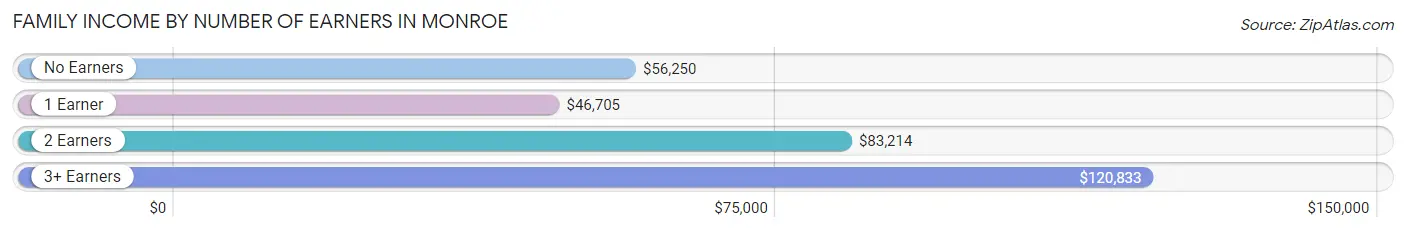
Family Income by Number of Earners in Monroe
The median family income in Monroe is $82,583, with families comprising 3+ earners (28) having the highest median family income of $120,833, while families with 1 earner (39) have the lowest median family income of $46,705, accounting for 17.0% and 23.6% of families, respectively.
| Number of Earners | # Families | Median Income |
| No Earners | 12 (7.3%) | $56,250 |
| 1 Earner | 39 (23.6%) | $46,705 |
| 2 Earners | 86 (52.1%) | $83,214 |
| 3+ Earners | 28 (17.0%) | $120,833 |
| Total | 165 (100.0%) | $82,583 |
Household Income in Monroe
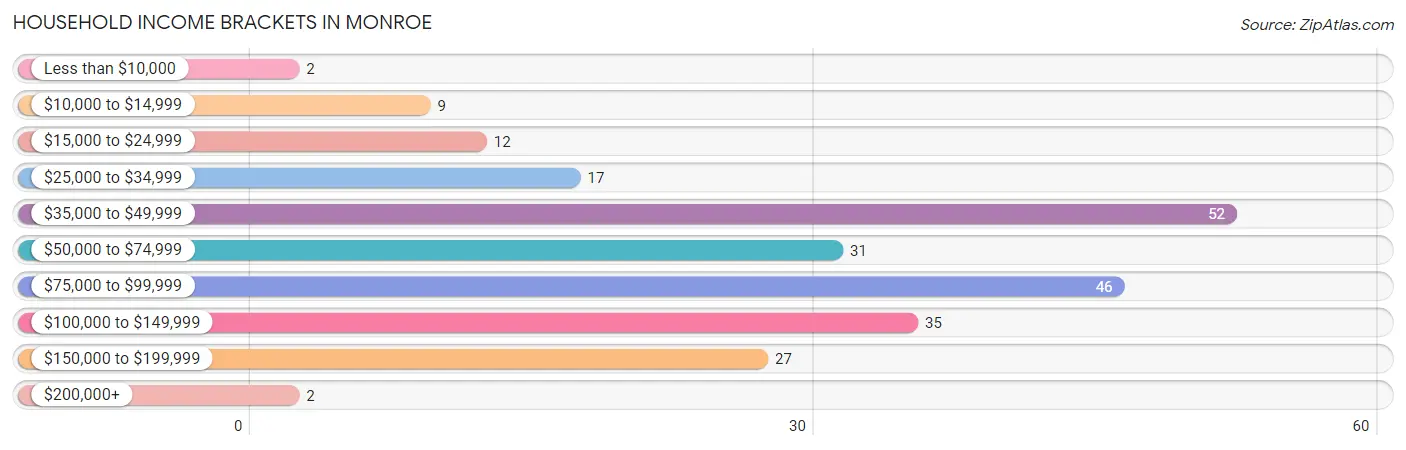
Household Income Brackets in Monroe
With 52 households falling in the category, the $35,000 to $49,999 income range is the most frequent in Monroe, accounting for 22.3% of all households. In contrast, only 2 households (0.9%) fall into the less than $10,000 income bracket, making it the least populous group.
| Income Bracket | # Households | % Households |
| Less than $10,000 | 2 | 0.9% |
| $10,000 to $14,999 | 9 | 3.9% |
| $15,000 to $24,999 | 12 | 5.2% |
| $25,000 to $34,999 | 17 | 7.3% |
| $35,000 to $49,999 | 52 | 22.3% |
| $50,000 to $74,999 | 31 | 13.3% |
| $75,000 to $99,999 | 46 | 19.7% |
| $100,000 to $149,999 | 35 | 15.0% |
| $150,000 to $199,999 | 27 | 11.6% |
| $200,000+ | 2 | 0.9% |
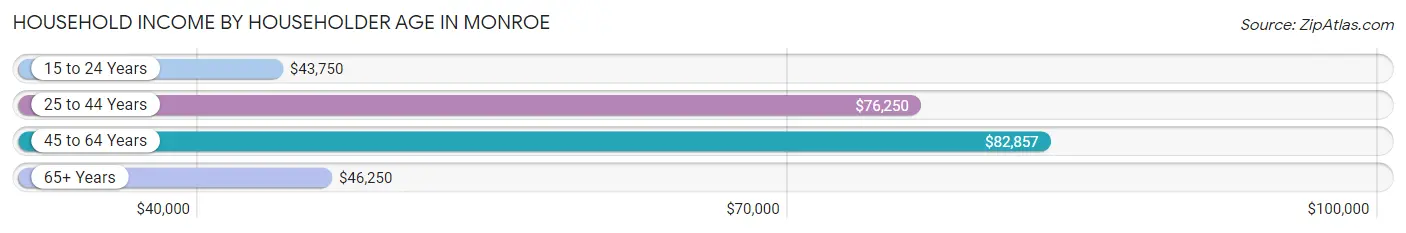
Household Income by Householder Age in Monroe
The median household income in Monroe is $68,125, with the highest median household income of $82,857 found in the 45 to 64 years age bracket for the primary householder. A total of 88 households (37.8%) fall into this category. Meanwhile, the 15 to 24 years age bracket for the primary householder has the lowest median household income of $43,750, with 9 households (3.9%) in this group.
| Income Bracket | # Households | Median Income |
| 15 to 24 Years | 9 (3.9%) | $43,750 |
| 25 to 44 Years | 98 (42.1%) | $76,250 |
| 45 to 64 Years | 88 (37.8%) | $82,857 |
| 65+ Years | 38 (16.3%) | $46,250 |
| Total | 233 (100.0%) | $68,125 |
Poverty in Monroe
Income Below Poverty by Sex and Age in Monroe
With 4.1% poverty level for males and 12.3% for females among the residents of Monroe, 12 to 14 year old males and 15 year old females are the most vulnerable to poverty, with 3 males (18.8%) and 5 females (45.5%) in their respective age groups living below the poverty level.
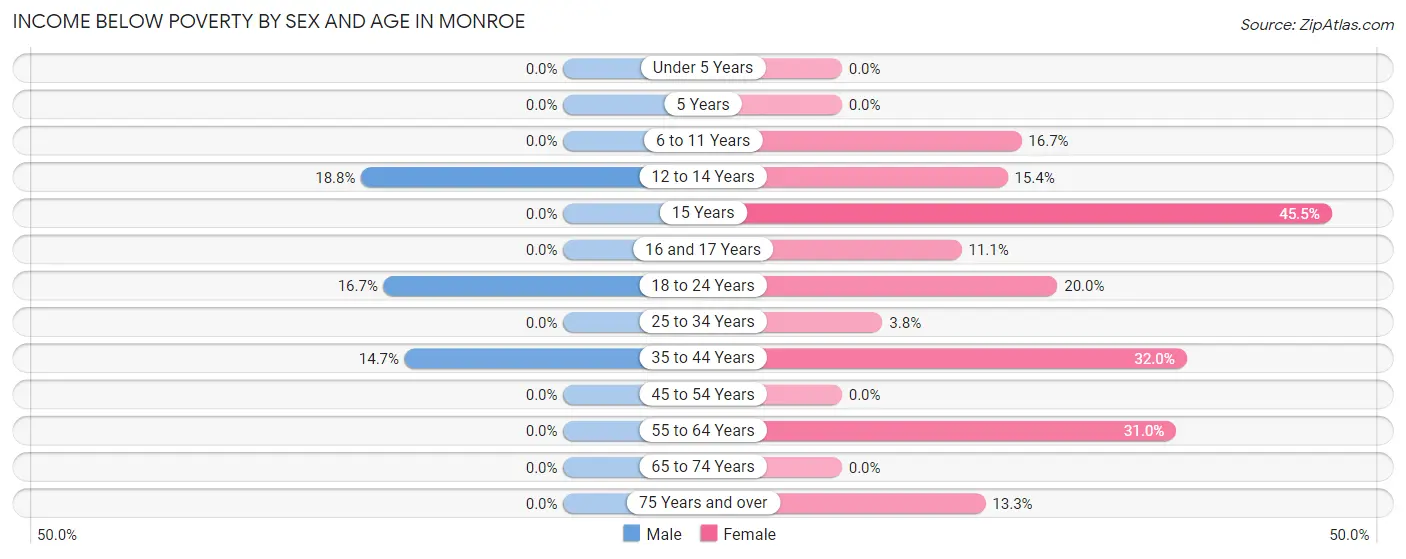
| Age Bracket | Male | Female |
| Under 5 Years | 0 (0.0%) | 0 (0.0%) |
| 5 Years | 0 (0.0%) | 0 (0.0%) |
| 6 to 11 Years | 0 (0.0%) | 4 (16.7%) |
| 12 to 14 Years | 3 (18.8%) | 2 (15.4%) |
| 15 Years | 0 (0.0%) | 5 (45.5%) |
| 16 and 17 Years | 0 (0.0%) | 2 (11.1%) |
| 18 to 24 Years | 5 (16.7%) | 6 (20.0%) |
| 25 to 34 Years | 0 (0.0%) | 2 (3.8%) |
| 35 to 44 Years | 5 (14.7%) | 8 (32.0%) |
| 45 to 54 Years | 0 (0.0%) | 0 (0.0%) |
| 55 to 64 Years | 0 (0.0%) | 9 (31.0%) |
| 65 to 74 Years | 0 (0.0%) | 0 (0.0%) |
| 75 Years and over | 0 (0.0%) | 2 (13.3%) |
| Total | 13 (4.1%) | 40 (12.3%) |
Income Above Poverty by Sex and Age in Monroe
According to the poverty statistics in Monroe, males aged under 5 years and females aged under 5 years are the age groups that are most secure financially, with 100.0% of males and 100.0% of females in these age groups living above the poverty line.
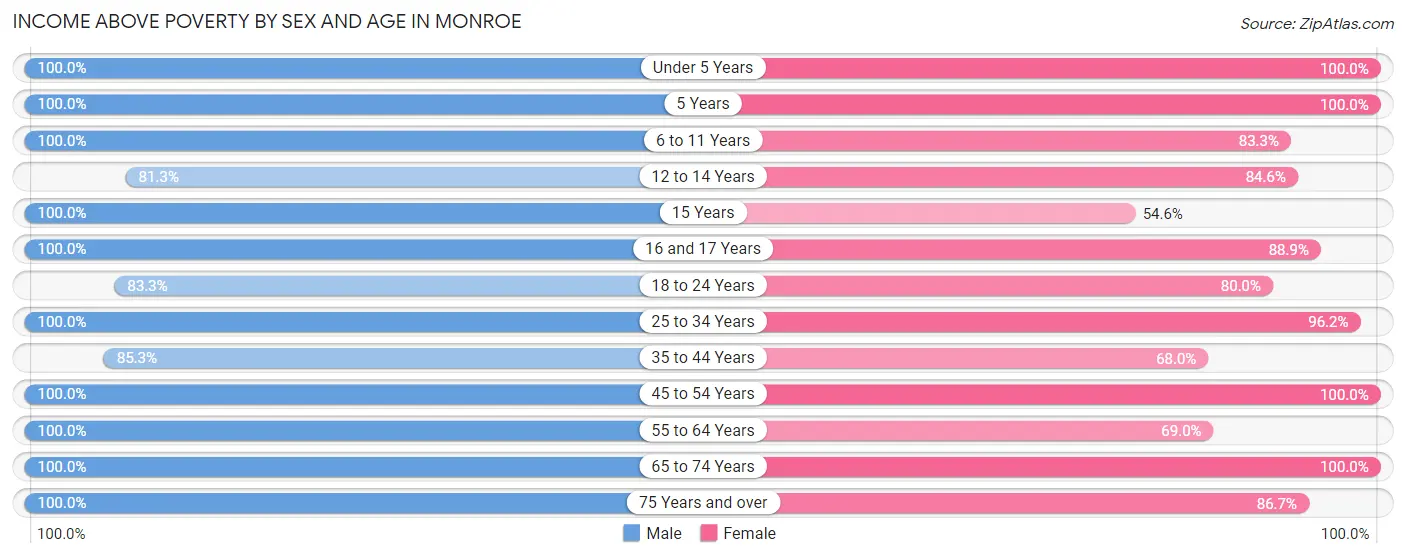
| Age Bracket | Male | Female |
| Under 5 Years | 37 (100.0%) | 18 (100.0%) |
| 5 Years | 11 (100.0%) | 5 (100.0%) |
| 6 to 11 Years | 32 (100.0%) | 20 (83.3%) |
| 12 to 14 Years | 13 (81.2%) | 11 (84.6%) |
| 15 Years | 2 (100.0%) | 6 (54.5%) |
| 16 and 17 Years | 18 (100.0%) | 16 (88.9%) |
| 18 to 24 Years | 25 (83.3%) | 24 (80.0%) |
| 25 to 34 Years | 52 (100.0%) | 51 (96.2%) |
| 35 to 44 Years | 29 (85.3%) | 17 (68.0%) |
| 45 to 54 Years | 27 (100.0%) | 68 (100.0%) |
| 55 to 64 Years | 30 (100.0%) | 20 (69.0%) |
| 65 to 74 Years | 14 (100.0%) | 17 (100.0%) |
| 75 Years and over | 11 (100.0%) | 13 (86.7%) |
| Total | 301 (95.9%) | 286 (87.7%) |
Income Below Poverty Among Married-Couple Families in Monroe
The poverty statistics for married-couple families in Monroe show that 3.8% or 5 of the total 133 families live below the poverty line. Families with 1 or 2 children have the highest poverty rate of 9.6%, comprising of 5 families. On the other hand, families with no children have the lowest poverty rate of 0.0%, which includes 0 families.
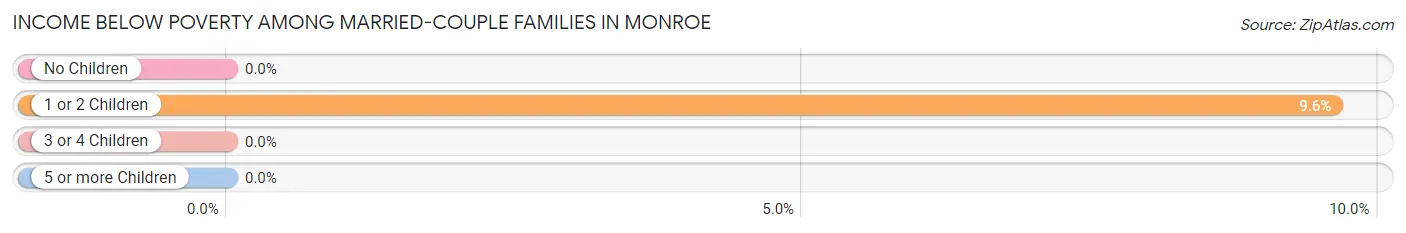
| Children | Above Poverty | Below Poverty |
| No Children | 59 (100.0%) | 0 (0.0%) |
| 1 or 2 Children | 47 (90.4%) | 5 (9.6%) |
| 3 or 4 Children | 22 (100.0%) | 0 (0.0%) |
| 5 or more Children | 0 (0.0%) | 0 (0.0%) |
| Total | 128 (96.2%) | 5 (3.8%) |
Income Below Poverty Among Single-Parent Households in Monroe
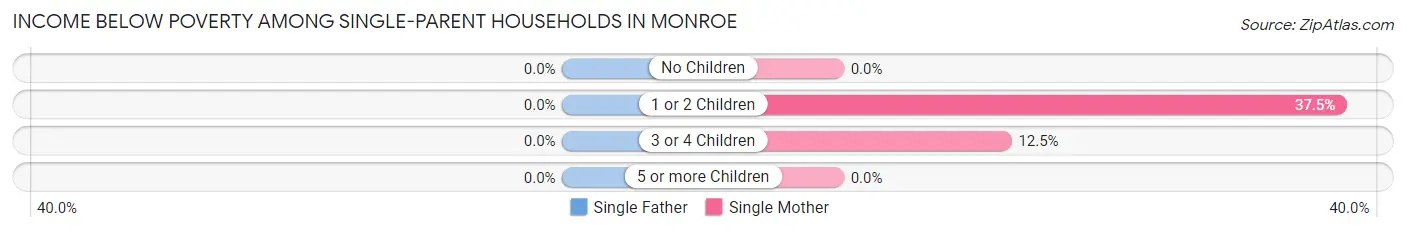
| Children | Single Father | Single Mother |
| No Children | 0 (0.0%) | 0 (0.0%) |
| 1 or 2 Children | 0 (0.0%) | 3 (37.5%) |
| 3 or 4 Children | 0 (0.0%) | 2 (12.5%) |
| 5 or more Children | 0 (0.0%) | 0 (0.0%) |
| Total | 0 (0.0%) | 5 (17.2%) |
Income Below Poverty Among Married-Couple vs Single-Parent Households in Monroe
The poverty data for Monroe shows that 5 of the married-couple family households (3.8%) and 5 of the single-parent households (15.6%) are living below the poverty level. Within the married-couple family households, those with 1 or 2 children have the highest poverty rate, with 5 households (9.6%) falling below the poverty line. Among the single-parent households, those with 1 or 2 children have the highest poverty rate, with 3 household (30.0%) living below poverty.
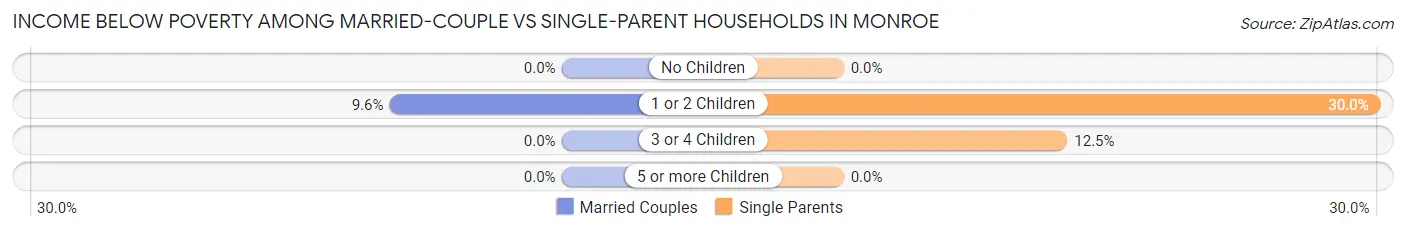
| Children | Married-Couple Families | Single-Parent Households |
| No Children | 0 (0.0%) | 0 (0.0%) |
| 1 or 2 Children | 5 (9.6%) | 3 (30.0%) |
| 3 or 4 Children | 0 (0.0%) | 2 (12.5%) |
| 5 or more Children | 0 (0.0%) | 0 (0.0%) |
| Total | 5 (3.8%) | 5 (15.6%) |
Race in Monroe
The most populous races in Monroe are White / Caucasian (578 | 90.3%), Hispanic or Latino (50 | 7.8%), and Two or more Races (42 | 6.6%).
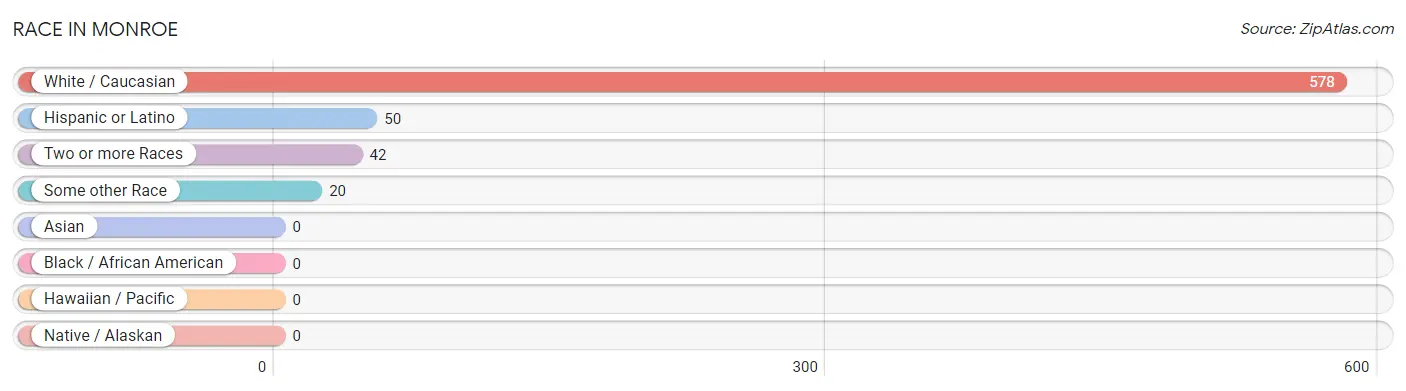
| Race | # Population | % Population |
| Asian | 0 | 0.0% |
| Black / African American | 0 | 0.0% |
| Hawaiian / Pacific | 0 | 0.0% |
| Hispanic or Latino | 50 | 7.8% |
| Native / Alaskan | 0 | 0.0% |
| White / Caucasian | 578 | 90.3% |
| Two or more Races | 42 | 6.6% |
| Some other Race | 20 | 3.1% |
| Total | 640 | 100.0% |
Ancestry in Monroe
The most populous ancestries reported in Monroe are German (167 | 26.1%), Irish (60 | 9.4%), American (55 | 8.6%), Mexican (47 | 7.3%), and English (44 | 6.9%), together accounting for 58.3% of all Monroe residents.
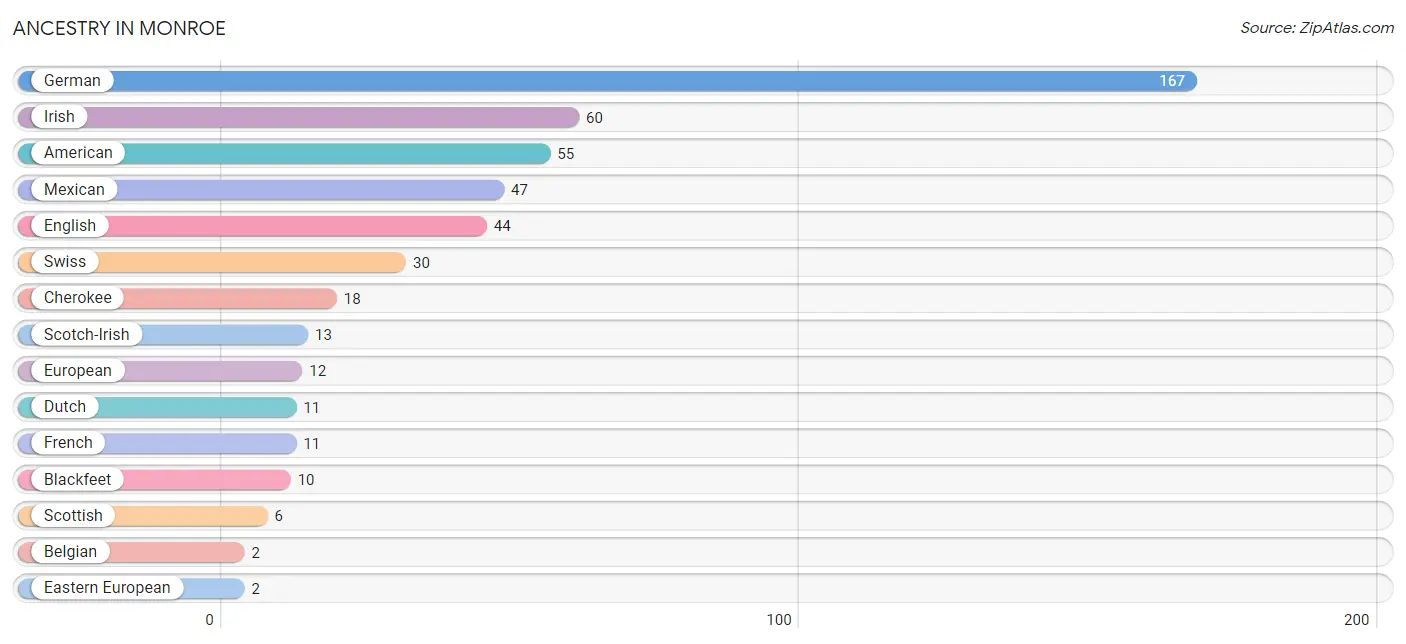
| Ancestry | # Population | % Population |
| American | 55 | 8.6% |
| Belgian | 2 | 0.3% |
| Blackfeet | 10 | 1.6% |
| Cherokee | 18 | 2.8% |
| Dutch | 11 | 1.7% |
| Eastern European | 2 | 0.3% |
| English | 44 | 6.9% |
| European | 12 | 1.9% |
| French | 11 | 1.7% |
| German | 167 | 26.1% |
| Irish | 60 | 9.4% |
| Mexican | 47 | 7.3% |
| Scotch-Irish | 13 | 2.0% |
| Scottish | 6 | 0.9% |
| Swedish | 1 | 0.2% |
| Swiss | 30 | 4.7% | View All 16 Rows |
Immigrants in Monroe

| Immigration Origin | # Population | % Population | View All 0 Rows |
Sex and Age in Monroe
Sex and Age in Monroe
The most populous age groups in Monroe are Under 5 Years (37 | 11.8%) for men and 15 to 19 Years (43 | 13.2%) for women.
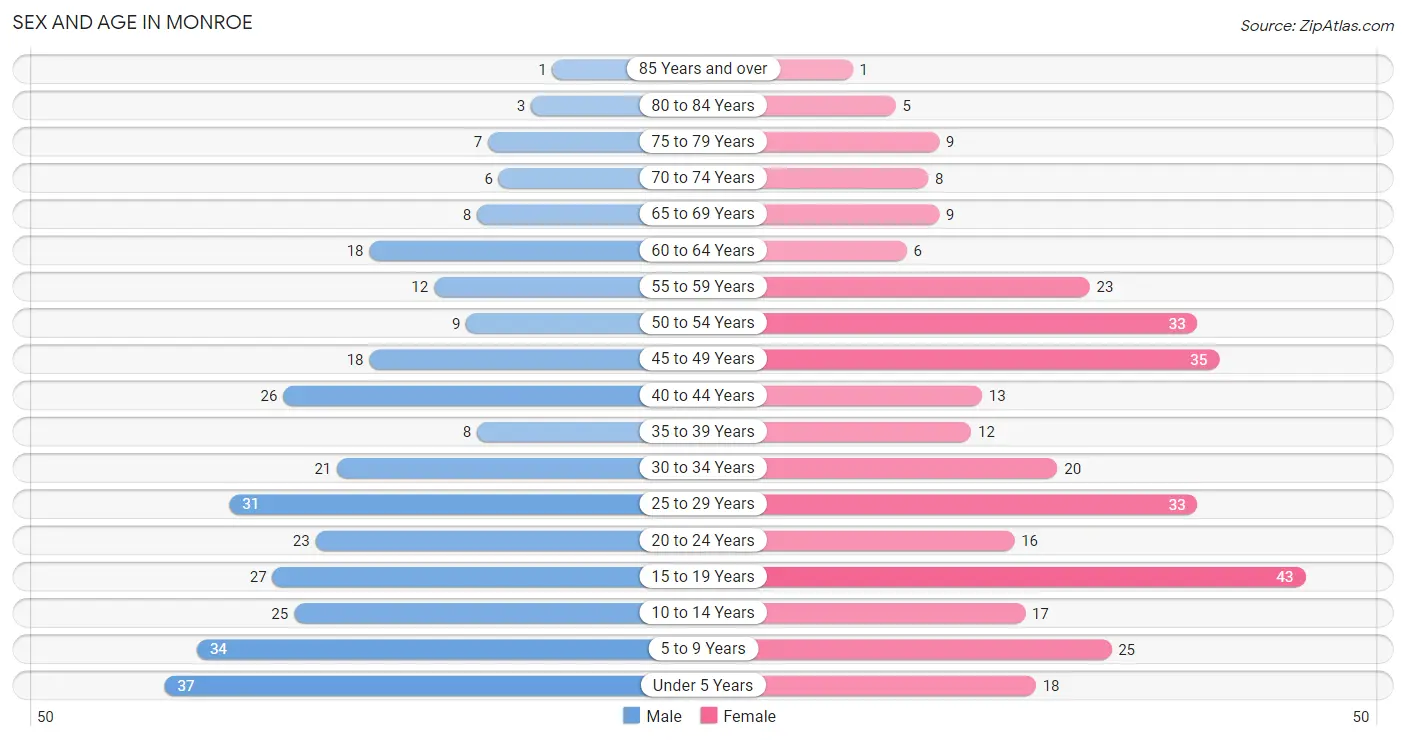
| Age Bracket | Male | Female |
| Under 5 Years | 37 (11.8%) | 18 (5.5%) |
| 5 to 9 Years | 34 (10.8%) | 25 (7.7%) |
| 10 to 14 Years | 25 (8.0%) | 17 (5.2%) |
| 15 to 19 Years | 27 (8.6%) | 43 (13.2%) |
| 20 to 24 Years | 23 (7.3%) | 16 (4.9%) |
| 25 to 29 Years | 31 (9.9%) | 33 (10.1%) |
| 30 to 34 Years | 21 (6.7%) | 20 (6.1%) |
| 35 to 39 Years | 8 (2.5%) | 12 (3.7%) |
| 40 to 44 Years | 26 (8.3%) | 13 (4.0%) |
| 45 to 49 Years | 18 (5.7%) | 35 (10.7%) |
| 50 to 54 Years | 9 (2.9%) | 33 (10.1%) |
| 55 to 59 Years | 12 (3.8%) | 23 (7.1%) |
| 60 to 64 Years | 18 (5.7%) | 6 (1.8%) |
| 65 to 69 Years | 8 (2.5%) | 9 (2.8%) |
| 70 to 74 Years | 6 (1.9%) | 8 (2.5%) |
| 75 to 79 Years | 7 (2.2%) | 9 (2.8%) |
| 80 to 84 Years | 3 (1.0%) | 5 (1.5%) |
| 85 Years and over | 1 (0.3%) | 1 (0.3%) |
| Total | 314 (100.0%) | 326 (100.0%) |
Families and Households in Monroe
Median Family Size in Monroe
The median family size in Monroe is 3.41 persons per family, with single female/mother families (29 | 17.6%) accounting for the largest median family size of 3.62 persons per family. On the other hand, single male/father families (3 | 1.8%) represent the smallest median family size with 2.33 persons per family.
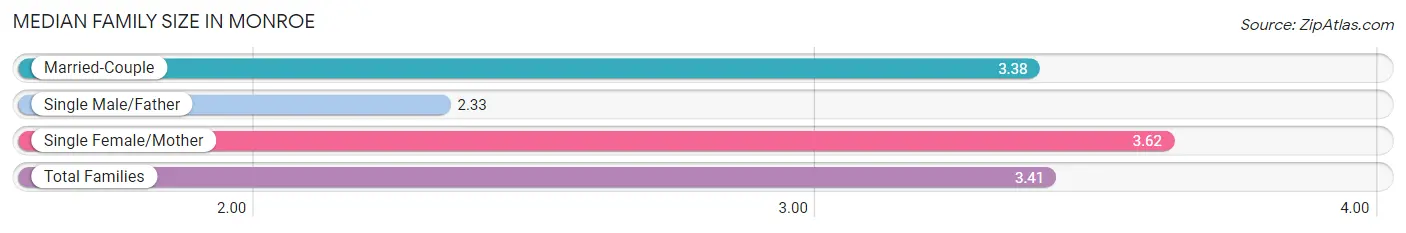
| Family Type | # Families | Family Size |
| Married-Couple | 133 (80.6%) | 3.38 |
| Single Male/Father | 3 (1.8%) | 2.33 |
| Single Female/Mother | 29 (17.6%) | 3.62 |
| Total Families | 165 (100.0%) | 3.41 |
Median Household Size in Monroe
The median household size in Monroe is 2.75 persons per household, with single female/mother households (29 | 12.4%) accounting for the largest median household size of 3.69 persons per household. non-family households (68 | 29.2%) represent the smallest median household size with 1.06 persons per household.
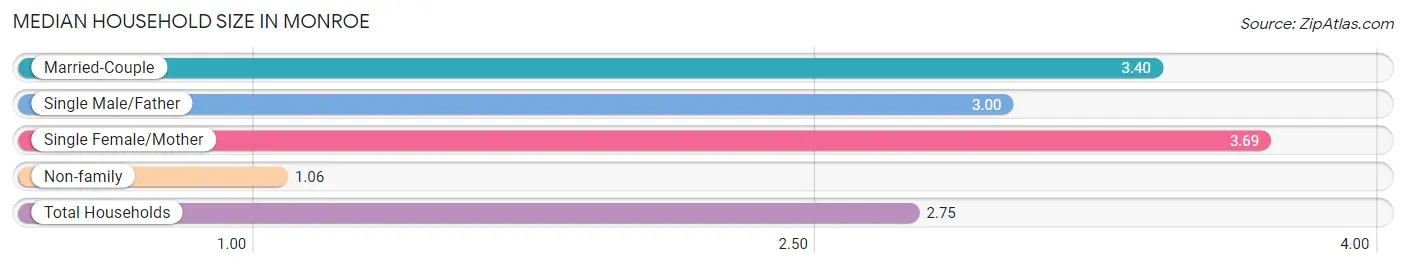
| Household Type | # Households | Household Size |
| Married-Couple | 133 (57.1%) | 3.40 |
| Single Male/Father | 3 (1.3%) | 3.00 |
| Single Female/Mother | 29 (12.4%) | 3.69 |
| Non-family | 68 (29.2%) | 1.06 |
| Total Households | 233 (100.0%) | 2.75 |
Household Size by Marriage Status in Monroe
Out of a total of 233 households in Monroe, 165 (70.8%) are family households, while 68 (29.2%) are nonfamily households. The most numerous type of family households are 4-person households, comprising 57, and the most common type of nonfamily households are 1-person households, comprising 62.
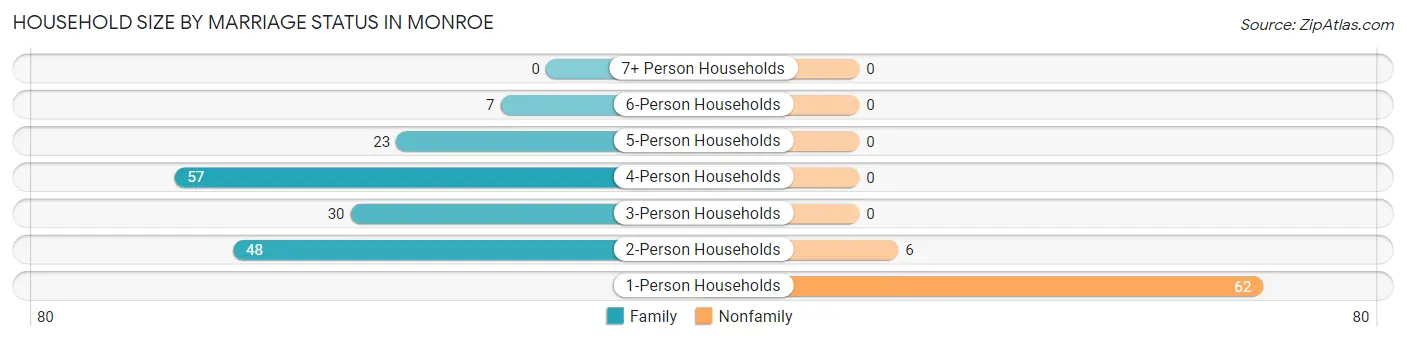
| Household Size | Family Households | Nonfamily Households |
| 1-Person Households | - | 62 (26.6%) |
| 2-Person Households | 48 (20.6%) | 6 (2.6%) |
| 3-Person Households | 30 (12.9%) | 0 (0.0%) |
| 4-Person Households | 57 (24.5%) | 0 (0.0%) |
| 5-Person Households | 23 (9.9%) | 0 (0.0%) |
| 6-Person Households | 7 (3.0%) | 0 (0.0%) |
| 7+ Person Households | 0 (0.0%) | 0 (0.0%) |
| Total | 165 (70.8%) | 68 (29.2%) |
Female Fertility in Monroe
Fertility by Age in Monroe
Average fertility rate in Monroe is 149.0 births per 1,000 women. Women in the age bracket of 20 to 34 years have the highest fertility rate with 348.0 births per 1,000 women. Women in the age bracket of 20 to 34 years acount for 92.3% of all women with births.
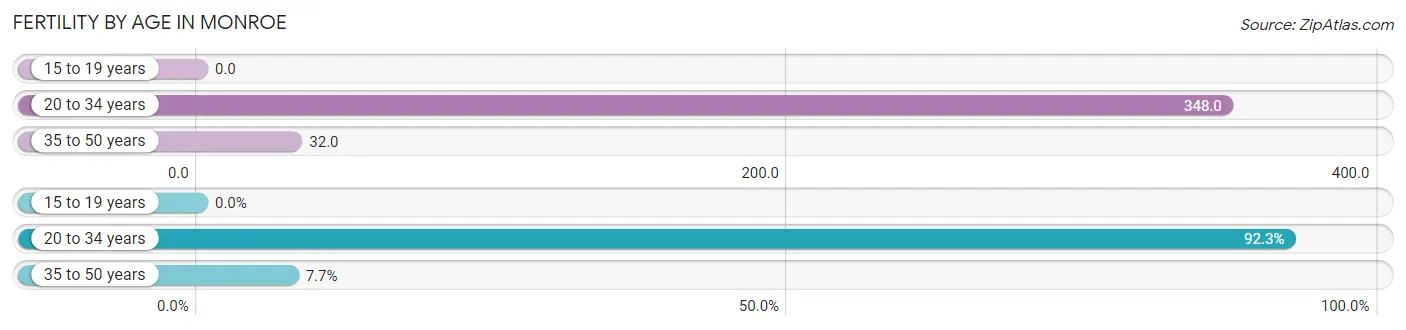
| Age Bracket | Women with Births | Births / 1,000 Women |
| 15 to 19 years | 0 (0.0%) | 0.0 |
| 20 to 34 years | 24 (92.3%) | 348.0 |
| 35 to 50 years | 2 (7.7%) | 32.0 |
| Total | 26 (100.0%) | 149.0 |
Fertility by Age by Marriage Status in Monroe
84.6% of women with births (26) in Monroe are married. The highest percentage of unmarried women with births falls into 35 to 50 years age bracket with 100.0% of them unmarried at the time of birth, while the lowest percentage of unmarried women with births belong to 20 to 34 years age bracket with 8.3% of them unmarried.
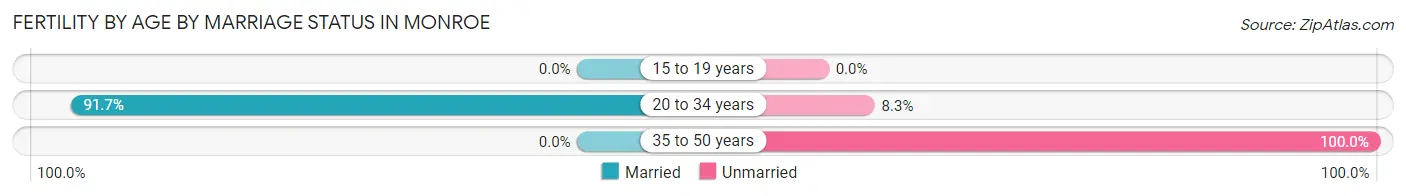
| Age Bracket | Married | Unmarried |
| 15 to 19 years | 0 (0.0%) | 0 (0.0%) |
| 20 to 34 years | 22 (91.7%) | 2 (8.3%) |
| 35 to 50 years | 0 (0.0%) | 2 (100.0%) |
| Total | 22 (84.6%) | 4 (15.4%) |
Fertility by Education in Monroe
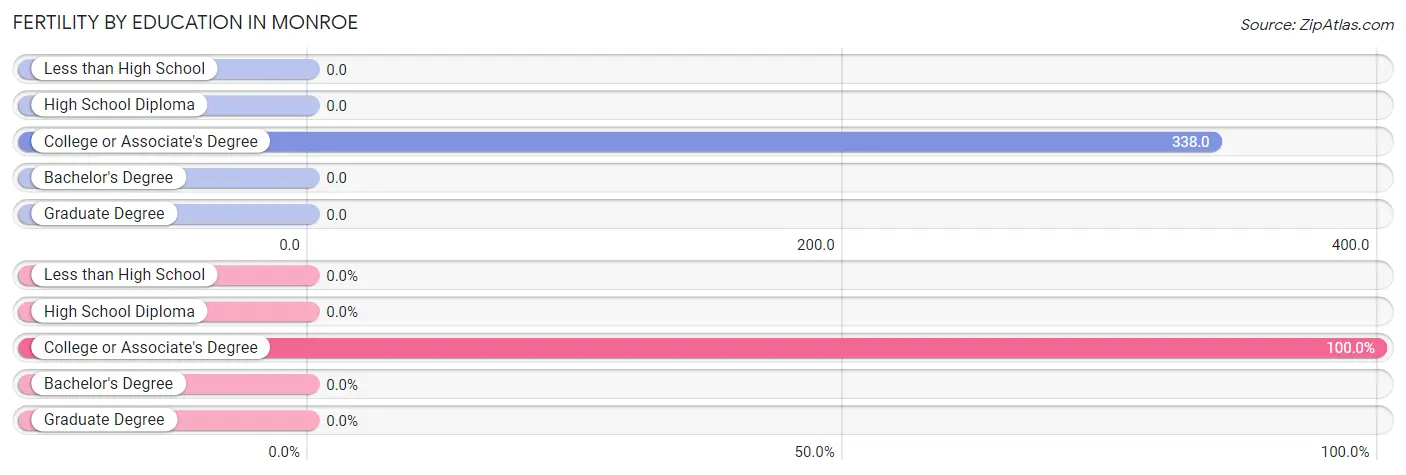
| Educational Attainment | Women with Births | Births / 1,000 Women |
| Less than High School | 0 (0.0%) | 0.0 |
| High School Diploma | 0 (0.0%) | 0.0 |
| College or Associate's Degree | 26 (100.0%) | 338.0 |
| Bachelor's Degree | 0 (0.0%) | 0.0 |
| Graduate Degree | 0 (0.0%) | 0.0 |
| Total | 26 (100.0%) | 149.0 |
Fertility by Education by Marriage Status in Monroe
15.4% of women with births in Monroe are unmarried. Women with the educational attainment of college or associate's degree are most likely to be married with 84.6% of them married at childbirth, while women with the educational attainment of college or associate's degree are least likely to be married with 15.4% of them unmarried at childbirth.
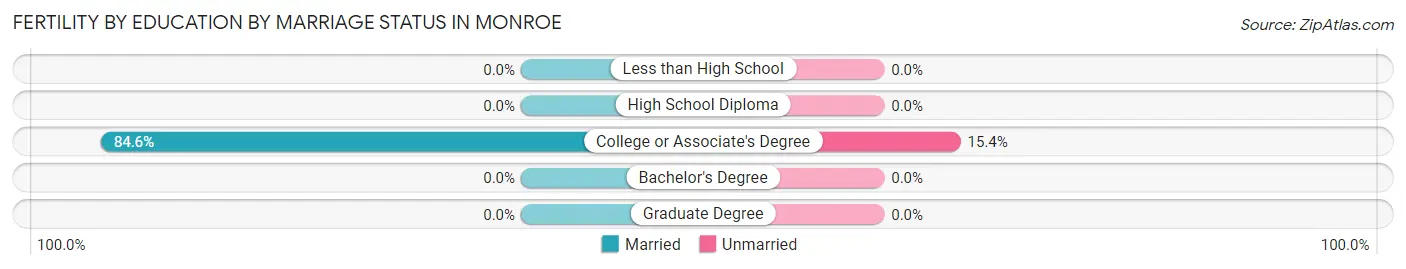
| Educational Attainment | Married | Unmarried |
| Less than High School | 0 (0.0%) | 0 (0.0%) |
| High School Diploma | 0 (0.0%) | 0 (0.0%) |
| College or Associate's Degree | 22 (84.6%) | 4 (15.4%) |
| Bachelor's Degree | 0 (0.0%) | 0 (0.0%) |
| Graduate Degree | 0 (0.0%) | 0 (0.0%) |
| Total | 22 (84.6%) | 4 (15.4%) |
Employment Characteristics in Monroe
Employment by Class of Employer in Monroe
Among the 359 employed individuals in Monroe, private company employees (235 | 65.5%), local government employees (52 | 14.5%), and not-for-profit organizations (43 | 12.0%) make up the most common classes of employment.
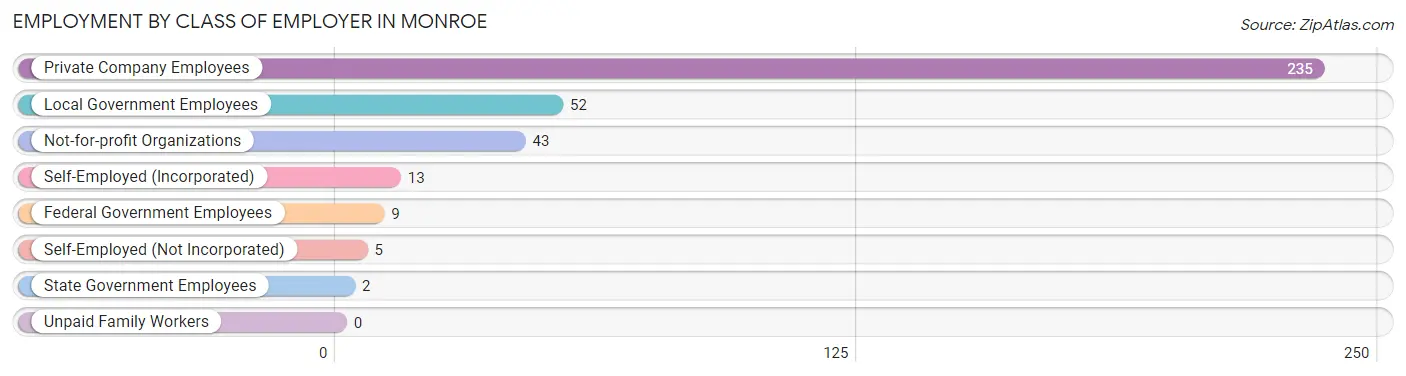
| Employer Class | # Employees | % Employees |
| Private Company Employees | 235 | 65.5% |
| Self-Employed (Incorporated) | 13 | 3.6% |
| Self-Employed (Not Incorporated) | 5 | 1.4% |
| Not-for-profit Organizations | 43 | 12.0% |
| Local Government Employees | 52 | 14.5% |
| State Government Employees | 2 | 0.6% |
| Federal Government Employees | 9 | 2.5% |
| Unpaid Family Workers | 0 | 0.0% |
| Total | 359 | 100.0% |
Employment Status by Age in Monroe
According to the labor force statistics for Monroe, out of the total population over 16 years of age (471), 76.4% or 360 individuals are in the labor force, with 0.3% or 1 of them unemployed. The age group with the highest labor force participation rate is 30 to 34 years, with 97.6% or 40 individuals in the labor force. Within the labor force, the 65 to 74 years age range has the highest percentage of unemployed individuals, with 6.7% or 1 of them being unemployed.
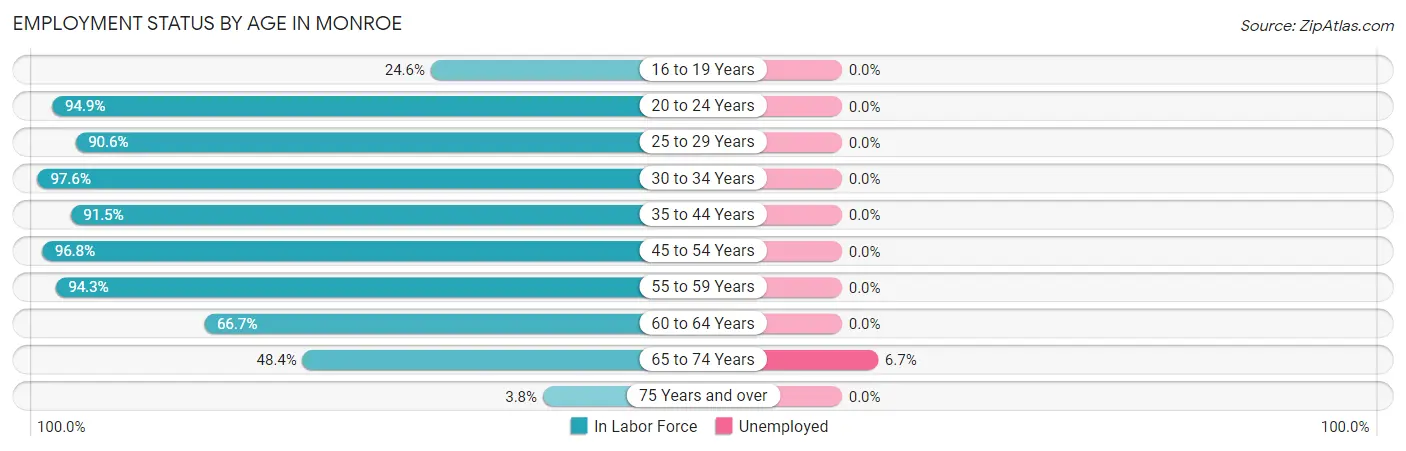
| Age Bracket | In Labor Force | Unemployed |
| 16 to 19 Years | 14 (24.6%) | 0 (0.0%) |
| 20 to 24 Years | 37 (94.9%) | 0 (0.0%) |
| 25 to 29 Years | 58 (90.6%) | 0 (0.0%) |
| 30 to 34 Years | 40 (97.6%) | 0 (0.0%) |
| 35 to 44 Years | 54 (91.5%) | 0 (0.0%) |
| 45 to 54 Years | 92 (96.8%) | 0 (0.0%) |
| 55 to 59 Years | 33 (94.3%) | 0 (0.0%) |
| 60 to 64 Years | 16 (66.7%) | 0 (0.0%) |
| 65 to 74 Years | 15 (48.4%) | 1 (6.7%) |
| 75 Years and over | 1 (3.8%) | 0 (0.0%) |
| Total | 360 (76.4%) | 1 (0.3%) |
Employment Status by Educational Attainment in Monroe
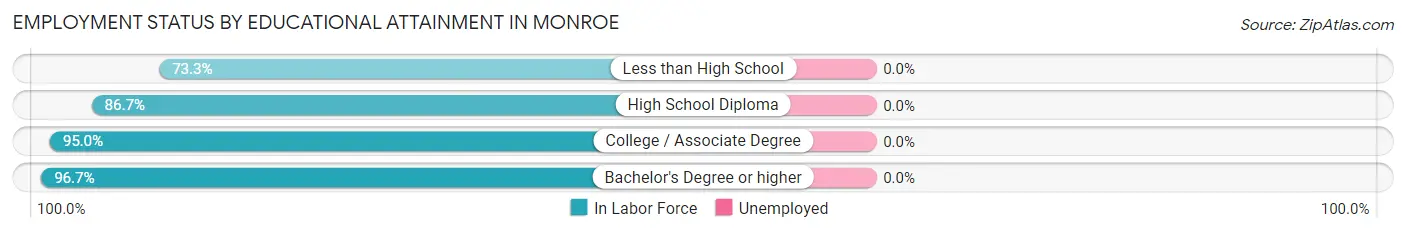
| Educational Attainment | In Labor Force | Unemployed |
| Less than High School | 11 (73.3%) | 0 (0.0%) |
| High School Diploma | 72 (86.7%) | 0 (0.0%) |
| College / Associate Degree | 151 (95.0%) | 0 (0.0%) |
| Bachelor's Degree or higher | 59 (96.7%) | 0 (0.0%) |
| Total | 293 (92.1%) | 0 (0.0%) |
Employment Occupations by Sex in Monroe
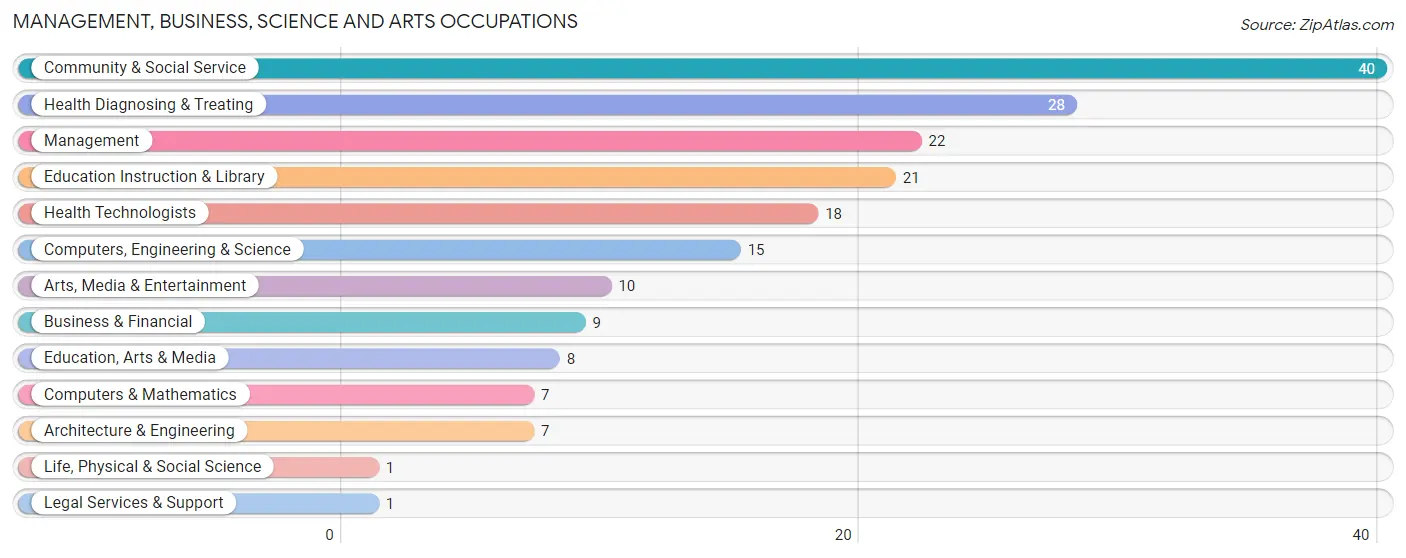
Management, Business, Science and Arts Occupations
The most common Management, Business, Science and Arts occupations in Monroe are Community & Social Service (40 | 11.2%), Health Diagnosing & Treating (28 | 7.8%), Management (22 | 6.2%), Education Instruction & Library (21 | 5.9%), and Health Technologists (18 | 5.0%).
Management, Business, Science and Arts Occupations by Sex
Within the Management, Business, Science and Arts occupations in Monroe, the most male-oriented occupations are Computers & Mathematics (100.0%), Life, Physical & Social Science (100.0%), and Education, Arts & Media (100.0%), while the most female-oriented occupations are Legal Services & Support (100.0%), Health Diagnosing & Treating (100.0%), and Health Technologists (100.0%).
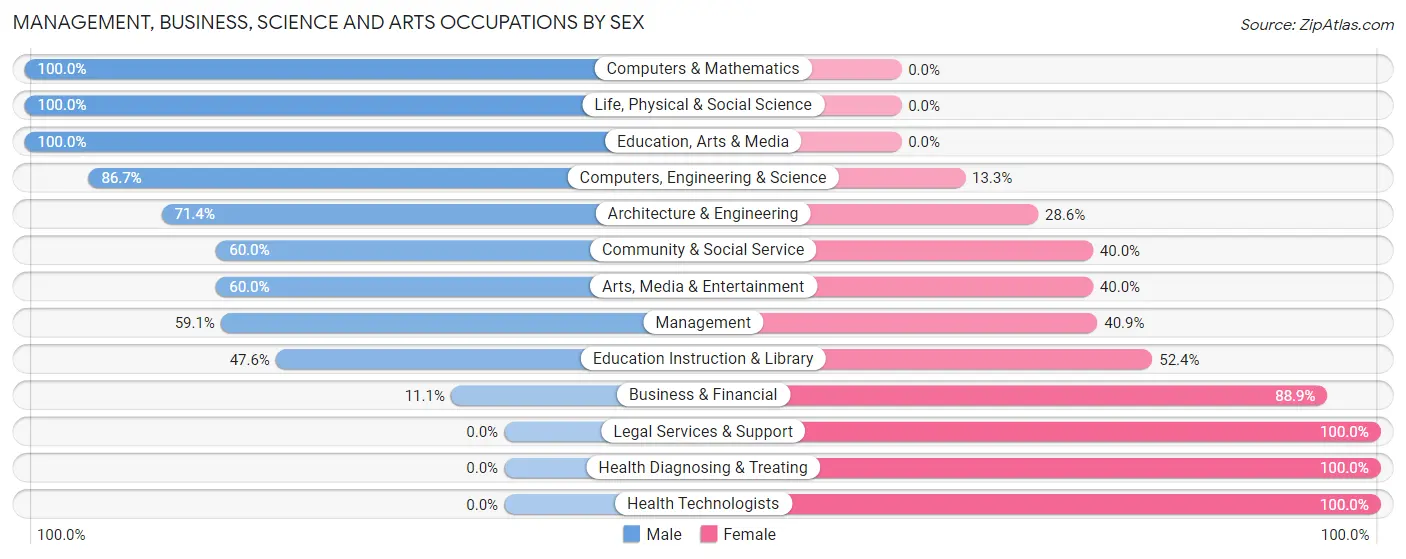
| Occupation | Male | Female |
| Management | 13 (59.1%) | 9 (40.9%) |
| Business & Financial | 1 (11.1%) | 8 (88.9%) |
| Computers, Engineering & Science | 13 (86.7%) | 2 (13.3%) |
| Computers & Mathematics | 7 (100.0%) | 0 (0.0%) |
| Architecture & Engineering | 5 (71.4%) | 2 (28.6%) |
| Life, Physical & Social Science | 1 (100.0%) | 0 (0.0%) |
| Community & Social Service | 24 (60.0%) | 16 (40.0%) |
| Education, Arts & Media | 8 (100.0%) | 0 (0.0%) |
| Legal Services & Support | 0 (0.0%) | 1 (100.0%) |
| Education Instruction & Library | 10 (47.6%) | 11 (52.4%) |
| Arts, Media & Entertainment | 6 (60.0%) | 4 (40.0%) |
| Health Diagnosing & Treating | 0 (0.0%) | 28 (100.0%) |
| Health Technologists | 0 (0.0%) | 18 (100.0%) |
| Total (Category) | 51 (44.7%) | 63 (55.3%) |
| Total (Overall) | 169 (47.3%) | 188 (52.7%) |
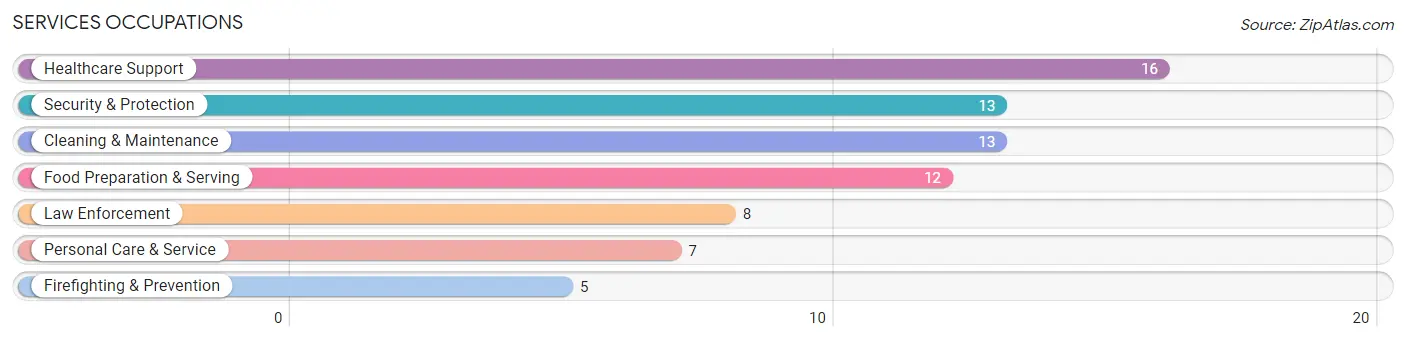
Services Occupations
The most common Services occupations in Monroe are Healthcare Support (16 | 4.5%), Security & Protection (13 | 3.6%), Cleaning & Maintenance (13 | 3.6%), Food Preparation & Serving (12 | 3.4%), and Law Enforcement (8 | 2.2%).
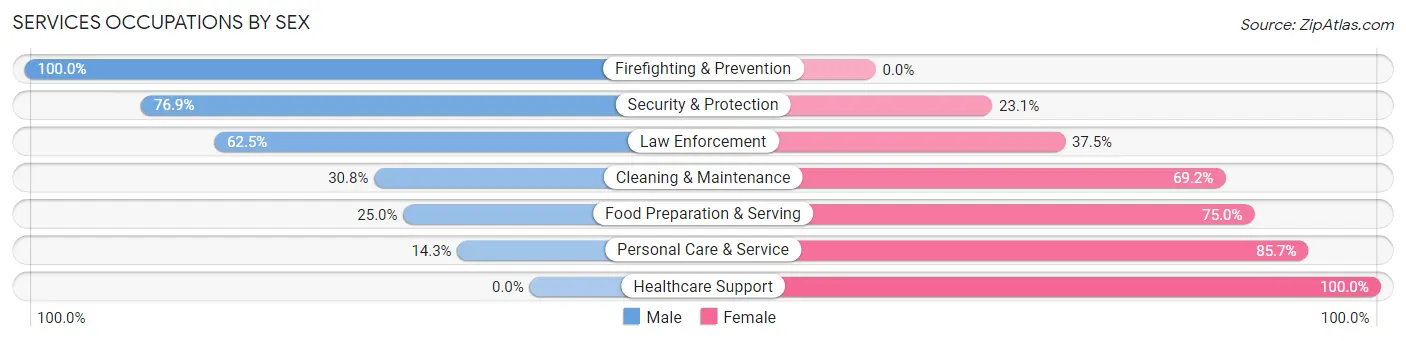
Services Occupations by Sex
Within the Services occupations in Monroe, the most male-oriented occupations are Firefighting & Prevention (100.0%), Security & Protection (76.9%), and Law Enforcement (62.5%), while the most female-oriented occupations are Healthcare Support (100.0%), Personal Care & Service (85.7%), and Food Preparation & Serving (75.0%).
| Occupation | Male | Female |
| Healthcare Support | 0 (0.0%) | 16 (100.0%) |
| Security & Protection | 10 (76.9%) | 3 (23.1%) |
| Firefighting & Prevention | 5 (100.0%) | 0 (0.0%) |
| Law Enforcement | 5 (62.5%) | 3 (37.5%) |
| Food Preparation & Serving | 3 (25.0%) | 9 (75.0%) |
| Cleaning & Maintenance | 4 (30.8%) | 9 (69.2%) |
| Personal Care & Service | 1 (14.3%) | 6 (85.7%) |
| Total (Category) | 18 (29.5%) | 43 (70.5%) |
| Total (Overall) | 169 (47.3%) | 188 (52.7%) |
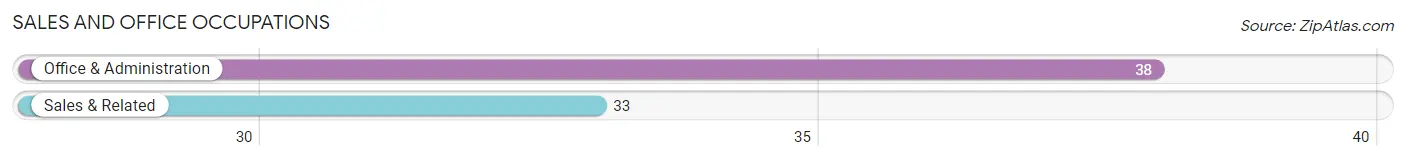
Sales and Office Occupations
The most common Sales and Office occupations in Monroe are Office & Administration (38 | 10.6%), and Sales & Related (33 | 9.2%).
Sales and Office Occupations by Sex
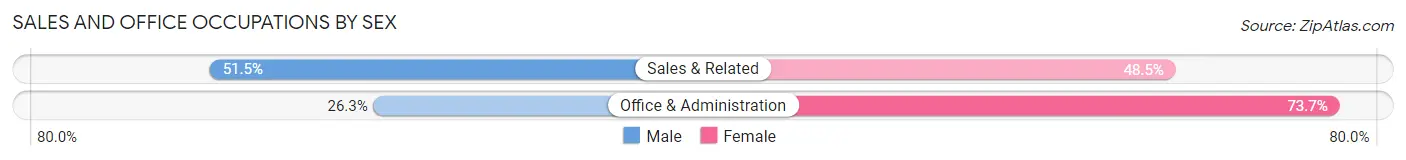
| Occupation | Male | Female |
| Sales & Related | 17 (51.5%) | 16 (48.5%) |
| Office & Administration | 10 (26.3%) | 28 (73.7%) |
| Total (Category) | 27 (38.0%) | 44 (62.0%) |
| Total (Overall) | 169 (47.3%) | 188 (52.7%) |
Natural Resources, Construction and Maintenance Occupations
The most common Natural Resources, Construction and Maintenance occupations in Monroe are Installation, Maintenance & Repair (13 | 3.6%), Farming, Fishing & Forestry (2 | 0.6%), and Construction & Extraction (2 | 0.6%).
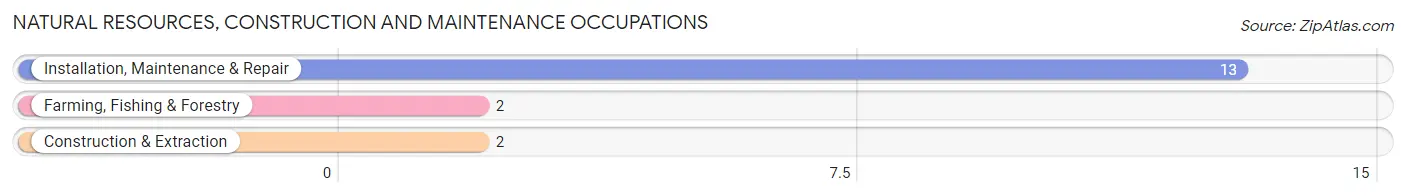
Natural Resources, Construction and Maintenance Occupations by Sex
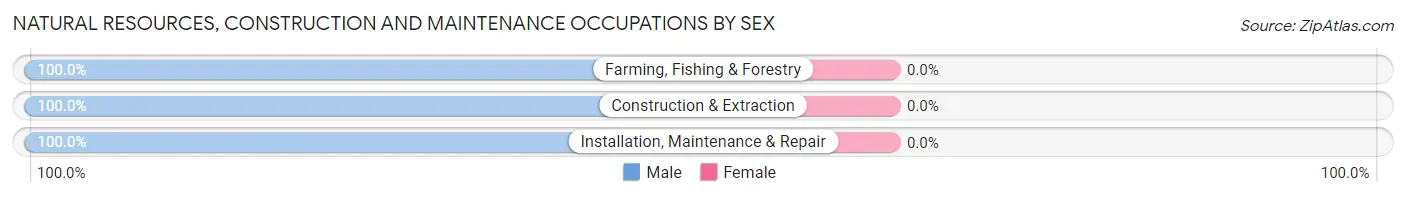
| Occupation | Male | Female |
| Farming, Fishing & Forestry | 2 (100.0%) | 0 (0.0%) |
| Construction & Extraction | 2 (100.0%) | 0 (0.0%) |
| Installation, Maintenance & Repair | 13 (100.0%) | 0 (0.0%) |
| Total (Category) | 17 (100.0%) | 0 (0.0%) |
| Total (Overall) | 169 (47.3%) | 188 (52.7%) |
Production, Transportation and Moving Occupations
The most common Production, Transportation and Moving occupations in Monroe are Production (77 | 21.6%), Material Moving (9 | 2.5%), and Transportation (8 | 2.2%).
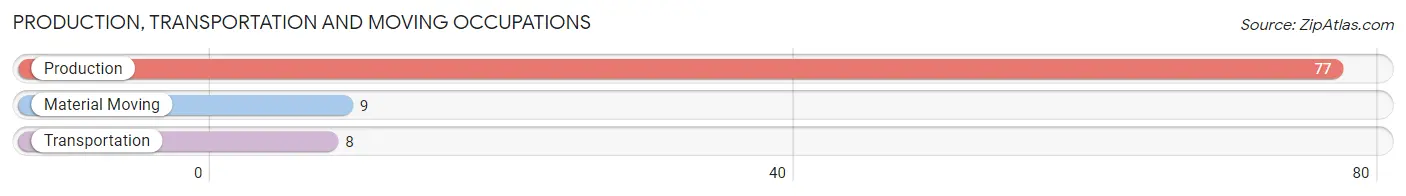
Production, Transportation and Moving Occupations by Sex
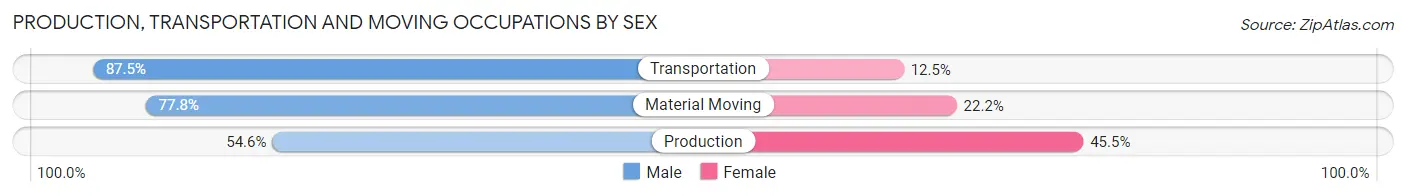
| Occupation | Male | Female |
| Production | 42 (54.5%) | 35 (45.5%) |
| Transportation | 7 (87.5%) | 1 (12.5%) |
| Material Moving | 7 (77.8%) | 2 (22.2%) |
| Total (Category) | 56 (59.6%) | 38 (40.4%) |
| Total (Overall) | 169 (47.3%) | 188 (52.7%) |
Employment Industries by Sex in Monroe
Employment Industries in Monroe
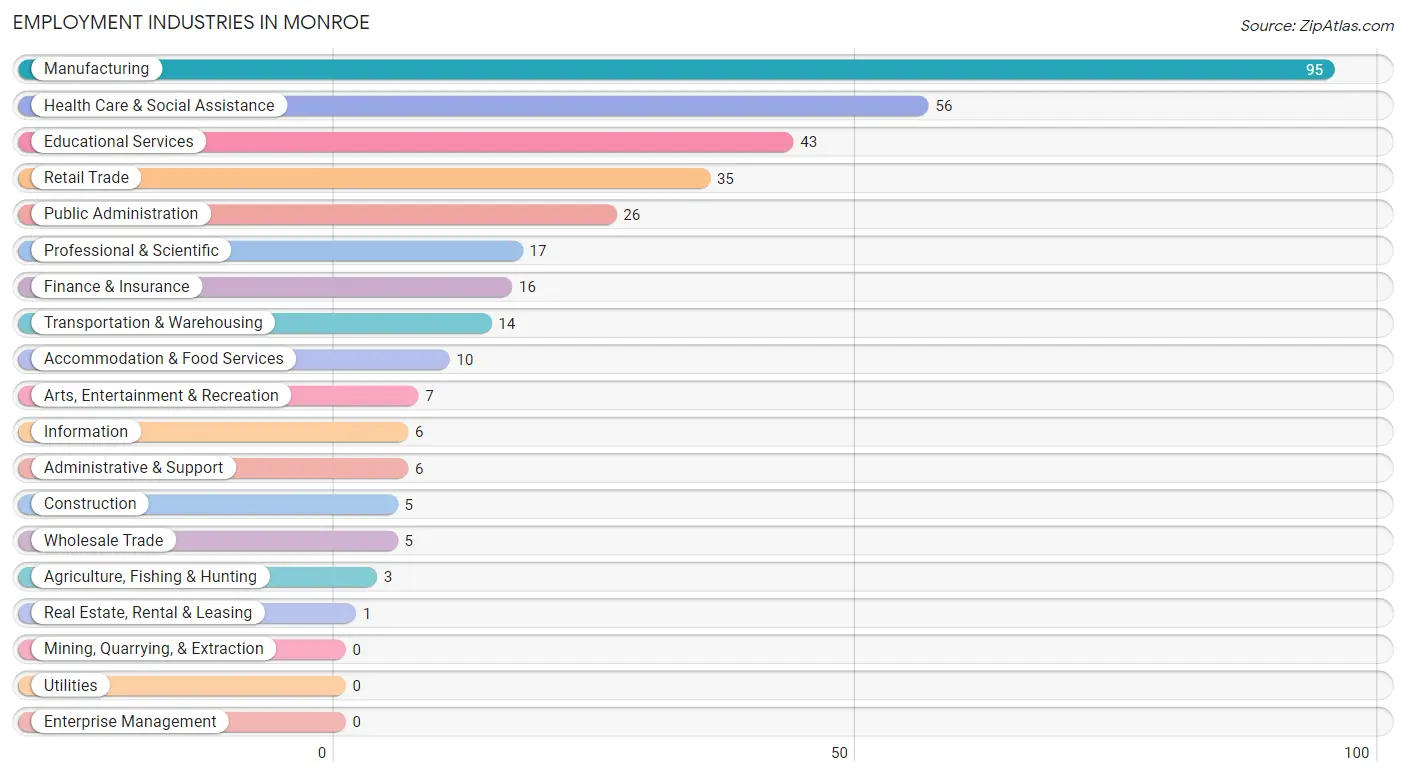
The major employment industries in Monroe include Manufacturing (95 | 26.6%), Health Care & Social Assistance (56 | 15.7%), Educational Services (43 | 12.0%), Retail Trade (35 | 9.8%), and Public Administration (26 | 7.3%).
Employment Industries by Sex in Monroe
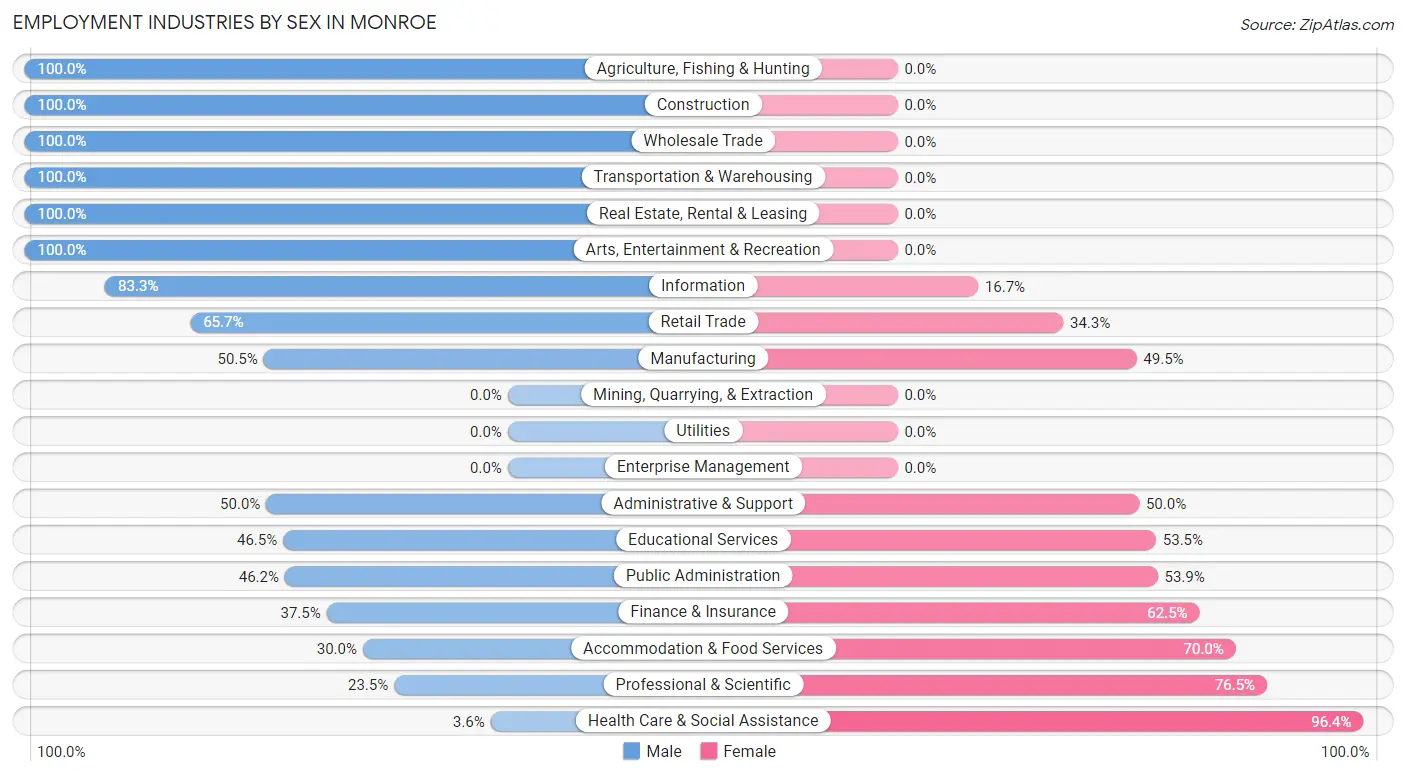
The Monroe industries that see more men than women are Agriculture, Fishing & Hunting (100.0%), Construction (100.0%), and Wholesale Trade (100.0%), whereas the industries that tend to have a higher number of women are Health Care & Social Assistance (96.4%), Professional & Scientific (76.5%), and Accommodation & Food Services (70.0%).
| Industry | Male | Female |
| Agriculture, Fishing & Hunting | 3 (100.0%) | 0 (0.0%) |
| Mining, Quarrying, & Extraction | 0 (0.0%) | 0 (0.0%) |
| Construction | 5 (100.0%) | 0 (0.0%) |
| Manufacturing | 48 (50.5%) | 47 (49.5%) |
| Wholesale Trade | 5 (100.0%) | 0 (0.0%) |
| Retail Trade | 23 (65.7%) | 12 (34.3%) |
| Transportation & Warehousing | 14 (100.0%) | 0 (0.0%) |
| Utilities | 0 (0.0%) | 0 (0.0%) |
| Information | 5 (83.3%) | 1 (16.7%) |
| Finance & Insurance | 6 (37.5%) | 10 (62.5%) |
| Real Estate, Rental & Leasing | 1 (100.0%) | 0 (0.0%) |
| Professional & Scientific | 4 (23.5%) | 13 (76.5%) |
| Enterprise Management | 0 (0.0%) | 0 (0.0%) |
| Administrative & Support | 3 (50.0%) | 3 (50.0%) |
| Educational Services | 20 (46.5%) | 23 (53.5%) |
| Health Care & Social Assistance | 2 (3.6%) | 54 (96.4%) |
| Arts, Entertainment & Recreation | 7 (100.0%) | 0 (0.0%) |
| Accommodation & Food Services | 3 (30.0%) | 7 (70.0%) |
| Public Administration | 12 (46.2%) | 14 (53.8%) |
| Total | 169 (47.3%) | 188 (52.7%) |
Education in Monroe
School Enrollment in Monroe
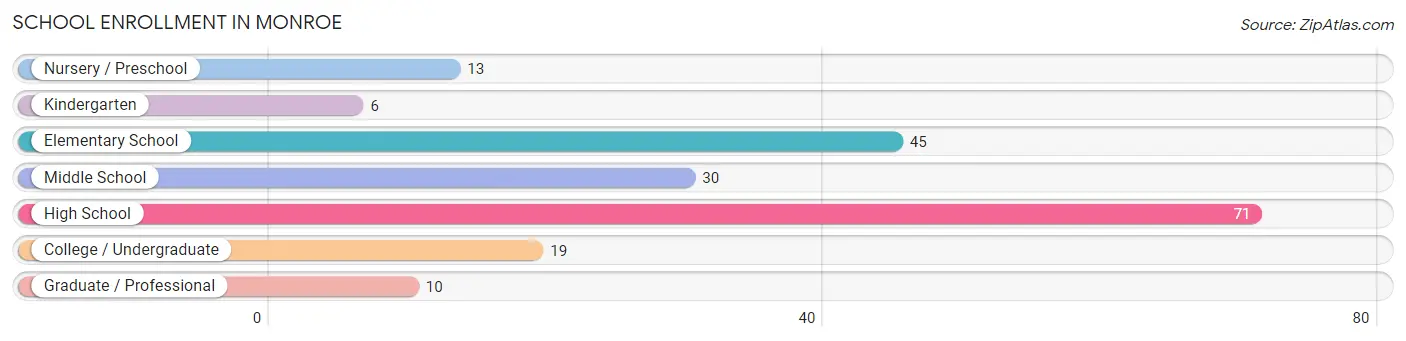
The most common levels of schooling among the 194 students in Monroe are high school (71 | 36.6%), elementary school (45 | 23.2%), and middle school (30 | 15.5%).
| School Level | # Students | % Students |
| Nursery / Preschool | 13 | 6.7% |
| Kindergarten | 6 | 3.1% |
| Elementary School | 45 | 23.2% |
| Middle School | 30 | 15.5% |
| High School | 71 | 36.6% |
| College / Undergraduate | 19 | 9.8% |
| Graduate / Professional | 10 | 5.1% |
| Total | 194 | 100.0% |
School Enrollment by Age by Funding Source in Monroe
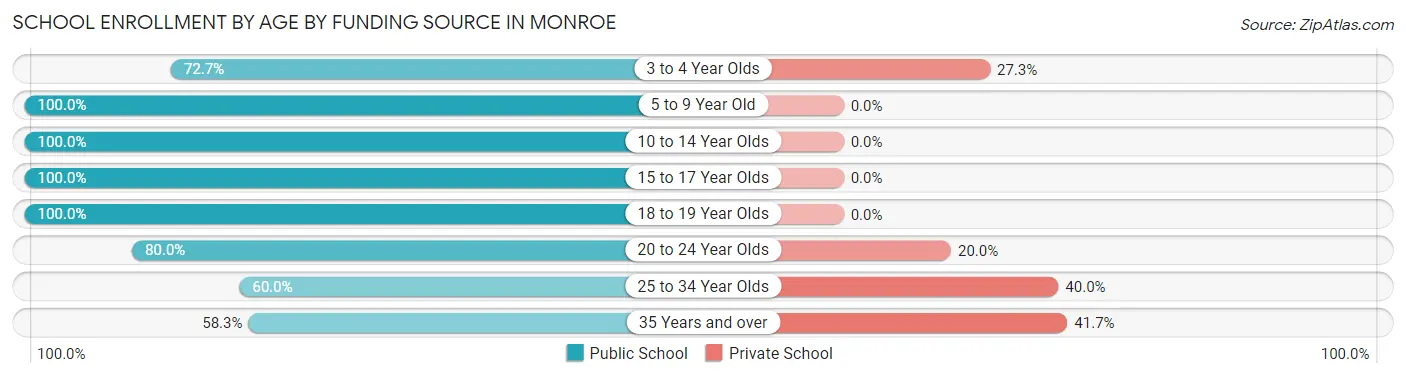
Out of a total of 194 students who are enrolled in schools in Monroe, 12 (6.2%) attend a private institution, while the remaining 182 (93.8%) are enrolled in public schools. The age group of 35 years and over has the highest likelihood of being enrolled in private schools, with 5 (41.7% in the age bracket) enrolled. Conversely, the age group of 5 to 9 year old has the lowest likelihood of being enrolled in a private school, with 50 (100.0% in the age bracket) attending a public institution.
| Age Bracket | Public School | Private School |
| 3 to 4 Year Olds | 8 (72.7%) | 3 (27.3%) |
| 5 to 9 Year Old | 50 (100.0%) | 0 (0.0%) |
| 10 to 14 Year Olds | 36 (100.0%) | 0 (0.0%) |
| 15 to 17 Year Olds | 49 (100.0%) | 0 (0.0%) |
| 18 to 19 Year Olds | 21 (100.0%) | 0 (0.0%) |
| 20 to 24 Year Olds | 8 (80.0%) | 2 (20.0%) |
| 25 to 34 Year Olds | 3 (60.0%) | 2 (40.0%) |
| 35 Years and over | 7 (58.3%) | 5 (41.7%) |
| Total | 182 (93.8%) | 12 (6.2%) |
Educational Attainment by Field of Study in Monroe
Education (24 | 32.0%), science & technology (15 | 20.0%), engineering (7 | 9.3%), business (7 | 9.3%), and psychology (5 | 6.7%) are the most common fields of study among 75 individuals in Monroe who have obtained a bachelor's degree or higher.
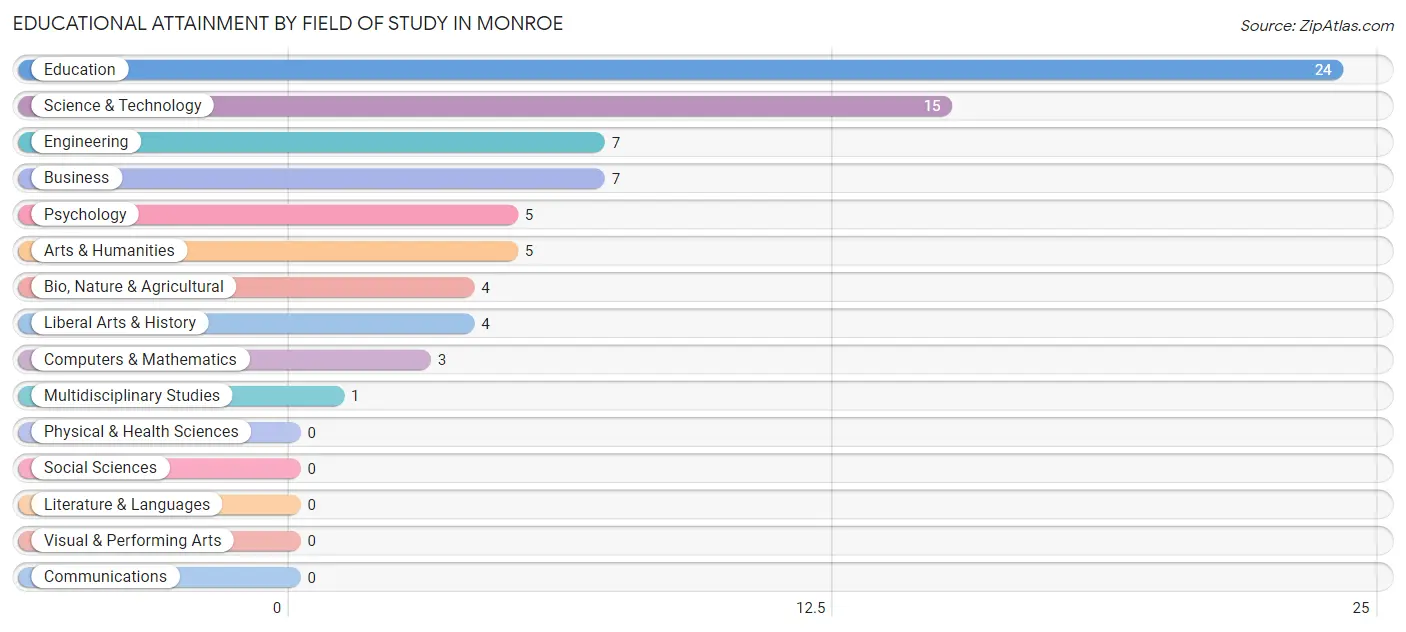
| Field of Study | # Graduates | % Graduates |
| Computers & Mathematics | 3 | 4.0% |
| Bio, Nature & Agricultural | 4 | 5.3% |
| Physical & Health Sciences | 0 | 0.0% |
| Psychology | 5 | 6.7% |
| Social Sciences | 0 | 0.0% |
| Engineering | 7 | 9.3% |
| Multidisciplinary Studies | 1 | 1.3% |
| Science & Technology | 15 | 20.0% |
| Business | 7 | 9.3% |
| Education | 24 | 32.0% |
| Literature & Languages | 0 | 0.0% |
| Liberal Arts & History | 4 | 5.3% |
| Visual & Performing Arts | 0 | 0.0% |
| Communications | 0 | 0.0% |
| Arts & Humanities | 5 | 6.7% |
| Total | 75 | 100.0% |
Transportation & Commute in Monroe
Vehicle Availability by Sex in Monroe
The most prevalent vehicle ownership categories in Monroe are males with 2 vehicles (75, accounting for 43.9%) and females with 2 vehicles (81, making up 39.9%).
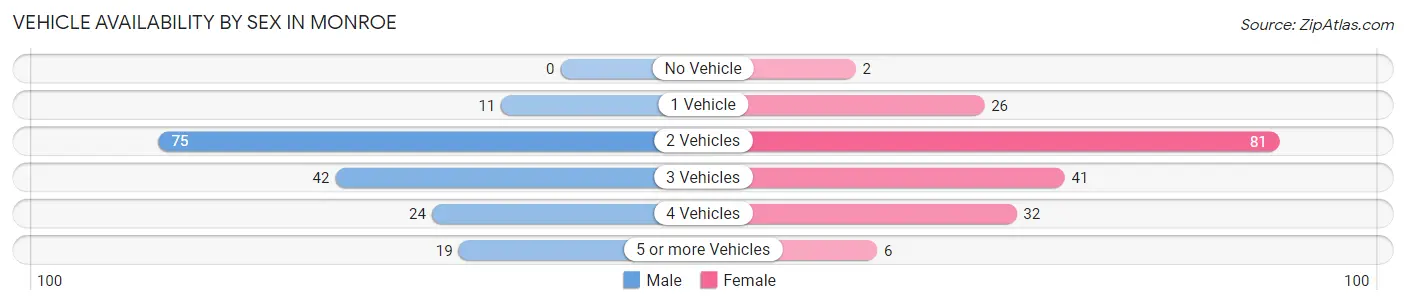
| Vehicles Available | Male | Female |
| No Vehicle | 0 (0.0%) | 2 (1.1%) |
| 1 Vehicle | 11 (6.4%) | 26 (13.8%) |
| 2 Vehicles | 75 (43.9%) | 81 (43.1%) |
| 3 Vehicles | 42 (24.6%) | 41 (21.8%) |
| 4 Vehicles | 24 (14.0%) | 32 (17.0%) |
| 5 or more Vehicles | 19 (11.1%) | 6 (3.2%) |
| Total | 171 (100.0%) | 188 (100.0%) |
Commute Time in Monroe
The most frequently occuring commute durations in Monroe are 10 to 14 minutes (108 commuters, 31.2%), 15 to 19 minutes (53 commuters, 15.3%), and 20 to 24 minutes (42 commuters, 12.1%).
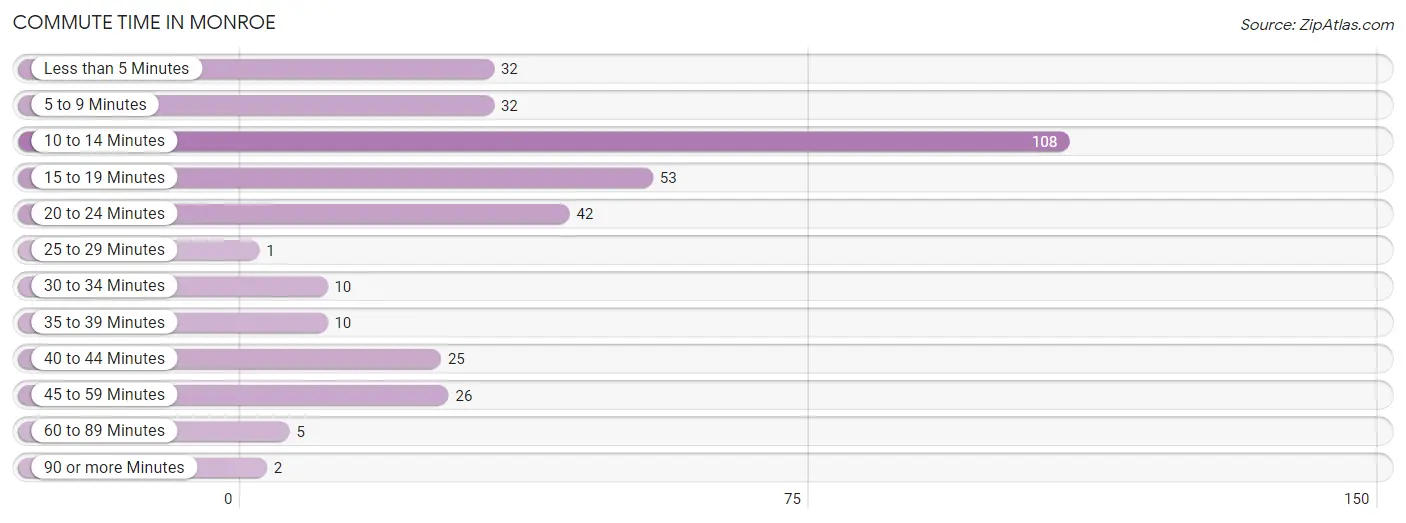
| Commute Time | # Commuters | % Commuters |
| Less than 5 Minutes | 32 | 9.2% |
| 5 to 9 Minutes | 32 | 9.2% |
| 10 to 14 Minutes | 108 | 31.2% |
| 15 to 19 Minutes | 53 | 15.3% |
| 20 to 24 Minutes | 42 | 12.1% |
| 25 to 29 Minutes | 1 | 0.3% |
| 30 to 34 Minutes | 10 | 2.9% |
| 35 to 39 Minutes | 10 | 2.9% |
| 40 to 44 Minutes | 25 | 7.2% |
| 45 to 59 Minutes | 26 | 7.5% |
| 60 to 89 Minutes | 5 | 1.5% |
| 90 or more Minutes | 2 | 0.6% |
Commute Time by Sex in Monroe
The most common commute times in Monroe are 10 to 14 minutes (37 commuters, 22.4%) for males and 10 to 14 minutes (71 commuters, 39.2%) for females.
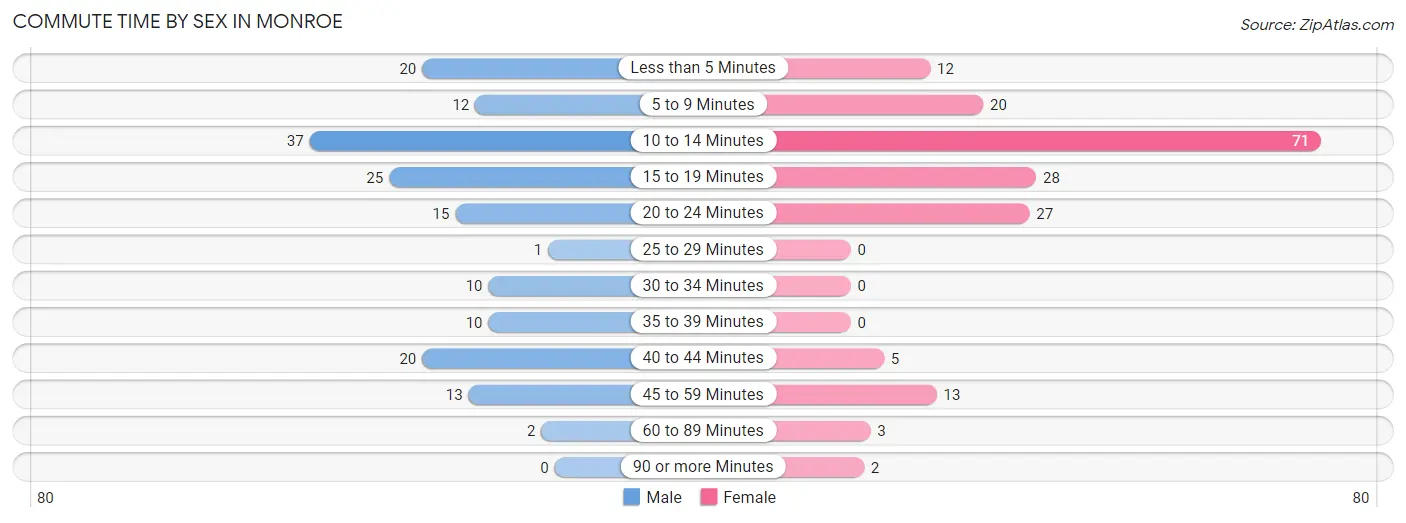
| Commute Time | Male | Female |
| Less than 5 Minutes | 20 (12.1%) | 12 (6.6%) |
| 5 to 9 Minutes | 12 (7.3%) | 20 (11.1%) |
| 10 to 14 Minutes | 37 (22.4%) | 71 (39.2%) |
| 15 to 19 Minutes | 25 (15.1%) | 28 (15.5%) |
| 20 to 24 Minutes | 15 (9.1%) | 27 (14.9%) |
| 25 to 29 Minutes | 1 (0.6%) | 0 (0.0%) |
| 30 to 34 Minutes | 10 (6.1%) | 0 (0.0%) |
| 35 to 39 Minutes | 10 (6.1%) | 0 (0.0%) |
| 40 to 44 Minutes | 20 (12.1%) | 5 (2.8%) |
| 45 to 59 Minutes | 13 (7.9%) | 13 (7.2%) |
| 60 to 89 Minutes | 2 (1.2%) | 3 (1.7%) |
| 90 or more Minutes | 0 (0.0%) | 2 (1.1%) |
Time of Departure to Work by Sex in Monroe
The most frequent times of departure to work in Monroe are 7:00 AM to 7:29 AM (31, 18.8%) for males and 7:30 AM to 7:59 AM (33, 18.2%) for females.
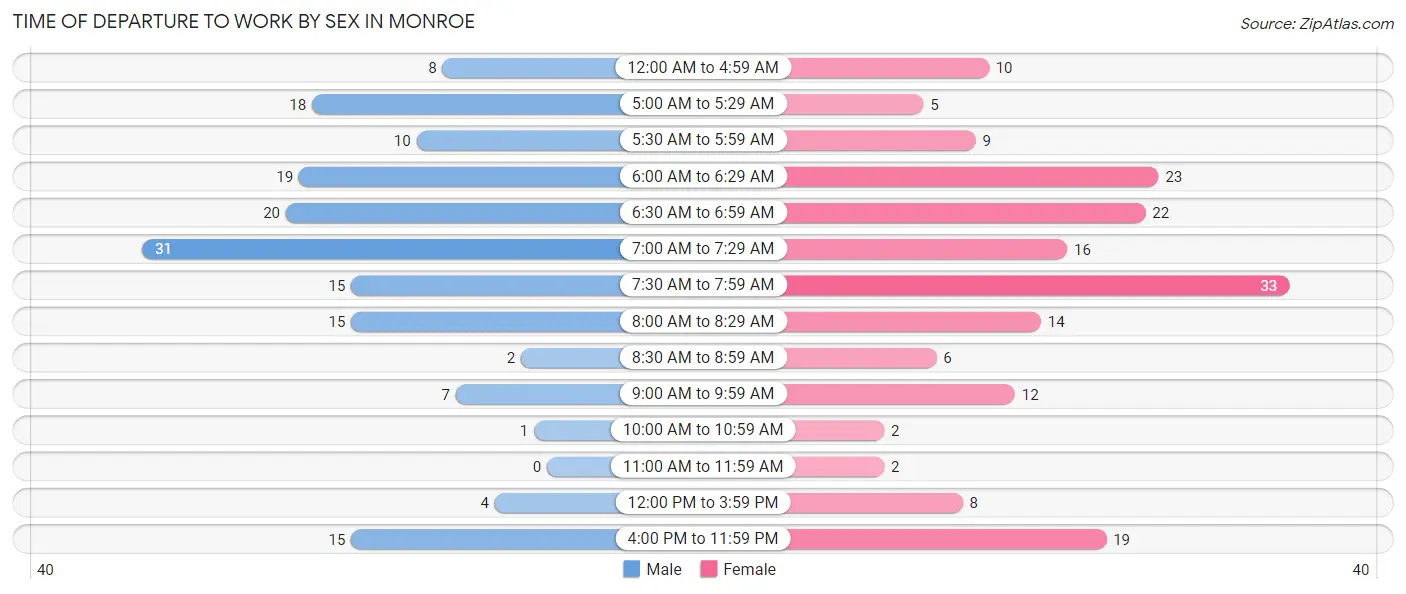
| Time of Departure | Male | Female |
| 12:00 AM to 4:59 AM | 8 (4.9%) | 10 (5.5%) |
| 5:00 AM to 5:29 AM | 18 (10.9%) | 5 (2.8%) |
| 5:30 AM to 5:59 AM | 10 (6.1%) | 9 (5.0%) |
| 6:00 AM to 6:29 AM | 19 (11.5%) | 23 (12.7%) |
| 6:30 AM to 6:59 AM | 20 (12.1%) | 22 (12.1%) |
| 7:00 AM to 7:29 AM | 31 (18.8%) | 16 (8.8%) |
| 7:30 AM to 7:59 AM | 15 (9.1%) | 33 (18.2%) |
| 8:00 AM to 8:29 AM | 15 (9.1%) | 14 (7.7%) |
| 8:30 AM to 8:59 AM | 2 (1.2%) | 6 (3.3%) |
| 9:00 AM to 9:59 AM | 7 (4.2%) | 12 (6.6%) |
| 10:00 AM to 10:59 AM | 1 (0.6%) | 2 (1.1%) |
| 11:00 AM to 11:59 AM | 0 (0.0%) | 2 (1.1%) |
| 12:00 PM to 3:59 PM | 4 (2.4%) | 8 (4.4%) |
| 4:00 PM to 11:59 PM | 15 (9.1%) | 19 (10.5%) |
| Total | 165 (100.0%) | 181 (100.0%) |
Housing Occupancy in Monroe
Occupancy by Ownership in Monroe
Of the total 233 dwellings in Monroe, owner-occupied units account for 191 (82.0%), while renter-occupied units make up 42 (18.0%).
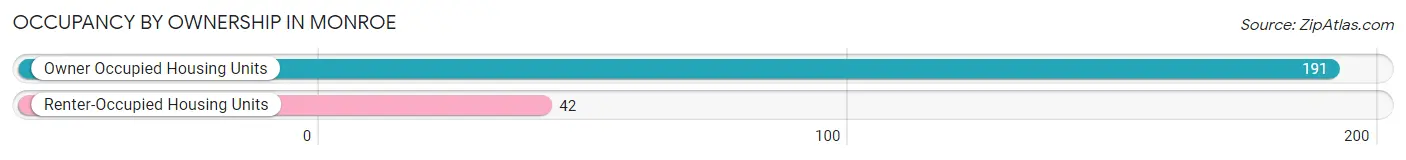
| Occupancy | # Housing Units | % Housing Units |
| Owner Occupied Housing Units | 191 | 82.0% |
| Renter-Occupied Housing Units | 42 | 18.0% |
| Total Occupied Housing Units | 233 | 100.0% |
Occupancy by Household Size in Monroe
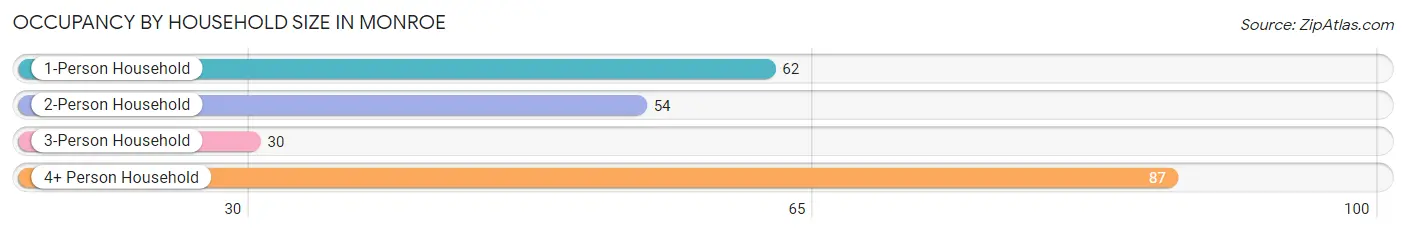
| Household Size | # Housing Units | % Housing Units |
| 1-Person Household | 62 | 26.6% |
| 2-Person Household | 54 | 23.2% |
| 3-Person Household | 30 | 12.9% |
| 4+ Person Household | 87 | 37.3% |
| Total Housing Units | 233 | 100.0% |
Occupancy by Ownership by Household Size in Monroe
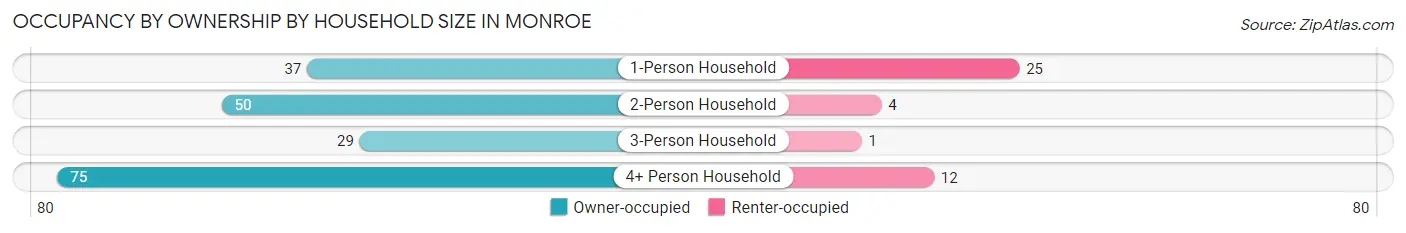
| Household Size | Owner-occupied | Renter-occupied |
| 1-Person Household | 37 (59.7%) | 25 (40.3%) |
| 2-Person Household | 50 (92.6%) | 4 (7.4%) |
| 3-Person Household | 29 (96.7%) | 1 (3.3%) |
| 4+ Person Household | 75 (86.2%) | 12 (13.8%) |
| Total Housing Units | 191 (82.0%) | 42 (18.0%) |
Occupancy by Educational Attainment in Monroe
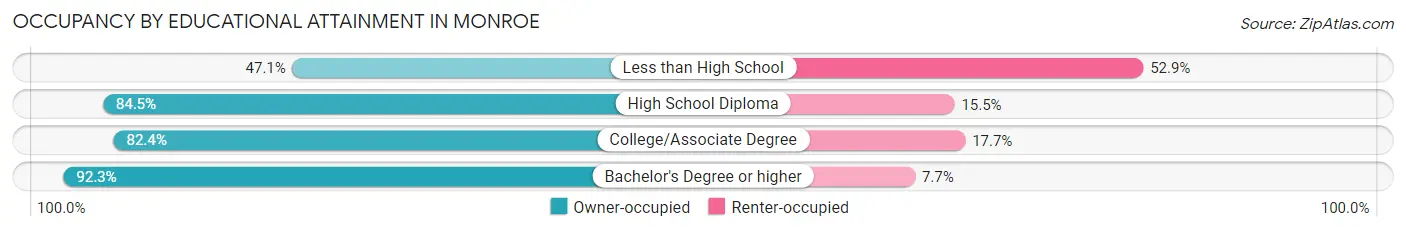
| Household Size | Owner-occupied | Renter-occupied |
| Less than High School | 8 (47.1%) | 9 (52.9%) |
| High School Diploma | 49 (84.5%) | 9 (15.5%) |
| College/Associate Degree | 98 (82.4%) | 21 (17.6%) |
| Bachelor's Degree or higher | 36 (92.3%) | 3 (7.7%) |
Occupancy by Age of Householder in Monroe
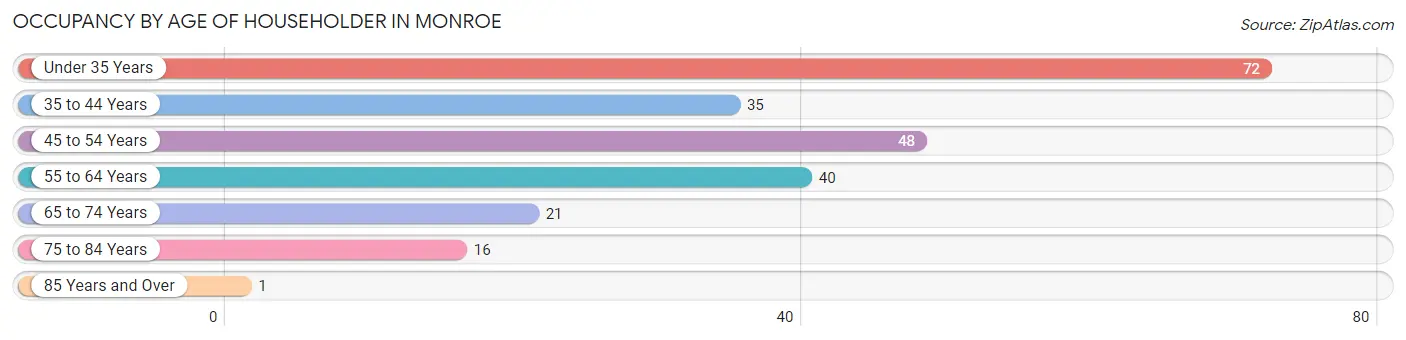
| Age Bracket | # Households | % Households |
| Under 35 Years | 72 | 30.9% |
| 35 to 44 Years | 35 | 15.0% |
| 45 to 54 Years | 48 | 20.6% |
| 55 to 64 Years | 40 | 17.2% |
| 65 to 74 Years | 21 | 9.0% |
| 75 to 84 Years | 16 | 6.9% |
| 85 Years and Over | 1 | 0.4% |
| Total | 233 | 100.0% |
Housing Finances in Monroe
Median Income by Occupancy in Monroe
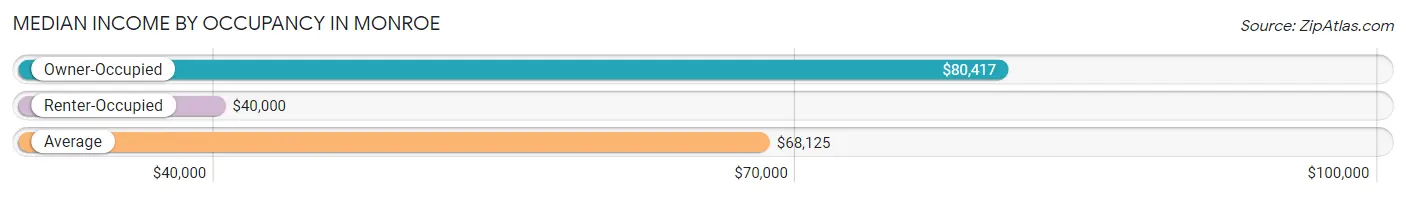
| Occupancy Type | # Households | Median Income |
| Owner-Occupied | 191 (82.0%) | $80,417 |
| Renter-Occupied | 42 (18.0%) | $40,000 |
| Average | 233 (100.0%) | $68,125 |
Occupancy by Householder Income Bracket in Monroe
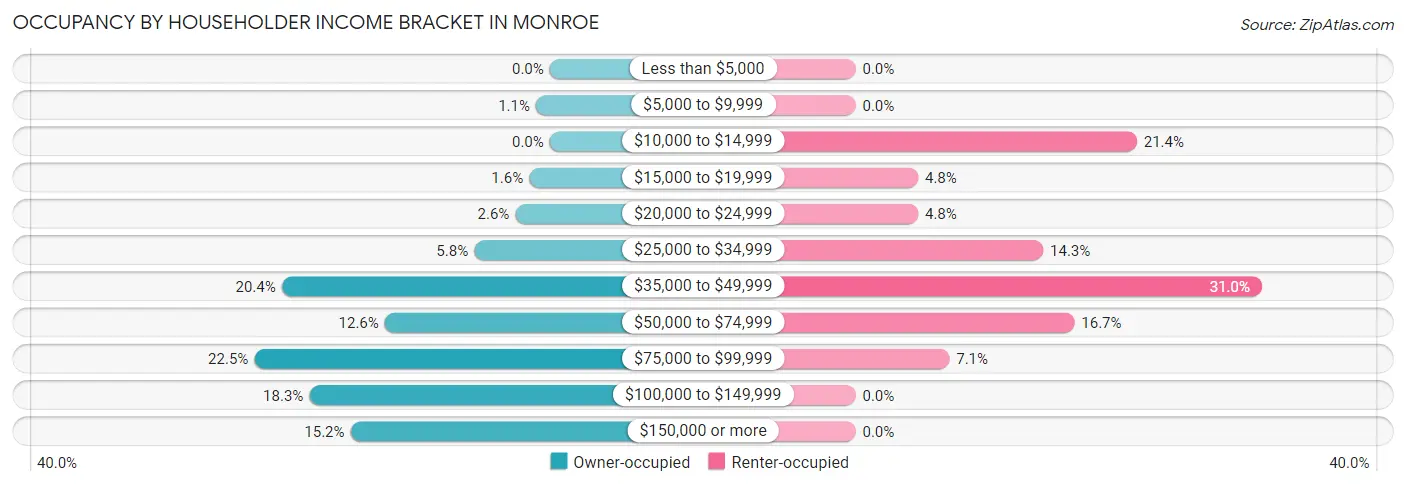
| Income Bracket | Owner-occupied | Renter-occupied |
| Less than $5,000 | 0 (0.0%) | 0 (0.0%) |
| $5,000 to $9,999 | 2 (1.1%) | 0 (0.0%) |
| $10,000 to $14,999 | 0 (0.0%) | 9 (21.4%) |
| $15,000 to $19,999 | 3 (1.6%) | 2 (4.8%) |
| $20,000 to $24,999 | 5 (2.6%) | 2 (4.8%) |
| $25,000 to $34,999 | 11 (5.8%) | 6 (14.3%) |
| $35,000 to $49,999 | 39 (20.4%) | 13 (30.9%) |
| $50,000 to $74,999 | 24 (12.6%) | 7 (16.7%) |
| $75,000 to $99,999 | 43 (22.5%) | 3 (7.1%) |
| $100,000 to $149,999 | 35 (18.3%) | 0 (0.0%) |
| $150,000 or more | 29 (15.2%) | 0 (0.0%) |
| Total | 191 (100.0%) | 42 (100.0%) |
Monthly Housing Cost Tiers in Monroe
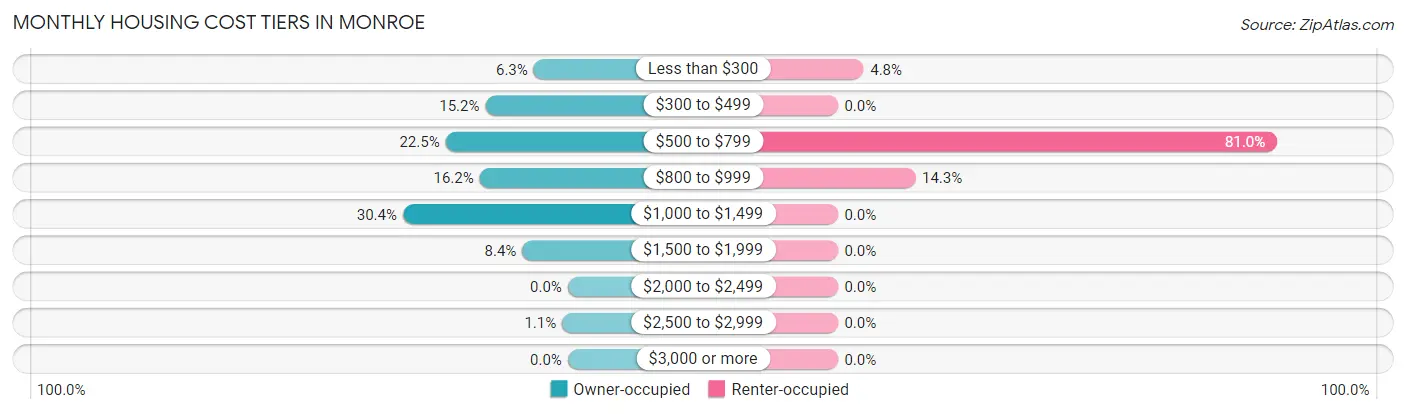
| Monthly Cost | Owner-occupied | Renter-occupied |
| Less than $300 | 12 (6.3%) | 2 (4.8%) |
| $300 to $499 | 29 (15.2%) | 0 (0.0%) |
| $500 to $799 | 43 (22.5%) | 34 (80.9%) |
| $800 to $999 | 31 (16.2%) | 6 (14.3%) |
| $1,000 to $1,499 | 58 (30.4%) | 0 (0.0%) |
| $1,500 to $1,999 | 16 (8.4%) | 0 (0.0%) |
| $2,000 to $2,499 | 0 (0.0%) | 0 (0.0%) |
| $2,500 to $2,999 | 2 (1.1%) | 0 (0.0%) |
| $3,000 or more | 0 (0.0%) | 0 (0.0%) |
| Total | 191 (100.0%) | 42 (100.0%) |
Physical Housing Characteristics in Monroe
Housing Structures in Monroe
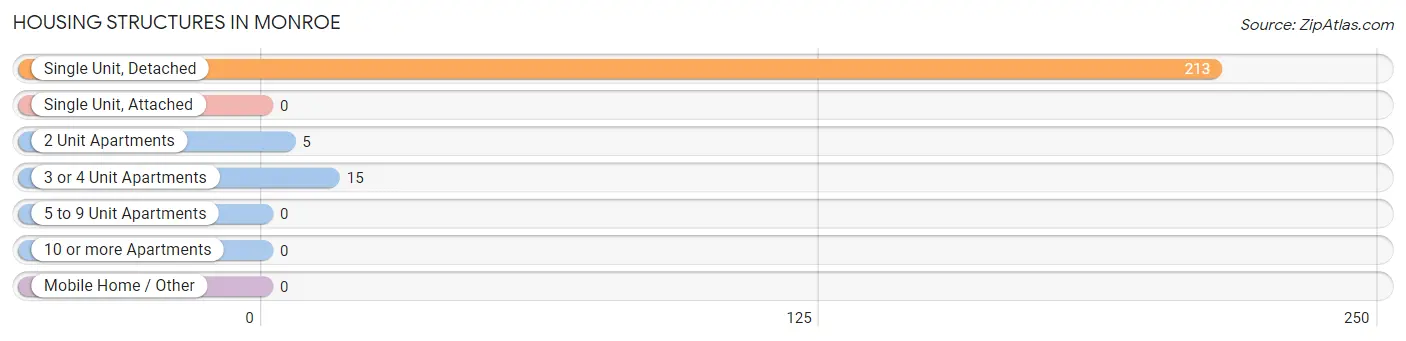
| Structure Type | # Housing Units | % Housing Units |
| Single Unit, Detached | 213 | 91.4% |
| Single Unit, Attached | 0 | 0.0% |
| 2 Unit Apartments | 5 | 2.1% |
| 3 or 4 Unit Apartments | 15 | 6.4% |
| 5 to 9 Unit Apartments | 0 | 0.0% |
| 10 or more Apartments | 0 | 0.0% |
| Mobile Home / Other | 0 | 0.0% |
| Total | 233 | 100.0% |
Housing Structures by Occupancy in Monroe
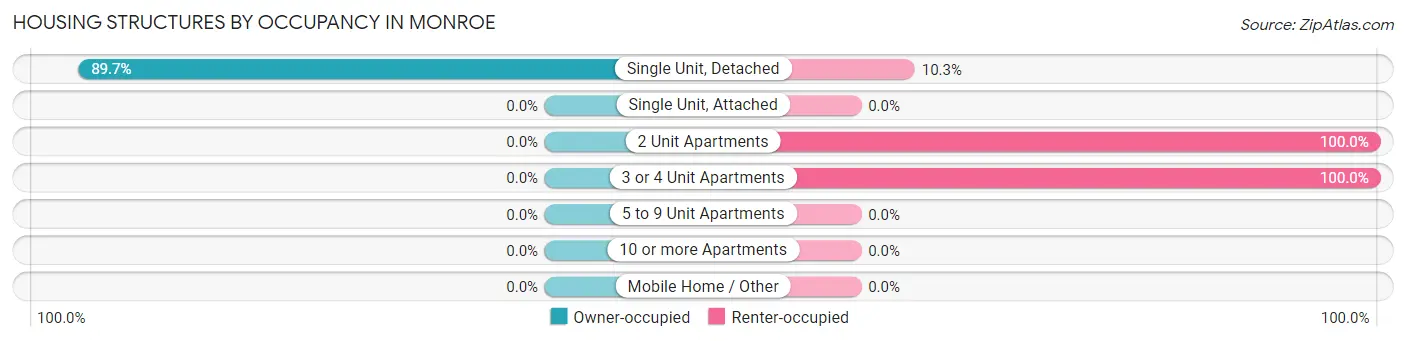
| Structure Type | Owner-occupied | Renter-occupied |
| Single Unit, Detached | 191 (89.7%) | 22 (10.3%) |
| Single Unit, Attached | 0 (0.0%) | 0 (0.0%) |
| 2 Unit Apartments | 0 (0.0%) | 5 (100.0%) |
| 3 or 4 Unit Apartments | 0 (0.0%) | 15 (100.0%) |
| 5 to 9 Unit Apartments | 0 (0.0%) | 0 (0.0%) |
| 10 or more Apartments | 0 (0.0%) | 0 (0.0%) |
| Mobile Home / Other | 0 (0.0%) | 0 (0.0%) |
| Total | 191 (82.0%) | 42 (18.0%) |
Housing Structures by Number of Rooms in Monroe
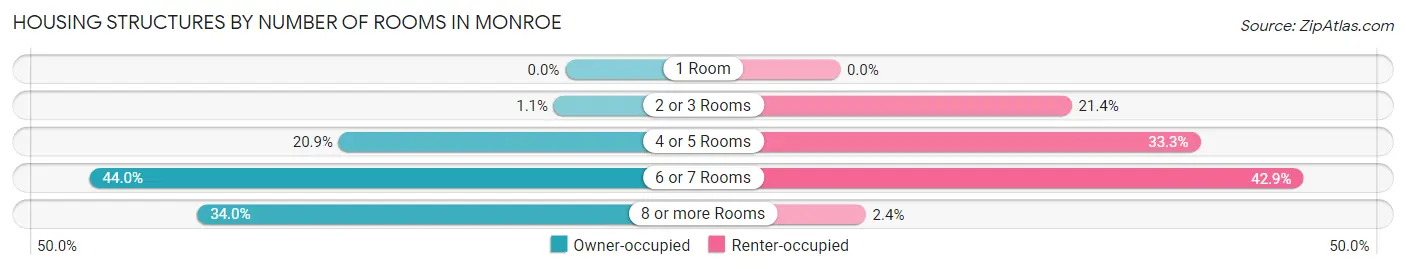
| Number of Rooms | Owner-occupied | Renter-occupied |
| 1 Room | 0 (0.0%) | 0 (0.0%) |
| 2 or 3 Rooms | 2 (1.1%) | 9 (21.4%) |
| 4 or 5 Rooms | 40 (20.9%) | 14 (33.3%) |
| 6 or 7 Rooms | 84 (44.0%) | 18 (42.9%) |
| 8 or more Rooms | 65 (34.0%) | 1 (2.4%) |
| Total | 191 (100.0%) | 42 (100.0%) |
Housing Structure by Heating Type in Monroe
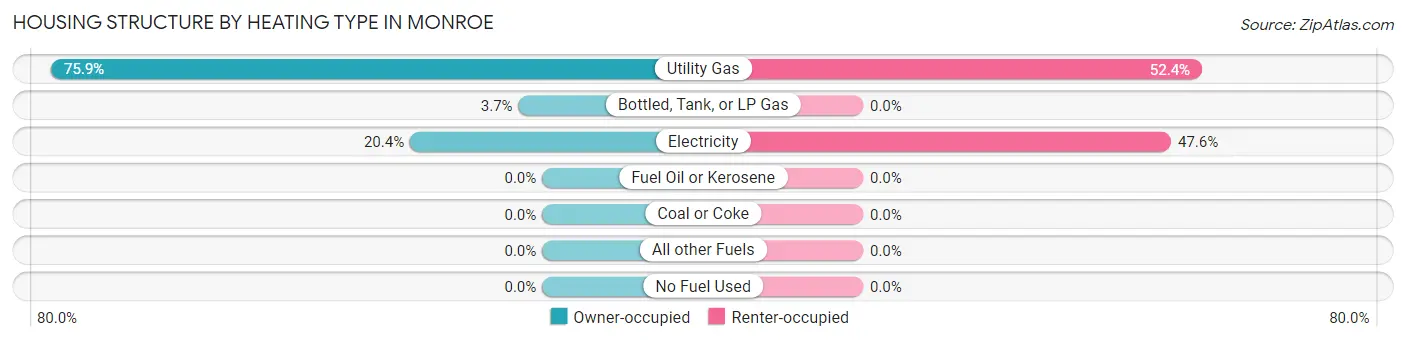
| Heating Type | Owner-occupied | Renter-occupied |
| Utility Gas | 145 (75.9%) | 22 (52.4%) |
| Bottled, Tank, or LP Gas | 7 (3.7%) | 0 (0.0%) |
| Electricity | 39 (20.4%) | 20 (47.6%) |
| Fuel Oil or Kerosene | 0 (0.0%) | 0 (0.0%) |
| Coal or Coke | 0 (0.0%) | 0 (0.0%) |
| All other Fuels | 0 (0.0%) | 0 (0.0%) |
| No Fuel Used | 0 (0.0%) | 0 (0.0%) |
| Total | 191 (100.0%) | 42 (100.0%) |
Household Vehicle Usage in Monroe
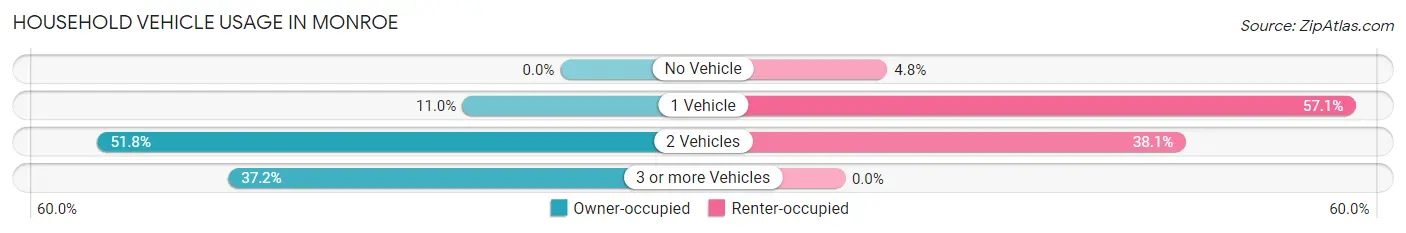
| Vehicles per Household | Owner-occupied | Renter-occupied |
| No Vehicle | 0 (0.0%) | 2 (4.8%) |
| 1 Vehicle | 21 (11.0%) | 24 (57.1%) |
| 2 Vehicles | 99 (51.8%) | 16 (38.1%) |
| 3 or more Vehicles | 71 (37.2%) | 0 (0.0%) |
| Total | 191 (100.0%) | 42 (100.0%) |
Real Estate & Mortgages in Monroe
Real Estate and Mortgage Overview in Monroe
| Characteristic | Without Mortgage | With Mortgage |
| Housing Units | 62 | 129 |
| Median Property Value | $125,000 | $135,400 |
| Median Household Income | $67,500 | $27 |
| Monthly Housing Costs | $441 | $0 |
| Real Estate Taxes | $878 | $4 |
Property Value by Mortgage Status in Monroe
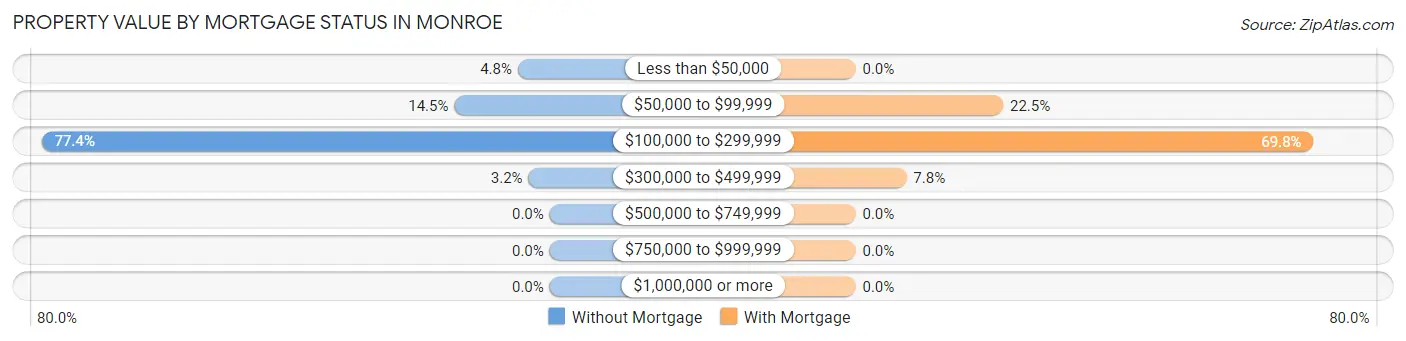
| Property Value | Without Mortgage | With Mortgage |
| Less than $50,000 | 3 (4.8%) | 0 (0.0%) |
| $50,000 to $99,999 | 9 (14.5%) | 29 (22.5%) |
| $100,000 to $299,999 | 48 (77.4%) | 90 (69.8%) |
| $300,000 to $499,999 | 2 (3.2%) | 10 (7.7%) |
| $500,000 to $749,999 | 0 (0.0%) | 0 (0.0%) |
| $750,000 to $999,999 | 0 (0.0%) | 0 (0.0%) |
| $1,000,000 or more | 0 (0.0%) | 0 (0.0%) |
| Total | 62 (100.0%) | 129 (100.0%) |
Household Income by Mortgage Status in Monroe
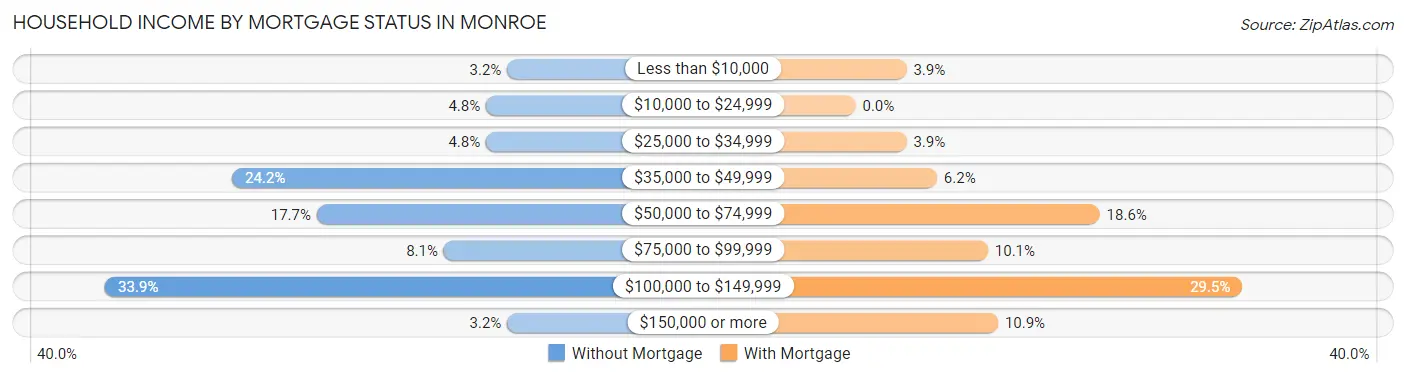
| Household Income | Without Mortgage | With Mortgage |
| Less than $10,000 | 2 (3.2%) | 5 (3.9%) |
| $10,000 to $24,999 | 3 (4.8%) | 0 (0.0%) |
| $25,000 to $34,999 | 3 (4.8%) | 5 (3.9%) |
| $35,000 to $49,999 | 15 (24.2%) | 8 (6.2%) |
| $50,000 to $74,999 | 11 (17.7%) | 24 (18.6%) |
| $75,000 to $99,999 | 5 (8.1%) | 13 (10.1%) |
| $100,000 to $149,999 | 21 (33.9%) | 38 (29.5%) |
| $150,000 or more | 2 (3.2%) | 14 (10.8%) |
| Total | 62 (100.0%) | 129 (100.0%) |
Property Value to Household Income Ratio in Monroe
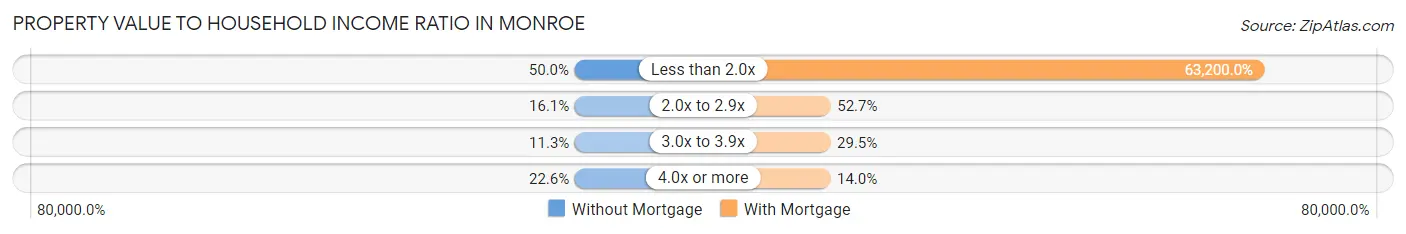
| Value-to-Income Ratio | Without Mortgage | With Mortgage |
| Less than 2.0x | 31 (50.0%) | 81,528 (63,200.0%) |
| 2.0x to 2.9x | 10 (16.1%) | 68 (52.7%) |
| 3.0x to 3.9x | 7 (11.3%) | 38 (29.5%) |
| 4.0x or more | 14 (22.6%) | 18 (14.0%) |
| Total | 62 (100.0%) | 129 (100.0%) |
Real Estate Taxes by Mortgage Status in Monroe
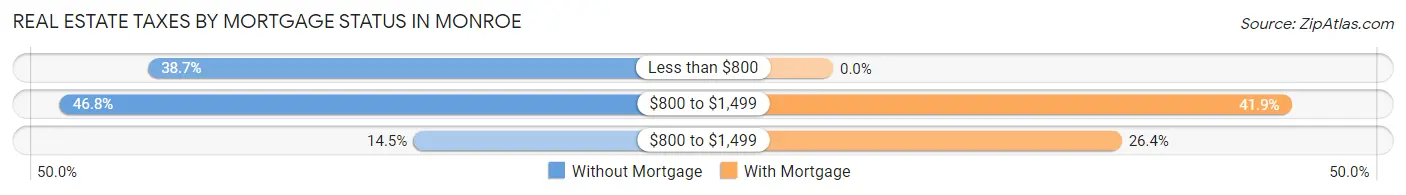
| Property Taxes | Without Mortgage | With Mortgage |
| Less than $800 | 24 (38.7%) | 0 (0.0%) |
| $800 to $1,499 | 29 (46.8%) | 54 (41.9%) |
| $800 to $1,499 | 9 (14.5%) | 34 (26.4%) |
| Total | 62 (100.0%) | 129 (100.0%) |
Health & Disability in Monroe
Health Insurance Coverage by Age in Monroe
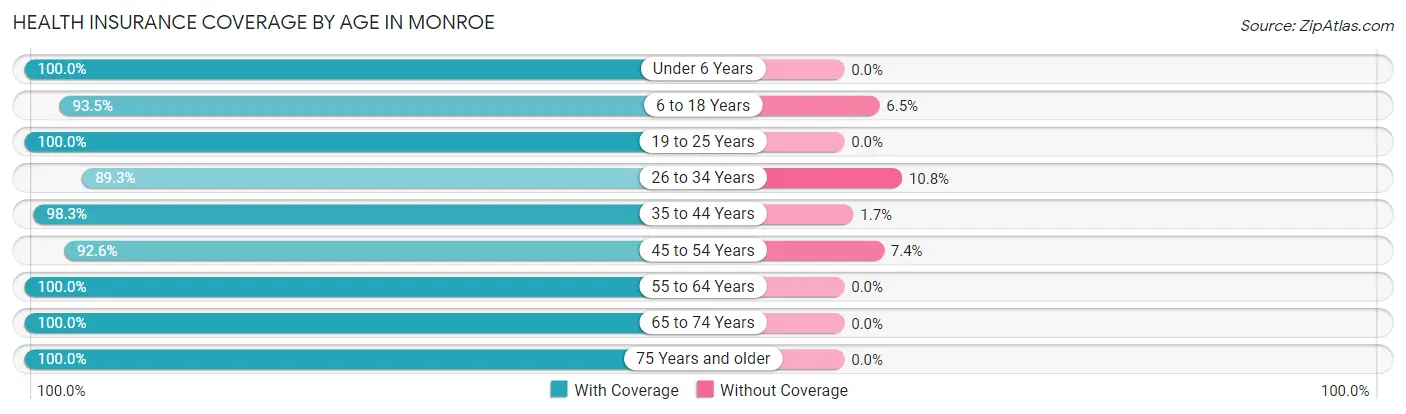
| Age Bracket | With Coverage | Without Coverage |
| Under 6 Years | 71 (100.0%) | 0 (0.0%) |
| 6 to 18 Years | 143 (93.5%) | 10 (6.5%) |
| 19 to 25 Years | 51 (100.0%) | 0 (0.0%) |
| 26 to 34 Years | 83 (89.2%) | 10 (10.7%) |
| 35 to 44 Years | 58 (98.3%) | 1 (1.7%) |
| 45 to 54 Years | 88 (92.6%) | 7 (7.4%) |
| 55 to 64 Years | 59 (100.0%) | 0 (0.0%) |
| 65 to 74 Years | 31 (100.0%) | 0 (0.0%) |
| 75 Years and older | 26 (100.0%) | 0 (0.0%) |
| Total | 610 (95.6%) | 28 (4.4%) |
Health Insurance Coverage by Citizenship Status in Monroe
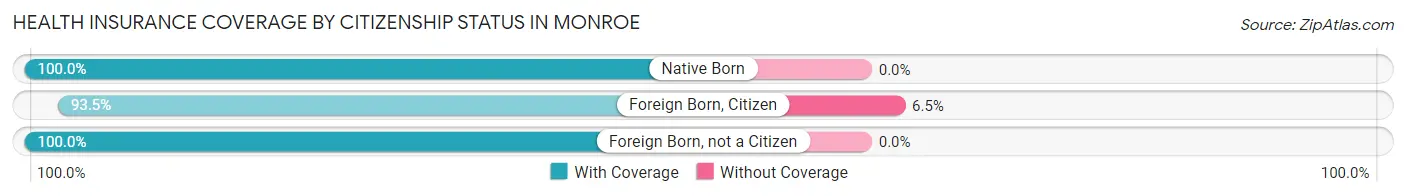
| Citizenship Status | With Coverage | Without Coverage |
| Native Born | 71 (100.0%) | 0 (0.0%) |
| Foreign Born, Citizen | 143 (93.5%) | 10 (6.5%) |
| Foreign Born, not a Citizen | 51 (100.0%) | 0 (0.0%) |
Health Insurance Coverage by Household Income in Monroe
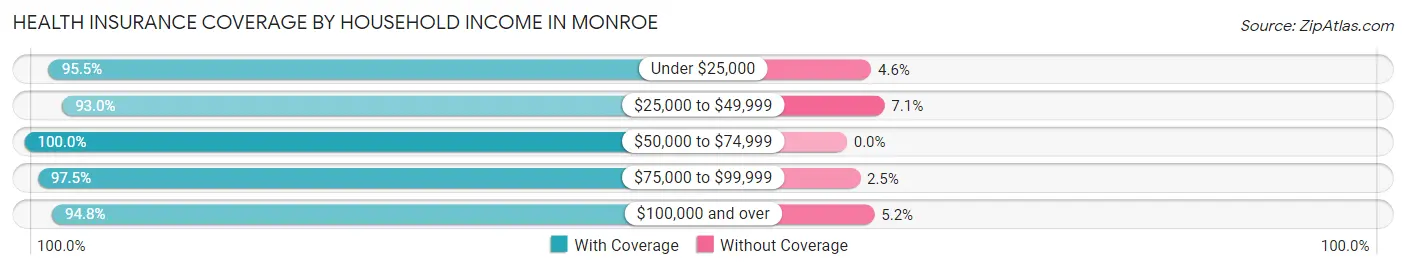
| Household Income | With Coverage | Without Coverage |
| Under $25,000 | 42 (95.5%) | 2 (4.5%) |
| $25,000 to $49,999 | 145 (92.9%) | 11 (7.0%) |
| $50,000 to $74,999 | 85 (100.0%) | 0 (0.0%) |
| $75,000 to $99,999 | 118 (97.5%) | 3 (2.5%) |
| $100,000 and over | 220 (94.8%) | 12 (5.2%) |
Public vs Private Health Insurance Coverage by Age in Monroe
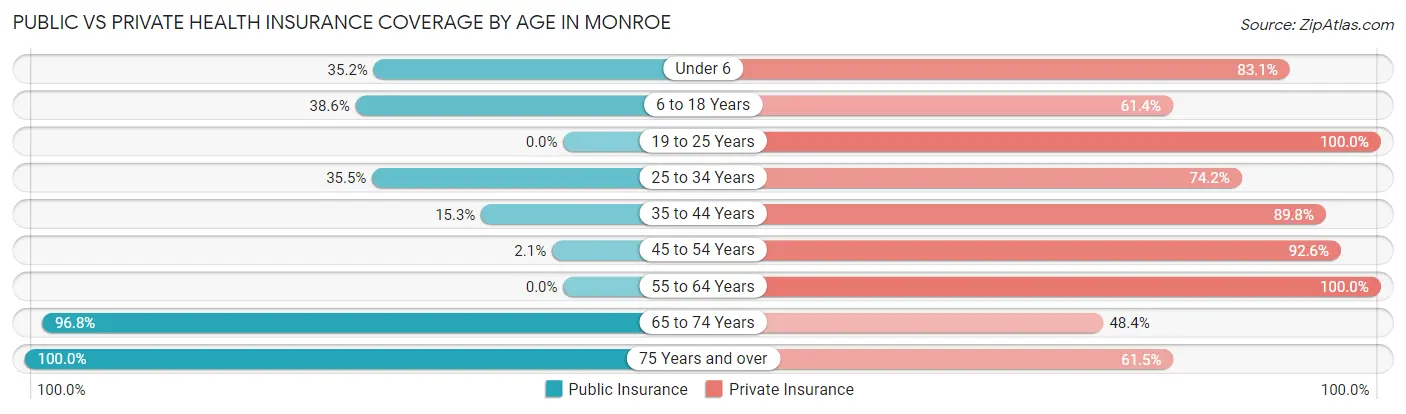
| Age Bracket | Public Insurance | Private Insurance |
| Under 6 | 25 (35.2%) | 59 (83.1%) |
| 6 to 18 Years | 59 (38.6%) | 94 (61.4%) |
| 19 to 25 Years | 0 (0.0%) | 51 (100.0%) |
| 25 to 34 Years | 33 (35.5%) | 69 (74.2%) |
| 35 to 44 Years | 9 (15.2%) | 53 (89.8%) |
| 45 to 54 Years | 2 (2.1%) | 88 (92.6%) |
| 55 to 64 Years | 0 (0.0%) | 59 (100.0%) |
| 65 to 74 Years | 30 (96.8%) | 15 (48.4%) |
| 75 Years and over | 26 (100.0%) | 16 (61.5%) |
| Total | 184 (28.8%) | 504 (79.0%) |
Disability Status by Sex by Age in Monroe
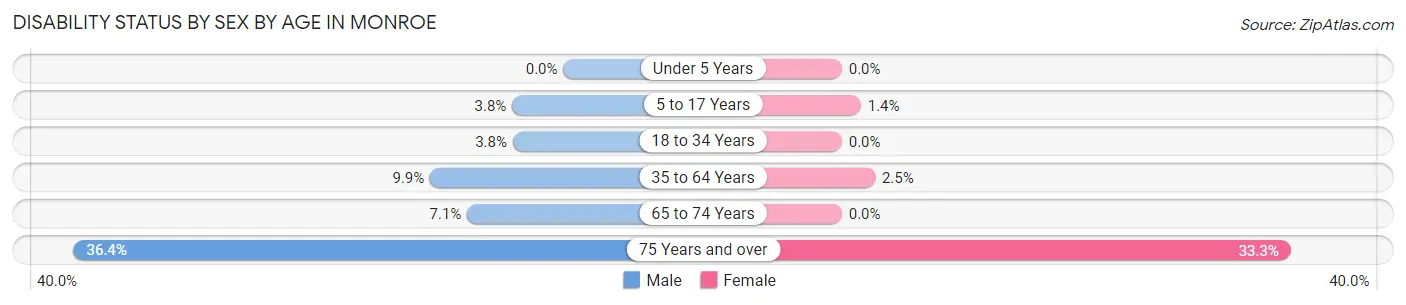
| Age Bracket | Male | Female |
| Under 5 Years | 0 (0.0%) | 0 (0.0%) |
| 5 to 17 Years | 3 (3.8%) | 1 (1.4%) |
| 18 to 34 Years | 3 (3.7%) | 0 (0.0%) |
| 35 to 64 Years | 9 (9.9%) | 3 (2.5%) |
| 65 to 74 Years | 1 (7.1%) | 0 (0.0%) |
| 75 Years and over | 4 (36.4%) | 5 (33.3%) |
Disability Class by Sex by Age in Monroe
Disability Class: Hearing Difficulty
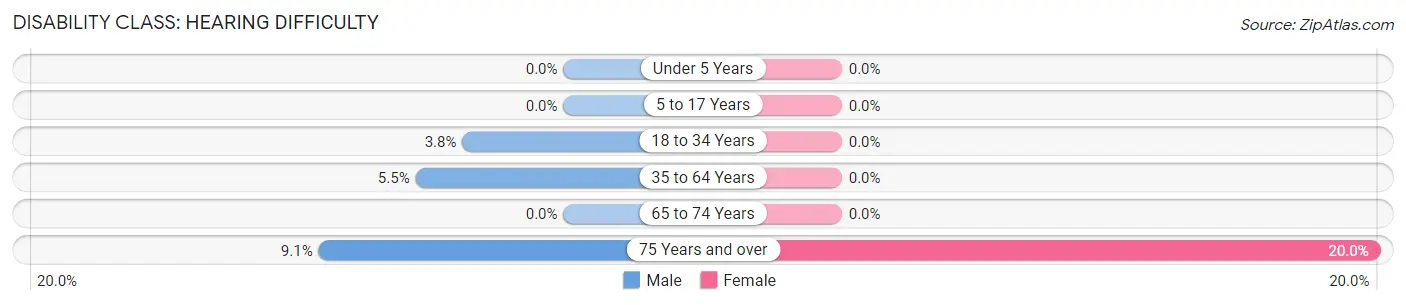
| Age Bracket | Male | Female |
| Under 5 Years | 0 (0.0%) | 0 (0.0%) |
| 5 to 17 Years | 0 (0.0%) | 0 (0.0%) |
| 18 to 34 Years | 3 (3.7%) | 0 (0.0%) |
| 35 to 64 Years | 5 (5.5%) | 0 (0.0%) |
| 65 to 74 Years | 0 (0.0%) | 0 (0.0%) |
| 75 Years and over | 1 (9.1%) | 3 (20.0%) |
Disability Class: Vision Difficulty
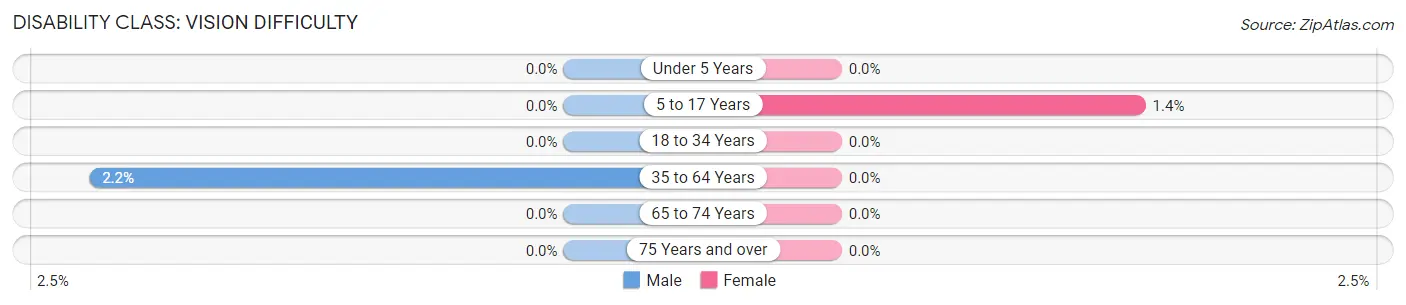
| Age Bracket | Male | Female |
| Under 5 Years | 0 (0.0%) | 0 (0.0%) |
| 5 to 17 Years | 0 (0.0%) | 1 (1.4%) |
| 18 to 34 Years | 0 (0.0%) | 0 (0.0%) |
| 35 to 64 Years | 2 (2.2%) | 0 (0.0%) |
| 65 to 74 Years | 0 (0.0%) | 0 (0.0%) |
| 75 Years and over | 0 (0.0%) | 0 (0.0%) |
Disability Class: Cognitive Difficulty
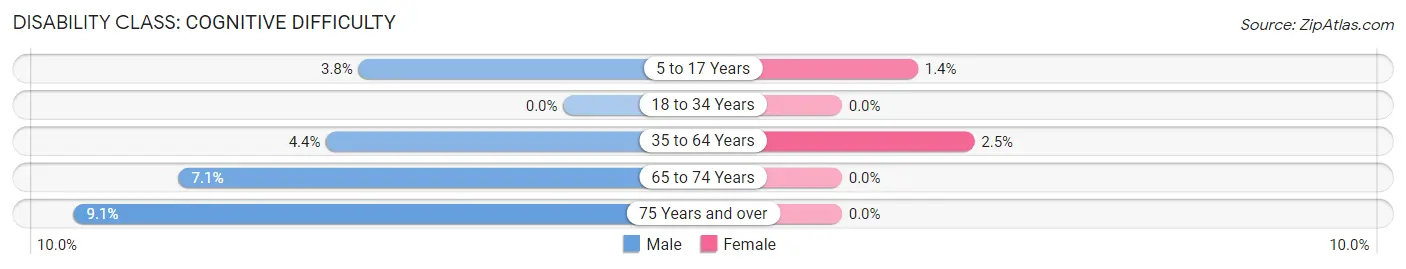
| Age Bracket | Male | Female |
| 5 to 17 Years | 3 (3.8%) | 1 (1.4%) |
| 18 to 34 Years | 0 (0.0%) | 0 (0.0%) |
| 35 to 64 Years | 4 (4.4%) | 3 (2.5%) |
| 65 to 74 Years | 1 (7.1%) | 0 (0.0%) |
| 75 Years and over | 1 (9.1%) | 0 (0.0%) |
Disability Class: Ambulatory Difficulty
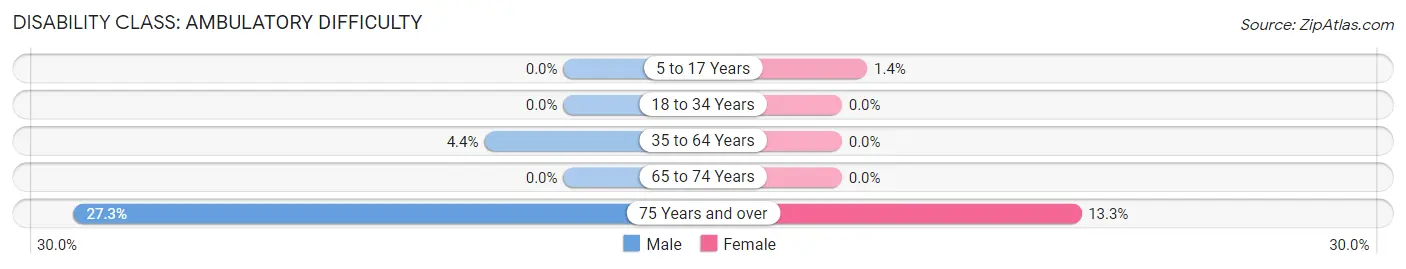
| Age Bracket | Male | Female |
| 5 to 17 Years | 0 (0.0%) | 1 (1.4%) |
| 18 to 34 Years | 0 (0.0%) | 0 (0.0%) |
| 35 to 64 Years | 4 (4.4%) | 0 (0.0%) |
| 65 to 74 Years | 0 (0.0%) | 0 (0.0%) |
| 75 Years and over | 3 (27.3%) | 2 (13.3%) |
Disability Class: Self-Care Difficulty
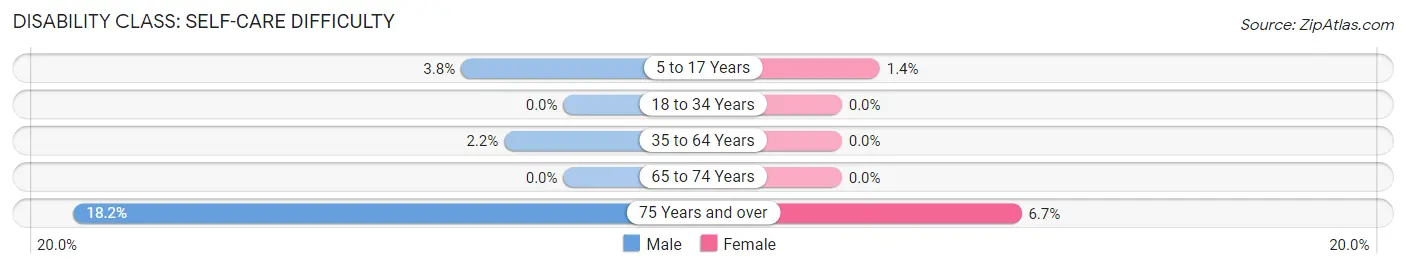
| Age Bracket | Male | Female |
| 5 to 17 Years | 3 (3.8%) | 1 (1.4%) |
| 18 to 34 Years | 0 (0.0%) | 0 (0.0%) |
| 35 to 64 Years | 2 (2.2%) | 0 (0.0%) |
| 65 to 74 Years | 0 (0.0%) | 0 (0.0%) |
| 75 Years and over | 2 (18.2%) | 1 (6.7%) |
Technology Access in Monroe
Computing Device Access in Monroe
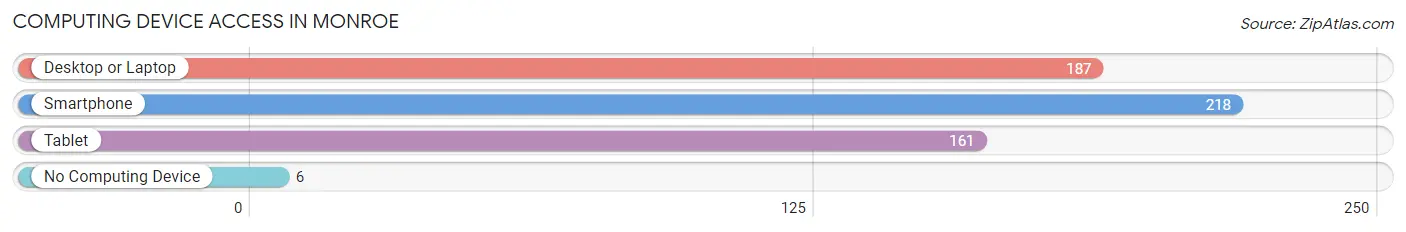
| Device Type | # Households | % Households |
| Desktop or Laptop | 187 | 80.3% |
| Smartphone | 218 | 93.6% |
| Tablet | 161 | 69.1% |
| No Computing Device | 6 | 2.6% |
| Total | 233 | 100.0% |
Internet Access in Monroe
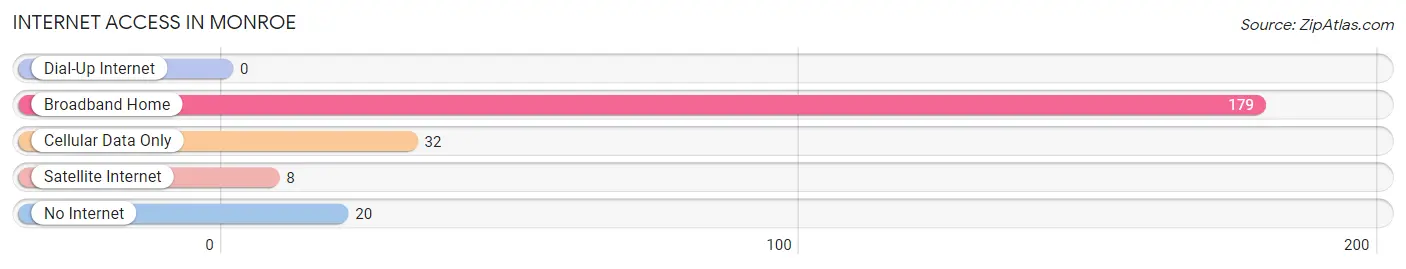
| Internet Type | # Households | % Households |
| Dial-Up Internet | 0 | 0.0% |
| Broadband Home | 179 | 76.8% |
| Cellular Data Only | 32 | 13.7% |
| Satellite Internet | 8 | 3.4% |
| No Internet | 20 | 8.6% |
| Total | 233 | 100.0% |
Monroe Summary
Monroe, Indiana is a small town located in the southeastern corner of the state, just north of the Ohio border. It is part of the Bloomington Metropolitan Statistical Area and is the county seat of Monroe County. The town has a population of approximately 2,500 people and is known for its rural charm and small-town atmosphere.
History
Monroe was founded in 1818 by a group of settlers from North Carolina. The town was named after James Monroe, the fifth President of the United States. The town was originally a farming community, but it soon developed into a small manufacturing center. In the late 19th century, the town was home to several factories, including a woolen mill, a flour mill, and a furniture factory.
Geography
Monroe is located in the southeastern corner of Indiana, just north of the Ohio border. It is part of the Bloomington Metropolitan Statistical Area and is the county seat of Monroe County. The town is situated on the banks of the White River, which flows through the town and provides a scenic backdrop. The town is surrounded by rolling hills and farmland, and is located just a few miles from the Hoosier National Forest.
Economy
Monroe’s economy is largely based on agriculture and manufacturing. The town is home to several small businesses, including a furniture factory, a flour mill, and a woolen mill. The town also has a few retail stores, restaurants, and other services. The town is also home to a branch of the Monroe County Public Library.
Demographics
As of the 2010 census, Monroe had a population of 2,500 people. The racial makeup of the town was 95.2% White, 1.2% African American, 0.4% Native American, 0.8% Asian, 0.2% from other races, and 2.4% from two or more races. The median household income was $37,500, and the median family income was $45,000. The town’s poverty rate was 11.2%.
Monroe is a small town with a rural charm and a friendly atmosphere. It is a great place to live and work, and it offers a variety of activities and attractions for visitors and residents alike. The town is home to several historic sites, including the Monroe County Courthouse and the Monroe County Historical Museum. The town also has several parks and recreational areas, including the White River State Park and the Monroe County Fairgrounds.
Common Questions
What is Per Capita Income in Monroe?
Per Capita income in Monroe is $28,167.
What is the Median Family Income in Monroe?
Median Family Income in Monroe is $82,583.
What is the Median Household income in Monroe?
Median Household Income in Monroe is $68,125.
What is Income or Wage Gap in Monroe?
Income or Wage Gap in Monroe is 35.2%.
Women in Monroe earn 64.8 cents for every dollar earned by a man.
What is Inequality or Gini Index in Monroe?
Inequality or Gini Index in Monroe is 0.34.
What is the Total Population of Monroe?
Total Population of Monroe is 640.
What is the Total Male Population of Monroe?
Total Male Population of Monroe is 314.
What is the Total Female Population of Monroe?
Total Female Population of Monroe is 326.
What is the Ratio of Males per 100 Females in Monroe?
There are 96.32 Males per 100 Females in Monroe.
What is the Ratio of Females per 100 Males in Monroe?
There are 103.82 Females per 100 Males in Monroe.
What is the Median Population Age in Monroe?
Median Population Age in Monroe is 29.5 Years.
What is the Average Family Size in Monroe
Average Family Size in Monroe is 3.4 People.
What is the Average Household Size in Monroe
Average Household Size in Monroe is 2.8 People.
How Large is the Labor Force in Monroe?
There are 360 People in the Labor Forcein in Monroe.
What is the Percentage of People in the Labor Force in Monroe?
76.4% of People are in the Labor Force in Monroe.
What is the Unemployment Rate in Monroe?
Unemployment Rate in Monroe is 0.3%.