Martinsville, IN Map & Demographics
Martinsville Map
Martinsville Overview
$28,963
PER CAPITA INCOME
$71,174
AVG FAMILY INCOME
$57,383
AVG HOUSEHOLD INCOME
25.5%
WAGE / INCOME GAP [ % ]
74.5¢/ $1
WAGE / INCOME GAP [ $ ]
0.43
INEQUALITY / GINI INDEX
11,916
TOTAL POPULATION
6,172
MALE POPULATION
5,744
FEMALE POPULATION
107.45
MALES / 100 FEMALES
93.07
FEMALES / 100 MALES
36.2
MEDIAN AGE
3.2
AVG FAMILY SIZE
2.6
AVG HOUSEHOLD SIZE
5,725
LABOR FORCE [ PEOPLE ]
60.5%
PERCENT IN LABOR FORCE
4.6%
UNEMPLOYMENT RATE
Martinsville Zip Codes
Martinsville Area Codes
Income in Martinsville
Income Overview in Martinsville
Per Capita Income in Martinsville is $28,963, while median incomes of families and households are $71,174 and $57,383 respectively.
| Characteristic | Number | Measure |
| Per Capita Income | 11,916 | $28,963 |
| Median Family Income | 2,885 | $71,174 |
| Mean Family Income | 2,885 | $84,783 |
| Median Household Income | 4,438 | $57,383 |
| Mean Household Income | 4,438 | $72,871 |
| Income Deficit | 2,885 | $0 |
| Wage / Income Gap (%) | 11,916 | 25.52% |
| Wage / Income Gap ($) | 11,916 | 74.48¢ per $1 |
| Gini / Inequality Index | 11,916 | 0.43 |
Earnings by Sex in Martinsville
Average Earnings in Martinsville are $36,929, $43,997 for men and $32,767 for women, a difference of 25.5%.
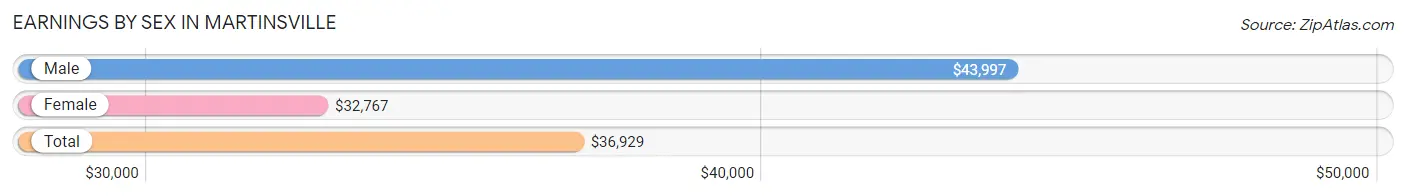
| Sex | Number | Average Earnings |
| Male | 3,519 (57.9%) | $43,997 |
| Female | 2,559 (42.1%) | $32,767 |
| Total | 6,078 (100.0%) | $36,929 |
Earnings by Sex by Income Bracket in Martinsville
The most common earnings brackets in Martinsville are $45,000 to $49,999 for men (398 | 11.3%) and $30,000 to $34,999 for women (284 | 11.1%).
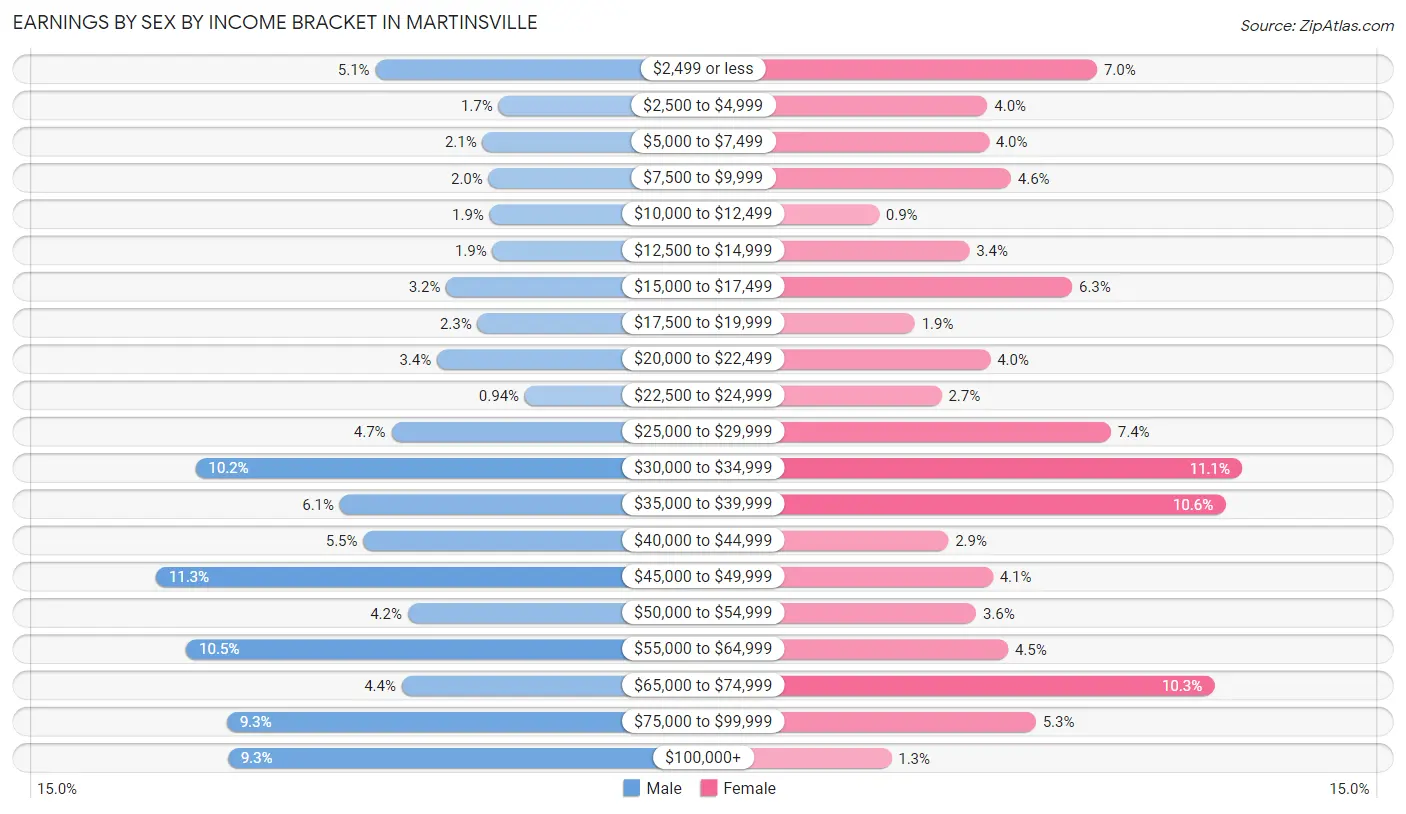
| Income | Male | Female |
| $2,499 or less | 181 (5.1%) | 180 (7.0%) |
| $2,500 to $4,999 | 59 (1.7%) | 101 (4.0%) |
| $5,000 to $7,499 | 75 (2.1%) | 102 (4.0%) |
| $7,500 to $9,999 | 69 (2.0%) | 118 (4.6%) |
| $10,000 to $12,499 | 68 (1.9%) | 23 (0.9%) |
| $12,500 to $14,999 | 65 (1.8%) | 88 (3.4%) |
| $15,000 to $17,499 | 111 (3.2%) | 162 (6.3%) |
| $17,500 to $19,999 | 80 (2.3%) | 49 (1.9%) |
| $20,000 to $22,499 | 120 (3.4%) | 103 (4.0%) |
| $22,500 to $24,999 | 33 (0.9%) | 68 (2.7%) |
| $25,000 to $29,999 | 165 (4.7%) | 190 (7.4%) |
| $30,000 to $34,999 | 359 (10.2%) | 284 (11.1%) |
| $35,000 to $39,999 | 216 (6.1%) | 272 (10.6%) |
| $40,000 to $44,999 | 193 (5.5%) | 73 (2.9%) |
| $45,000 to $49,999 | 398 (11.3%) | 105 (4.1%) |
| $50,000 to $54,999 | 149 (4.2%) | 93 (3.6%) |
| $55,000 to $64,999 | 368 (10.5%) | 116 (4.5%) |
| $65,000 to $74,999 | 155 (4.4%) | 264 (10.3%) |
| $75,000 to $99,999 | 328 (9.3%) | 136 (5.3%) |
| $100,000+ | 327 (9.3%) | 32 (1.3%) |
| Total | 3,519 (100.0%) | 2,559 (100.0%) |
Earnings by Sex by Educational Attainment in Martinsville
Average earnings in Martinsville are $47,967 for men and $34,870 for women, a difference of 27.3%. Men with an educational attainment of bachelor's degree enjoy the highest average annual earnings of $56,500, while those with less than high school education earn the least with $38,638. Women with an educational attainment of graduate degree earn the most with the average annual earnings of $73,676, while those with less than high school education have the smallest earnings of $20,772.
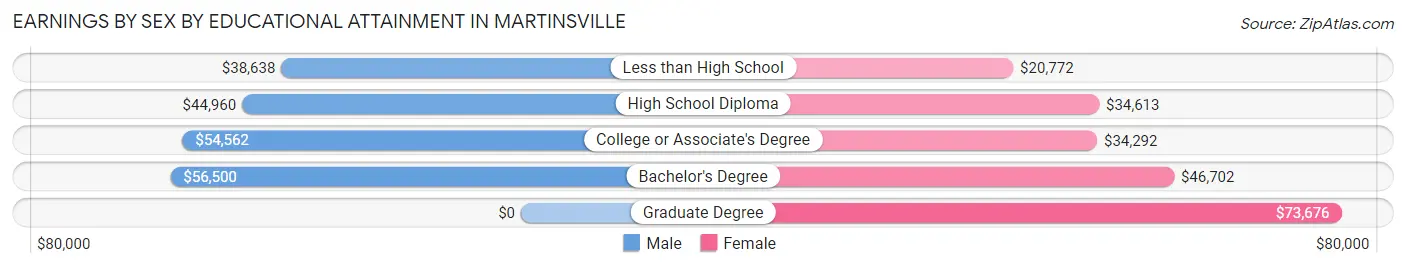
| Educational Attainment | Male Income | Female Income |
| Less than High School | $38,638 | $20,772 |
| High School Diploma | $44,960 | $34,613 |
| College or Associate's Degree | $54,562 | $34,292 |
| Bachelor's Degree | $56,500 | $46,702 |
| Graduate Degree | - | - |
| Total | $47,967 | $34,870 |
Family Income in Martinsville
Family Income Brackets in Martinsville
According to the Martinsville family income data, there are 666 families falling into the $50,000 to $74,999 income range, which is the most common income bracket and makes up 23.1% of all families. Conversely, the $15,000 to $24,999 income bracket is the least frequent group with only 72 families (2.5%) belonging to this category.
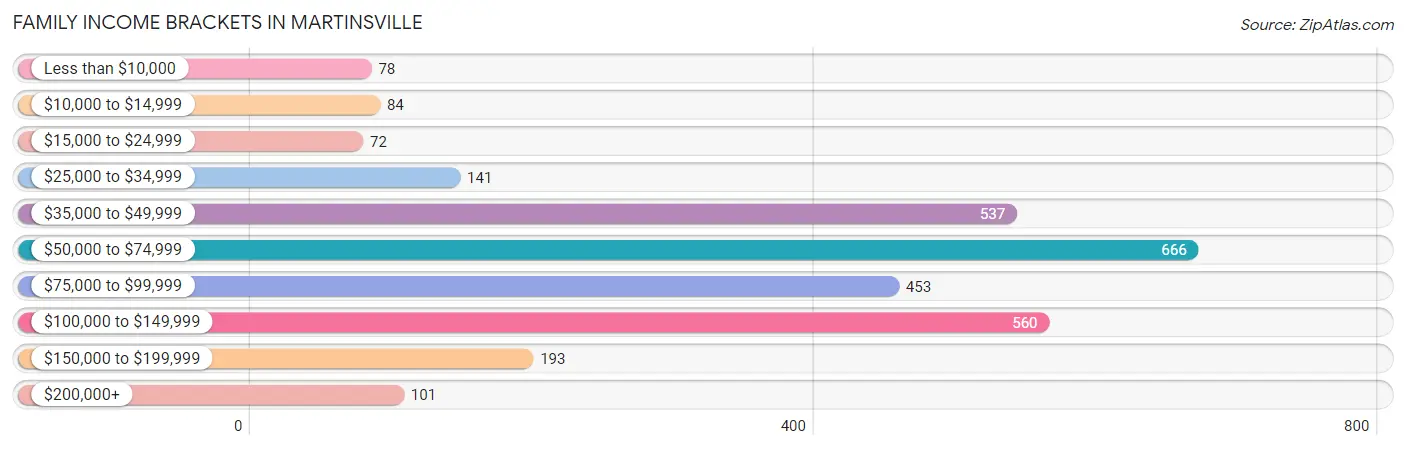
| Income Bracket | # Families | % Families |
| Less than $10,000 | 78 | 2.7% |
| $10,000 to $14,999 | 84 | 2.9% |
| $15,000 to $24,999 | 72 | 2.5% |
| $25,000 to $34,999 | 141 | 4.9% |
| $35,000 to $49,999 | 537 | 18.6% |
| $50,000 to $74,999 | 666 | 23.1% |
| $75,000 to $99,999 | 453 | 15.7% |
| $100,000 to $149,999 | 560 | 19.4% |
| $150,000 to $199,999 | 193 | 6.7% |
| $200,000+ | 101 | 3.5% |
Family Income by Famaliy Size in Martinsville
7+ person families (113 | 3.9%) account for the highest median family income in Martinsville with $114,547 per family, while 2-person families (1,367 | 47.4%) have the highest median income of $30,145 per family member.
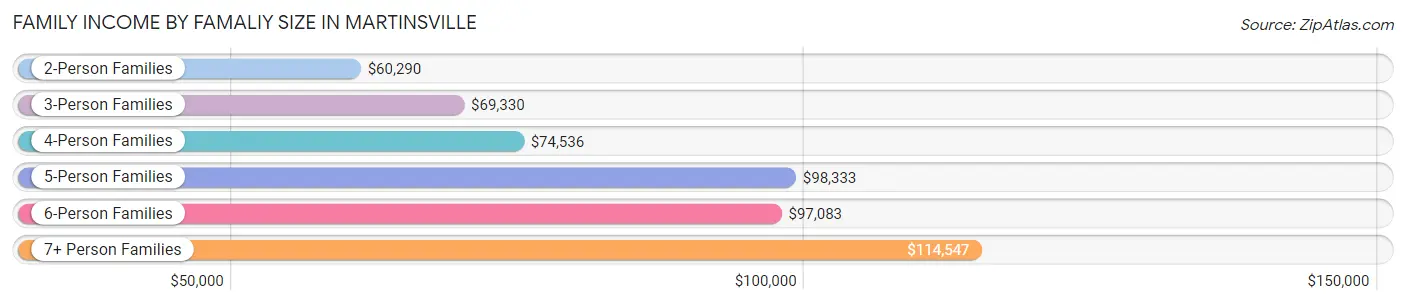
| Income Bracket | # Families | Median Income |
| 2-Person Families | 1,367 (47.4%) | $60,290 |
| 3-Person Families | 693 (24.0%) | $69,330 |
| 4-Person Families | 345 (12.0%) | $74,536 |
| 5-Person Families | 238 (8.3%) | $98,333 |
| 6-Person Families | 129 (4.5%) | $97,083 |
| 7+ Person Families | 113 (3.9%) | $114,547 |
| Total | 2,885 (100.0%) | $71,174 |
Family Income by Number of Earners in Martinsville
The median family income in Martinsville is $71,174, with families comprising 3+ earners (359) having the highest median family income of $116,299, while families with no earners (391) have the lowest median family income of $45,781, accounting for 12.4% and 13.6% of families, respectively.
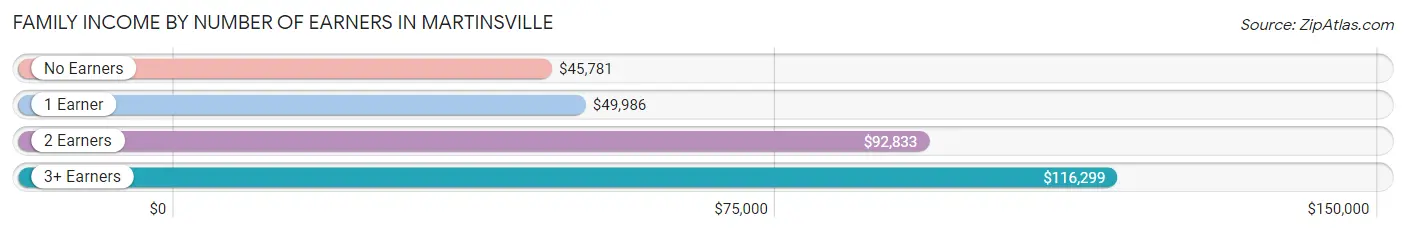
| Number of Earners | # Families | Median Income |
| No Earners | 391 (13.6%) | $45,781 |
| 1 Earner | 1,065 (36.9%) | $49,986 |
| 2 Earners | 1,070 (37.1%) | $92,833 |
| 3+ Earners | 359 (12.4%) | $116,299 |
| Total | 2,885 (100.0%) | $71,174 |
Household Income in Martinsville
Household Income Brackets in Martinsville
With 945 households falling in the category, the $50,000 to $74,999 income range is the most frequent in Martinsville, accounting for 21.3% of all households. In contrast, only 102 households (2.3%) fall into the $200,000+ income bracket, making it the least populous group.
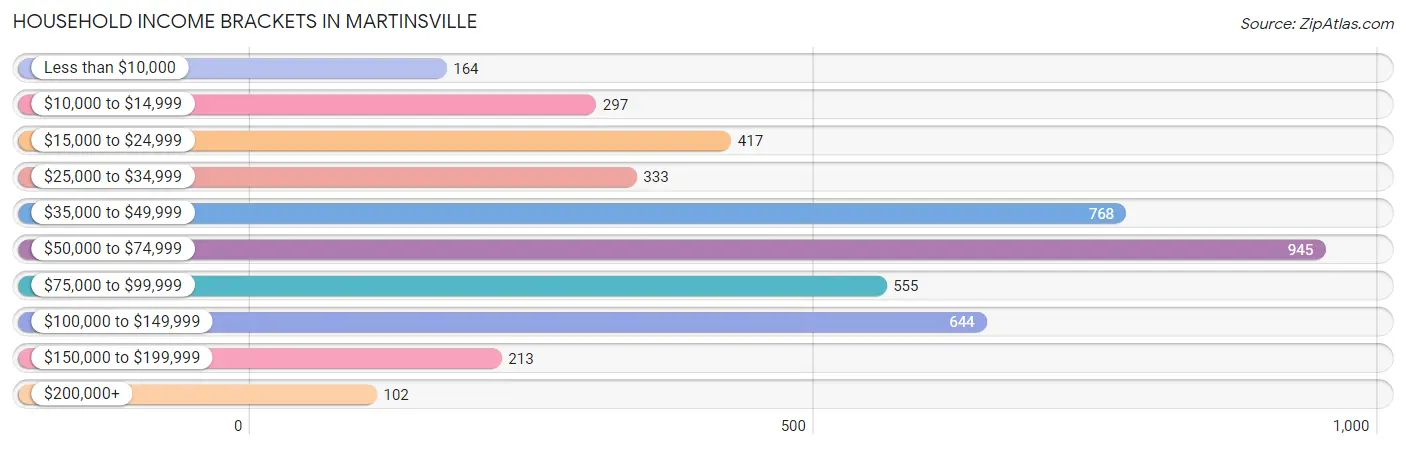
| Income Bracket | # Households | % Households |
| Less than $10,000 | 164 | 3.7% |
| $10,000 to $14,999 | 297 | 6.7% |
| $15,000 to $24,999 | 417 | 9.4% |
| $25,000 to $34,999 | 333 | 7.5% |
| $35,000 to $49,999 | 768 | 17.3% |
| $50,000 to $74,999 | 945 | 21.3% |
| $75,000 to $99,999 | 555 | 12.5% |
| $100,000 to $149,999 | 644 | 14.5% |
| $150,000 to $199,999 | 213 | 4.8% |
| $200,000+ | 102 | 2.3% |
Household Income by Householder Age in Martinsville
The median household income in Martinsville is $57,383, with the highest median household income of $76,934 found in the 25 to 44 years age bracket for the primary householder. A total of 1,558 households (35.1%) fall into this category. Meanwhile, the 65+ years age bracket for the primary householder has the lowest median household income of $33,574, with 1,249 households (28.1%) in this group.
| Income Bracket | # Households | Median Income |
| 15 to 24 Years | 194 (4.4%) | $36,786 |
| 25 to 44 Years | 1,558 (35.1%) | $76,934 |
| 45 to 64 Years | 1,437 (32.4%) | $57,396 |
| 65+ Years | 1,249 (28.1%) | $33,574 |
| Total | 4,438 (100.0%) | $57,383 |
Poverty in Martinsville
Income Below Poverty by Sex and Age in Martinsville
With 7.1% poverty level for males and 12.9% for females among the residents of Martinsville, 55 to 64 year old males and 5 year old females are the most vulnerable to poverty, with 115 males (17.0%) and 28 females (45.9%) in their respective age groups living below the poverty level.
| Age Bracket | Male | Female |
| Under 5 Years | 49 (16.1%) | 20 (5.4%) |
| 5 Years | 0 (0.0%) | 28 (45.9%) |
| 6 to 11 Years | 67 (10.4%) | 0 (0.0%) |
| 12 to 14 Years | 0 (0.0%) | 37 (13.8%) |
| 15 Years | 0 (0.0%) | 0 (0.0%) |
| 16 and 17 Years | 5 (2.6%) | 14 (6.3%) |
| 18 to 24 Years | 84 (10.1%) | 95 (20.1%) |
| 25 to 34 Years | 24 (2.8%) | 72 (11.4%) |
| 35 to 44 Years | 16 (2.1%) | 41 (5.7%) |
| 45 to 54 Years | 22 (3.8%) | 76 (11.7%) |
| 55 to 64 Years | 115 (17.0%) | 100 (13.2%) |
| 65 to 74 Years | 17 (3.8%) | 152 (30.2%) |
| 75 Years and over | 20 (7.2%) | 80 (18.9%) |
| Total | 419 (7.1%) | 715 (12.9%) |
Income Above Poverty by Sex and Age in Martinsville
According to the poverty statistics in Martinsville, males aged 5 years and females aged 6 to 11 years are the age groups that are most secure financially, with 100.0% of males and 100.0% of females in these age groups living above the poverty line.
| Age Bracket | Male | Female |
| Under 5 Years | 255 (83.9%) | 352 (94.6%) |
| 5 Years | 32 (100.0%) | 33 (54.1%) |
| 6 to 11 Years | 579 (89.6%) | 324 (100.0%) |
| 12 to 14 Years | 254 (100.0%) | 232 (86.3%) |
| 15 Years | 46 (100.0%) | 123 (100.0%) |
| 16 and 17 Years | 186 (97.4%) | 209 (93.7%) |
| 18 to 24 Years | 751 (89.9%) | 377 (79.9%) |
| 25 to 34 Years | 830 (97.2%) | 562 (88.6%) |
| 35 to 44 Years | 761 (97.9%) | 678 (94.3%) |
| 45 to 54 Years | 563 (96.2%) | 573 (88.3%) |
| 55 to 64 Years | 560 (83.0%) | 658 (86.8%) |
| 65 to 74 Years | 429 (96.2%) | 351 (69.8%) |
| 75 Years and over | 259 (92.8%) | 344 (81.1%) |
| Total | 5,505 (92.9%) | 4,816 (87.1%) |
Income Below Poverty Among Married-Couple Families in Martinsville
The poverty statistics for married-couple families in Martinsville show that 1.3% or 27 of the total 2,018 families live below the poverty line. Families with no children have the highest poverty rate of 2.7%, comprising of 27 families. On the other hand, families with 1 or 2 children have the lowest poverty rate of 0.0%, which includes 0 families.
| Children | Above Poverty | Below Poverty |
| No Children | 975 (97.3%) | 27 (2.7%) |
| 1 or 2 Children | 729 (100.0%) | 0 (0.0%) |
| 3 or 4 Children | 218 (100.0%) | 0 (0.0%) |
| 5 or more Children | 69 (100.0%) | 0 (0.0%) |
| Total | 1,991 (98.7%) | 27 (1.3%) |
Income Below Poverty Among Single-Parent Households in Martinsville
According to the poverty data in Martinsville, 6.9% or 26 single-father households and 25.1% or 123 single-mother households are living below the poverty line. Among single-father households, those with 1 or 2 children have the highest poverty rate, with 26 households (12.1%) experiencing poverty. Likewise, among single-mother households, those with 3 or 4 children have the highest poverty rate, with 32 households (78.0%) falling below the poverty line.
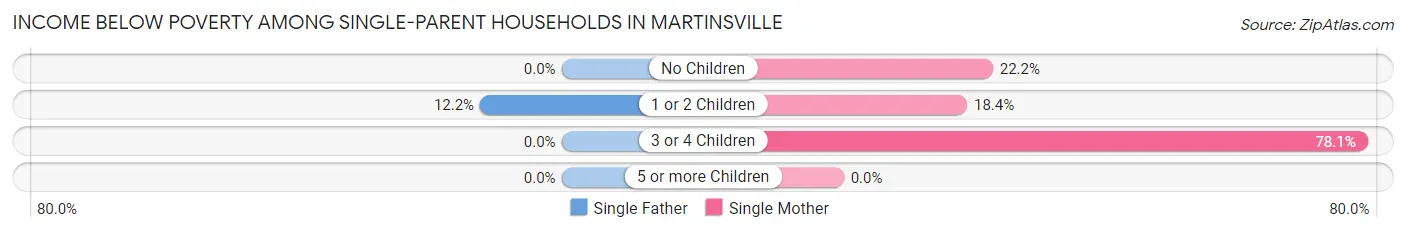
| Children | Single Father | Single Mother |
| No Children | 0 (0.0%) | 48 (22.2%) |
| 1 or 2 Children | 26 (12.1%) | 43 (18.4%) |
| 3 or 4 Children | 0 (0.0%) | 32 (78.0%) |
| 5 or more Children | 0 (0.0%) | 0 (0.0%) |
| Total | 26 (6.9%) | 123 (25.1%) |
Income Below Poverty Among Married-Couple vs Single-Parent Households in Martinsville
The poverty data for Martinsville shows that 27 of the married-couple family households (1.3%) and 149 of the single-parent households (17.2%) are living below the poverty level. Within the married-couple family households, those with no children have the highest poverty rate, with 27 households (2.7%) falling below the poverty line. Among the single-parent households, those with 3 or 4 children have the highest poverty rate, with 32 household (78.0%) living below poverty.
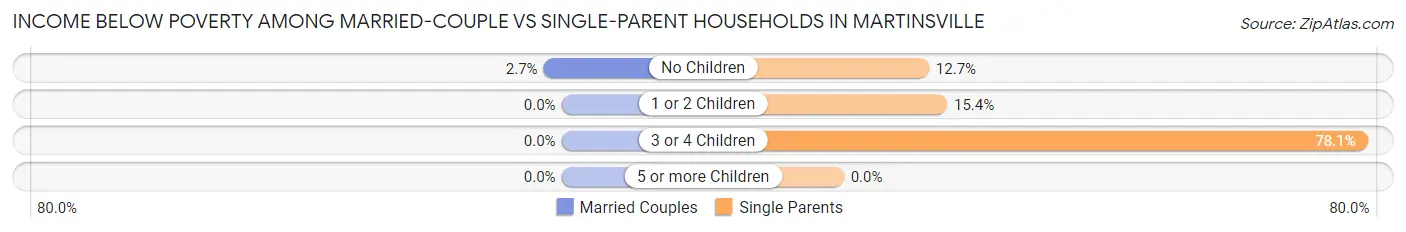
| Children | Married-Couple Families | Single-Parent Households |
| No Children | 27 (2.7%) | 48 (12.7%) |
| 1 or 2 Children | 0 (0.0%) | 69 (15.4%) |
| 3 or 4 Children | 0 (0.0%) | 32 (78.0%) |
| 5 or more Children | 0 (0.0%) | 0 (0.0%) |
| Total | 27 (1.3%) | 149 (17.2%) |
Race in Martinsville
The most populous races in Martinsville are White / Caucasian (11,433 | 96.0%), Two or more Races (230 | 1.9%), and Hispanic or Latino (203 | 1.7%).
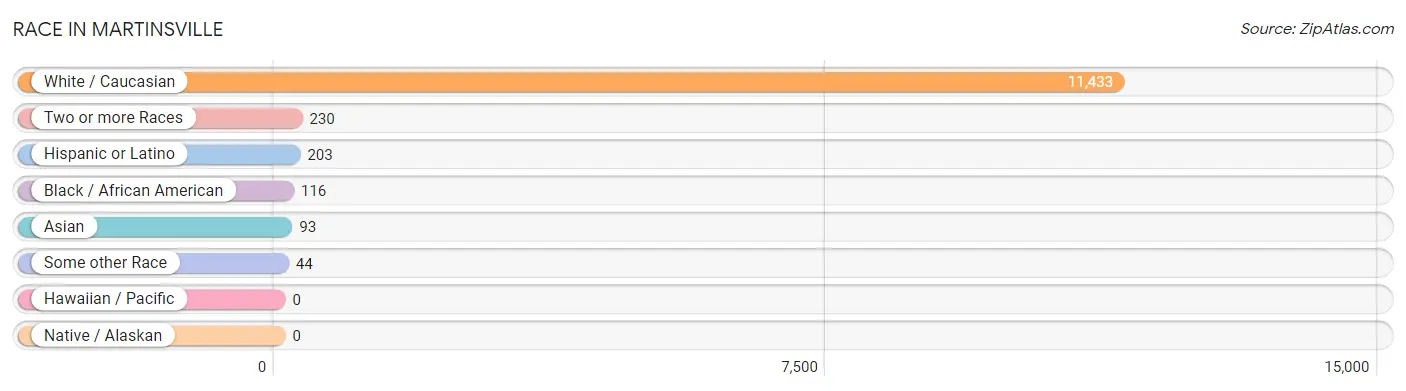
| Race | # Population | % Population |
| Asian | 93 | 0.8% |
| Black / African American | 116 | 1.0% |
| Hawaiian / Pacific | 0 | 0.0% |
| Hispanic or Latino | 203 | 1.7% |
| Native / Alaskan | 0 | 0.0% |
| White / Caucasian | 11,433 | 96.0% |
| Two or more Races | 230 | 1.9% |
| Some other Race | 44 | 0.4% |
| Total | 11,916 | 100.0% |
Ancestry in Martinsville
The most populous ancestries reported in Martinsville are German (1,405 | 11.8%), Irish (1,330 | 11.2%), American (1,222 | 10.3%), English (930 | 7.8%), and European (404 | 3.4%), together accounting for 44.4% of all Martinsville residents.
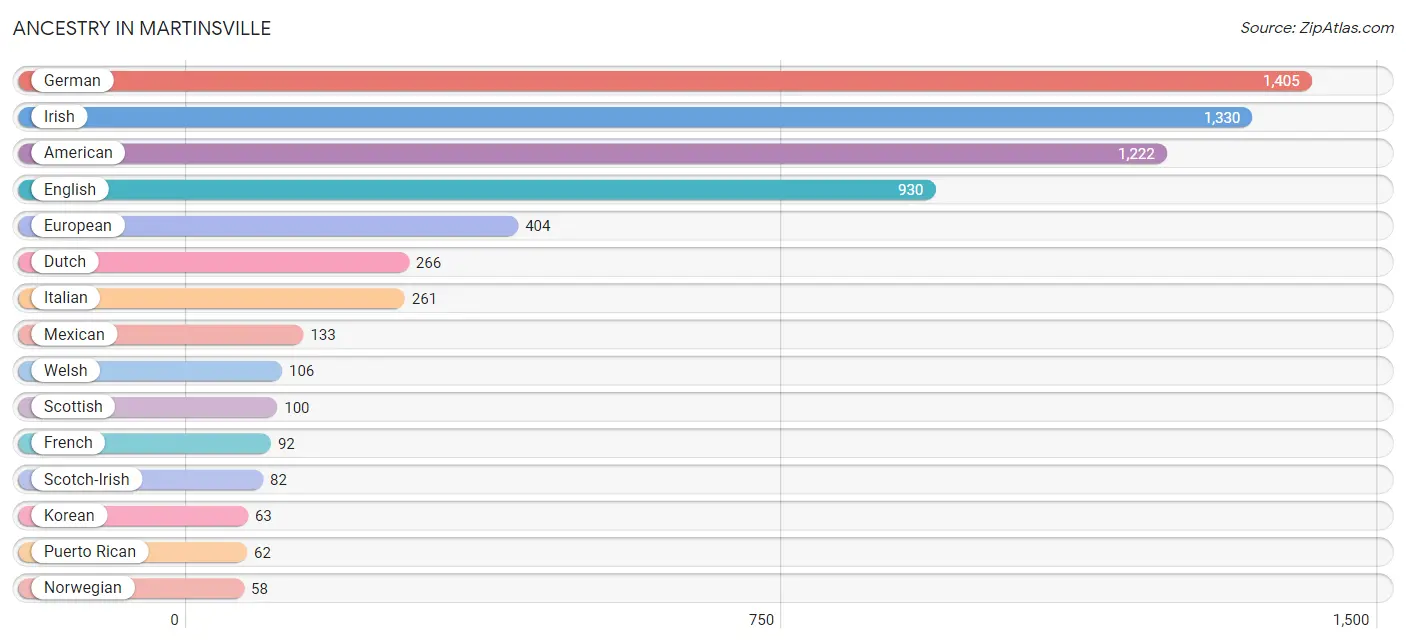
| Ancestry | # Population | % Population |
| American | 1,222 | 10.3% |
| Belgian | 7 | 0.1% |
| Brazilian | 27 | 0.2% |
| British | 34 | 0.3% |
| Cherokee | 27 | 0.2% |
| Czech | 51 | 0.4% |
| Dutch | 266 | 2.2% |
| Eastern European | 24 | 0.2% |
| English | 930 | 7.8% |
| European | 404 | 3.4% |
| French | 92 | 0.8% |
| French Canadian | 12 | 0.1% |
| German | 1,405 | 11.8% |
| Greek | 26 | 0.2% |
| Hungarian | 11 | 0.1% |
| Indian (Asian) | 30 | 0.3% |
| Irish | 1,330 | 11.2% |
| Italian | 261 | 2.2% |
| Korean | 63 | 0.5% |
| Mexican | 133 | 1.1% |
| Mexican American Indian | 12 | 0.1% |
| Norwegian | 58 | 0.5% |
| Pennsylvania German | 32 | 0.3% |
| Portuguese | 1 | 0.0% |
| Puerto Rican | 62 | 0.5% |
| Scandinavian | 29 | 0.2% |
| Scotch-Irish | 82 | 0.7% |
| Scottish | 100 | 0.8% |
| Swedish | 13 | 0.1% |
| Welsh | 106 | 0.9% | View All 30 Rows |
Immigrants in Martinsville
The most numerous immigrant groups reported in Martinsville came from Asia (93 | 0.8%), Philippines (63 | 0.5%), South Eastern Asia (63 | 0.5%), Europe (37 | 0.3%), and Germany (37 | 0.3%), together accounting for 2.5% of all Martinsville residents.
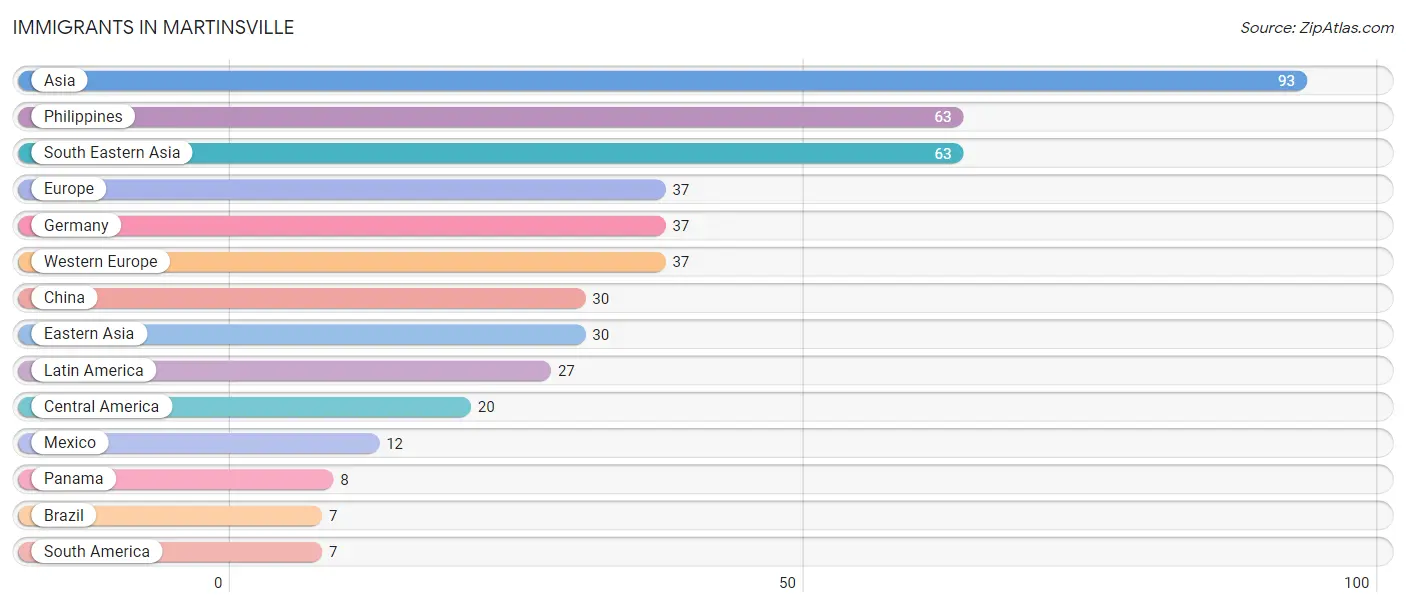
| Immigration Origin | # Population | % Population |
| Asia | 93 | 0.8% |
| Brazil | 7 | 0.1% |
| Central America | 20 | 0.2% |
| China | 30 | 0.3% |
| Eastern Asia | 30 | 0.3% |
| Europe | 37 | 0.3% |
| Germany | 37 | 0.3% |
| Latin America | 27 | 0.2% |
| Mexico | 12 | 0.1% |
| Panama | 8 | 0.1% |
| Philippines | 63 | 0.5% |
| South America | 7 | 0.1% |
| South Eastern Asia | 63 | 0.5% |
| Western Europe | 37 | 0.3% | View All 14 Rows |
Sex and Age in Martinsville
Sex and Age in Martinsville
The most populous age groups in Martinsville are 20 to 24 Years (694 | 11.2%) for men and 55 to 59 Years (536 | 9.3%) for women.
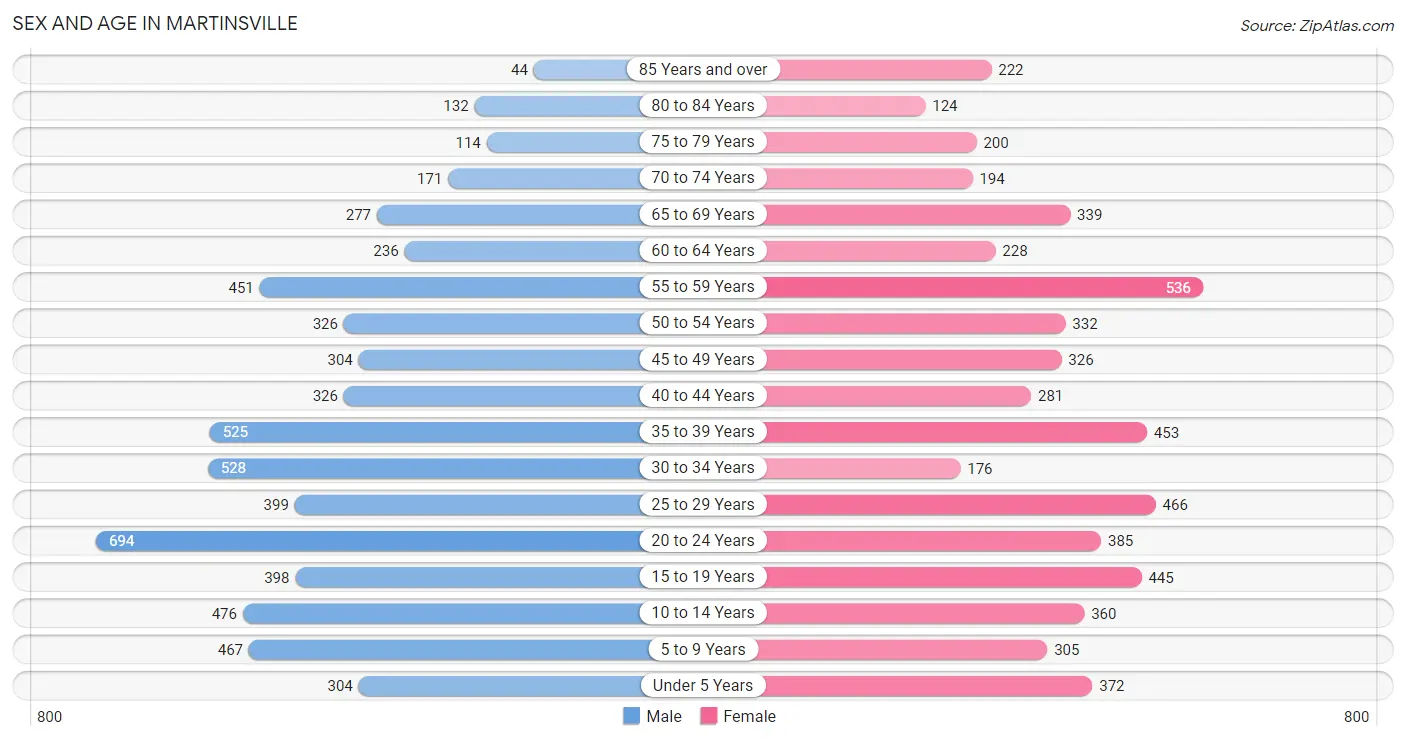
| Age Bracket | Male | Female |
| Under 5 Years | 304 (4.9%) | 372 (6.5%) |
| 5 to 9 Years | 467 (7.6%) | 305 (5.3%) |
| 10 to 14 Years | 476 (7.7%) | 360 (6.3%) |
| 15 to 19 Years | 398 (6.5%) | 445 (7.7%) |
| 20 to 24 Years | 694 (11.2%) | 385 (6.7%) |
| 25 to 29 Years | 399 (6.5%) | 466 (8.1%) |
| 30 to 34 Years | 528 (8.6%) | 176 (3.1%) |
| 35 to 39 Years | 525 (8.5%) | 453 (7.9%) |
| 40 to 44 Years | 326 (5.3%) | 281 (4.9%) |
| 45 to 49 Years | 304 (4.9%) | 326 (5.7%) |
| 50 to 54 Years | 326 (5.3%) | 332 (5.8%) |
| 55 to 59 Years | 451 (7.3%) | 536 (9.3%) |
| 60 to 64 Years | 236 (3.8%) | 228 (4.0%) |
| 65 to 69 Years | 277 (4.5%) | 339 (5.9%) |
| 70 to 74 Years | 171 (2.8%) | 194 (3.4%) |
| 75 to 79 Years | 114 (1.8%) | 200 (3.5%) |
| 80 to 84 Years | 132 (2.1%) | 124 (2.2%) |
| 85 Years and over | 44 (0.7%) | 222 (3.9%) |
| Total | 6,172 (100.0%) | 5,744 (100.0%) |
Families and Households in Martinsville
Median Family Size in Martinsville
The median family size in Martinsville is 3.20 persons per family, with married-couple families (2,018 | 70.0%) accounting for the largest median family size of 3.39 persons per family. On the other hand, single male/father families (376 | 13.0%) represent the smallest median family size with 2.60 persons per family.
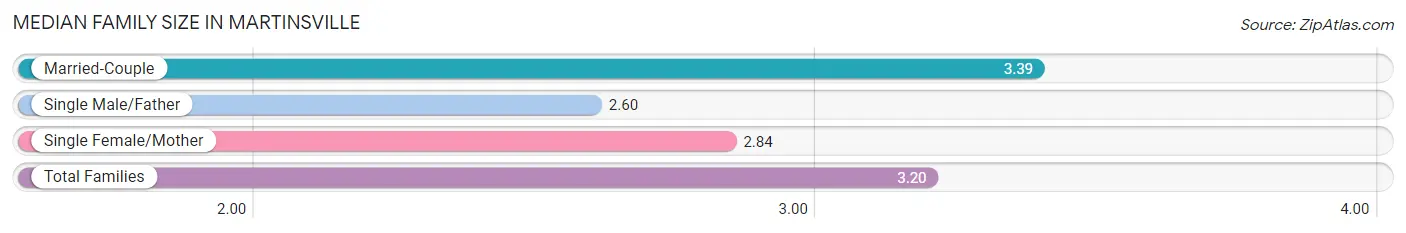
| Family Type | # Families | Family Size |
| Married-Couple | 2,018 (70.0%) | 3.39 |
| Single Male/Father | 376 (13.0%) | 2.60 |
| Single Female/Mother | 491 (17.0%) | 2.84 |
| Total Families | 2,885 (100.0%) | 3.20 |
Median Household Size in Martinsville
The median household size in Martinsville is 2.57 persons per household, with married-couple households (2,018 | 45.5%) accounting for the largest median household size of 3.41 persons per household. non-family households (1,553 | 35.0%) represent the smallest median household size with 1.21 persons per household.
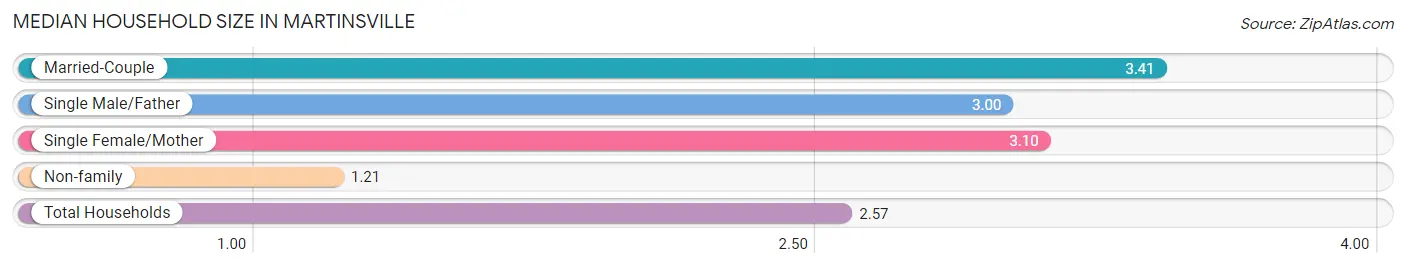
| Household Type | # Households | Household Size |
| Married-Couple | 2,018 (45.5%) | 3.41 |
| Single Male/Father | 376 (8.5%) | 3.00 |
| Single Female/Mother | 491 (11.1%) | 3.10 |
| Non-family | 1,553 (35.0%) | 1.21 |
| Total Households | 4,438 (100.0%) | 2.57 |
Household Size by Marriage Status in Martinsville
Out of a total of 4,438 households in Martinsville, 2,885 (65.0%) are family households, while 1,553 (35.0%) are nonfamily households. The most numerous type of family households are 2-person households, comprising 1,281, and the most common type of nonfamily households are 1-person households, comprising 1,334.
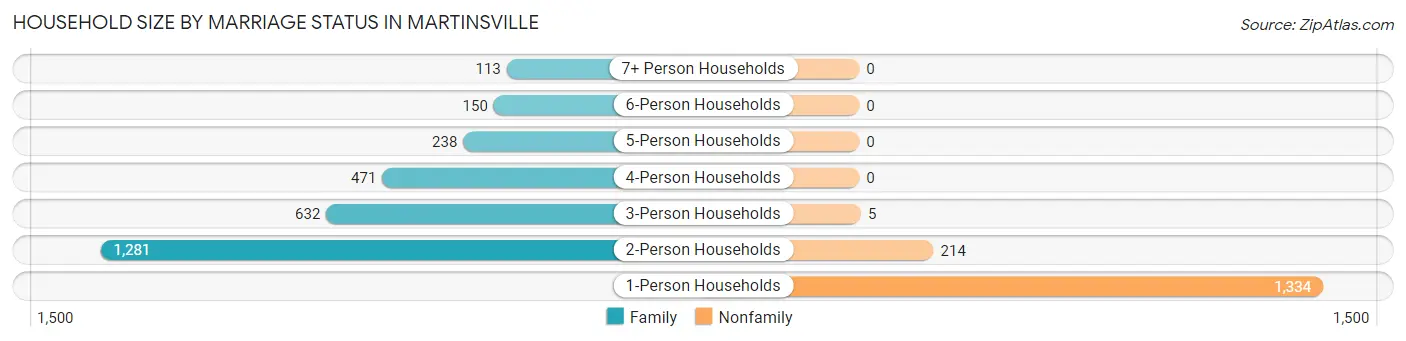
| Household Size | Family Households | Nonfamily Households |
| 1-Person Households | - | 1,334 (30.1%) |
| 2-Person Households | 1,281 (28.9%) | 214 (4.8%) |
| 3-Person Households | 632 (14.2%) | 5 (0.1%) |
| 4-Person Households | 471 (10.6%) | 0 (0.0%) |
| 5-Person Households | 238 (5.4%) | 0 (0.0%) |
| 6-Person Households | 150 (3.4%) | 0 (0.0%) |
| 7+ Person Households | 113 (2.5%) | 0 (0.0%) |
| Total | 2,885 (65.0%) | 1,553 (35.0%) |
Female Fertility in Martinsville
Fertility by Age in Martinsville
Average fertility rate in Martinsville is 41.0 births per 1,000 women. Women in the age bracket of 15 to 19 years have the highest fertility rate with 83.0 births per 1,000 women. Women in the age bracket of 20 to 34 years acount for 63.3% of all women with births.
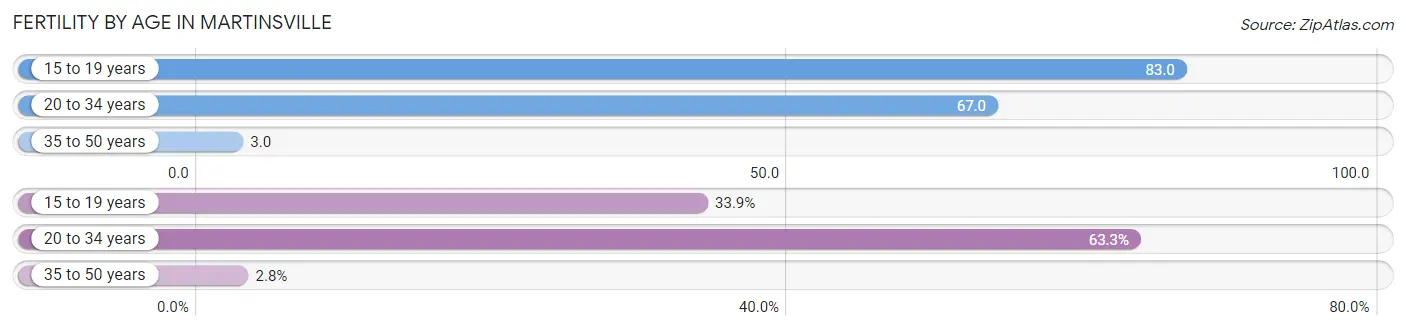
| Age Bracket | Women with Births | Births / 1,000 Women |
| 15 to 19 years | 37 (33.9%) | 83.0 |
| 20 to 34 years | 69 (63.3%) | 67.0 |
| 35 to 50 years | 3 (2.8%) | 3.0 |
| Total | 109 (100.0%) | 41.0 |
Fertility by Age by Marriage Status in Martinsville
44.0% of women with births (109) in Martinsville are married. The highest percentage of unmarried women with births falls into 15 to 19 years age bracket with 100.0% of them unmarried at the time of birth, while the lowest percentage of unmarried women with births belong to 35 to 50 years age bracket with 0.0% of them unmarried.
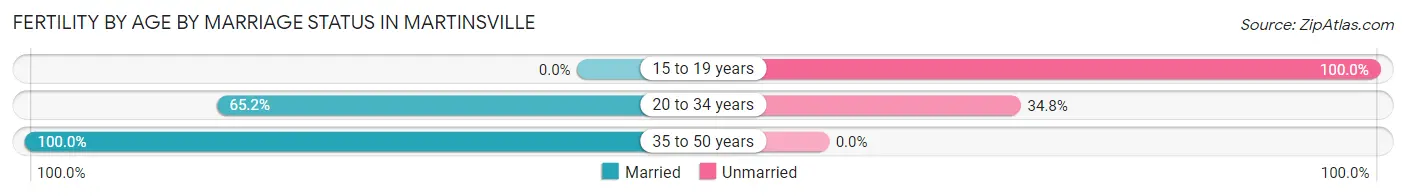
| Age Bracket | Married | Unmarried |
| 15 to 19 years | 0 (0.0%) | 37 (100.0%) |
| 20 to 34 years | 45 (65.2%) | 24 (34.8%) |
| 35 to 50 years | 3 (100.0%) | 0 (0.0%) |
| Total | 48 (44.0%) | 61 (56.0%) |
Fertility by Education in Martinsville
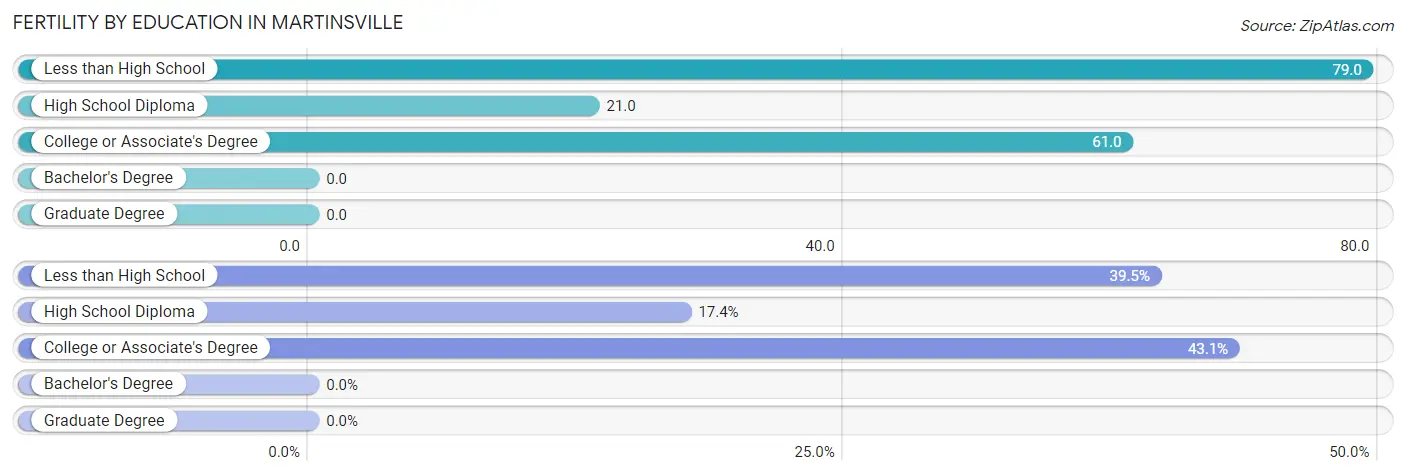
| Educational Attainment | Women with Births | Births / 1,000 Women |
| Less than High School | 43 (39.5%) | 79.0 |
| High School Diploma | 19 (17.4%) | 21.0 |
| College or Associate's Degree | 47 (43.1%) | 61.0 |
| Bachelor's Degree | 0 (0.0%) | 0.0 |
| Graduate Degree | 0 (0.0%) | 0.0 |
| Total | 109 (100.0%) | 41.0 |
Fertility by Education by Marriage Status in Martinsville
56.0% of women with births in Martinsville are unmarried. Women with the educational attainment of college or associate's degree are most likely to be married with 83.0% of them married at childbirth, while women with the educational attainment of less than high school are least likely to be married with 86.1% of them unmarried at childbirth.
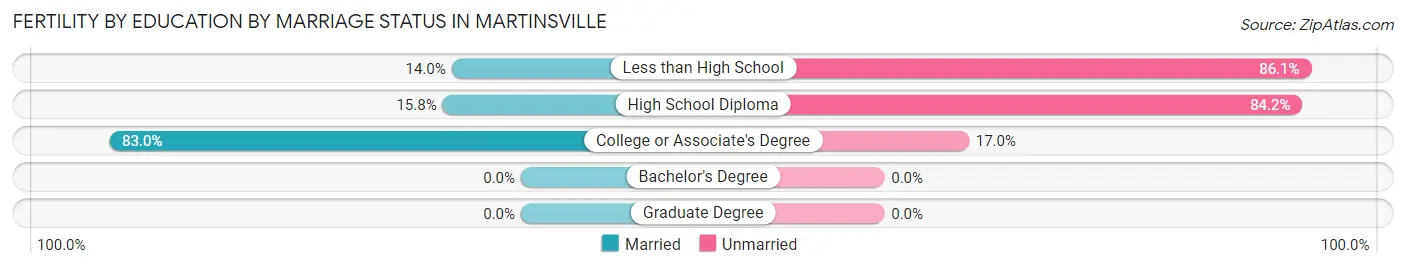
| Educational Attainment | Married | Unmarried |
| Less than High School | 6 (14.0%) | 37 (86.1%) |
| High School Diploma | 3 (15.8%) | 16 (84.2%) |
| College or Associate's Degree | 39 (83.0%) | 8 (17.0%) |
| Bachelor's Degree | 0 (0.0%) | 0 (0.0%) |
| Graduate Degree | 0 (0.0%) | 0 (0.0%) |
| Total | 48 (44.0%) | 61 (56.0%) |
Employment Characteristics in Martinsville
Employment by Class of Employer in Martinsville
Among the 5,432 employed individuals in Martinsville, private company employees (4,286 | 78.9%), local government employees (360 | 6.6%), and not-for-profit organizations (292 | 5.4%) make up the most common classes of employment.
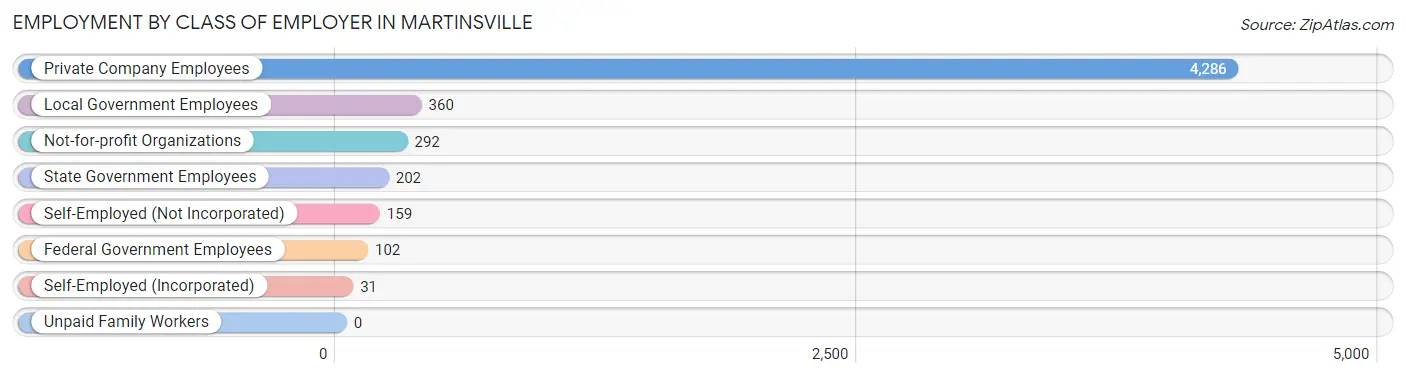
| Employer Class | # Employees | % Employees |
| Private Company Employees | 4,286 | 78.9% |
| Self-Employed (Incorporated) | 31 | 0.6% |
| Self-Employed (Not Incorporated) | 159 | 2.9% |
| Not-for-profit Organizations | 292 | 5.4% |
| Local Government Employees | 360 | 6.6% |
| State Government Employees | 202 | 3.7% |
| Federal Government Employees | 102 | 1.9% |
| Unpaid Family Workers | 0 | 0.0% |
| Total | 5,432 | 100.0% |
Employment Status by Age in Martinsville
According to the labor force statistics for Martinsville, out of the total population over 16 years of age (9,463), 60.5% or 5,725 individuals are in the labor force, with 4.6% or 263 of them unemployed. The age group with the highest labor force participation rate is 30 to 34 years, with 85.2% or 600 individuals in the labor force. Within the labor force, the 65 to 74 years age range has the highest percentage of unemployed individuals, with 22.1% or 31 of them being unemployed.
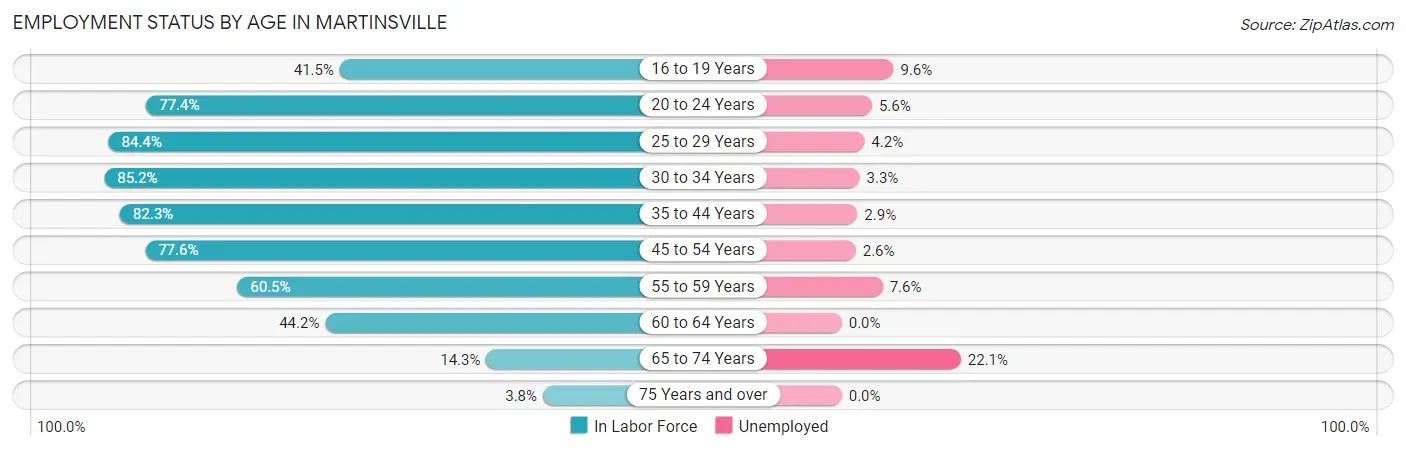
| Age Bracket | In Labor Force | Unemployed |
| 16 to 19 Years | 280 (41.5%) | 27 (9.6%) |
| 20 to 24 Years | 835 (77.4%) | 47 (5.6%) |
| 25 to 29 Years | 730 (84.4%) | 31 (4.2%) |
| 30 to 34 Years | 600 (85.2%) | 20 (3.3%) |
| 35 to 44 Years | 1,304 (82.3%) | 38 (2.9%) |
| 45 to 54 Years | 999 (77.6%) | 26 (2.6%) |
| 55 to 59 Years | 597 (60.5%) | 45 (7.6%) |
| 60 to 64 Years | 205 (44.2%) | 0 (0.0%) |
| 65 to 74 Years | 140 (14.3%) | 31 (22.1%) |
| 75 Years and over | 32 (3.8%) | 0 (0.0%) |
| Total | 5,725 (60.5%) | 263 (4.6%) |
Employment Status by Educational Attainment in Martinsville
According to labor force statistics for Martinsville, 75.3% of individuals (4,437) out of the total population between 25 and 64 years of age (5,893) are in the labor force, with 3.6% or 160 of them being unemployed. The group with the highest labor force participation rate are those with the educational attainment of bachelor's degree or higher, with 86.5% or 703 individuals in the labor force. Within the labor force, individuals with high school diploma education have the highest percentage of unemployment, with 5.9% or 106 of them being unemployed.
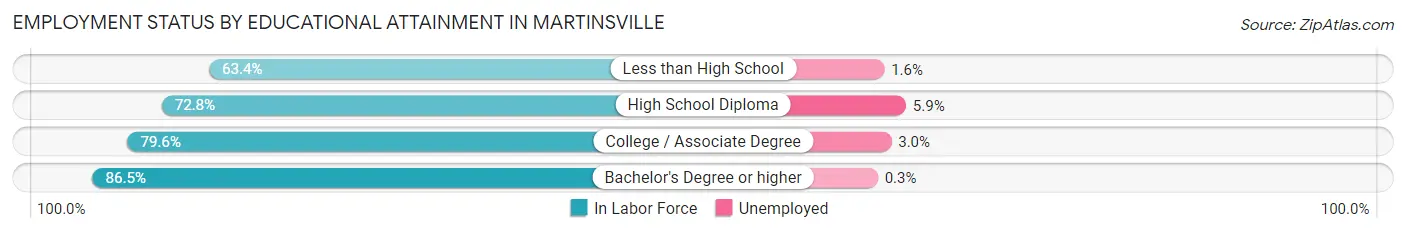
| Educational Attainment | In Labor Force | Unemployed |
| Less than High School | 561 (63.4%) | 14 (1.6%) |
| High School Diploma | 1,795 (72.8%) | 145 (5.9%) |
| College / Associate Degree | 1,376 (79.6%) | 52 (3.0%) |
| Bachelor's Degree or higher | 703 (86.5%) | 2 (0.3%) |
| Total | 4,437 (75.3%) | 212 (3.6%) |
Employment Occupations by Sex in Martinsville
Management, Business, Science and Arts Occupations
The most common Management, Business, Science and Arts occupations in Martinsville are Health Diagnosing & Treating (376 | 6.9%), Community & Social Service (327 | 6.0%), Management (254 | 4.7%), Computers, Engineering & Science (252 | 4.6%), and Business & Financial (233 | 4.3%).
Management, Business, Science and Arts Occupations by Sex
Within the Management, Business, Science and Arts occupations in Martinsville, the most male-oriented occupations are Architecture & Engineering (100.0%), Life, Physical & Social Science (100.0%), and Legal Services & Support (100.0%), while the most female-oriented occupations are Education Instruction & Library (83.8%), Health Technologists (80.6%), and Arts, Media & Entertainment (77.2%).
| Occupation | Male | Female |
| Management | 142 (55.9%) | 112 (44.1%) |
| Business & Financial | 107 (45.9%) | 126 (54.1%) |
| Computers, Engineering & Science | 216 (85.7%) | 36 (14.3%) |
| Computers & Mathematics | 29 (44.6%) | 36 (55.4%) |
| Architecture & Engineering | 176 (100.0%) | 0 (0.0%) |
| Life, Physical & Social Science | 11 (100.0%) | 0 (0.0%) |
| Community & Social Service | 150 (45.9%) | 177 (54.1%) |
| Education, Arts & Media | 38 (57.6%) | 28 (42.4%) |
| Legal Services & Support | 77 (100.0%) | 0 (0.0%) |
| Education Instruction & Library | 17 (16.2%) | 88 (83.8%) |
| Arts, Media & Entertainment | 18 (22.8%) | 61 (77.2%) |
| Health Diagnosing & Treating | 94 (25.0%) | 282 (75.0%) |
| Health Technologists | 38 (19.4%) | 158 (80.6%) |
| Total (Category) | 709 (49.2%) | 733 (50.8%) |
| Total (Overall) | 3,097 (57.1%) | 2,323 (42.9%) |
Services Occupations
The most common Services occupations in Martinsville are Food Preparation & Serving (350 | 6.5%), Cleaning & Maintenance (297 | 5.5%), Security & Protection (211 | 3.9%), Law Enforcement (155 | 2.9%), and Healthcare Support (138 | 2.5%).
Services Occupations by Sex
Within the Services occupations in Martinsville, the most male-oriented occupations are Firefighting & Prevention (91.1%), Security & Protection (85.3%), and Law Enforcement (83.2%), while the most female-oriented occupations are Healthcare Support (100.0%), Food Preparation & Serving (81.7%), and Cleaning & Maintenance (25.9%).
| Occupation | Male | Female |
| Healthcare Support | 0 (0.0%) | 138 (100.0%) |
| Security & Protection | 180 (85.3%) | 31 (14.7%) |
| Firefighting & Prevention | 51 (91.1%) | 5 (8.9%) |
| Law Enforcement | 129 (83.2%) | 26 (16.8%) |
| Food Preparation & Serving | 64 (18.3%) | 286 (81.7%) |
| Cleaning & Maintenance | 220 (74.1%) | 77 (25.9%) |
| Personal Care & Service | 0 (0.0%) | 0 (0.0%) |
| Total (Category) | 464 (46.6%) | 532 (53.4%) |
| Total (Overall) | 3,097 (57.1%) | 2,323 (42.9%) |
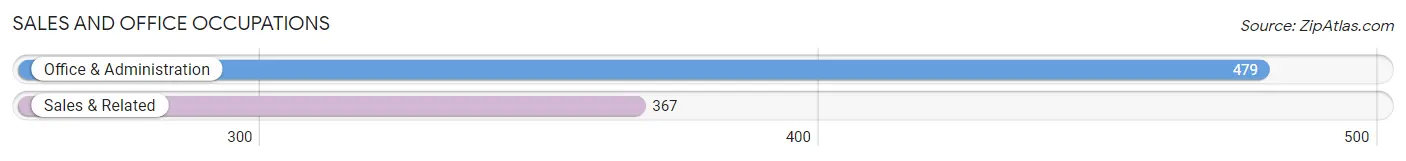
Sales and Office Occupations
The most common Sales and Office occupations in Martinsville are Office & Administration (479 | 8.8%), and Sales & Related (367 | 6.8%).
Sales and Office Occupations by Sex
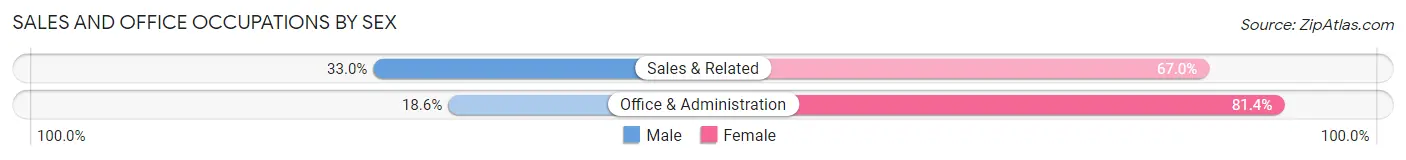
| Occupation | Male | Female |
| Sales & Related | 121 (33.0%) | 246 (67.0%) |
| Office & Administration | 89 (18.6%) | 390 (81.4%) |
| Total (Category) | 210 (24.8%) | 636 (75.2%) |
| Total (Overall) | 3,097 (57.1%) | 2,323 (42.9%) |
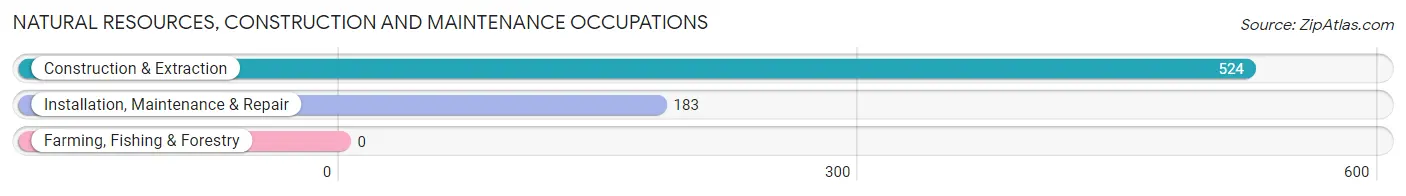
Natural Resources, Construction and Maintenance Occupations
The most common Natural Resources, Construction and Maintenance occupations in Martinsville are Construction & Extraction (524 | 9.7%), and Installation, Maintenance & Repair (183 | 3.4%).
Natural Resources, Construction and Maintenance Occupations by Sex
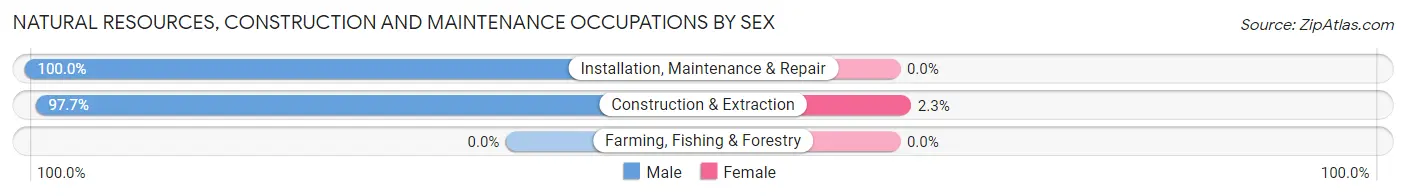
| Occupation | Male | Female |
| Farming, Fishing & Forestry | 0 (0.0%) | 0 (0.0%) |
| Construction & Extraction | 512 (97.7%) | 12 (2.3%) |
| Installation, Maintenance & Repair | 183 (100.0%) | 0 (0.0%) |
| Total (Category) | 695 (98.3%) | 12 (1.7%) |
| Total (Overall) | 3,097 (57.1%) | 2,323 (42.9%) |
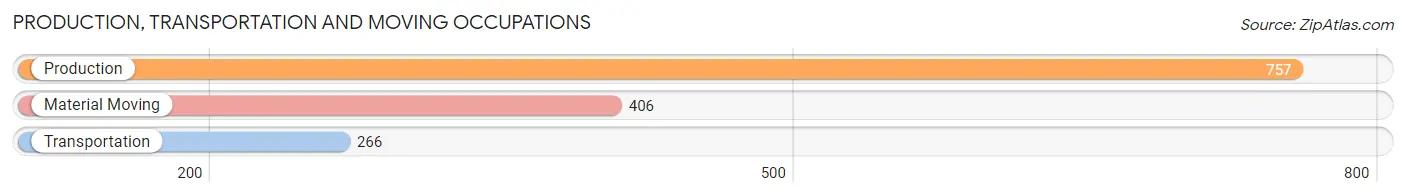
Production, Transportation and Moving Occupations
The most common Production, Transportation and Moving occupations in Martinsville are Production (757 | 14.0%), Material Moving (406 | 7.5%), and Transportation (266 | 4.9%).
Production, Transportation and Moving Occupations by Sex
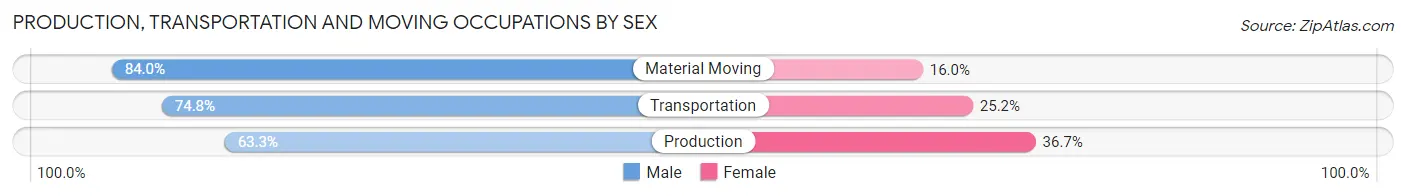
| Occupation | Male | Female |
| Production | 479 (63.3%) | 278 (36.7%) |
| Transportation | 199 (74.8%) | 67 (25.2%) |
| Material Moving | 341 (84.0%) | 65 (16.0%) |
| Total (Category) | 1,019 (71.3%) | 410 (28.7%) |
| Total (Overall) | 3,097 (57.1%) | 2,323 (42.9%) |
Employment Industries by Sex in Martinsville
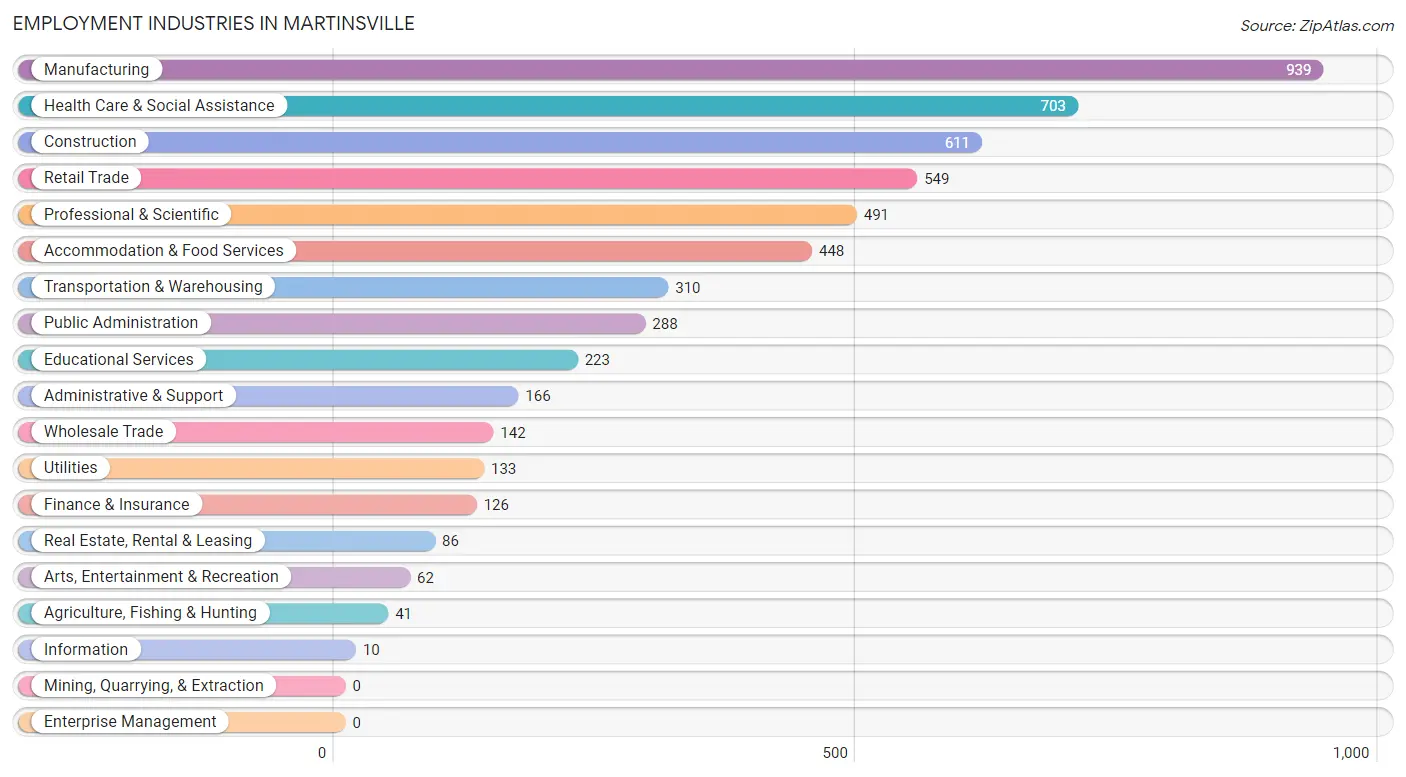
Employment Industries in Martinsville
The major employment industries in Martinsville include Manufacturing (939 | 17.3%), Health Care & Social Assistance (703 | 13.0%), Construction (611 | 11.3%), Retail Trade (549 | 10.1%), and Professional & Scientific (491 | 9.1%).
Employment Industries by Sex in Martinsville
The Martinsville industries that see more men than women are Agriculture, Fishing & Hunting (100.0%), Administrative & Support (100.0%), and Construction (96.2%), whereas the industries that tend to have a higher number of women are Information (100.0%), Arts, Entertainment & Recreation (100.0%), and Health Care & Social Assistance (88.2%).
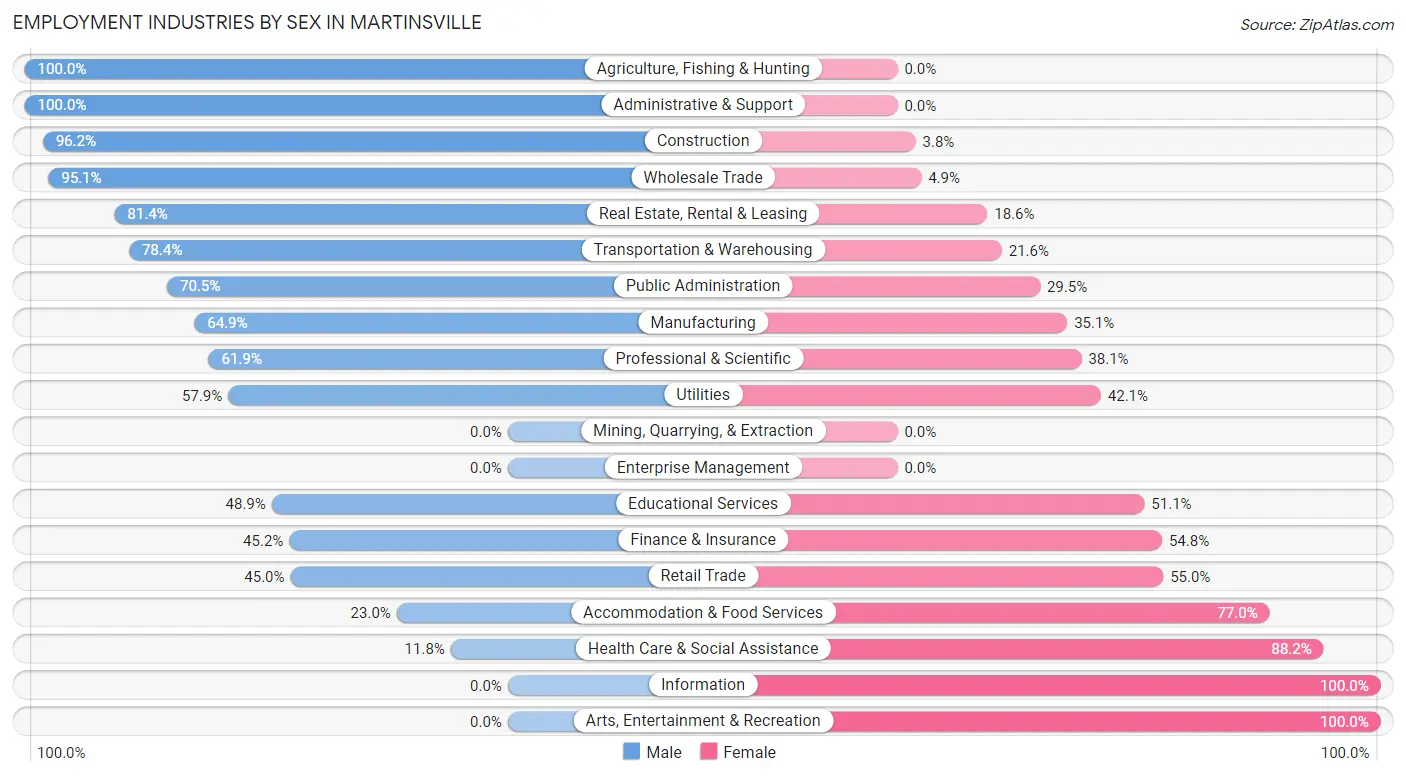
| Industry | Male | Female |
| Agriculture, Fishing & Hunting | 41 (100.0%) | 0 (0.0%) |
| Mining, Quarrying, & Extraction | 0 (0.0%) | 0 (0.0%) |
| Construction | 588 (96.2%) | 23 (3.8%) |
| Manufacturing | 609 (64.9%) | 330 (35.1%) |
| Wholesale Trade | 135 (95.1%) | 7 (4.9%) |
| Retail Trade | 247 (45.0%) | 302 (55.0%) |
| Transportation & Warehousing | 243 (78.4%) | 67 (21.6%) |
| Utilities | 77 (57.9%) | 56 (42.1%) |
| Information | 0 (0.0%) | 10 (100.0%) |
| Finance & Insurance | 57 (45.2%) | 69 (54.8%) |
| Real Estate, Rental & Leasing | 70 (81.4%) | 16 (18.6%) |
| Professional & Scientific | 304 (61.9%) | 187 (38.1%) |
| Enterprise Management | 0 (0.0%) | 0 (0.0%) |
| Administrative & Support | 166 (100.0%) | 0 (0.0%) |
| Educational Services | 109 (48.9%) | 114 (51.1%) |
| Health Care & Social Assistance | 83 (11.8%) | 620 (88.2%) |
| Arts, Entertainment & Recreation | 0 (0.0%) | 62 (100.0%) |
| Accommodation & Food Services | 103 (23.0%) | 345 (77.0%) |
| Public Administration | 203 (70.5%) | 85 (29.5%) |
| Total | 3,097 (57.1%) | 2,323 (42.9%) |
Education in Martinsville
School Enrollment in Martinsville
The most common levels of schooling among the 2,675 students in Martinsville are elementary school (770 | 28.8%), middle school (585 | 21.9%), and college / undergraduate (566 | 21.2%).
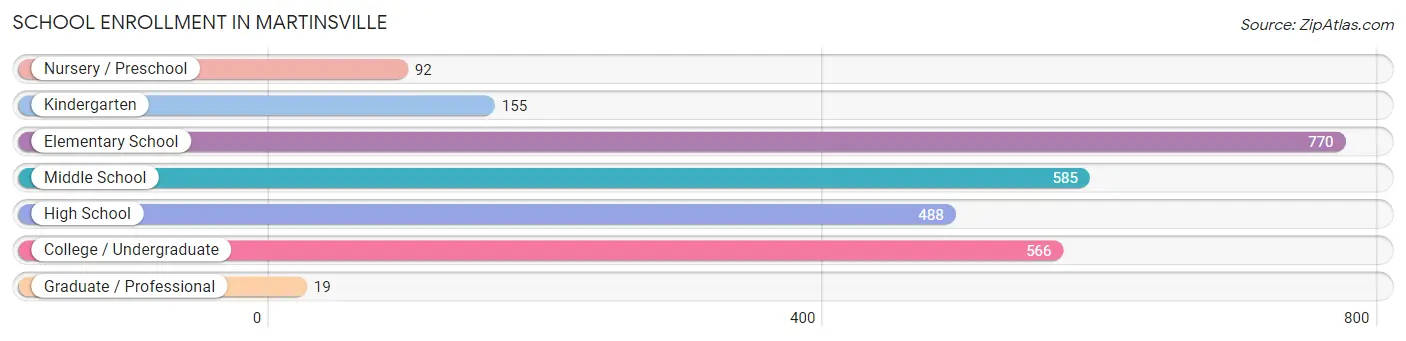
| School Level | # Students | % Students |
| Nursery / Preschool | 92 | 3.4% |
| Kindergarten | 155 | 5.8% |
| Elementary School | 770 | 28.8% |
| Middle School | 585 | 21.9% |
| High School | 488 | 18.2% |
| College / Undergraduate | 566 | 21.2% |
| Graduate / Professional | 19 | 0.7% |
| Total | 2,675 | 100.0% |
School Enrollment by Age by Funding Source in Martinsville
Out of a total of 2,675 students who are enrolled in schools in Martinsville, 286 (10.7%) attend a private institution, while the remaining 2,389 (89.3%) are enrolled in public schools. The age group of 25 to 34 year olds has the highest likelihood of being enrolled in private schools, with 22 (20.7% in the age bracket) enrolled. Conversely, the age group of 3 to 4 year olds has the lowest likelihood of being enrolled in a private school, with 36 (100.0% in the age bracket) attending a public institution.
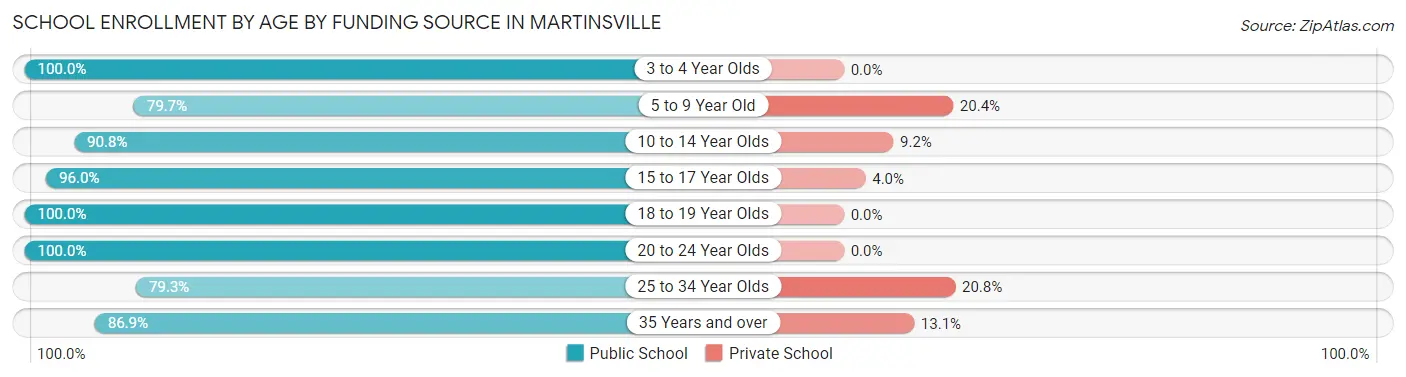
| Age Bracket | Public School | Private School |
| 3 to 4 Year Olds | 36 (100.0%) | 0 (0.0%) |
| 5 to 9 Year Old | 599 (79.6%) | 153 (20.3%) |
| 10 to 14 Year Olds | 759 (90.8%) | 77 (9.2%) |
| 15 to 17 Year Olds | 430 (96.0%) | 18 (4.0%) |
| 18 to 19 Year Olds | 78 (100.0%) | 0 (0.0%) |
| 20 to 24 Year Olds | 289 (100.0%) | 0 (0.0%) |
| 25 to 34 Year Olds | 84 (79.2%) | 22 (20.7%) |
| 35 Years and over | 113 (86.9%) | 17 (13.1%) |
| Total | 2,389 (89.3%) | 286 (10.7%) |
Educational Attainment by Field of Study in Martinsville
Business (234 | 22.7%), liberal arts & history (168 | 16.3%), education (163 | 15.8%), arts & humanities (125 | 12.1%), and psychology (79 | 7.7%) are the most common fields of study among 1,032 individuals in Martinsville who have obtained a bachelor's degree or higher.
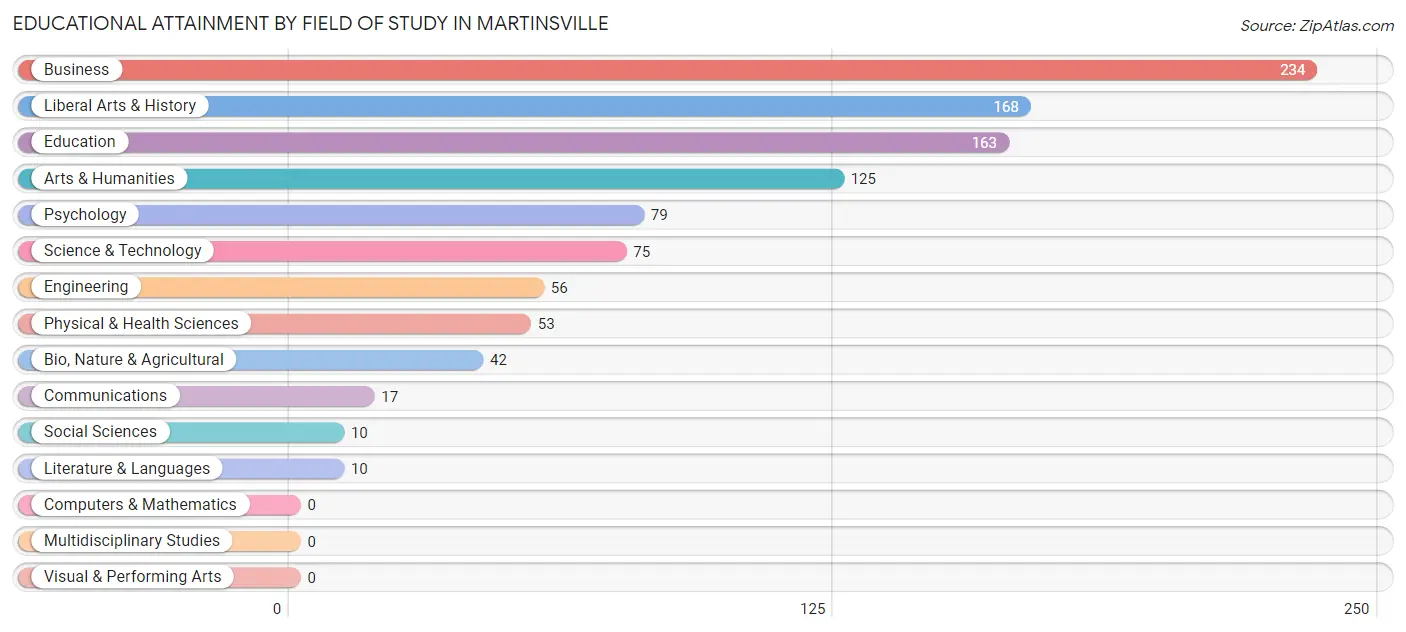
| Field of Study | # Graduates | % Graduates |
| Computers & Mathematics | 0 | 0.0% |
| Bio, Nature & Agricultural | 42 | 4.1% |
| Physical & Health Sciences | 53 | 5.1% |
| Psychology | 79 | 7.7% |
| Social Sciences | 10 | 1.0% |
| Engineering | 56 | 5.4% |
| Multidisciplinary Studies | 0 | 0.0% |
| Science & Technology | 75 | 7.3% |
| Business | 234 | 22.7% |
| Education | 163 | 15.8% |
| Literature & Languages | 10 | 1.0% |
| Liberal Arts & History | 168 | 16.3% |
| Visual & Performing Arts | 0 | 0.0% |
| Communications | 17 | 1.7% |
| Arts & Humanities | 125 | 12.1% |
| Total | 1,032 | 100.0% |
Transportation & Commute in Martinsville
Vehicle Availability by Sex in Martinsville
The most prevalent vehicle ownership categories in Martinsville are males with 2 vehicles (1,203, accounting for 38.8%) and females with 2 vehicles (946, making up 52.1%).
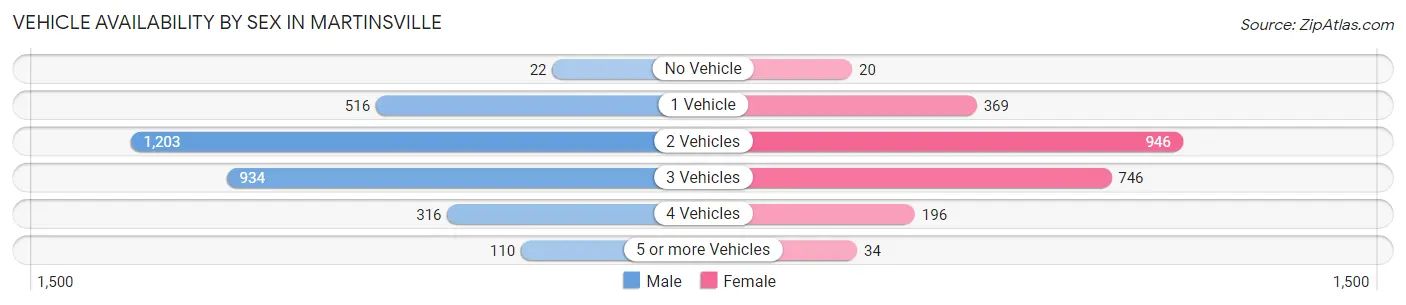
| Vehicles Available | Male | Female |
| No Vehicle | 22 (0.7%) | 20 (0.9%) |
| 1 Vehicle | 516 (16.6%) | 369 (16.0%) |
| 2 Vehicles | 1,203 (38.8%) | 946 (40.9%) |
| 3 Vehicles | 934 (30.1%) | 746 (32.3%) |
| 4 Vehicles | 316 (10.2%) | 196 (8.5%) |
| 5 or more Vehicles | 110 (3.5%) | 34 (1.5%) |
| Total | 3,101 (100.0%) | 2,311 (100.0%) |
Commute Time in Martinsville
The most frequently occuring commute durations in Martinsville are 30 to 34 minutes (673 commuters, 13.3%), 10 to 14 minutes (639 commuters, 12.7%), and 45 to 59 minutes (566 commuters, 11.2%).
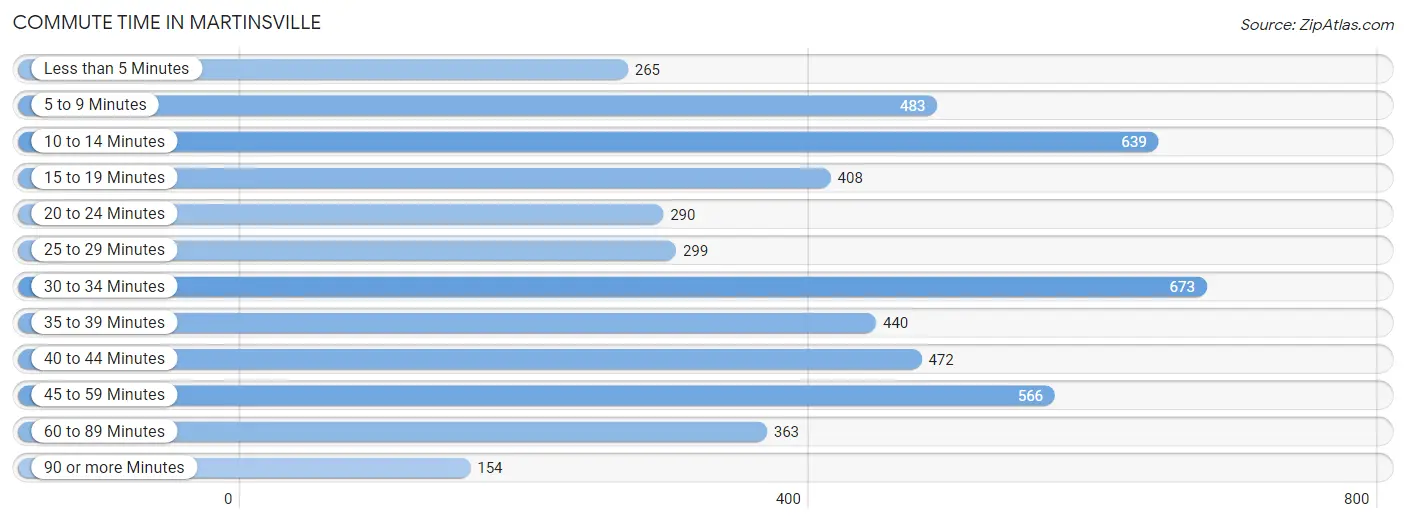
| Commute Time | # Commuters | % Commuters |
| Less than 5 Minutes | 265 | 5.2% |
| 5 to 9 Minutes | 483 | 9.6% |
| 10 to 14 Minutes | 639 | 12.7% |
| 15 to 19 Minutes | 408 | 8.1% |
| 20 to 24 Minutes | 290 | 5.7% |
| 25 to 29 Minutes | 299 | 5.9% |
| 30 to 34 Minutes | 673 | 13.3% |
| 35 to 39 Minutes | 440 | 8.7% |
| 40 to 44 Minutes | 472 | 9.3% |
| 45 to 59 Minutes | 566 | 11.2% |
| 60 to 89 Minutes | 363 | 7.2% |
| 90 or more Minutes | 154 | 3.0% |
Commute Time by Sex in Martinsville
The most common commute times in Martinsville are 45 to 59 minutes (508 commuters, 17.1%) for males and 30 to 34 minutes (450 commuters, 21.7%) for females.
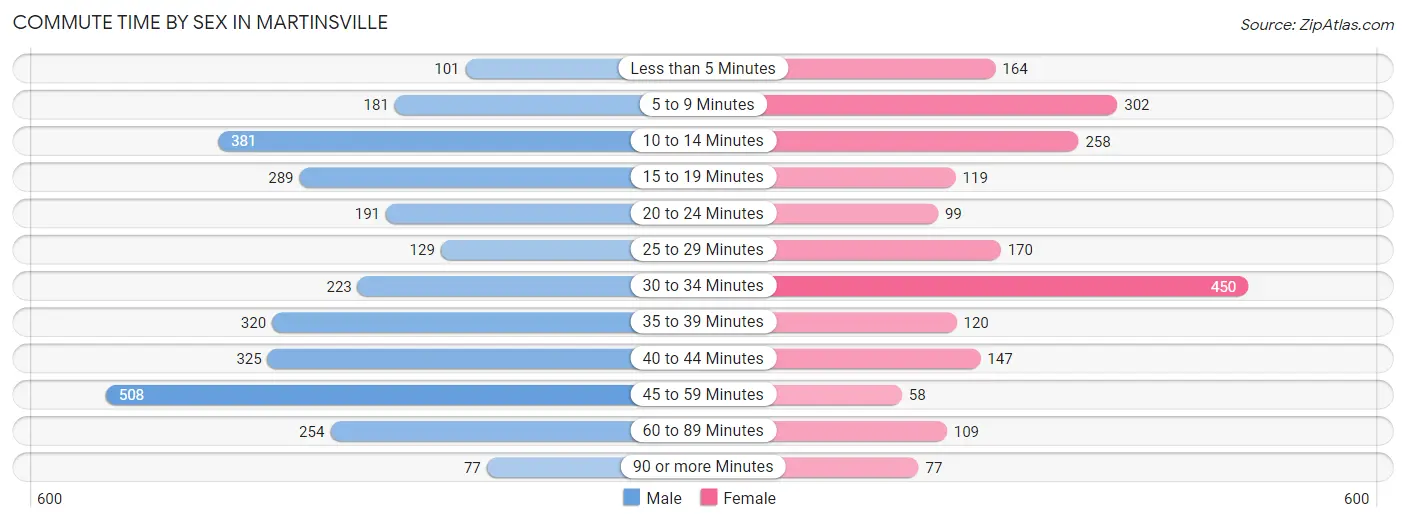
| Commute Time | Male | Female |
| Less than 5 Minutes | 101 (3.4%) | 164 (7.9%) |
| 5 to 9 Minutes | 181 (6.1%) | 302 (14.6%) |
| 10 to 14 Minutes | 381 (12.8%) | 258 (12.4%) |
| 15 to 19 Minutes | 289 (9.7%) | 119 (5.7%) |
| 20 to 24 Minutes | 191 (6.4%) | 99 (4.8%) |
| 25 to 29 Minutes | 129 (4.3%) | 170 (8.2%) |
| 30 to 34 Minutes | 223 (7.5%) | 450 (21.7%) |
| 35 to 39 Minutes | 320 (10.7%) | 120 (5.8%) |
| 40 to 44 Minutes | 325 (10.9%) | 147 (7.1%) |
| 45 to 59 Minutes | 508 (17.1%) | 58 (2.8%) |
| 60 to 89 Minutes | 254 (8.5%) | 109 (5.3%) |
| 90 or more Minutes | 77 (2.6%) | 77 (3.7%) |
Time of Departure to Work by Sex in Martinsville
The most frequent times of departure to work in Martinsville are 5:00 AM to 5:29 AM (417, 14.0%) for males and 7:30 AM to 7:59 AM (262, 12.6%) for females.
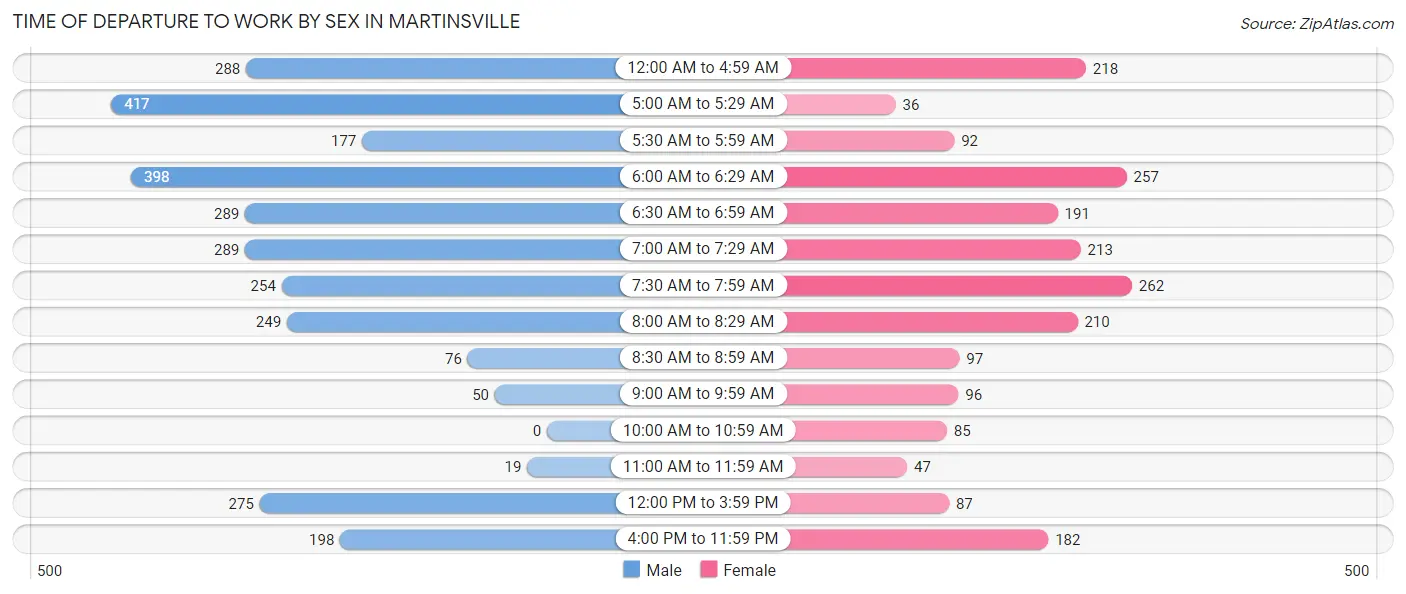
| Time of Departure | Male | Female |
| 12:00 AM to 4:59 AM | 288 (9.7%) | 218 (10.5%) |
| 5:00 AM to 5:29 AM | 417 (14.0%) | 36 (1.7%) |
| 5:30 AM to 5:59 AM | 177 (5.9%) | 92 (4.4%) |
| 6:00 AM to 6:29 AM | 398 (13.4%) | 257 (12.4%) |
| 6:30 AM to 6:59 AM | 289 (9.7%) | 191 (9.2%) |
| 7:00 AM to 7:29 AM | 289 (9.7%) | 213 (10.3%) |
| 7:30 AM to 7:59 AM | 254 (8.5%) | 262 (12.6%) |
| 8:00 AM to 8:29 AM | 249 (8.4%) | 210 (10.1%) |
| 8:30 AM to 8:59 AM | 76 (2.5%) | 97 (4.7%) |
| 9:00 AM to 9:59 AM | 50 (1.7%) | 96 (4.6%) |
| 10:00 AM to 10:59 AM | 0 (0.0%) | 85 (4.1%) |
| 11:00 AM to 11:59 AM | 19 (0.6%) | 47 (2.3%) |
| 12:00 PM to 3:59 PM | 275 (9.2%) | 87 (4.2%) |
| 4:00 PM to 11:59 PM | 198 (6.7%) | 182 (8.8%) |
| Total | 2,979 (100.0%) | 2,073 (100.0%) |
Housing Occupancy in Martinsville
Occupancy by Ownership in Martinsville
Of the total 4,438 dwellings in Martinsville, owner-occupied units account for 2,831 (63.8%), while renter-occupied units make up 1,607 (36.2%).
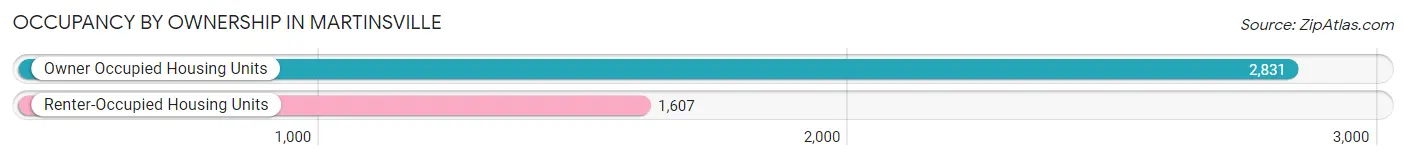
| Occupancy | # Housing Units | % Housing Units |
| Owner Occupied Housing Units | 2,831 | 63.8% |
| Renter-Occupied Housing Units | 1,607 | 36.2% |
| Total Occupied Housing Units | 4,438 | 100.0% |
Occupancy by Household Size in Martinsville
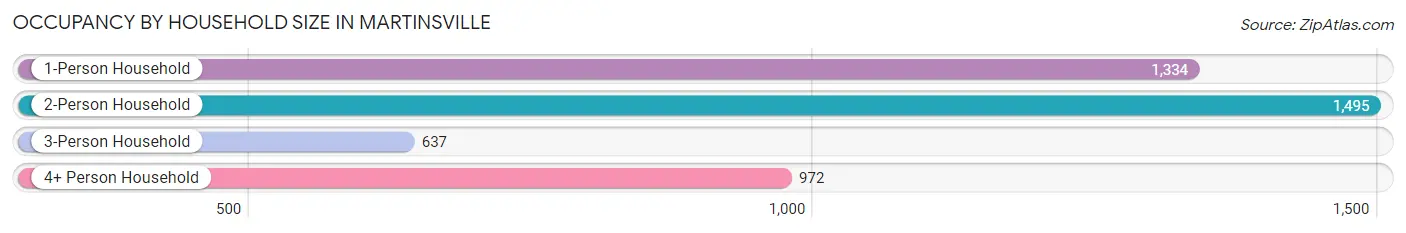
| Household Size | # Housing Units | % Housing Units |
| 1-Person Household | 1,334 | 30.1% |
| 2-Person Household | 1,495 | 33.7% |
| 3-Person Household | 637 | 14.3% |
| 4+ Person Household | 972 | 21.9% |
| Total Housing Units | 4,438 | 100.0% |
Occupancy by Ownership by Household Size in Martinsville
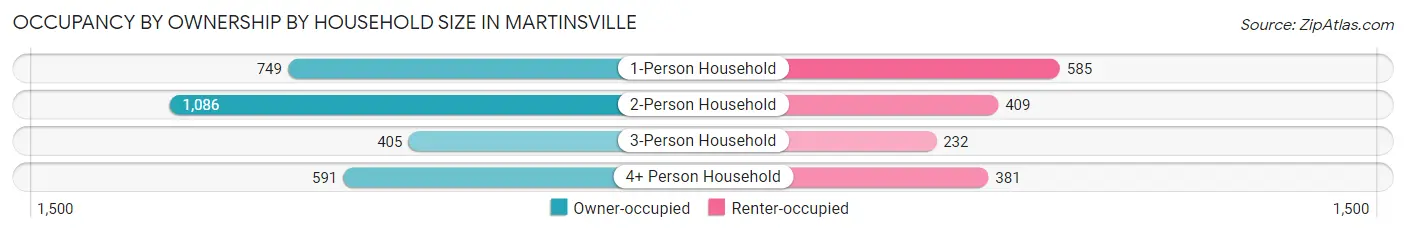
| Household Size | Owner-occupied | Renter-occupied |
| 1-Person Household | 749 (56.1%) | 585 (43.9%) |
| 2-Person Household | 1,086 (72.6%) | 409 (27.4%) |
| 3-Person Household | 405 (63.6%) | 232 (36.4%) |
| 4+ Person Household | 591 (60.8%) | 381 (39.2%) |
| Total Housing Units | 2,831 (63.8%) | 1,607 (36.2%) |
Occupancy by Educational Attainment in Martinsville
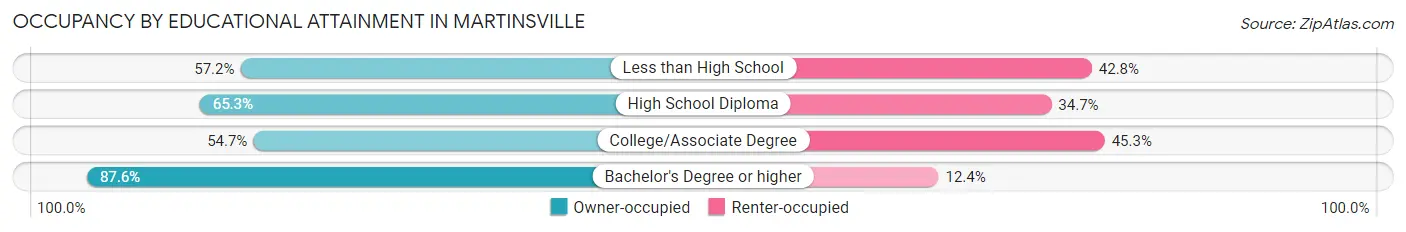
| Household Size | Owner-occupied | Renter-occupied |
| Less than High School | 423 (57.2%) | 316 (42.8%) |
| High School Diploma | 1,210 (65.3%) | 644 (34.7%) |
| College/Associate Degree | 695 (54.7%) | 576 (45.3%) |
| Bachelor's Degree or higher | 503 (87.6%) | 71 (12.4%) |
Occupancy by Age of Householder in Martinsville
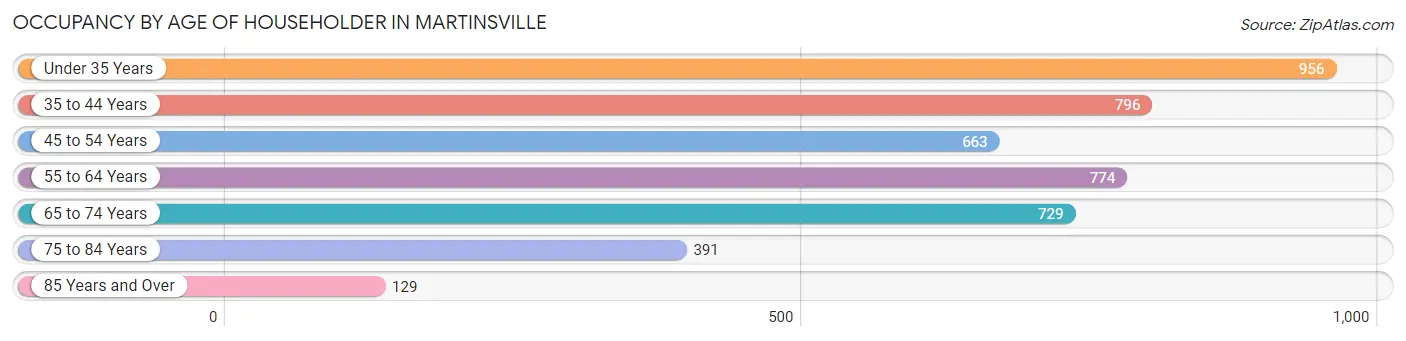
| Age Bracket | # Households | % Households |
| Under 35 Years | 956 | 21.5% |
| 35 to 44 Years | 796 | 17.9% |
| 45 to 54 Years | 663 | 14.9% |
| 55 to 64 Years | 774 | 17.4% |
| 65 to 74 Years | 729 | 16.4% |
| 75 to 84 Years | 391 | 8.8% |
| 85 Years and Over | 129 | 2.9% |
| Total | 4,438 | 100.0% |
Housing Finances in Martinsville
Median Income by Occupancy in Martinsville
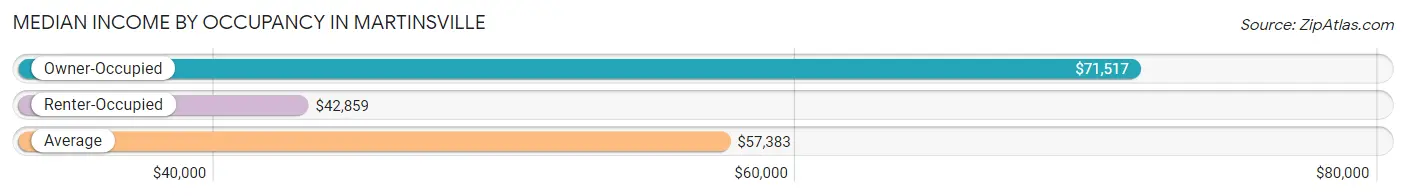
| Occupancy Type | # Households | Median Income |
| Owner-Occupied | 2,831 (63.8%) | $71,517 |
| Renter-Occupied | 1,607 (36.2%) | $42,859 |
| Average | 4,438 (100.0%) | $57,383 |
Occupancy by Householder Income Bracket in Martinsville
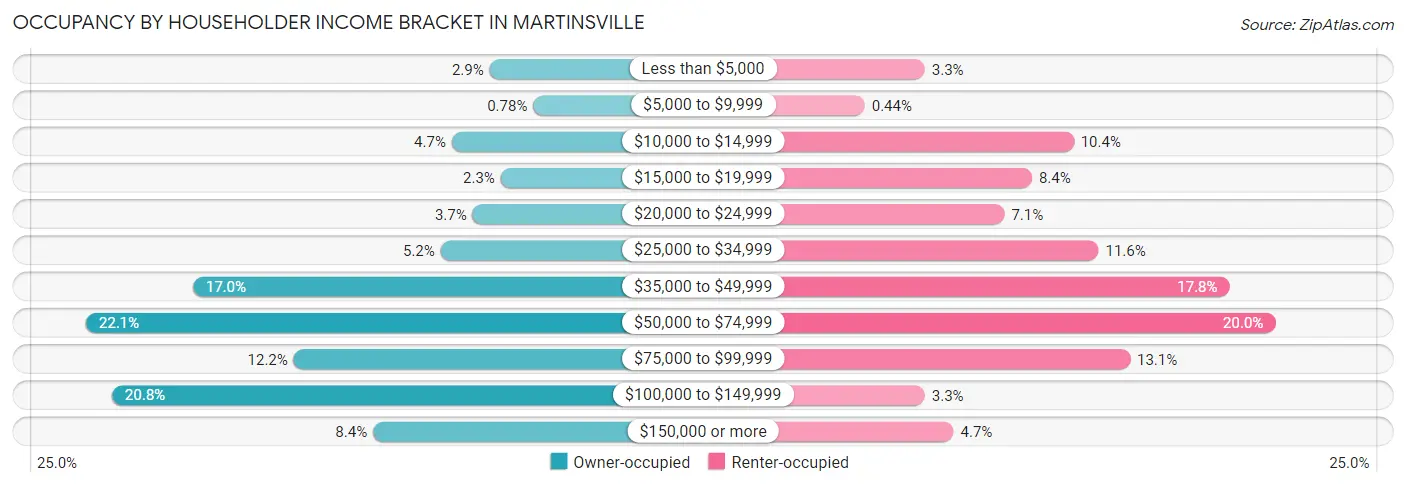
| Income Bracket | Owner-occupied | Renter-occupied |
| Less than $5,000 | 81 (2.9%) | 53 (3.3%) |
| $5,000 to $9,999 | 22 (0.8%) | 7 (0.4%) |
| $10,000 to $14,999 | 132 (4.7%) | 167 (10.4%) |
| $15,000 to $19,999 | 66 (2.3%) | 135 (8.4%) |
| $20,000 to $24,999 | 104 (3.7%) | 114 (7.1%) |
| $25,000 to $34,999 | 147 (5.2%) | 186 (11.6%) |
| $35,000 to $49,999 | 481 (17.0%) | 286 (17.8%) |
| $50,000 to $74,999 | 625 (22.1%) | 321 (20.0%) |
| $75,000 to $99,999 | 345 (12.2%) | 210 (13.1%) |
| $100,000 to $149,999 | 590 (20.8%) | 53 (3.3%) |
| $150,000 or more | 238 (8.4%) | 75 (4.7%) |
| Total | 2,831 (100.0%) | 1,607 (100.0%) |
Monthly Housing Cost Tiers in Martinsville
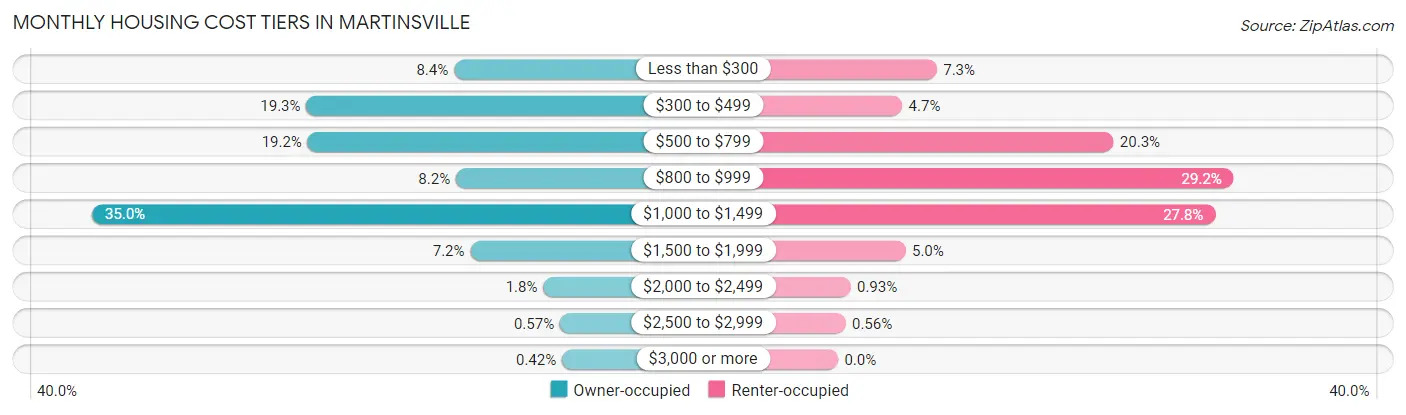
| Monthly Cost | Owner-occupied | Renter-occupied |
| Less than $300 | 237 (8.4%) | 117 (7.3%) |
| $300 to $499 | 545 (19.3%) | 76 (4.7%) |
| $500 to $799 | 542 (19.2%) | 326 (20.3%) |
| $800 to $999 | 233 (8.2%) | 469 (29.2%) |
| $1,000 to $1,499 | 992 (35.0%) | 447 (27.8%) |
| $1,500 to $1,999 | 203 (7.2%) | 80 (5.0%) |
| $2,000 to $2,499 | 51 (1.8%) | 15 (0.9%) |
| $2,500 to $2,999 | 16 (0.6%) | 9 (0.6%) |
| $3,000 or more | 12 (0.4%) | 0 (0.0%) |
| Total | 2,831 (100.0%) | 1,607 (100.0%) |
Physical Housing Characteristics in Martinsville
Housing Structures in Martinsville
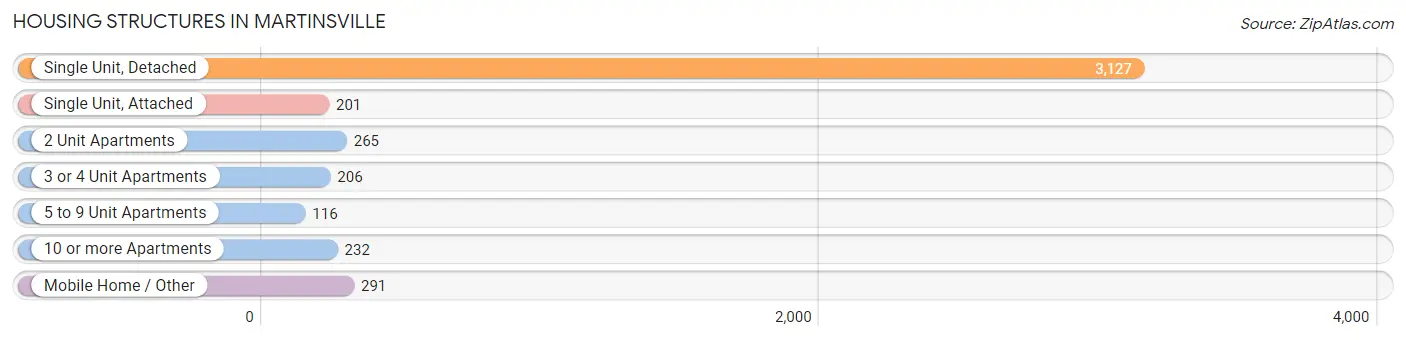
| Structure Type | # Housing Units | % Housing Units |
| Single Unit, Detached | 3,127 | 70.5% |
| Single Unit, Attached | 201 | 4.5% |
| 2 Unit Apartments | 265 | 6.0% |
| 3 or 4 Unit Apartments | 206 | 4.6% |
| 5 to 9 Unit Apartments | 116 | 2.6% |
| 10 or more Apartments | 232 | 5.2% |
| Mobile Home / Other | 291 | 6.6% |
| Total | 4,438 | 100.0% |
Housing Structures by Occupancy in Martinsville
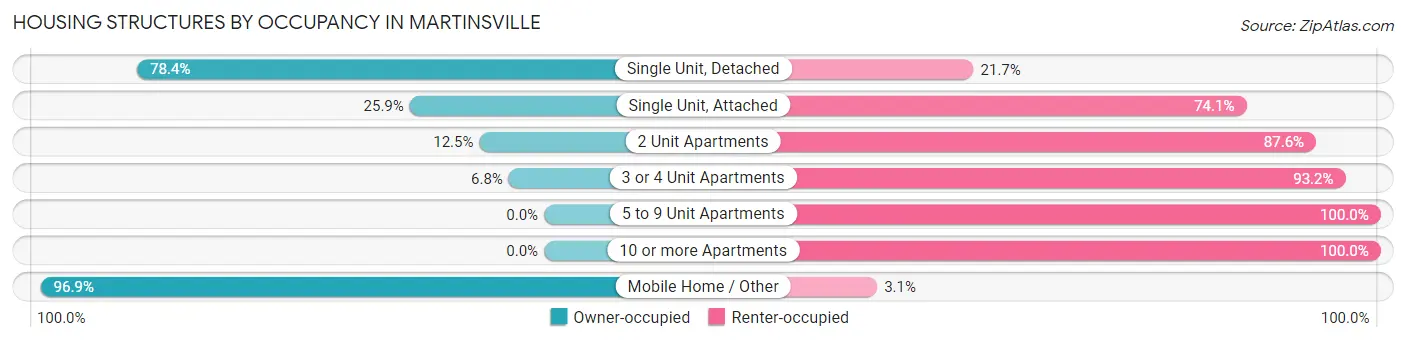
| Structure Type | Owner-occupied | Renter-occupied |
| Single Unit, Detached | 2,450 (78.3%) | 677 (21.6%) |
| Single Unit, Attached | 52 (25.9%) | 149 (74.1%) |
| 2 Unit Apartments | 33 (12.4%) | 232 (87.5%) |
| 3 or 4 Unit Apartments | 14 (6.8%) | 192 (93.2%) |
| 5 to 9 Unit Apartments | 0 (0.0%) | 116 (100.0%) |
| 10 or more Apartments | 0 (0.0%) | 232 (100.0%) |
| Mobile Home / Other | 282 (96.9%) | 9 (3.1%) |
| Total | 2,831 (63.8%) | 1,607 (36.2%) |
Housing Structures by Number of Rooms in Martinsville
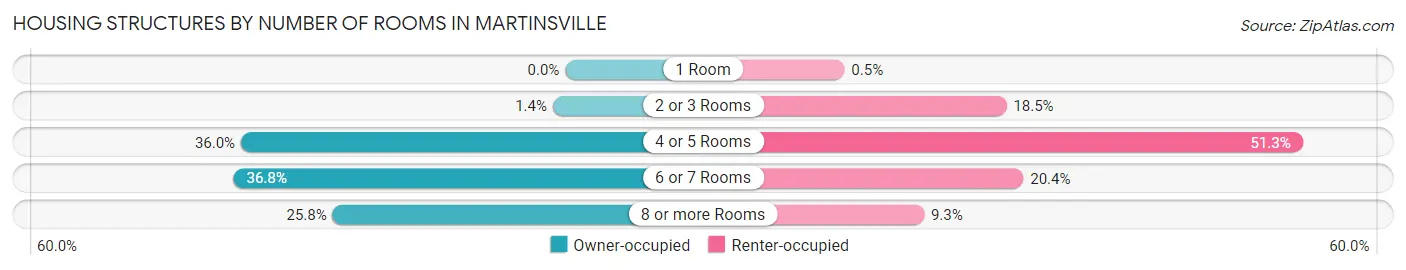
| Number of Rooms | Owner-occupied | Renter-occupied |
| 1 Room | 0 (0.0%) | 8 (0.5%) |
| 2 or 3 Rooms | 39 (1.4%) | 297 (18.5%) |
| 4 or 5 Rooms | 1,019 (36.0%) | 825 (51.3%) |
| 6 or 7 Rooms | 1,042 (36.8%) | 327 (20.3%) |
| 8 or more Rooms | 731 (25.8%) | 150 (9.3%) |
| Total | 2,831 (100.0%) | 1,607 (100.0%) |
Housing Structure by Heating Type in Martinsville
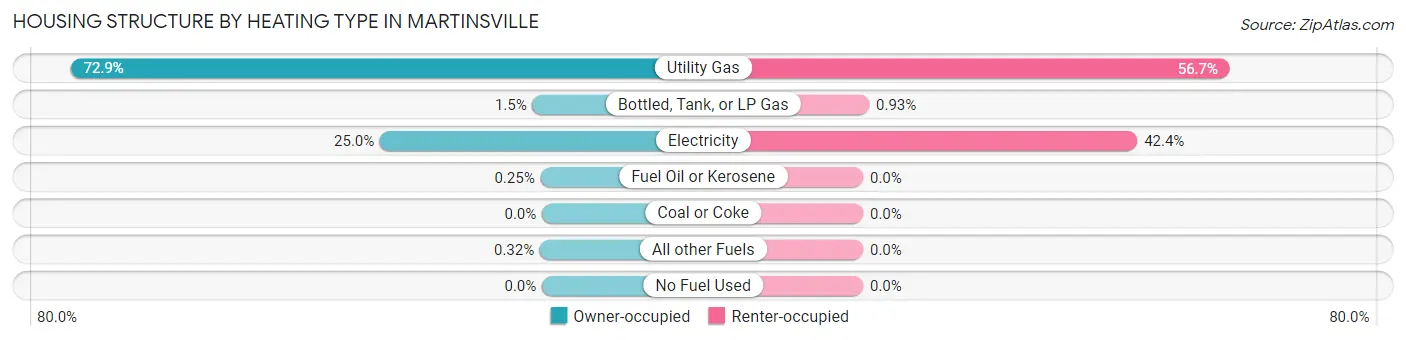
| Heating Type | Owner-occupied | Renter-occupied |
| Utility Gas | 2,064 (72.9%) | 911 (56.7%) |
| Bottled, Tank, or LP Gas | 42 (1.5%) | 15 (0.9%) |
| Electricity | 709 (25.0%) | 681 (42.4%) |
| Fuel Oil or Kerosene | 7 (0.3%) | 0 (0.0%) |
| Coal or Coke | 0 (0.0%) | 0 (0.0%) |
| All other Fuels | 9 (0.3%) | 0 (0.0%) |
| No Fuel Used | 0 (0.0%) | 0 (0.0%) |
| Total | 2,831 (100.0%) | 1,607 (100.0%) |
Household Vehicle Usage in Martinsville
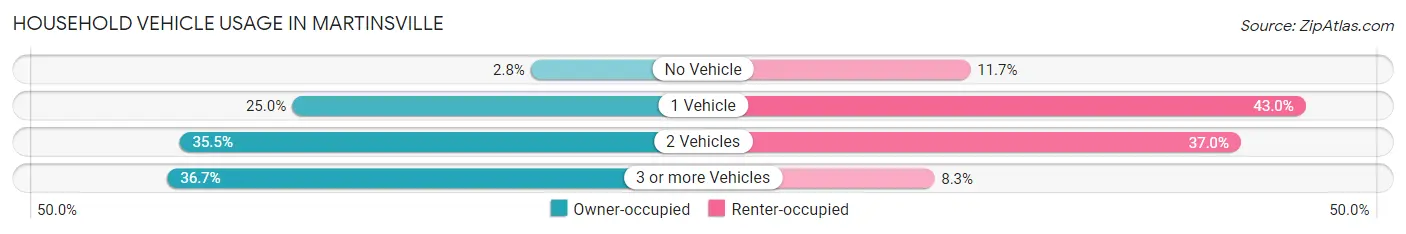
| Vehicles per Household | Owner-occupied | Renter-occupied |
| No Vehicle | 78 (2.8%) | 188 (11.7%) |
| 1 Vehicle | 709 (25.0%) | 691 (43.0%) |
| 2 Vehicles | 1,006 (35.5%) | 594 (37.0%) |
| 3 or more Vehicles | 1,038 (36.7%) | 134 (8.3%) |
| Total | 2,831 (100.0%) | 1,607 (100.0%) |
Real Estate & Mortgages in Martinsville
Real Estate and Mortgage Overview in Martinsville
| Characteristic | Without Mortgage | With Mortgage |
| Housing Units | 1,030 | 1,801 |
| Median Property Value | $108,800 | $149,600 |
| Median Household Income | $41,684 | $194 |
| Monthly Housing Costs | $411 | $12 |
| Real Estate Taxes | $611 | $81 |
Property Value by Mortgage Status in Martinsville
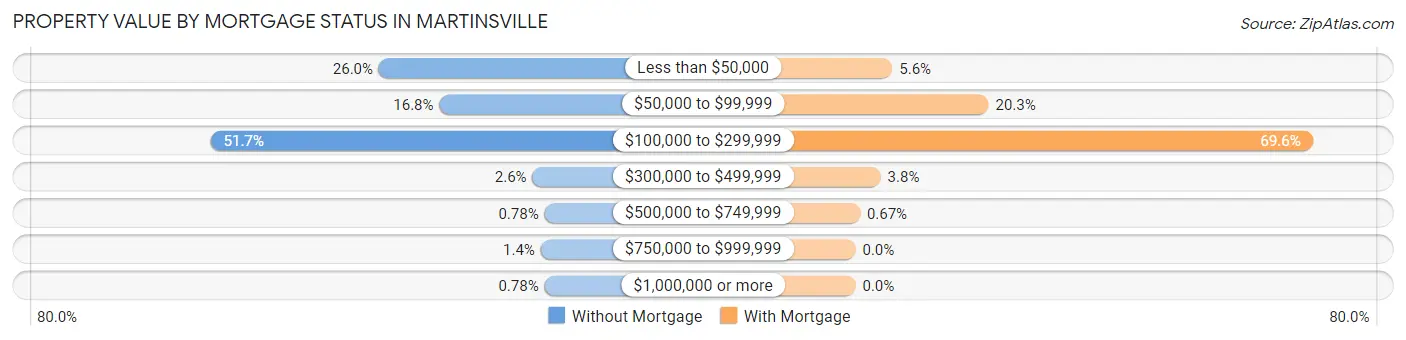
| Property Value | Without Mortgage | With Mortgage |
| Less than $50,000 | 268 (26.0%) | 101 (5.6%) |
| $50,000 to $99,999 | 173 (16.8%) | 365 (20.3%) |
| $100,000 to $299,999 | 532 (51.6%) | 1,254 (69.6%) |
| $300,000 to $499,999 | 27 (2.6%) | 69 (3.8%) |
| $500,000 to $749,999 | 8 (0.8%) | 12 (0.7%) |
| $750,000 to $999,999 | 14 (1.4%) | 0 (0.0%) |
| $1,000,000 or more | 8 (0.8%) | 0 (0.0%) |
| Total | 1,030 (100.0%) | 1,801 (100.0%) |
Household Income by Mortgage Status in Martinsville
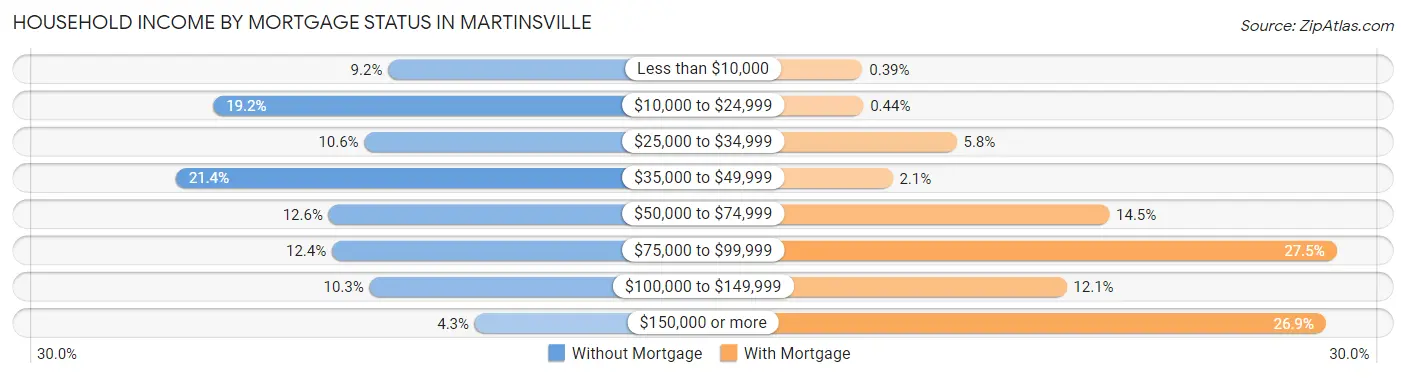
| Household Income | Without Mortgage | With Mortgage |
| Less than $10,000 | 95 (9.2%) | 7 (0.4%) |
| $10,000 to $24,999 | 198 (19.2%) | 8 (0.4%) |
| $25,000 to $34,999 | 109 (10.6%) | 104 (5.8%) |
| $35,000 to $49,999 | 220 (21.4%) | 38 (2.1%) |
| $50,000 to $74,999 | 130 (12.6%) | 261 (14.5%) |
| $75,000 to $99,999 | 128 (12.4%) | 495 (27.5%) |
| $100,000 to $149,999 | 106 (10.3%) | 217 (12.0%) |
| $150,000 or more | 44 (4.3%) | 484 (26.9%) |
| Total | 1,030 (100.0%) | 1,801 (100.0%) |
Property Value to Household Income Ratio in Martinsville
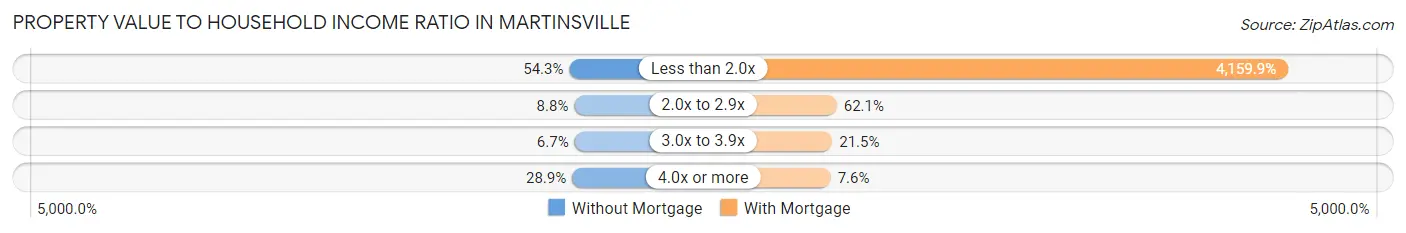
| Value-to-Income Ratio | Without Mortgage | With Mortgage |
| Less than 2.0x | 559 (54.3%) | 74,920 (4,159.9%) |
| 2.0x to 2.9x | 91 (8.8%) | 1,118 (62.1%) |
| 3.0x to 3.9x | 69 (6.7%) | 387 (21.5%) |
| 4.0x or more | 298 (28.9%) | 137 (7.6%) |
| Total | 1,030 (100.0%) | 1,801 (100.0%) |
Real Estate Taxes by Mortgage Status in Martinsville
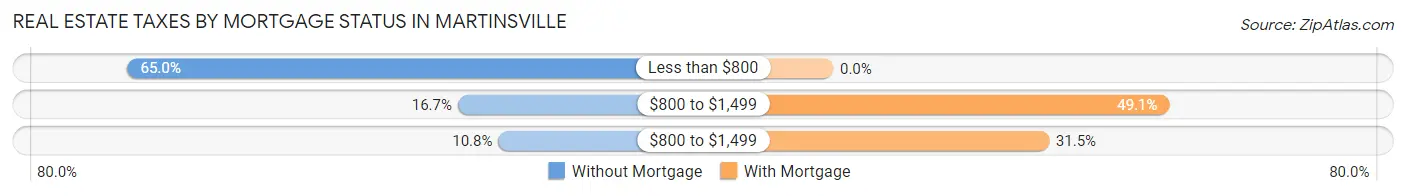
| Property Taxes | Without Mortgage | With Mortgage |
| Less than $800 | 669 (64.9%) | 0 (0.0%) |
| $800 to $1,499 | 172 (16.7%) | 885 (49.1%) |
| $800 to $1,499 | 111 (10.8%) | 568 (31.5%) |
| Total | 1,030 (100.0%) | 1,801 (100.0%) |
Health & Disability in Martinsville
Health Insurance Coverage by Age in Martinsville
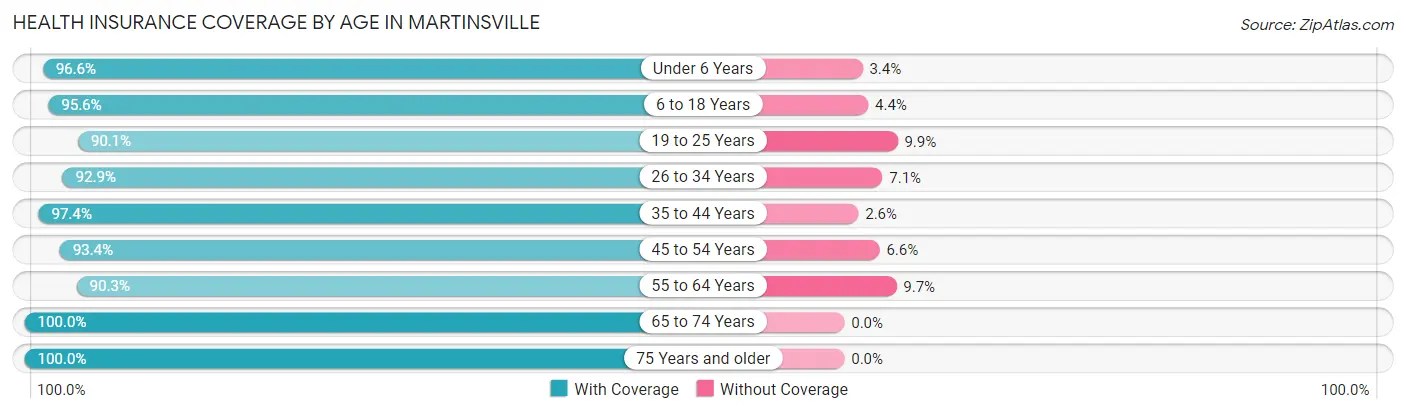
| Age Bracket | With Coverage | Without Coverage |
| Under 6 Years | 743 (96.6%) | 26 (3.4%) |
| 6 to 18 Years | 2,150 (95.6%) | 100 (4.4%) |
| 19 to 25 Years | 1,162 (90.1%) | 128 (9.9%) |
| 26 to 34 Years | 1,257 (92.9%) | 96 (7.1%) |
| 35 to 44 Years | 1,457 (97.4%) | 39 (2.6%) |
| 45 to 54 Years | 1,153 (93.4%) | 81 (6.6%) |
| 55 to 64 Years | 1,257 (90.3%) | 135 (9.7%) |
| 65 to 74 Years | 949 (100.0%) | 0 (0.0%) |
| 75 Years and older | 703 (100.0%) | 0 (0.0%) |
| Total | 10,831 (94.7%) | 605 (5.3%) |
Health Insurance Coverage by Citizenship Status in Martinsville
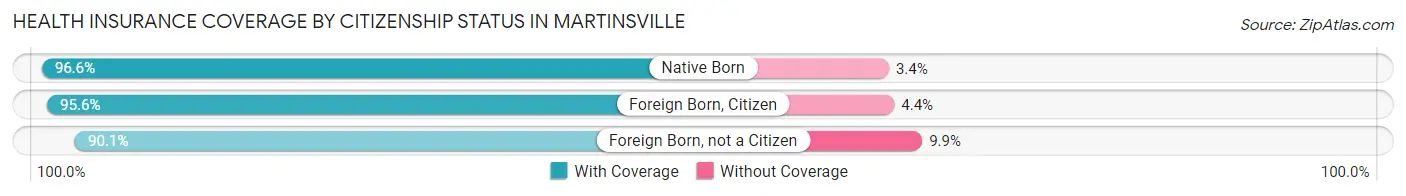
| Citizenship Status | With Coverage | Without Coverage |
| Native Born | 743 (96.6%) | 26 (3.4%) |
| Foreign Born, Citizen | 2,150 (95.6%) | 100 (4.4%) |
| Foreign Born, not a Citizen | 1,162 (90.1%) | 128 (9.9%) |
Health Insurance Coverage by Household Income in Martinsville
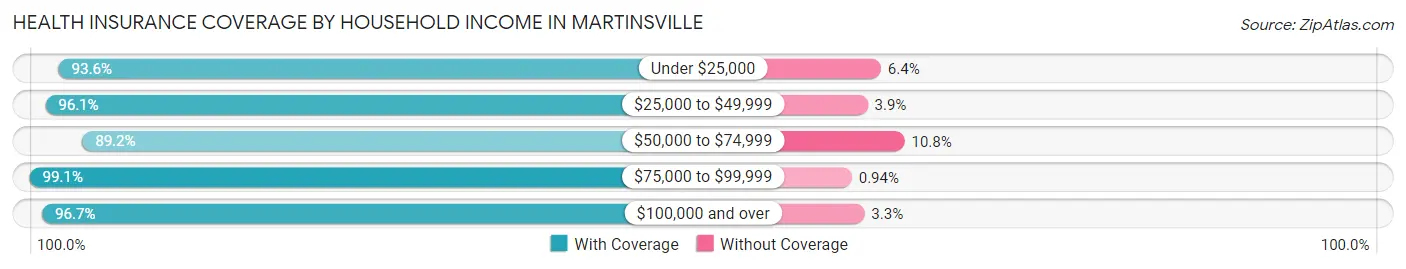
| Household Income | With Coverage | Without Coverage |
| Under $25,000 | 1,274 (93.6%) | 87 (6.4%) |
| $25,000 to $49,999 | 2,290 (96.1%) | 93 (3.9%) |
| $50,000 to $74,999 | 2,144 (89.2%) | 260 (10.8%) |
| $75,000 to $99,999 | 1,583 (99.1%) | 15 (0.9%) |
| $100,000 and over | 3,490 (96.7%) | 119 (3.3%) |
Public vs Private Health Insurance Coverage by Age in Martinsville
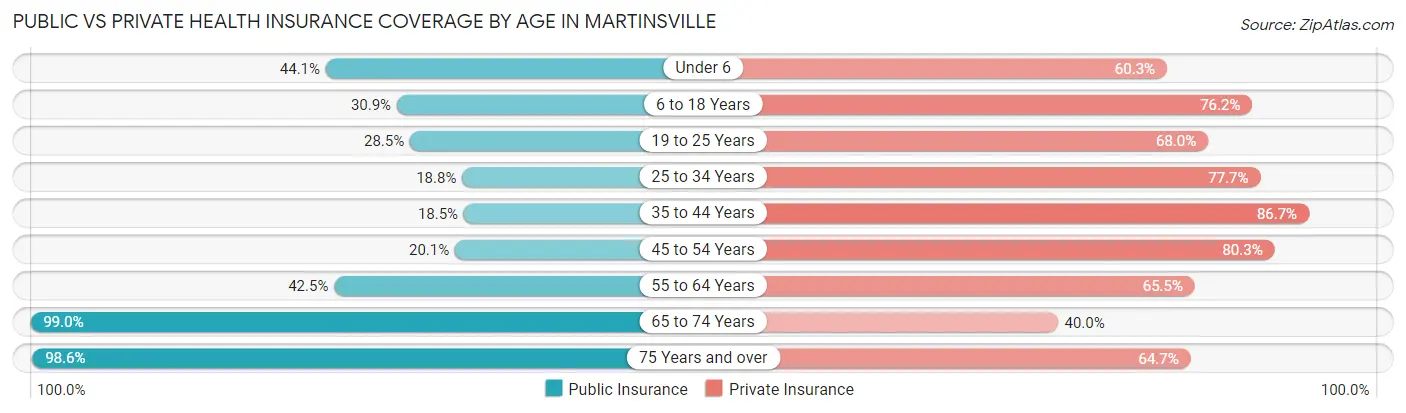
| Age Bracket | Public Insurance | Private Insurance |
| Under 6 | 339 (44.1%) | 464 (60.3%) |
| 6 to 18 Years | 695 (30.9%) | 1,714 (76.2%) |
| 19 to 25 Years | 367 (28.4%) | 877 (68.0%) |
| 25 to 34 Years | 254 (18.8%) | 1,051 (77.7%) |
| 35 to 44 Years | 276 (18.4%) | 1,297 (86.7%) |
| 45 to 54 Years | 248 (20.1%) | 991 (80.3%) |
| 55 to 64 Years | 592 (42.5%) | 912 (65.5%) |
| 65 to 74 Years | 939 (99.0%) | 380 (40.0%) |
| 75 Years and over | 693 (98.6%) | 455 (64.7%) |
| Total | 4,403 (38.5%) | 8,141 (71.2%) |
Disability Status by Sex by Age in Martinsville
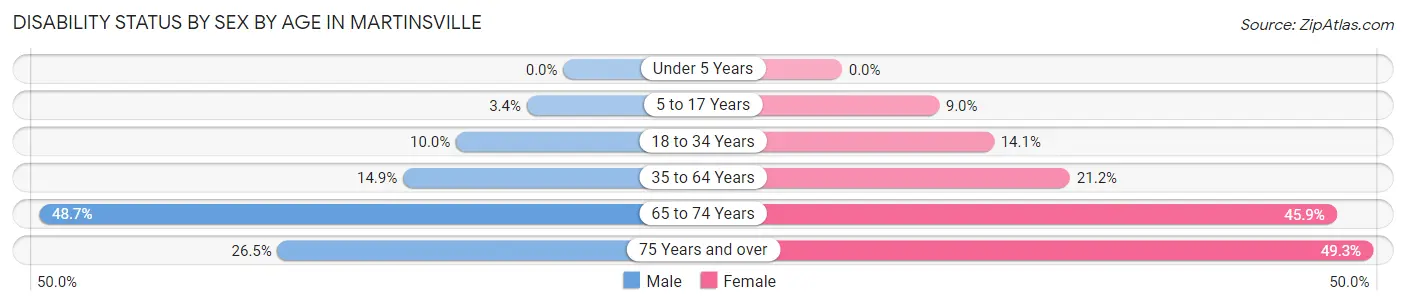
| Age Bracket | Male | Female |
| Under 5 Years | 0 (0.0%) | 0 (0.0%) |
| 5 to 17 Years | 40 (3.4%) | 91 (9.0%) |
| 18 to 34 Years | 168 (10.0%) | 156 (14.1%) |
| 35 to 64 Years | 297 (14.9%) | 450 (21.2%) |
| 65 to 74 Years | 217 (48.6%) | 231 (45.9%) |
| 75 Years and over | 74 (26.5%) | 209 (49.3%) |
Disability Class by Sex by Age in Martinsville
Disability Class: Hearing Difficulty
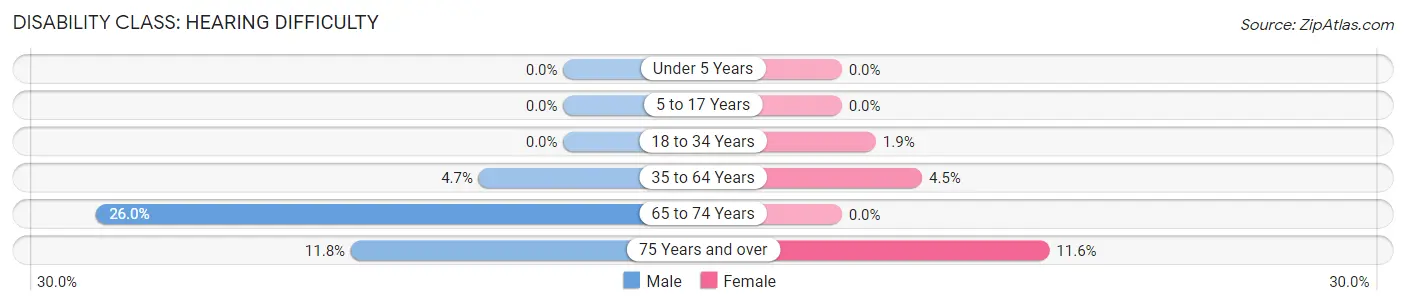
| Age Bracket | Male | Female |
| Under 5 Years | 0 (0.0%) | 0 (0.0%) |
| 5 to 17 Years | 0 (0.0%) | 0 (0.0%) |
| 18 to 34 Years | 0 (0.0%) | 21 (1.9%) |
| 35 to 64 Years | 94 (4.7%) | 95 (4.5%) |
| 65 to 74 Years | 116 (26.0%) | 0 (0.0%) |
| 75 Years and over | 33 (11.8%) | 49 (11.6%) |
Disability Class: Vision Difficulty
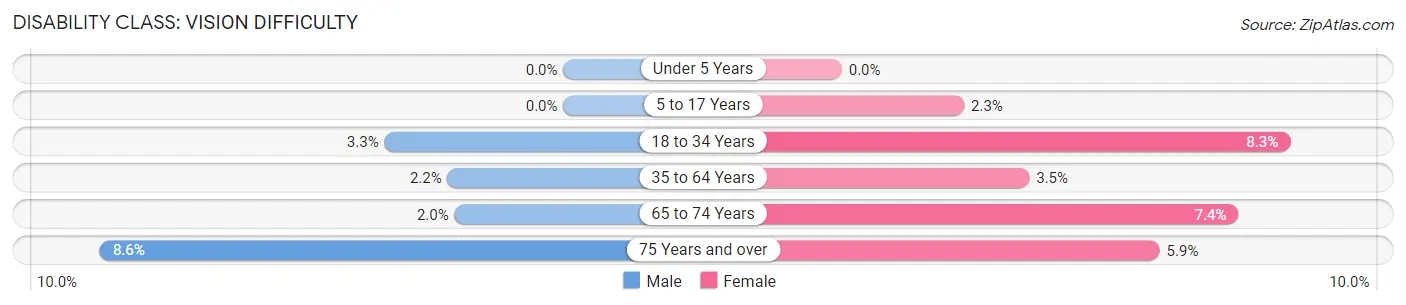
| Age Bracket | Male | Female |
| Under 5 Years | 0 (0.0%) | 0 (0.0%) |
| 5 to 17 Years | 0 (0.0%) | 23 (2.3%) |
| 18 to 34 Years | 56 (3.3%) | 92 (8.3%) |
| 35 to 64 Years | 43 (2.1%) | 74 (3.5%) |
| 65 to 74 Years | 9 (2.0%) | 37 (7.4%) |
| 75 Years and over | 24 (8.6%) | 25 (5.9%) |
Disability Class: Cognitive Difficulty
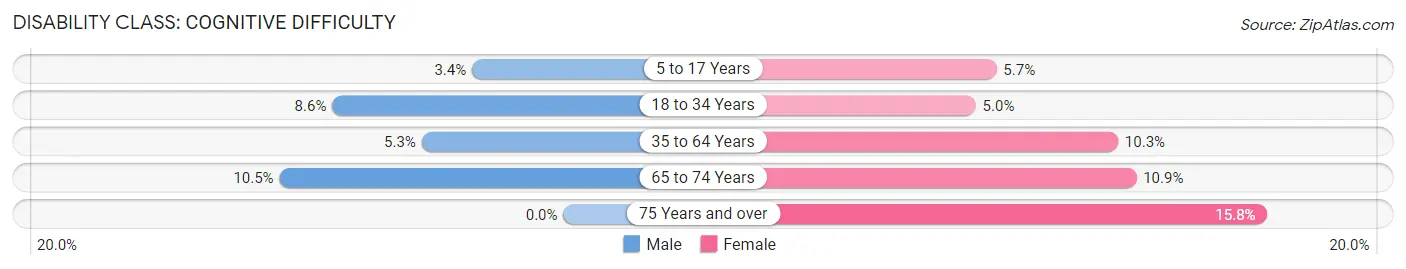
| Age Bracket | Male | Female |
| 5 to 17 Years | 40 (3.4%) | 58 (5.7%) |
| 18 to 34 Years | 145 (8.6%) | 55 (5.0%) |
| 35 to 64 Years | 105 (5.3%) | 218 (10.2%) |
| 65 to 74 Years | 47 (10.5%) | 55 (10.9%) |
| 75 Years and over | 0 (0.0%) | 67 (15.8%) |
Disability Class: Ambulatory Difficulty
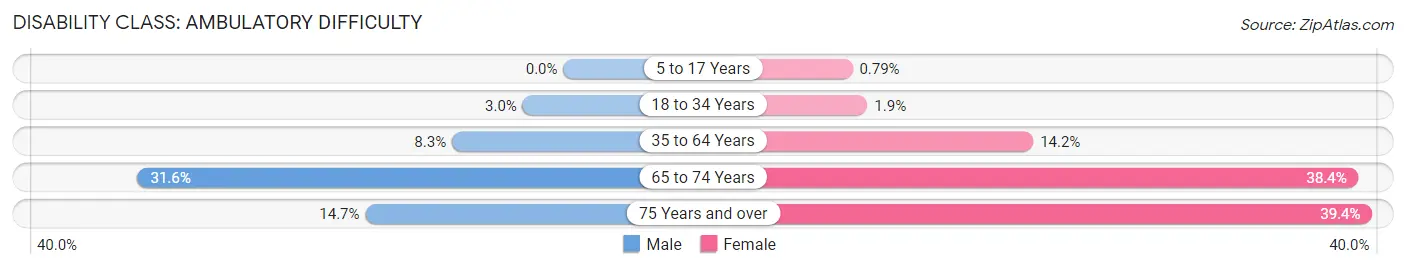
| Age Bracket | Male | Female |
| 5 to 17 Years | 0 (0.0%) | 8 (0.8%) |
| 18 to 34 Years | 51 (3.0%) | 21 (1.9%) |
| 35 to 64 Years | 165 (8.3%) | 302 (14.2%) |
| 65 to 74 Years | 141 (31.6%) | 193 (38.4%) |
| 75 Years and over | 41 (14.7%) | 167 (39.4%) |
Disability Class: Self-Care Difficulty
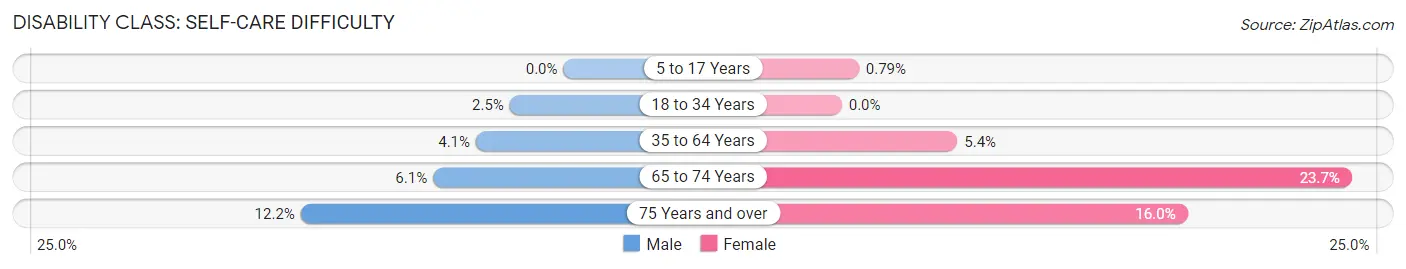
| Age Bracket | Male | Female |
| 5 to 17 Years | 0 (0.0%) | 8 (0.8%) |
| 18 to 34 Years | 42 (2.5%) | 0 (0.0%) |
| 35 to 64 Years | 81 (4.1%) | 114 (5.4%) |
| 65 to 74 Years | 27 (6.0%) | 119 (23.7%) |
| 75 Years and over | 34 (12.2%) | 68 (16.0%) |
Technology Access in Martinsville
Computing Device Access in Martinsville
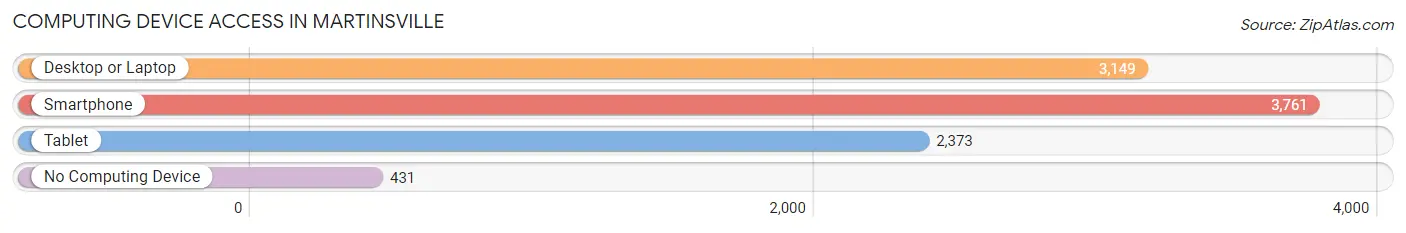
| Device Type | # Households | % Households |
| Desktop or Laptop | 3,149 | 71.0% |
| Smartphone | 3,761 | 84.8% |
| Tablet | 2,373 | 53.5% |
| No Computing Device | 431 | 9.7% |
| Total | 4,438 | 100.0% |
Internet Access in Martinsville
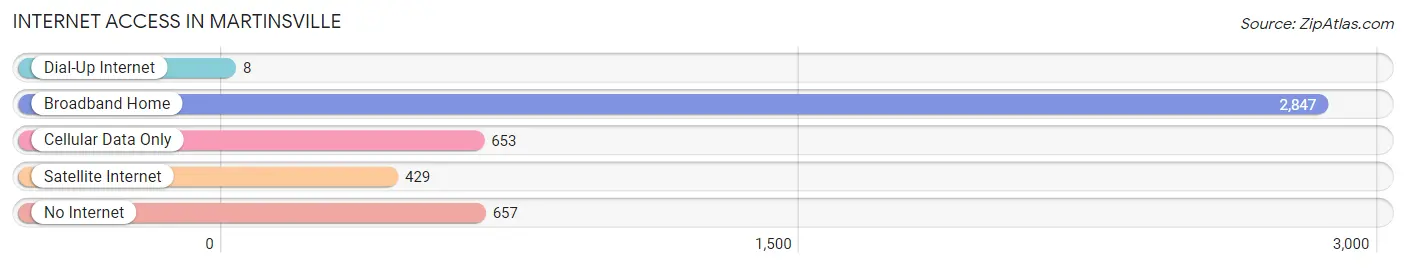
| Internet Type | # Households | % Households |
| Dial-Up Internet | 8 | 0.2% |
| Broadband Home | 2,847 | 64.1% |
| Cellular Data Only | 653 | 14.7% |
| Satellite Internet | 429 | 9.7% |
| No Internet | 657 | 14.8% |
| Total | 4,438 | 100.0% |
Martinsville Summary
Martinsville, Indiana is a small city located in Morgan County, Indiana, United States. It is the county seat of Morgan County and is located about 40 miles southwest of Indianapolis. The city has a population of 11,828 as of the 2010 census.
History
The area that is now Martinsville was first settled in 1822 by John Martin, who had moved to the area from North Carolina. Martin built a log cabin and established a trading post, which became the first permanent settlement in the area. The settlement was originally known as "Martinsville" and was later incorporated as a town in 1848.
The city grew rapidly in the late 19th century, becoming a major center for the production of furniture and other wood products. The city was also home to several large factories, including the Indiana Furniture Company, which was founded in 1876.
Geography
Martinsville is located in central Indiana, about 40 miles southwest of Indianapolis. The city is situated in the White River Valley, which is part of the Central Lowland region of the United States. The city is located at the intersection of State Road 37 and State Road 39.
The city has a total area of 8.3 square miles, of which 8.2 square miles is land and 0.1 square miles is water. The city is located at an elevation of 830 feet above sea level.
Economy
Martinsville has a diverse economy, with a variety of industries represented. The city is home to several large employers, including the Indiana Furniture Company, which is the largest employer in the city. Other major employers include the Morgan County Hospital, the Martinsville School Corporation, and the Martinsville-Morgan County Chamber of Commerce.
The city is also home to several small businesses, including restaurants, retail stores, and professional services. The city is also home to several manufacturing companies, including the Indiana Furniture Company, which produces furniture and other wood products.
Demographics
As of the 2010 census, the city had a population of 11,828. The racial makeup of the city was 95.2% White, 1.2% African American, 0.3% Native American, 0.7% Asian, 0.1% Pacific Islander, 1.2% from other races, and 1.3% from two or more races. Hispanic or Latino of any race were 3.2% of the population.
The median income for a household in the city was $37,945, and the median income for a family was $45,945. The per capita income for the city was $19,945. About 11.2% of families and 14.2% of the population were below the poverty line, including 19.2% of those under age 18 and 8.2% of those age 65 or over.
Common Questions
What is Per Capita Income in Martinsville?
Per Capita income in Martinsville is $28,963.
What is the Median Family Income in Martinsville?
Median Family Income in Martinsville is $71,174.
What is the Median Household income in Martinsville?
Median Household Income in Martinsville is $57,383.
What is Income or Wage Gap in Martinsville?
Income or Wage Gap in Martinsville is 25.5%.
Women in Martinsville earn 74.5 cents for every dollar earned by a man.
What is Inequality or Gini Index in Martinsville?
Inequality or Gini Index in Martinsville is 0.43.
What is the Total Population of Martinsville?
Total Population of Martinsville is 11,916.
What is the Total Male Population of Martinsville?
Total Male Population of Martinsville is 6,172.
What is the Total Female Population of Martinsville?
Total Female Population of Martinsville is 5,744.
What is the Ratio of Males per 100 Females in Martinsville?
There are 107.45 Males per 100 Females in Martinsville.
What is the Ratio of Females per 100 Males in Martinsville?
There are 93.07 Females per 100 Males in Martinsville.
What is the Median Population Age in Martinsville?
Median Population Age in Martinsville is 36.2 Years.
What is the Average Family Size in Martinsville
Average Family Size in Martinsville is 3.2 People.
What is the Average Household Size in Martinsville
Average Household Size in Martinsville is 2.6 People.
How Large is the Labor Force in Martinsville?
There are 5,725 People in the Labor Forcein in Martinsville.
What is the Percentage of People in the Labor Force in Martinsville?
60.5% of People are in the Labor Force in Martinsville.
What is the Unemployment Rate in Martinsville?
Unemployment Rate in Martinsville is 4.6%.