Marshall, IN Map & Demographics
Marshall Map
Marshall Overview
$31,780
PER CAPITA INCOME
$81,250
AVG FAMILY INCOME
$40,625
AVG HOUSEHOLD INCOME
21.9%
WAGE / INCOME GAP [ % ]
78.1¢/ $1
WAGE / INCOME GAP [ $ ]
0.43
INEQUALITY / GINI INDEX
331
TOTAL POPULATION
145
MALE POPULATION
186
FEMALE POPULATION
77.96
MALES / 100 FEMALES
128.28
FEMALES / 100 MALES
48.0
MEDIAN AGE
3.3
AVG FAMILY SIZE
2.2
AVG HOUSEHOLD SIZE
199
LABOR FORCE [ PEOPLE ]
70.6%
PERCENT IN LABOR FORCE
2.0%
UNEMPLOYMENT RATE
Marshall Zip Codes
Marshall Area Codes
Income in Marshall
Income Overview in Marshall
Per Capita Income in Marshall is $31,780, while median incomes of families and households are $81,250 and $40,625 respectively.
| Characteristic | Number | Measure |
| Per Capita Income | 331 | $31,780 |
| Median Family Income | 74 | $81,250 |
| Mean Family Income | 74 | $96,351 |
| Median Household Income | 152 | $40,625 |
| Mean Household Income | 152 | $64,983 |
| Income Deficit | 74 | $0 |
| Wage / Income Gap (%) | 331 | 21.87% |
| Wage / Income Gap ($) | 331 | 78.13¢ per $1 |
| Gini / Inequality Index | 331 | 0.43 |
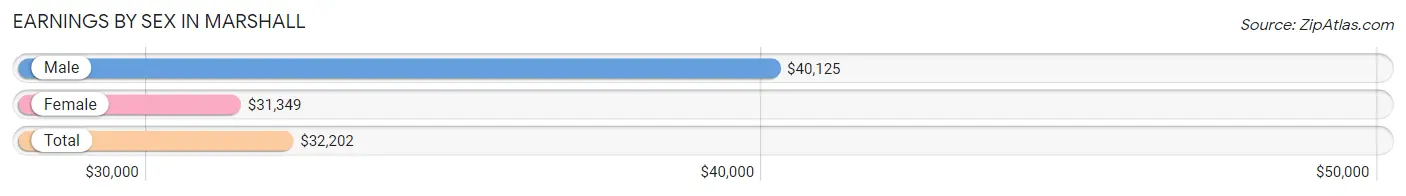
Earnings by Sex in Marshall
Average Earnings in Marshall are $32,202, $40,125 for men and $31,349 for women, a difference of 21.9%.
| Sex | Number | Average Earnings |
| Male | 77 (38.3%) | $40,125 |
| Female | 124 (61.7%) | $31,349 |
| Total | 201 (100.0%) | $32,202 |
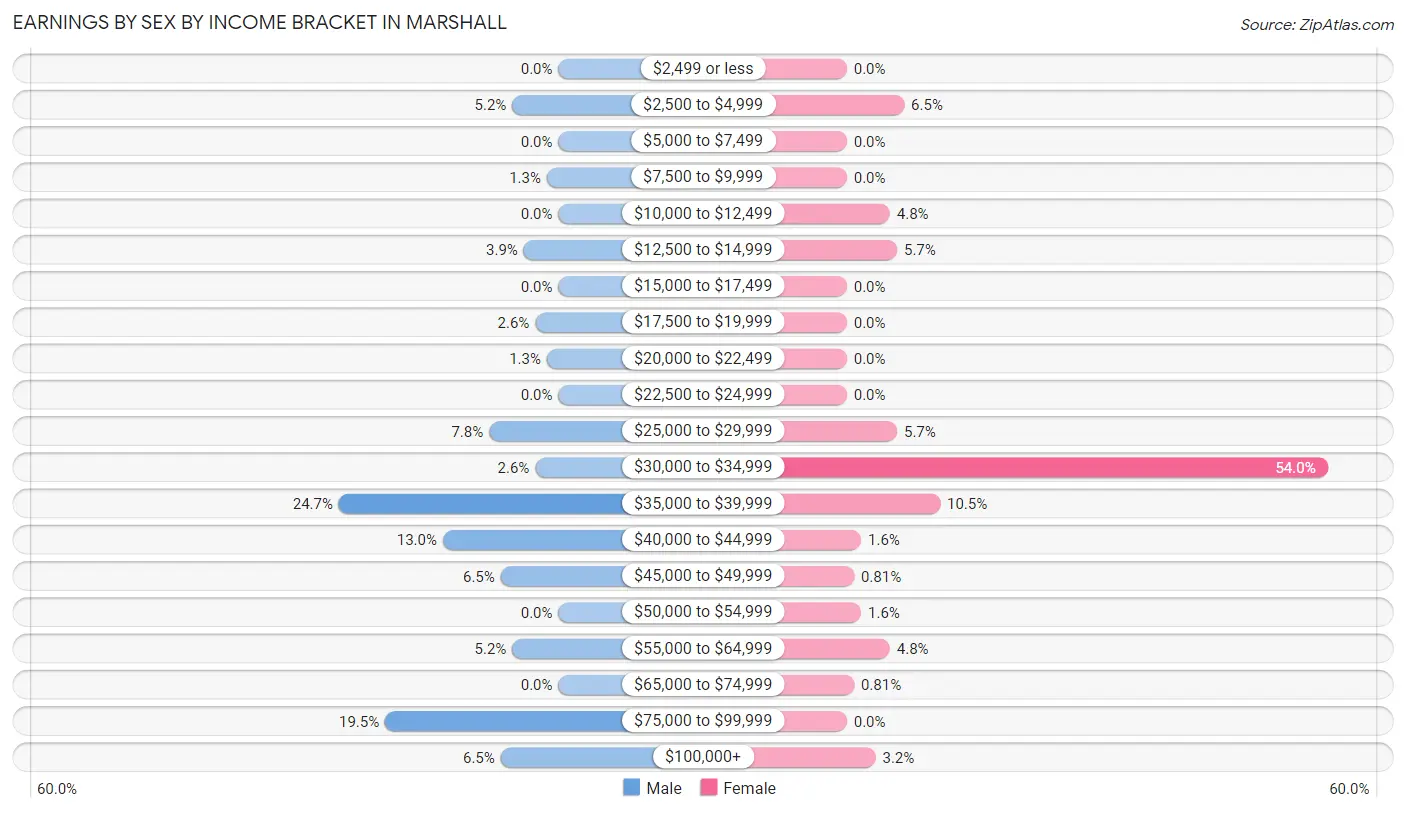
Earnings by Sex by Income Bracket in Marshall
The most common earnings brackets in Marshall are $35,000 to $39,999 for men (19 | 24.7%) and $30,000 to $34,999 for women (67 | 54.0%).
| Income | Male | Female |
| $2,499 or less | 0 (0.0%) | 0 (0.0%) |
| $2,500 to $4,999 | 4 (5.2%) | 8 (6.5%) |
| $5,000 to $7,499 | 0 (0.0%) | 0 (0.0%) |
| $7,500 to $9,999 | 1 (1.3%) | 0 (0.0%) |
| $10,000 to $12,499 | 0 (0.0%) | 6 (4.8%) |
| $12,500 to $14,999 | 3 (3.9%) | 7 (5.7%) |
| $15,000 to $17,499 | 0 (0.0%) | 0 (0.0%) |
| $17,500 to $19,999 | 2 (2.6%) | 0 (0.0%) |
| $20,000 to $22,499 | 1 (1.3%) | 0 (0.0%) |
| $22,500 to $24,999 | 0 (0.0%) | 0 (0.0%) |
| $25,000 to $29,999 | 6 (7.8%) | 7 (5.7%) |
| $30,000 to $34,999 | 2 (2.6%) | 67 (54.0%) |
| $35,000 to $39,999 | 19 (24.7%) | 13 (10.5%) |
| $40,000 to $44,999 | 10 (13.0%) | 2 (1.6%) |
| $45,000 to $49,999 | 5 (6.5%) | 1 (0.8%) |
| $50,000 to $54,999 | 0 (0.0%) | 2 (1.6%) |
| $55,000 to $64,999 | 4 (5.2%) | 6 (4.8%) |
| $65,000 to $74,999 | 0 (0.0%) | 1 (0.8%) |
| $75,000 to $99,999 | 15 (19.5%) | 0 (0.0%) |
| $100,000+ | 5 (6.5%) | 4 (3.2%) |
| Total | 77 (100.0%) | 124 (100.0%) |
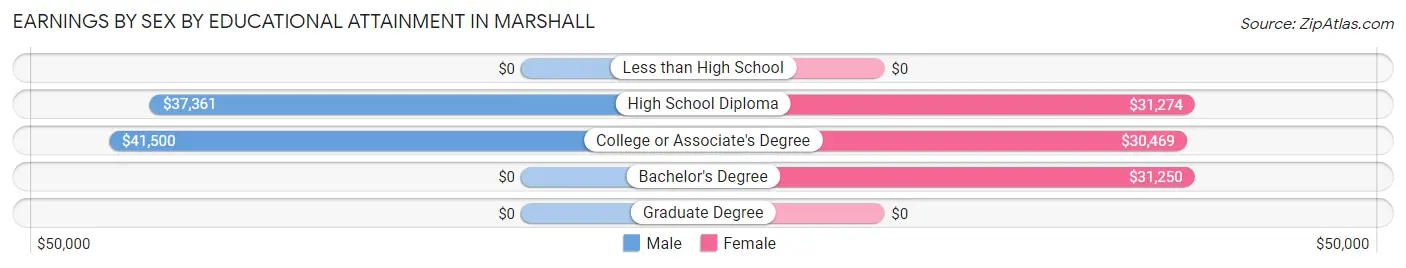
Earnings by Sex by Educational Attainment in Marshall
Average earnings in Marshall are $41,719 for men and $31,171 for women, a difference of 25.3%. Men with an educational attainment of college or associate's degree enjoy the highest average annual earnings of $41,500, while those with high school diploma education earn the least with $37,361. Women with an educational attainment of high school diploma earn the most with the average annual earnings of $31,274, while those with college or associate's degree education have the smallest earnings of $30,469.
| Educational Attainment | Male Income | Female Income |
| Less than High School | - | - |
| High School Diploma | $37,361 | $31,274 |
| College or Associate's Degree | $41,500 | $30,469 |
| Bachelor's Degree | - | - |
| Graduate Degree | - | - |
| Total | $41,719 | $31,171 |
Family Income in Marshall
Family Income Brackets in Marshall
According to the Marshall family income data, there are 15 families falling into the $35,000 to $49,999 income range, which is the most common income bracket and makes up 20.3% of all families.
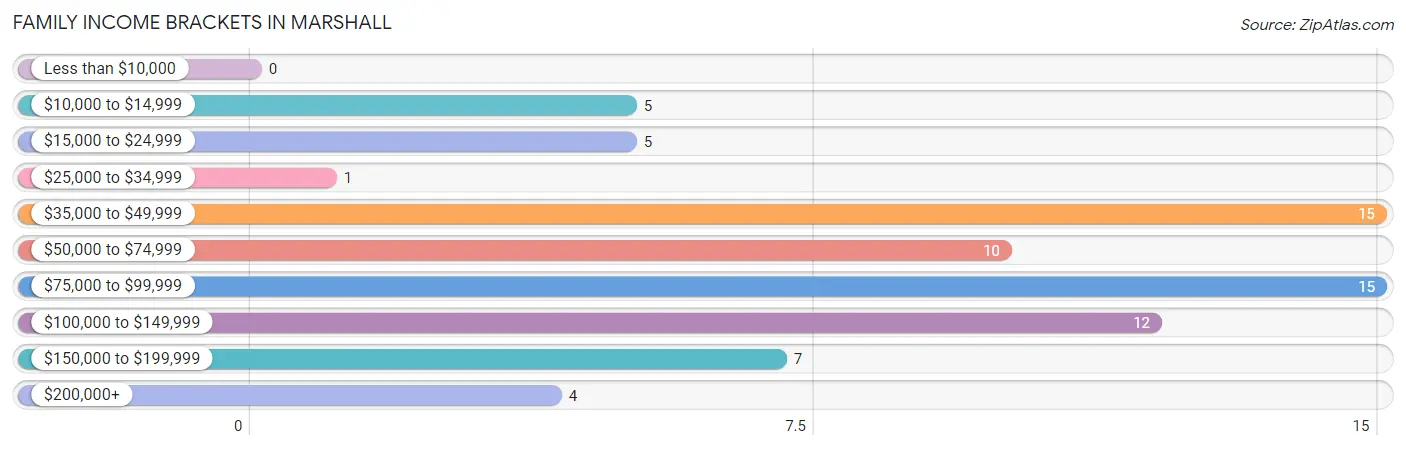
| Income Bracket | # Families | % Families |
| Less than $10,000 | 0 | 0.0% |
| $10,000 to $14,999 | 5 | 6.8% |
| $15,000 to $24,999 | 5 | 6.8% |
| $25,000 to $34,999 | 1 | 1.4% |
| $35,000 to $49,999 | 15 | 20.3% |
| $50,000 to $74,999 | 10 | 13.5% |
| $75,000 to $99,999 | 15 | 20.3% |
| $100,000 to $149,999 | 12 | 16.2% |
| $150,000 to $199,999 | 7 | 9.5% |
| $200,000+ | 4 | 5.4% |
Family Income by Famaliy Size in Marshall
2-person families (38 | 51.3%) account for the highest median family income in Marshall with $77,500 per family, while 2-person families (38 | 51.3%) have the highest median income of $38,750 per family member.
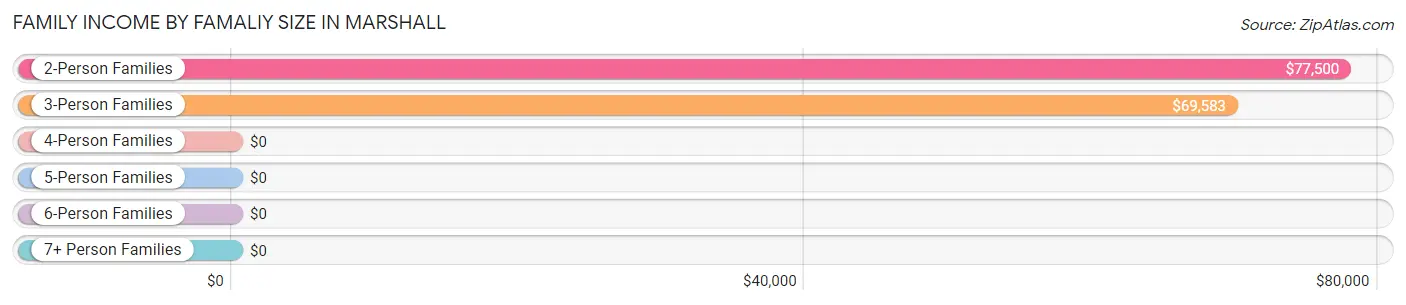
| Income Bracket | # Families | Median Income |
| 2-Person Families | 38 (51.3%) | $77,500 |
| 3-Person Families | 23 (31.1%) | $69,583 |
| 4-Person Families | 7 (9.5%) | $0 |
| 5-Person Families | 4 (5.4%) | $0 |
| 6-Person Families | 2 (2.7%) | $0 |
| 7+ Person Families | 0 (0.0%) | $0 |
| Total | 74 (100.0%) | $81,250 |
Family Income by Number of Earners in Marshall
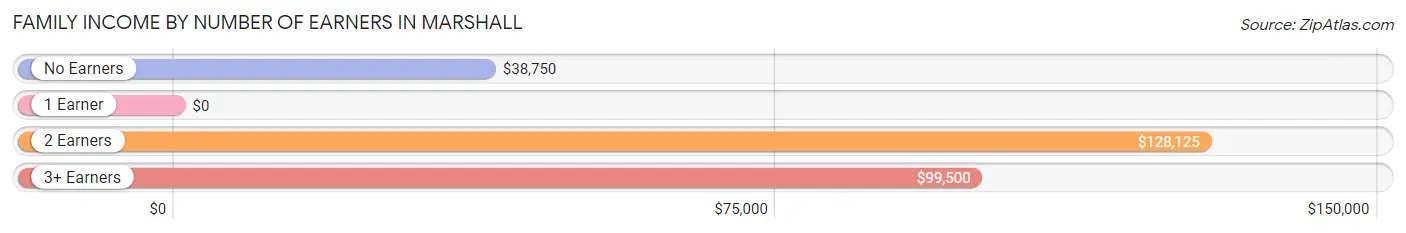
| Number of Earners | # Families | Median Income |
| No Earners | 15 (20.3%) | $38,750 |
| 1 Earner | 22 (29.7%) | $0 |
| 2 Earners | 23 (31.1%) | $128,125 |
| 3+ Earners | 14 (18.9%) | $99,500 |
| Total | 74 (100.0%) | $81,250 |
Household Income in Marshall
Household Income Brackets in Marshall
With 56 households falling in the category, the $25,000 to $34,999 income range is the most frequent in Marshall, accounting for 36.8% of all households. In contrast, only 1 households (0.7%) fall into the less than $10,000 income bracket, making it the least populous group.
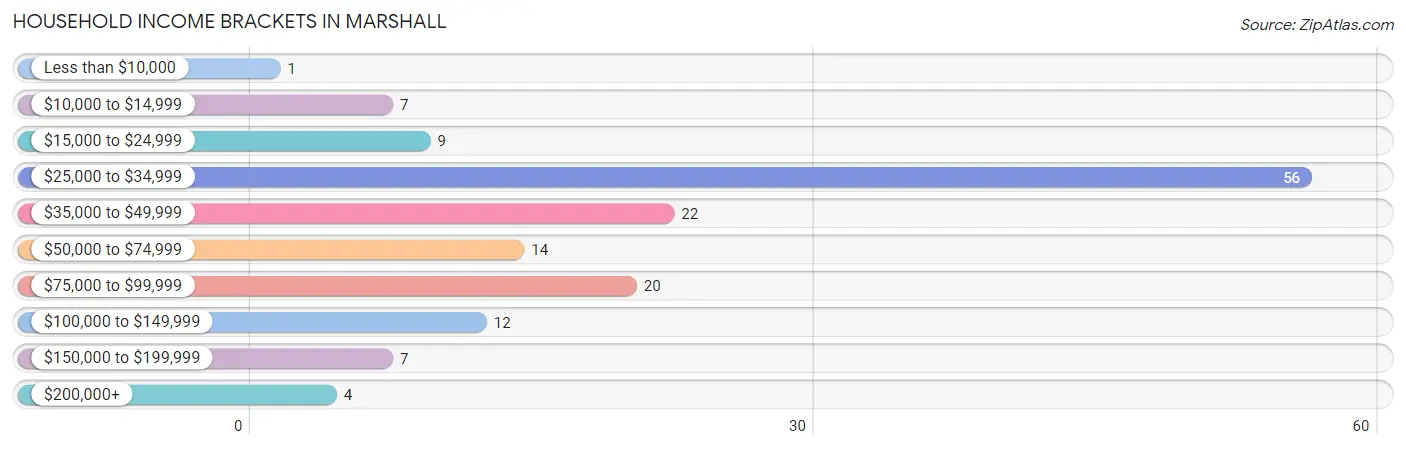
| Income Bracket | # Households | % Households |
| Less than $10,000 | 1 | 0.7% |
| $10,000 to $14,999 | 7 | 4.6% |
| $15,000 to $24,999 | 9 | 5.9% |
| $25,000 to $34,999 | 56 | 36.8% |
| $35,000 to $49,999 | 22 | 14.5% |
| $50,000 to $74,999 | 14 | 9.2% |
| $75,000 to $99,999 | 20 | 13.2% |
| $100,000 to $149,999 | 12 | 7.9% |
| $150,000 to $199,999 | 7 | 4.6% |
| $200,000+ | 4 | 2.6% |
Household Income by Householder Age in Marshall
The median household income in Marshall is $40,625, with the highest median household income of $81,563 found in the 25 to 44 years age bracket for the primary householder. A total of 29 households (19.1%) fall into this category. Meanwhile, the 15 to 24 years age bracket for the primary householder has the lowest median household income of $0, with 6 households (4.0%) in this group.
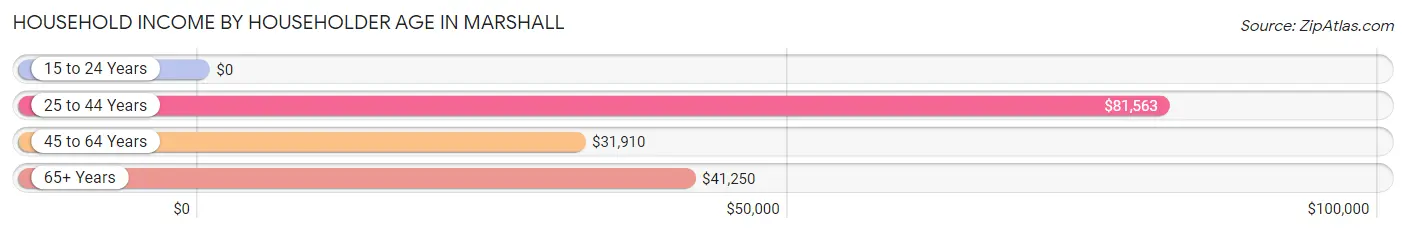
| Income Bracket | # Households | Median Income |
| 15 to 24 Years | 6 (4.0%) | $0 |
| 25 to 44 Years | 29 (19.1%) | $81,563 |
| 45 to 64 Years | 87 (57.2%) | $31,910 |
| 65+ Years | 30 (19.7%) | $41,250 |
| Total | 152 (100.0%) | $40,625 |
Poverty in Marshall
Income Below Poverty by Sex and Age in Marshall
With 6.2% poverty level for males and 8.3% for females among the residents of Marshall, 6 to 11 year old males and 6 to 11 year old females are the most vulnerable to poverty, with 7 males (41.2%) and 7 females (63.6%) in their respective age groups living below the poverty level.
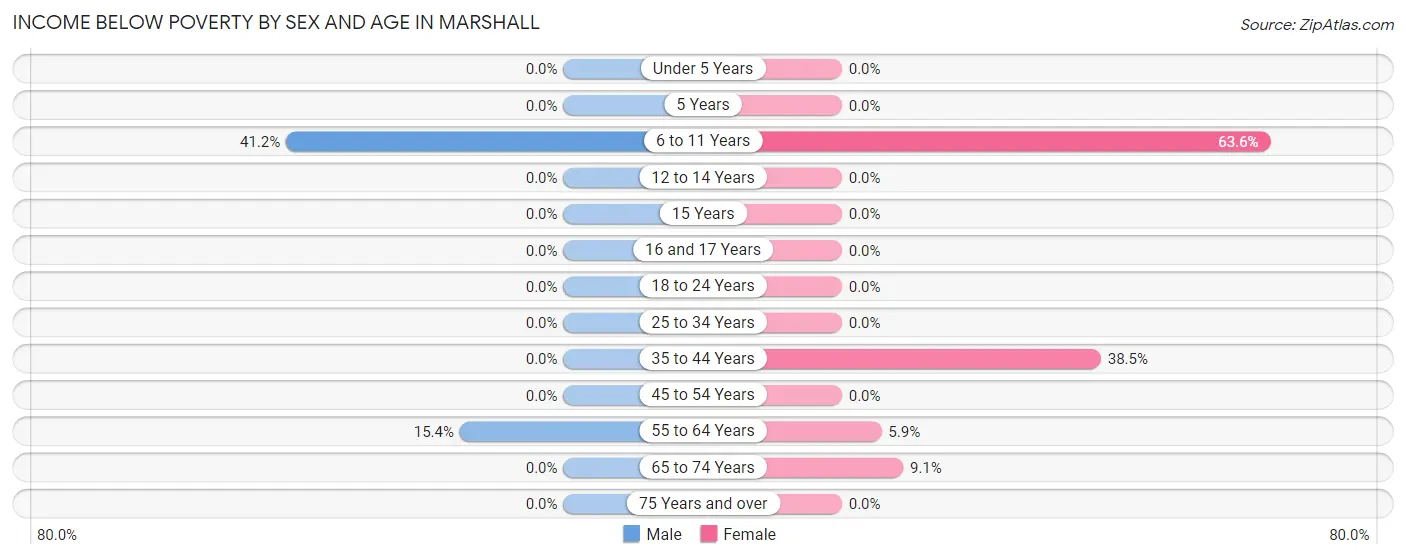
| Age Bracket | Male | Female |
| Under 5 Years | 0 (0.0%) | 0 (0.0%) |
| 5 Years | 0 (0.0%) | 0 (0.0%) |
| 6 to 11 Years | 7 (41.2%) | 7 (63.6%) |
| 12 to 14 Years | 0 (0.0%) | 0 (0.0%) |
| 15 Years | 0 (0.0%) | 0 (0.0%) |
| 16 and 17 Years | 0 (0.0%) | 0 (0.0%) |
| 18 to 24 Years | 0 (0.0%) | 0 (0.0%) |
| 25 to 34 Years | 0 (0.0%) | 0 (0.0%) |
| 35 to 44 Years | 0 (0.0%) | 5 (38.5%) |
| 45 to 54 Years | 0 (0.0%) | 0 (0.0%) |
| 55 to 64 Years | 2 (15.4%) | 1 (5.9%) |
| 65 to 74 Years | 0 (0.0%) | 2 (9.1%) |
| 75 Years and over | 0 (0.0%) | 0 (0.0%) |
| Total | 9 (6.2%) | 15 (8.3%) |
Income Above Poverty by Sex and Age in Marshall
According to the poverty statistics in Marshall, males aged under 5 years and females aged under 5 years are the age groups that are most secure financially, with 100.0% of males and 100.0% of females in these age groups living above the poverty line.
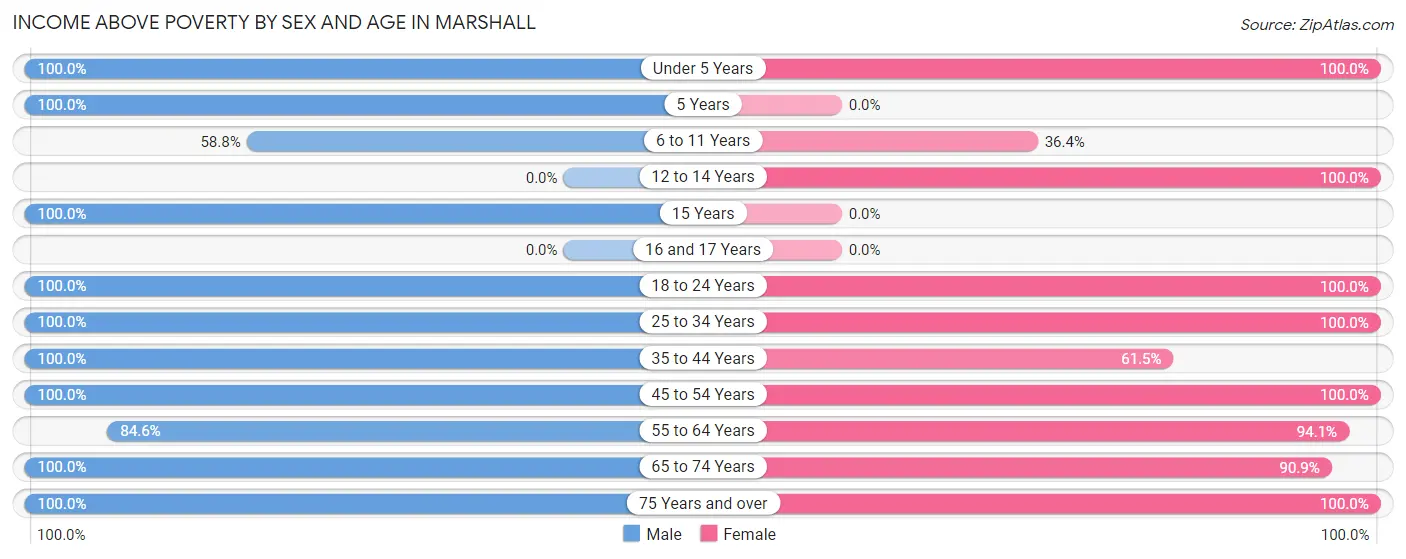
| Age Bracket | Male | Female |
| Under 5 Years | 8 (100.0%) | 4 (100.0%) |
| 5 Years | 1 (100.0%) | 0 (0.0%) |
| 6 to 11 Years | 10 (58.8%) | 4 (36.4%) |
| 12 to 14 Years | 0 (0.0%) | 2 (100.0%) |
| 15 Years | 1 (100.0%) | 0 (0.0%) |
| 16 and 17 Years | 0 (0.0%) | 0 (0.0%) |
| 18 to 24 Years | 14 (100.0%) | 17 (100.0%) |
| 25 to 34 Years | 36 (100.0%) | 10 (100.0%) |
| 35 to 44 Years | 7 (100.0%) | 8 (61.5%) |
| 45 to 54 Years | 25 (100.0%) | 78 (100.0%) |
| 55 to 64 Years | 11 (84.6%) | 16 (94.1%) |
| 65 to 74 Years | 16 (100.0%) | 20 (90.9%) |
| 75 Years and over | 7 (100.0%) | 7 (100.0%) |
| Total | 136 (93.8%) | 166 (91.7%) |
Income Below Poverty Among Married-Couple Families in Marshall
The poverty statistics for married-couple families in Marshall show that 1.7% or 1 of the total 58 families live below the poverty line. Families with no children have the highest poverty rate of 2.4%, comprising of 1 families. On the other hand, families with 1 or 2 children have the lowest poverty rate of 0.0%, which includes 0 families.
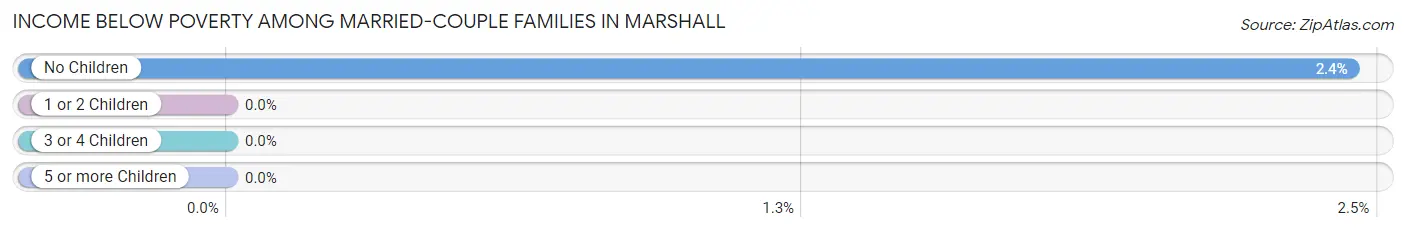
| Children | Above Poverty | Below Poverty |
| No Children | 40 (97.6%) | 1 (2.4%) |
| 1 or 2 Children | 17 (100.0%) | 0 (0.0%) |
| 3 or 4 Children | 0 (0.0%) | 0 (0.0%) |
| 5 or more Children | 0 (0.0%) | 0 (0.0%) |
| Total | 57 (98.3%) | 1 (1.7%) |
Income Below Poverty Among Single-Parent Households in Marshall
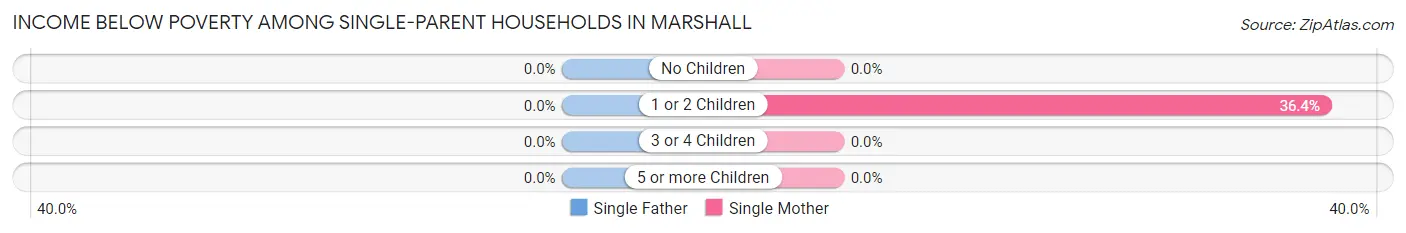
| Children | Single Father | Single Mother |
| No Children | 0 (0.0%) | 0 (0.0%) |
| 1 or 2 Children | 0 (0.0%) | 4 (36.4%) |
| 3 or 4 Children | 0 (0.0%) | 0 (0.0%) |
| 5 or more Children | 0 (0.0%) | 0 (0.0%) |
| Total | 0 (0.0%) | 4 (33.3%) |
Income Below Poverty Among Married-Couple vs Single-Parent Households in Marshall
The poverty data for Marshall shows that 1 of the married-couple family households (1.7%) and 4 of the single-parent households (25.0%) are living below the poverty level. Within the married-couple family households, those with no children have the highest poverty rate, with 1 households (2.4%) falling below the poverty line. Among the single-parent households, those with 1 or 2 children have the highest poverty rate, with 4 household (36.4%) living below poverty.
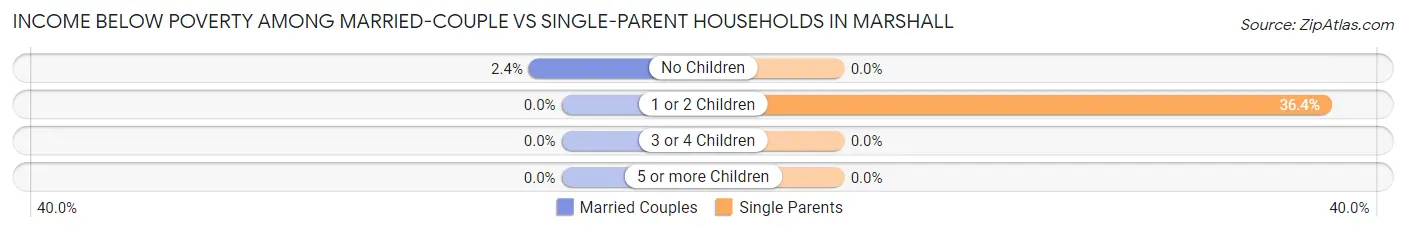
| Children | Married-Couple Families | Single-Parent Households |
| No Children | 1 (2.4%) | 0 (0.0%) |
| 1 or 2 Children | 0 (0.0%) | 4 (36.4%) |
| 3 or 4 Children | 0 (0.0%) | 0 (0.0%) |
| 5 or more Children | 0 (0.0%) | 0 (0.0%) |
| Total | 1 (1.7%) | 4 (25.0%) |
Race in Marshall
The most populous races in Marshall are White / Caucasian (276 | 83.4%), Black / African American (53 | 16.0%), and Two or more Races (2 | 0.6%).
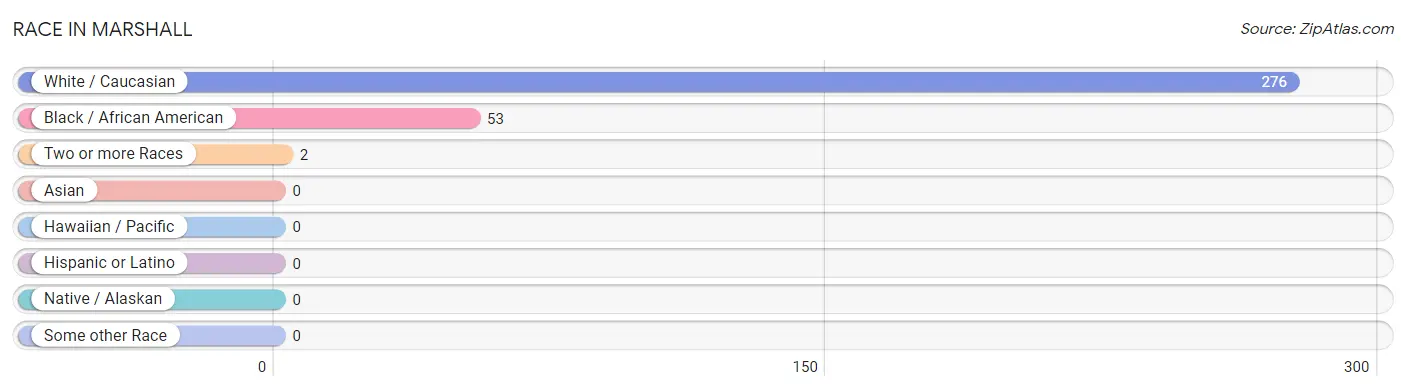
| Race | # Population | % Population |
| Asian | 0 | 0.0% |
| Black / African American | 53 | 16.0% |
| Hawaiian / Pacific | 0 | 0.0% |
| Hispanic or Latino | 0 | 0.0% |
| Native / Alaskan | 0 | 0.0% |
| White / Caucasian | 276 | 83.4% |
| Two or more Races | 2 | 0.6% |
| Some other Race | 0 | 0.0% |
| Total | 331 | 100.0% |
Ancestry in Marshall
The most populous ancestries reported in Marshall are Irish (53 | 16.0%), English (43 | 13.0%), German (39 | 11.8%), American (11 | 3.3%), and Italian (10 | 3.0%), together accounting for 47.1% of all Marshall residents.
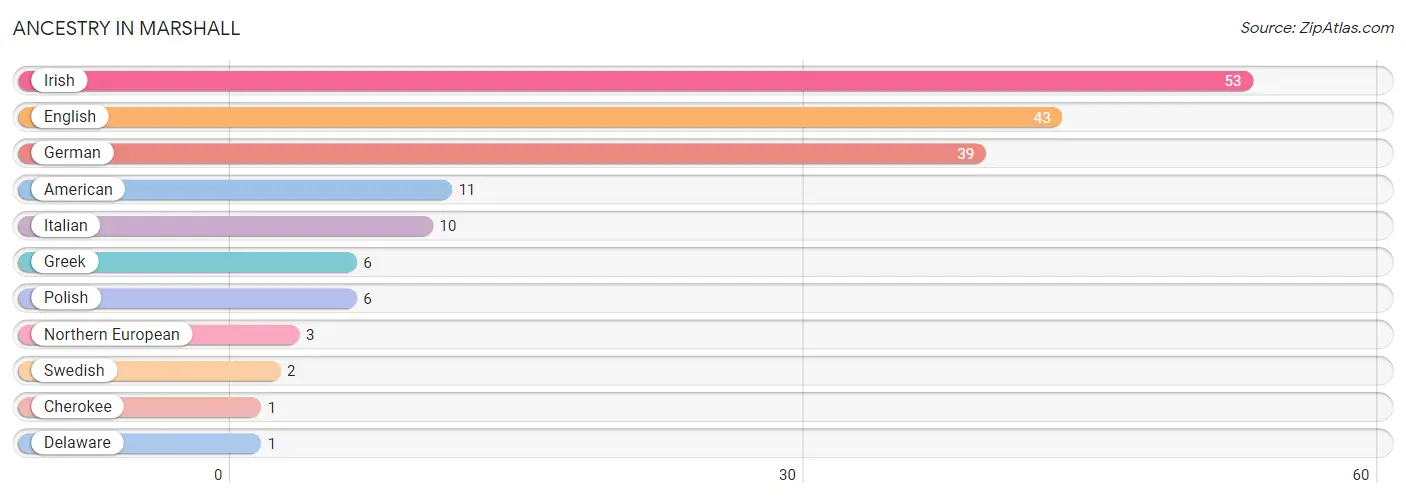
| Ancestry | # Population | % Population |
| American | 11 | 3.3% |
| Cherokee | 1 | 0.3% |
| Delaware | 1 | 0.3% |
| English | 43 | 13.0% |
| German | 39 | 11.8% |
| Greek | 6 | 1.8% |
| Irish | 53 | 16.0% |
| Italian | 10 | 3.0% |
| Northern European | 3 | 0.9% |
| Polish | 6 | 1.8% |
| Swedish | 2 | 0.6% | View All 11 Rows |
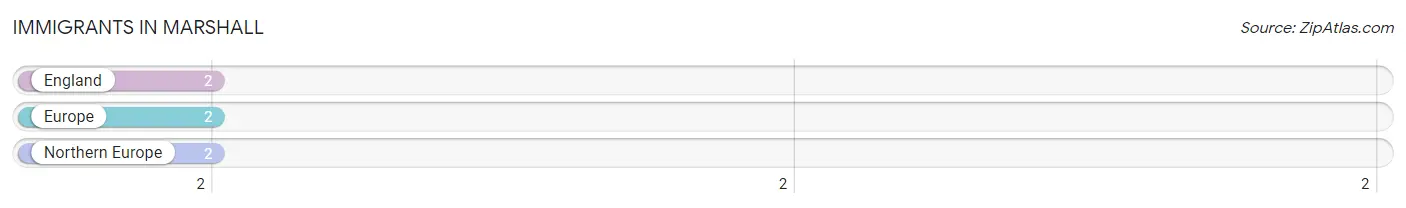
Immigrants in Marshall
The most numerous immigrant groups reported in Marshall came from England (2 | 0.6%), Europe (2 | 0.6%), and Northern Europe (2 | 0.6%), together accounting for 1.8% of all Marshall residents.
| Immigration Origin | # Population | % Population |
| England | 2 | 0.6% |
| Europe | 2 | 0.6% |
| Northern Europe | 2 | 0.6% | View All 3 Rows |
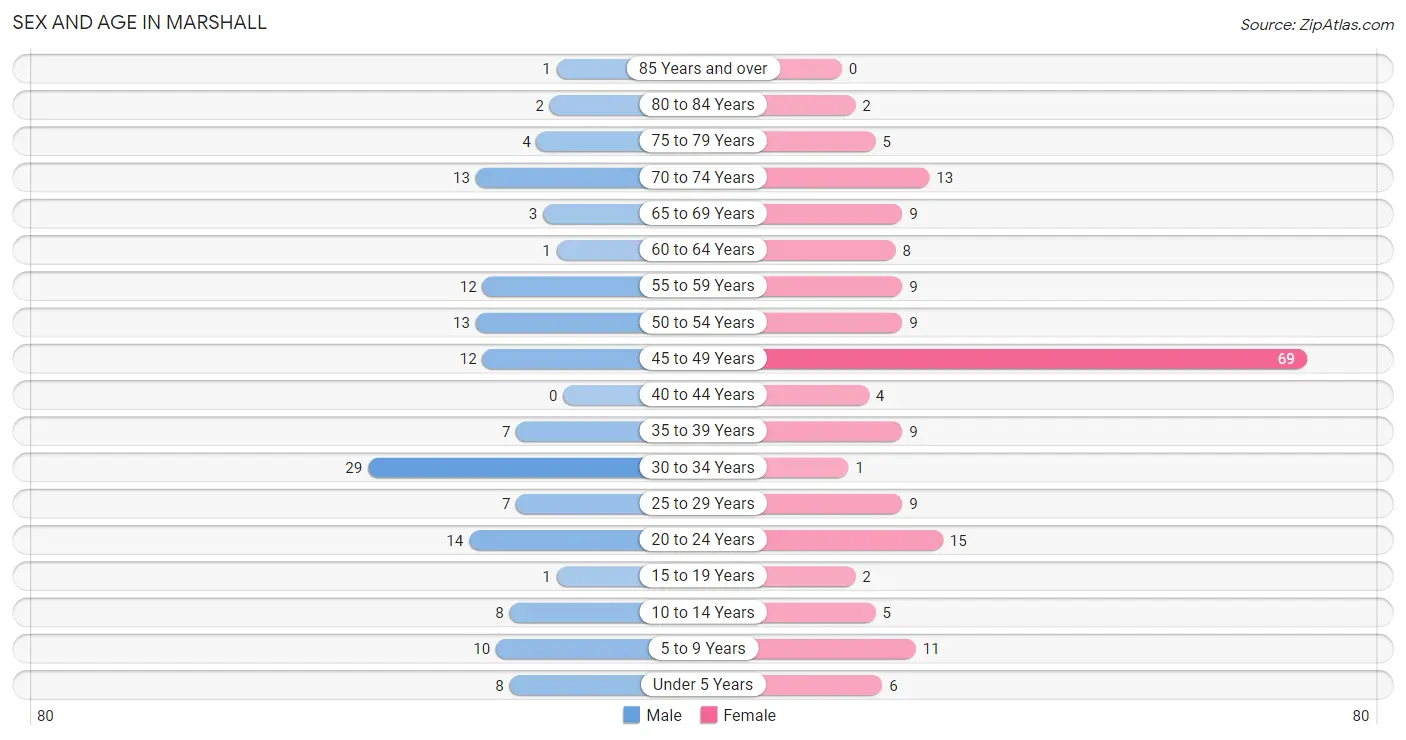
Sex and Age in Marshall
Sex and Age in Marshall
The most populous age groups in Marshall are 30 to 34 Years (29 | 20.0%) for men and 45 to 49 Years (69 | 37.1%) for women.
| Age Bracket | Male | Female |
| Under 5 Years | 8 (5.5%) | 6 (3.2%) |
| 5 to 9 Years | 10 (6.9%) | 11 (5.9%) |
| 10 to 14 Years | 8 (5.5%) | 5 (2.7%) |
| 15 to 19 Years | 1 (0.7%) | 2 (1.1%) |
| 20 to 24 Years | 14 (9.7%) | 15 (8.1%) |
| 25 to 29 Years | 7 (4.8%) | 9 (4.8%) |
| 30 to 34 Years | 29 (20.0%) | 1 (0.5%) |
| 35 to 39 Years | 7 (4.8%) | 9 (4.8%) |
| 40 to 44 Years | 0 (0.0%) | 4 (2.1%) |
| 45 to 49 Years | 12 (8.3%) | 69 (37.1%) |
| 50 to 54 Years | 13 (9.0%) | 9 (4.8%) |
| 55 to 59 Years | 12 (8.3%) | 9 (4.8%) |
| 60 to 64 Years | 1 (0.7%) | 8 (4.3%) |
| 65 to 69 Years | 3 (2.1%) | 9 (4.8%) |
| 70 to 74 Years | 13 (9.0%) | 13 (7.0%) |
| 75 to 79 Years | 4 (2.8%) | 5 (2.7%) |
| 80 to 84 Years | 2 (1.4%) | 2 (1.1%) |
| 85 Years and over | 1 (0.7%) | 0 (0.0%) |
| Total | 145 (100.0%) | 186 (100.0%) |
Families and Households in Marshall
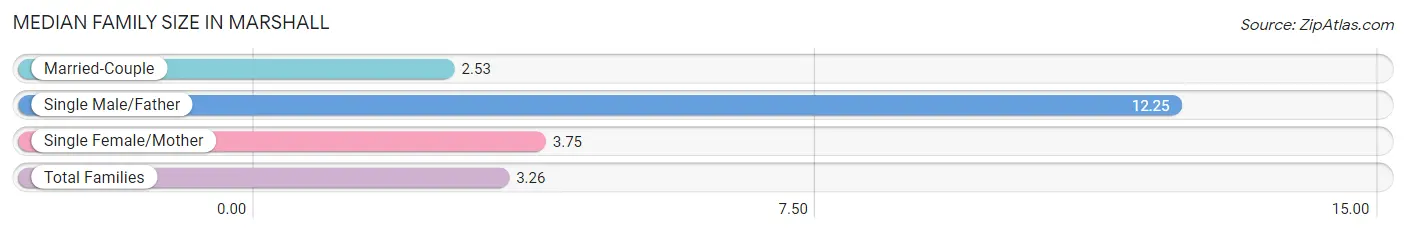
Median Family Size in Marshall
The median family size in Marshall is 3.26 persons per family, with single male/father families (4 | 5.4%) accounting for the largest median family size of 12.25 persons per family. On the other hand, married-couple families (58 | 78.4%) represent the smallest median family size with 2.53 persons per family.
| Family Type | # Families | Family Size |
| Married-Couple | 58 (78.4%) | 2.53 |
| Single Male/Father | 4 (5.4%) | 12.25 |
| Single Female/Mother | 12 (16.2%) | 3.75 |
| Total Families | 74 (100.0%) | 3.26 |
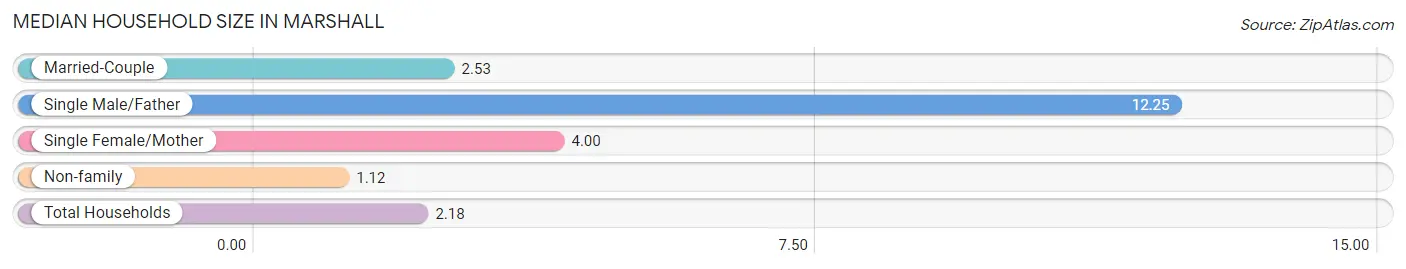
Median Household Size in Marshall
The median household size in Marshall is 2.18 persons per household, with single male/father households (4 | 2.6%) accounting for the largest median household size of 12.25 persons per household. non-family households (78 | 51.3%) represent the smallest median household size with 1.12 persons per household.
| Household Type | # Households | Household Size |
| Married-Couple | 58 (38.2%) | 2.53 |
| Single Male/Father | 4 (2.6%) | 12.25 |
| Single Female/Mother | 12 (7.9%) | 4.00 |
| Non-family | 78 (51.3%) | 1.12 |
| Total Households | 152 (100.0%) | 2.18 |
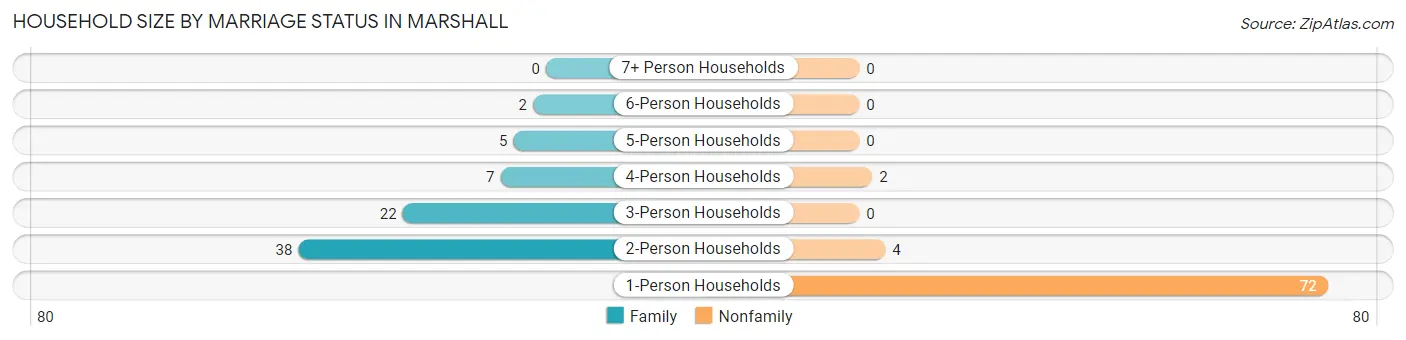
Household Size by Marriage Status in Marshall
Out of a total of 152 households in Marshall, 74 (48.7%) are family households, while 78 (51.3%) are nonfamily households. The most numerous type of family households are 2-person households, comprising 38, and the most common type of nonfamily households are 1-person households, comprising 72.
| Household Size | Family Households | Nonfamily Households |
| 1-Person Households | - | 72 (47.4%) |
| 2-Person Households | 38 (25.0%) | 4 (2.6%) |
| 3-Person Households | 22 (14.5%) | 0 (0.0%) |
| 4-Person Households | 7 (4.6%) | 2 (1.3%) |
| 5-Person Households | 5 (3.3%) | 0 (0.0%) |
| 6-Person Households | 2 (1.3%) | 0 (0.0%) |
| 7+ Person Households | 0 (0.0%) | 0 (0.0%) |
| Total | 74 (48.7%) | 78 (51.3%) |
Female Fertility in Marshall
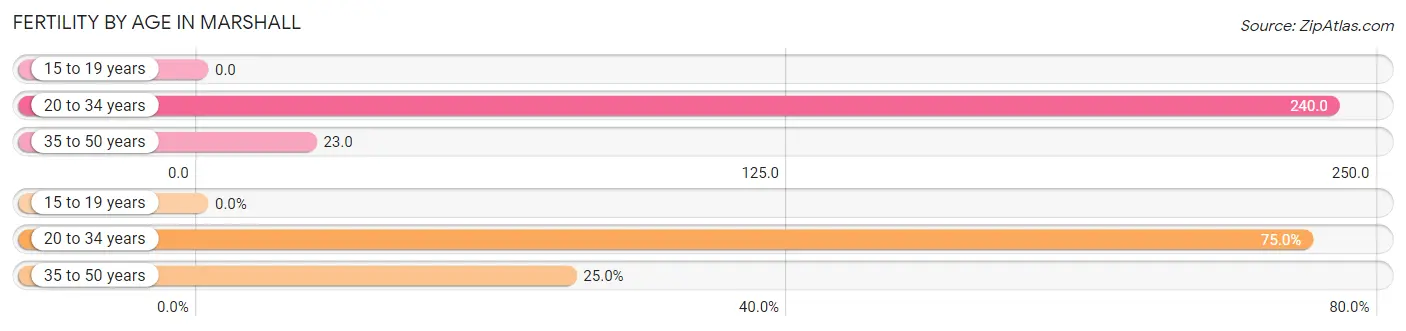
Fertility by Age in Marshall
Average fertility rate in Marshall is 70.0 births per 1,000 women. Women in the age bracket of 20 to 34 years have the highest fertility rate with 240.0 births per 1,000 women. Women in the age bracket of 20 to 34 years acount for 75.0% of all women with births.
| Age Bracket | Women with Births | Births / 1,000 Women |
| 15 to 19 years | 0 (0.0%) | 0.0 |
| 20 to 34 years | 6 (75.0%) | 240.0 |
| 35 to 50 years | 2 (25.0%) | 23.0 |
| Total | 8 (100.0%) | 70.0 |
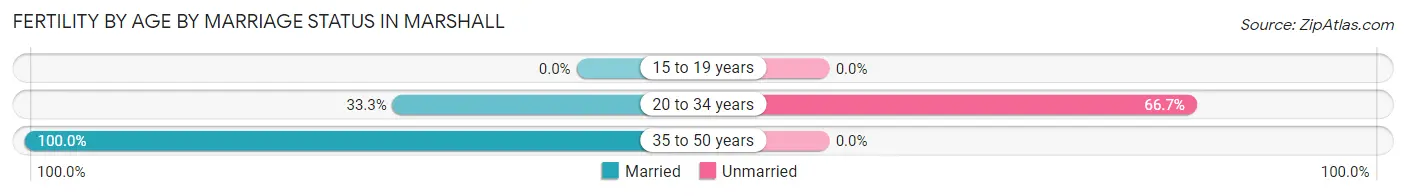
Fertility by Age by Marriage Status in Marshall
50.0% of women with births (8) in Marshall are married. The highest percentage of unmarried women with births falls into 20 to 34 years age bracket with 66.7% of them unmarried at the time of birth, while the lowest percentage of unmarried women with births belong to 35 to 50 years age bracket with 0.0% of them unmarried.
| Age Bracket | Married | Unmarried |
| 15 to 19 years | 0 (0.0%) | 0 (0.0%) |
| 20 to 34 years | 2 (33.3%) | 4 (66.7%) |
| 35 to 50 years | 2 (100.0%) | 0 (0.0%) |
| Total | 4 (50.0%) | 4 (50.0%) |
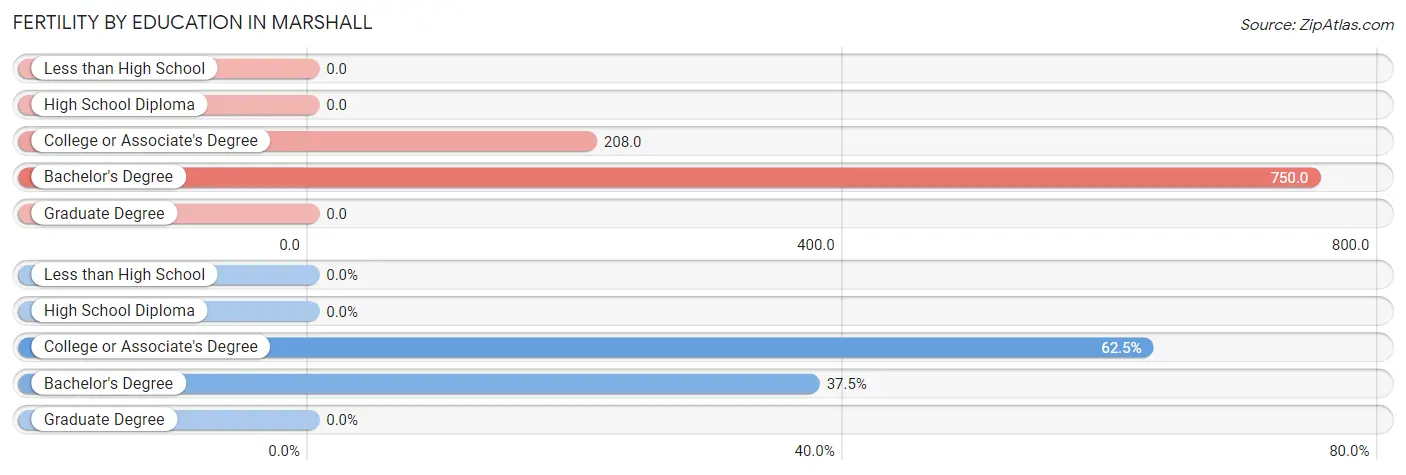
Fertility by Education in Marshall
| Educational Attainment | Women with Births | Births / 1,000 Women |
| Less than High School | 0 (0.0%) | 0.0 |
| High School Diploma | 0 (0.0%) | 0.0 |
| College or Associate's Degree | 5 (62.5%) | 208.0 |
| Bachelor's Degree | 3 (37.5%) | 750.0 |
| Graduate Degree | 0 (0.0%) | 0.0 |
| Total | 8 (100.0%) | 70.0 |
Fertility by Education by Marriage Status in Marshall
50.0% of women with births in Marshall are unmarried. Women with the educational attainment of bachelor's degree are most likely to be married with 100.0% of them married at childbirth, while women with the educational attainment of college or associate's degree are least likely to be married with 80.0% of them unmarried at childbirth.
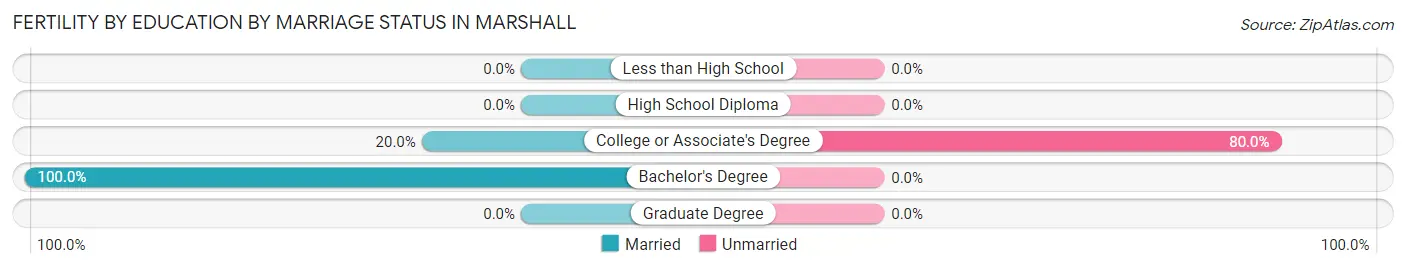
| Educational Attainment | Married | Unmarried |
| Less than High School | 0 (0.0%) | 0 (0.0%) |
| High School Diploma | 0 (0.0%) | 0 (0.0%) |
| College or Associate's Degree | 1 (20.0%) | 4 (80.0%) |
| Bachelor's Degree | 3 (100.0%) | 0 (0.0%) |
| Graduate Degree | 0 (0.0%) | 0 (0.0%) |
| Total | 4 (50.0%) | 4 (50.0%) |
Employment Characteristics in Marshall
Employment by Class of Employer in Marshall
Among the 142 employed individuals in Marshall, private company employees (87 | 61.3%), state government employees (20 | 14.1%), and local government employees (12 | 8.5%) make up the most common classes of employment.
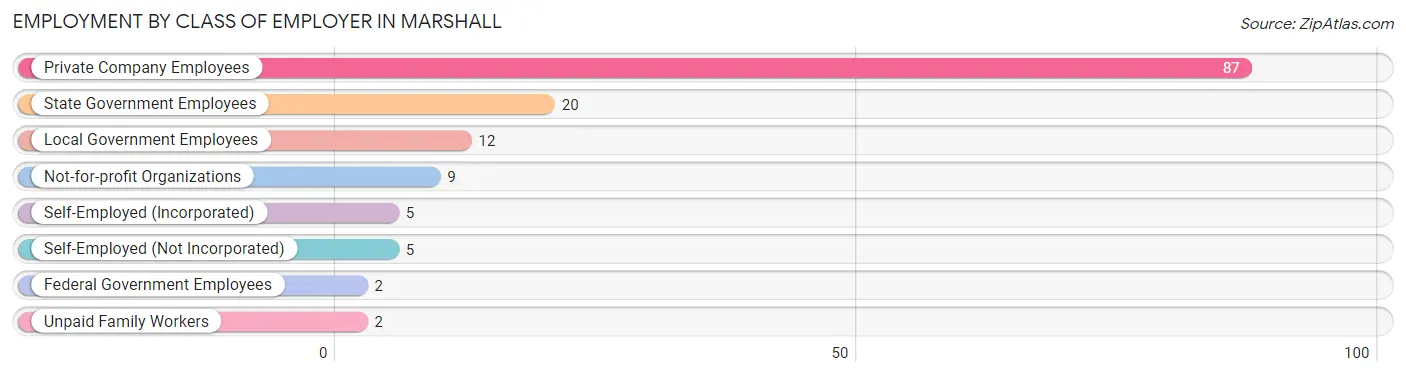
| Employer Class | # Employees | % Employees |
| Private Company Employees | 87 | 61.3% |
| Self-Employed (Incorporated) | 5 | 3.5% |
| Self-Employed (Not Incorporated) | 5 | 3.5% |
| Not-for-profit Organizations | 9 | 6.3% |
| Local Government Employees | 12 | 8.5% |
| State Government Employees | 20 | 14.1% |
| Federal Government Employees | 2 | 1.4% |
| Unpaid Family Workers | 2 | 1.4% |
| Total | 142 | 100.0% |
Employment Status by Age in Marshall
According to the labor force statistics for Marshall, out of the total population over 16 years of age (282), 70.6% or 199 individuals are in the labor force, with 2.0% or 4 of them unemployed. The age group with the highest labor force participation rate is 25 to 29 years, with 100.0% or 16 individuals in the labor force. Within the labor force, the 20 to 24 years age range has the highest percentage of unemployed individuals, with 14.8% or 4 of them being unemployed.
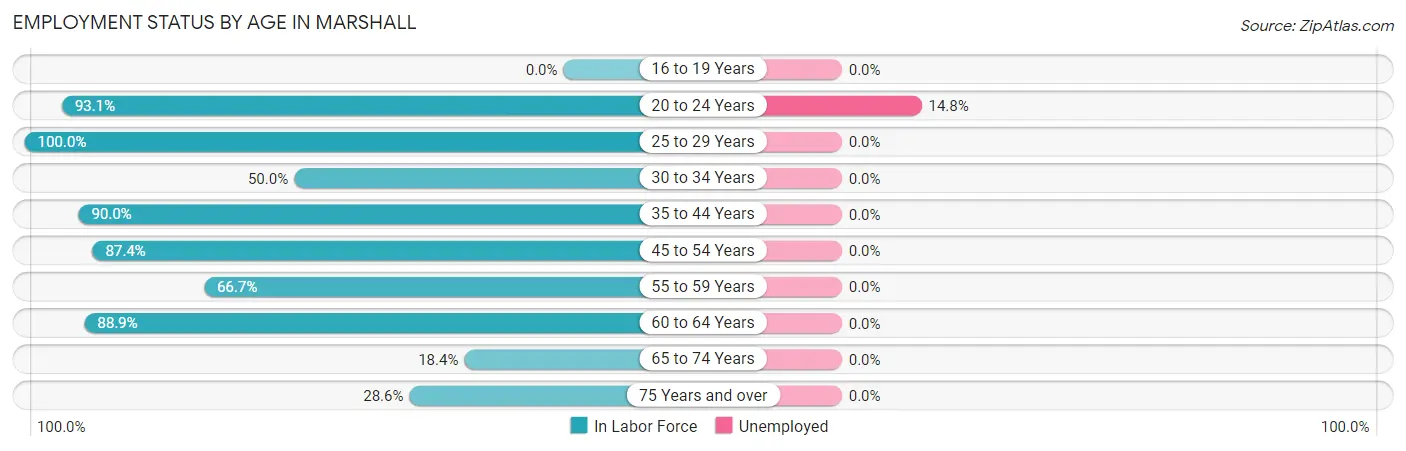
| Age Bracket | In Labor Force | Unemployed |
| 16 to 19 Years | 0 (0.0%) | 0 (0.0%) |
| 20 to 24 Years | 27 (93.1%) | 4 (14.8%) |
| 25 to 29 Years | 16 (100.0%) | 0 (0.0%) |
| 30 to 34 Years | 15 (50.0%) | 0 (0.0%) |
| 35 to 44 Years | 18 (90.0%) | 0 (0.0%) |
| 45 to 54 Years | 90 (87.4%) | 0 (0.0%) |
| 55 to 59 Years | 14 (66.7%) | 0 (0.0%) |
| 60 to 64 Years | 8 (88.9%) | 0 (0.0%) |
| 65 to 74 Years | 7 (18.4%) | 0 (0.0%) |
| 75 Years and over | 4 (28.6%) | 0 (0.0%) |
| Total | 199 (70.6%) | 4 (2.0%) |
Employment Status by Educational Attainment in Marshall
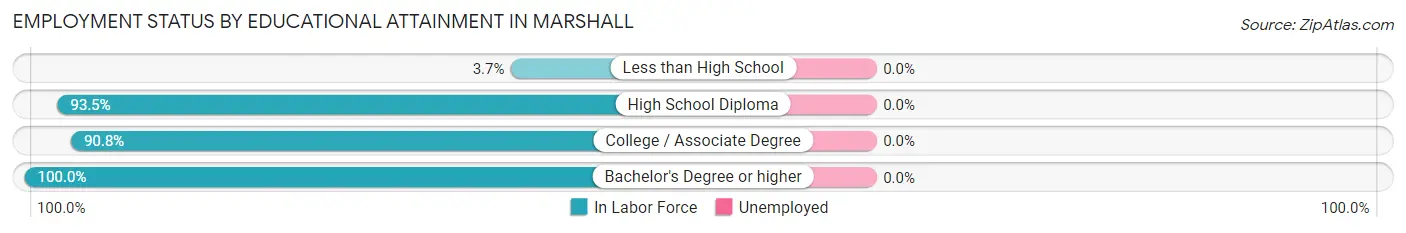
| Educational Attainment | In Labor Force | Unemployed |
| Less than High School | 1 (3.7%) | 0 (0.0%) |
| High School Diploma | 86 (93.5%) | 0 (0.0%) |
| College / Associate Degree | 59 (90.8%) | 0 (0.0%) |
| Bachelor's Degree or higher | 15 (100.0%) | 0 (0.0%) |
| Total | 161 (80.9%) | 0 (0.0%) |
Employment Occupations by Sex in Marshall
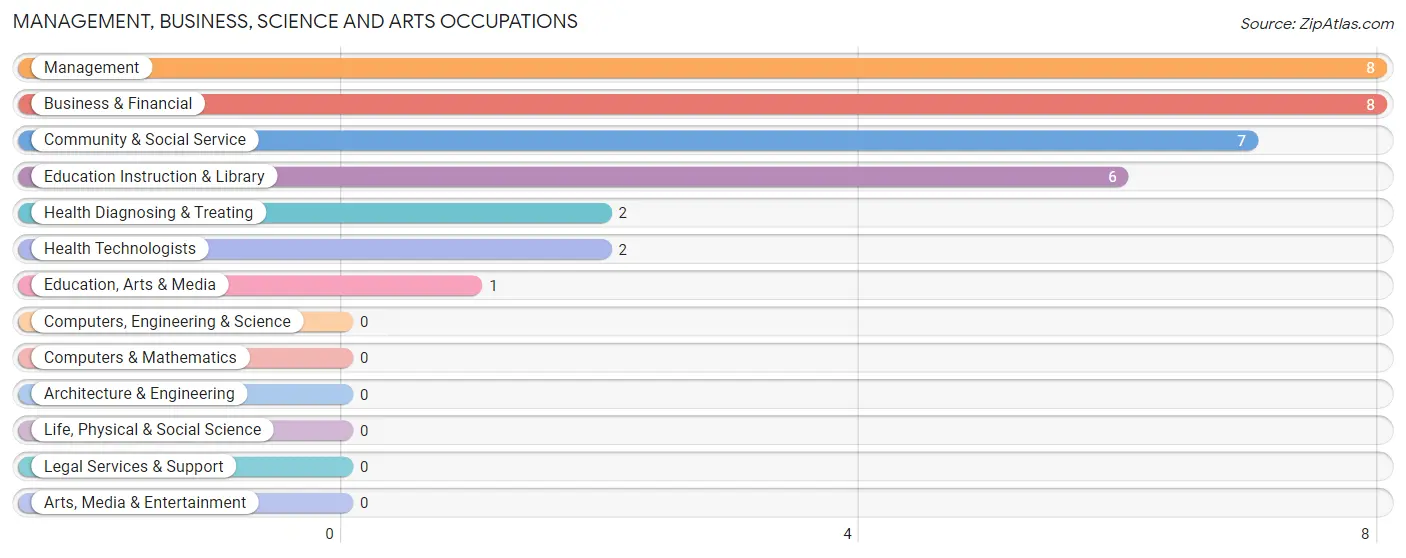
Management, Business, Science and Arts Occupations
The most common Management, Business, Science and Arts occupations in Marshall are Management (8 | 4.1%), Business & Financial (8 | 4.1%), Community & Social Service (7 | 3.6%), Education Instruction & Library (6 | 3.1%), and Health Diagnosing & Treating (2 | 1.0%).
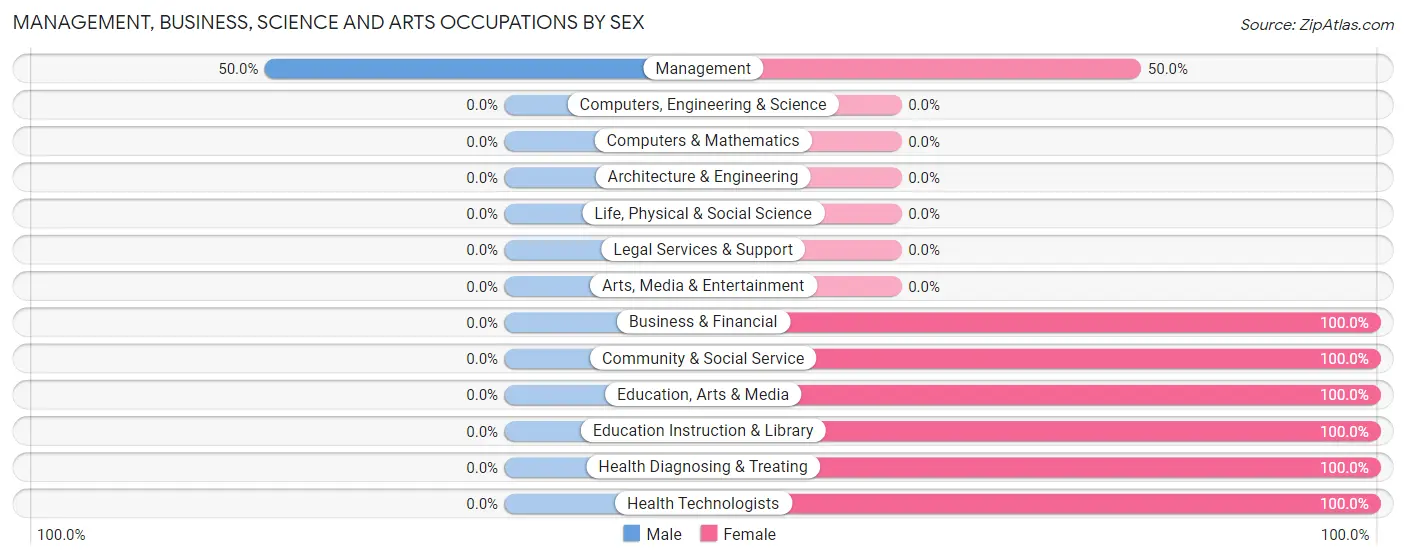
Management, Business, Science and Arts Occupations by Sex
| Occupation | Male | Female |
| Management | 4 (50.0%) | 4 (50.0%) |
| Business & Financial | 0 (0.0%) | 8 (100.0%) |
| Computers, Engineering & Science | 0 (0.0%) | 0 (0.0%) |
| Computers & Mathematics | 0 (0.0%) | 0 (0.0%) |
| Architecture & Engineering | 0 (0.0%) | 0 (0.0%) |
| Life, Physical & Social Science | 0 (0.0%) | 0 (0.0%) |
| Community & Social Service | 0 (0.0%) | 7 (100.0%) |
| Education, Arts & Media | 0 (0.0%) | 1 (100.0%) |
| Legal Services & Support | 0 (0.0%) | 0 (0.0%) |
| Education Instruction & Library | 0 (0.0%) | 6 (100.0%) |
| Arts, Media & Entertainment | 0 (0.0%) | 0 (0.0%) |
| Health Diagnosing & Treating | 0 (0.0%) | 2 (100.0%) |
| Health Technologists | 0 (0.0%) | 2 (100.0%) |
| Total (Category) | 4 (16.0%) | 21 (84.0%) |
| Total (Overall) | 75 (38.5%) | 120 (61.5%) |
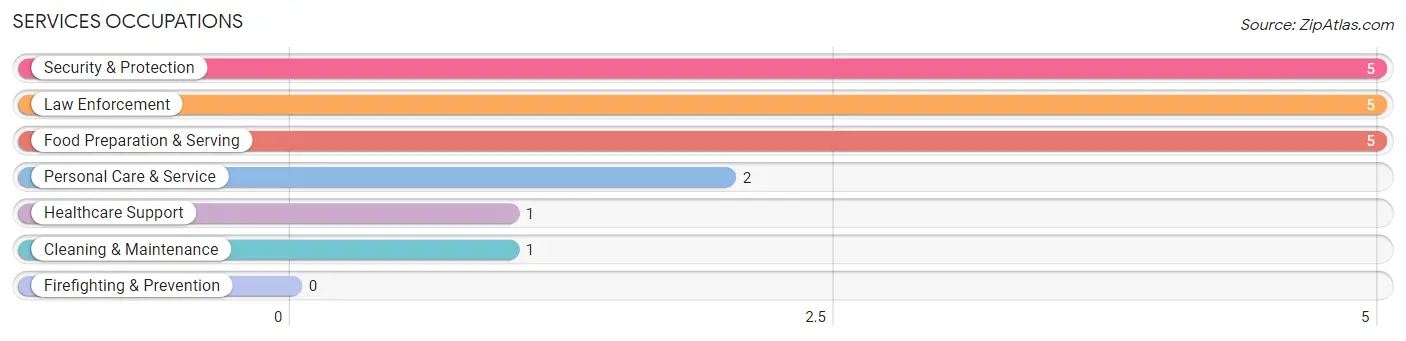
Services Occupations
The most common Services occupations in Marshall are Security & Protection (5 | 2.6%), Law Enforcement (5 | 2.6%), Food Preparation & Serving (5 | 2.6%), Personal Care & Service (2 | 1.0%), and Healthcare Support (1 | 0.5%).
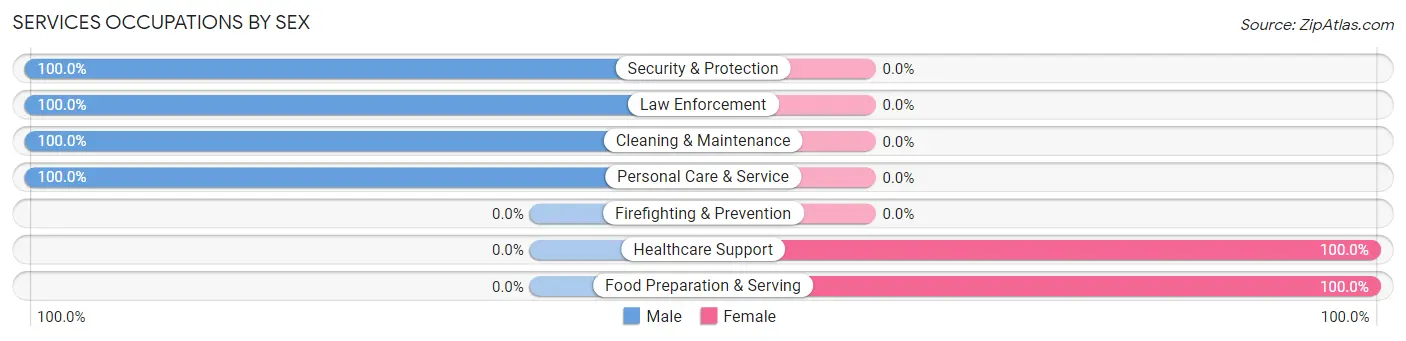
Services Occupations by Sex
Within the Services occupations in Marshall, the most male-oriented occupations are Security & Protection (100.0%), Law Enforcement (100.0%), and Cleaning & Maintenance (100.0%), while the most female-oriented occupations are Healthcare Support (100.0%), and Food Preparation & Serving (100.0%).
| Occupation | Male | Female |
| Healthcare Support | 0 (0.0%) | 1 (100.0%) |
| Security & Protection | 5 (100.0%) | 0 (0.0%) |
| Firefighting & Prevention | 0 (0.0%) | 0 (0.0%) |
| Law Enforcement | 5 (100.0%) | 0 (0.0%) |
| Food Preparation & Serving | 0 (0.0%) | 5 (100.0%) |
| Cleaning & Maintenance | 1 (100.0%) | 0 (0.0%) |
| Personal Care & Service | 2 (100.0%) | 0 (0.0%) |
| Total (Category) | 8 (57.1%) | 6 (42.9%) |
| Total (Overall) | 75 (38.5%) | 120 (61.5%) |
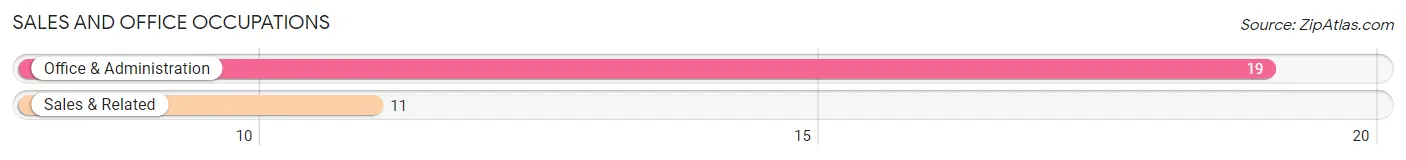
Sales and Office Occupations
The most common Sales and Office occupations in Marshall are Office & Administration (19 | 9.7%), and Sales & Related (11 | 5.6%).
Sales and Office Occupations by Sex
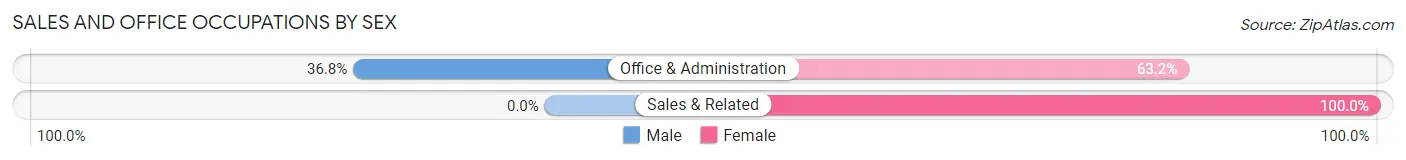
| Occupation | Male | Female |
| Sales & Related | 0 (0.0%) | 11 (100.0%) |
| Office & Administration | 7 (36.8%) | 12 (63.2%) |
| Total (Category) | 7 (23.3%) | 23 (76.7%) |
| Total (Overall) | 75 (38.5%) | 120 (61.5%) |
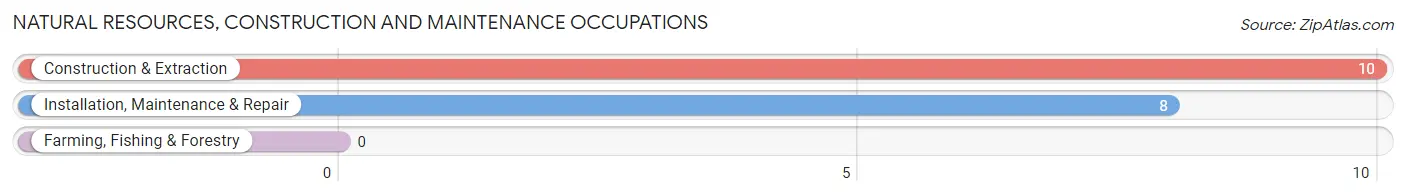
Natural Resources, Construction and Maintenance Occupations
The most common Natural Resources, Construction and Maintenance occupations in Marshall are Construction & Extraction (10 | 5.1%), and Installation, Maintenance & Repair (8 | 4.1%).
Natural Resources, Construction and Maintenance Occupations by Sex
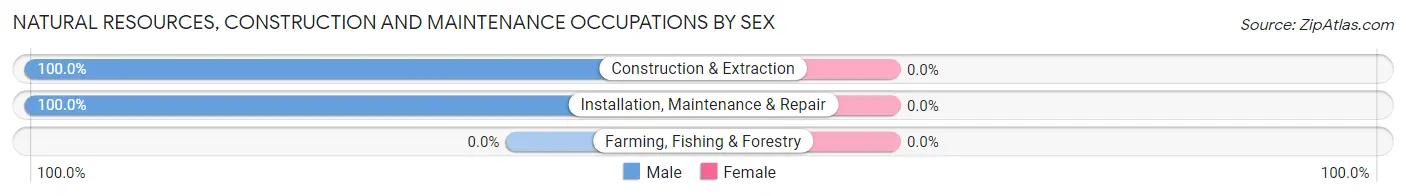
| Occupation | Male | Female |
| Farming, Fishing & Forestry | 0 (0.0%) | 0 (0.0%) |
| Construction & Extraction | 10 (100.0%) | 0 (0.0%) |
| Installation, Maintenance & Repair | 8 (100.0%) | 0 (0.0%) |
| Total (Category) | 18 (100.0%) | 0 (0.0%) |
| Total (Overall) | 75 (38.5%) | 120 (61.5%) |
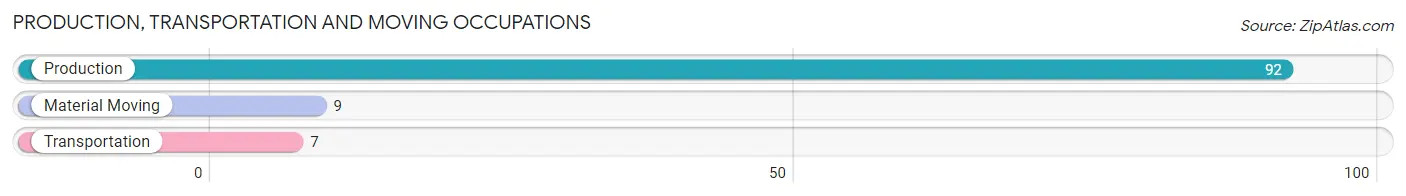
Production, Transportation and Moving Occupations
The most common Production, Transportation and Moving occupations in Marshall are Production (92 | 47.2%), Material Moving (9 | 4.6%), and Transportation (7 | 3.6%).
Production, Transportation and Moving Occupations by Sex
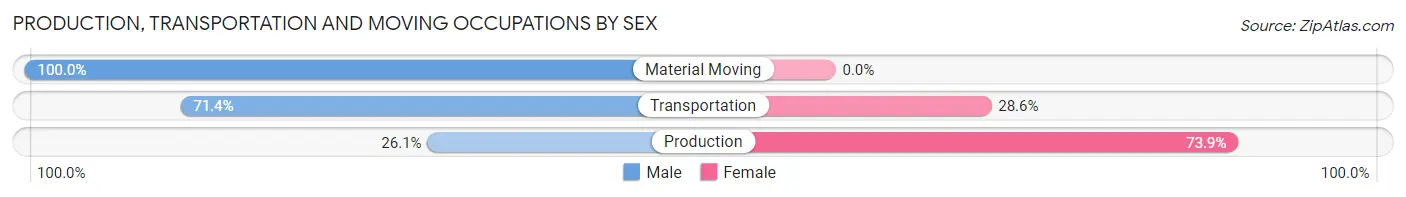
| Occupation | Male | Female |
| Production | 24 (26.1%) | 68 (73.9%) |
| Transportation | 5 (71.4%) | 2 (28.6%) |
| Material Moving | 9 (100.0%) | 0 (0.0%) |
| Total (Category) | 38 (35.2%) | 70 (64.8%) |
| Total (Overall) | 75 (38.5%) | 120 (61.5%) |
Employment Industries by Sex in Marshall
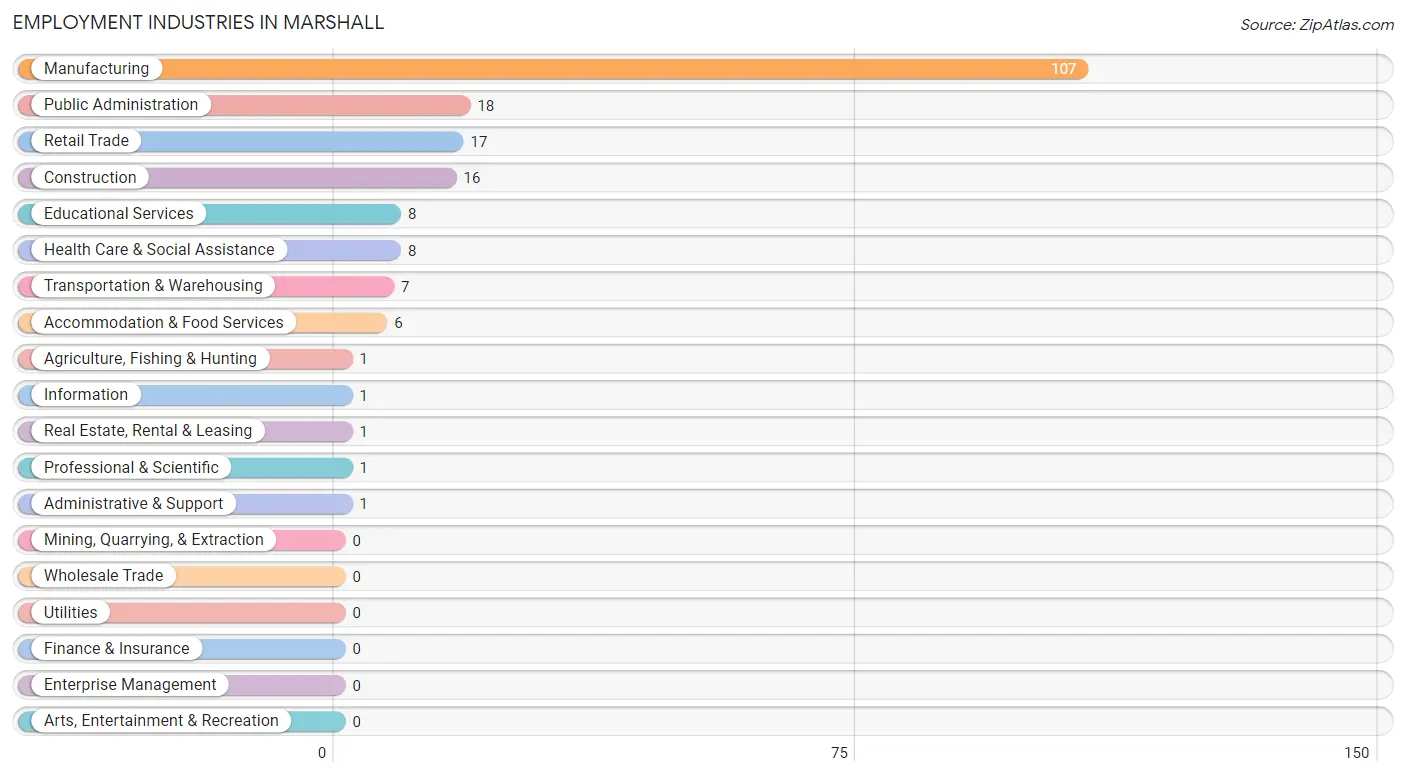
Employment Industries in Marshall
The major employment industries in Marshall include Manufacturing (107 | 54.9%), Public Administration (18 | 9.2%), Retail Trade (17 | 8.7%), Construction (16 | 8.2%), and Educational Services (8 | 4.1%).
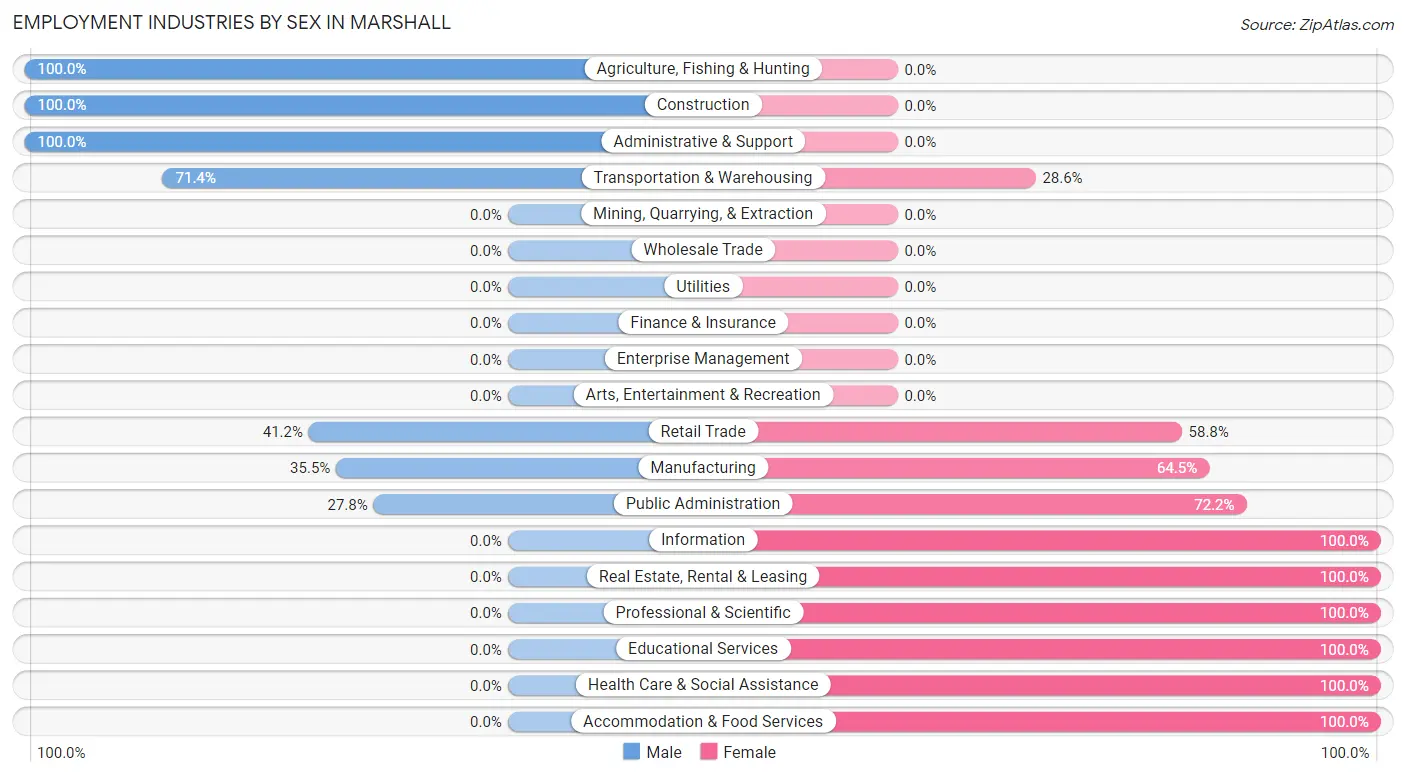
Employment Industries by Sex in Marshall
The Marshall industries that see more men than women are Agriculture, Fishing & Hunting (100.0%), Construction (100.0%), and Administrative & Support (100.0%), whereas the industries that tend to have a higher number of women are Information (100.0%), Real Estate, Rental & Leasing (100.0%), and Professional & Scientific (100.0%).
| Industry | Male | Female |
| Agriculture, Fishing & Hunting | 1 (100.0%) | 0 (0.0%) |
| Mining, Quarrying, & Extraction | 0 (0.0%) | 0 (0.0%) |
| Construction | 16 (100.0%) | 0 (0.0%) |
| Manufacturing | 38 (35.5%) | 69 (64.5%) |
| Wholesale Trade | 0 (0.0%) | 0 (0.0%) |
| Retail Trade | 7 (41.2%) | 10 (58.8%) |
| Transportation & Warehousing | 5 (71.4%) | 2 (28.6%) |
| Utilities | 0 (0.0%) | 0 (0.0%) |
| Information | 0 (0.0%) | 1 (100.0%) |
| Finance & Insurance | 0 (0.0%) | 0 (0.0%) |
| Real Estate, Rental & Leasing | 0 (0.0%) | 1 (100.0%) |
| Professional & Scientific | 0 (0.0%) | 1 (100.0%) |
| Enterprise Management | 0 (0.0%) | 0 (0.0%) |
| Administrative & Support | 1 (100.0%) | 0 (0.0%) |
| Educational Services | 0 (0.0%) | 8 (100.0%) |
| Health Care & Social Assistance | 0 (0.0%) | 8 (100.0%) |
| Arts, Entertainment & Recreation | 0 (0.0%) | 0 (0.0%) |
| Accommodation & Food Services | 0 (0.0%) | 6 (100.0%) |
| Public Administration | 5 (27.8%) | 13 (72.2%) |
| Total | 75 (38.5%) | 120 (61.5%) |
Education in Marshall
School Enrollment in Marshall
The most common levels of schooling among the 43 students in Marshall are elementary school (20 | 46.5%), middle school (10 | 23.3%), and college / undergraduate (6 | 14.0%).
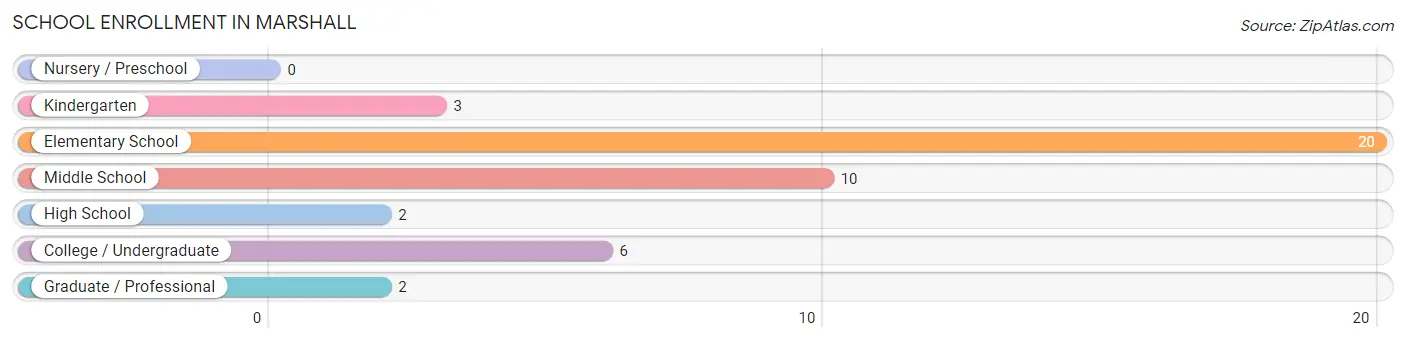
| School Level | # Students | % Students |
| Nursery / Preschool | 0 | 0.0% |
| Kindergarten | 3 | 7.0% |
| Elementary School | 20 | 46.5% |
| Middle School | 10 | 23.3% |
| High School | 2 | 4.6% |
| College / Undergraduate | 6 | 14.0% |
| Graduate / Professional | 2 | 4.6% |
| Total | 43 | 100.0% |
School Enrollment by Age by Funding Source in Marshall
Out of a total of 43 students who are enrolled in schools in Marshall, 4 (9.3%) attend a private institution, while the remaining 39 (90.7%) are enrolled in public schools. The age group of 18 to 19 year olds has the highest likelihood of being enrolled in private schools, with 2 (100.0% in the age bracket) enrolled. Conversely, the age group of 5 to 9 year old has the lowest likelihood of being enrolled in a private school, with 21 (100.0% in the age bracket) attending a public institution.
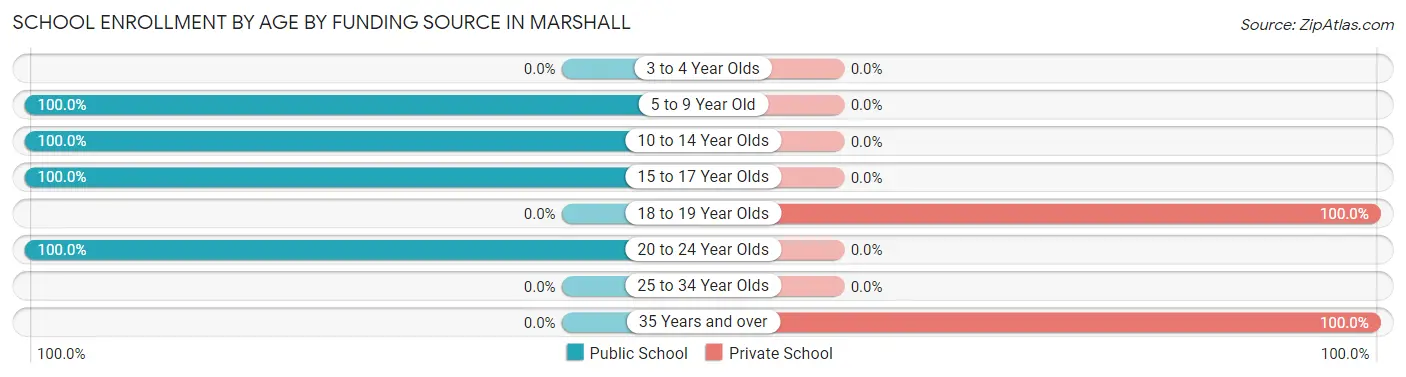
| Age Bracket | Public School | Private School |
| 3 to 4 Year Olds | 0 (0.0%) | 0 (0.0%) |
| 5 to 9 Year Old | 21 (100.0%) | 0 (0.0%) |
| 10 to 14 Year Olds | 13 (100.0%) | 0 (0.0%) |
| 15 to 17 Year Olds | 1 (100.0%) | 0 (0.0%) |
| 18 to 19 Year Olds | 0 (0.0%) | 2 (100.0%) |
| 20 to 24 Year Olds | 4 (100.0%) | 0 (0.0%) |
| 25 to 34 Year Olds | 0 (0.0%) | 0 (0.0%) |
| 35 Years and over | 0 (0.0%) | 2 (100.0%) |
| Total | 39 (90.7%) | 4 (9.3%) |
Educational Attainment by Field of Study in Marshall
Education (7 | 36.8%), business (5 | 26.3%), arts & humanities (4 | 21.0%), science & technology (2 | 10.5%), and communications (1 | 5.3%) are the most common fields of study among 19 individuals in Marshall who have obtained a bachelor's degree or higher.
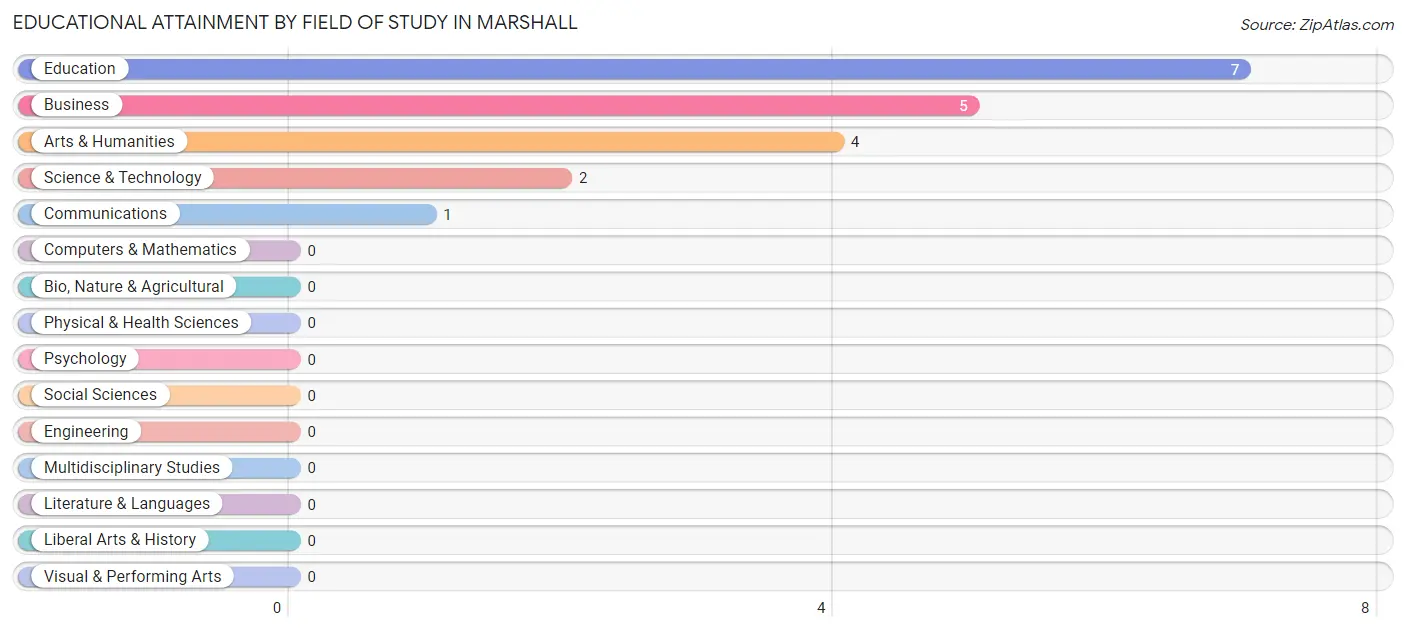
| Field of Study | # Graduates | % Graduates |
| Computers & Mathematics | 0 | 0.0% |
| Bio, Nature & Agricultural | 0 | 0.0% |
| Physical & Health Sciences | 0 | 0.0% |
| Psychology | 0 | 0.0% |
| Social Sciences | 0 | 0.0% |
| Engineering | 0 | 0.0% |
| Multidisciplinary Studies | 0 | 0.0% |
| Science & Technology | 2 | 10.5% |
| Business | 5 | 26.3% |
| Education | 7 | 36.8% |
| Literature & Languages | 0 | 0.0% |
| Liberal Arts & History | 0 | 0.0% |
| Visual & Performing Arts | 0 | 0.0% |
| Communications | 1 | 5.3% |
| Arts & Humanities | 4 | 21.0% |
| Total | 19 | 100.0% |
Transportation & Commute in Marshall
Vehicle Availability by Sex in Marshall
The most prevalent vehicle ownership categories in Marshall are males with 2 vehicles (28, accounting for 37.3%) and females with 2 vehicles (19, making up 41.8%).
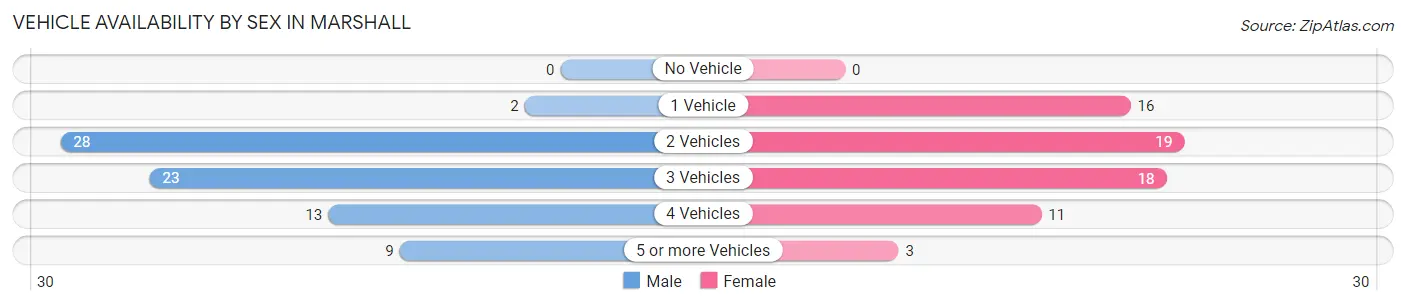
| Vehicles Available | Male | Female |
| No Vehicle | 0 (0.0%) | 0 (0.0%) |
| 1 Vehicle | 2 (2.7%) | 16 (23.9%) |
| 2 Vehicles | 28 (37.3%) | 19 (28.4%) |
| 3 Vehicles | 23 (30.7%) | 18 (26.9%) |
| 4 Vehicles | 13 (17.3%) | 11 (16.4%) |
| 5 or more Vehicles | 9 (12.0%) | 3 (4.5%) |
| Total | 75 (100.0%) | 67 (100.0%) |
Commute Time in Marshall
The most frequently occuring commute durations in Marshall are 30 to 34 minutes (32 commuters, 23.5%), 15 to 19 minutes (14 commuters, 10.3%), and 20 to 24 minutes (14 commuters, 10.3%).
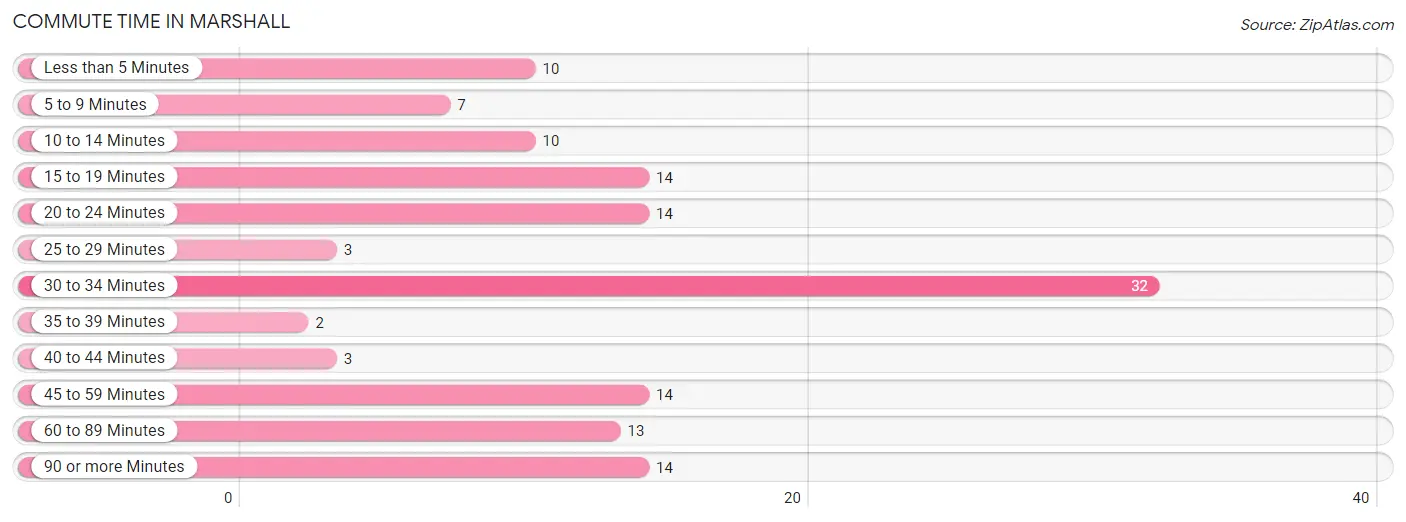
| Commute Time | # Commuters | % Commuters |
| Less than 5 Minutes | 10 | 7.3% |
| 5 to 9 Minutes | 7 | 5.1% |
| 10 to 14 Minutes | 10 | 7.3% |
| 15 to 19 Minutes | 14 | 10.3% |
| 20 to 24 Minutes | 14 | 10.3% |
| 25 to 29 Minutes | 3 | 2.2% |
| 30 to 34 Minutes | 32 | 23.5% |
| 35 to 39 Minutes | 2 | 1.5% |
| 40 to 44 Minutes | 3 | 2.2% |
| 45 to 59 Minutes | 14 | 10.3% |
| 60 to 89 Minutes | 13 | 9.6% |
| 90 or more Minutes | 14 | 10.3% |
Commute Time by Sex in Marshall
The most common commute times in Marshall are 30 to 34 minutes (18 commuters, 25.0%) for males and 30 to 34 minutes (14 commuters, 21.9%) for females.
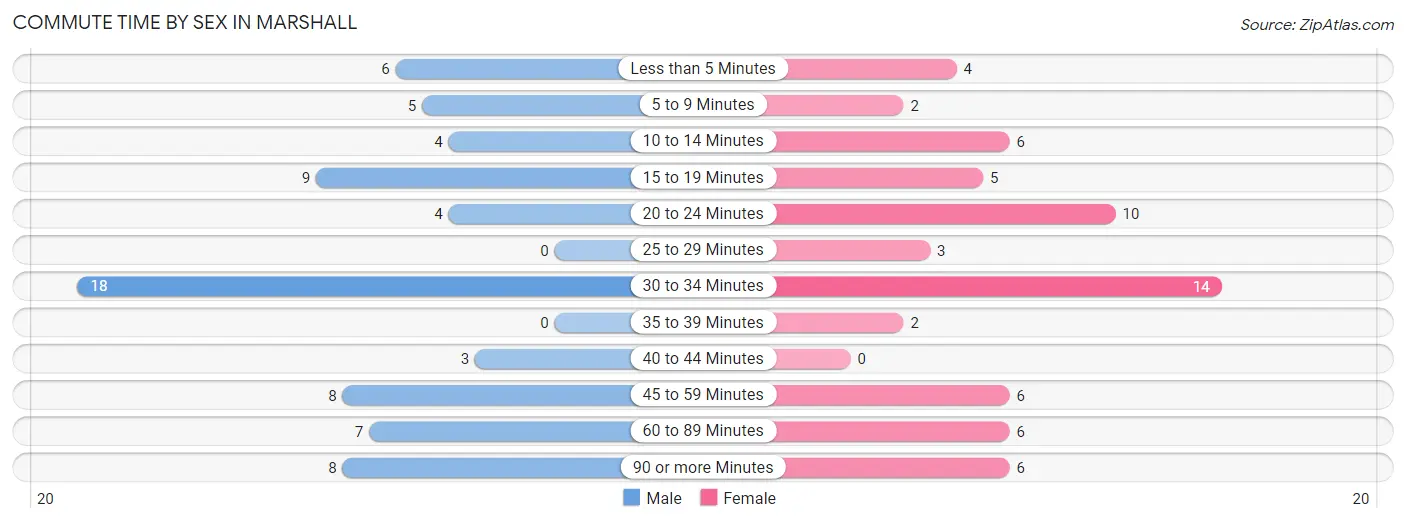
| Commute Time | Male | Female |
| Less than 5 Minutes | 6 (8.3%) | 4 (6.2%) |
| 5 to 9 Minutes | 5 (6.9%) | 2 (3.1%) |
| 10 to 14 Minutes | 4 (5.6%) | 6 (9.4%) |
| 15 to 19 Minutes | 9 (12.5%) | 5 (7.8%) |
| 20 to 24 Minutes | 4 (5.6%) | 10 (15.6%) |
| 25 to 29 Minutes | 0 (0.0%) | 3 (4.7%) |
| 30 to 34 Minutes | 18 (25.0%) | 14 (21.9%) |
| 35 to 39 Minutes | 0 (0.0%) | 2 (3.1%) |
| 40 to 44 Minutes | 3 (4.2%) | 0 (0.0%) |
| 45 to 59 Minutes | 8 (11.1%) | 6 (9.4%) |
| 60 to 89 Minutes | 7 (9.7%) | 6 (9.4%) |
| 90 or more Minutes | 8 (11.1%) | 6 (9.4%) |
Time of Departure to Work by Sex in Marshall
The most frequent times of departure to work in Marshall are 12:00 PM to 3:59 PM (19, 26.4%) for males and 7:30 AM to 7:59 AM (18, 28.1%) for females.
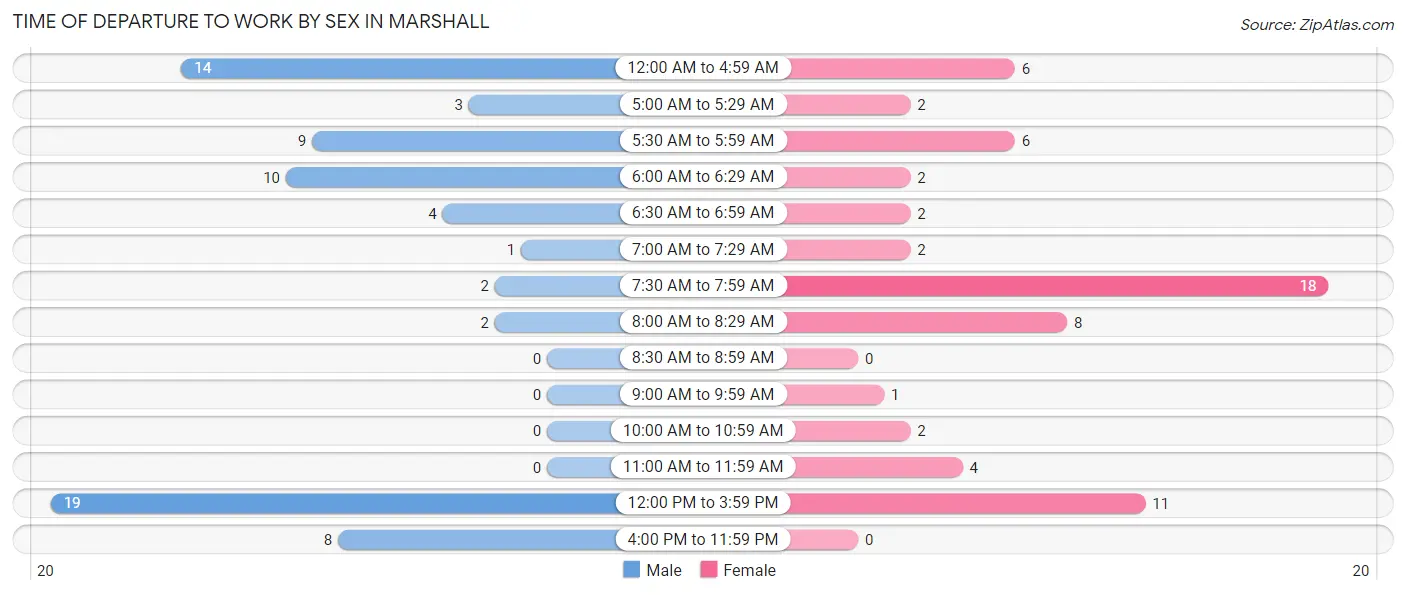
| Time of Departure | Male | Female |
| 12:00 AM to 4:59 AM | 14 (19.4%) | 6 (9.4%) |
| 5:00 AM to 5:29 AM | 3 (4.2%) | 2 (3.1%) |
| 5:30 AM to 5:59 AM | 9 (12.5%) | 6 (9.4%) |
| 6:00 AM to 6:29 AM | 10 (13.9%) | 2 (3.1%) |
| 6:30 AM to 6:59 AM | 4 (5.6%) | 2 (3.1%) |
| 7:00 AM to 7:29 AM | 1 (1.4%) | 2 (3.1%) |
| 7:30 AM to 7:59 AM | 2 (2.8%) | 18 (28.1%) |
| 8:00 AM to 8:29 AM | 2 (2.8%) | 8 (12.5%) |
| 8:30 AM to 8:59 AM | 0 (0.0%) | 0 (0.0%) |
| 9:00 AM to 9:59 AM | 0 (0.0%) | 1 (1.6%) |
| 10:00 AM to 10:59 AM | 0 (0.0%) | 2 (3.1%) |
| 11:00 AM to 11:59 AM | 0 (0.0%) | 4 (6.2%) |
| 12:00 PM to 3:59 PM | 19 (26.4%) | 11 (17.2%) |
| 4:00 PM to 11:59 PM | 8 (11.1%) | 0 (0.0%) |
| Total | 72 (100.0%) | 64 (100.0%) |
Housing Occupancy in Marshall
Occupancy by Ownership in Marshall
Of the total 152 dwellings in Marshall, owner-occupied units account for 92 (60.5%), while renter-occupied units make up 60 (39.5%).
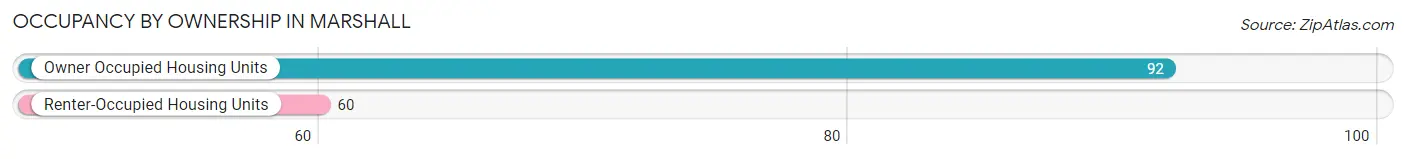
| Occupancy | # Housing Units | % Housing Units |
| Owner Occupied Housing Units | 92 | 60.5% |
| Renter-Occupied Housing Units | 60 | 39.5% |
| Total Occupied Housing Units | 152 | 100.0% |
Occupancy by Household Size in Marshall
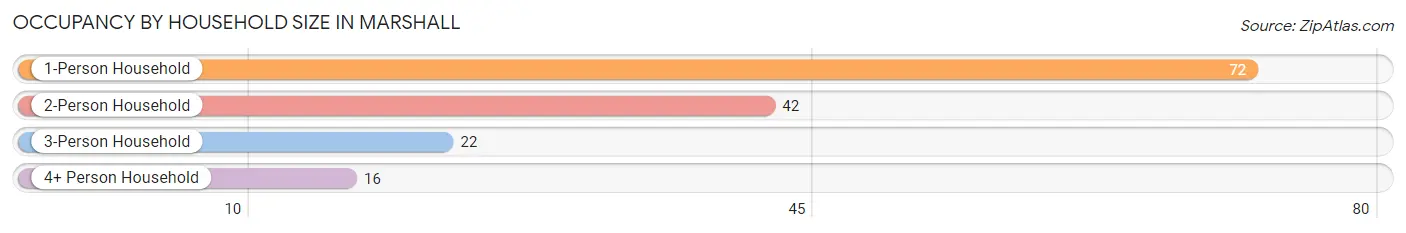
| Household Size | # Housing Units | % Housing Units |
| 1-Person Household | 72 | 47.4% |
| 2-Person Household | 42 | 27.6% |
| 3-Person Household | 22 | 14.5% |
| 4+ Person Household | 16 | 10.5% |
| Total Housing Units | 152 | 100.0% |
Occupancy by Ownership by Household Size in Marshall
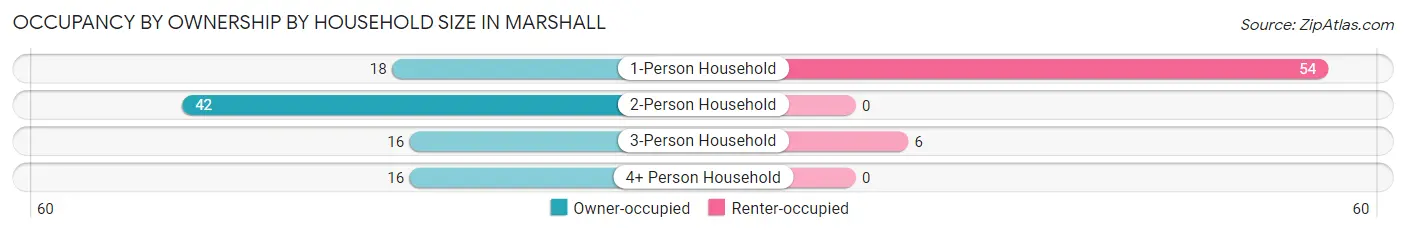
| Household Size | Owner-occupied | Renter-occupied |
| 1-Person Household | 18 (25.0%) | 54 (75.0%) |
| 2-Person Household | 42 (100.0%) | 0 (0.0%) |
| 3-Person Household | 16 (72.7%) | 6 (27.3%) |
| 4+ Person Household | 16 (100.0%) | 0 (0.0%) |
| Total Housing Units | 92 (60.5%) | 60 (39.5%) |
Occupancy by Educational Attainment in Marshall
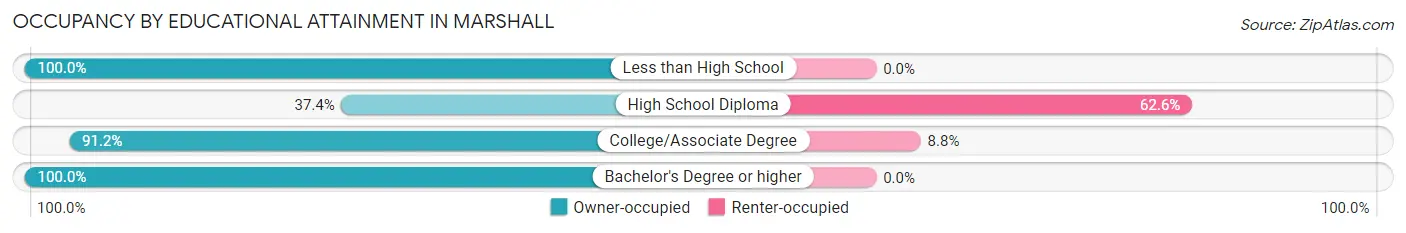
| Household Size | Owner-occupied | Renter-occupied |
| Less than High School | 12 (100.0%) | 0 (0.0%) |
| High School Diploma | 34 (37.4%) | 57 (62.6%) |
| College/Associate Degree | 31 (91.2%) | 3 (8.8%) |
| Bachelor's Degree or higher | 15 (100.0%) | 0 (0.0%) |
Occupancy by Age of Householder in Marshall
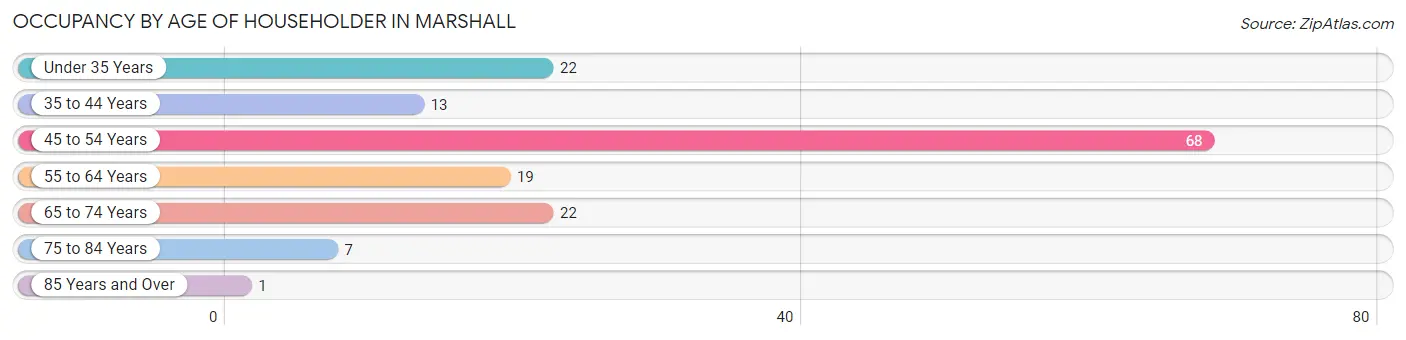
| Age Bracket | # Households | % Households |
| Under 35 Years | 22 | 14.5% |
| 35 to 44 Years | 13 | 8.6% |
| 45 to 54 Years | 68 | 44.7% |
| 55 to 64 Years | 19 | 12.5% |
| 65 to 74 Years | 22 | 14.5% |
| 75 to 84 Years | 7 | 4.6% |
| 85 Years and Over | 1 | 0.7% |
| Total | 152 | 100.0% |
Housing Finances in Marshall
Median Income by Occupancy in Marshall
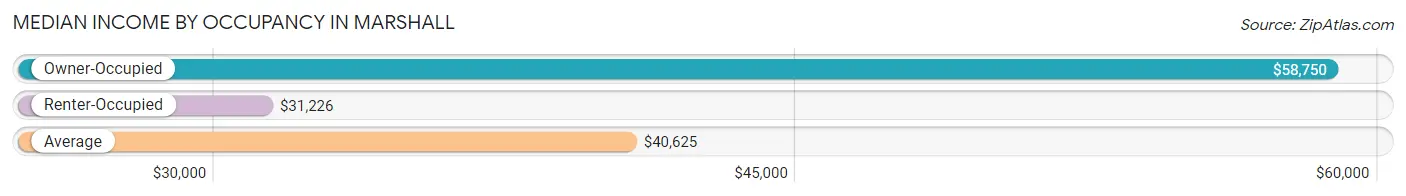
| Occupancy Type | # Households | Median Income |
| Owner-Occupied | 92 (60.5%) | $58,750 |
| Renter-Occupied | 60 (39.5%) | $31,226 |
| Average | 152 (100.0%) | $40,625 |
Occupancy by Householder Income Bracket in Marshall
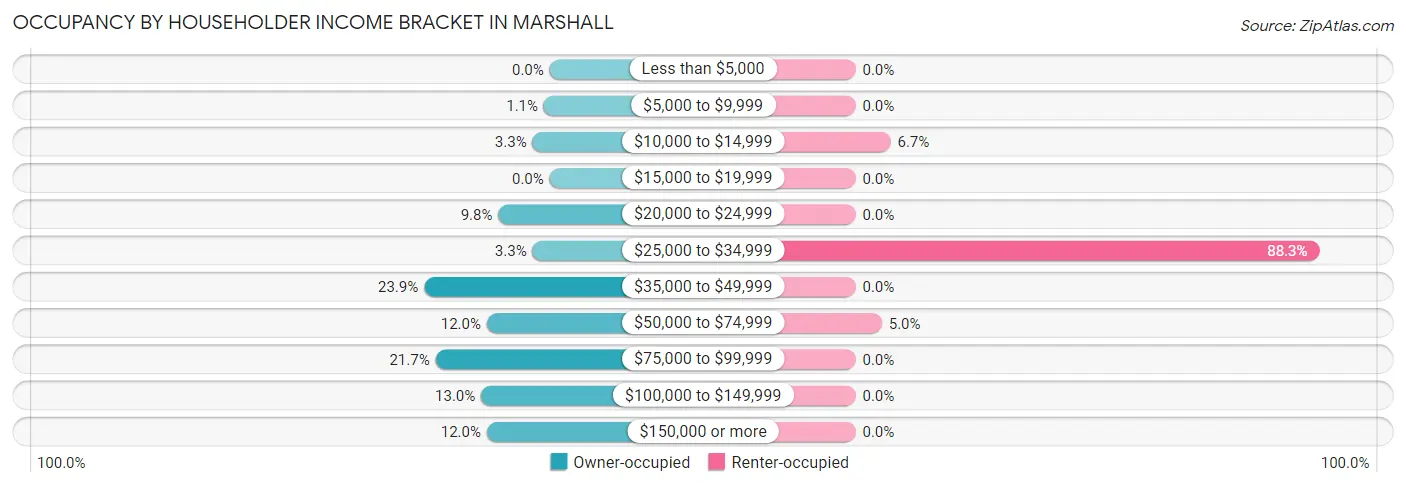
| Income Bracket | Owner-occupied | Renter-occupied |
| Less than $5,000 | 0 (0.0%) | 0 (0.0%) |
| $5,000 to $9,999 | 1 (1.1%) | 0 (0.0%) |
| $10,000 to $14,999 | 3 (3.3%) | 4 (6.7%) |
| $15,000 to $19,999 | 0 (0.0%) | 0 (0.0%) |
| $20,000 to $24,999 | 9 (9.8%) | 0 (0.0%) |
| $25,000 to $34,999 | 3 (3.3%) | 53 (88.3%) |
| $35,000 to $49,999 | 22 (23.9%) | 0 (0.0%) |
| $50,000 to $74,999 | 11 (12.0%) | 3 (5.0%) |
| $75,000 to $99,999 | 20 (21.7%) | 0 (0.0%) |
| $100,000 to $149,999 | 12 (13.0%) | 0 (0.0%) |
| $150,000 or more | 11 (12.0%) | 0 (0.0%) |
| Total | 92 (100.0%) | 60 (100.0%) |
Monthly Housing Cost Tiers in Marshall
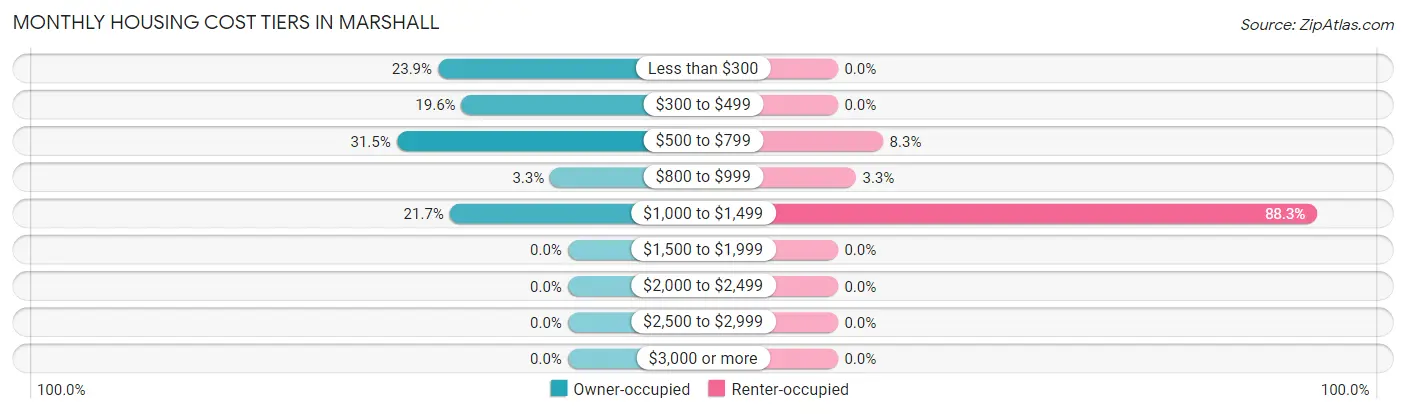
| Monthly Cost | Owner-occupied | Renter-occupied |
| Less than $300 | 22 (23.9%) | 0 (0.0%) |
| $300 to $499 | 18 (19.6%) | 0 (0.0%) |
| $500 to $799 | 29 (31.5%) | 5 (8.3%) |
| $800 to $999 | 3 (3.3%) | 2 (3.3%) |
| $1,000 to $1,499 | 20 (21.7%) | 53 (88.3%) |
| $1,500 to $1,999 | 0 (0.0%) | 0 (0.0%) |
| $2,000 to $2,499 | 0 (0.0%) | 0 (0.0%) |
| $2,500 to $2,999 | 0 (0.0%) | 0 (0.0%) |
| $3,000 or more | 0 (0.0%) | 0 (0.0%) |
| Total | 92 (100.0%) | 60 (100.0%) |
Physical Housing Characteristics in Marshall
Housing Structures in Marshall
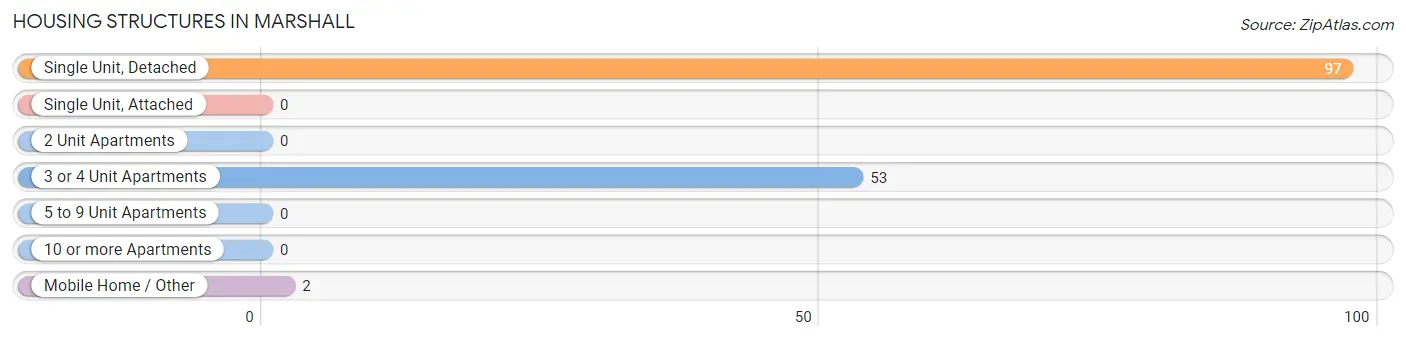
| Structure Type | # Housing Units | % Housing Units |
| Single Unit, Detached | 97 | 63.8% |
| Single Unit, Attached | 0 | 0.0% |
| 2 Unit Apartments | 0 | 0.0% |
| 3 or 4 Unit Apartments | 53 | 34.9% |
| 5 to 9 Unit Apartments | 0 | 0.0% |
| 10 or more Apartments | 0 | 0.0% |
| Mobile Home / Other | 2 | 1.3% |
| Total | 152 | 100.0% |
Housing Structures by Occupancy in Marshall
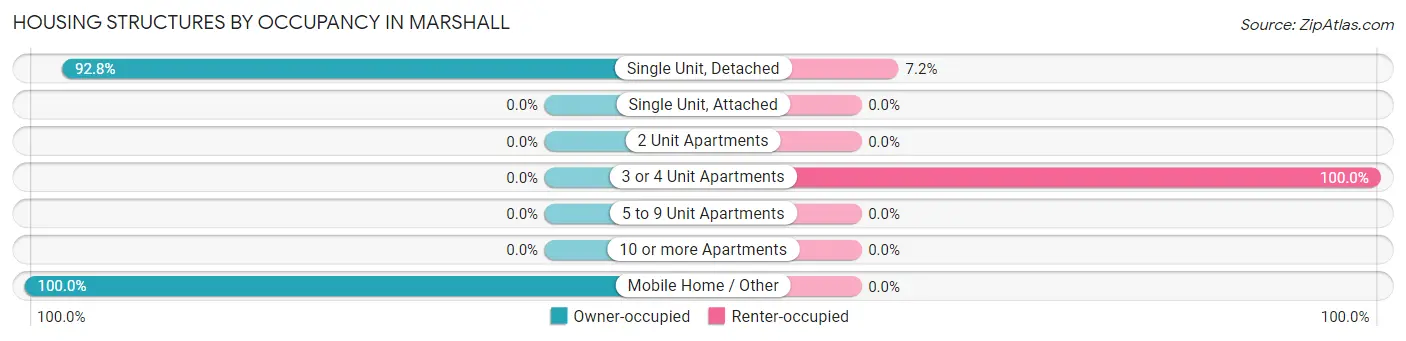
| Structure Type | Owner-occupied | Renter-occupied |
| Single Unit, Detached | 90 (92.8%) | 7 (7.2%) |
| Single Unit, Attached | 0 (0.0%) | 0 (0.0%) |
| 2 Unit Apartments | 0 (0.0%) | 0 (0.0%) |
| 3 or 4 Unit Apartments | 0 (0.0%) | 53 (100.0%) |
| 5 to 9 Unit Apartments | 0 (0.0%) | 0 (0.0%) |
| 10 or more Apartments | 0 (0.0%) | 0 (0.0%) |
| Mobile Home / Other | 2 (100.0%) | 0 (0.0%) |
| Total | 92 (60.5%) | 60 (39.5%) |
Housing Structures by Number of Rooms in Marshall
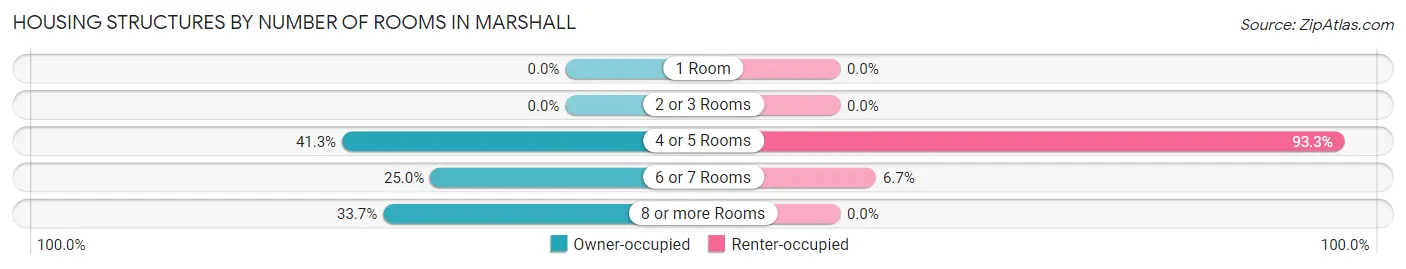
| Number of Rooms | Owner-occupied | Renter-occupied |
| 1 Room | 0 (0.0%) | 0 (0.0%) |
| 2 or 3 Rooms | 0 (0.0%) | 0 (0.0%) |
| 4 or 5 Rooms | 38 (41.3%) | 56 (93.3%) |
| 6 or 7 Rooms | 23 (25.0%) | 4 (6.7%) |
| 8 or more Rooms | 31 (33.7%) | 0 (0.0%) |
| Total | 92 (100.0%) | 60 (100.0%) |
Housing Structure by Heating Type in Marshall
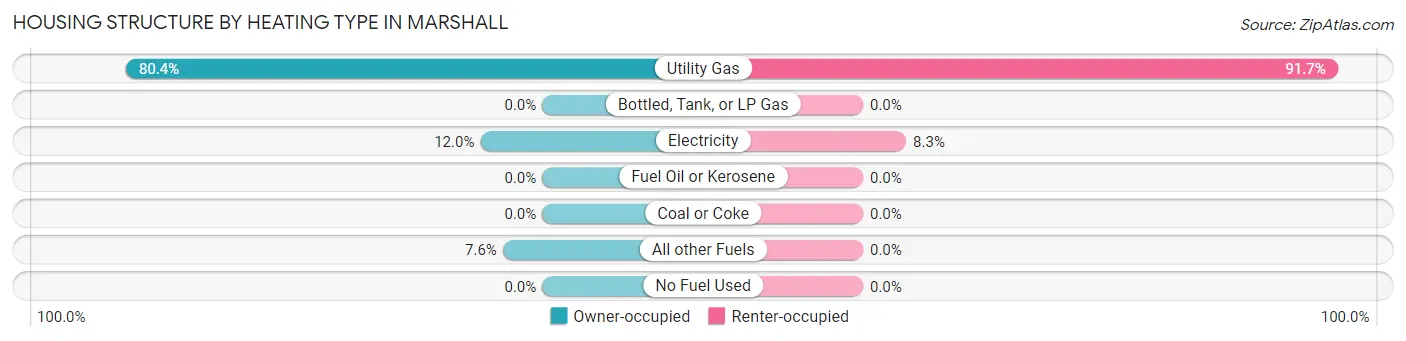
| Heating Type | Owner-occupied | Renter-occupied |
| Utility Gas | 74 (80.4%) | 55 (91.7%) |
| Bottled, Tank, or LP Gas | 0 (0.0%) | 0 (0.0%) |
| Electricity | 11 (12.0%) | 5 (8.3%) |
| Fuel Oil or Kerosene | 0 (0.0%) | 0 (0.0%) |
| Coal or Coke | 0 (0.0%) | 0 (0.0%) |
| All other Fuels | 7 (7.6%) | 0 (0.0%) |
| No Fuel Used | 0 (0.0%) | 0 (0.0%) |
| Total | 92 (100.0%) | 60 (100.0%) |
Household Vehicle Usage in Marshall
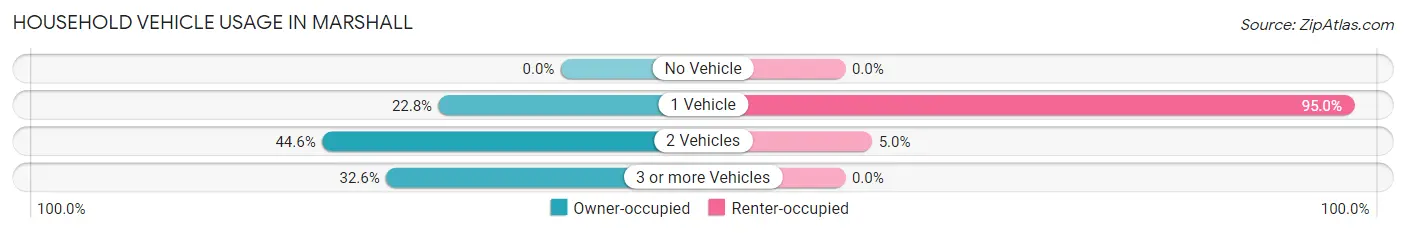
| Vehicles per Household | Owner-occupied | Renter-occupied |
| No Vehicle | 0 (0.0%) | 0 (0.0%) |
| 1 Vehicle | 21 (22.8%) | 57 (95.0%) |
| 2 Vehicles | 41 (44.6%) | 3 (5.0%) |
| 3 or more Vehicles | 30 (32.6%) | 0 (0.0%) |
| Total | 92 (100.0%) | 60 (100.0%) |
Real Estate & Mortgages in Marshall
Real Estate and Mortgage Overview in Marshall
| Characteristic | Without Mortgage | With Mortgage |
| Housing Units | 40 | 52 |
| Median Property Value | $55,000 | $100,000 |
| Median Household Income | $56,250 | $7 |
| Monthly Housing Costs | $291 | $0 |
| Real Estate Taxes | - | - |
Property Value by Mortgage Status in Marshall
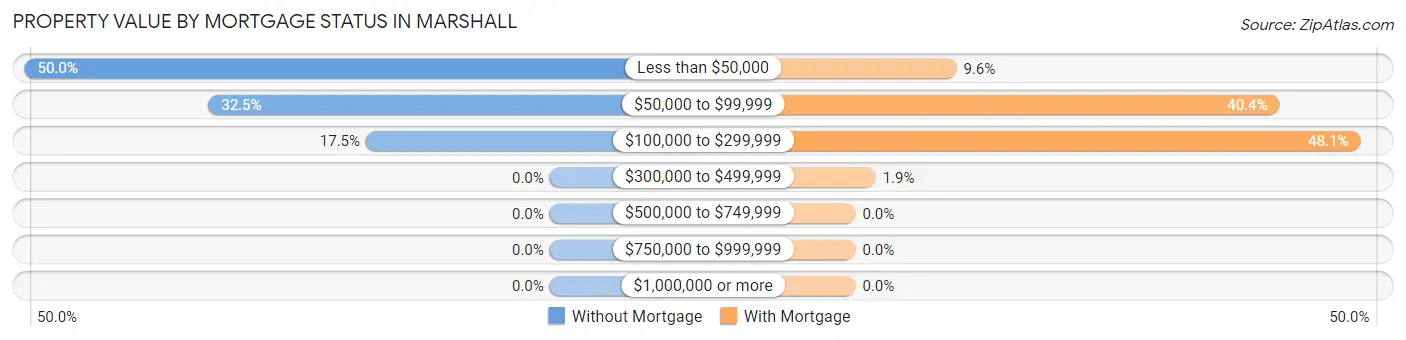
| Property Value | Without Mortgage | With Mortgage |
| Less than $50,000 | 20 (50.0%) | 5 (9.6%) |
| $50,000 to $99,999 | 13 (32.5%) | 21 (40.4%) |
| $100,000 to $299,999 | 7 (17.5%) | 25 (48.1%) |
| $300,000 to $499,999 | 0 (0.0%) | 1 (1.9%) |
| $500,000 to $749,999 | 0 (0.0%) | 0 (0.0%) |
| $750,000 to $999,999 | 0 (0.0%) | 0 (0.0%) |
| $1,000,000 or more | 0 (0.0%) | 0 (0.0%) |
| Total | 40 (100.0%) | 52 (100.0%) |
Household Income by Mortgage Status in Marshall
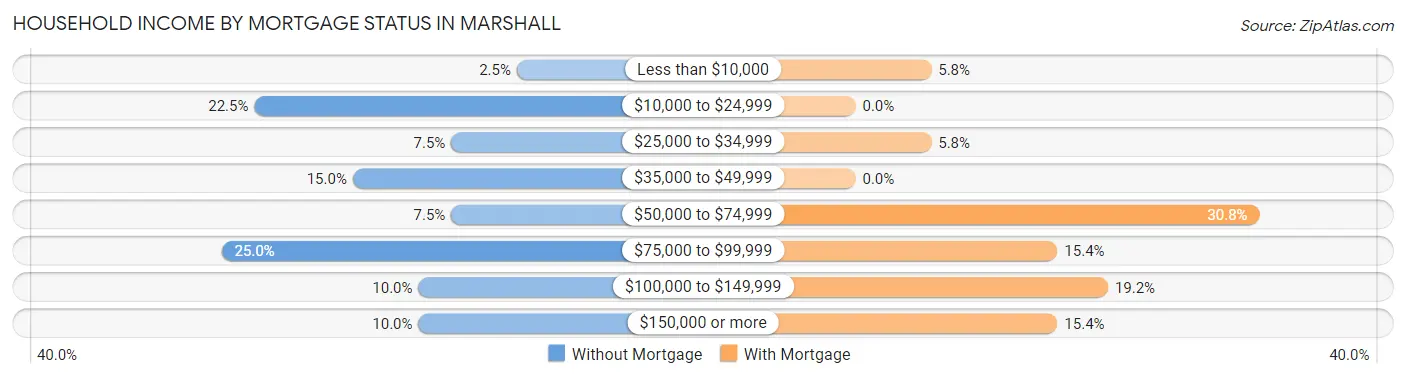
| Household Income | Without Mortgage | With Mortgage |
| Less than $10,000 | 1 (2.5%) | 3 (5.8%) |
| $10,000 to $24,999 | 9 (22.5%) | 0 (0.0%) |
| $25,000 to $34,999 | 3 (7.5%) | 3 (5.8%) |
| $35,000 to $49,999 | 6 (15.0%) | 0 (0.0%) |
| $50,000 to $74,999 | 3 (7.5%) | 16 (30.8%) |
| $75,000 to $99,999 | 10 (25.0%) | 8 (15.4%) |
| $100,000 to $149,999 | 4 (10.0%) | 10 (19.2%) |
| $150,000 or more | 4 (10.0%) | 8 (15.4%) |
| Total | 40 (100.0%) | 52 (100.0%) |
Property Value to Household Income Ratio in Marshall
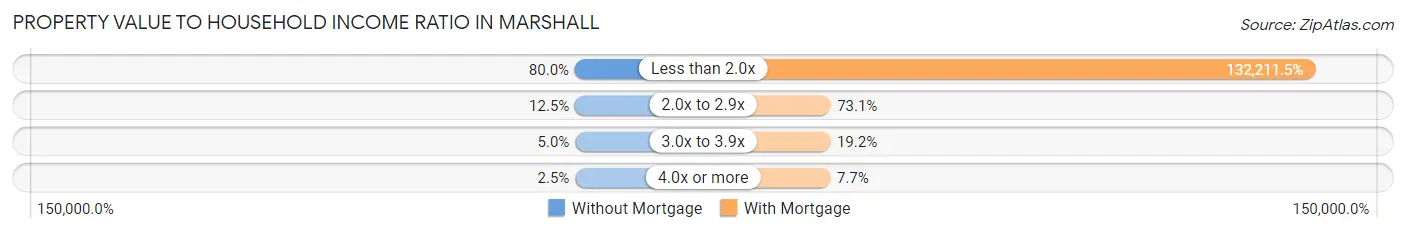
| Value-to-Income Ratio | Without Mortgage | With Mortgage |
| Less than 2.0x | 32 (80.0%) | 68,750 (132,211.5%) |
| 2.0x to 2.9x | 5 (12.5%) | 38 (73.1%) |
| 3.0x to 3.9x | 2 (5.0%) | 10 (19.2%) |
| 4.0x or more | 1 (2.5%) | 4 (7.7%) |
| Total | 40 (100.0%) | 52 (100.0%) |
Real Estate Taxes by Mortgage Status in Marshall
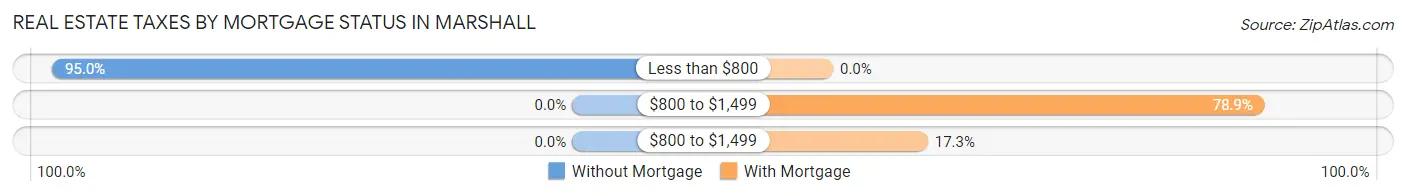
| Property Taxes | Without Mortgage | With Mortgage |
| Less than $800 | 38 (95.0%) | 0 (0.0%) |
| $800 to $1,499 | 0 (0.0%) | 41 (78.8%) |
| $800 to $1,499 | 0 (0.0%) | 9 (17.3%) |
| Total | 40 (100.0%) | 52 (100.0%) |
Health & Disability in Marshall
Health Insurance Coverage by Age in Marshall
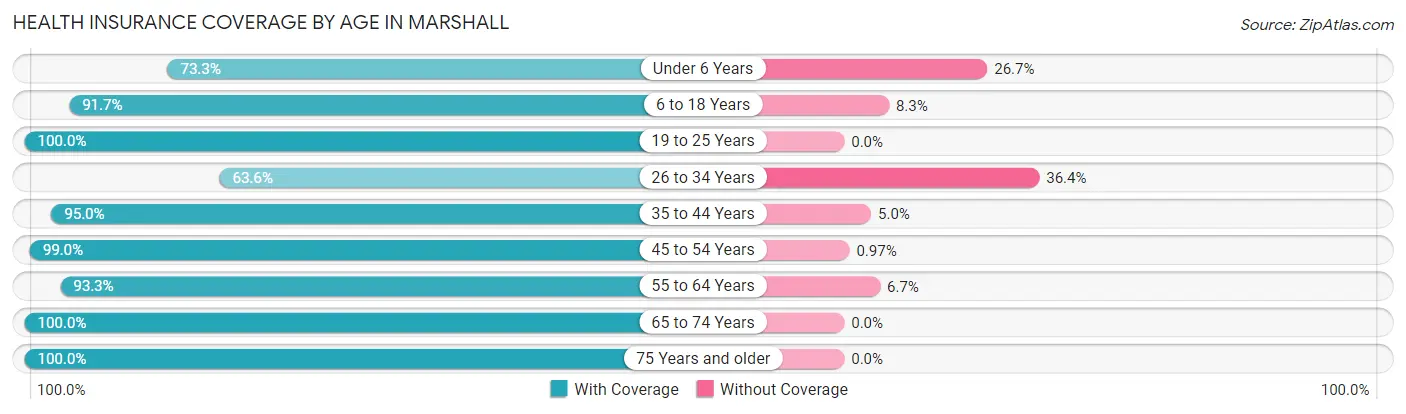
| Age Bracket | With Coverage | Without Coverage |
| Under 6 Years | 11 (73.3%) | 4 (26.7%) |
| 6 to 18 Years | 33 (91.7%) | 3 (8.3%) |
| 19 to 25 Years | 31 (100.0%) | 0 (0.0%) |
| 26 to 34 Years | 28 (63.6%) | 16 (36.4%) |
| 35 to 44 Years | 19 (95.0%) | 1 (5.0%) |
| 45 to 54 Years | 102 (99.0%) | 1 (1.0%) |
| 55 to 64 Years | 28 (93.3%) | 2 (6.7%) |
| 65 to 74 Years | 38 (100.0%) | 0 (0.0%) |
| 75 Years and older | 14 (100.0%) | 0 (0.0%) |
| Total | 304 (91.8%) | 27 (8.2%) |
Health Insurance Coverage by Citizenship Status in Marshall
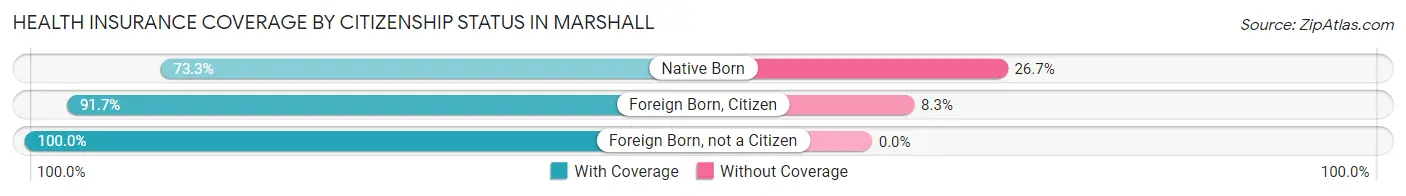
| Citizenship Status | With Coverage | Without Coverage |
| Native Born | 11 (73.3%) | 4 (26.7%) |
| Foreign Born, Citizen | 33 (91.7%) | 3 (8.3%) |
| Foreign Born, not a Citizen | 31 (100.0%) | 0 (0.0%) |
Health Insurance Coverage by Household Income in Marshall
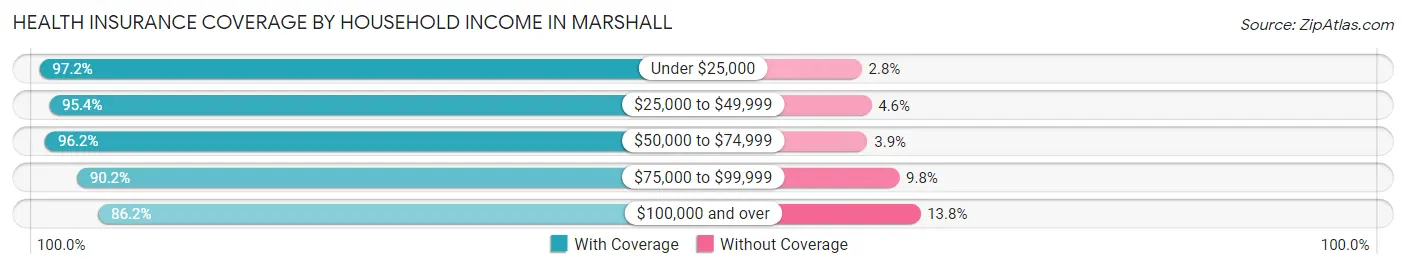
| Household Income | With Coverage | Without Coverage |
| Under $25,000 | 35 (97.2%) | 1 (2.8%) |
| $25,000 to $49,999 | 104 (95.4%) | 5 (4.6%) |
| $50,000 to $74,999 | 25 (96.2%) | 1 (3.8%) |
| $75,000 to $99,999 | 46 (90.2%) | 5 (9.8%) |
| $100,000 and over | 94 (86.2%) | 15 (13.8%) |
Public vs Private Health Insurance Coverage by Age in Marshall
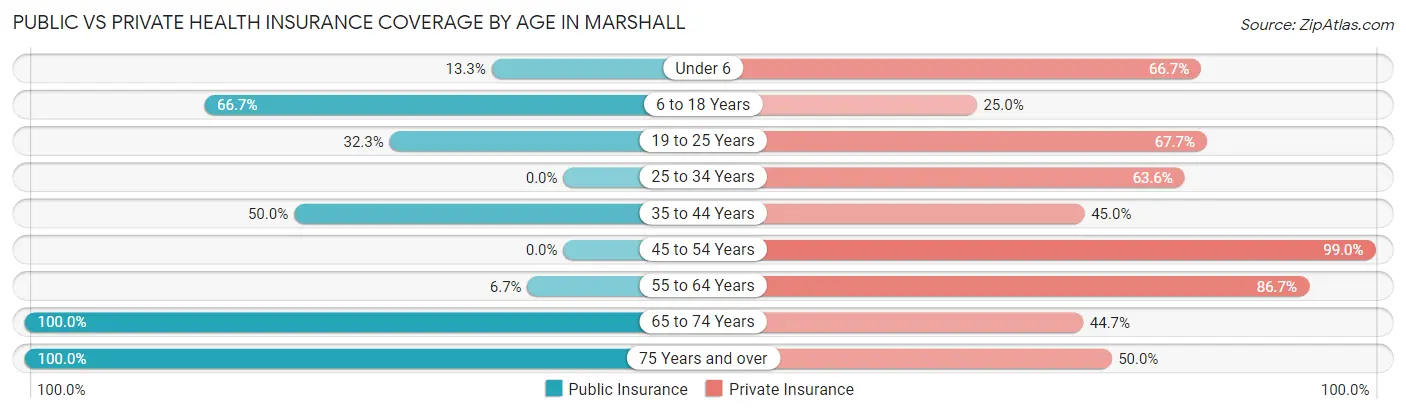
| Age Bracket | Public Insurance | Private Insurance |
| Under 6 | 2 (13.3%) | 10 (66.7%) |
| 6 to 18 Years | 24 (66.7%) | 9 (25.0%) |
| 19 to 25 Years | 10 (32.3%) | 21 (67.7%) |
| 25 to 34 Years | 0 (0.0%) | 28 (63.6%) |
| 35 to 44 Years | 10 (50.0%) | 9 (45.0%) |
| 45 to 54 Years | 0 (0.0%) | 102 (99.0%) |
| 55 to 64 Years | 2 (6.7%) | 26 (86.7%) |
| 65 to 74 Years | 38 (100.0%) | 17 (44.7%) |
| 75 Years and over | 14 (100.0%) | 7 (50.0%) |
| Total | 100 (30.2%) | 229 (69.2%) |
Disability Status by Sex by Age in Marshall
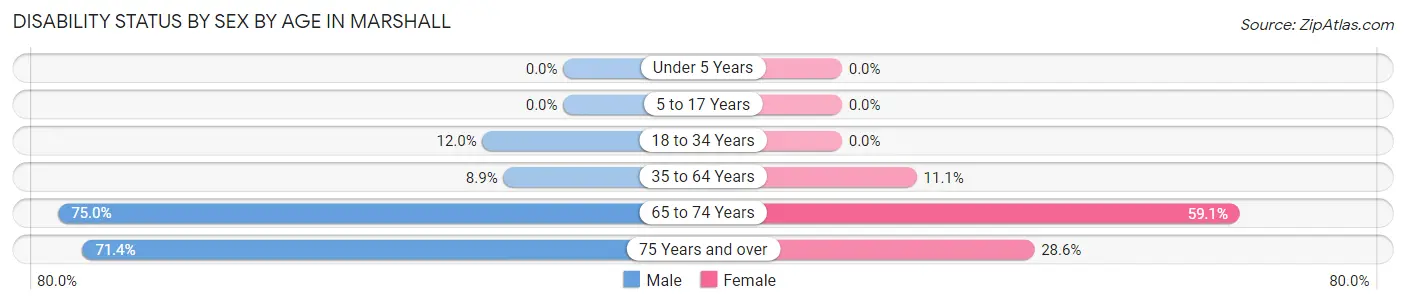
| Age Bracket | Male | Female |
| Under 5 Years | 0 (0.0%) | 0 (0.0%) |
| 5 to 17 Years | 0 (0.0%) | 0 (0.0%) |
| 18 to 34 Years | 6 (12.0%) | 0 (0.0%) |
| 35 to 64 Years | 4 (8.9%) | 12 (11.1%) |
| 65 to 74 Years | 12 (75.0%) | 13 (59.1%) |
| 75 Years and over | 5 (71.4%) | 2 (28.6%) |
Disability Class by Sex by Age in Marshall
Disability Class: Hearing Difficulty
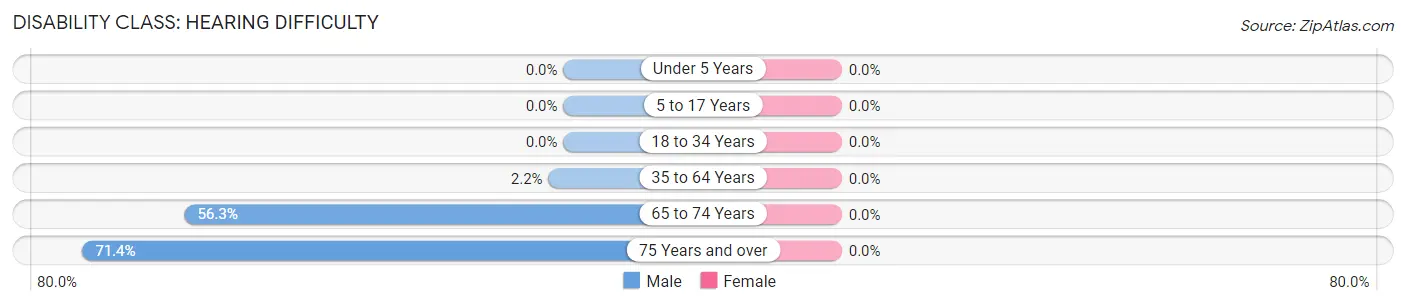
| Age Bracket | Male | Female |
| Under 5 Years | 0 (0.0%) | 0 (0.0%) |
| 5 to 17 Years | 0 (0.0%) | 0 (0.0%) |
| 18 to 34 Years | 0 (0.0%) | 0 (0.0%) |
| 35 to 64 Years | 1 (2.2%) | 0 (0.0%) |
| 65 to 74 Years | 9 (56.2%) | 0 (0.0%) |
| 75 Years and over | 5 (71.4%) | 0 (0.0%) |
Disability Class: Vision Difficulty
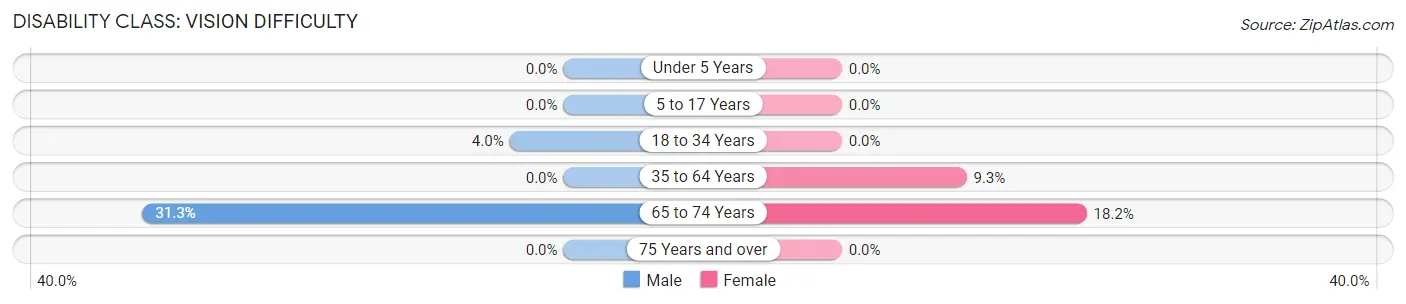
| Age Bracket | Male | Female |
| Under 5 Years | 0 (0.0%) | 0 (0.0%) |
| 5 to 17 Years | 0 (0.0%) | 0 (0.0%) |
| 18 to 34 Years | 2 (4.0%) | 0 (0.0%) |
| 35 to 64 Years | 0 (0.0%) | 10 (9.3%) |
| 65 to 74 Years | 5 (31.2%) | 4 (18.2%) |
| 75 Years and over | 0 (0.0%) | 0 (0.0%) |
Disability Class: Cognitive Difficulty
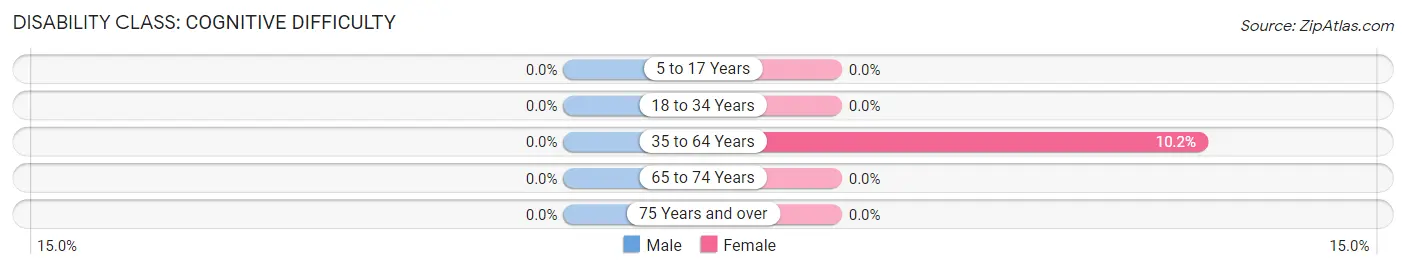
| Age Bracket | Male | Female |
| 5 to 17 Years | 0 (0.0%) | 0 (0.0%) |
| 18 to 34 Years | 0 (0.0%) | 0 (0.0%) |
| 35 to 64 Years | 0 (0.0%) | 11 (10.2%) |
| 65 to 74 Years | 0 (0.0%) | 0 (0.0%) |
| 75 Years and over | 0 (0.0%) | 0 (0.0%) |
Disability Class: Ambulatory Difficulty
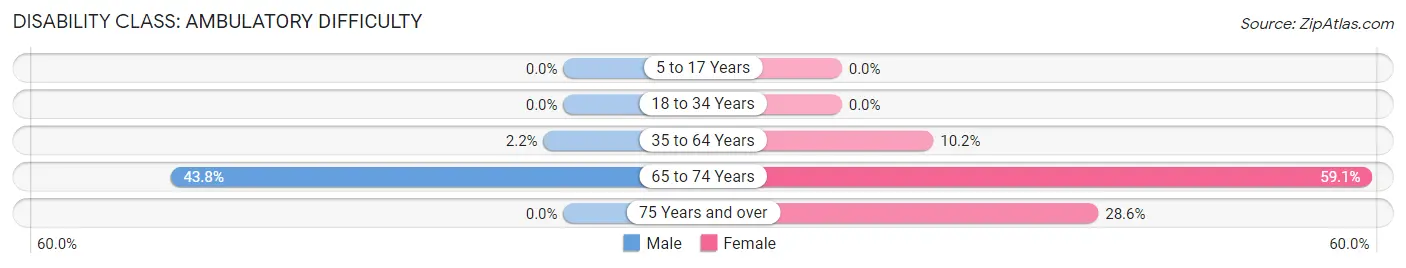
| Age Bracket | Male | Female |
| 5 to 17 Years | 0 (0.0%) | 0 (0.0%) |
| 18 to 34 Years | 0 (0.0%) | 0 (0.0%) |
| 35 to 64 Years | 1 (2.2%) | 11 (10.2%) |
| 65 to 74 Years | 7 (43.8%) | 13 (59.1%) |
| 75 Years and over | 0 (0.0%) | 2 (28.6%) |
Disability Class: Self-Care Difficulty
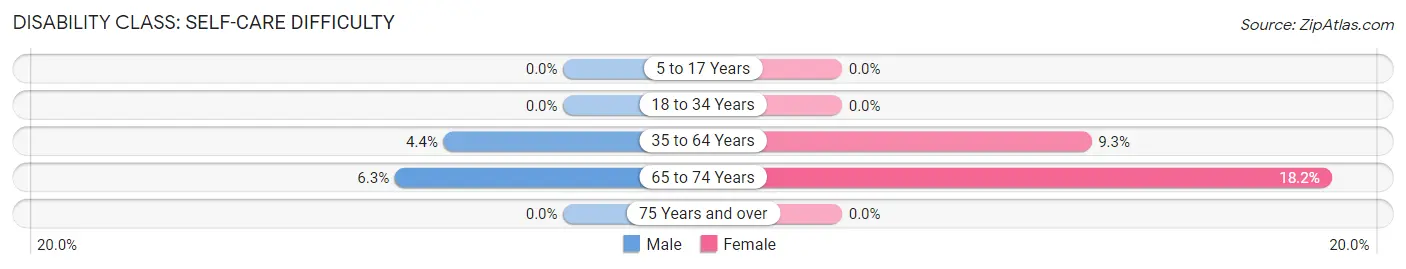
| Age Bracket | Male | Female |
| 5 to 17 Years | 0 (0.0%) | 0 (0.0%) |
| 18 to 34 Years | 0 (0.0%) | 0 (0.0%) |
| 35 to 64 Years | 2 (4.4%) | 10 (9.3%) |
| 65 to 74 Years | 1 (6.2%) | 4 (18.2%) |
| 75 Years and over | 0 (0.0%) | 0 (0.0%) |
Technology Access in Marshall
Computing Device Access in Marshall
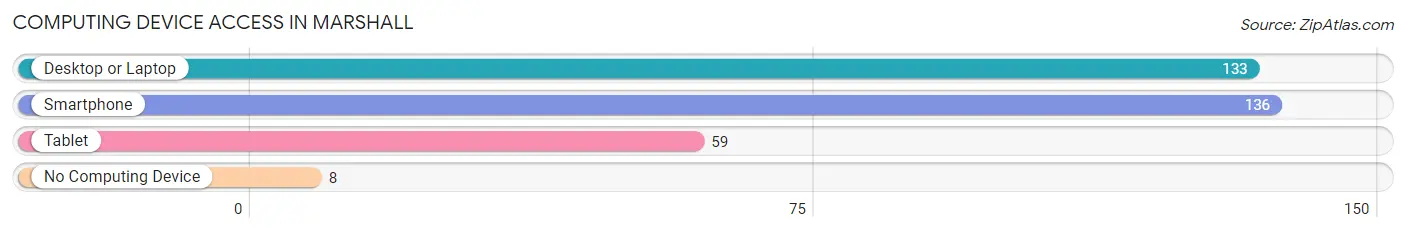
| Device Type | # Households | % Households |
| Desktop or Laptop | 133 | 87.5% |
| Smartphone | 136 | 89.5% |
| Tablet | 59 | 38.8% |
| No Computing Device | 8 | 5.3% |
| Total | 152 | 100.0% |
Internet Access in Marshall
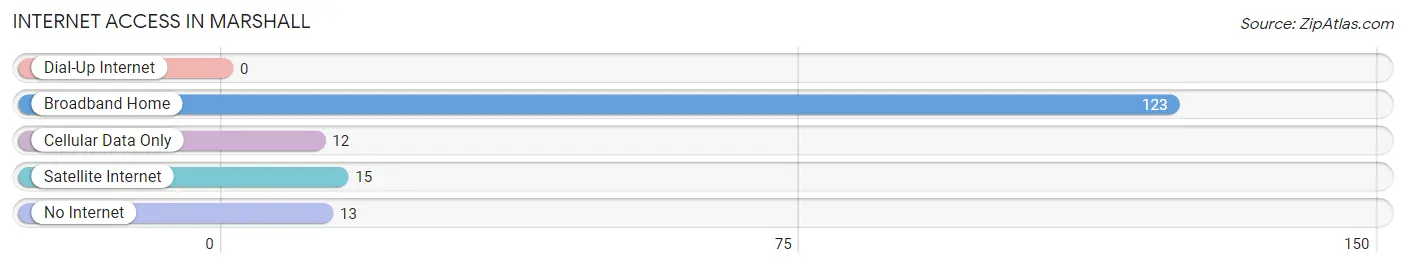
| Internet Type | # Households | % Households |
| Dial-Up Internet | 0 | 0.0% |
| Broadband Home | 123 | 80.9% |
| Cellular Data Only | 12 | 7.9% |
| Satellite Internet | 15 | 9.9% |
| No Internet | 13 | 8.6% |
| Total | 152 | 100.0% |
Marshall Summary
Marshall, Indiana is a small town located in the northern part of the state, in the county of Parke. It is situated on the banks of the Wabash River, and is home to a population of just over 2,000 people. The town was founded in 1836, and has a rich history of industry and agriculture.
Geography
Marshall is located in the northern part of Indiana, in the county of Parke. It is situated on the banks of the Wabash River, and is surrounded by rolling hills and farmland. The town is located approximately 50 miles west of Indianapolis, and is part of the Terre Haute metropolitan area. The town is situated at an elevation of 645 feet above sea level.
Economy
Marshall’s economy is largely based on agriculture and manufacturing. The town is home to several large agricultural operations, including a large dairy farm and a large hog farm. The town is also home to several manufacturing companies, including a plastics factory and a metal fabrication plant. The town is also home to several small businesses, including restaurants, retail stores, and service providers.
Demographics
As of the 2010 census, the population of Marshall was 2,039. The racial makeup of the town was 97.2% White, 0.7% African American, 0.3% Native American, 0.2% Asian, 0.1% Pacific Islander, 0.4% from other races, and 1.1% from two or more races. Hispanic or Latino of any race were 1.2% of the population.
The median income for a household in Marshall was $37,917, and the median income for a family was $45,000. The per capita income for the town was $18,945. About 11.2% of families and 14.2% of the population were below the poverty line, including 18.2% of those under age 18 and 8.2% of those age 65 or over.
History
Marshall was founded in 1836 by a group of settlers from Ohio. The town was named after Chief Justice John Marshall, who served on the Supreme Court from 1801 to 1835. The town was originally a farming community, and the first settlers grew corn, wheat, and other crops. The town was also home to several mills, which were used to grind grain and produce flour.
In the late 19th century, Marshall began to industrialize, and several factories were built in the town. The most notable of these was the Marshall Foundry, which produced cast iron products. The town also became home to several other industries, including a brickyard, a furniture factory, and a canning factory.
In the early 20th century, Marshall experienced a period of growth and prosperity. The town was home to several banks, a movie theater, and a variety of other businesses. The town also became home to several churches, and a public school system was established.
In the late 20th century, Marshall experienced a period of decline. Many of the factories and businesses closed, and the population began to decline. However, the town has experienced a resurgence in recent years, and is now home to several small businesses and a growing population.
Common Questions
What is Per Capita Income in Marshall?
Per Capita income in Marshall is $31,780.
What is the Median Family Income in Marshall?
Median Family Income in Marshall is $81,250.
What is the Median Household income in Marshall?
Median Household Income in Marshall is $40,625.
What is Income or Wage Gap in Marshall?
Income or Wage Gap in Marshall is 21.9%.
Women in Marshall earn 78.1 cents for every dollar earned by a man.
What is Inequality or Gini Index in Marshall?
Inequality or Gini Index in Marshall is 0.43.
What is the Total Population of Marshall?
Total Population of Marshall is 331.
What is the Total Male Population of Marshall?
Total Male Population of Marshall is 145.
What is the Total Female Population of Marshall?
Total Female Population of Marshall is 186.
What is the Ratio of Males per 100 Females in Marshall?
There are 77.96 Males per 100 Females in Marshall.
What is the Ratio of Females per 100 Males in Marshall?
There are 128.28 Females per 100 Males in Marshall.
What is the Median Population Age in Marshall?
Median Population Age in Marshall is 48.0 Years.
What is the Average Family Size in Marshall
Average Family Size in Marshall is 3.3 People.
What is the Average Household Size in Marshall
Average Household Size in Marshall is 2.2 People.
How Large is the Labor Force in Marshall?
There are 199 People in the Labor Forcein in Marshall.
What is the Percentage of People in the Labor Force in Marshall?
70.6% of People are in the Labor Force in Marshall.
What is the Unemployment Rate in Marshall?
Unemployment Rate in Marshall is 2.0%.