Zip Codes with the Highest Percentage of Population Employed in Farming, Fishing & Forestry in Marion, IN
RELATED REPORTS & OPTIONS
Farming, Fishing & Forestry
Marion
Compare Zip Codes
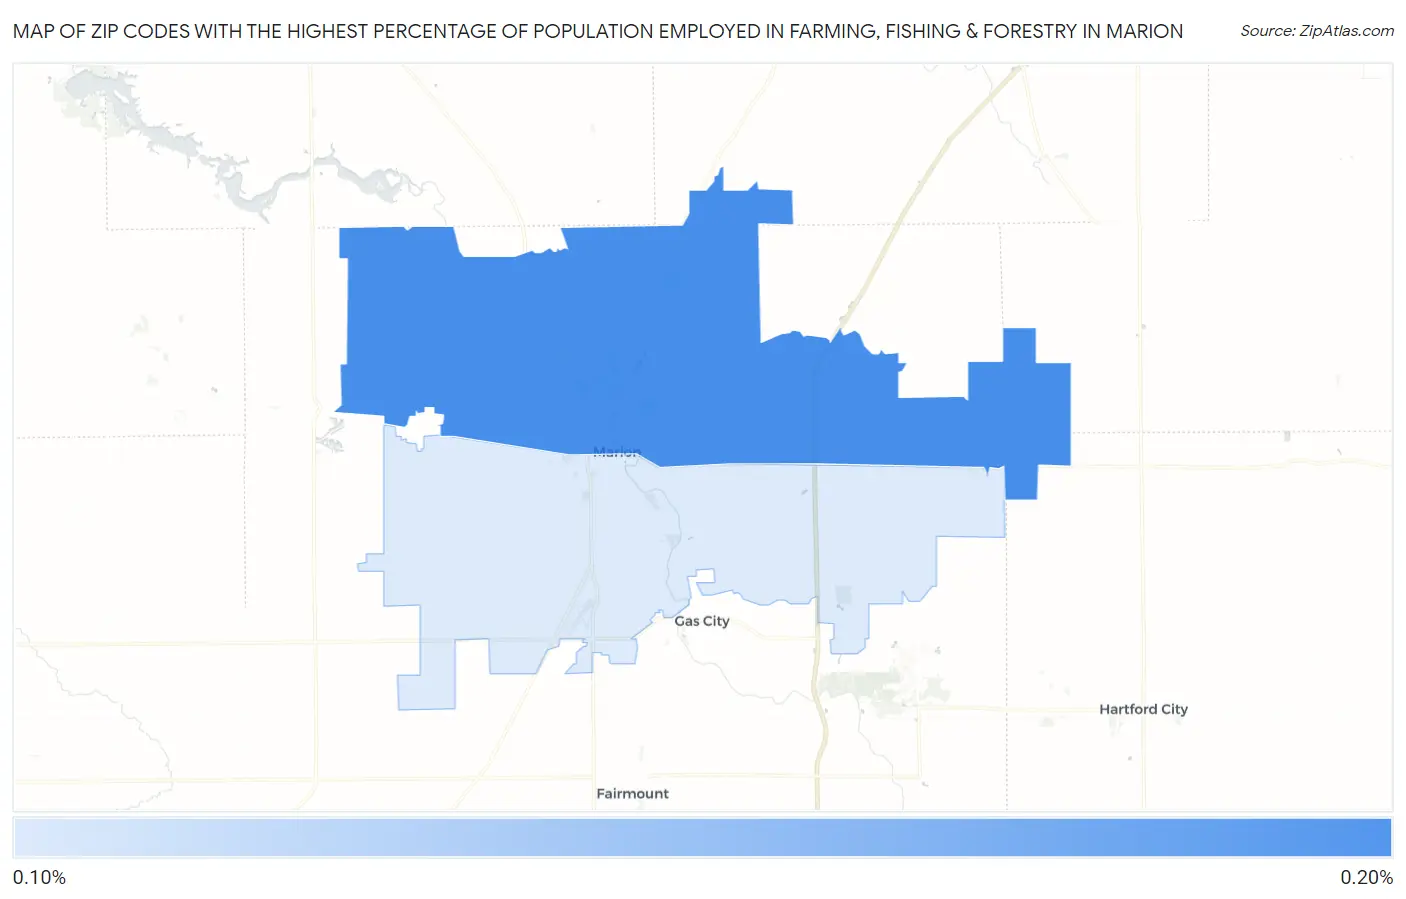
Map of Zip Codes with the Highest Percentage of Population Employed in Farming, Fishing & Forestry in Marion
0.0%
0.20%
Zip Codes with the Highest Percentage of Population Employed in Farming, Fishing & Forestry in Marion, IN
| Zip Code | % Employed | vs State | vs National | |
| 1. | 46952 | 0.17% | 0.39%(-0.213)#360 | 0.61%(-0.433)#16,541 |
| 2. | 46953 | 0.10% | 0.39%(-0.284)#387 | 0.61%(-0.504)#17,740 |
1
Common Questions
What are the Top Zip Codes with the Highest Percentage of Population Employed in Farming, Fishing & Forestry in Marion, IN?
Top Zip Codes with the Highest Percentage of Population Employed in Farming, Fishing & Forestry in Marion, IN are:
What zip code has the Highest Percentage of Population Employed in Farming, Fishing & Forestry in Marion, IN?
46952 has the Highest Percentage of Population Employed in Farming, Fishing & Forestry in Marion, IN with 0.17%.
What is the Percentage of Population Employed in Farming, Fishing & Forestry in Indiana?
Percentage of Population Employed in Farming, Fishing & Forestry in Indiana is 0.39%.
What is the Percentage of Population Employed in Farming, Fishing & Forestry in the United States?
Percentage of Population Employed in Farming, Fishing & Forestry in the United States is 0.61%.