Liberty, IN Map & Demographics
Liberty Map
Liberty Overview
$30,034
PER CAPITA INCOME
$76,204
AVG FAMILY INCOME
$57,754
AVG HOUSEHOLD INCOME
16.2%
WAGE / INCOME GAP [ % ]
83.8¢/ $1
WAGE / INCOME GAP [ $ ]
$12,498
FAMILY INCOME DEFICIT
0.39
INEQUALITY / GINI INDEX
2,085
TOTAL POPULATION
1,021
MALE POPULATION
1,064
FEMALE POPULATION
95.96
MALES / 100 FEMALES
104.21
FEMALES / 100 MALES
46.0
MEDIAN AGE
2.8
AVG FAMILY SIZE
2.1
AVG HOUSEHOLD SIZE
1,145
LABOR FORCE [ PEOPLE ]
64.5%
PERCENT IN LABOR FORCE
3.4%
UNEMPLOYMENT RATE
Liberty Zip Codes
Liberty Area Codes
Income in Liberty
Income Overview in Liberty
Per Capita Income in Liberty is $30,034, while median incomes of families and households are $76,204 and $57,754 respectively.
| Characteristic | Number | Measure |
| Per Capita Income | 2,085 | $30,034 |
| Median Family Income | 574 | $76,204 |
| Mean Family Income | 574 | $78,362 |
| Median Household Income | 968 | $57,754 |
| Mean Household Income | 968 | $63,148 |
| Income Deficit | 574 | $12,498 |
| Wage / Income Gap (%) | 2,085 | 16.19% |
| Wage / Income Gap ($) | 2,085 | 83.81¢ per $1 |
| Gini / Inequality Index | 2,085 | 0.39 |
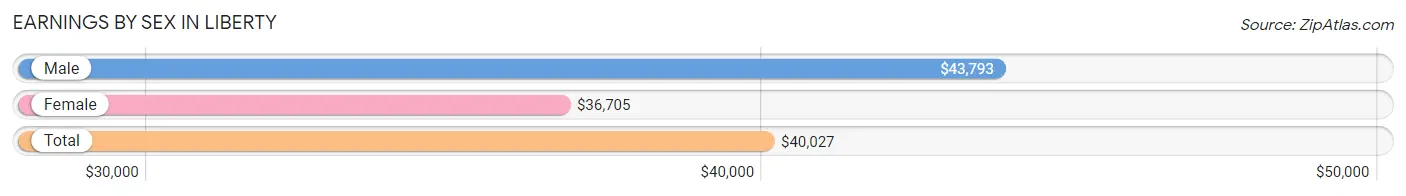
Earnings by Sex in Liberty
Average Earnings in Liberty are $40,027, $43,793 for men and $36,705 for women, a difference of 16.2%.
| Sex | Number | Average Earnings |
| Male | 640 (52.6%) | $43,793 |
| Female | 576 (47.4%) | $36,705 |
| Total | 1,216 (100.0%) | $40,027 |
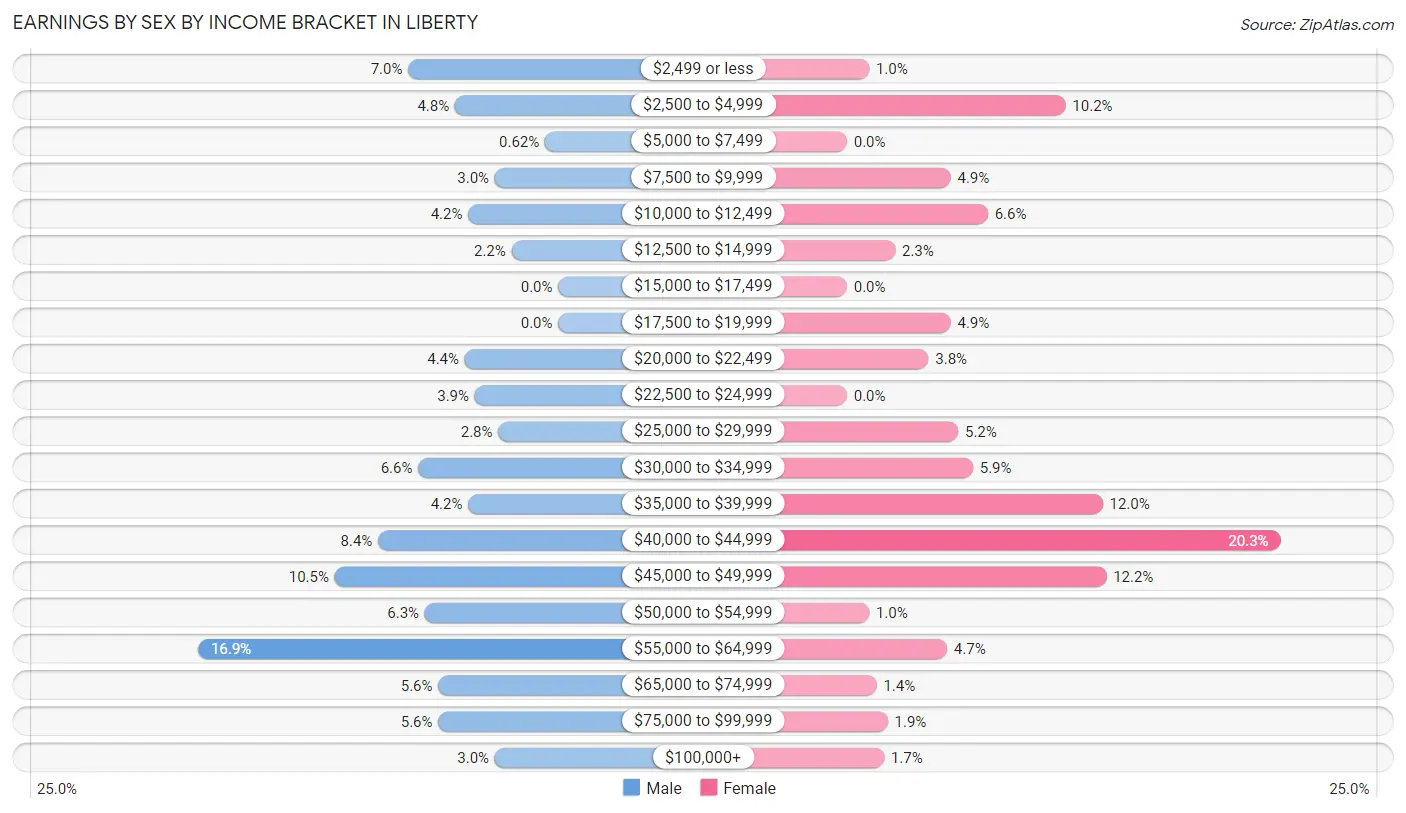
Earnings by Sex by Income Bracket in Liberty
The most common earnings brackets in Liberty are $55,000 to $64,999 for men (108 | 16.9%) and $40,000 to $44,999 for women (117 | 20.3%).
| Income | Male | Female |
| $2,499 or less | 45 (7.0%) | 6 (1.0%) |
| $2,500 to $4,999 | 31 (4.8%) | 59 (10.2%) |
| $5,000 to $7,499 | 4 (0.6%) | 0 (0.0%) |
| $7,500 to $9,999 | 19 (3.0%) | 28 (4.9%) |
| $10,000 to $12,499 | 27 (4.2%) | 38 (6.6%) |
| $12,500 to $14,999 | 14 (2.2%) | 13 (2.3%) |
| $15,000 to $17,499 | 0 (0.0%) | 0 (0.0%) |
| $17,500 to $19,999 | 0 (0.0%) | 28 (4.9%) |
| $20,000 to $22,499 | 28 (4.4%) | 22 (3.8%) |
| $22,500 to $24,999 | 25 (3.9%) | 0 (0.0%) |
| $25,000 to $29,999 | 18 (2.8%) | 30 (5.2%) |
| $30,000 to $34,999 | 42 (6.6%) | 34 (5.9%) |
| $35,000 to $39,999 | 27 (4.2%) | 69 (12.0%) |
| $40,000 to $44,999 | 54 (8.4%) | 117 (20.3%) |
| $45,000 to $49,999 | 67 (10.5%) | 70 (12.1%) |
| $50,000 to $54,999 | 40 (6.2%) | 6 (1.0%) |
| $55,000 to $64,999 | 108 (16.9%) | 27 (4.7%) |
| $65,000 to $74,999 | 36 (5.6%) | 8 (1.4%) |
| $75,000 to $99,999 | 36 (5.6%) | 11 (1.9%) |
| $100,000+ | 19 (3.0%) | 10 (1.7%) |
| Total | 640 (100.0%) | 576 (100.0%) |
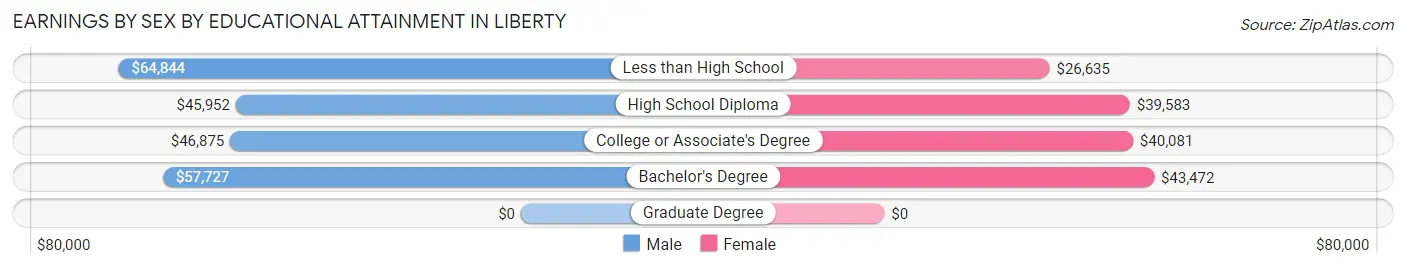
Earnings by Sex by Educational Attainment in Liberty
Average earnings in Liberty are $47,887 for men and $39,550 for women, a difference of 17.4%. Men with an educational attainment of less than high school enjoy the highest average annual earnings of $64,844, while those with high school diploma education earn the least with $45,952. Women with an educational attainment of bachelor's degree earn the most with the average annual earnings of $43,472, while those with less than high school education have the smallest earnings of $26,635.
| Educational Attainment | Male Income | Female Income |
| Less than High School | $64,844 | $26,635 |
| High School Diploma | $45,952 | $39,583 |
| College or Associate's Degree | $46,875 | $40,081 |
| Bachelor's Degree | $57,727 | $43,472 |
| Graduate Degree | - | - |
| Total | $47,887 | $39,550 |
Family Income in Liberty
Family Income Brackets in Liberty
According to the Liberty family income data, there are 178 families falling into the $100,000 to $149,999 income range, which is the most common income bracket and makes up 31.0% of all families. Conversely, the $200,000+ income bracket is the least frequent group with only 3 families (0.5%) belonging to this category.
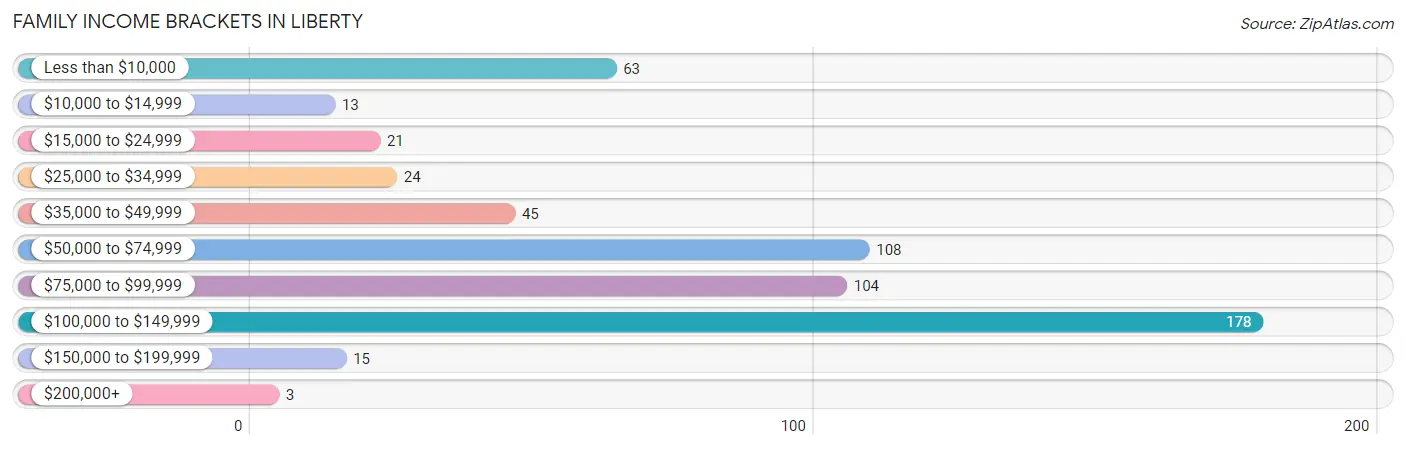
| Income Bracket | # Families | % Families |
| Less than $10,000 | 63 | 11.0% |
| $10,000 to $14,999 | 13 | 2.3% |
| $15,000 to $24,999 | 21 | 3.7% |
| $25,000 to $34,999 | 24 | 4.2% |
| $35,000 to $49,999 | 45 | 7.8% |
| $50,000 to $74,999 | 108 | 18.8% |
| $75,000 to $99,999 | 104 | 18.1% |
| $100,000 to $149,999 | 178 | 31.0% |
| $150,000 to $199,999 | 15 | 2.6% |
| $200,000+ | 3 | 0.5% |
Family Income by Famaliy Size in Liberty
4-person families (71 | 12.4%) account for the highest median family income in Liberty with $114,688 per family, while 2-person families (353 | 61.5%) have the highest median income of $35,387 per family member.
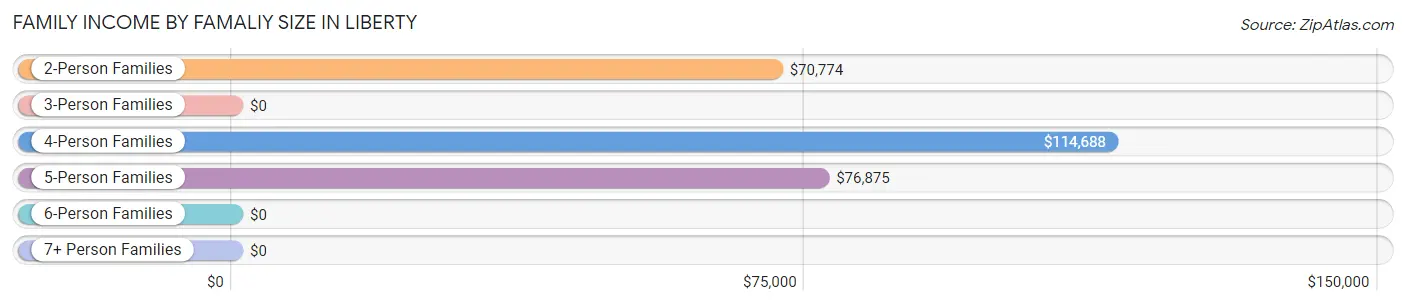
| Income Bracket | # Families | Median Income |
| 2-Person Families | 353 (61.5%) | $70,774 |
| 3-Person Families | 128 (22.3%) | $0 |
| 4-Person Families | 71 (12.4%) | $114,688 |
| 5-Person Families | 22 (3.8%) | $76,875 |
| 6-Person Families | 0 (0.0%) | $0 |
| 7+ Person Families | 0 (0.0%) | $0 |
| Total | 574 (100.0%) | $76,204 |
Family Income by Number of Earners in Liberty
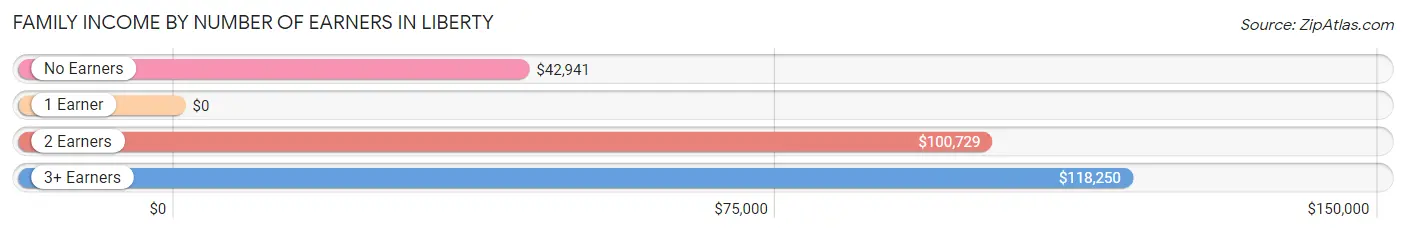
| Number of Earners | # Families | Median Income |
| No Earners | 112 (19.5%) | $42,941 |
| 1 Earner | 147 (25.6%) | $0 |
| 2 Earners | 203 (35.4%) | $100,729 |
| 3+ Earners | 112 (19.5%) | $118,250 |
| Total | 574 (100.0%) | $76,204 |
Household Income in Liberty
Household Income Brackets in Liberty
With 194 households falling in the category, the $50,000 to $74,999 income range is the most frequent in Liberty, accounting for 20.0% of all households. In contrast, only 3 households (0.3%) fall into the $200,000+ income bracket, making it the least populous group.
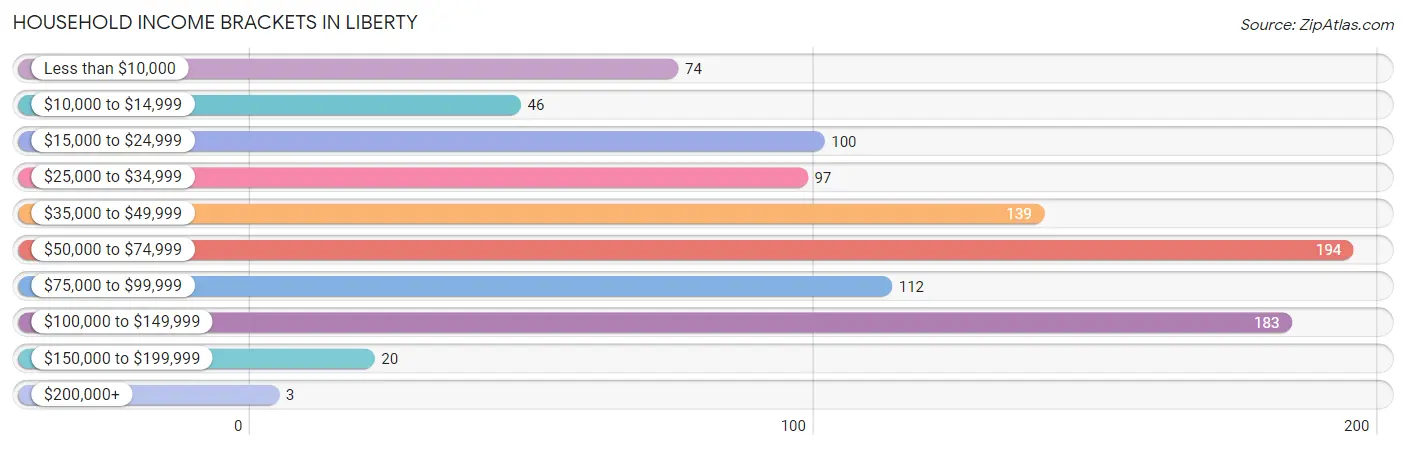
| Income Bracket | # Households | % Households |
| Less than $10,000 | 74 | 7.6% |
| $10,000 to $14,999 | 46 | 4.8% |
| $15,000 to $24,999 | 100 | 10.3% |
| $25,000 to $34,999 | 97 | 10.0% |
| $35,000 to $49,999 | 139 | 14.4% |
| $50,000 to $74,999 | 194 | 20.0% |
| $75,000 to $99,999 | 112 | 11.6% |
| $100,000 to $149,999 | 183 | 18.9% |
| $150,000 to $199,999 | 20 | 2.1% |
| $200,000+ | 3 | 0.3% |
Household Income by Householder Age in Liberty
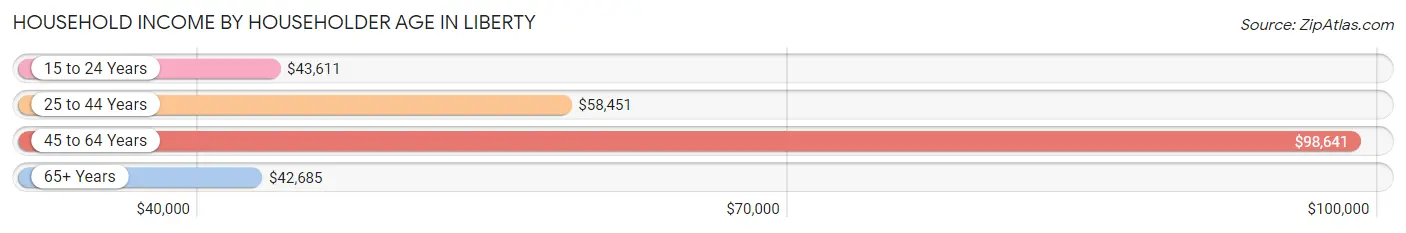
The median household income in Liberty is $57,754, with the highest median household income of $98,641 found in the 45 to 64 years age bracket for the primary householder. A total of 343 households (35.4%) fall into this category. Meanwhile, the 65+ years age bracket for the primary householder has the lowest median household income of $42,685, with 286 households (29.5%) in this group.
| Income Bracket | # Households | Median Income |
| 15 to 24 Years | 44 (4.5%) | $43,611 |
| 25 to 44 Years | 295 (30.5%) | $58,451 |
| 45 to 64 Years | 343 (35.4%) | $98,641 |
| 65+ Years | 286 (29.5%) | $42,685 |
| Total | 968 (100.0%) | $57,754 |
Poverty in Liberty
Income Below Poverty by Sex and Age in Liberty
With 11.5% poverty level for males and 16.2% for females among the residents of Liberty, 5 year old males and 15 year old females are the most vulnerable to poverty, with 19 males (100.0%) and 17 females (100.0%) in their respective age groups living below the poverty level.
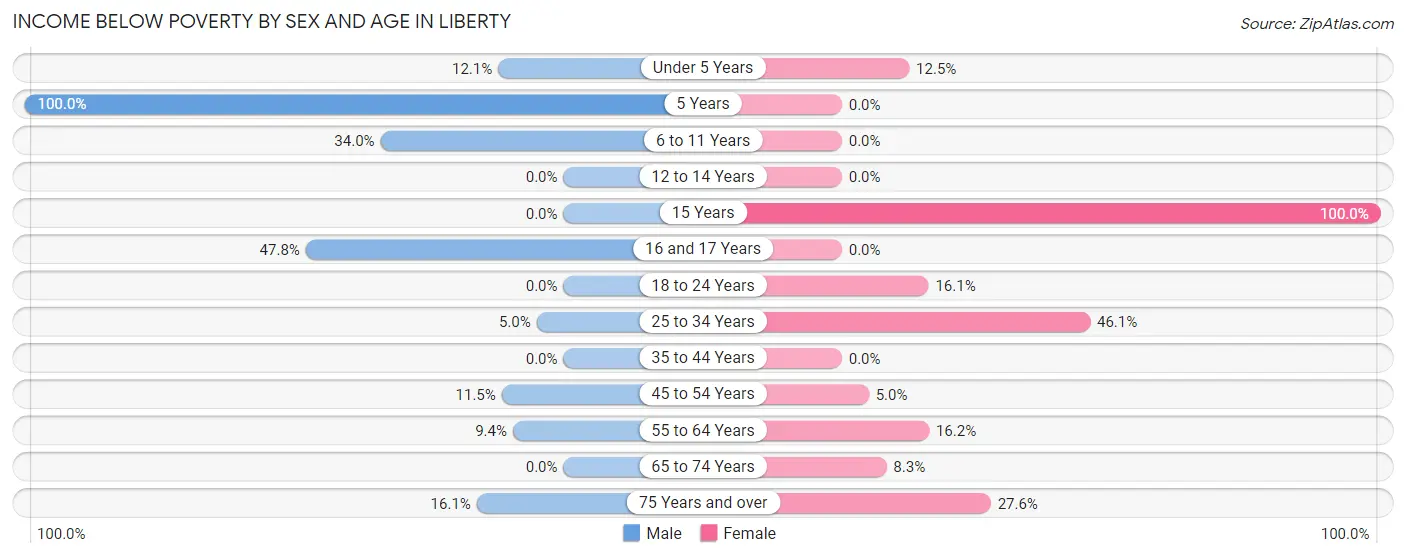
| Age Bracket | Male | Female |
| Under 5 Years | 8 (12.1%) | 4 (12.5%) |
| 5 Years | 19 (100.0%) | 0 (0.0%) |
| 6 to 11 Years | 18 (34.0%) | 0 (0.0%) |
| 12 to 14 Years | 0 (0.0%) | 0 (0.0%) |
| 15 Years | 0 (0.0%) | 17 (100.0%) |
| 16 and 17 Years | 22 (47.8%) | 0 (0.0%) |
| 18 to 24 Years | 0 (0.0%) | 14 (16.1%) |
| 25 to 34 Years | 8 (5.0%) | 47 (46.1%) |
| 35 to 44 Years | 0 (0.0%) | 0 (0.0%) |
| 45 to 54 Years | 11 (11.5%) | 6 (5.0%) |
| 55 to 64 Years | 15 (9.4%) | 33 (16.2%) |
| 65 to 74 Years | 0 (0.0%) | 12 (8.3%) |
| 75 Years and over | 14 (16.1%) | 34 (27.6%) |
| Total | 115 (11.5%) | 167 (16.2%) |
Income Above Poverty by Sex and Age in Liberty
According to the poverty statistics in Liberty, males aged 12 to 14 years and females aged 5 years are the age groups that are most secure financially, with 100.0% of males and 100.0% of females in these age groups living above the poverty line.
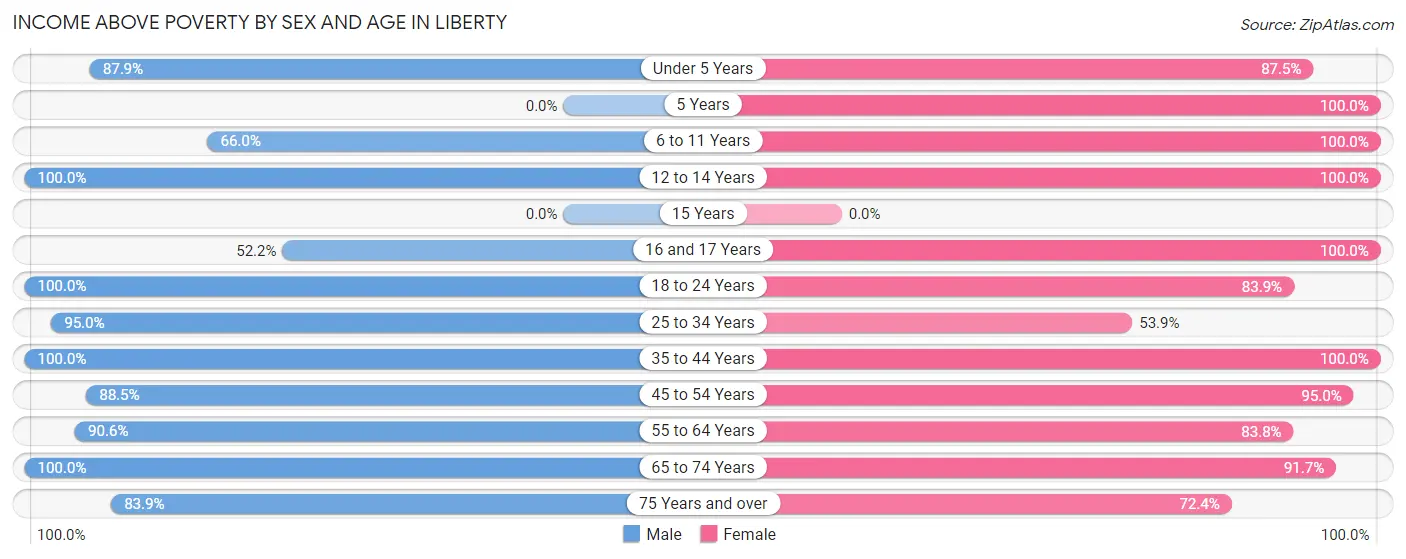
| Age Bracket | Male | Female |
| Under 5 Years | 58 (87.9%) | 28 (87.5%) |
| 5 Years | 0 (0.0%) | 7 (100.0%) |
| 6 to 11 Years | 35 (66.0%) | 67 (100.0%) |
| 12 to 14 Years | 19 (100.0%) | 30 (100.0%) |
| 15 Years | 0 (0.0%) | 0 (0.0%) |
| 16 and 17 Years | 24 (52.2%) | 6 (100.0%) |
| 18 to 24 Years | 73 (100.0%) | 73 (83.9%) |
| 25 to 34 Years | 153 (95.0%) | 55 (53.9%) |
| 35 to 44 Years | 127 (100.0%) | 92 (100.0%) |
| 45 to 54 Years | 85 (88.5%) | 114 (95.0%) |
| 55 to 64 Years | 145 (90.6%) | 171 (83.8%) |
| 65 to 74 Years | 90 (100.0%) | 133 (91.7%) |
| 75 Years and over | 73 (83.9%) | 89 (72.4%) |
| Total | 882 (88.5%) | 865 (83.8%) |
Income Below Poverty Among Married-Couple Families in Liberty
The poverty statistics for married-couple families in Liberty show that 7.4% or 33 of the total 445 families live below the poverty line. Families with 1 or 2 children have the highest poverty rate of 10.2%, comprising of 5 families. On the other hand, families with 3 or 4 children have the lowest poverty rate of 0.0%, which includes 0 families.
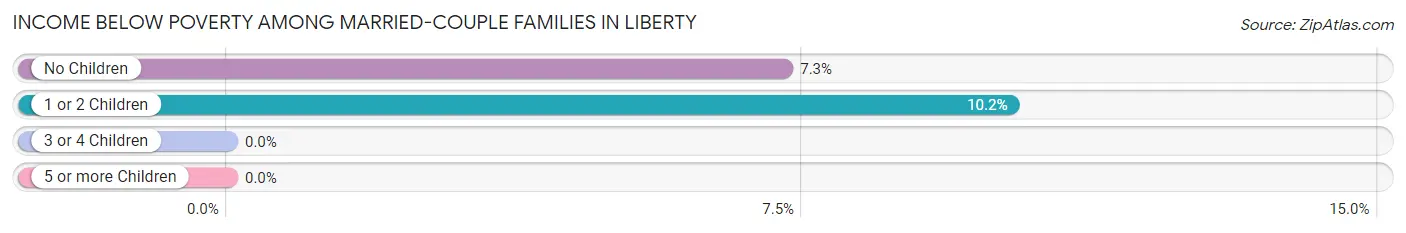
| Children | Above Poverty | Below Poverty |
| No Children | 358 (92.7%) | 28 (7.2%) |
| 1 or 2 Children | 44 (89.8%) | 5 (10.2%) |
| 3 or 4 Children | 10 (100.0%) | 0 (0.0%) |
| 5 or more Children | 0 (0.0%) | 0 (0.0%) |
| Total | 412 (92.6%) | 33 (7.4%) |
Income Below Poverty Among Single-Parent Households in Liberty
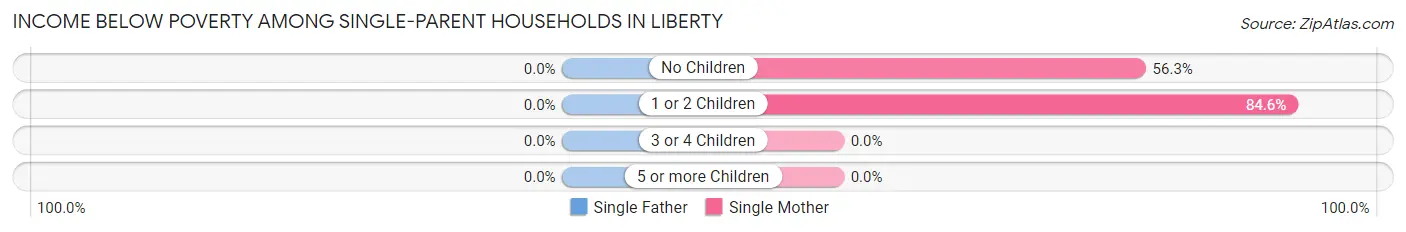
| Children | Single Father | Single Mother |
| No Children | 0 (0.0%) | 9 (56.2%) |
| 1 or 2 Children | 0 (0.0%) | 55 (84.6%) |
| 3 or 4 Children | 0 (0.0%) | 0 (0.0%) |
| 5 or more Children | 0 (0.0%) | 0 (0.0%) |
| Total | 0 (0.0%) | 64 (71.1%) |
Income Below Poverty Among Married-Couple vs Single-Parent Households in Liberty
The poverty data for Liberty shows that 33 of the married-couple family households (7.4%) and 64 of the single-parent households (49.6%) are living below the poverty level. Within the married-couple family households, those with 1 or 2 children have the highest poverty rate, with 5 households (10.2%) falling below the poverty line. Among the single-parent households, those with 1 or 2 children have the highest poverty rate, with 55 household (63.2%) living below poverty.
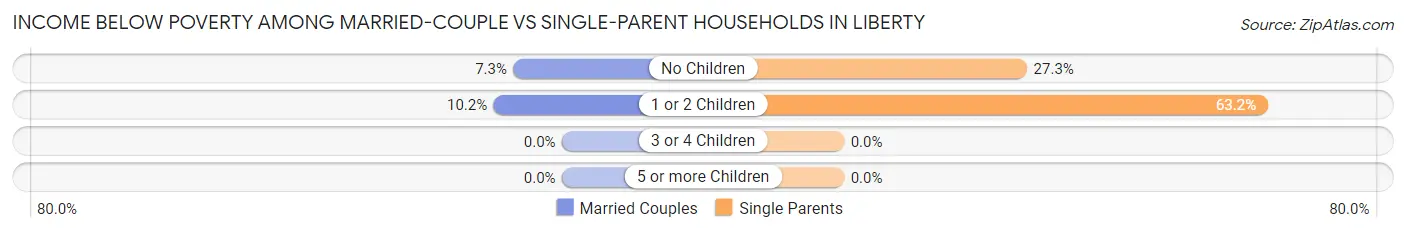
| Children | Married-Couple Families | Single-Parent Households |
| No Children | 28 (7.2%) | 9 (27.3%) |
| 1 or 2 Children | 5 (10.2%) | 55 (63.2%) |
| 3 or 4 Children | 0 (0.0%) | 0 (0.0%) |
| 5 or more Children | 0 (0.0%) | 0 (0.0%) |
| Total | 33 (7.4%) | 64 (49.6%) |
Race in Liberty
The most populous races in Liberty are White / Caucasian (1,930 | 92.6%), Two or more Races (107 | 5.1%), and Hispanic or Latino (36 | 1.7%).
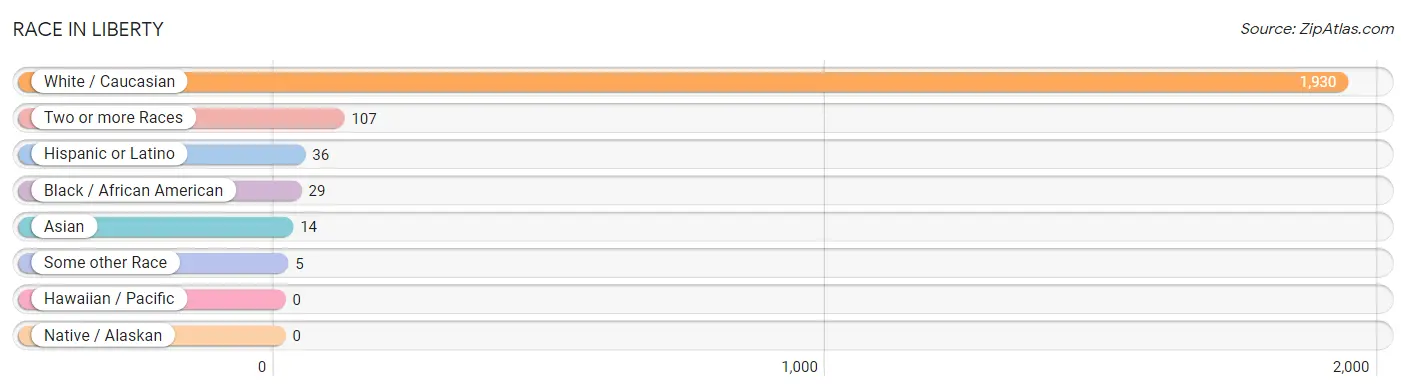
| Race | # Population | % Population |
| Asian | 14 | 0.7% |
| Black / African American | 29 | 1.4% |
| Hawaiian / Pacific | 0 | 0.0% |
| Hispanic or Latino | 36 | 1.7% |
| Native / Alaskan | 0 | 0.0% |
| White / Caucasian | 1,930 | 92.6% |
| Two or more Races | 107 | 5.1% |
| Some other Race | 5 | 0.2% |
| Total | 2,085 | 100.0% |
Ancestry in Liberty
The most populous ancestries reported in Liberty are German (466 | 22.4%), American (259 | 12.4%), English (254 | 12.2%), Irish (213 | 10.2%), and Scottish (98 | 4.7%), together accounting for 61.9% of all Liberty residents.
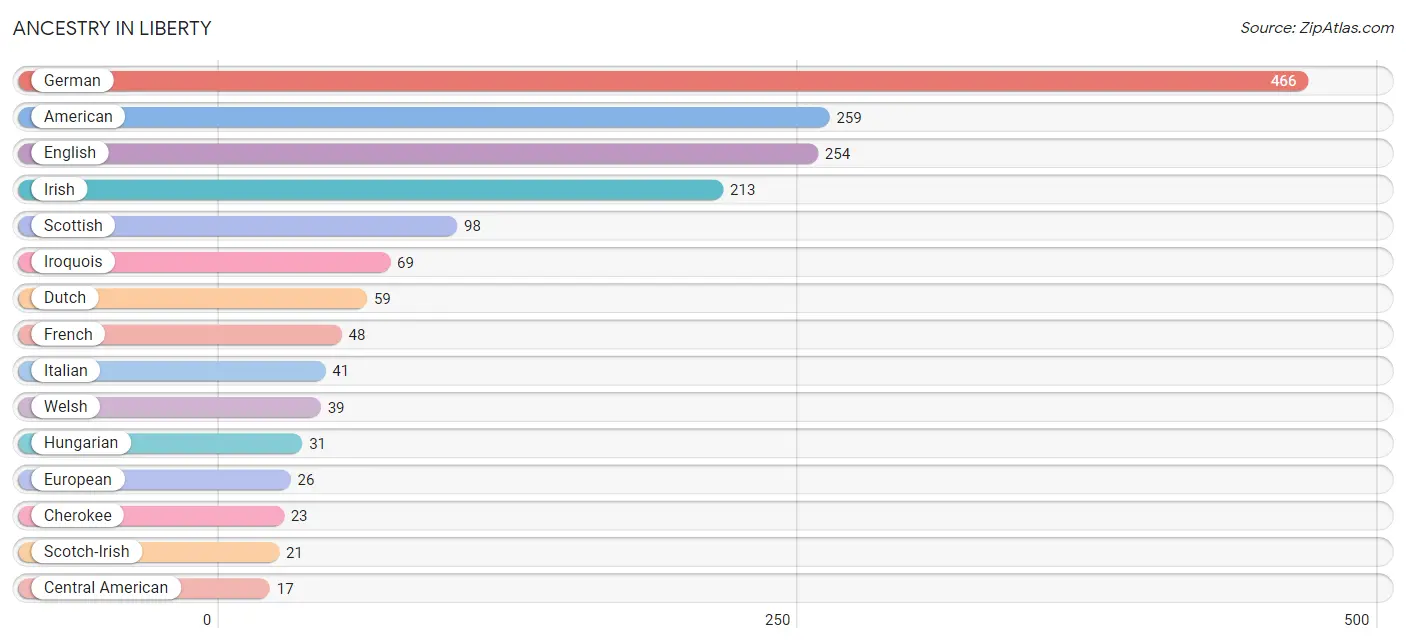
| Ancestry | # Population | % Population |
| American | 259 | 12.4% |
| Bhutanese | 5 | 0.2% |
| British | 4 | 0.2% |
| Central American | 17 | 0.8% |
| Cherokee | 23 | 1.1% |
| Costa Rican | 17 | 0.8% |
| Dutch | 59 | 2.8% |
| English | 254 | 12.2% |
| European | 26 | 1.3% |
| Finnish | 9 | 0.4% |
| French | 48 | 2.3% |
| German | 466 | 22.4% |
| Greek | 3 | 0.1% |
| Hungarian | 31 | 1.5% |
| Irish | 213 | 10.2% |
| Iroquois | 69 | 3.3% |
| Italian | 41 | 2.0% |
| Laotian | 3 | 0.1% |
| Lithuanian | 15 | 0.7% |
| Mexican | 5 | 0.2% |
| Polish | 11 | 0.5% |
| Scandinavian | 9 | 0.4% |
| Scotch-Irish | 21 | 1.0% |
| Scottish | 98 | 4.7% |
| South American | 14 | 0.7% |
| Sri Lankan | 2 | 0.1% |
| Thai | 9 | 0.4% |
| Venezuelan | 14 | 0.7% |
| Welsh | 39 | 1.9% | View All 29 Rows |
Immigrants in Liberty
The most numerous immigrant groups reported in Liberty came from Latin America (36 | 1.7%), Central America (22 | 1.1%), Costa Rica (17 | 0.8%), Asia (14 | 0.7%), and South America (14 | 0.7%), together accounting for 4.9% of all Liberty residents.
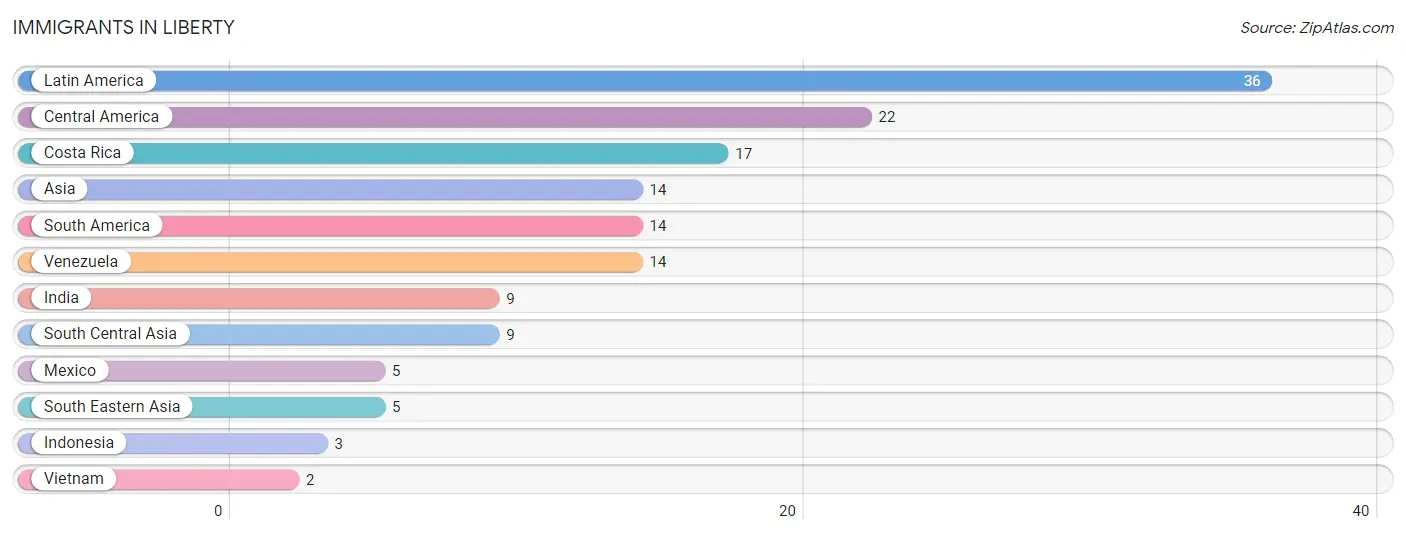
| Immigration Origin | # Population | % Population |
| Asia | 14 | 0.7% |
| Central America | 22 | 1.1% |
| Costa Rica | 17 | 0.8% |
| India | 9 | 0.4% |
| Indonesia | 3 | 0.1% |
| Latin America | 36 | 1.7% |
| Mexico | 5 | 0.2% |
| South America | 14 | 0.7% |
| South Central Asia | 9 | 0.4% |
| South Eastern Asia | 5 | 0.2% |
| Venezuela | 14 | 0.7% |
| Vietnam | 2 | 0.1% | View All 12 Rows |
Sex and Age in Liberty
Sex and Age in Liberty
The most populous age groups in Liberty are 25 to 29 Years (109 | 10.7%) for men and 55 to 59 Years (156 | 14.7%) for women.
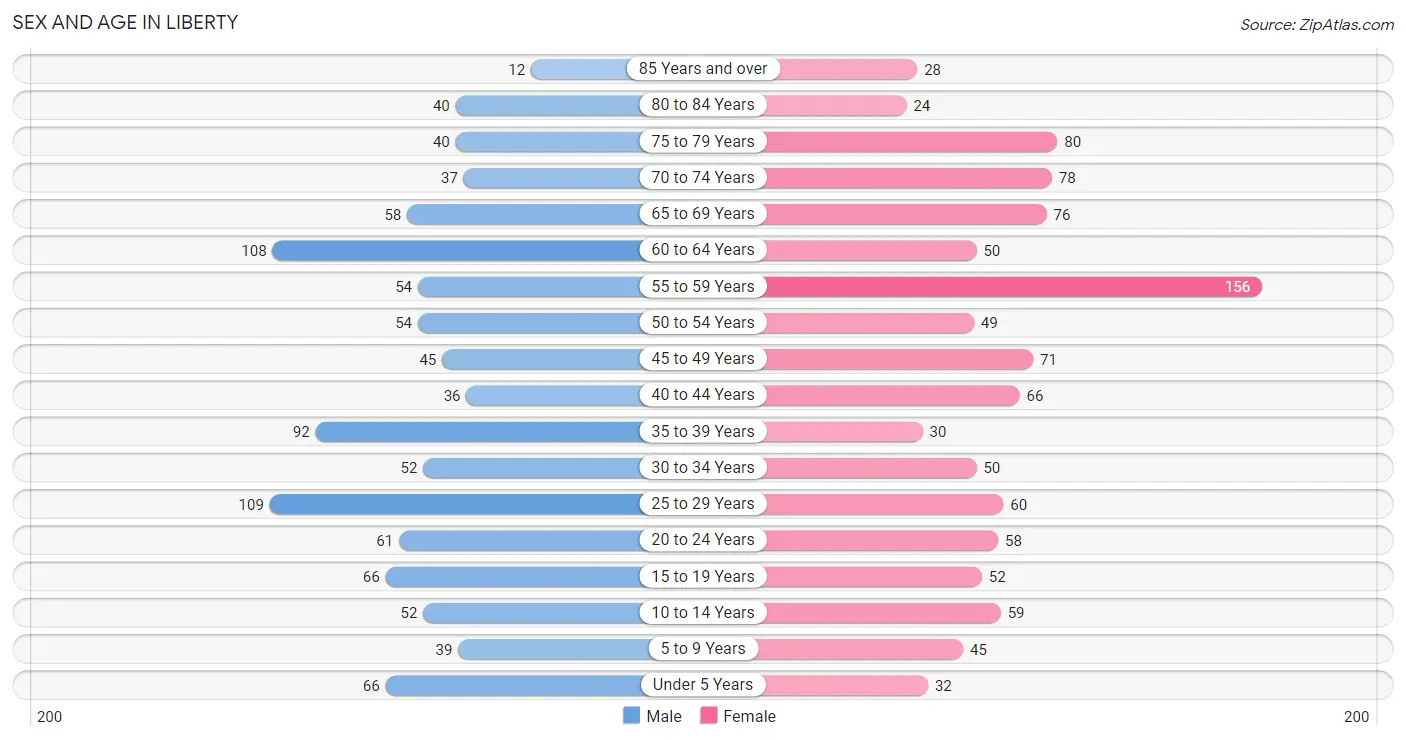
| Age Bracket | Male | Female |
| Under 5 Years | 66 (6.5%) | 32 (3.0%) |
| 5 to 9 Years | 39 (3.8%) | 45 (4.2%) |
| 10 to 14 Years | 52 (5.1%) | 59 (5.6%) |
| 15 to 19 Years | 66 (6.5%) | 52 (4.9%) |
| 20 to 24 Years | 61 (6.0%) | 58 (5.4%) |
| 25 to 29 Years | 109 (10.7%) | 60 (5.6%) |
| 30 to 34 Years | 52 (5.1%) | 50 (4.7%) |
| 35 to 39 Years | 92 (9.0%) | 30 (2.8%) |
| 40 to 44 Years | 36 (3.5%) | 66 (6.2%) |
| 45 to 49 Years | 45 (4.4%) | 71 (6.7%) |
| 50 to 54 Years | 54 (5.3%) | 49 (4.6%) |
| 55 to 59 Years | 54 (5.3%) | 156 (14.7%) |
| 60 to 64 Years | 108 (10.6%) | 50 (4.7%) |
| 65 to 69 Years | 58 (5.7%) | 76 (7.1%) |
| 70 to 74 Years | 37 (3.6%) | 78 (7.3%) |
| 75 to 79 Years | 40 (3.9%) | 80 (7.5%) |
| 80 to 84 Years | 40 (3.9%) | 24 (2.3%) |
| 85 Years and over | 12 (1.2%) | 28 (2.6%) |
| Total | 1,021 (100.0%) | 1,064 (100.0%) |
Families and Households in Liberty
Median Family Size in Liberty
The median family size in Liberty is 2.77 persons per family, with married-couple families (445 | 77.5%) accounting for the largest median family size of 2.83 persons per family. On the other hand, single female/mother families (90 | 15.7%) represent the smallest median family size with 2.50 persons per family.
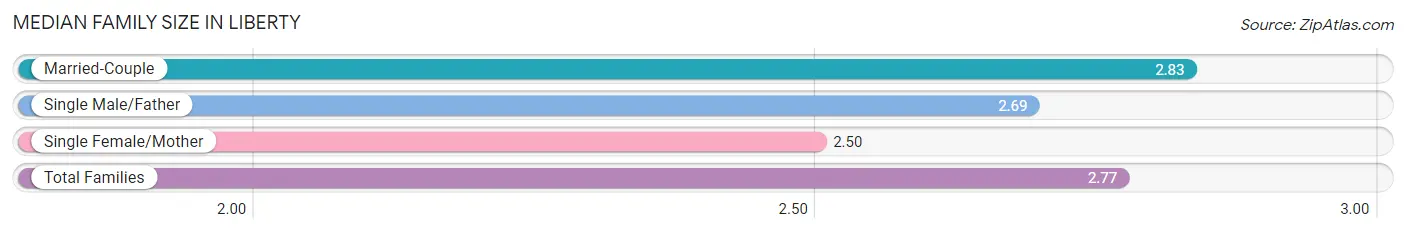
| Family Type | # Families | Family Size |
| Married-Couple | 445 (77.5%) | 2.83 |
| Single Male/Father | 39 (6.8%) | 2.69 |
| Single Female/Mother | 90 (15.7%) | 2.50 |
| Total Families | 574 (100.0%) | 2.77 |
Median Household Size in Liberty
The median household size in Liberty is 2.10 persons per household, with single male/father households (39 | 4.0%) accounting for the largest median household size of 3.05 persons per household. non-family households (394 | 40.7%) represent the smallest median household size with 1.08 persons per household.
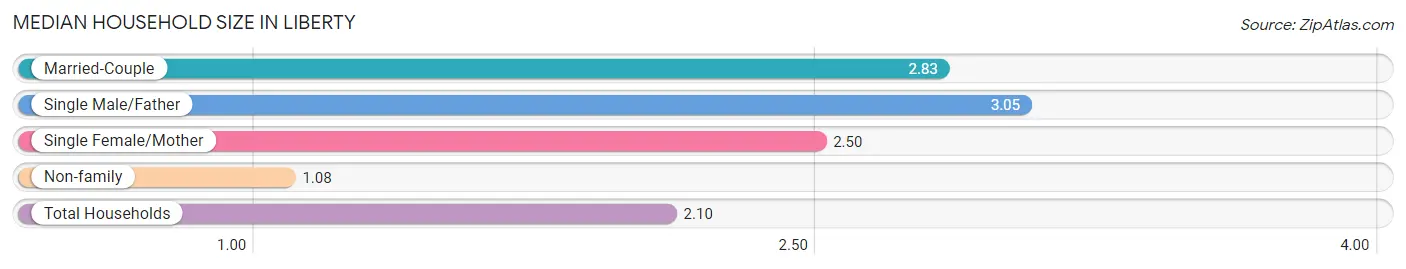
| Household Type | # Households | Household Size |
| Married-Couple | 445 (46.0%) | 2.83 |
| Single Male/Father | 39 (4.0%) | 3.05 |
| Single Female/Mother | 90 (9.3%) | 2.50 |
| Non-family | 394 (40.7%) | 1.08 |
| Total Households | 968 (100.0%) | 2.10 |
Household Size by Marriage Status in Liberty
Out of a total of 968 households in Liberty, 574 (59.3%) are family households, while 394 (40.7%) are nonfamily households. The most numerous type of family households are 2-person households, comprising 334, and the most common type of nonfamily households are 1-person households, comprising 359.
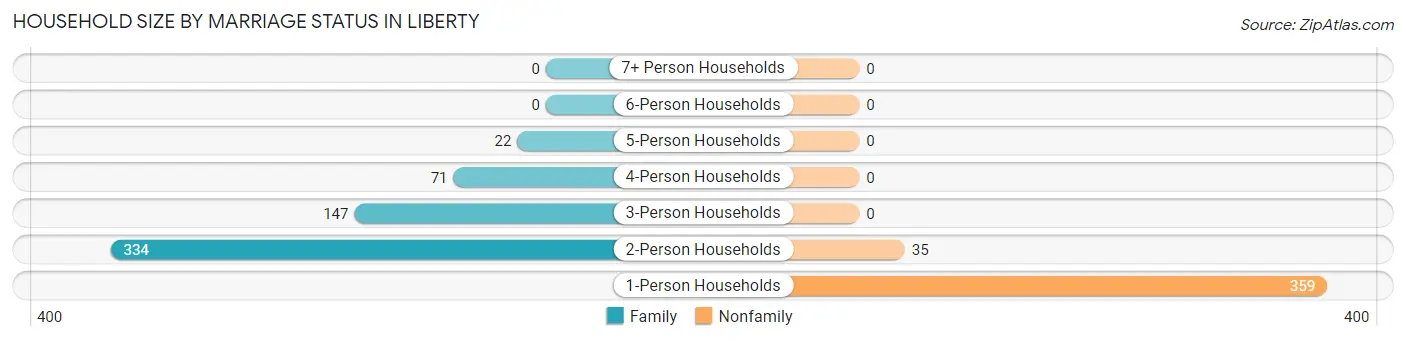
| Household Size | Family Households | Nonfamily Households |
| 1-Person Households | - | 359 (37.1%) |
| 2-Person Households | 334 (34.5%) | 35 (3.6%) |
| 3-Person Households | 147 (15.2%) | 0 (0.0%) |
| 4-Person Households | 71 (7.3%) | 0 (0.0%) |
| 5-Person Households | 22 (2.3%) | 0 (0.0%) |
| 6-Person Households | 0 (0.0%) | 0 (0.0%) |
| 7+ Person Households | 0 (0.0%) | 0 (0.0%) |
| Total | 574 (59.3%) | 394 (40.7%) |
Female Fertility in Liberty
Fertility by Age in Liberty
Average fertility rate in Liberty is 40.0 births per 1,000 women. Women in the age bracket of 20 to 34 years have the highest fertility rate with 95.0 births per 1,000 women. Women in the age bracket of 20 to 34 years acount for 100.0% of all women with births.
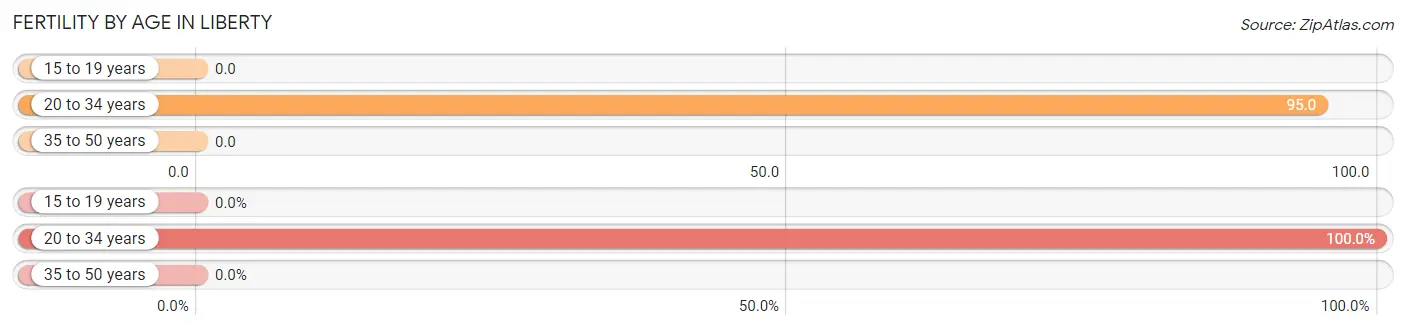
| Age Bracket | Women with Births | Births / 1,000 Women |
| 15 to 19 years | 0 (0.0%) | 0.0 |
| 20 to 34 years | 16 (100.0%) | 95.0 |
| 35 to 50 years | 0 (0.0%) | 0.0 |
| Total | 16 (100.0%) | 40.0 |
Fertility by Age by Marriage Status in Liberty
12.5% of women with births (16) in Liberty are married. The highest percentage of unmarried women with births falls into 20 to 34 years age bracket with 87.5% of them unmarried at the time of birth, while the lowest percentage of unmarried women with births belong to 20 to 34 years age bracket with 87.5% of them unmarried.
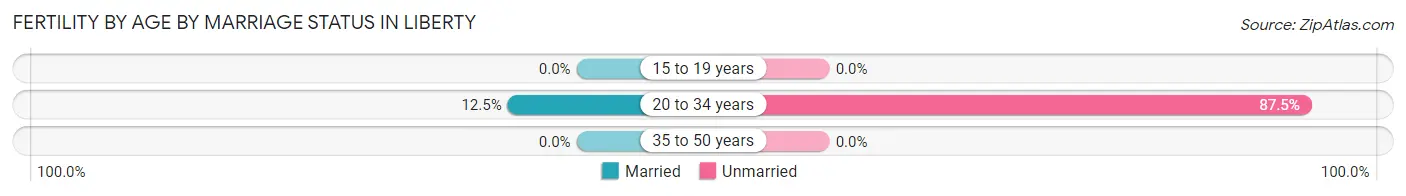
| Age Bracket | Married | Unmarried |
| 15 to 19 years | 0 (0.0%) | 0 (0.0%) |
| 20 to 34 years | 2 (12.5%) | 14 (87.5%) |
| 35 to 50 years | 0 (0.0%) | 0 (0.0%) |
| Total | 2 (12.5%) | 14 (87.5%) |
Fertility by Education in Liberty
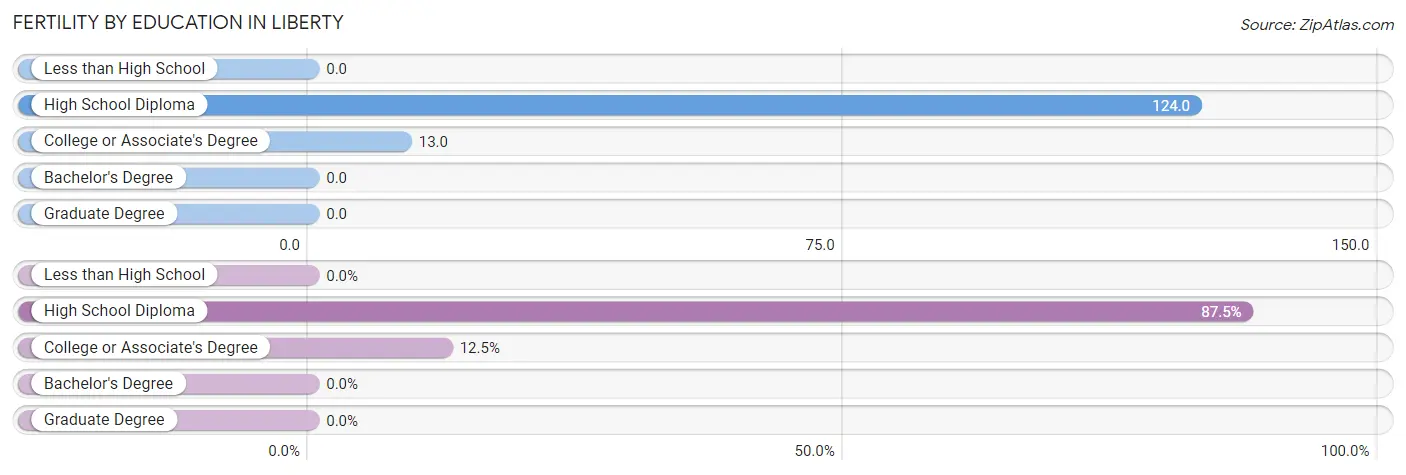
| Educational Attainment | Women with Births | Births / 1,000 Women |
| Less than High School | 0 (0.0%) | 0.0 |
| High School Diploma | 14 (87.5%) | 124.0 |
| College or Associate's Degree | 2 (12.5%) | 13.0 |
| Bachelor's Degree | 0 (0.0%) | 0.0 |
| Graduate Degree | 0 (0.0%) | 0.0 |
| Total | 16 (100.0%) | 40.0 |
Fertility by Education by Marriage Status in Liberty
87.5% of women with births in Liberty are unmarried. Women with the educational attainment of college or associate's degree are most likely to be married with 100.0% of them married at childbirth, while women with the educational attainment of high school diploma are least likely to be married with 100.0% of them unmarried at childbirth.
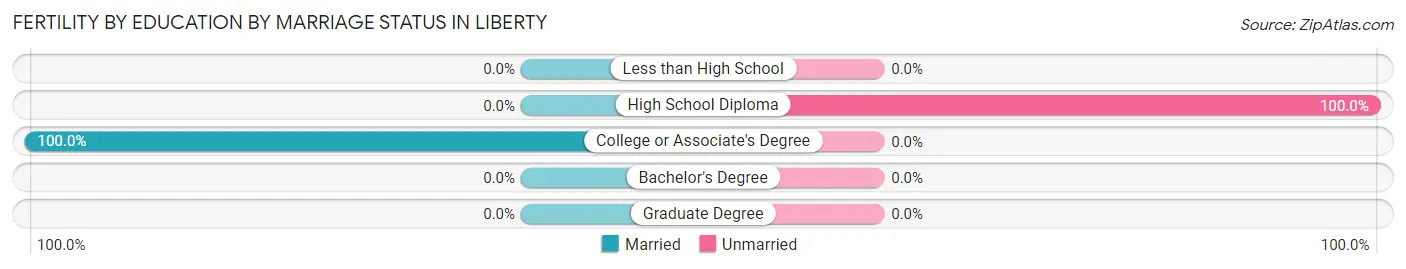
| Educational Attainment | Married | Unmarried |
| Less than High School | 0 (0.0%) | 0 (0.0%) |
| High School Diploma | 0 (0.0%) | 14 (100.0%) |
| College or Associate's Degree | 2 (100.0%) | 0 (0.0%) |
| Bachelor's Degree | 0 (0.0%) | 0 (0.0%) |
| Graduate Degree | 0 (0.0%) | 0 (0.0%) |
| Total | 2 (12.5%) | 14 (87.5%) |
Employment Characteristics in Liberty
Employment by Class of Employer in Liberty
Among the 1,083 employed individuals in Liberty, private company employees (794 | 73.3%), not-for-profit organizations (97 | 9.0%), and state government employees (74 | 6.8%) make up the most common classes of employment.
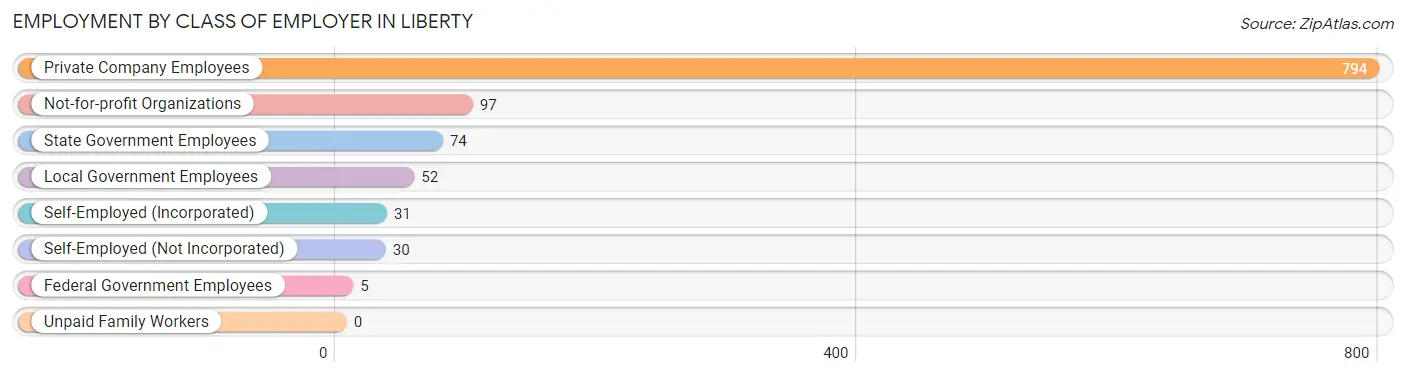
| Employer Class | # Employees | % Employees |
| Private Company Employees | 794 | 73.3% |
| Self-Employed (Incorporated) | 31 | 2.9% |
| Self-Employed (Not Incorporated) | 30 | 2.8% |
| Not-for-profit Organizations | 97 | 9.0% |
| Local Government Employees | 52 | 4.8% |
| State Government Employees | 74 | 6.8% |
| Federal Government Employees | 5 | 0.5% |
| Unpaid Family Workers | 0 | 0.0% |
| Total | 1,083 | 100.0% |
Employment Status by Age in Liberty
According to the labor force statistics for Liberty, out of the total population over 16 years of age (1,775), 64.5% or 1,145 individuals are in the labor force, with 3.4% or 39 of them unemployed. The age group with the highest labor force participation rate is 25 to 29 years, with 95.3% or 161 individuals in the labor force. Within the labor force, the 25 to 29 years age range has the highest percentage of unemployed individuals, with 24.2% or 39 of them being unemployed.
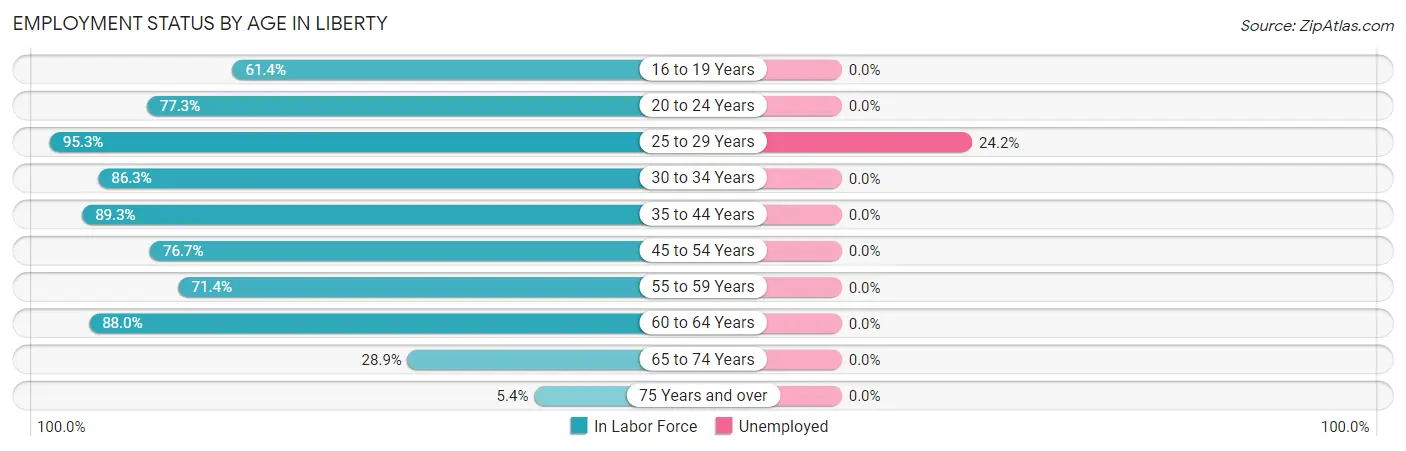
| Age Bracket | In Labor Force | Unemployed |
| 16 to 19 Years | 62 (61.4%) | 0 (0.0%) |
| 20 to 24 Years | 92 (77.3%) | 0 (0.0%) |
| 25 to 29 Years | 161 (95.3%) | 39 (24.2%) |
| 30 to 34 Years | 88 (86.3%) | 0 (0.0%) |
| 35 to 44 Years | 200 (89.3%) | 0 (0.0%) |
| 45 to 54 Years | 168 (76.7%) | 0 (0.0%) |
| 55 to 59 Years | 150 (71.4%) | 0 (0.0%) |
| 60 to 64 Years | 139 (88.0%) | 0 (0.0%) |
| 65 to 74 Years | 72 (28.9%) | 0 (0.0%) |
| 75 Years and over | 12 (5.4%) | 0 (0.0%) |
| Total | 1,145 (64.5%) | 39 (3.4%) |
Employment Status by Educational Attainment in Liberty
According to labor force statistics for Liberty, 83.7% of individuals (906) out of the total population between 25 and 64 years of age (1,082) are in the labor force, with 4.3% or 39 of them being unemployed. The group with the highest labor force participation rate are those with the educational attainment of college / associate degree, with 91.8% or 313 individuals in the labor force. Within the labor force, individuals with college / associate degree education have the highest percentage of unemployment, with 12.5% or 39 of them being unemployed.
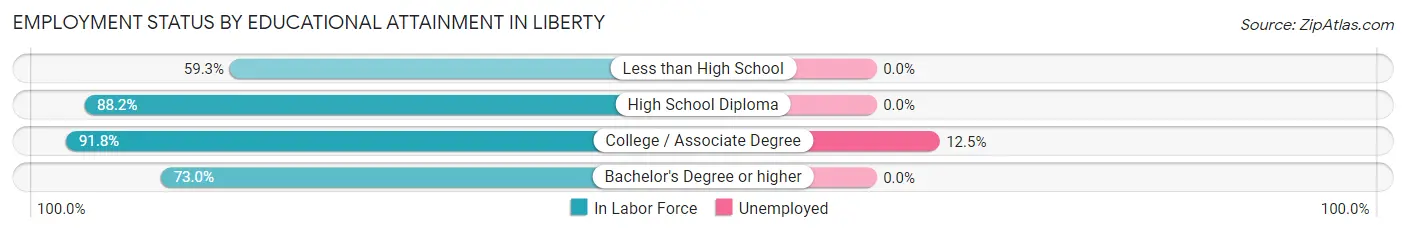
| Educational Attainment | In Labor Force | Unemployed |
| Less than High School | 51 (59.3%) | 0 (0.0%) |
| High School Diploma | 372 (88.2%) | 0 (0.0%) |
| College / Associate Degree | 313 (91.8%) | 43 (12.5%) |
| Bachelor's Degree or higher | 170 (73.0%) | 0 (0.0%) |
| Total | 906 (83.7%) | 47 (4.3%) |
Employment Occupations by Sex in Liberty
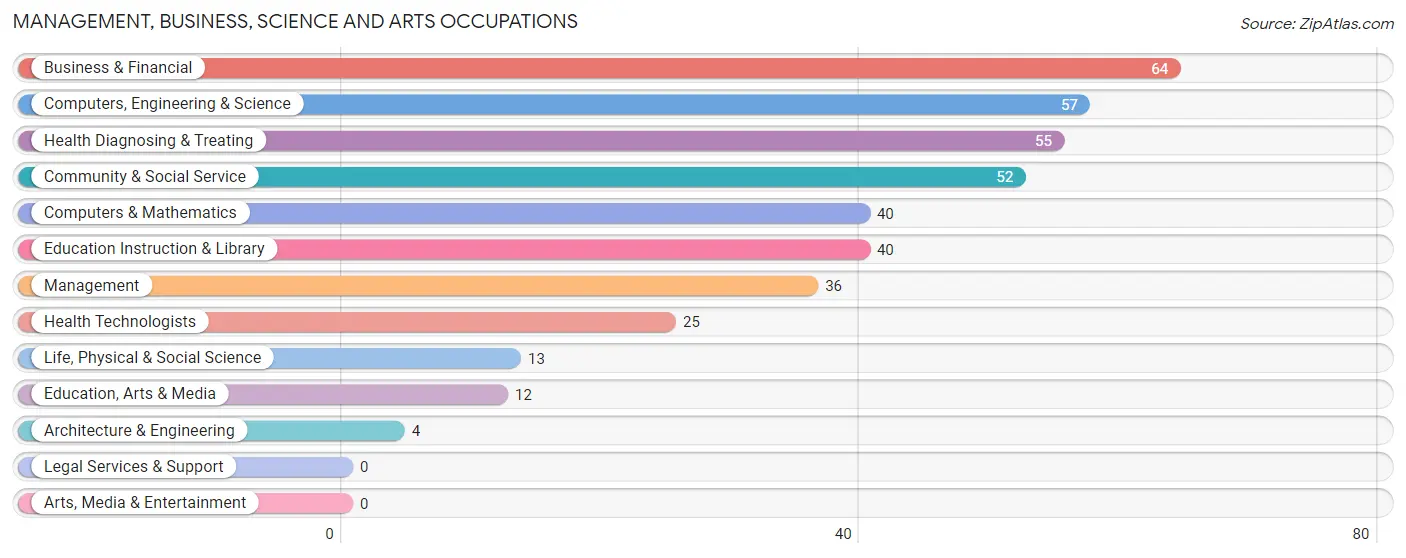
Management, Business, Science and Arts Occupations
The most common Management, Business, Science and Arts occupations in Liberty are Business & Financial (64 | 5.8%), Computers, Engineering & Science (57 | 5.2%), Health Diagnosing & Treating (55 | 5.0%), Community & Social Service (52 | 4.7%), and Computers & Mathematics (40 | 3.6%).
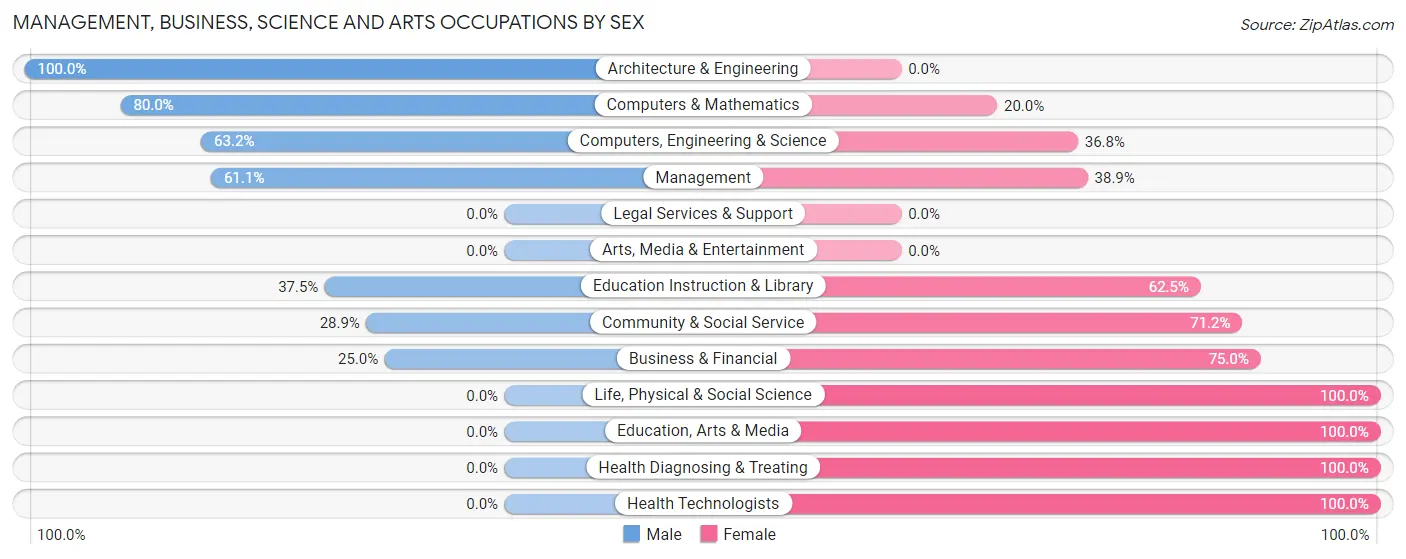
Management, Business, Science and Arts Occupations by Sex
Within the Management, Business, Science and Arts occupations in Liberty, the most male-oriented occupations are Architecture & Engineering (100.0%), Computers & Mathematics (80.0%), and Computers, Engineering & Science (63.2%), while the most female-oriented occupations are Life, Physical & Social Science (100.0%), Education, Arts & Media (100.0%), and Health Diagnosing & Treating (100.0%).
| Occupation | Male | Female |
| Management | 22 (61.1%) | 14 (38.9%) |
| Business & Financial | 16 (25.0%) | 48 (75.0%) |
| Computers, Engineering & Science | 36 (63.2%) | 21 (36.8%) |
| Computers & Mathematics | 32 (80.0%) | 8 (20.0%) |
| Architecture & Engineering | 4 (100.0%) | 0 (0.0%) |
| Life, Physical & Social Science | 0 (0.0%) | 13 (100.0%) |
| Community & Social Service | 15 (28.8%) | 37 (71.2%) |
| Education, Arts & Media | 0 (0.0%) | 12 (100.0%) |
| Legal Services & Support | 0 (0.0%) | 0 (0.0%) |
| Education Instruction & Library | 15 (37.5%) | 25 (62.5%) |
| Arts, Media & Entertainment | 0 (0.0%) | 0 (0.0%) |
| Health Diagnosing & Treating | 0 (0.0%) | 55 (100.0%) |
| Health Technologists | 0 (0.0%) | 25 (100.0%) |
| Total (Category) | 89 (33.7%) | 175 (66.3%) |
| Total (Overall) | 620 (56.1%) | 485 (43.9%) |
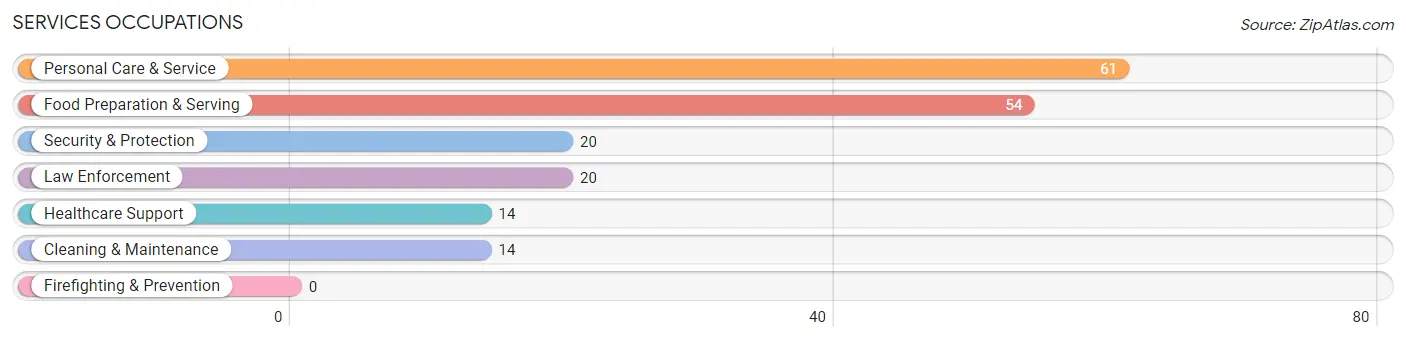
Services Occupations
The most common Services occupations in Liberty are Personal Care & Service (61 | 5.5%), Food Preparation & Serving (54 | 4.9%), Security & Protection (20 | 1.8%), Law Enforcement (20 | 1.8%), and Healthcare Support (14 | 1.3%).
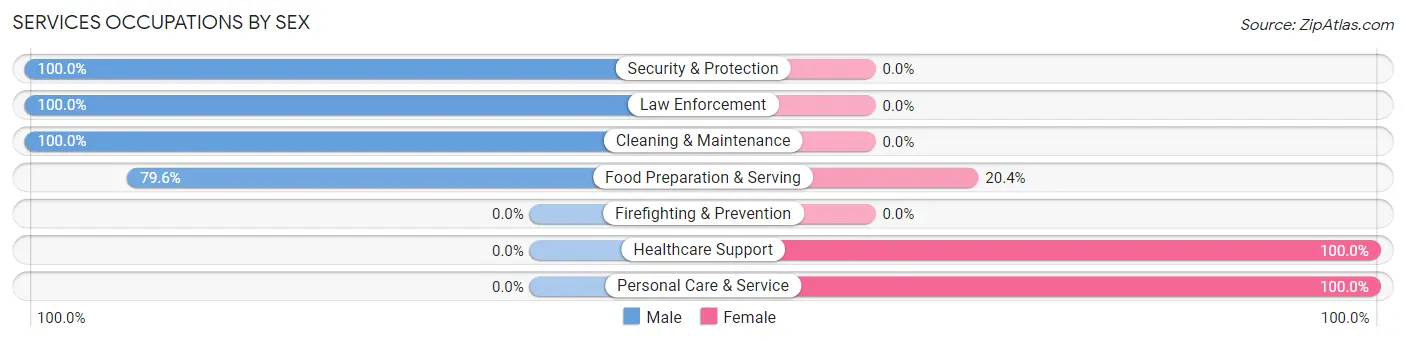
Services Occupations by Sex
Within the Services occupations in Liberty, the most male-oriented occupations are Security & Protection (100.0%), Law Enforcement (100.0%), and Cleaning & Maintenance (100.0%), while the most female-oriented occupations are Healthcare Support (100.0%), Personal Care & Service (100.0%), and Food Preparation & Serving (20.4%).
| Occupation | Male | Female |
| Healthcare Support | 0 (0.0%) | 14 (100.0%) |
| Security & Protection | 20 (100.0%) | 0 (0.0%) |
| Firefighting & Prevention | 0 (0.0%) | 0 (0.0%) |
| Law Enforcement | 20 (100.0%) | 0 (0.0%) |
| Food Preparation & Serving | 43 (79.6%) | 11 (20.4%) |
| Cleaning & Maintenance | 14 (100.0%) | 0 (0.0%) |
| Personal Care & Service | 0 (0.0%) | 61 (100.0%) |
| Total (Category) | 77 (47.2%) | 86 (52.8%) |
| Total (Overall) | 620 (56.1%) | 485 (43.9%) |
Sales and Office Occupations
The most common Sales and Office occupations in Liberty are Office & Administration (159 | 14.4%), and Sales & Related (147 | 13.3%).
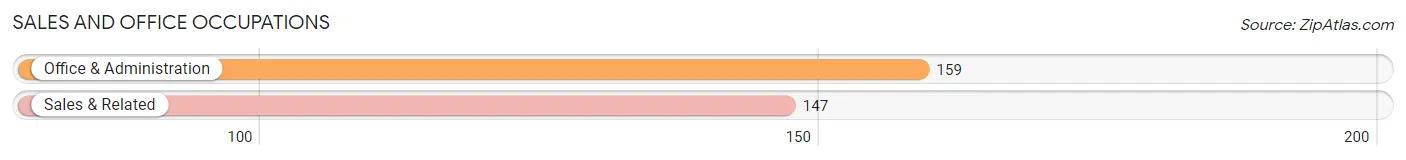
Sales and Office Occupations by Sex
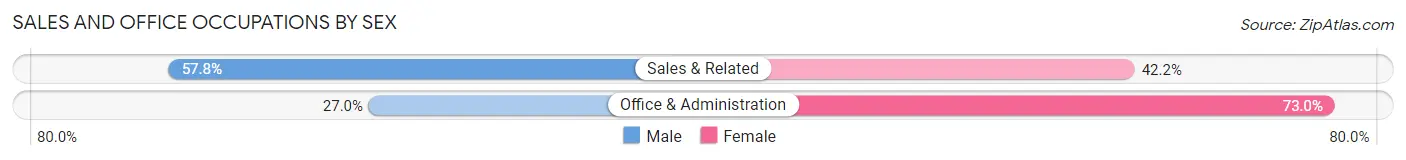
| Occupation | Male | Female |
| Sales & Related | 85 (57.8%) | 62 (42.2%) |
| Office & Administration | 43 (27.0%) | 116 (73.0%) |
| Total (Category) | 128 (41.8%) | 178 (58.2%) |
| Total (Overall) | 620 (56.1%) | 485 (43.9%) |
Natural Resources, Construction and Maintenance Occupations
The most common Natural Resources, Construction and Maintenance occupations in Liberty are Installation, Maintenance & Repair (61 | 5.5%), and Construction & Extraction (48 | 4.3%).
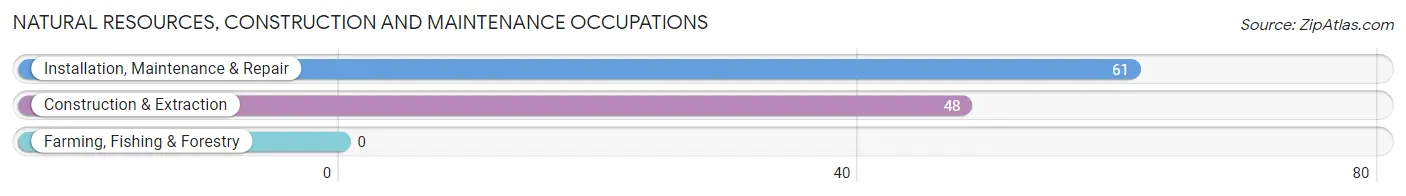
Natural Resources, Construction and Maintenance Occupations by Sex
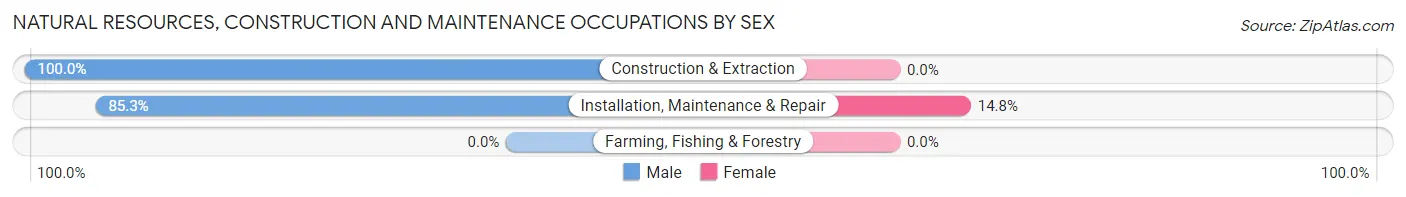
| Occupation | Male | Female |
| Farming, Fishing & Forestry | 0 (0.0%) | 0 (0.0%) |
| Construction & Extraction | 48 (100.0%) | 0 (0.0%) |
| Installation, Maintenance & Repair | 52 (85.3%) | 9 (14.7%) |
| Total (Category) | 100 (91.7%) | 9 (8.3%) |
| Total (Overall) | 620 (56.1%) | 485 (43.9%) |
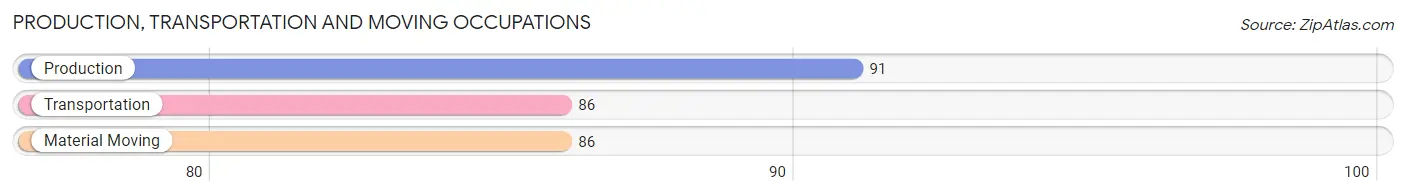
Production, Transportation and Moving Occupations
The most common Production, Transportation and Moving occupations in Liberty are Production (91 | 8.2%), Transportation (86 | 7.8%), and Material Moving (86 | 7.8%).
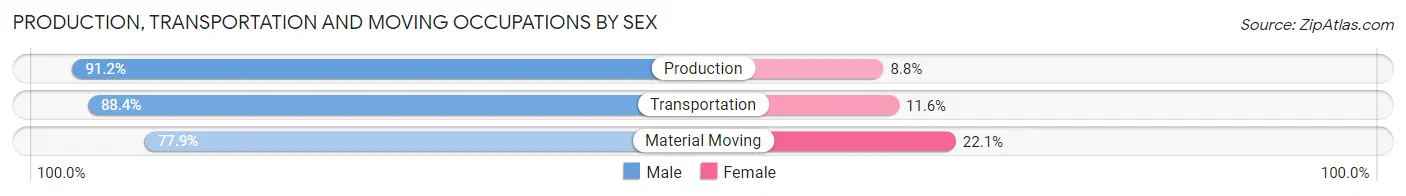
Production, Transportation and Moving Occupations by Sex
| Occupation | Male | Female |
| Production | 83 (91.2%) | 8 (8.8%) |
| Transportation | 76 (88.4%) | 10 (11.6%) |
| Material Moving | 67 (77.9%) | 19 (22.1%) |
| Total (Category) | 226 (85.9%) | 37 (14.1%) |
| Total (Overall) | 620 (56.1%) | 485 (43.9%) |
Employment Industries by Sex in Liberty
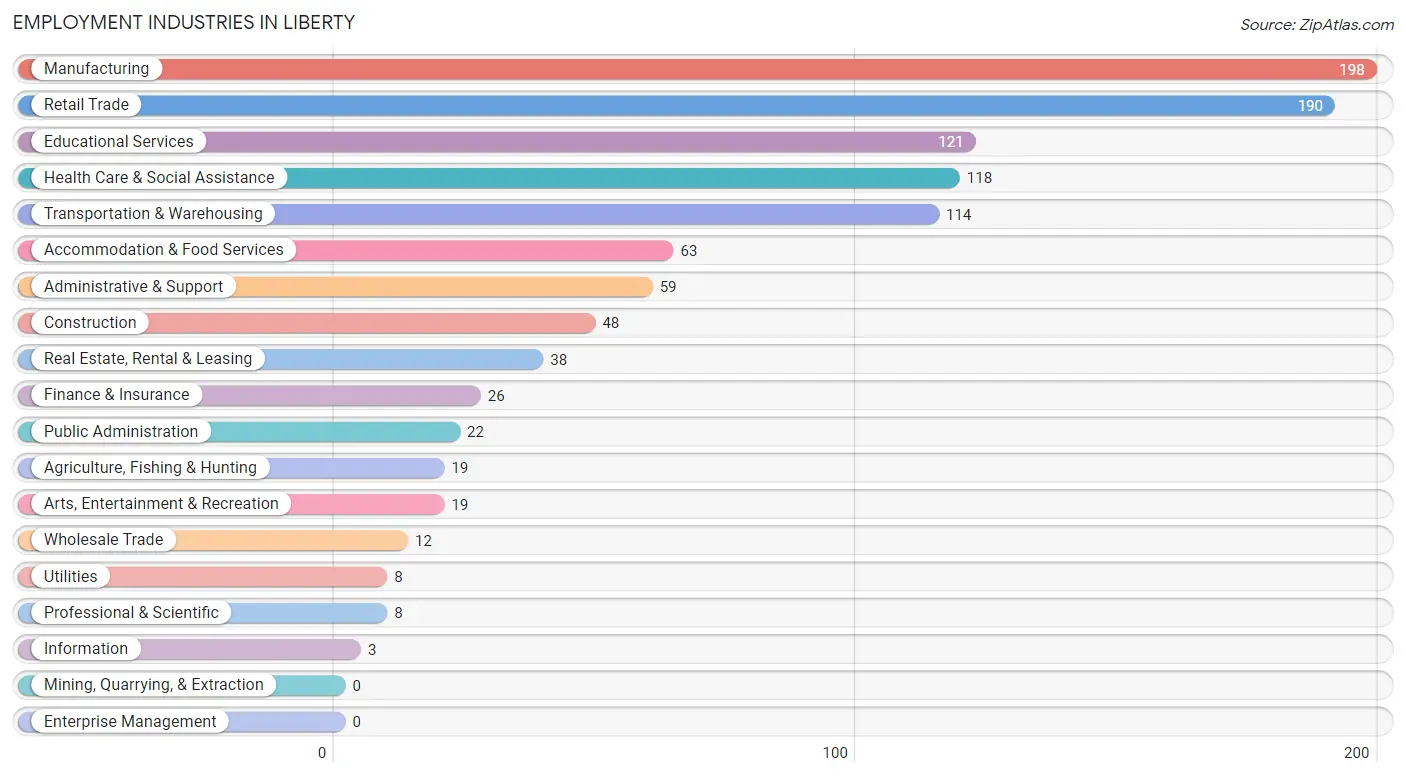
Employment Industries in Liberty
The major employment industries in Liberty include Manufacturing (198 | 17.9%), Retail Trade (190 | 17.2%), Educational Services (121 | 11.0%), Health Care & Social Assistance (118 | 10.7%), and Transportation & Warehousing (114 | 10.3%).
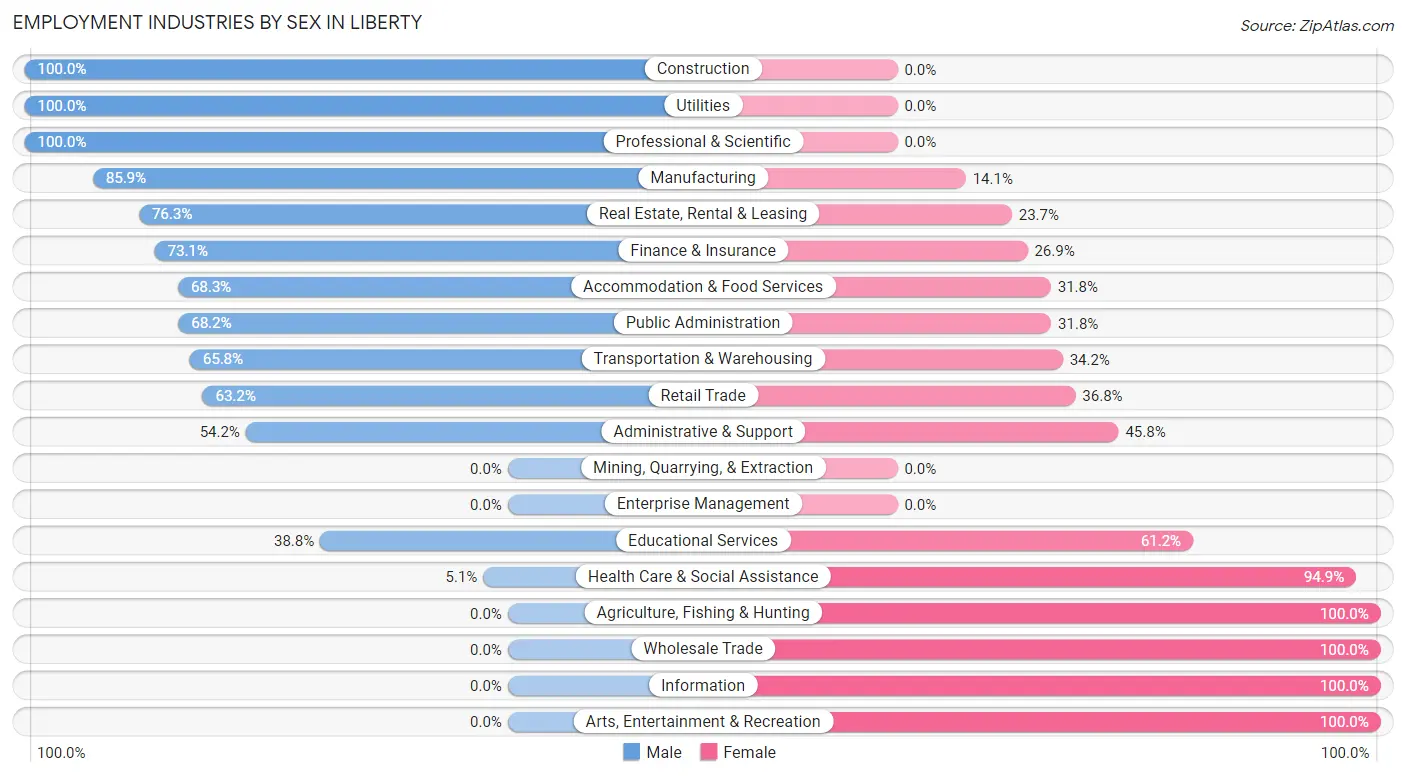
Employment Industries by Sex in Liberty
The Liberty industries that see more men than women are Construction (100.0%), Utilities (100.0%), and Professional & Scientific (100.0%), whereas the industries that tend to have a higher number of women are Agriculture, Fishing & Hunting (100.0%), Wholesale Trade (100.0%), and Information (100.0%).
| Industry | Male | Female |
| Agriculture, Fishing & Hunting | 0 (0.0%) | 19 (100.0%) |
| Mining, Quarrying, & Extraction | 0 (0.0%) | 0 (0.0%) |
| Construction | 48 (100.0%) | 0 (0.0%) |
| Manufacturing | 170 (85.9%) | 28 (14.1%) |
| Wholesale Trade | 0 (0.0%) | 12 (100.0%) |
| Retail Trade | 120 (63.2%) | 70 (36.8%) |
| Transportation & Warehousing | 75 (65.8%) | 39 (34.2%) |
| Utilities | 8 (100.0%) | 0 (0.0%) |
| Information | 0 (0.0%) | 3 (100.0%) |
| Finance & Insurance | 19 (73.1%) | 7 (26.9%) |
| Real Estate, Rental & Leasing | 29 (76.3%) | 9 (23.7%) |
| Professional & Scientific | 8 (100.0%) | 0 (0.0%) |
| Enterprise Management | 0 (0.0%) | 0 (0.0%) |
| Administrative & Support | 32 (54.2%) | 27 (45.8%) |
| Educational Services | 47 (38.8%) | 74 (61.2%) |
| Health Care & Social Assistance | 6 (5.1%) | 112 (94.9%) |
| Arts, Entertainment & Recreation | 0 (0.0%) | 19 (100.0%) |
| Accommodation & Food Services | 43 (68.2%) | 20 (31.8%) |
| Public Administration | 15 (68.2%) | 7 (31.8%) |
| Total | 620 (56.1%) | 485 (43.9%) |
Education in Liberty
School Enrollment in Liberty
The most common levels of schooling among the 305 students in Liberty are middle school (96 | 31.5%), elementary school (84 | 27.5%), and high school (57 | 18.7%).
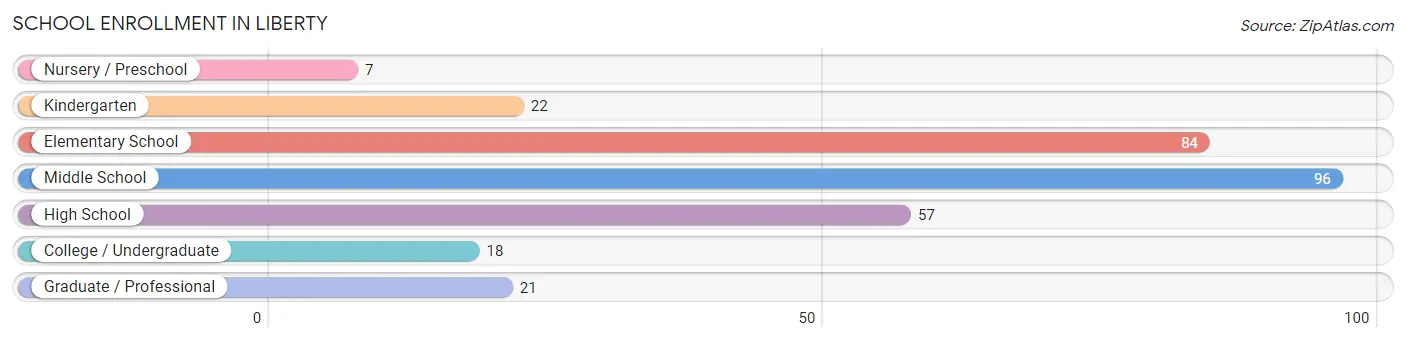
| School Level | # Students | % Students |
| Nursery / Preschool | 7 | 2.3% |
| Kindergarten | 22 | 7.2% |
| Elementary School | 84 | 27.5% |
| Middle School | 96 | 31.5% |
| High School | 57 | 18.7% |
| College / Undergraduate | 18 | 5.9% |
| Graduate / Professional | 21 | 6.9% |
| Total | 305 | 100.0% |
School Enrollment by Age by Funding Source in Liberty
Out of a total of 305 students who are enrolled in schools in Liberty, 7 (2.3%) attend a private institution, while the remaining 298 (97.7%) are enrolled in public schools. The age group of 5 to 9 year old has the highest likelihood of being enrolled in private schools, with 7 (8.3% in the age bracket) enrolled. Conversely, the age group of 10 to 14 year olds has the lowest likelihood of being enrolled in a private school, with 108 (100.0% in the age bracket) attending a public institution.
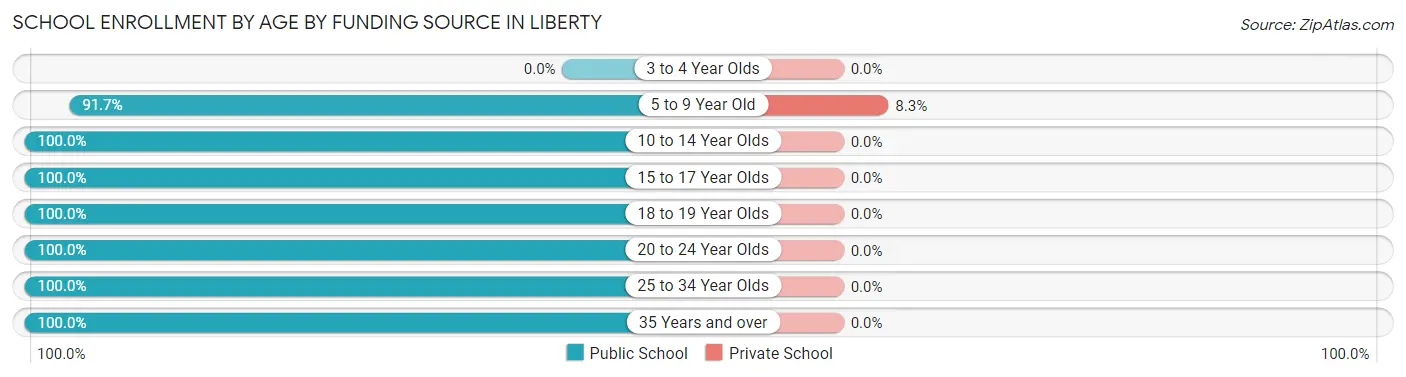
| Age Bracket | Public School | Private School |
| 3 to 4 Year Olds | 0 (0.0%) | 0 (0.0%) |
| 5 to 9 Year Old | 77 (91.7%) | 7 (8.3%) |
| 10 to 14 Year Olds | 108 (100.0%) | 0 (0.0%) |
| 15 to 17 Year Olds | 69 (100.0%) | 0 (0.0%) |
| 18 to 19 Year Olds | 5 (100.0%) | 0 (0.0%) |
| 20 to 24 Year Olds | 9 (100.0%) | 0 (0.0%) |
| 25 to 34 Year Olds | 20 (100.0%) | 0 (0.0%) |
| 35 Years and over | 10 (100.0%) | 0 (0.0%) |
| Total | 298 (97.7%) | 7 (2.3%) |
Educational Attainment by Field of Study in Liberty
Science & technology (76 | 21.5%), business (50 | 14.1%), education (47 | 13.3%), arts & humanities (44 | 12.4%), and bio, nature & agricultural (22 | 6.2%) are the most common fields of study among 354 individuals in Liberty who have obtained a bachelor's degree or higher.
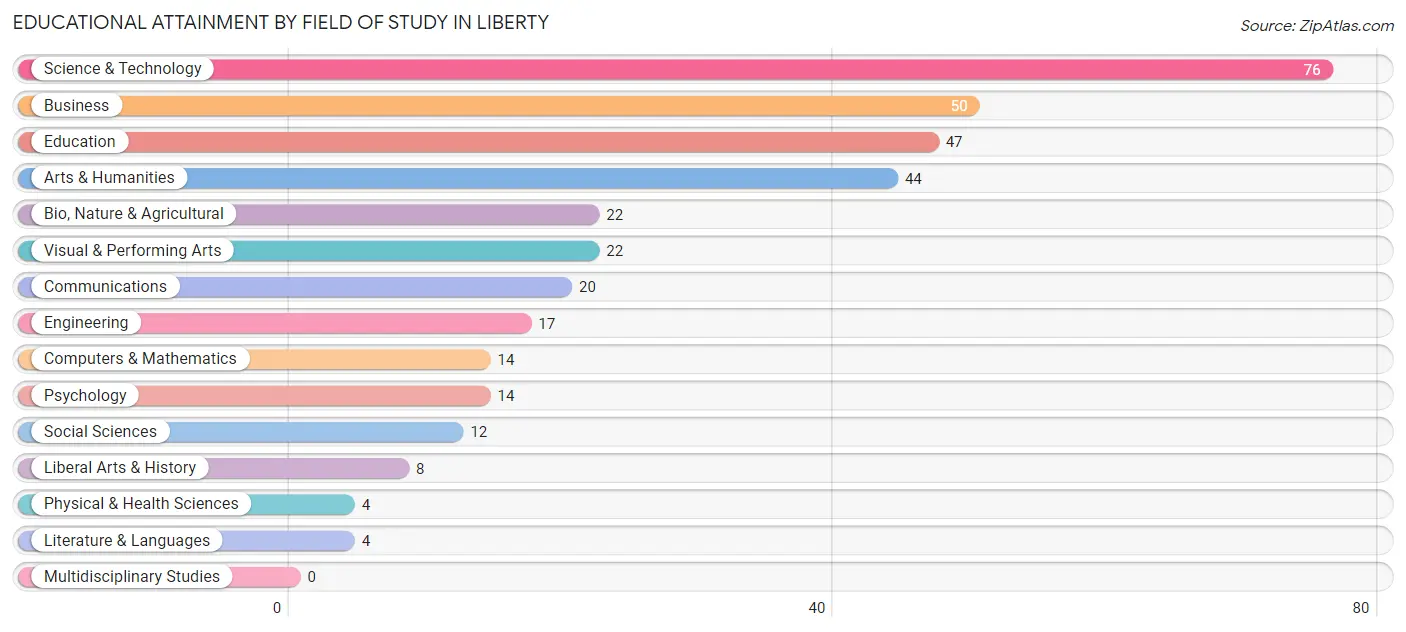
| Field of Study | # Graduates | % Graduates |
| Computers & Mathematics | 14 | 4.0% |
| Bio, Nature & Agricultural | 22 | 6.2% |
| Physical & Health Sciences | 4 | 1.1% |
| Psychology | 14 | 4.0% |
| Social Sciences | 12 | 3.4% |
| Engineering | 17 | 4.8% |
| Multidisciplinary Studies | 0 | 0.0% |
| Science & Technology | 76 | 21.5% |
| Business | 50 | 14.1% |
| Education | 47 | 13.3% |
| Literature & Languages | 4 | 1.1% |
| Liberal Arts & History | 8 | 2.3% |
| Visual & Performing Arts | 22 | 6.2% |
| Communications | 20 | 5.7% |
| Arts & Humanities | 44 | 12.4% |
| Total | 354 | 100.0% |
Transportation & Commute in Liberty
Vehicle Availability by Sex in Liberty
The most prevalent vehicle ownership categories in Liberty are males with 2 vehicles (265, accounting for 43.9%) and females with 2 vehicles (205, making up 55.3%).
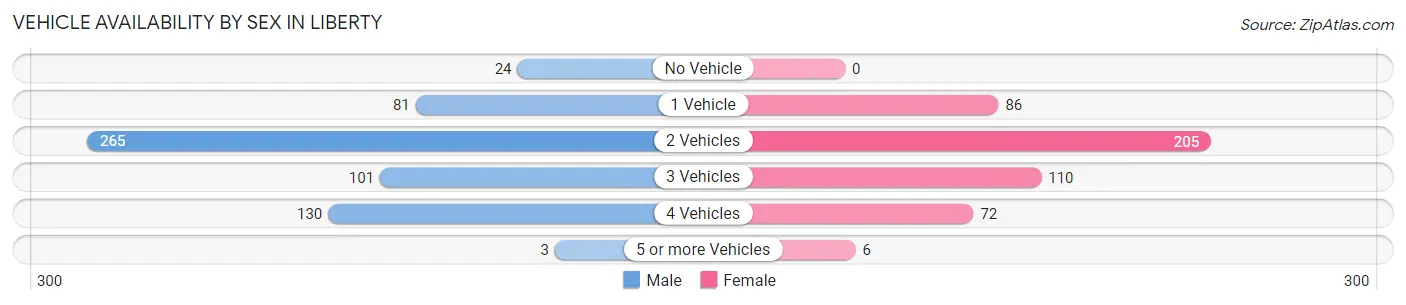
| Vehicles Available | Male | Female |
| No Vehicle | 24 (4.0%) | 0 (0.0%) |
| 1 Vehicle | 81 (13.4%) | 86 (17.9%) |
| 2 Vehicles | 265 (43.9%) | 205 (42.8%) |
| 3 Vehicles | 101 (16.7%) | 110 (23.0%) |
| 4 Vehicles | 130 (21.5%) | 72 (15.0%) |
| 5 or more Vehicles | 3 (0.5%) | 6 (1.3%) |
| Total | 604 (100.0%) | 479 (100.0%) |
Commute Time in Liberty
The most frequently occuring commute durations in Liberty are 30 to 34 minutes (235 commuters, 21.9%), 20 to 24 minutes (233 commuters, 21.7%), and 25 to 29 minutes (136 commuters, 12.7%).
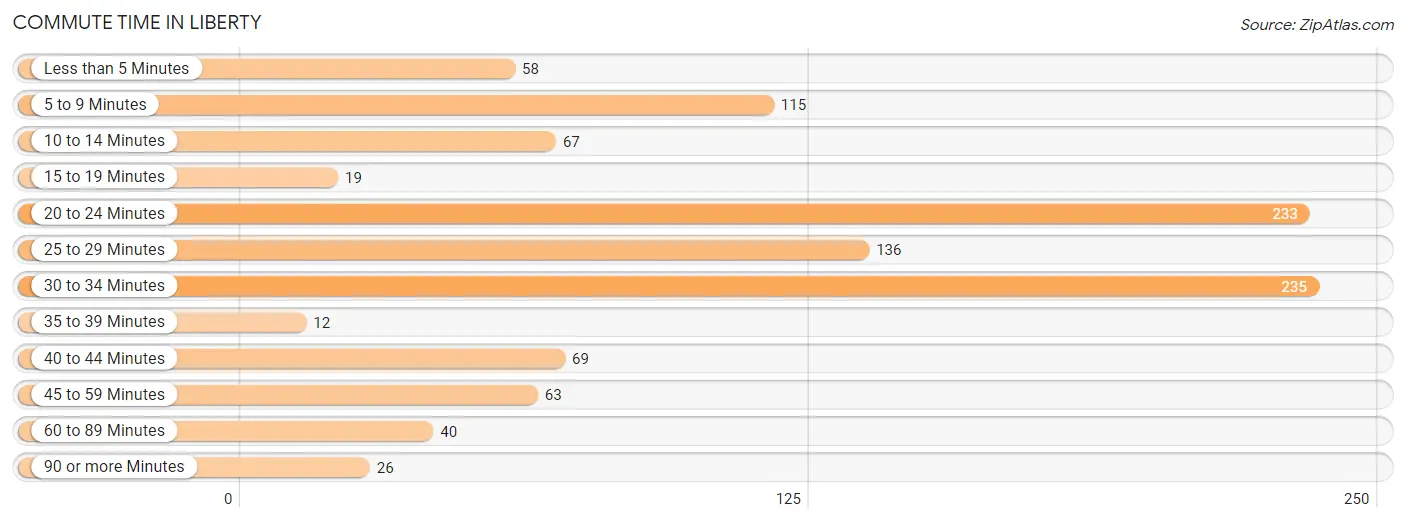
| Commute Time | # Commuters | % Commuters |
| Less than 5 Minutes | 58 | 5.4% |
| 5 to 9 Minutes | 115 | 10.7% |
| 10 to 14 Minutes | 67 | 6.2% |
| 15 to 19 Minutes | 19 | 1.8% |
| 20 to 24 Minutes | 233 | 21.7% |
| 25 to 29 Minutes | 136 | 12.7% |
| 30 to 34 Minutes | 235 | 21.9% |
| 35 to 39 Minutes | 12 | 1.1% |
| 40 to 44 Minutes | 69 | 6.4% |
| 45 to 59 Minutes | 63 | 5.9% |
| 60 to 89 Minutes | 40 | 3.7% |
| 90 or more Minutes | 26 | 2.4% |
Commute Time by Sex in Liberty
The most common commute times in Liberty are 20 to 24 minutes (132 commuters, 21.8%) for males and 30 to 34 minutes (117 commuters, 24.9%) for females.
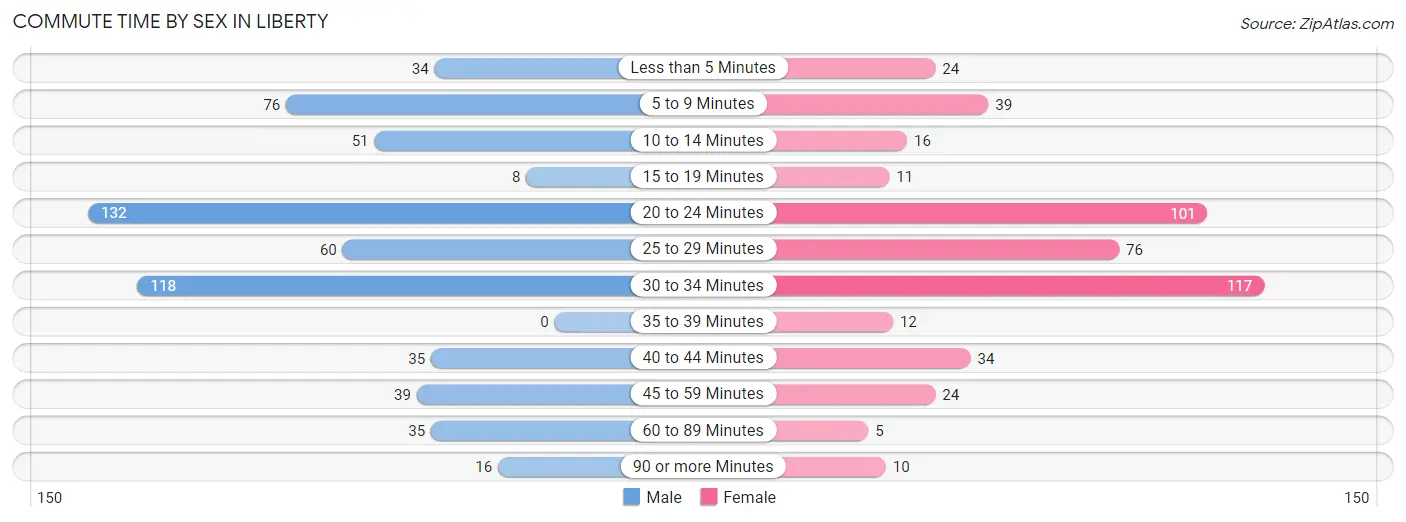
| Commute Time | Male | Female |
| Less than 5 Minutes | 34 (5.6%) | 24 (5.1%) |
| 5 to 9 Minutes | 76 (12.6%) | 39 (8.3%) |
| 10 to 14 Minutes | 51 (8.4%) | 16 (3.4%) |
| 15 to 19 Minutes | 8 (1.3%) | 11 (2.4%) |
| 20 to 24 Minutes | 132 (21.8%) | 101 (21.5%) |
| 25 to 29 Minutes | 60 (9.9%) | 76 (16.2%) |
| 30 to 34 Minutes | 118 (19.5%) | 117 (24.9%) |
| 35 to 39 Minutes | 0 (0.0%) | 12 (2.6%) |
| 40 to 44 Minutes | 35 (5.8%) | 34 (7.2%) |
| 45 to 59 Minutes | 39 (6.5%) | 24 (5.1%) |
| 60 to 89 Minutes | 35 (5.8%) | 5 (1.1%) |
| 90 or more Minutes | 16 (2.6%) | 10 (2.1%) |
Time of Departure to Work by Sex in Liberty
The most frequent times of departure to work in Liberty are 12:00 AM to 4:59 AM (95, 15.7%) for males and 7:00 AM to 7:29 AM (151, 32.2%) for females.
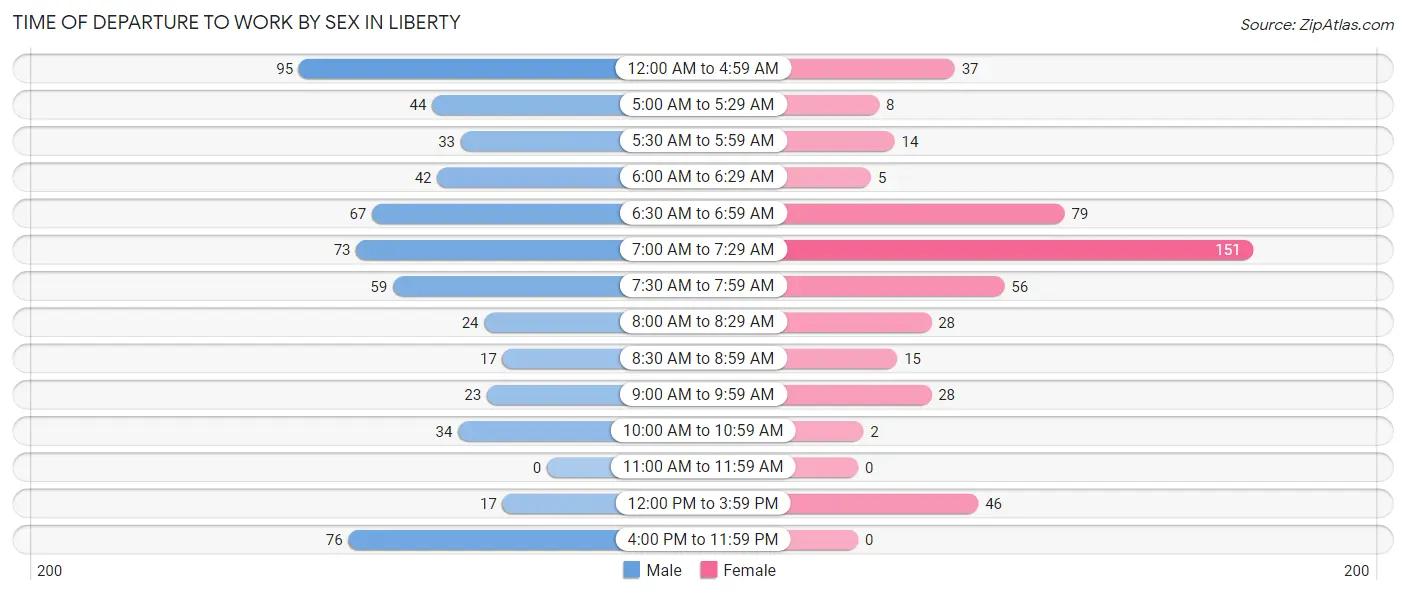
| Time of Departure | Male | Female |
| 12:00 AM to 4:59 AM | 95 (15.7%) | 37 (7.9%) |
| 5:00 AM to 5:29 AM | 44 (7.3%) | 8 (1.7%) |
| 5:30 AM to 5:59 AM | 33 (5.5%) | 14 (3.0%) |
| 6:00 AM to 6:29 AM | 42 (7.0%) | 5 (1.1%) |
| 6:30 AM to 6:59 AM | 67 (11.1%) | 79 (16.8%) |
| 7:00 AM to 7:29 AM | 73 (12.1%) | 151 (32.2%) |
| 7:30 AM to 7:59 AM | 59 (9.8%) | 56 (11.9%) |
| 8:00 AM to 8:29 AM | 24 (4.0%) | 28 (6.0%) |
| 8:30 AM to 8:59 AM | 17 (2.8%) | 15 (3.2%) |
| 9:00 AM to 9:59 AM | 23 (3.8%) | 28 (6.0%) |
| 10:00 AM to 10:59 AM | 34 (5.6%) | 2 (0.4%) |
| 11:00 AM to 11:59 AM | 0 (0.0%) | 0 (0.0%) |
| 12:00 PM to 3:59 PM | 17 (2.8%) | 46 (9.8%) |
| 4:00 PM to 11:59 PM | 76 (12.6%) | 0 (0.0%) |
| Total | 604 (100.0%) | 469 (100.0%) |
Housing Occupancy in Liberty
Occupancy by Ownership in Liberty
Of the total 968 dwellings in Liberty, owner-occupied units account for 673 (69.5%), while renter-occupied units make up 295 (30.5%).
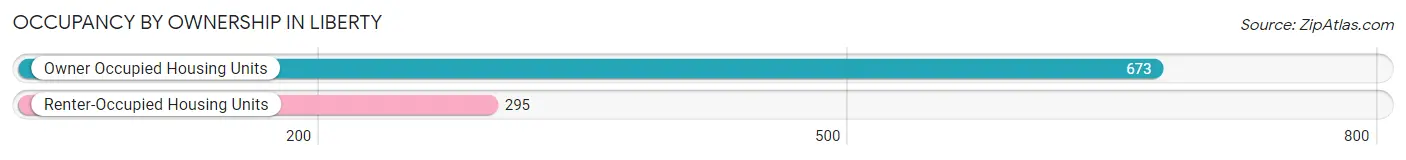
| Occupancy | # Housing Units | % Housing Units |
| Owner Occupied Housing Units | 673 | 69.5% |
| Renter-Occupied Housing Units | 295 | 30.5% |
| Total Occupied Housing Units | 968 | 100.0% |
Occupancy by Household Size in Liberty
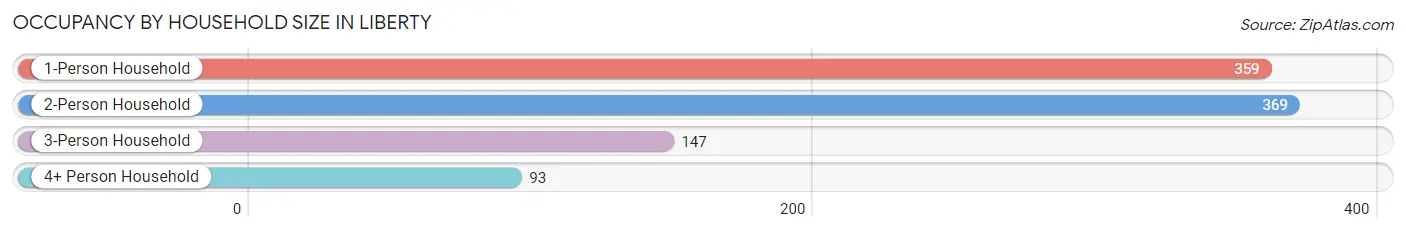
| Household Size | # Housing Units | % Housing Units |
| 1-Person Household | 359 | 37.1% |
| 2-Person Household | 369 | 38.1% |
| 3-Person Household | 147 | 15.2% |
| 4+ Person Household | 93 | 9.6% |
| Total Housing Units | 968 | 100.0% |
Occupancy by Ownership by Household Size in Liberty
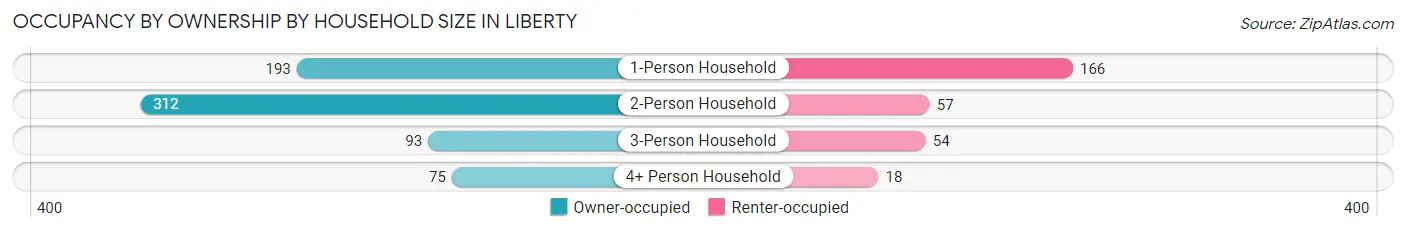
| Household Size | Owner-occupied | Renter-occupied |
| 1-Person Household | 193 (53.8%) | 166 (46.2%) |
| 2-Person Household | 312 (84.6%) | 57 (15.4%) |
| 3-Person Household | 93 (63.3%) | 54 (36.7%) |
| 4+ Person Household | 75 (80.6%) | 18 (19.4%) |
| Total Housing Units | 673 (69.5%) | 295 (30.5%) |
Occupancy by Educational Attainment in Liberty
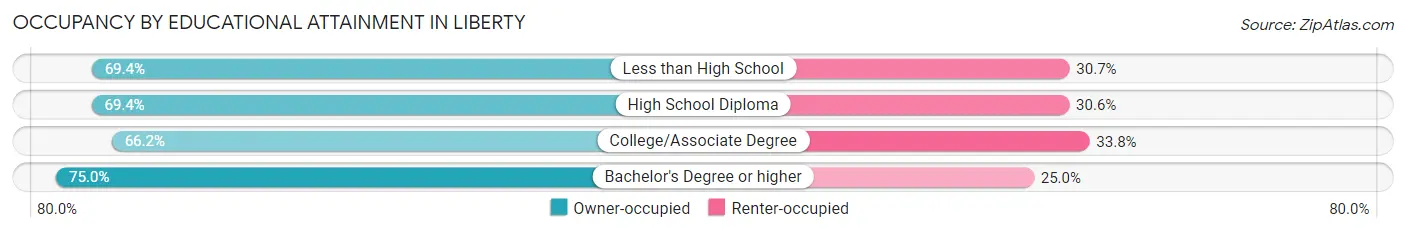
| Household Size | Owner-occupied | Renter-occupied |
| Less than High School | 86 (69.4%) | 38 (30.6%) |
| High School Diploma | 272 (69.4%) | 120 (30.6%) |
| College/Associate Degree | 180 (66.2%) | 92 (33.8%) |
| Bachelor's Degree or higher | 135 (75.0%) | 45 (25.0%) |
Occupancy by Age of Householder in Liberty
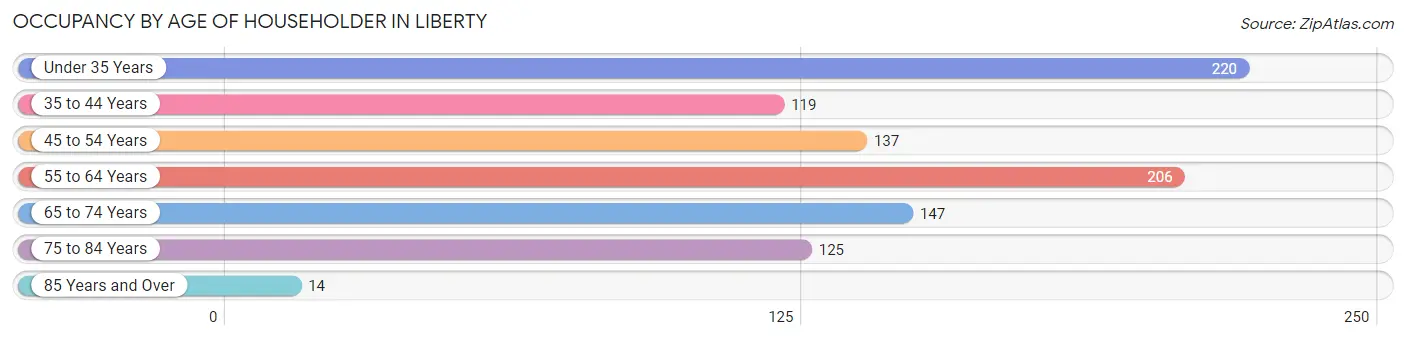
| Age Bracket | # Households | % Households |
| Under 35 Years | 220 | 22.7% |
| 35 to 44 Years | 119 | 12.3% |
| 45 to 54 Years | 137 | 14.1% |
| 55 to 64 Years | 206 | 21.3% |
| 65 to 74 Years | 147 | 15.2% |
| 75 to 84 Years | 125 | 12.9% |
| 85 Years and Over | 14 | 1.5% |
| Total | 968 | 100.0% |
Housing Finances in Liberty
Median Income by Occupancy in Liberty
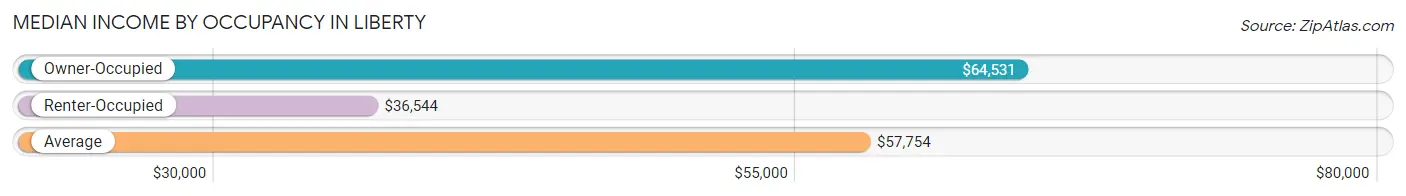
| Occupancy Type | # Households | Median Income |
| Owner-Occupied | 673 (69.5%) | $64,531 |
| Renter-Occupied | 295 (30.5%) | $36,544 |
| Average | 968 (100.0%) | $57,754 |
Occupancy by Householder Income Bracket in Liberty
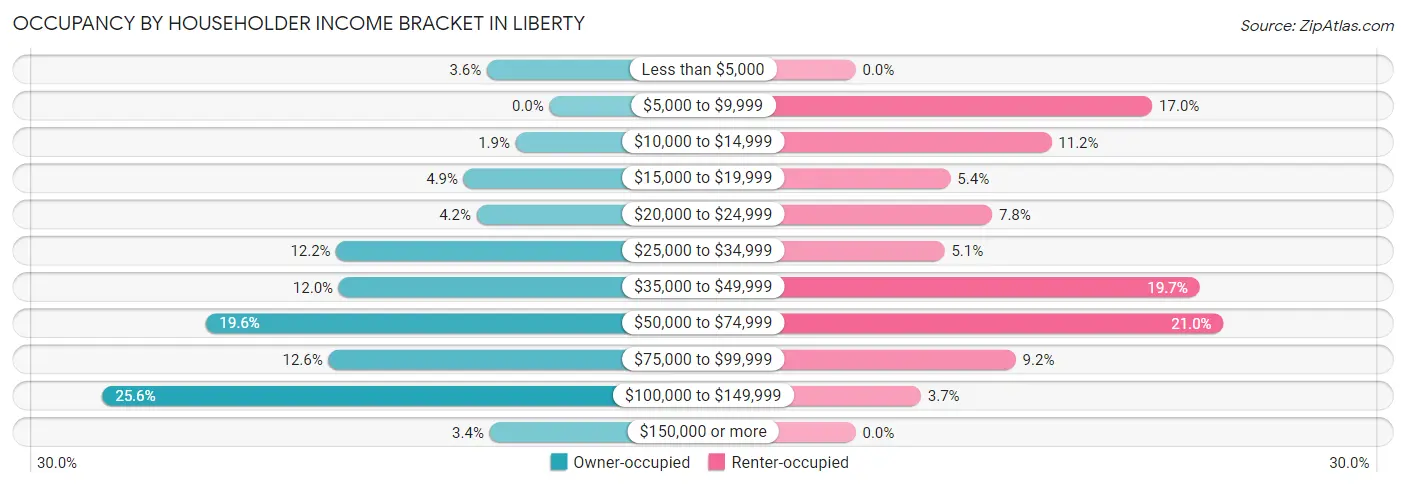
| Income Bracket | Owner-occupied | Renter-occupied |
| Less than $5,000 | 24 (3.6%) | 0 (0.0%) |
| $5,000 to $9,999 | 0 (0.0%) | 50 (17.0%) |
| $10,000 to $14,999 | 13 (1.9%) | 33 (11.2%) |
| $15,000 to $19,999 | 33 (4.9%) | 16 (5.4%) |
| $20,000 to $24,999 | 28 (4.2%) | 23 (7.8%) |
| $25,000 to $34,999 | 82 (12.2%) | 15 (5.1%) |
| $35,000 to $49,999 | 81 (12.0%) | 58 (19.7%) |
| $50,000 to $74,999 | 132 (19.6%) | 62 (21.0%) |
| $75,000 to $99,999 | 85 (12.6%) | 27 (9.1%) |
| $100,000 to $149,999 | 172 (25.6%) | 11 (3.7%) |
| $150,000 or more | 23 (3.4%) | 0 (0.0%) |
| Total | 673 (100.0%) | 295 (100.0%) |
Monthly Housing Cost Tiers in Liberty
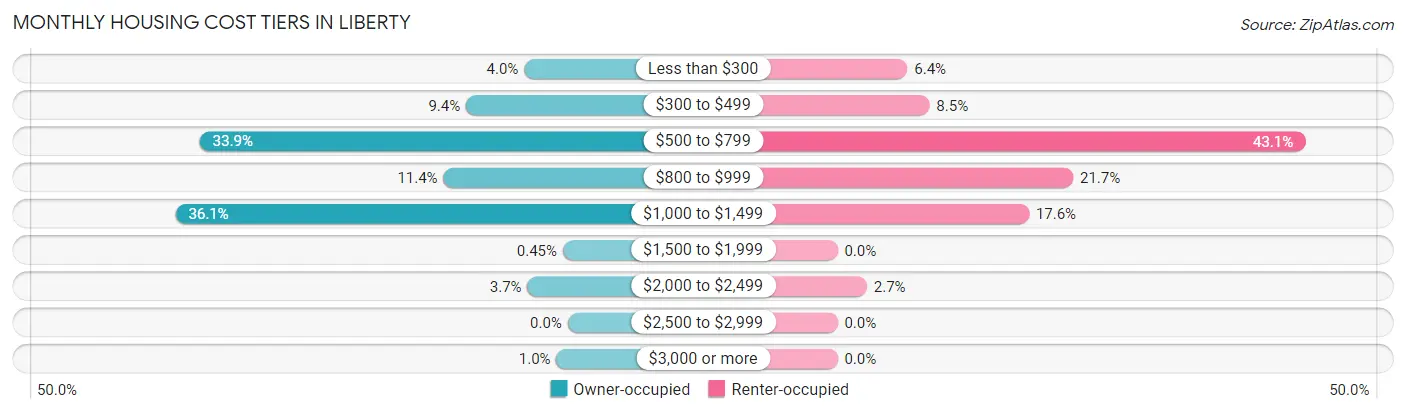
| Monthly Cost | Owner-occupied | Renter-occupied |
| Less than $300 | 27 (4.0%) | 19 (6.4%) |
| $300 to $499 | 63 (9.4%) | 25 (8.5%) |
| $500 to $799 | 228 (33.9%) | 127 (43.0%) |
| $800 to $999 | 77 (11.4%) | 64 (21.7%) |
| $1,000 to $1,499 | 243 (36.1%) | 52 (17.6%) |
| $1,500 to $1,999 | 3 (0.4%) | 0 (0.0%) |
| $2,000 to $2,499 | 25 (3.7%) | 8 (2.7%) |
| $2,500 to $2,999 | 0 (0.0%) | 0 (0.0%) |
| $3,000 or more | 7 (1.0%) | 0 (0.0%) |
| Total | 673 (100.0%) | 295 (100.0%) |
Physical Housing Characteristics in Liberty
Housing Structures in Liberty
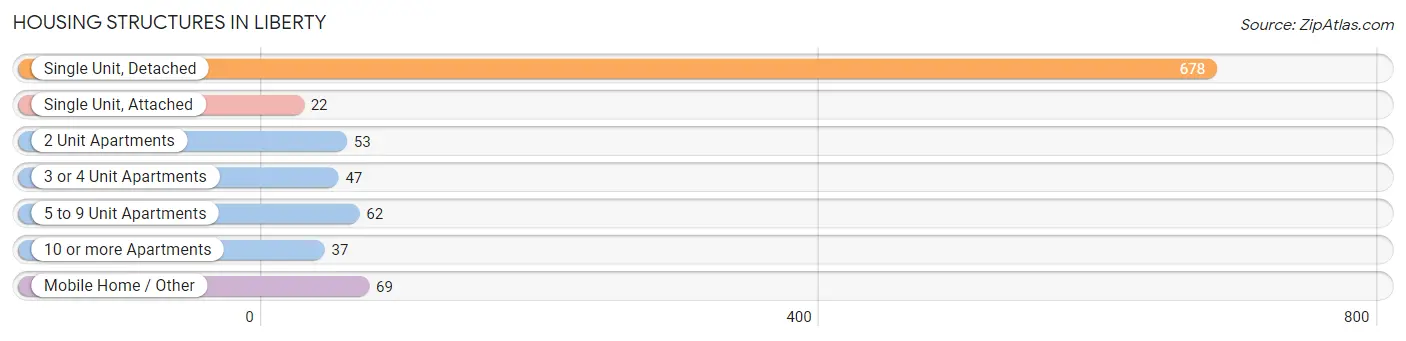
| Structure Type | # Housing Units | % Housing Units |
| Single Unit, Detached | 678 | 70.0% |
| Single Unit, Attached | 22 | 2.3% |
| 2 Unit Apartments | 53 | 5.5% |
| 3 or 4 Unit Apartments | 47 | 4.9% |
| 5 to 9 Unit Apartments | 62 | 6.4% |
| 10 or more Apartments | 37 | 3.8% |
| Mobile Home / Other | 69 | 7.1% |
| Total | 968 | 100.0% |
Housing Structures by Occupancy in Liberty
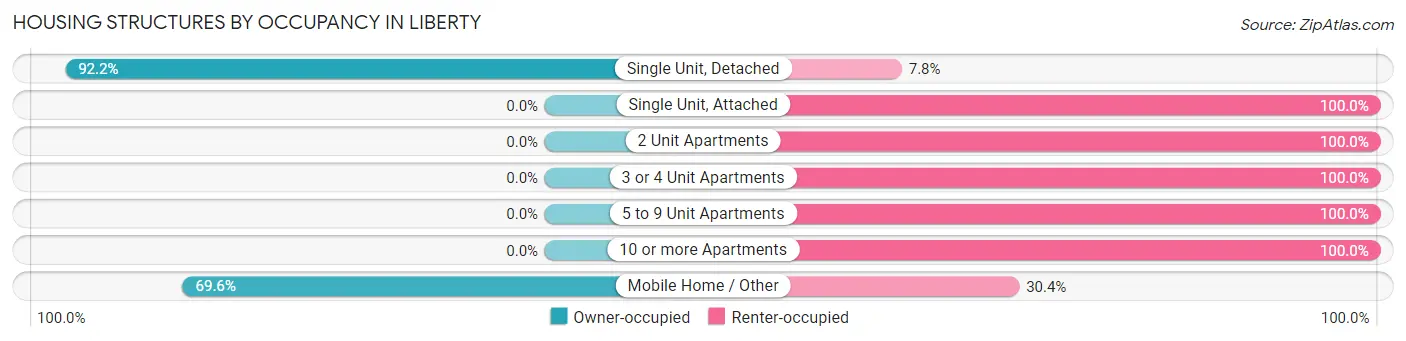
| Structure Type | Owner-occupied | Renter-occupied |
| Single Unit, Detached | 625 (92.2%) | 53 (7.8%) |
| Single Unit, Attached | 0 (0.0%) | 22 (100.0%) |
| 2 Unit Apartments | 0 (0.0%) | 53 (100.0%) |
| 3 or 4 Unit Apartments | 0 (0.0%) | 47 (100.0%) |
| 5 to 9 Unit Apartments | 0 (0.0%) | 62 (100.0%) |
| 10 or more Apartments | 0 (0.0%) | 37 (100.0%) |
| Mobile Home / Other | 48 (69.6%) | 21 (30.4%) |
| Total | 673 (69.5%) | 295 (30.5%) |
Housing Structures by Number of Rooms in Liberty
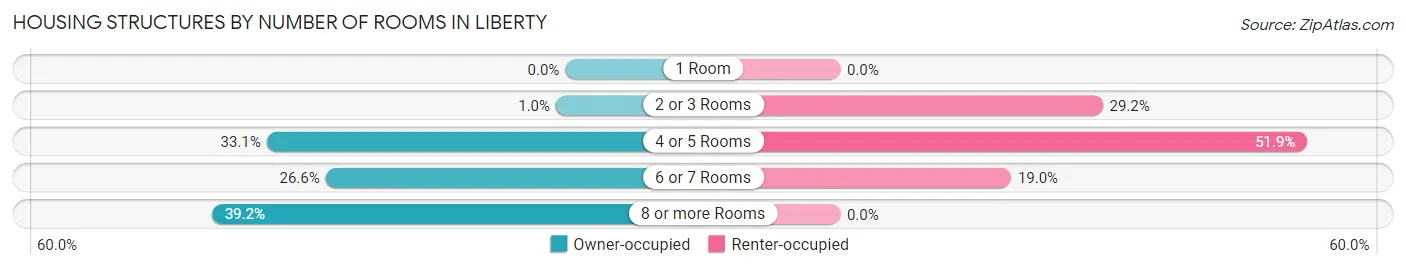
| Number of Rooms | Owner-occupied | Renter-occupied |
| 1 Room | 0 (0.0%) | 0 (0.0%) |
| 2 or 3 Rooms | 7 (1.0%) | 86 (29.1%) |
| 4 or 5 Rooms | 223 (33.1%) | 153 (51.9%) |
| 6 or 7 Rooms | 179 (26.6%) | 56 (19.0%) |
| 8 or more Rooms | 264 (39.2%) | 0 (0.0%) |
| Total | 673 (100.0%) | 295 (100.0%) |
Housing Structure by Heating Type in Liberty
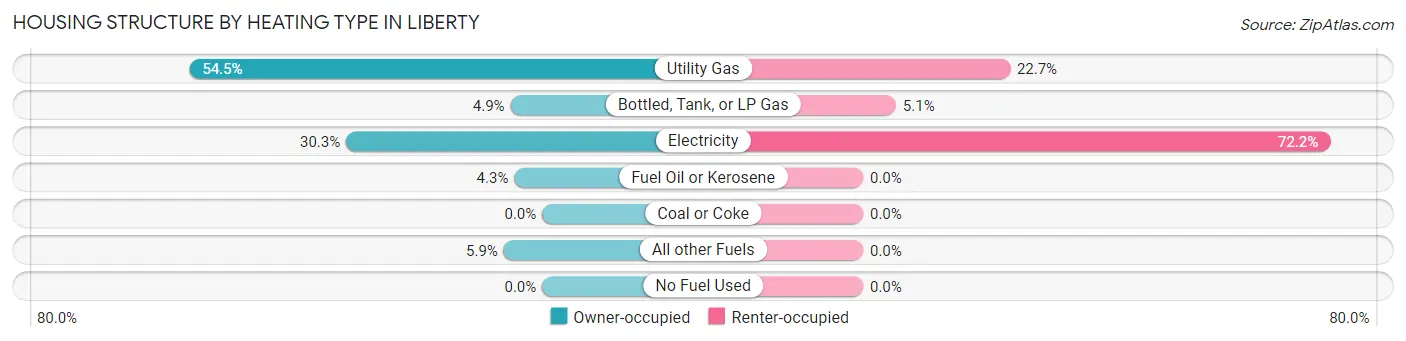
| Heating Type | Owner-occupied | Renter-occupied |
| Utility Gas | 367 (54.5%) | 67 (22.7%) |
| Bottled, Tank, or LP Gas | 33 (4.9%) | 15 (5.1%) |
| Electricity | 204 (30.3%) | 213 (72.2%) |
| Fuel Oil or Kerosene | 29 (4.3%) | 0 (0.0%) |
| Coal or Coke | 0 (0.0%) | 0 (0.0%) |
| All other Fuels | 40 (5.9%) | 0 (0.0%) |
| No Fuel Used | 0 (0.0%) | 0 (0.0%) |
| Total | 673 (100.0%) | 295 (100.0%) |
Household Vehicle Usage in Liberty
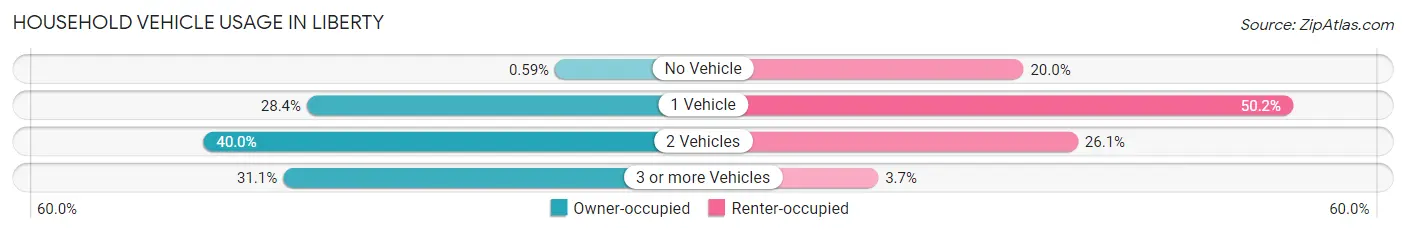
| Vehicles per Household | Owner-occupied | Renter-occupied |
| No Vehicle | 4 (0.6%) | 59 (20.0%) |
| 1 Vehicle | 191 (28.4%) | 148 (50.2%) |
| 2 Vehicles | 269 (40.0%) | 77 (26.1%) |
| 3 or more Vehicles | 209 (31.0%) | 11 (3.7%) |
| Total | 673 (100.0%) | 295 (100.0%) |
Real Estate & Mortgages in Liberty
Real Estate and Mortgage Overview in Liberty
| Characteristic | Without Mortgage | With Mortgage |
| Housing Units | 208 | 465 |
| Median Property Value | $107,300 | $127,700 |
| Median Household Income | $63,750 | $15 |
| Monthly Housing Costs | $541 | $0 |
| Real Estate Taxes | $647 | $19 |
Property Value by Mortgage Status in Liberty
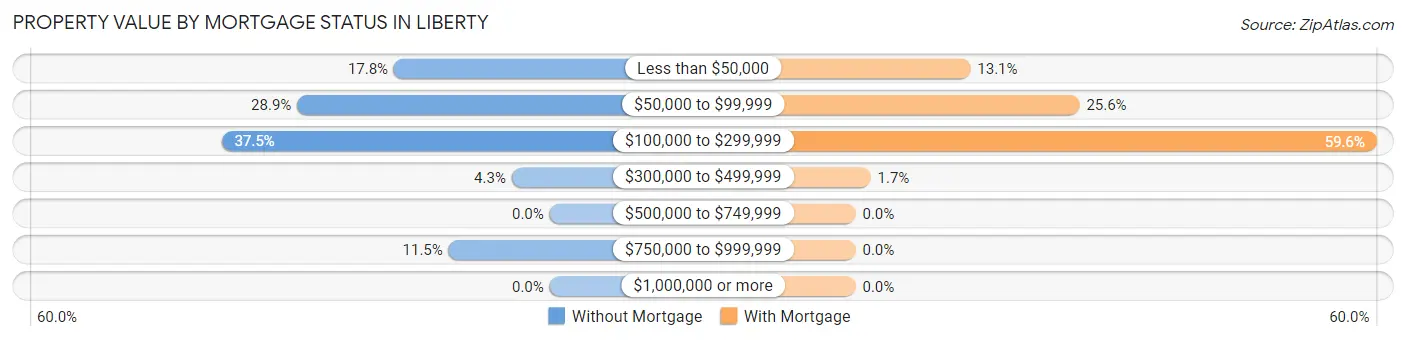
| Property Value | Without Mortgage | With Mortgage |
| Less than $50,000 | 37 (17.8%) | 61 (13.1%) |
| $50,000 to $99,999 | 60 (28.8%) | 119 (25.6%) |
| $100,000 to $299,999 | 78 (37.5%) | 277 (59.6%) |
| $300,000 to $499,999 | 9 (4.3%) | 8 (1.7%) |
| $500,000 to $749,999 | 0 (0.0%) | 0 (0.0%) |
| $750,000 to $999,999 | 24 (11.5%) | 0 (0.0%) |
| $1,000,000 or more | 0 (0.0%) | 0 (0.0%) |
| Total | 208 (100.0%) | 465 (100.0%) |
Household Income by Mortgage Status in Liberty
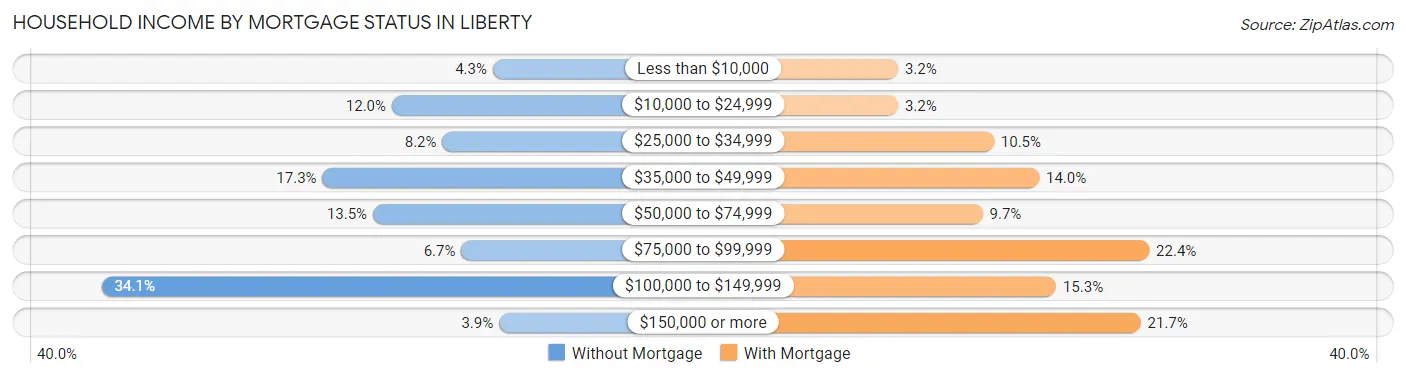
| Household Income | Without Mortgage | With Mortgage |
| Less than $10,000 | 9 (4.3%) | 15 (3.2%) |
| $10,000 to $24,999 | 25 (12.0%) | 15 (3.2%) |
| $25,000 to $34,999 | 17 (8.2%) | 49 (10.5%) |
| $35,000 to $49,999 | 36 (17.3%) | 65 (14.0%) |
| $50,000 to $74,999 | 28 (13.5%) | 45 (9.7%) |
| $75,000 to $99,999 | 14 (6.7%) | 104 (22.4%) |
| $100,000 to $149,999 | 71 (34.1%) | 71 (15.3%) |
| $150,000 or more | 8 (3.8%) | 101 (21.7%) |
| Total | 208 (100.0%) | 465 (100.0%) |
Property Value to Household Income Ratio in Liberty
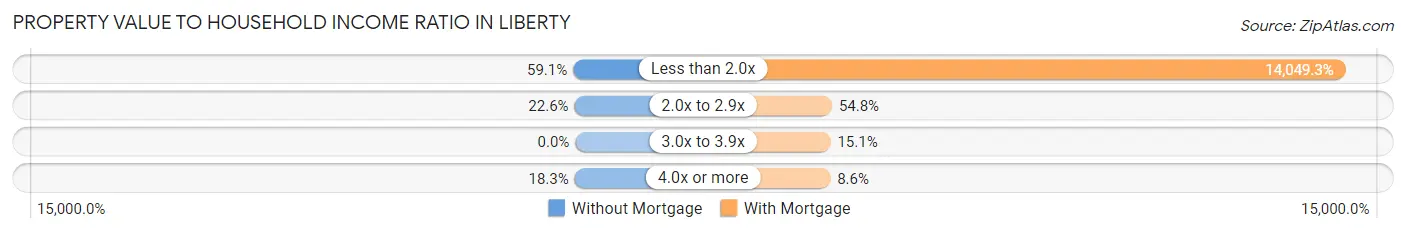
| Value-to-Income Ratio | Without Mortgage | With Mortgage |
| Less than 2.0x | 123 (59.1%) | 65,329 (14,049.3%) |
| 2.0x to 2.9x | 47 (22.6%) | 255 (54.8%) |
| 3.0x to 3.9x | 0 (0.0%) | 70 (15.0%) |
| 4.0x or more | 38 (18.3%) | 40 (8.6%) |
| Total | 208 (100.0%) | 465 (100.0%) |
Real Estate Taxes by Mortgage Status in Liberty
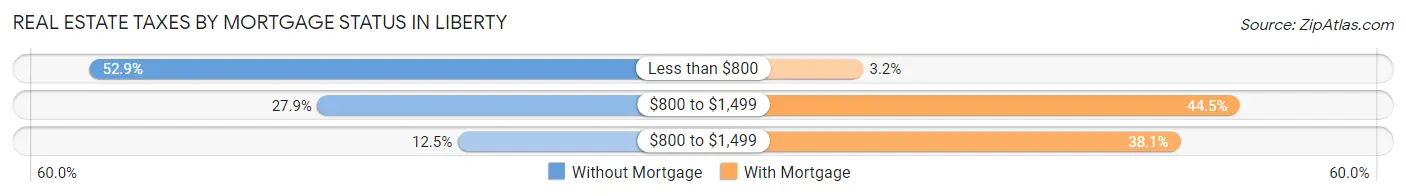
| Property Taxes | Without Mortgage | With Mortgage |
| Less than $800 | 110 (52.9%) | 15 (3.2%) |
| $800 to $1,499 | 58 (27.9%) | 207 (44.5%) |
| $800 to $1,499 | 26 (12.5%) | 177 (38.1%) |
| Total | 208 (100.0%) | 465 (100.0%) |
Health & Disability in Liberty
Health Insurance Coverage by Age in Liberty
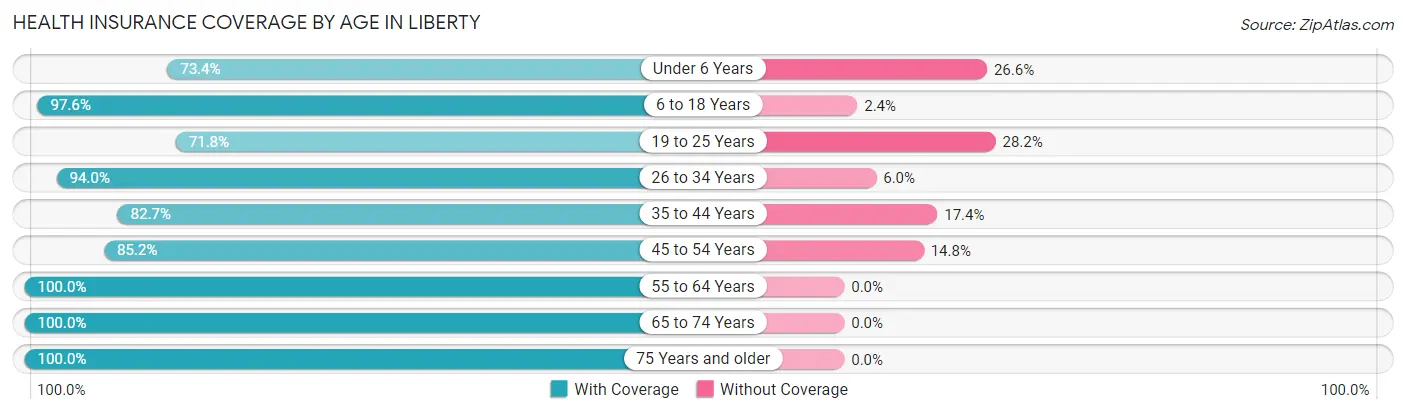
| Age Bracket | With Coverage | Without Coverage |
| Under 6 Years | 91 (73.4%) | 33 (26.6%) |
| 6 to 18 Years | 242 (97.6%) | 6 (2.4%) |
| 19 to 25 Years | 140 (71.8%) | 55 (28.2%) |
| 26 to 34 Years | 205 (94.0%) | 13 (6.0%) |
| 35 to 44 Years | 181 (82.7%) | 38 (17.3%) |
| 45 to 54 Years | 184 (85.2%) | 32 (14.8%) |
| 55 to 64 Years | 364 (100.0%) | 0 (0.0%) |
| 65 to 74 Years | 235 (100.0%) | 0 (0.0%) |
| 75 Years and older | 210 (100.0%) | 0 (0.0%) |
| Total | 1,852 (91.3%) | 177 (8.7%) |
Health Insurance Coverage by Citizenship Status in Liberty
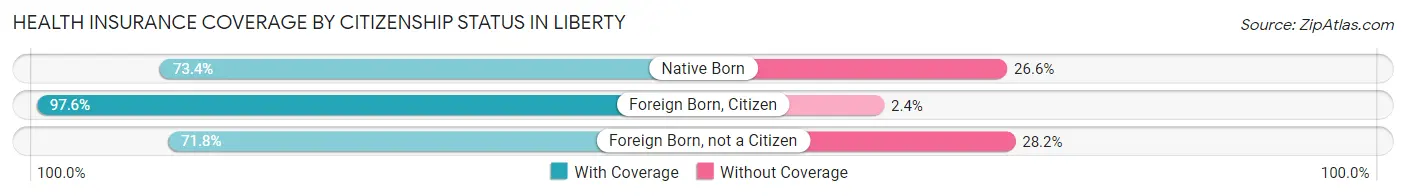
| Citizenship Status | With Coverage | Without Coverage |
| Native Born | 91 (73.4%) | 33 (26.6%) |
| Foreign Born, Citizen | 242 (97.6%) | 6 (2.4%) |
| Foreign Born, not a Citizen | 140 (71.8%) | 55 (28.2%) |
Health Insurance Coverage by Household Income in Liberty
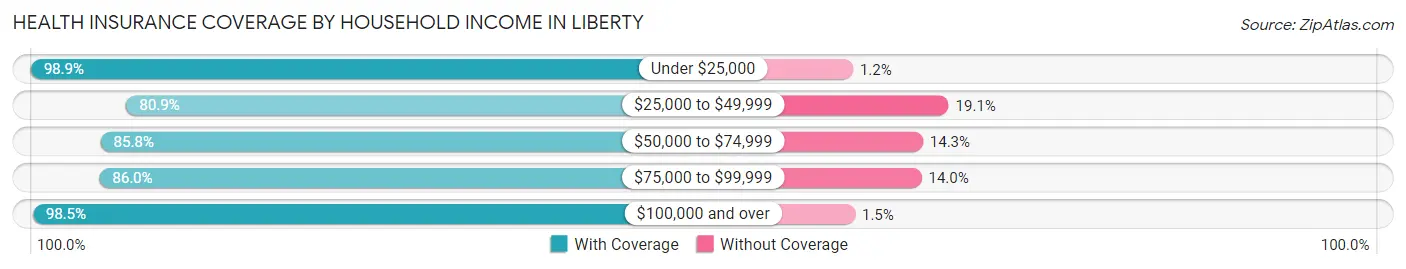
| Household Income | With Coverage | Without Coverage |
| Under $25,000 | 345 (98.9%) | 4 (1.1%) |
| $25,000 to $49,999 | 280 (80.9%) | 66 (19.1%) |
| $50,000 to $74,999 | 319 (85.8%) | 53 (14.2%) |
| $75,000 to $99,999 | 270 (86.0%) | 44 (14.0%) |
| $100,000 and over | 638 (98.5%) | 10 (1.5%) |
Public vs Private Health Insurance Coverage by Age in Liberty
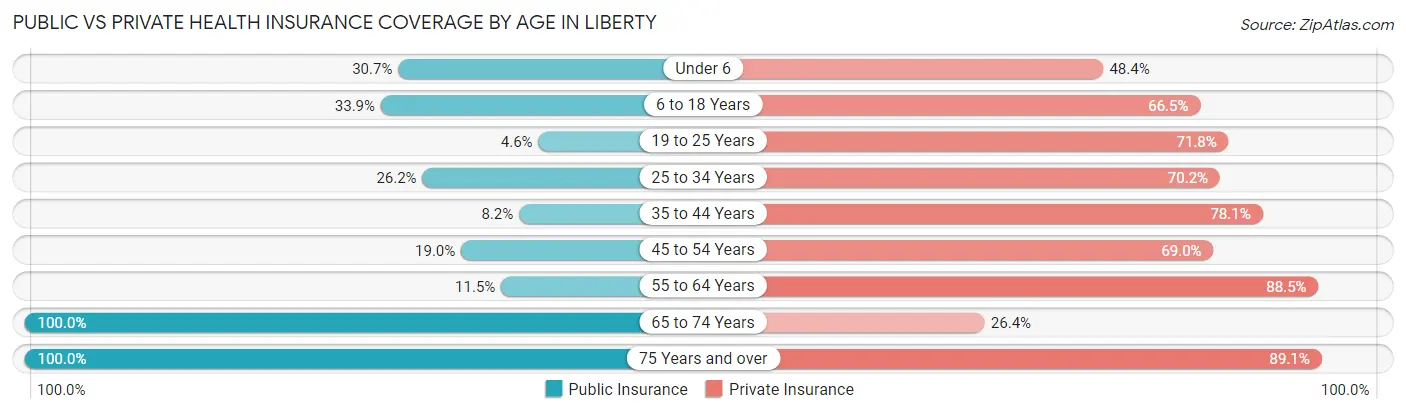
| Age Bracket | Public Insurance | Private Insurance |
| Under 6 | 38 (30.6%) | 60 (48.4%) |
| 6 to 18 Years | 84 (33.9%) | 165 (66.5%) |
| 19 to 25 Years | 9 (4.6%) | 140 (71.8%) |
| 25 to 34 Years | 57 (26.2%) | 153 (70.2%) |
| 35 to 44 Years | 18 (8.2%) | 171 (78.1%) |
| 45 to 54 Years | 41 (19.0%) | 149 (69.0%) |
| 55 to 64 Years | 42 (11.5%) | 322 (88.5%) |
| 65 to 74 Years | 235 (100.0%) | 62 (26.4%) |
| 75 Years and over | 210 (100.0%) | 187 (89.0%) |
| Total | 734 (36.2%) | 1,409 (69.4%) |
Disability Status by Sex by Age in Liberty
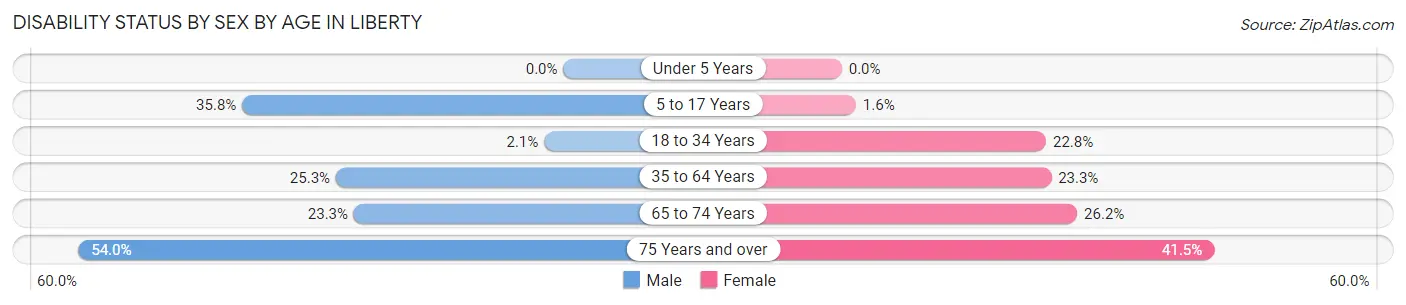
| Age Bracket | Male | Female |
| Under 5 Years | 0 (0.0%) | 0 (0.0%) |
| 5 to 17 Years | 49 (35.8%) | 2 (1.6%) |
| 18 to 34 Years | 5 (2.1%) | 43 (22.8%) |
| 35 to 64 Years | 97 (25.3%) | 97 (23.3%) |
| 65 to 74 Years | 21 (23.3%) | 38 (26.2%) |
| 75 Years and over | 47 (54.0%) | 51 (41.5%) |
Disability Class by Sex by Age in Liberty
Disability Class: Hearing Difficulty
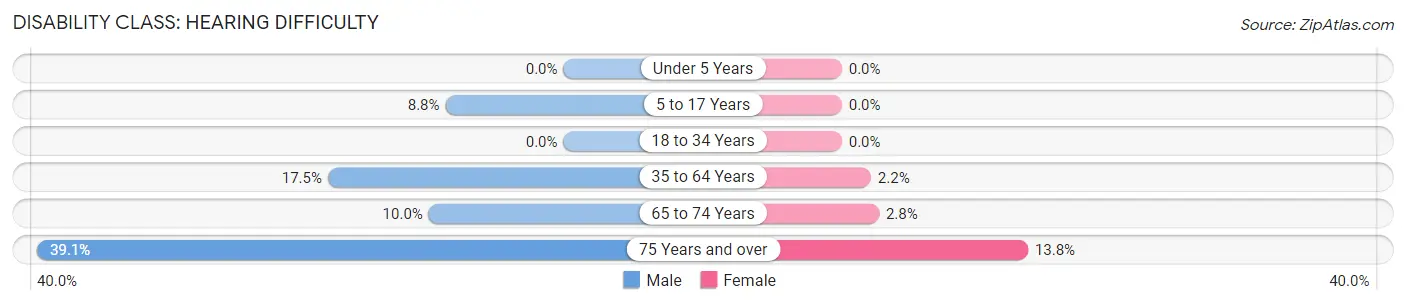
| Age Bracket | Male | Female |
| Under 5 Years | 0 (0.0%) | 0 (0.0%) |
| 5 to 17 Years | 12 (8.8%) | 0 (0.0%) |
| 18 to 34 Years | 0 (0.0%) | 0 (0.0%) |
| 35 to 64 Years | 67 (17.5%) | 9 (2.2%) |
| 65 to 74 Years | 9 (10.0%) | 4 (2.8%) |
| 75 Years and over | 34 (39.1%) | 17 (13.8%) |
Disability Class: Vision Difficulty
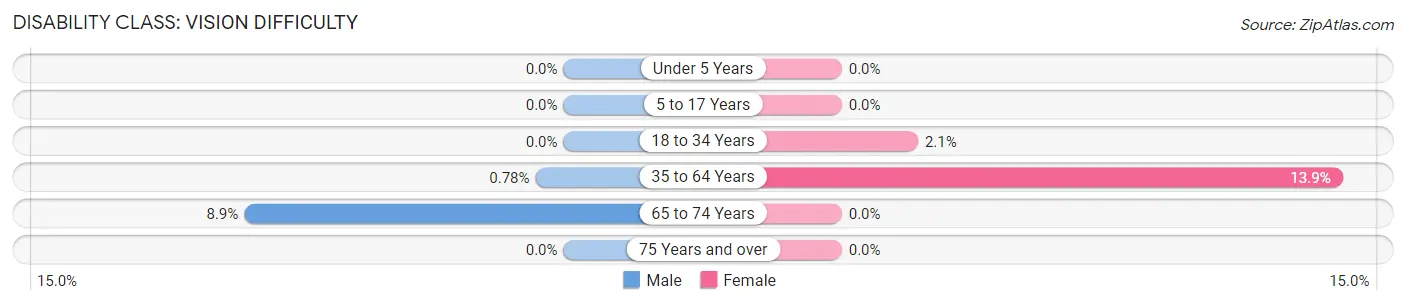
| Age Bracket | Male | Female |
| Under 5 Years | 0 (0.0%) | 0 (0.0%) |
| 5 to 17 Years | 0 (0.0%) | 0 (0.0%) |
| 18 to 34 Years | 0 (0.0%) | 4 (2.1%) |
| 35 to 64 Years | 3 (0.8%) | 58 (13.9%) |
| 65 to 74 Years | 8 (8.9%) | 0 (0.0%) |
| 75 Years and over | 0 (0.0%) | 0 (0.0%) |
Disability Class: Cognitive Difficulty
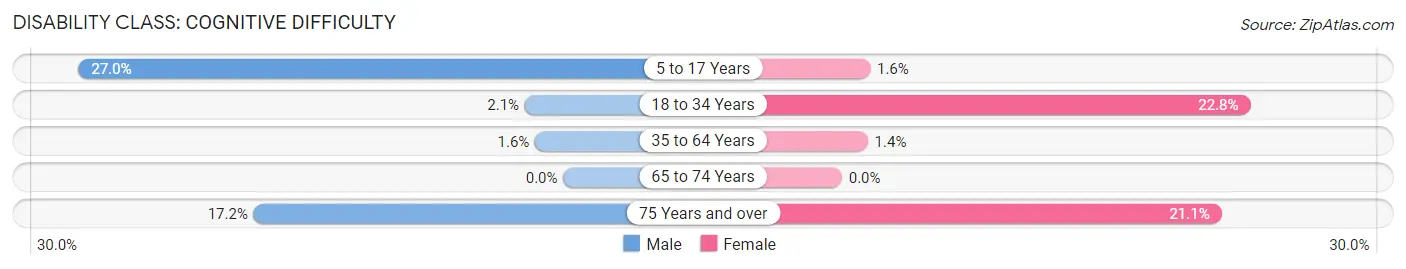
| Age Bracket | Male | Female |
| 5 to 17 Years | 37 (27.0%) | 2 (1.6%) |
| 18 to 34 Years | 5 (2.1%) | 43 (22.8%) |
| 35 to 64 Years | 6 (1.6%) | 6 (1.4%) |
| 65 to 74 Years | 0 (0.0%) | 0 (0.0%) |
| 75 Years and over | 15 (17.2%) | 26 (21.1%) |
Disability Class: Ambulatory Difficulty
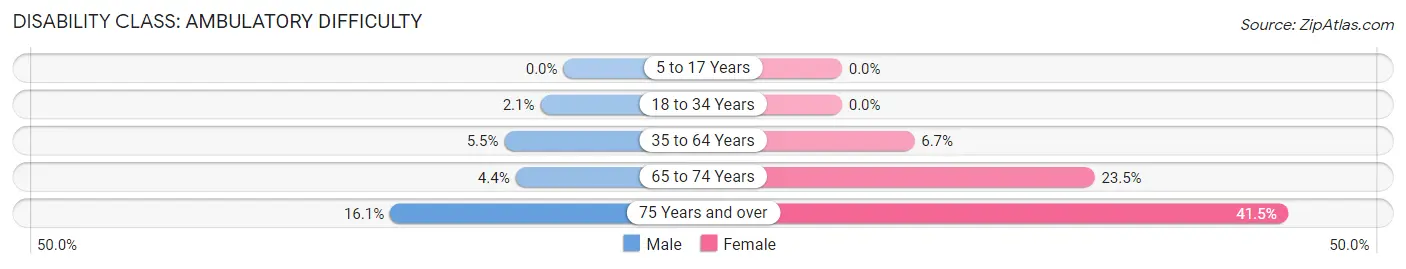
| Age Bracket | Male | Female |
| 5 to 17 Years | 0 (0.0%) | 0 (0.0%) |
| 18 to 34 Years | 5 (2.1%) | 0 (0.0%) |
| 35 to 64 Years | 21 (5.5%) | 28 (6.7%) |
| 65 to 74 Years | 4 (4.4%) | 34 (23.4%) |
| 75 Years and over | 14 (16.1%) | 51 (41.5%) |
Disability Class: Self-Care Difficulty
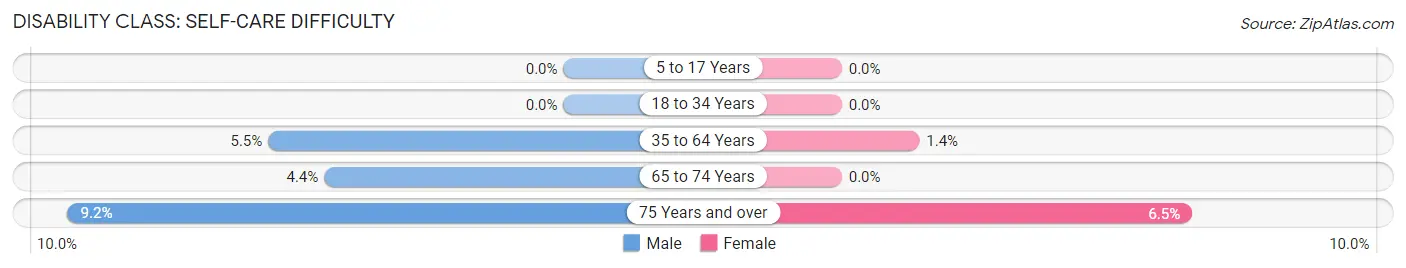
| Age Bracket | Male | Female |
| 5 to 17 Years | 0 (0.0%) | 0 (0.0%) |
| 18 to 34 Years | 0 (0.0%) | 0 (0.0%) |
| 35 to 64 Years | 21 (5.5%) | 6 (1.4%) |
| 65 to 74 Years | 4 (4.4%) | 0 (0.0%) |
| 75 Years and over | 8 (9.2%) | 8 (6.5%) |
Technology Access in Liberty
Computing Device Access in Liberty
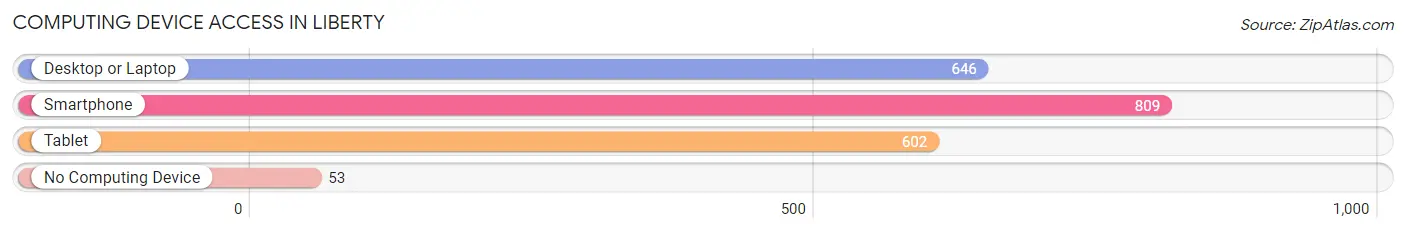
| Device Type | # Households | % Households |
| Desktop or Laptop | 646 | 66.7% |
| Smartphone | 809 | 83.6% |
| Tablet | 602 | 62.2% |
| No Computing Device | 53 | 5.5% |
| Total | 968 | 100.0% |
Internet Access in Liberty
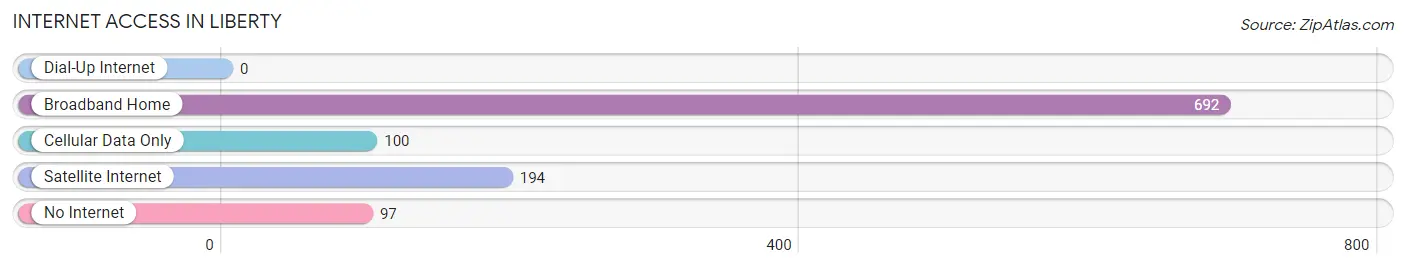
| Internet Type | # Households | % Households |
| Dial-Up Internet | 0 | 0.0% |
| Broadband Home | 692 | 71.5% |
| Cellular Data Only | 100 | 10.3% |
| Satellite Internet | 194 | 20.0% |
| No Internet | 97 | 10.0% |
| Total | 968 | 100.0% |
Liberty Summary
Liberty, Indiana is a small town located in Union County, Indiana. It is situated in the east central part of the state, about 40 miles northeast of Indianapolis. The town was founded in 1837 and has a population of approximately 2,500 people.
Geography
Liberty is located in the east central part of Indiana, in Union County. It is situated on the banks of the Whitewater River, which flows through the town. The town is surrounded by rolling hills and farmland, and is located in the Whitewater Valley. The town is located about 40 miles northeast of Indianapolis, and is about an hour and a half drive from Cincinnati, Ohio.
Economy
The economy of Liberty is largely based on agriculture and manufacturing. The town is home to several small businesses, including a grocery store, a hardware store, and a few restaurants. The town also has a few small manufacturing plants, which produce a variety of products, including furniture, automotive parts, and medical supplies.
The town is also home to a few small farms, which produce a variety of crops, including corn, soybeans, and wheat. The town also has a few small wineries, which produce a variety of wines.
Demographics
As of the 2010 census, the population of Liberty was 2,500 people. The town is predominantly white, with about 95% of the population being white. The town also has a small Hispanic population, with about 4% of the population being Hispanic. The town also has a small African American population, with about 1% of the population being African American.
The median household income in Liberty is $41,000, and the median home value is $90,000. The town has a low unemployment rate, with only about 4% of the population being unemployed.
Conclusion
Liberty, Indiana is a small town located in Union County, Indiana. It is situated in the east central part of the state, about 40 miles northeast of Indianapolis. The town was founded in 1837 and has a population of approximately 2,500 people. The economy of Liberty is largely based on agriculture and manufacturing, and the town is home to several small businesses. The town is predominantly white, with about 95% of the population being white. The median household income in Liberty is $41,000, and the median home value is $90,000. The town has a low unemployment rate, with only about 4% of the population being unemployed.
Common Questions
What is Per Capita Income in Liberty?
Per Capita income in Liberty is $30,034.
What is the Median Family Income in Liberty?
Median Family Income in Liberty is $76,204.
What is the Median Household income in Liberty?
Median Household Income in Liberty is $57,754.
What is Income or Wage Gap in Liberty?
Income or Wage Gap in Liberty is 16.2%.
Women in Liberty earn 83.8 cents for every dollar earned by a man.
What is Family Income Deficit in Liberty?
Family Income Deficit in Liberty is $12,498.
Families that are below poverty line in Liberty earn $12,498 less on average than the poverty threshold level.
What is Inequality or Gini Index in Liberty?
Inequality or Gini Index in Liberty is 0.39.
What is the Total Population of Liberty?
Total Population of Liberty is 2,085.
What is the Total Male Population of Liberty?
Total Male Population of Liberty is 1,021.
What is the Total Female Population of Liberty?
Total Female Population of Liberty is 1,064.
What is the Ratio of Males per 100 Females in Liberty?
There are 95.96 Males per 100 Females in Liberty.
What is the Ratio of Females per 100 Males in Liberty?
There are 104.21 Females per 100 Males in Liberty.
What is the Median Population Age in Liberty?
Median Population Age in Liberty is 46.0 Years.
What is the Average Family Size in Liberty
Average Family Size in Liberty is 2.8 People.
What is the Average Household Size in Liberty
Average Household Size in Liberty is 2.1 People.
How Large is the Labor Force in Liberty?
There are 1,145 People in the Labor Forcein in Liberty.
What is the Percentage of People in the Labor Force in Liberty?
64.5% of People are in the Labor Force in Liberty.
What is the Unemployment Rate in Liberty?
Unemployment Rate in Liberty is 3.4%.