Lapel, IN Map & Demographics
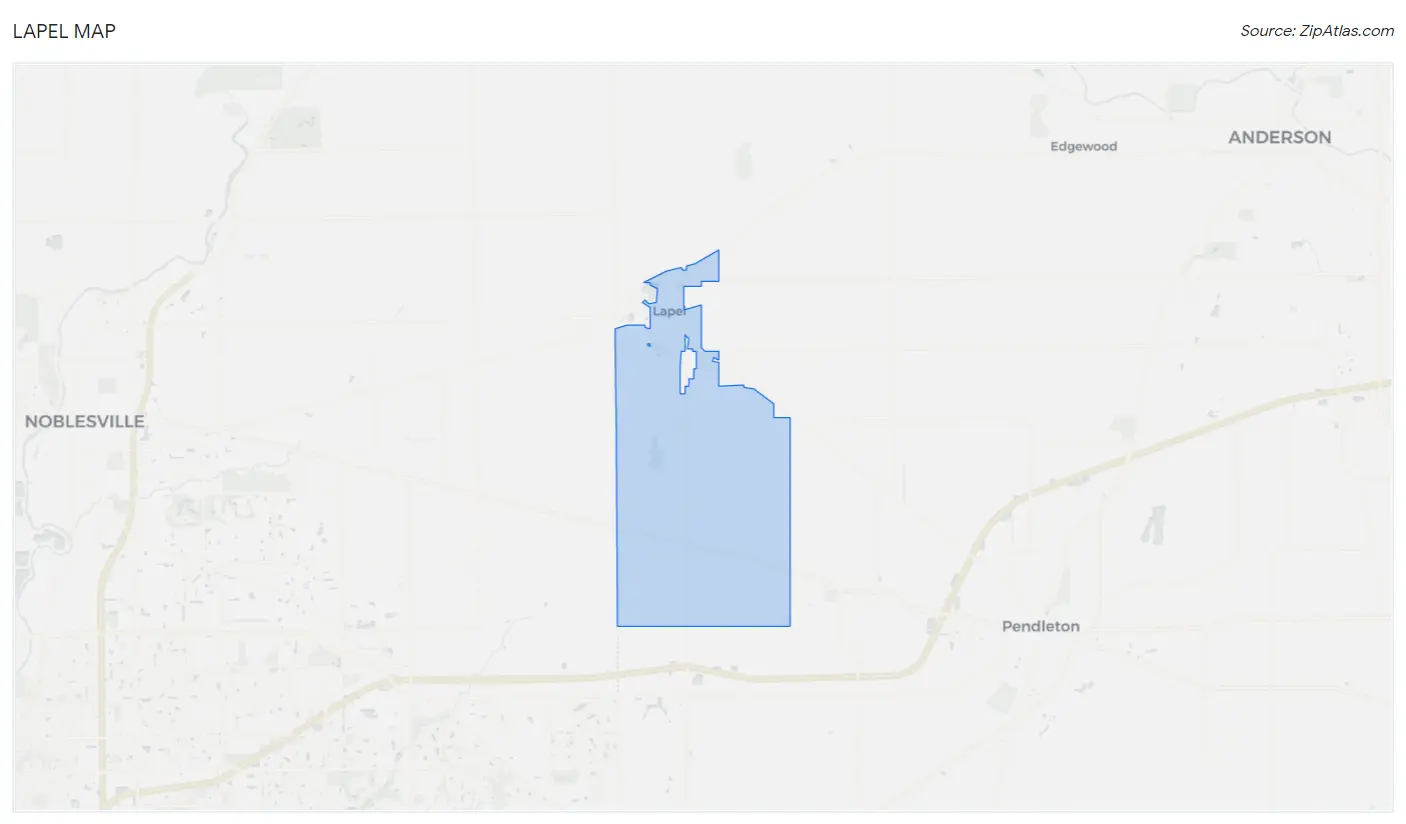
Lapel Map
Lapel Overview
$34,761
PER CAPITA INCOME
$82,778
AVG FAMILY INCOME
$69,028
AVG HOUSEHOLD INCOME
36.1%
WAGE / INCOME GAP [ % ]
63.9¢/ $1
WAGE / INCOME GAP [ $ ]
$6,650
FAMILY INCOME DEFICIT
0.33
INEQUALITY / GINI INDEX
2,517
TOTAL POPULATION
1,161
MALE POPULATION
1,356
FEMALE POPULATION
85.62
MALES / 100 FEMALES
116.80
FEMALES / 100 MALES
37.3
MEDIAN AGE
3.0
AVG FAMILY SIZE
2.4
AVG HOUSEHOLD SIZE
1,432
LABOR FORCE [ PEOPLE ]
73.7%
PERCENT IN LABOR FORCE
3.2%
UNEMPLOYMENT RATE
Lapel Zip Codes
Lapel Area Codes
Income in Lapel
Income Overview in Lapel
Per Capita Income in Lapel is $34,761, while median incomes of families and households are $82,778 and $69,028 respectively.
| Characteristic | Number | Measure |
| Per Capita Income | 2,517 | $34,761 |
| Median Family Income | 678 | $82,778 |
| Mean Family Income | 678 | $91,473 |
| Median Household Income | 1,051 | $69,028 |
| Mean Household Income | 1,051 | $80,080 |
| Income Deficit | 678 | $6,650 |
| Wage / Income Gap (%) | 2,517 | 36.09% |
| Wage / Income Gap ($) | 2,517 | 63.91¢ per $1 |
| Gini / Inequality Index | 2,517 | 0.33 |
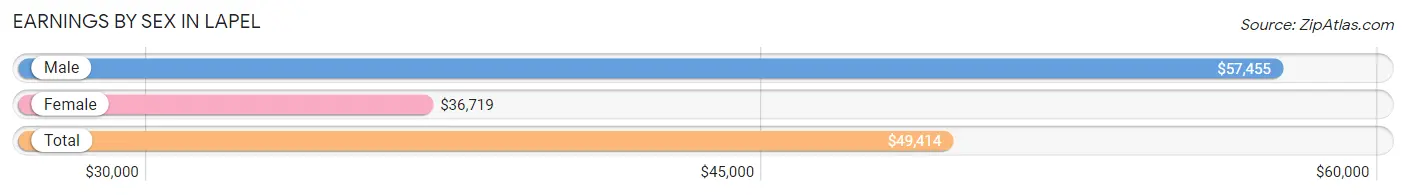
Earnings by Sex in Lapel
Average Earnings in Lapel are $49,414, $57,455 for men and $36,719 for women, a difference of 36.1%.
| Sex | Number | Average Earnings |
| Male | 698 (47.8%) | $57,455 |
| Female | 762 (52.2%) | $36,719 |
| Total | 1,460 (100.0%) | $49,414 |
Earnings by Sex by Income Bracket in Lapel
The most common earnings brackets in Lapel are $75,000 to $99,999 for men (166 | 23.8%) and $25,000 to $29,999 for women (92 | 12.1%).
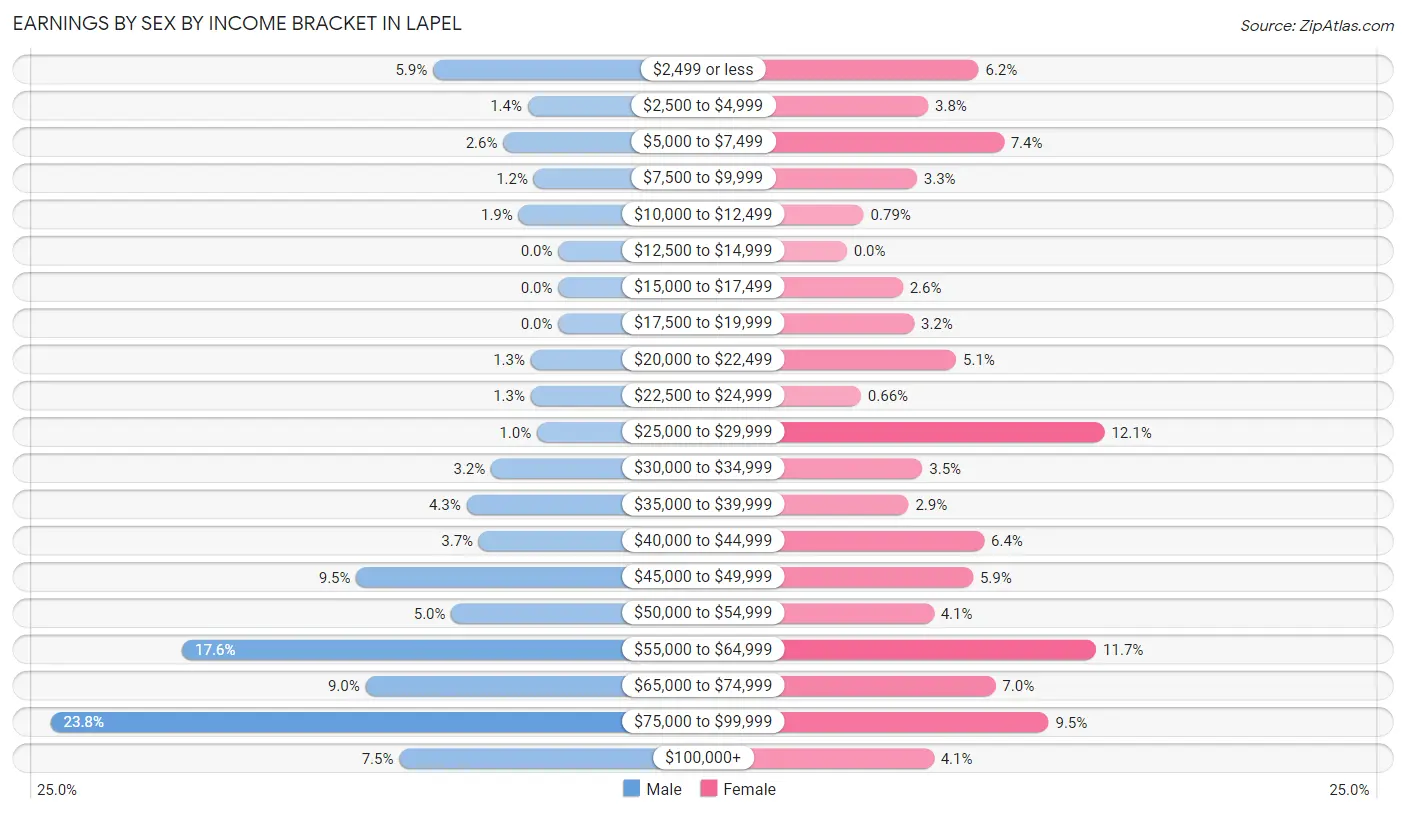
| Income | Male | Female |
| $2,499 or less | 41 (5.9%) | 47 (6.2%) |
| $2,500 to $4,999 | 10 (1.4%) | 29 (3.8%) |
| $5,000 to $7,499 | 18 (2.6%) | 56 (7.3%) |
| $7,500 to $9,999 | 8 (1.1%) | 25 (3.3%) |
| $10,000 to $12,499 | 13 (1.9%) | 6 (0.8%) |
| $12,500 to $14,999 | 0 (0.0%) | 0 (0.0%) |
| $15,000 to $17,499 | 0 (0.0%) | 20 (2.6%) |
| $17,500 to $19,999 | 0 (0.0%) | 24 (3.2%) |
| $20,000 to $22,499 | 9 (1.3%) | 39 (5.1%) |
| $22,500 to $24,999 | 9 (1.3%) | 5 (0.7%) |
| $25,000 to $29,999 | 7 (1.0%) | 92 (12.1%) |
| $30,000 to $34,999 | 22 (3.2%) | 27 (3.5%) |
| $35,000 to $39,999 | 30 (4.3%) | 22 (2.9%) |
| $40,000 to $44,999 | 26 (3.7%) | 49 (6.4%) |
| $45,000 to $49,999 | 66 (9.5%) | 45 (5.9%) |
| $50,000 to $54,999 | 35 (5.0%) | 31 (4.1%) |
| $55,000 to $64,999 | 123 (17.6%) | 89 (11.7%) |
| $65,000 to $74,999 | 63 (9.0%) | 53 (7.0%) |
| $75,000 to $99,999 | 166 (23.8%) | 72 (9.5%) |
| $100,000+ | 52 (7.4%) | 31 (4.1%) |
| Total | 698 (100.0%) | 762 (100.0%) |
Earnings by Sex by Educational Attainment in Lapel
Average earnings in Lapel are $58,165 for men and $45,071 for women, a difference of 22.5%. Men with an educational attainment of bachelor's degree enjoy the highest average annual earnings of $95,080, while those with high school diploma education earn the least with $53,125. Women with an educational attainment of graduate degree earn the most with the average annual earnings of $76,923, while those with high school diploma education have the smallest earnings of $20,909.
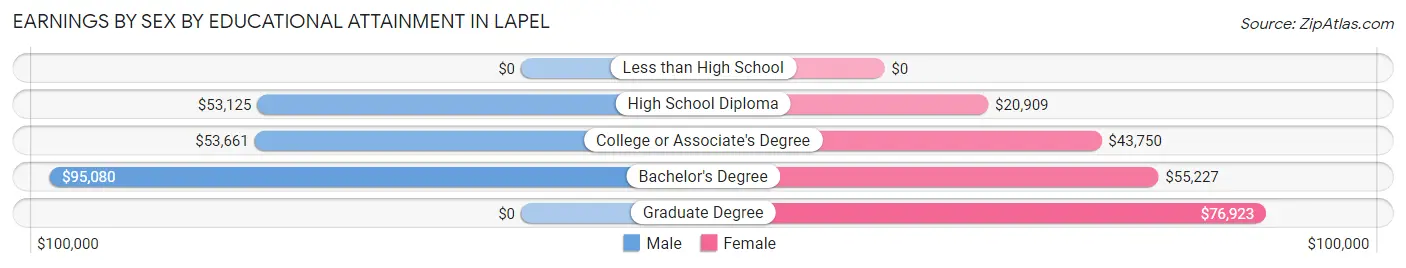
| Educational Attainment | Male Income | Female Income |
| Less than High School | - | - |
| High School Diploma | $53,125 | $20,909 |
| College or Associate's Degree | $53,661 | $43,750 |
| Bachelor's Degree | $95,080 | $55,227 |
| Graduate Degree | - | - |
| Total | $58,165 | $45,071 |
Family Income in Lapel
Family Income Brackets in Lapel
According to the Lapel family income data, there are 226 families falling into the $100,000 to $149,999 income range, which is the most common income bracket and makes up 33.3% of all families.
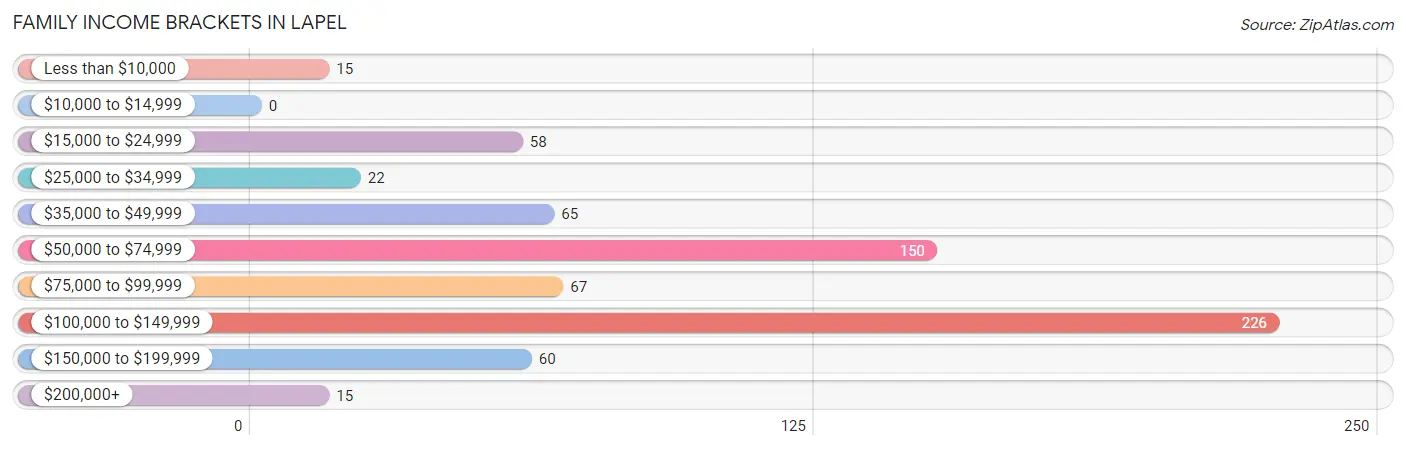
| Income Bracket | # Families | % Families |
| Less than $10,000 | 15 | 2.2% |
| $10,000 to $14,999 | 0 | 0.0% |
| $15,000 to $24,999 | 58 | 8.6% |
| $25,000 to $34,999 | 22 | 3.2% |
| $35,000 to $49,999 | 65 | 9.6% |
| $50,000 to $74,999 | 150 | 22.1% |
| $75,000 to $99,999 | 67 | 9.9% |
| $100,000 to $149,999 | 226 | 33.3% |
| $150,000 to $199,999 | 60 | 8.8% |
| $200,000+ | 15 | 2.2% |
Family Income by Famaliy Size in Lapel
4-person families (146 | 21.5%) account for the highest median family income in Lapel with $111,250 per family, while 2-person families (359 | 52.9%) have the highest median income of $37,216 per family member.
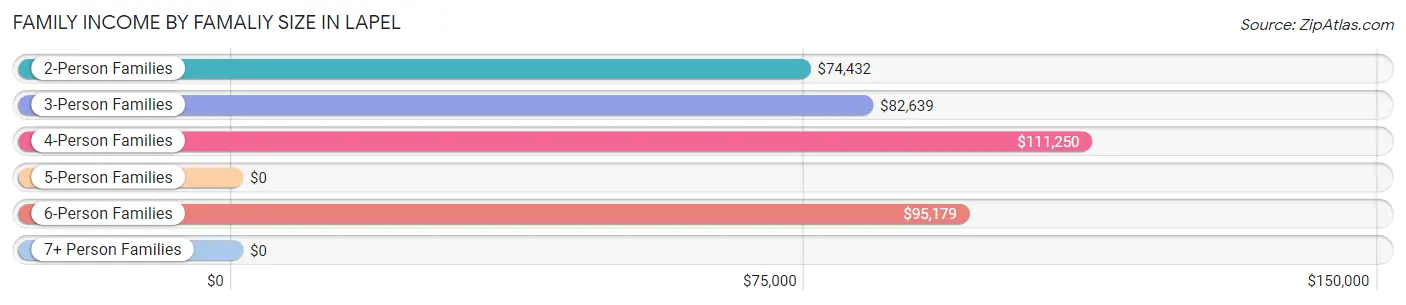
| Income Bracket | # Families | Median Income |
| 2-Person Families | 359 (52.9%) | $74,432 |
| 3-Person Families | 129 (19.0%) | $82,639 |
| 4-Person Families | 146 (21.5%) | $111,250 |
| 5-Person Families | 15 (2.2%) | $0 |
| 6-Person Families | 29 (4.3%) | $95,179 |
| 7+ Person Families | 0 (0.0%) | $0 |
| Total | 678 (100.0%) | $82,778 |
Family Income by Number of Earners in Lapel
The median family income in Lapel is $82,778, with families comprising 2 earners (348) having the highest median family income of $123,438, while families with no earners (55) have the lowest median family income of $47,750, accounting for 51.3% and 8.1% of families, respectively.
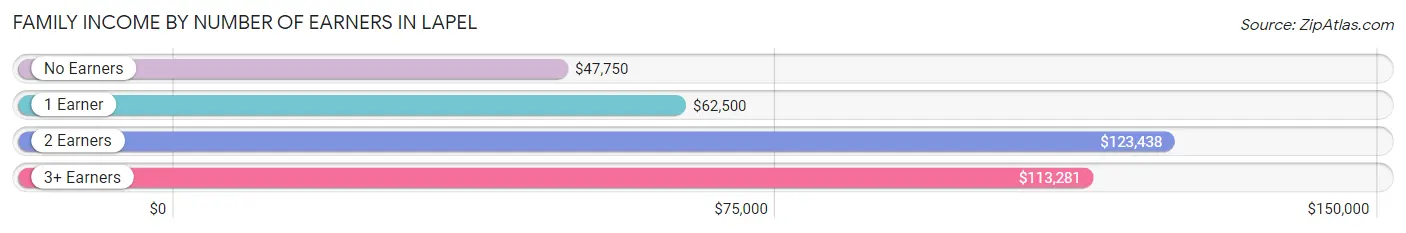
| Number of Earners | # Families | Median Income |
| No Earners | 55 (8.1%) | $47,750 |
| 1 Earner | 228 (33.6%) | $62,500 |
| 2 Earners | 348 (51.3%) | $123,438 |
| 3+ Earners | 47 (6.9%) | $113,281 |
| Total | 678 (100.0%) | $82,778 |
Household Income in Lapel
Household Income Brackets in Lapel
With 253 households falling in the category, the $100,000 to $149,999 income range is the most frequent in Lapel, accounting for 24.1% of all households. In contrast, only 6 households (0.6%) fall into the $10,000 to $14,999 income bracket, making it the least populous group.
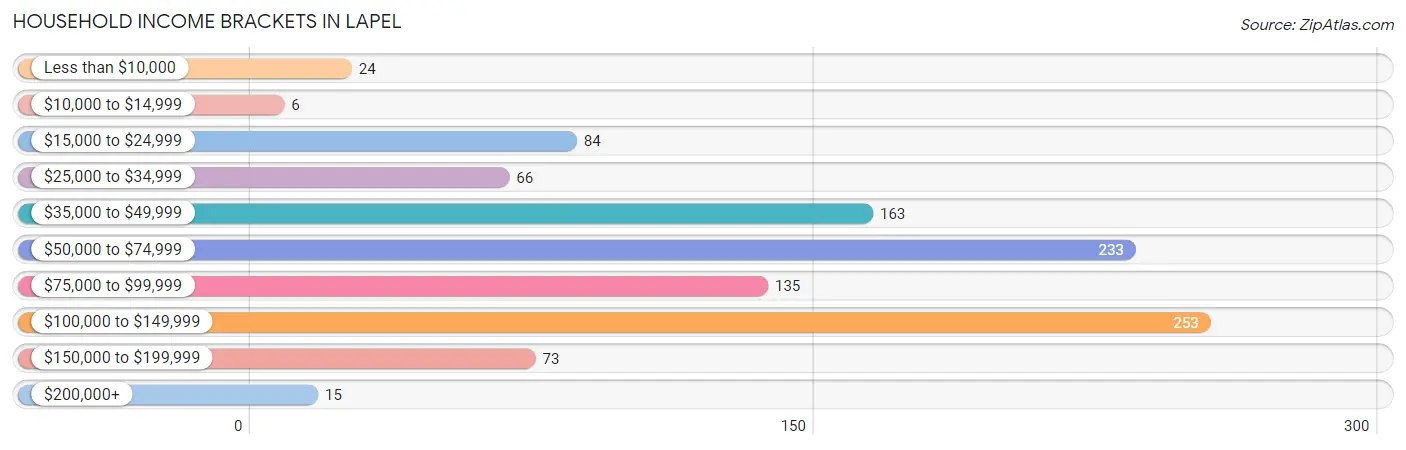
| Income Bracket | # Households | % Households |
| Less than $10,000 | 24 | 2.3% |
| $10,000 to $14,999 | 6 | 0.6% |
| $15,000 to $24,999 | 84 | 8.0% |
| $25,000 to $34,999 | 66 | 6.3% |
| $35,000 to $49,999 | 163 | 15.5% |
| $50,000 to $74,999 | 233 | 22.2% |
| $75,000 to $99,999 | 135 | 12.8% |
| $100,000 to $149,999 | 253 | 24.1% |
| $150,000 to $199,999 | 73 | 6.9% |
| $200,000+ | 15 | 1.4% |
Household Income by Householder Age in Lapel
The median household income in Lapel is $69,028, with the highest median household income of $77,841 found in the 45 to 64 years age bracket for the primary householder. A total of 465 households (44.2%) fall into this category.
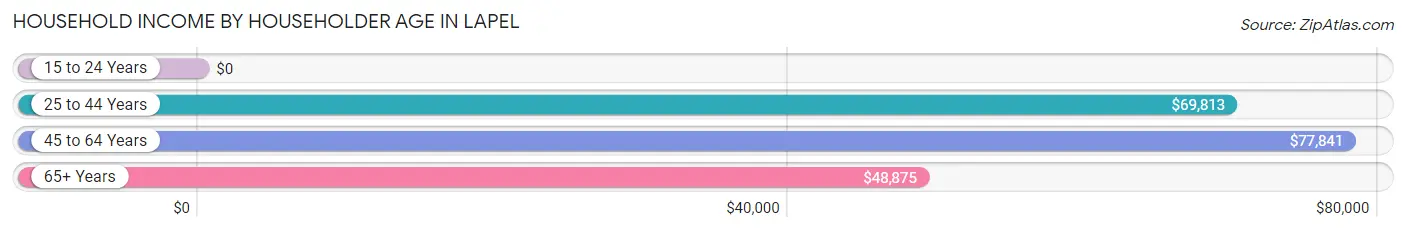
| Income Bracket | # Households | Median Income |
| 15 to 24 Years | 0 (0.0%) | $0 |
| 25 to 44 Years | 393 (37.4%) | $69,813 |
| 45 to 64 Years | 465 (44.2%) | $77,841 |
| 65+ Years | 193 (18.4%) | $48,875 |
| Total | 1,051 (100.0%) | $69,028 |
Poverty in Lapel
Income Below Poverty by Sex and Age in Lapel
With 6.4% poverty level for males and 5.7% for females among the residents of Lapel, under 5 year old males and 16 and 17 year old females are the most vulnerable to poverty, with 35 males (47.9%) and 8 females (38.1%) in their respective age groups living below the poverty level.
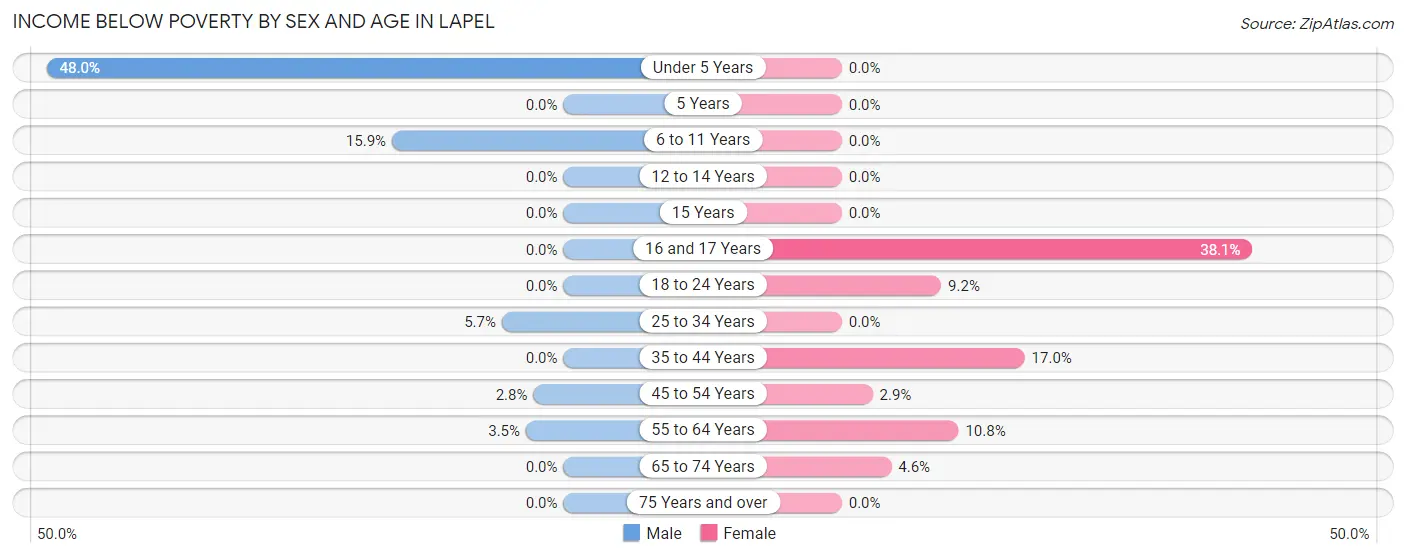
| Age Bracket | Male | Female |
| Under 5 Years | 35 (47.9%) | 0 (0.0%) |
| 5 Years | 0 (0.0%) | 0 (0.0%) |
| 6 to 11 Years | 14 (15.9%) | 0 (0.0%) |
| 12 to 14 Years | 0 (0.0%) | 0 (0.0%) |
| 15 Years | 0 (0.0%) | 0 (0.0%) |
| 16 and 17 Years | 0 (0.0%) | 8 (38.1%) |
| 18 to 24 Years | 0 (0.0%) | 13 (9.2%) |
| 25 to 34 Years | 12 (5.7%) | 0 (0.0%) |
| 35 to 44 Years | 0 (0.0%) | 28 (17.0%) |
| 45 to 54 Years | 5 (2.8%) | 6 (2.9%) |
| 55 to 64 Years | 8 (3.5%) | 17 (10.8%) |
| 65 to 74 Years | 0 (0.0%) | 4 (4.6%) |
| 75 Years and over | 0 (0.0%) | 0 (0.0%) |
| Total | 74 (6.4%) | 76 (5.7%) |
Income Above Poverty by Sex and Age in Lapel
According to the poverty statistics in Lapel, males aged 5 years and females aged under 5 years are the age groups that are most secure financially, with 100.0% of males and 100.0% of females in these age groups living above the poverty line.
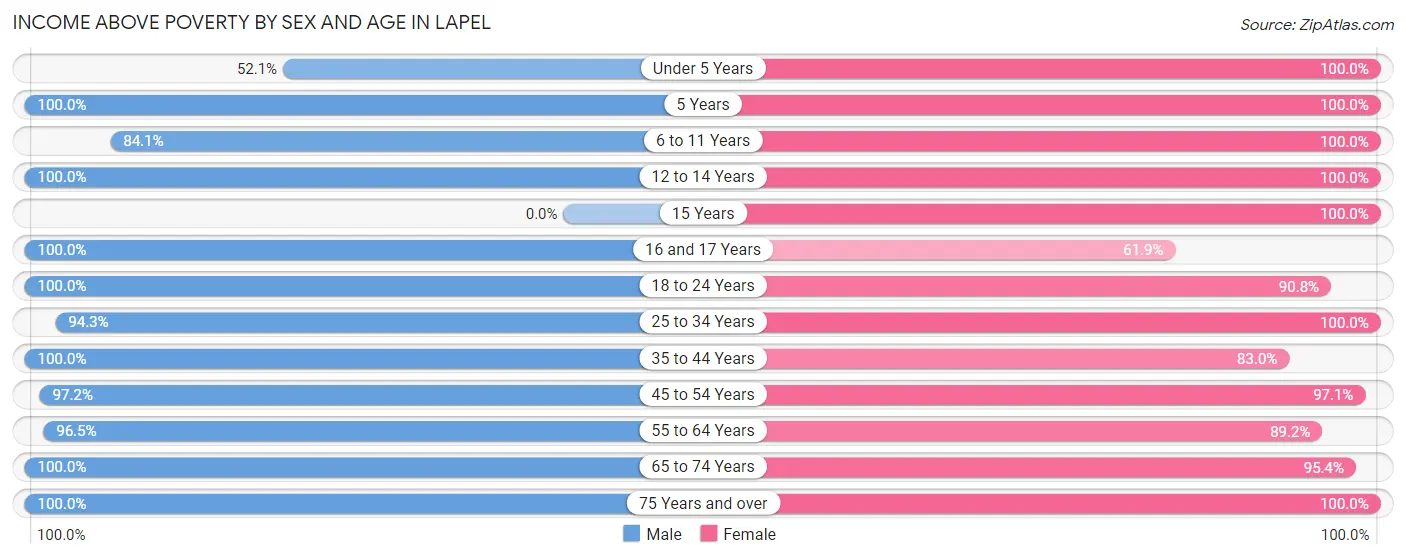
| Age Bracket | Male | Female |
| Under 5 Years | 38 (52.0%) | 167 (100.0%) |
| 5 Years | 16 (100.0%) | 7 (100.0%) |
| 6 to 11 Years | 74 (84.1%) | 90 (100.0%) |
| 12 to 14 Years | 71 (100.0%) | 45 (100.0%) |
| 15 Years | 0 (0.0%) | 7 (100.0%) |
| 16 and 17 Years | 45 (100.0%) | 13 (61.9%) |
| 18 to 24 Years | 14 (100.0%) | 128 (90.8%) |
| 25 to 34 Years | 198 (94.3%) | 155 (100.0%) |
| 35 to 44 Years | 114 (100.0%) | 137 (83.0%) |
| 45 to 54 Years | 174 (97.2%) | 204 (97.1%) |
| 55 to 64 Years | 222 (96.5%) | 140 (89.2%) |
| 65 to 74 Years | 94 (100.0%) | 83 (95.4%) |
| 75 Years and over | 27 (100.0%) | 94 (100.0%) |
| Total | 1,087 (93.6%) | 1,270 (94.4%) |
Income Below Poverty Among Married-Couple Families in Lapel
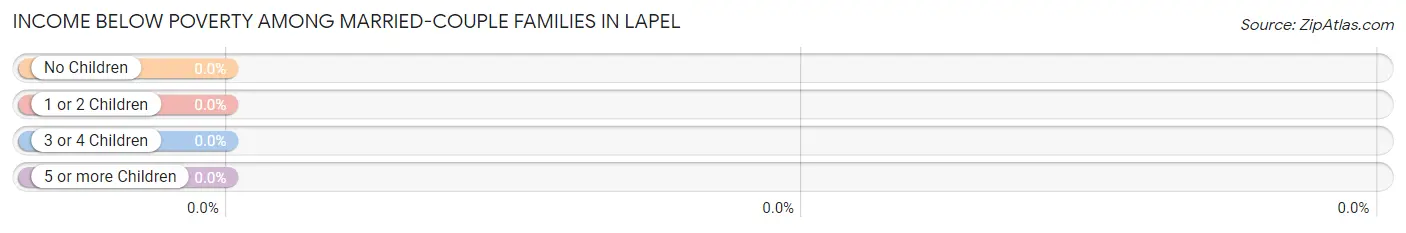
| Children | Above Poverty | Below Poverty |
| No Children | 208 (100.0%) | 0 (0.0%) |
| 1 or 2 Children | 145 (100.0%) | 0 (0.0%) |
| 3 or 4 Children | 37 (100.0%) | 0 (0.0%) |
| 5 or more Children | 0 (0.0%) | 0 (0.0%) |
| Total | 390 (100.0%) | 0 (0.0%) |
Income Below Poverty Among Single-Parent Households in Lapel
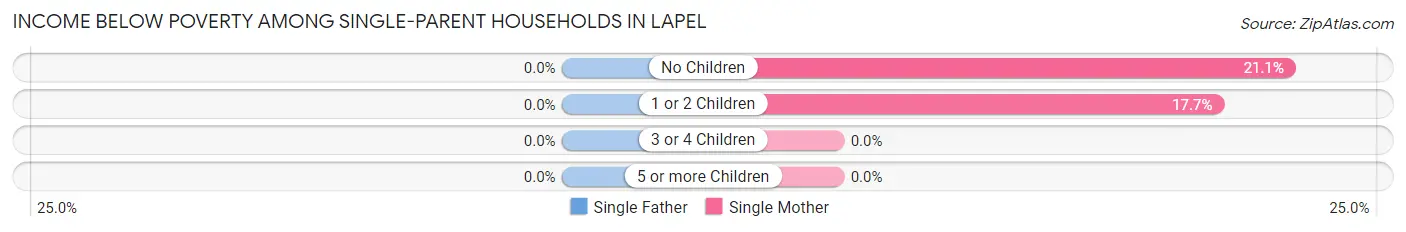
| Children | Single Father | Single Mother |
| No Children | 0 (0.0%) | 12 (21.0%) |
| 1 or 2 Children | 0 (0.0%) | 28 (17.7%) |
| 3 or 4 Children | 0 (0.0%) | 0 (0.0%) |
| 5 or more Children | 0 (0.0%) | 0 (0.0%) |
| Total | 0 (0.0%) | 40 (18.6%) |
Income Below Poverty Among Married-Couple vs Single-Parent Households in Lapel
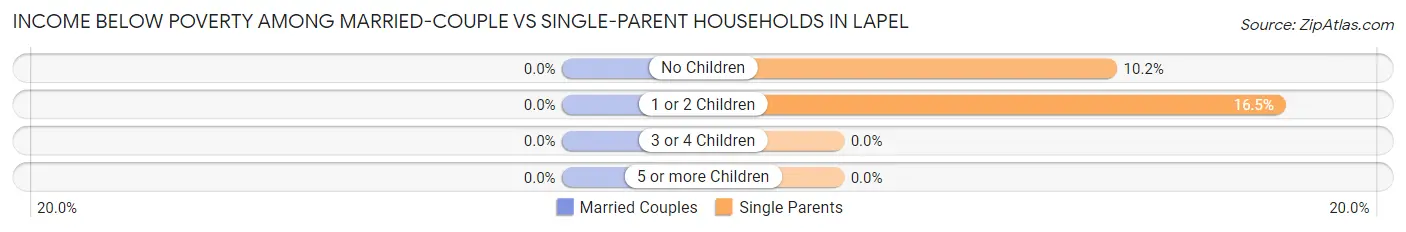
| Children | Married-Couple Families | Single-Parent Households |
| No Children | 0 (0.0%) | 12 (10.2%) |
| 1 or 2 Children | 0 (0.0%) | 28 (16.5%) |
| 3 or 4 Children | 0 (0.0%) | 0 (0.0%) |
| 5 or more Children | 0 (0.0%) | 0 (0.0%) |
| Total | 0 (0.0%) | 40 (13.9%) |
Race in Lapel
The most populous races in Lapel are White / Caucasian (2,409 | 95.7%), Hispanic or Latino (87 | 3.5%), and Two or more Races (80 | 3.2%).
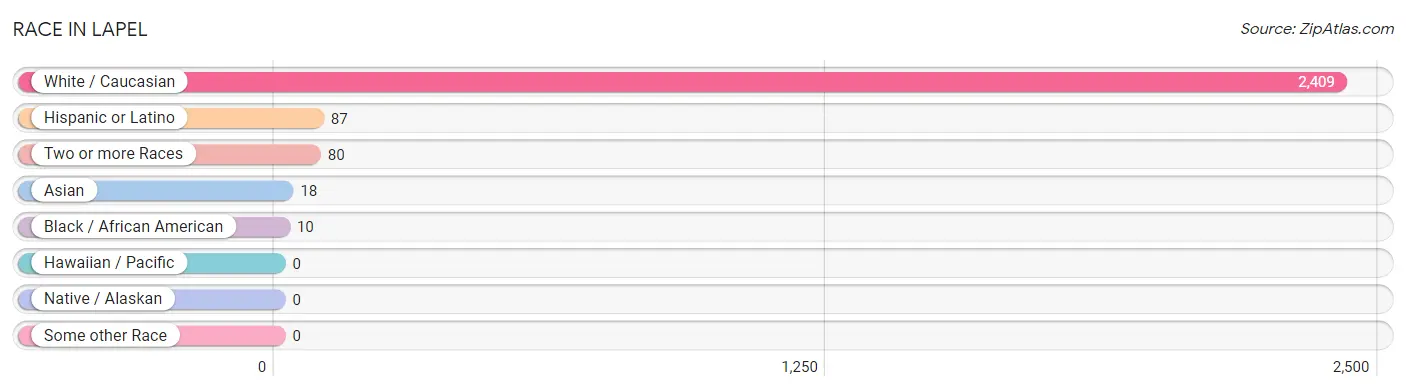
| Race | # Population | % Population |
| Asian | 18 | 0.7% |
| Black / African American | 10 | 0.4% |
| Hawaiian / Pacific | 0 | 0.0% |
| Hispanic or Latino | 87 | 3.5% |
| Native / Alaskan | 0 | 0.0% |
| White / Caucasian | 2,409 | 95.7% |
| Two or more Races | 80 | 3.2% |
| Some other Race | 0 | 0.0% |
| Total | 2,517 | 100.0% |
Ancestry in Lapel
The most populous ancestries reported in Lapel are German (577 | 22.9%), English (340 | 13.5%), Irish (203 | 8.1%), American (196 | 7.8%), and Scottish (66 | 2.6%), together accounting for 54.9% of all Lapel residents.
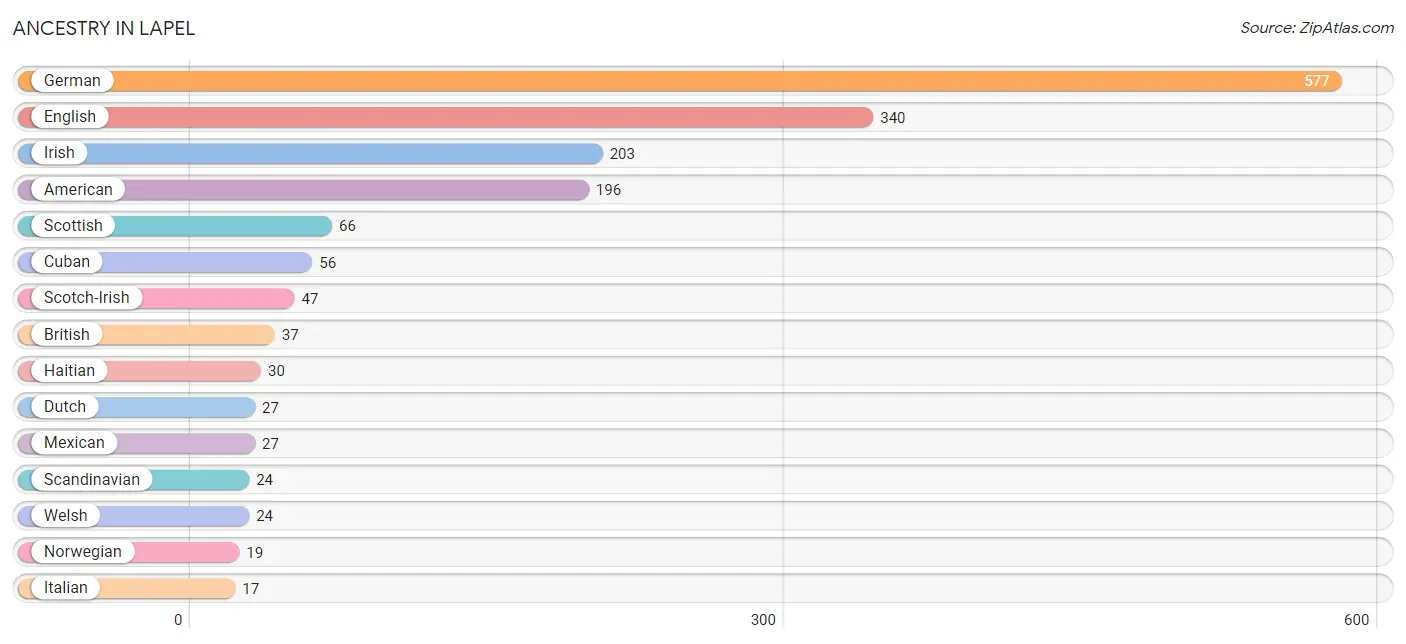
| Ancestry | # Population | % Population |
| Aleut | 1 | 0.0% |
| American | 196 | 7.8% |
| British | 37 | 1.5% |
| Central American | 4 | 0.2% |
| Central American Indian | 4 | 0.2% |
| Cherokee | 2 | 0.1% |
| Cuban | 56 | 2.2% |
| Czechoslovakian | 4 | 0.2% |
| Dutch | 27 | 1.1% |
| Eastern European | 13 | 0.5% |
| English | 340 | 13.5% |
| European | 15 | 0.6% |
| French | 9 | 0.4% |
| French Canadian | 8 | 0.3% |
| German | 577 | 22.9% |
| Greek | 4 | 0.2% |
| Haitian | 30 | 1.2% |
| Irish | 203 | 8.1% |
| Italian | 17 | 0.7% |
| Mexican | 27 | 1.1% |
| Norwegian | 19 | 0.7% |
| Panamanian | 4 | 0.2% |
| Russian | 8 | 0.3% |
| Scandinavian | 24 | 0.9% |
| Scotch-Irish | 47 | 1.9% |
| Scottish | 66 | 2.6% |
| Swiss | 5 | 0.2% |
| Welsh | 24 | 0.9% | View All 28 Rows |
Immigrants in Lapel
The most numerous immigrant groups reported in Lapel came from Caribbean (10 | 0.4%), Haiti (10 | 0.4%), and Latin America (10 | 0.4%), together accounting for 1.2% of all Lapel residents.
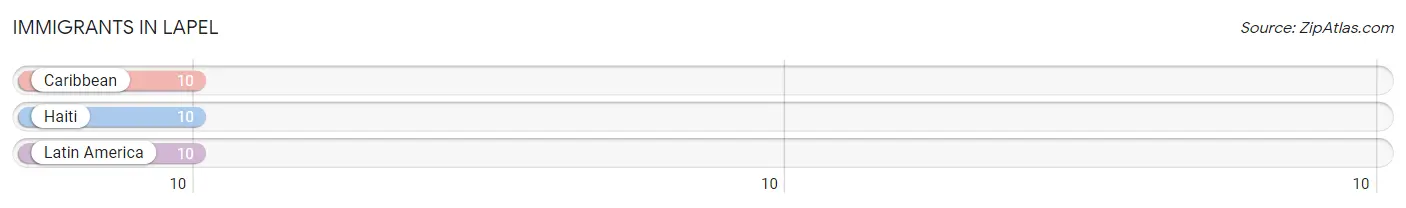
| Immigration Origin | # Population | % Population |
| Caribbean | 10 | 0.4% |
| Haiti | 10 | 0.4% |
| Latin America | 10 | 0.4% | View All 3 Rows |
Sex and Age in Lapel
Sex and Age in Lapel
The most populous age groups in Lapel are 55 to 59 Years (142 | 12.2%) for men and Under 5 Years (167 | 12.3%) for women.
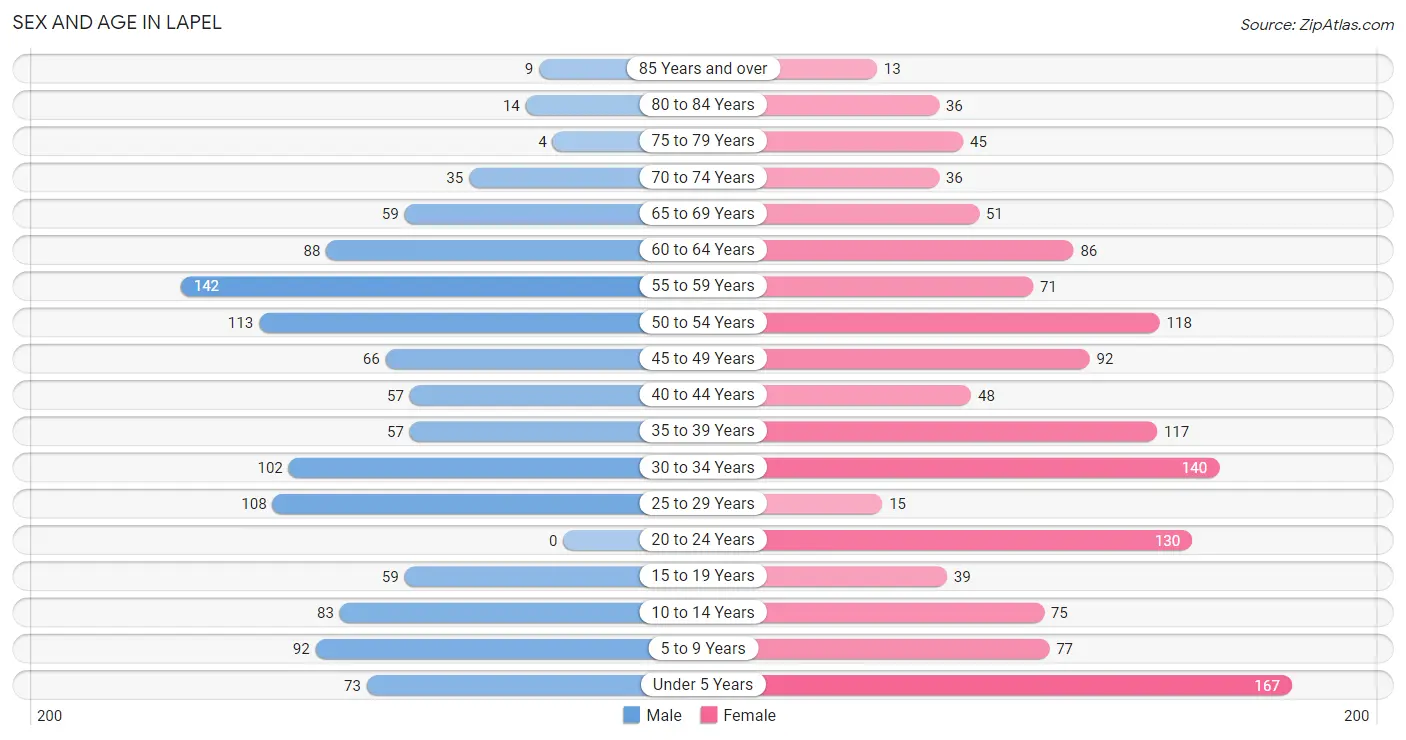
| Age Bracket | Male | Female |
| Under 5 Years | 73 (6.3%) | 167 (12.3%) |
| 5 to 9 Years | 92 (7.9%) | 77 (5.7%) |
| 10 to 14 Years | 83 (7.1%) | 75 (5.5%) |
| 15 to 19 Years | 59 (5.1%) | 39 (2.9%) |
| 20 to 24 Years | 0 (0.0%) | 130 (9.6%) |
| 25 to 29 Years | 108 (9.3%) | 15 (1.1%) |
| 30 to 34 Years | 102 (8.8%) | 140 (10.3%) |
| 35 to 39 Years | 57 (4.9%) | 117 (8.6%) |
| 40 to 44 Years | 57 (4.9%) | 48 (3.5%) |
| 45 to 49 Years | 66 (5.7%) | 92 (6.8%) |
| 50 to 54 Years | 113 (9.7%) | 118 (8.7%) |
| 55 to 59 Years | 142 (12.2%) | 71 (5.2%) |
| 60 to 64 Years | 88 (7.6%) | 86 (6.3%) |
| 65 to 69 Years | 59 (5.1%) | 51 (3.8%) |
| 70 to 74 Years | 35 (3.0%) | 36 (2.6%) |
| 75 to 79 Years | 4 (0.3%) | 45 (3.3%) |
| 80 to 84 Years | 14 (1.2%) | 36 (2.6%) |
| 85 Years and over | 9 (0.8%) | 13 (1.0%) |
| Total | 1,161 (100.0%) | 1,356 (100.0%) |
Families and Households in Lapel
Median Family Size in Lapel
The median family size in Lapel is 3.00 persons per family, with married-couple families (390 | 57.5%) accounting for the largest median family size of 3.26 persons per family. On the other hand, single male/father families (73 | 10.8%) represent the smallest median family size with 2.32 persons per family.
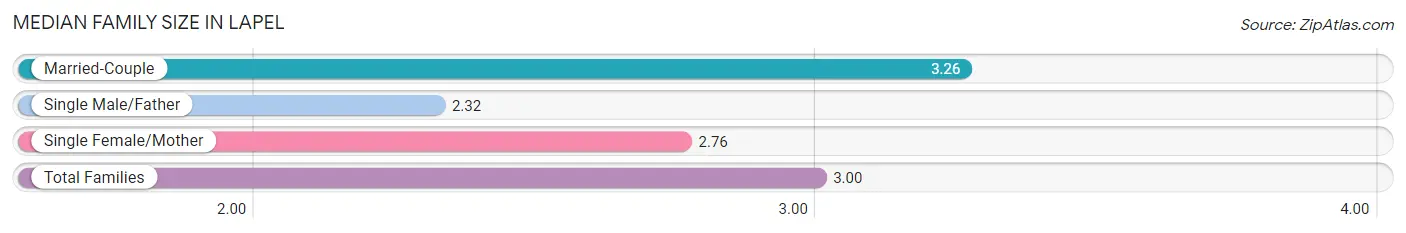
| Family Type | # Families | Family Size |
| Married-Couple | 390 (57.5%) | 3.26 |
| Single Male/Father | 73 (10.8%) | 2.32 |
| Single Female/Mother | 215 (31.7%) | 2.76 |
| Total Families | 678 (100.0%) | 3.00 |
Median Household Size in Lapel
The median household size in Lapel is 2.39 persons per household, with married-couple households (390 | 37.1%) accounting for the largest median household size of 3.28 persons per household. non-family households (373 | 35.5%) represent the smallest median household size with 1.19 persons per household.
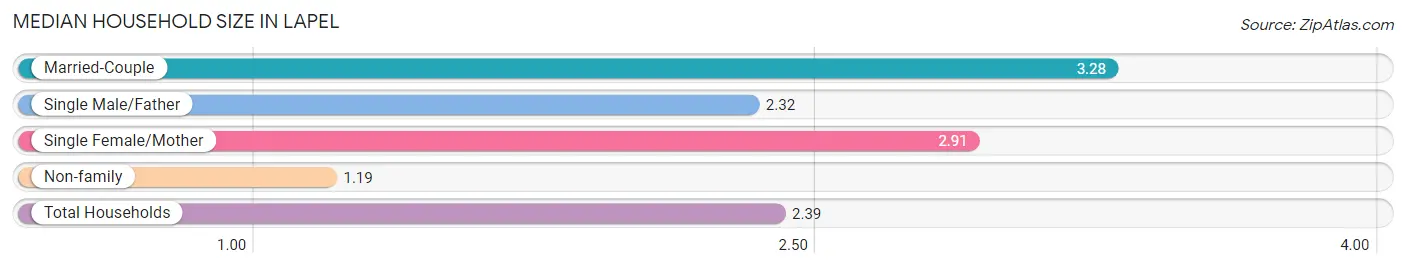
| Household Type | # Households | Household Size |
| Married-Couple | 390 (37.1%) | 3.28 |
| Single Male/Father | 73 (7.0%) | 2.32 |
| Single Female/Mother | 215 (20.5%) | 2.91 |
| Non-family | 373 (35.5%) | 1.19 |
| Total Households | 1,051 (100.0%) | 2.39 |
Household Size by Marriage Status in Lapel
Out of a total of 1,051 households in Lapel, 678 (64.5%) are family households, while 373 (35.5%) are nonfamily households. The most numerous type of family households are 2-person households, comprising 352, and the most common type of nonfamily households are 1-person households, comprising 315.
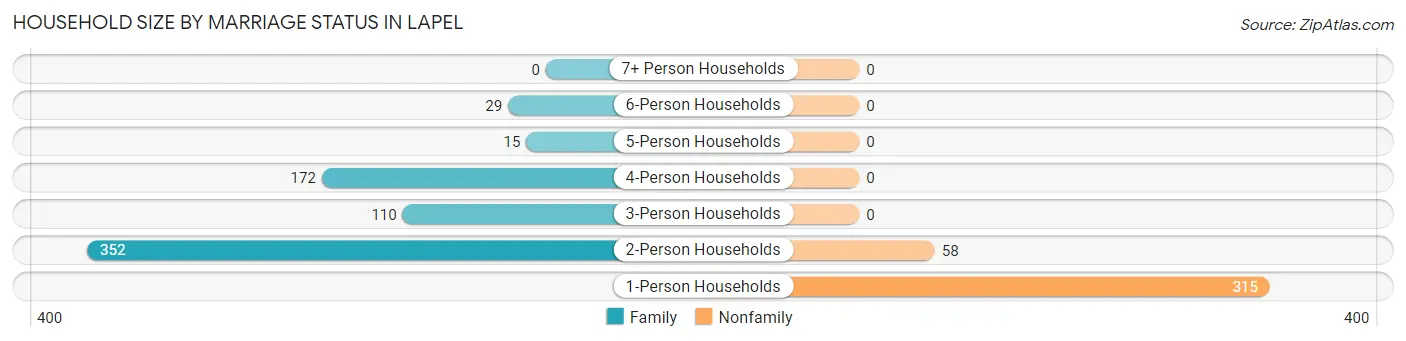
| Household Size | Family Households | Nonfamily Households |
| 1-Person Households | - | 315 (30.0%) |
| 2-Person Households | 352 (33.5%) | 58 (5.5%) |
| 3-Person Households | 110 (10.5%) | 0 (0.0%) |
| 4-Person Households | 172 (16.4%) | 0 (0.0%) |
| 5-Person Households | 15 (1.4%) | 0 (0.0%) |
| 6-Person Households | 29 (2.8%) | 0 (0.0%) |
| 7+ Person Households | 0 (0.0%) | 0 (0.0%) |
| Total | 678 (64.5%) | 373 (35.5%) |
Female Fertility in Lapel
Fertility by Age in Lapel
Average fertility rate in Lapel is 91.0 births per 1,000 women. Women in the age bracket of 20 to 34 years have the highest fertility rate with 147.0 births per 1,000 women. Women in the age bracket of 20 to 34 years acount for 76.4% of all women with births.
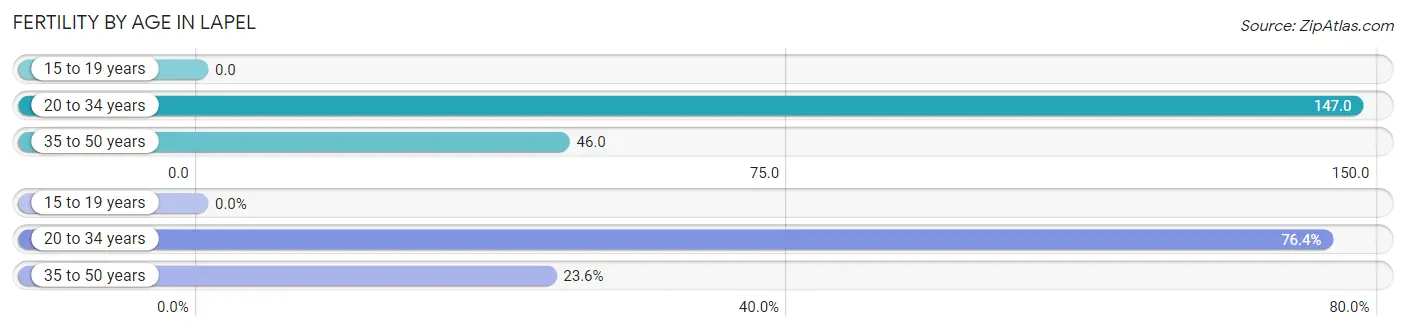
| Age Bracket | Women with Births | Births / 1,000 Women |
| 15 to 19 years | 0 (0.0%) | 0.0 |
| 20 to 34 years | 42 (76.4%) | 147.0 |
| 35 to 50 years | 13 (23.6%) | 46.0 |
| Total | 55 (100.0%) | 91.0 |
Fertility by Age by Marriage Status in Lapel
76.4% of women with births (55) in Lapel are married. The highest percentage of unmarried women with births falls into 35 to 50 years age bracket with 100.0% of them unmarried at the time of birth, while the lowest percentage of unmarried women with births belong to 20 to 34 years age bracket with 0.0% of them unmarried.
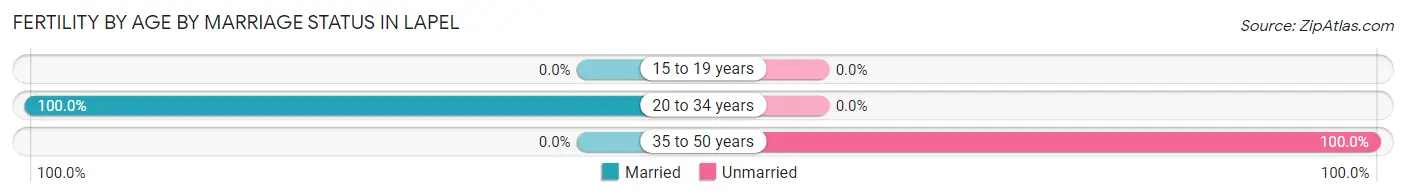
| Age Bracket | Married | Unmarried |
| 15 to 19 years | 0 (0.0%) | 0 (0.0%) |
| 20 to 34 years | 42 (100.0%) | 0 (0.0%) |
| 35 to 50 years | 0 (0.0%) | 13 (100.0%) |
| Total | 42 (76.4%) | 13 (23.6%) |
Fertility by Education in Lapel
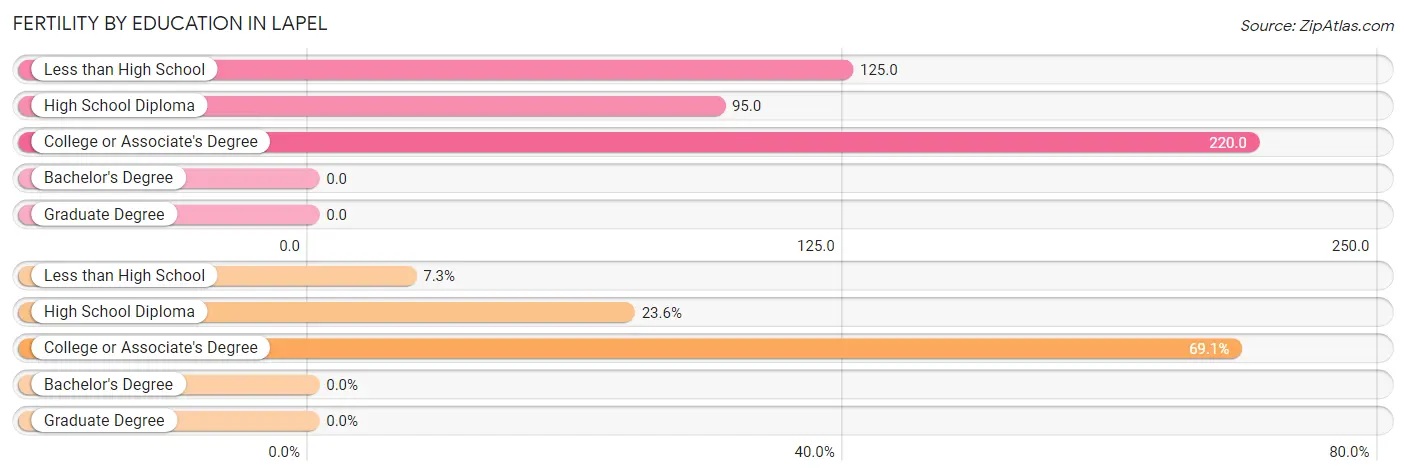
| Educational Attainment | Women with Births | Births / 1,000 Women |
| Less than High School | 4 (7.3%) | 125.0 |
| High School Diploma | 13 (23.6%) | 95.0 |
| College or Associate's Degree | 38 (69.1%) | 220.0 |
| Bachelor's Degree | 0 (0.0%) | 0.0 |
| Graduate Degree | 0 (0.0%) | 0.0 |
| Total | 55 (100.0%) | 91.0 |
Fertility by Education by Marriage Status in Lapel
23.6% of women with births in Lapel are unmarried. Women with the educational attainment of less than high school are most likely to be married with 100.0% of them married at childbirth, while women with the educational attainment of high school diploma are least likely to be married with 100.0% of them unmarried at childbirth.
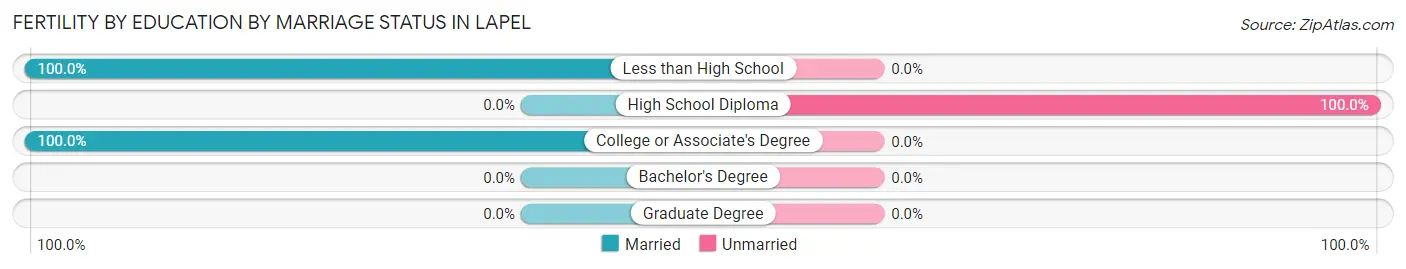
| Educational Attainment | Married | Unmarried |
| Less than High School | 4 (100.0%) | 0 (0.0%) |
| High School Diploma | 0 (0.0%) | 13 (100.0%) |
| College or Associate's Degree | 38 (100.0%) | 0 (0.0%) |
| Bachelor's Degree | 0 (0.0%) | 0 (0.0%) |
| Graduate Degree | 0 (0.0%) | 0 (0.0%) |
| Total | 42 (76.4%) | 13 (23.6%) |
Employment Characteristics in Lapel
Employment by Class of Employer in Lapel
Among the 1,362 employed individuals in Lapel, private company employees (988 | 72.5%), state government employees (115 | 8.4%), and not-for-profit organizations (99 | 7.3%) make up the most common classes of employment.
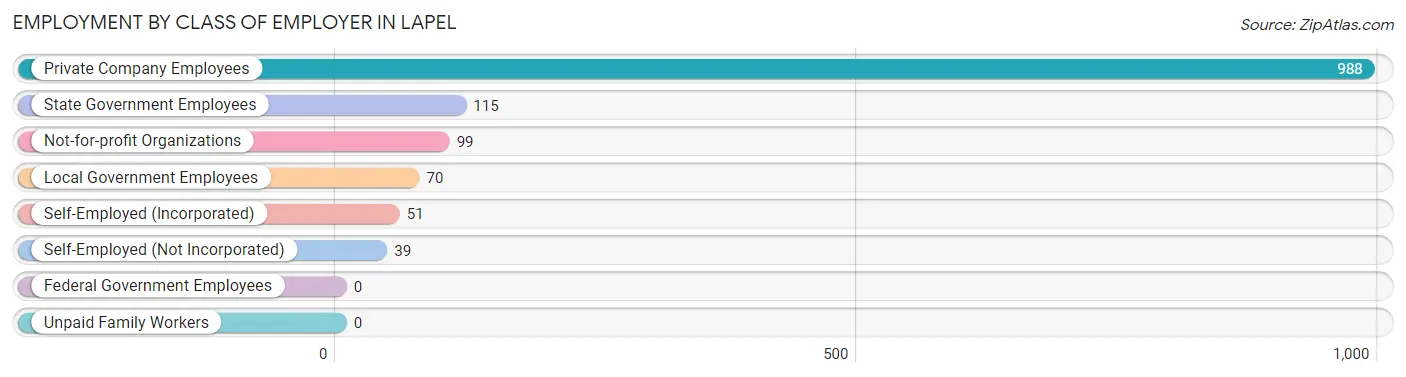
| Employer Class | # Employees | % Employees |
| Private Company Employees | 988 | 72.5% |
| Self-Employed (Incorporated) | 51 | 3.7% |
| Self-Employed (Not Incorporated) | 39 | 2.9% |
| Not-for-profit Organizations | 99 | 7.3% |
| Local Government Employees | 70 | 5.1% |
| State Government Employees | 115 | 8.4% |
| Federal Government Employees | 0 | 0.0% |
| Unpaid Family Workers | 0 | 0.0% |
| Total | 1,362 | 100.0% |
Employment Status by Age in Lapel
According to the labor force statistics for Lapel, out of the total population over 16 years of age (1,943), 73.7% or 1,432 individuals are in the labor force, with 3.2% or 46 of them unemployed. The age group with the highest labor force participation rate is 25 to 29 years, with 100.0% or 123 individuals in the labor force. Within the labor force, the 65 to 74 years age range has the highest percentage of unemployed individuals, with 19.6% or 11 of them being unemployed.
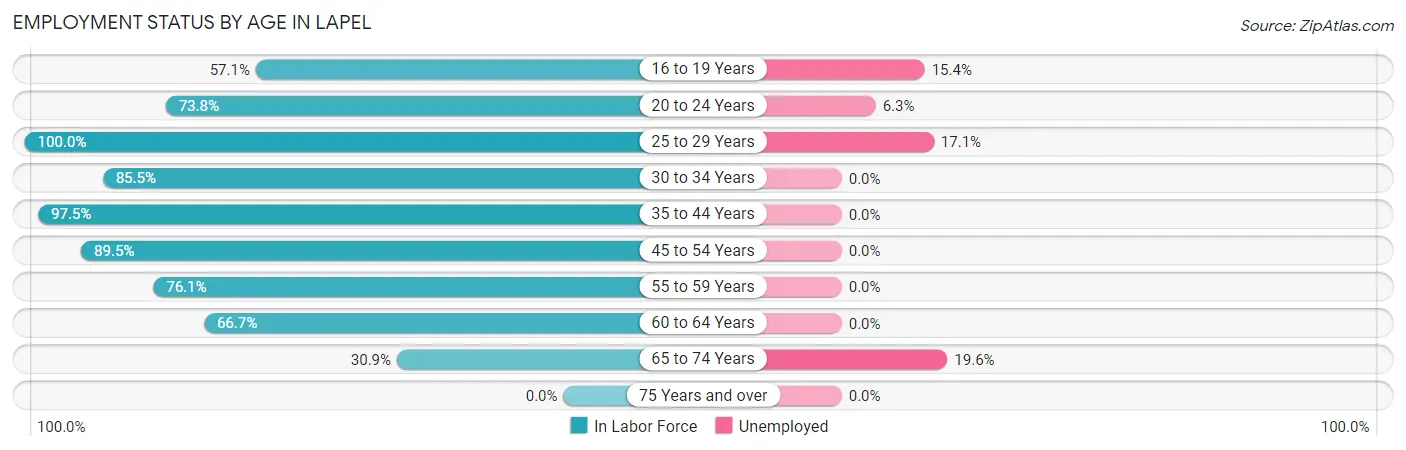
| Age Bracket | In Labor Force | Unemployed |
| 16 to 19 Years | 52 (57.1%) | 8 (15.4%) |
| 20 to 24 Years | 96 (73.8%) | 6 (6.3%) |
| 25 to 29 Years | 123 (100.0%) | 21 (17.1%) |
| 30 to 34 Years | 207 (85.5%) | 0 (0.0%) |
| 35 to 44 Years | 272 (97.5%) | 0 (0.0%) |
| 45 to 54 Years | 348 (89.5%) | 0 (0.0%) |
| 55 to 59 Years | 162 (76.1%) | 0 (0.0%) |
| 60 to 64 Years | 116 (66.7%) | 0 (0.0%) |
| 65 to 74 Years | 56 (30.9%) | 11 (19.6%) |
| 75 Years and over | 0 (0.0%) | 0 (0.0%) |
| Total | 1,432 (73.7%) | 46 (3.2%) |
Employment Status by Educational Attainment in Lapel
According to labor force statistics for Lapel, 86.5% of individuals (1,228) out of the total population between 25 and 64 years of age (1,420) are in the labor force, with 1.7% or 21 of them being unemployed. The group with the highest labor force participation rate are those with the educational attainment of bachelor's degree or higher, with 97.4% or 441 individuals in the labor force. Within the labor force, individuals with high school diploma education have the highest percentage of unemployment, with 6.1% or 21 of them being unemployed.
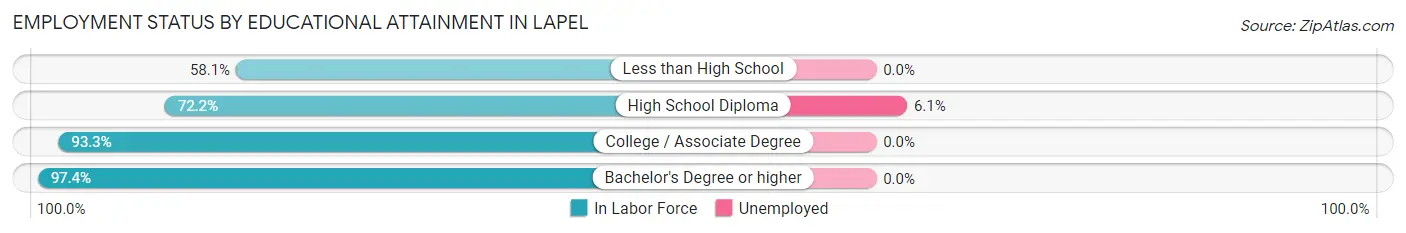
| Educational Attainment | In Labor Force | Unemployed |
| Less than High School | 25 (58.1%) | 0 (0.0%) |
| High School Diploma | 343 (72.2%) | 29 (6.1%) |
| College / Associate Degree | 419 (93.3%) | 0 (0.0%) |
| Bachelor's Degree or higher | 441 (97.4%) | 0 (0.0%) |
| Total | 1,228 (86.5%) | 24 (1.7%) |
Employment Occupations by Sex in Lapel
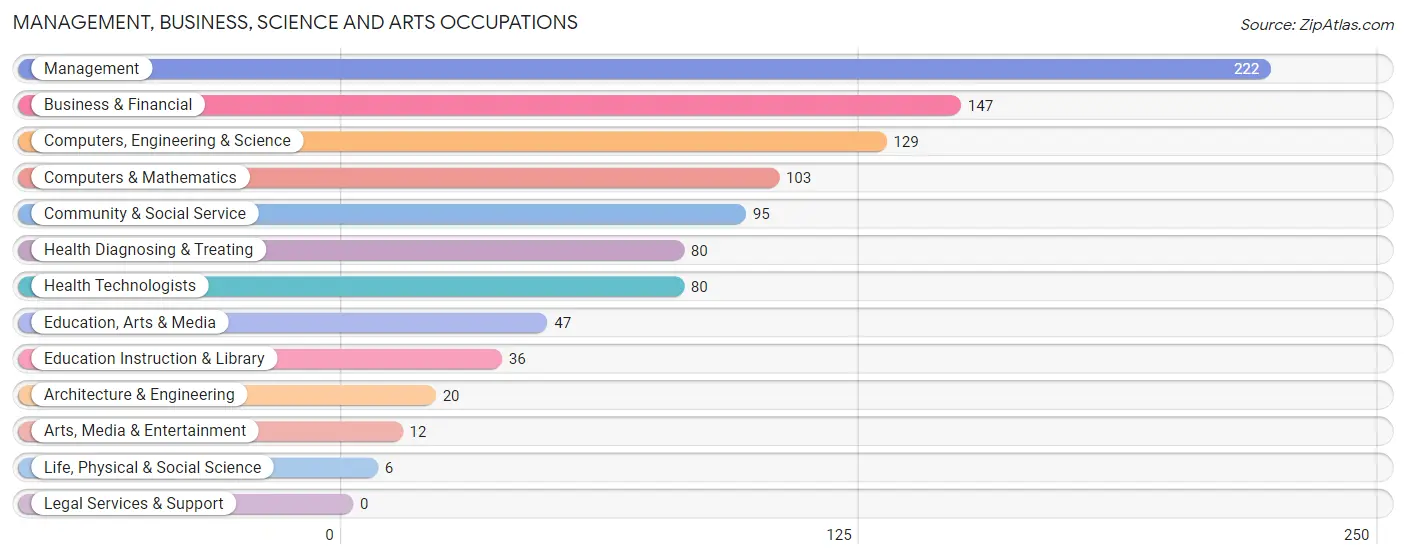
Management, Business, Science and Arts Occupations
The most common Management, Business, Science and Arts occupations in Lapel are Management (222 | 16.0%), Business & Financial (147 | 10.6%), Computers, Engineering & Science (129 | 9.3%), Computers & Mathematics (103 | 7.4%), and Community & Social Service (95 | 6.9%).
Management, Business, Science and Arts Occupations by Sex
Within the Management, Business, Science and Arts occupations in Lapel, the most male-oriented occupations are Architecture & Engineering (100.0%), Life, Physical & Social Science (100.0%), and Business & Financial (74.8%), while the most female-oriented occupations are Health Diagnosing & Treating (100.0%), Health Technologists (100.0%), and Education Instruction & Library (75.0%).
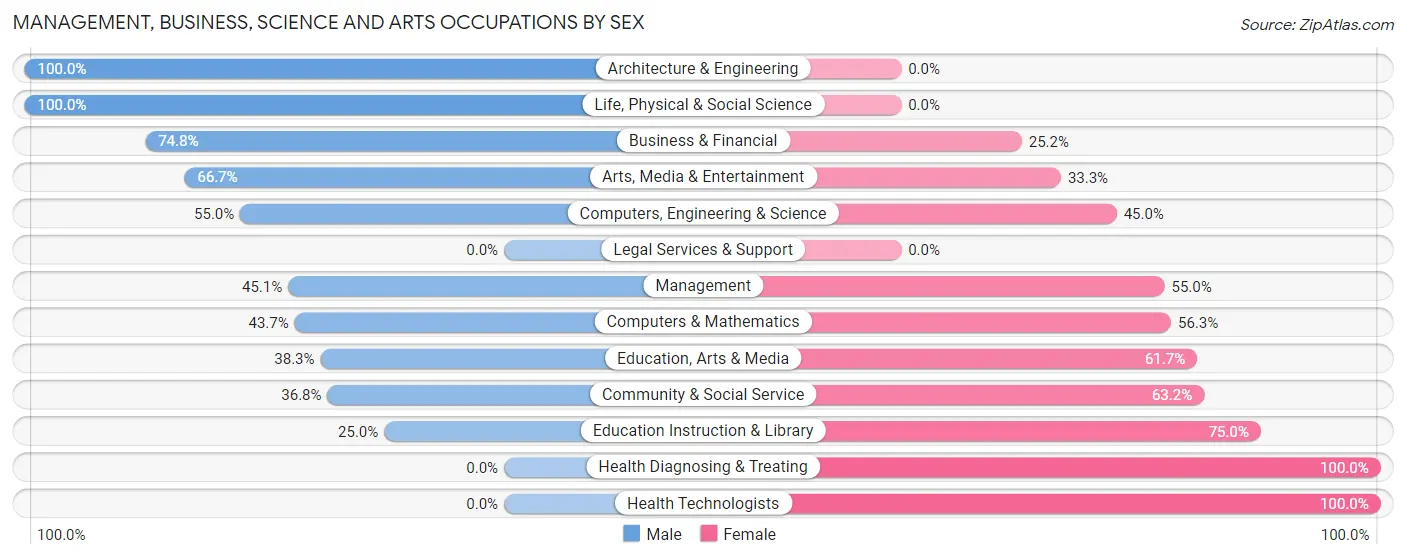
| Occupation | Male | Female |
| Management | 100 (45.1%) | 122 (54.9%) |
| Business & Financial | 110 (74.8%) | 37 (25.2%) |
| Computers, Engineering & Science | 71 (55.0%) | 58 (45.0%) |
| Computers & Mathematics | 45 (43.7%) | 58 (56.3%) |
| Architecture & Engineering | 20 (100.0%) | 0 (0.0%) |
| Life, Physical & Social Science | 6 (100.0%) | 0 (0.0%) |
| Community & Social Service | 35 (36.8%) | 60 (63.2%) |
| Education, Arts & Media | 18 (38.3%) | 29 (61.7%) |
| Legal Services & Support | 0 (0.0%) | 0 (0.0%) |
| Education Instruction & Library | 9 (25.0%) | 27 (75.0%) |
| Arts, Media & Entertainment | 8 (66.7%) | 4 (33.3%) |
| Health Diagnosing & Treating | 0 (0.0%) | 80 (100.0%) |
| Health Technologists | 0 (0.0%) | 80 (100.0%) |
| Total (Category) | 316 (46.9%) | 357 (53.0%) |
| Total (Overall) | 655 (47.3%) | 731 (52.7%) |
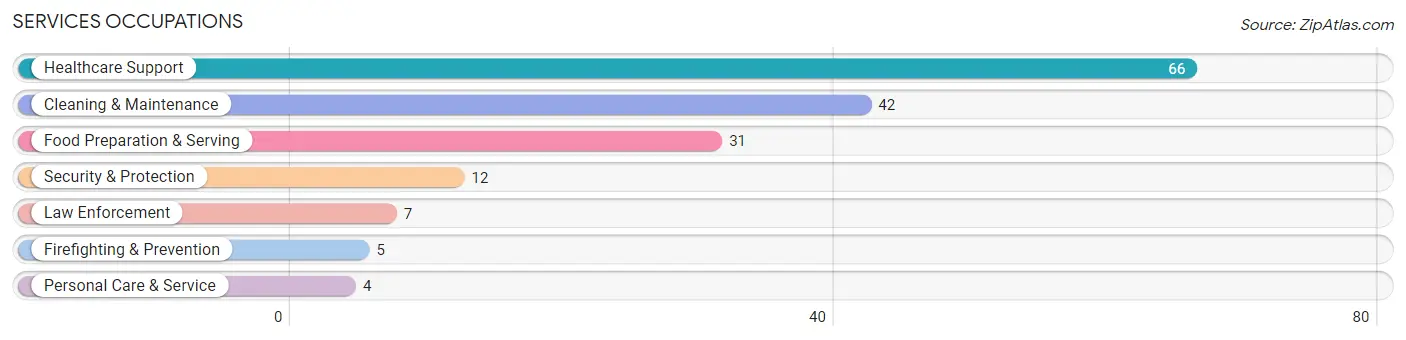
Services Occupations
The most common Services occupations in Lapel are Healthcare Support (66 | 4.8%), Cleaning & Maintenance (42 | 3.0%), Food Preparation & Serving (31 | 2.2%), Security & Protection (12 | 0.9%), and Law Enforcement (7 | 0.5%).
Services Occupations by Sex
Within the Services occupations in Lapel, the most male-oriented occupations are Law Enforcement (100.0%), Security & Protection (58.3%), and Cleaning & Maintenance (38.1%), while the most female-oriented occupations are Healthcare Support (100.0%), Firefighting & Prevention (100.0%), and Personal Care & Service (100.0%).
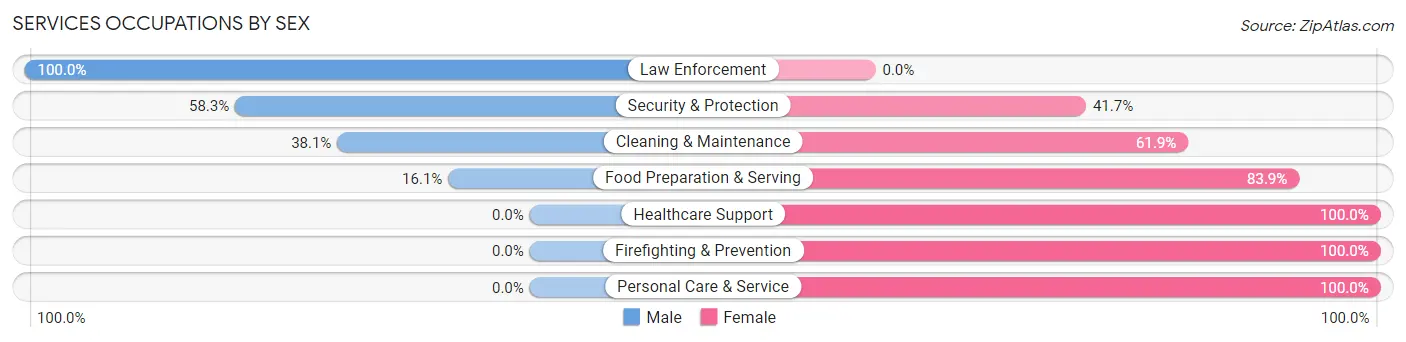
| Occupation | Male | Female |
| Healthcare Support | 0 (0.0%) | 66 (100.0%) |
| Security & Protection | 7 (58.3%) | 5 (41.7%) |
| Firefighting & Prevention | 0 (0.0%) | 5 (100.0%) |
| Law Enforcement | 7 (100.0%) | 0 (0.0%) |
| Food Preparation & Serving | 5 (16.1%) | 26 (83.9%) |
| Cleaning & Maintenance | 16 (38.1%) | 26 (61.9%) |
| Personal Care & Service | 0 (0.0%) | 4 (100.0%) |
| Total (Category) | 28 (18.1%) | 127 (81.9%) |
| Total (Overall) | 655 (47.3%) | 731 (52.7%) |
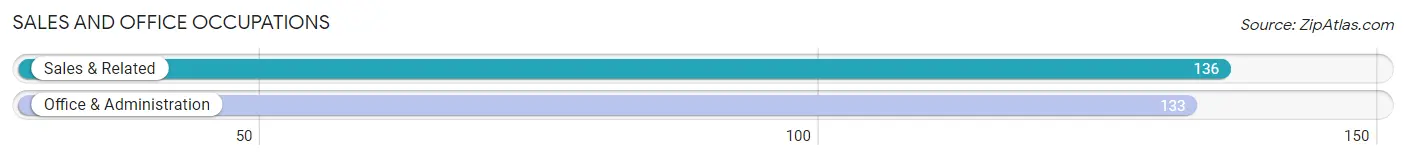
Sales and Office Occupations
The most common Sales and Office occupations in Lapel are Sales & Related (136 | 9.8%), and Office & Administration (133 | 9.6%).
Sales and Office Occupations by Sex
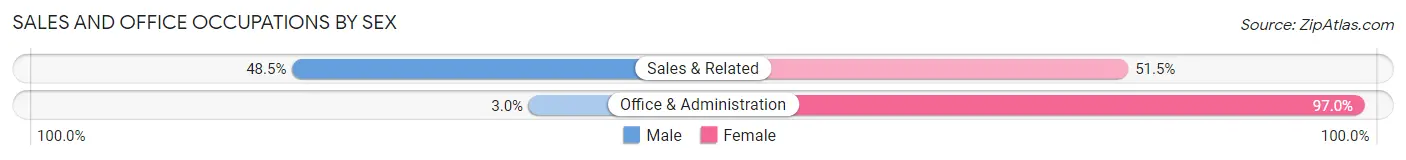
| Occupation | Male | Female |
| Sales & Related | 66 (48.5%) | 70 (51.5%) |
| Office & Administration | 4 (3.0%) | 129 (97.0%) |
| Total (Category) | 70 (26.0%) | 199 (74.0%) |
| Total (Overall) | 655 (47.3%) | 731 (52.7%) |
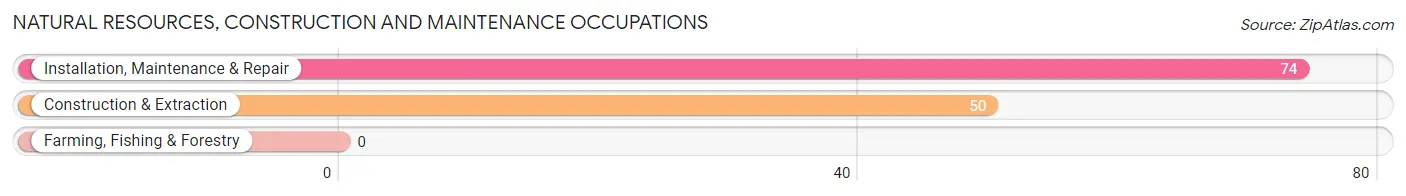
Natural Resources, Construction and Maintenance Occupations
The most common Natural Resources, Construction and Maintenance occupations in Lapel are Installation, Maintenance & Repair (74 | 5.3%), and Construction & Extraction (50 | 3.6%).
Natural Resources, Construction and Maintenance Occupations by Sex
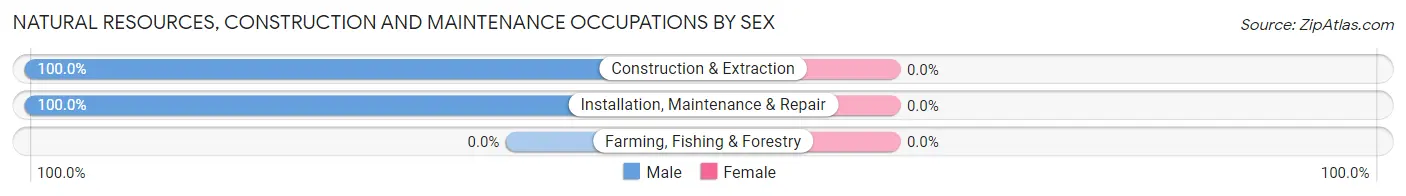
| Occupation | Male | Female |
| Farming, Fishing & Forestry | 0 (0.0%) | 0 (0.0%) |
| Construction & Extraction | 50 (100.0%) | 0 (0.0%) |
| Installation, Maintenance & Repair | 74 (100.0%) | 0 (0.0%) |
| Total (Category) | 124 (100.0%) | 0 (0.0%) |
| Total (Overall) | 655 (47.3%) | 731 (52.7%) |
Production, Transportation and Moving Occupations
The most common Production, Transportation and Moving occupations in Lapel are Production (84 | 6.1%), Transportation (47 | 3.4%), and Material Moving (34 | 2.5%).
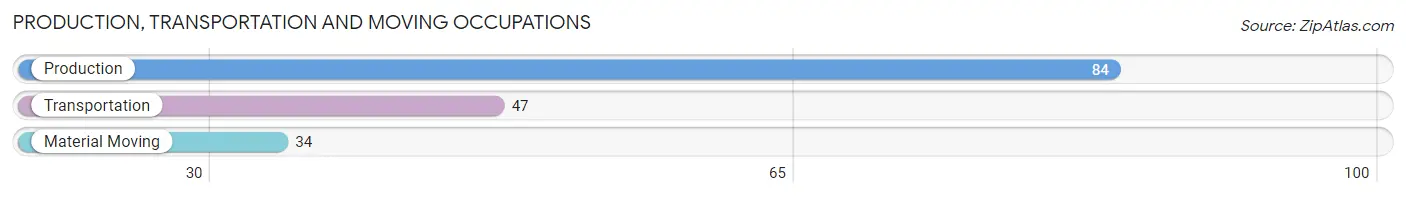
Production, Transportation and Moving Occupations by Sex
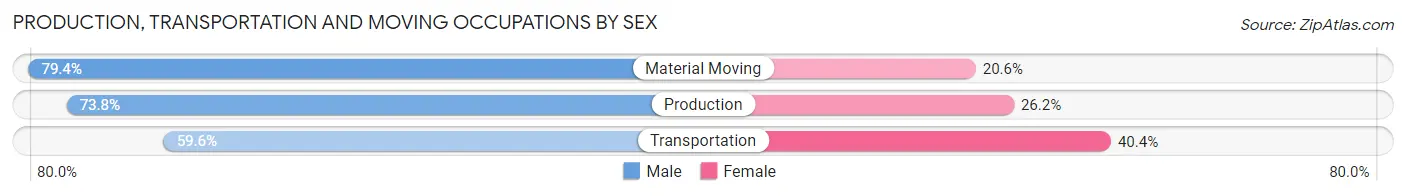
| Occupation | Male | Female |
| Production | 62 (73.8%) | 22 (26.2%) |
| Transportation | 28 (59.6%) | 19 (40.4%) |
| Material Moving | 27 (79.4%) | 7 (20.6%) |
| Total (Category) | 117 (70.9%) | 48 (29.1%) |
| Total (Overall) | 655 (47.3%) | 731 (52.7%) |
Employment Industries by Sex in Lapel
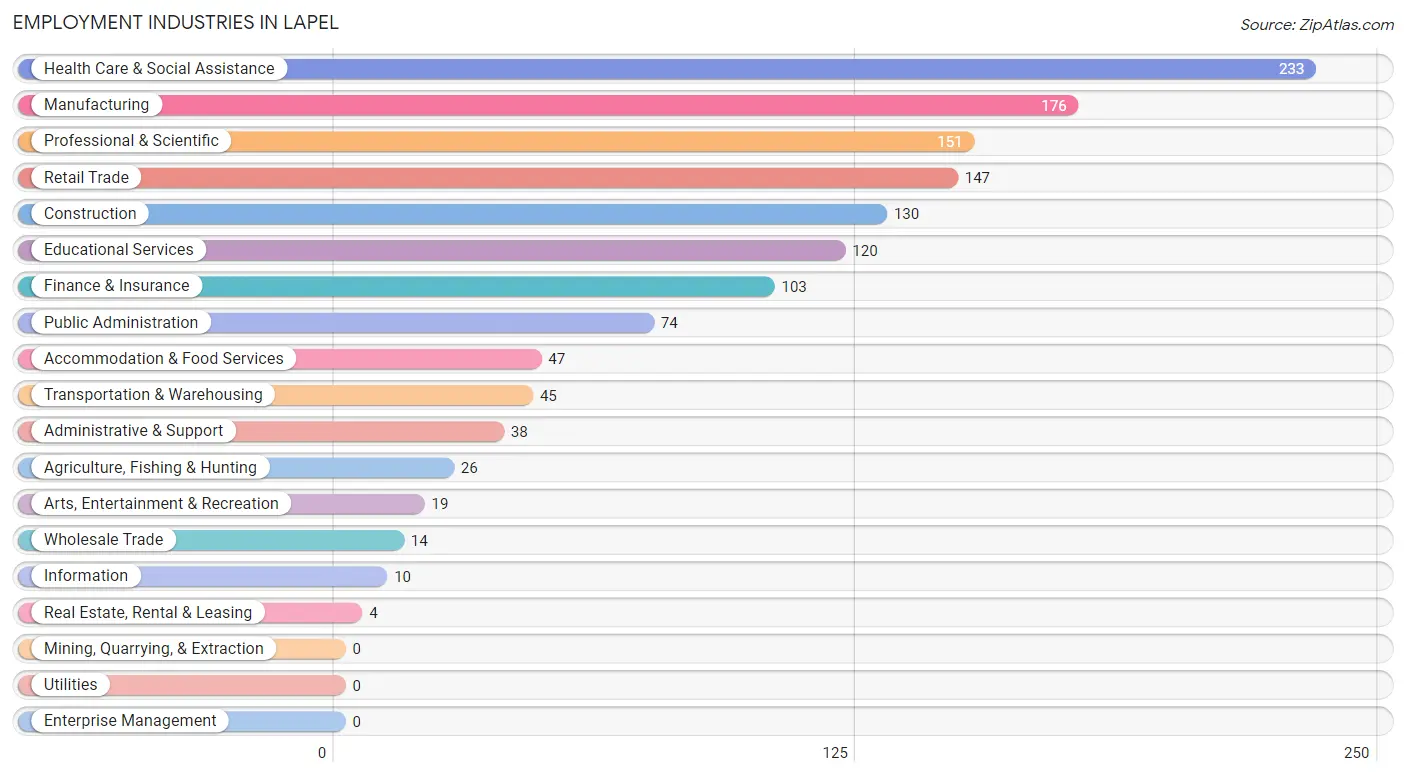
Employment Industries in Lapel
The major employment industries in Lapel include Health Care & Social Assistance (233 | 16.8%), Manufacturing (176 | 12.7%), Professional & Scientific (151 | 10.9%), Retail Trade (147 | 10.6%), and Construction (130 | 9.4%).
Employment Industries by Sex in Lapel
The Lapel industries that see more men than women are Agriculture, Fishing & Hunting (100.0%), Construction (100.0%), and Wholesale Trade (100.0%), whereas the industries that tend to have a higher number of women are Information (100.0%), Finance & Insurance (95.2%), and Health Care & Social Assistance (91.8%).
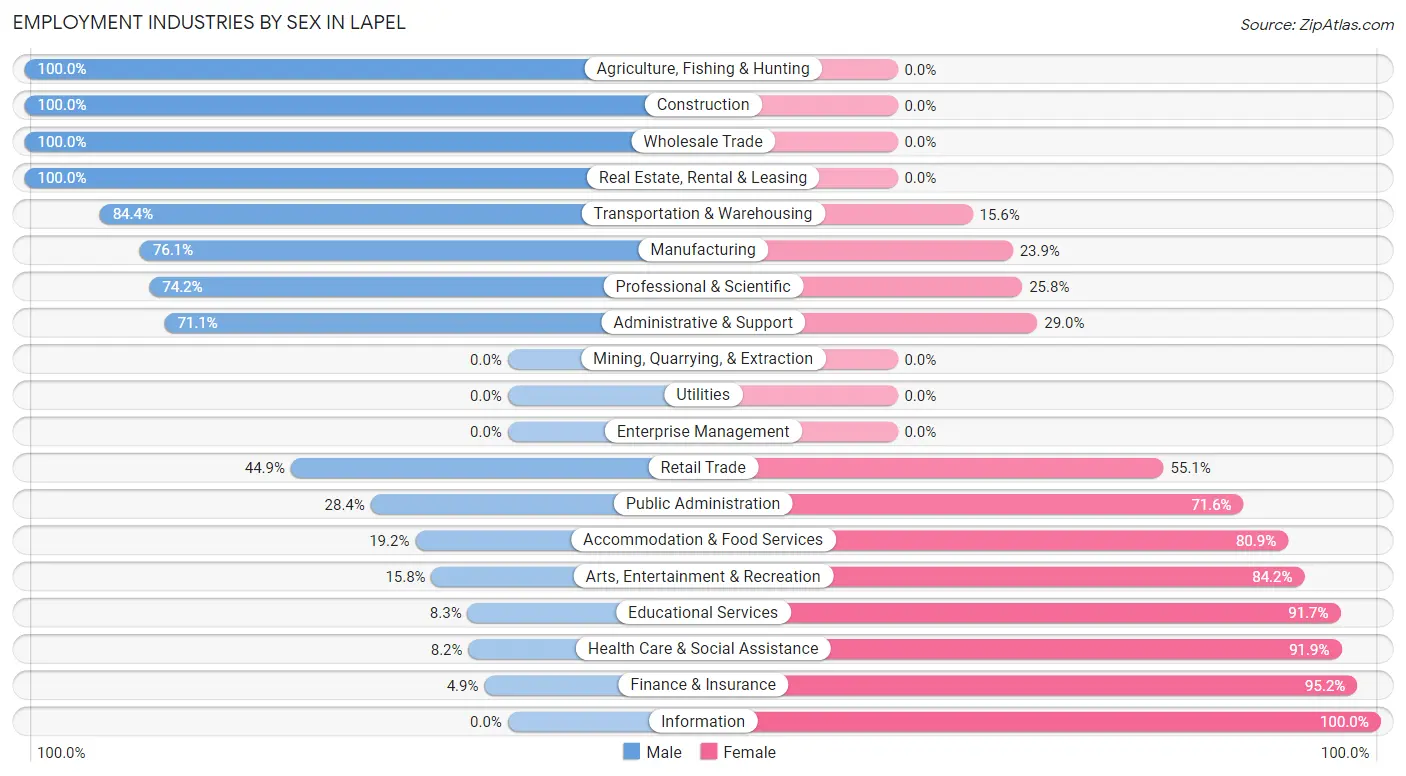
| Industry | Male | Female |
| Agriculture, Fishing & Hunting | 26 (100.0%) | 0 (0.0%) |
| Mining, Quarrying, & Extraction | 0 (0.0%) | 0 (0.0%) |
| Construction | 130 (100.0%) | 0 (0.0%) |
| Manufacturing | 134 (76.1%) | 42 (23.9%) |
| Wholesale Trade | 14 (100.0%) | 0 (0.0%) |
| Retail Trade | 66 (44.9%) | 81 (55.1%) |
| Transportation & Warehousing | 38 (84.4%) | 7 (15.6%) |
| Utilities | 0 (0.0%) | 0 (0.0%) |
| Information | 0 (0.0%) | 10 (100.0%) |
| Finance & Insurance | 5 (4.9%) | 98 (95.2%) |
| Real Estate, Rental & Leasing | 4 (100.0%) | 0 (0.0%) |
| Professional & Scientific | 112 (74.2%) | 39 (25.8%) |
| Enterprise Management | 0 (0.0%) | 0 (0.0%) |
| Administrative & Support | 27 (71.1%) | 11 (28.9%) |
| Educational Services | 10 (8.3%) | 110 (91.7%) |
| Health Care & Social Assistance | 19 (8.2%) | 214 (91.8%) |
| Arts, Entertainment & Recreation | 3 (15.8%) | 16 (84.2%) |
| Accommodation & Food Services | 9 (19.2%) | 38 (80.8%) |
| Public Administration | 21 (28.4%) | 53 (71.6%) |
| Total | 655 (47.3%) | 731 (52.7%) |
Education in Lapel
School Enrollment in Lapel
The most common levels of schooling among the 604 students in Lapel are middle school (130 | 21.5%), elementary school (123 | 20.4%), and high school (87 | 14.4%).
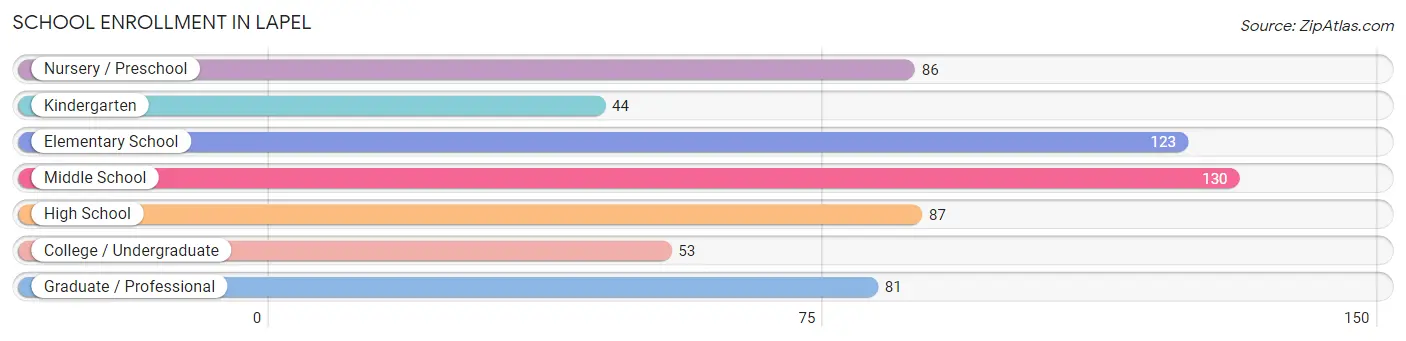
| School Level | # Students | % Students |
| Nursery / Preschool | 86 | 14.2% |
| Kindergarten | 44 | 7.3% |
| Elementary School | 123 | 20.4% |
| Middle School | 130 | 21.5% |
| High School | 87 | 14.4% |
| College / Undergraduate | 53 | 8.8% |
| Graduate / Professional | 81 | 13.4% |
| Total | 604 | 100.0% |
School Enrollment by Age by Funding Source in Lapel
Out of a total of 604 students who are enrolled in schools in Lapel, 142 (23.5%) attend a private institution, while the remaining 462 (76.5%) are enrolled in public schools. The age group of 20 to 24 year olds has the highest likelihood of being enrolled in private schools, with 53 (91.4% in the age bracket) enrolled. Conversely, the age group of 5 to 9 year old has the lowest likelihood of being enrolled in a private school, with 169 (100.0% in the age bracket) attending a public institution.
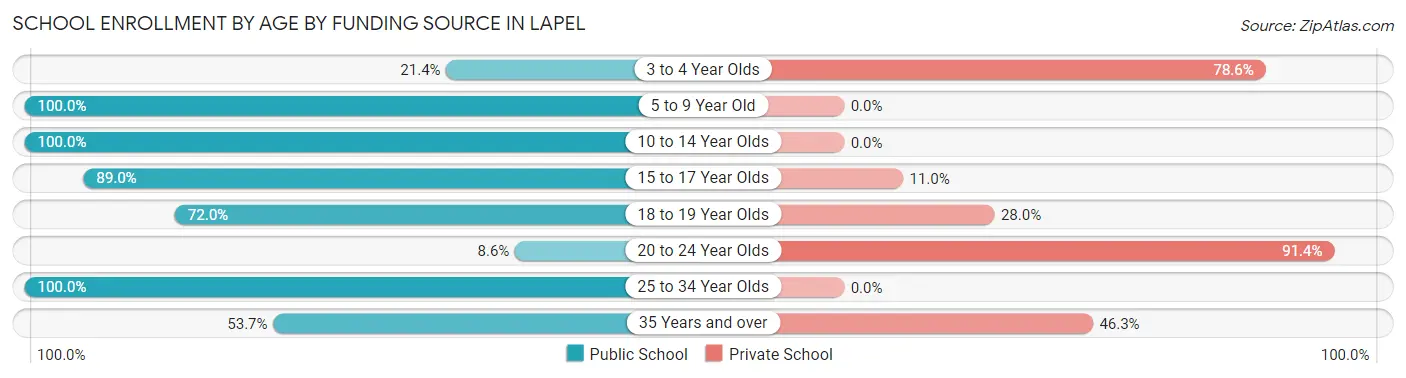
| Age Bracket | Public School | Private School |
| 3 to 4 Year Olds | 15 (21.4%) | 55 (78.6%) |
| 5 to 9 Year Old | 169 (100.0%) | 0 (0.0%) |
| 10 to 14 Year Olds | 158 (100.0%) | 0 (0.0%) |
| 15 to 17 Year Olds | 65 (89.0%) | 8 (11.0%) |
| 18 to 19 Year Olds | 18 (72.0%) | 7 (28.0%) |
| 20 to 24 Year Olds | 5 (8.6%) | 53 (91.4%) |
| 25 to 34 Year Olds | 10 (100.0%) | 0 (0.0%) |
| 35 Years and over | 22 (53.7%) | 19 (46.3%) |
| Total | 462 (76.5%) | 142 (23.5%) |
Educational Attainment by Field of Study in Lapel
Business (133 | 28.0%), science & technology (83 | 17.5%), education (72 | 15.2%), liberal arts & history (61 | 12.8%), and engineering (33 | 7.0%) are the most common fields of study among 475 individuals in Lapel who have obtained a bachelor's degree or higher.
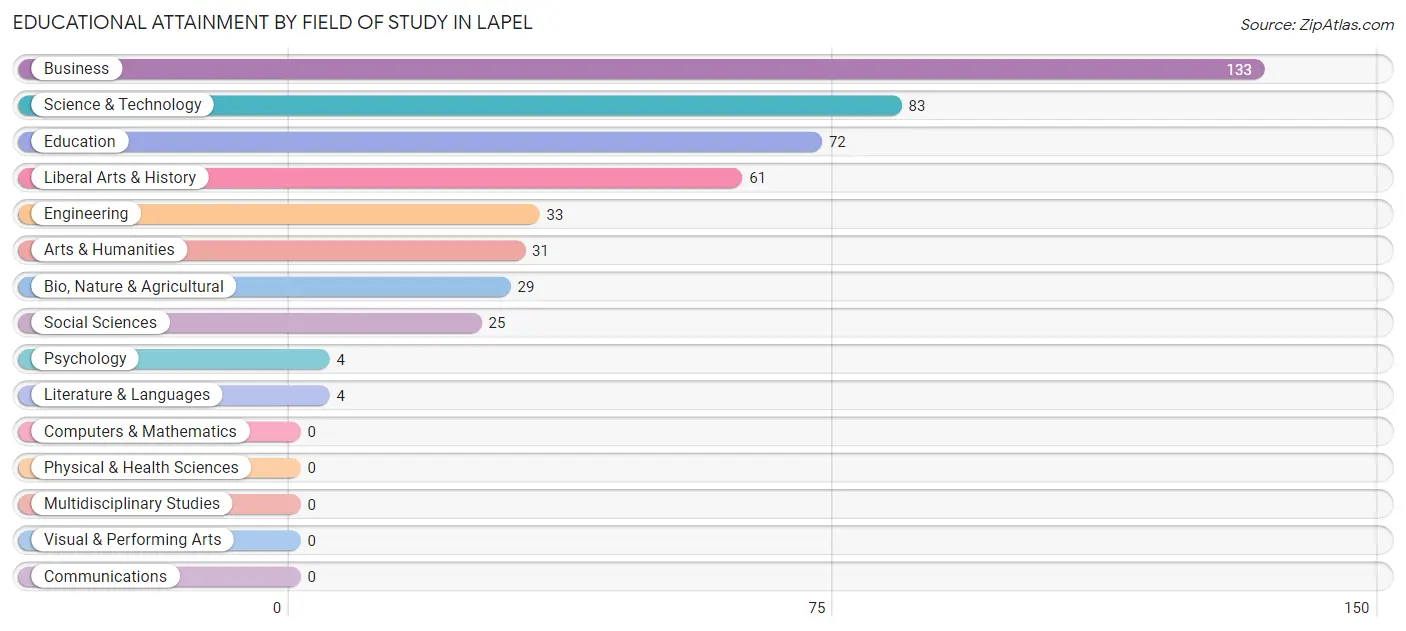
| Field of Study | # Graduates | % Graduates |
| Computers & Mathematics | 0 | 0.0% |
| Bio, Nature & Agricultural | 29 | 6.1% |
| Physical & Health Sciences | 0 | 0.0% |
| Psychology | 4 | 0.8% |
| Social Sciences | 25 | 5.3% |
| Engineering | 33 | 7.0% |
| Multidisciplinary Studies | 0 | 0.0% |
| Science & Technology | 83 | 17.5% |
| Business | 133 | 28.0% |
| Education | 72 | 15.2% |
| Literature & Languages | 4 | 0.8% |
| Liberal Arts & History | 61 | 12.8% |
| Visual & Performing Arts | 0 | 0.0% |
| Communications | 0 | 0.0% |
| Arts & Humanities | 31 | 6.5% |
| Total | 475 | 100.0% |
Transportation & Commute in Lapel
Vehicle Availability by Sex in Lapel
The most prevalent vehicle ownership categories in Lapel are males with 2 vehicles (322, accounting for 49.2%) and females with 2 vehicles (287, making up 45.5%).
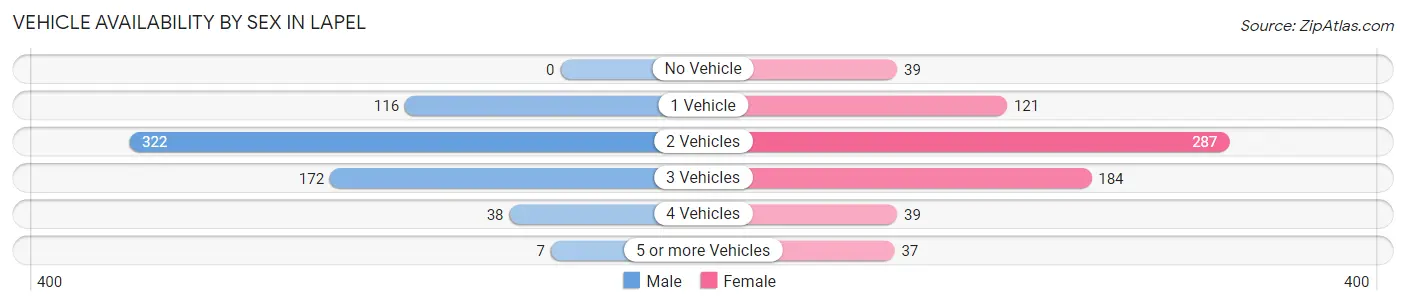
| Vehicles Available | Male | Female |
| No Vehicle | 0 (0.0%) | 39 (5.5%) |
| 1 Vehicle | 116 (17.7%) | 121 (17.1%) |
| 2 Vehicles | 322 (49.2%) | 287 (40.6%) |
| 3 Vehicles | 172 (26.3%) | 184 (26.0%) |
| 4 Vehicles | 38 (5.8%) | 39 (5.5%) |
| 5 or more Vehicles | 7 (1.1%) | 37 (5.2%) |
| Total | 655 (100.0%) | 707 (100.0%) |
Commute Time in Lapel
The most frequently occuring commute durations in Lapel are 20 to 24 minutes (241 commuters, 19.9%), 45 to 59 minutes (176 commuters, 14.5%), and 15 to 19 minutes (142 commuters, 11.7%).
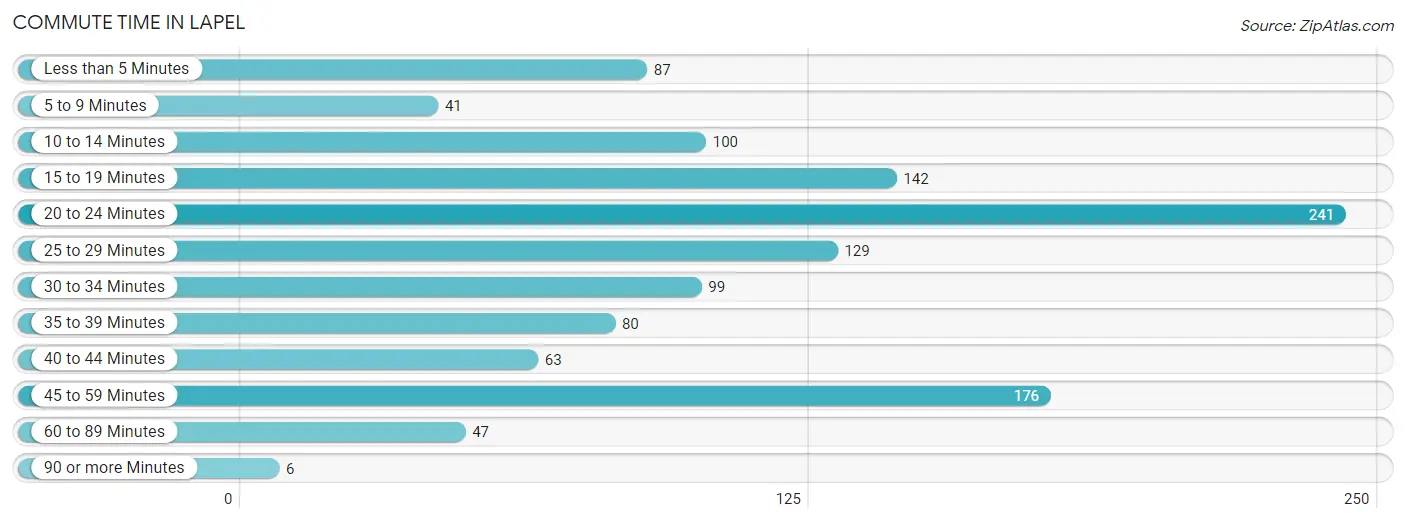
| Commute Time | # Commuters | % Commuters |
| Less than 5 Minutes | 87 | 7.2% |
| 5 to 9 Minutes | 41 | 3.4% |
| 10 to 14 Minutes | 100 | 8.3% |
| 15 to 19 Minutes | 142 | 11.7% |
| 20 to 24 Minutes | 241 | 19.9% |
| 25 to 29 Minutes | 129 | 10.6% |
| 30 to 34 Minutes | 99 | 8.2% |
| 35 to 39 Minutes | 80 | 6.6% |
| 40 to 44 Minutes | 63 | 5.2% |
| 45 to 59 Minutes | 176 | 14.5% |
| 60 to 89 Minutes | 47 | 3.9% |
| 90 or more Minutes | 6 | 0.5% |
Commute Time by Sex in Lapel
The most common commute times in Lapel are 20 to 24 minutes (130 commuters, 21.0%) for males and 20 to 24 minutes (111 commuters, 18.8%) for females.
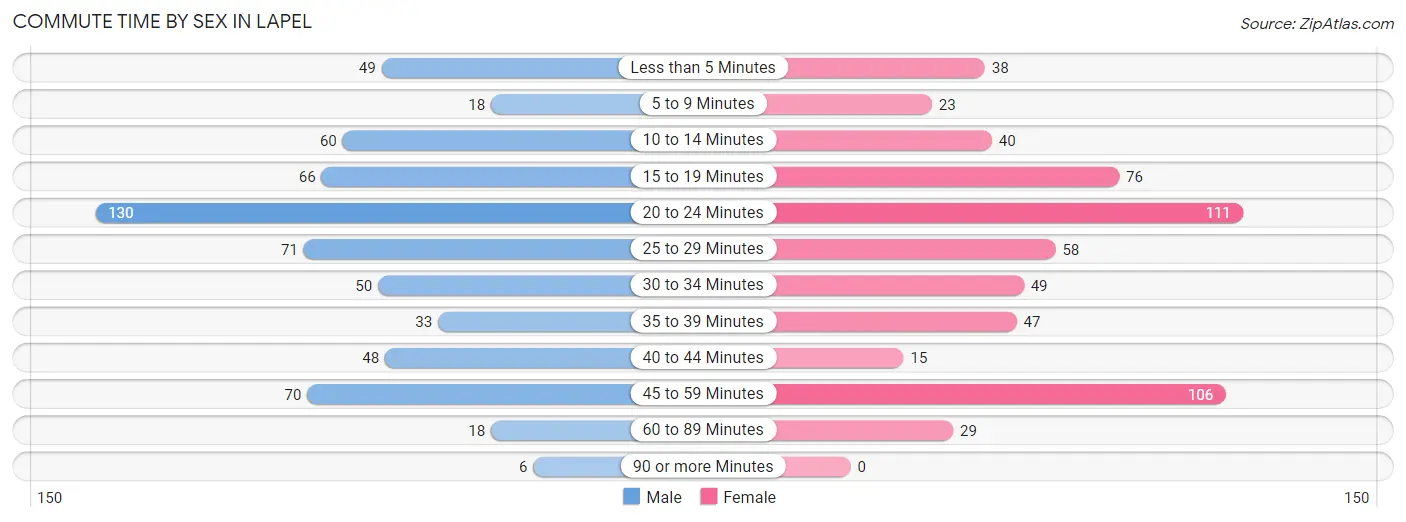
| Commute Time | Male | Female |
| Less than 5 Minutes | 49 (7.9%) | 38 (6.4%) |
| 5 to 9 Minutes | 18 (2.9%) | 23 (3.9%) |
| 10 to 14 Minutes | 60 (9.7%) | 40 (6.8%) |
| 15 to 19 Minutes | 66 (10.7%) | 76 (12.8%) |
| 20 to 24 Minutes | 130 (21.0%) | 111 (18.8%) |
| 25 to 29 Minutes | 71 (11.5%) | 58 (9.8%) |
| 30 to 34 Minutes | 50 (8.1%) | 49 (8.3%) |
| 35 to 39 Minutes | 33 (5.3%) | 47 (7.9%) |
| 40 to 44 Minutes | 48 (7.7%) | 15 (2.5%) |
| 45 to 59 Minutes | 70 (11.3%) | 106 (17.9%) |
| 60 to 89 Minutes | 18 (2.9%) | 29 (4.9%) |
| 90 or more Minutes | 6 (1.0%) | 0 (0.0%) |
Time of Departure to Work by Sex in Lapel
The most frequent times of departure to work in Lapel are 6:30 AM to 6:59 AM (89, 14.4%) for males and 7:00 AM to 7:29 AM (118, 19.9%) for females.
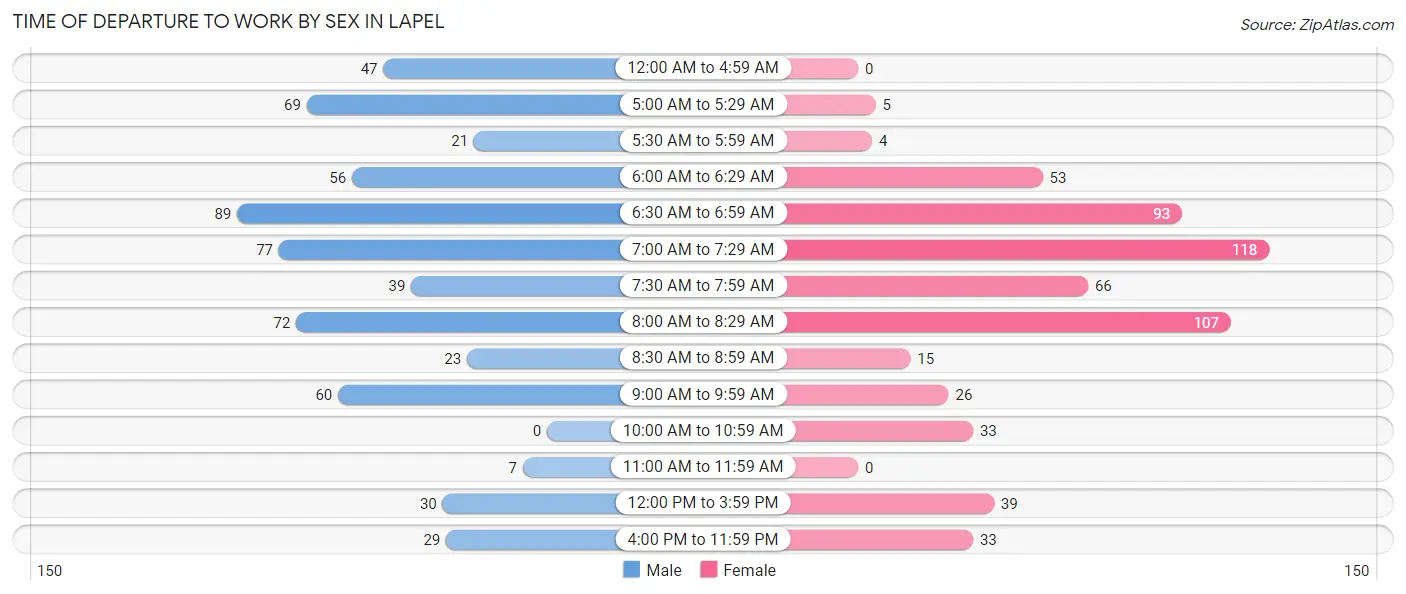
| Time of Departure | Male | Female |
| 12:00 AM to 4:59 AM | 47 (7.6%) | 0 (0.0%) |
| 5:00 AM to 5:29 AM | 69 (11.2%) | 5 (0.8%) |
| 5:30 AM to 5:59 AM | 21 (3.4%) | 4 (0.7%) |
| 6:00 AM to 6:29 AM | 56 (9.0%) | 53 (8.9%) |
| 6:30 AM to 6:59 AM | 89 (14.4%) | 93 (15.7%) |
| 7:00 AM to 7:29 AM | 77 (12.4%) | 118 (19.9%) |
| 7:30 AM to 7:59 AM | 39 (6.3%) | 66 (11.2%) |
| 8:00 AM to 8:29 AM | 72 (11.6%) | 107 (18.1%) |
| 8:30 AM to 8:59 AM | 23 (3.7%) | 15 (2.5%) |
| 9:00 AM to 9:59 AM | 60 (9.7%) | 26 (4.4%) |
| 10:00 AM to 10:59 AM | 0 (0.0%) | 33 (5.6%) |
| 11:00 AM to 11:59 AM | 7 (1.1%) | 0 (0.0%) |
| 12:00 PM to 3:59 PM | 30 (4.9%) | 39 (6.6%) |
| 4:00 PM to 11:59 PM | 29 (4.7%) | 33 (5.6%) |
| Total | 619 (100.0%) | 592 (100.0%) |
Housing Occupancy in Lapel
Occupancy by Ownership in Lapel
Of the total 1,051 dwellings in Lapel, owner-occupied units account for 767 (73.0%), while renter-occupied units make up 284 (27.0%).
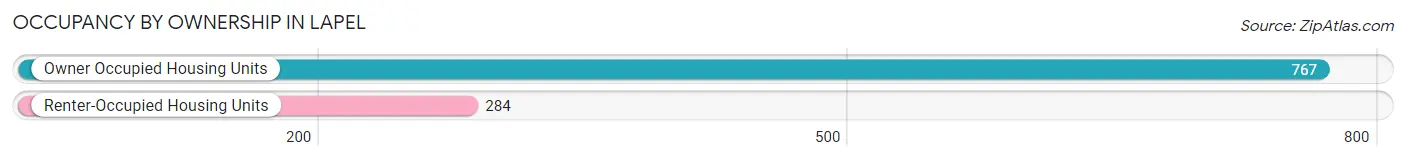
| Occupancy | # Housing Units | % Housing Units |
| Owner Occupied Housing Units | 767 | 73.0% |
| Renter-Occupied Housing Units | 284 | 27.0% |
| Total Occupied Housing Units | 1,051 | 100.0% |
Occupancy by Household Size in Lapel
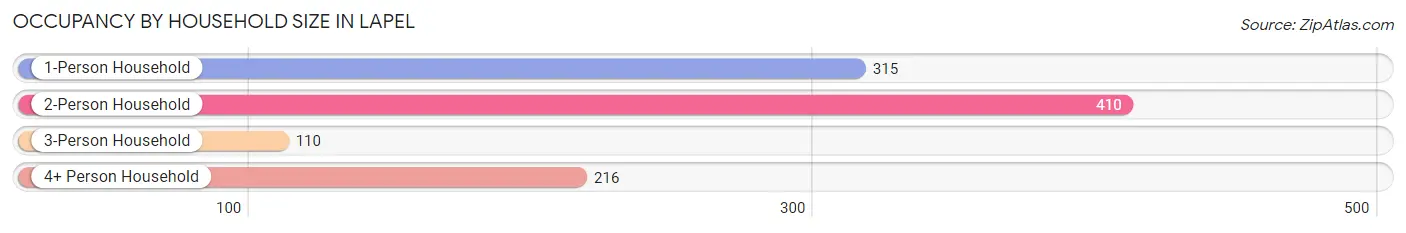
| Household Size | # Housing Units | % Housing Units |
| 1-Person Household | 315 | 30.0% |
| 2-Person Household | 410 | 39.0% |
| 3-Person Household | 110 | 10.5% |
| 4+ Person Household | 216 | 20.5% |
| Total Housing Units | 1,051 | 100.0% |
Occupancy by Ownership by Household Size in Lapel
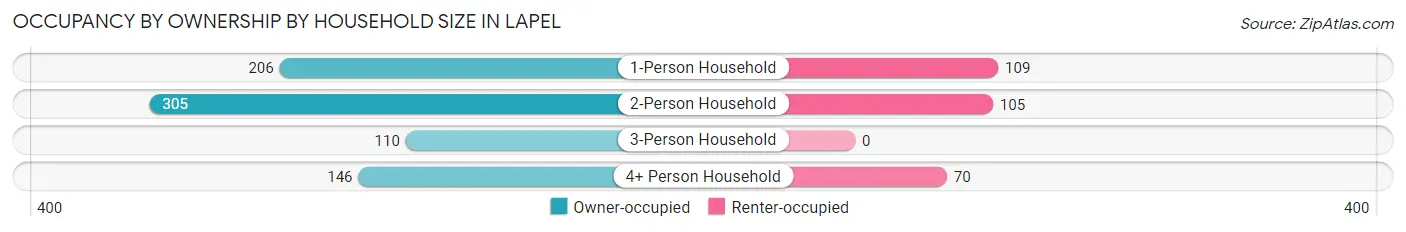
| Household Size | Owner-occupied | Renter-occupied |
| 1-Person Household | 206 (65.4%) | 109 (34.6%) |
| 2-Person Household | 305 (74.4%) | 105 (25.6%) |
| 3-Person Household | 110 (100.0%) | 0 (0.0%) |
| 4+ Person Household | 146 (67.6%) | 70 (32.4%) |
| Total Housing Units | 767 (73.0%) | 284 (27.0%) |
Occupancy by Educational Attainment in Lapel
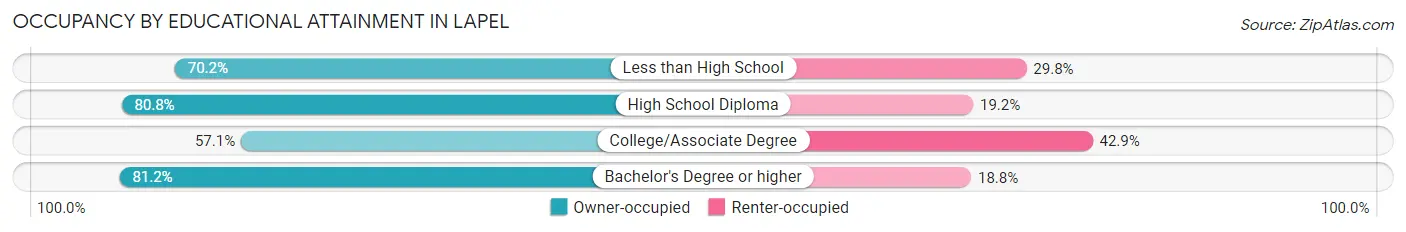
| Household Size | Owner-occupied | Renter-occupied |
| Less than High School | 33 (70.2%) | 14 (29.8%) |
| High School Diploma | 286 (80.8%) | 68 (19.2%) |
| College/Associate Degree | 189 (57.1%) | 142 (42.9%) |
| Bachelor's Degree or higher | 259 (81.2%) | 60 (18.8%) |
Occupancy by Age of Householder in Lapel
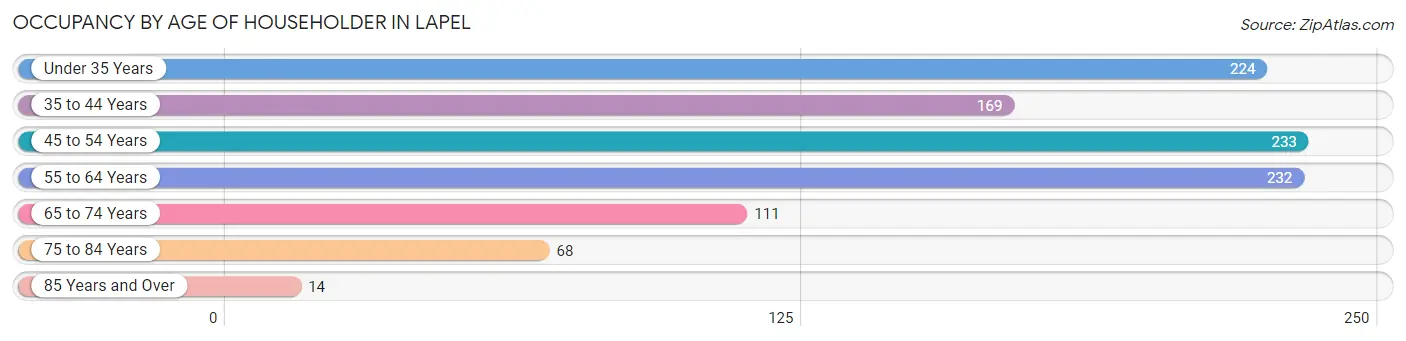
| Age Bracket | # Households | % Households |
| Under 35 Years | 224 | 21.3% |
| 35 to 44 Years | 169 | 16.1% |
| 45 to 54 Years | 233 | 22.2% |
| 55 to 64 Years | 232 | 22.1% |
| 65 to 74 Years | 111 | 10.6% |
| 75 to 84 Years | 68 | 6.5% |
| 85 Years and Over | 14 | 1.3% |
| Total | 1,051 | 100.0% |
Housing Finances in Lapel
Median Income by Occupancy in Lapel
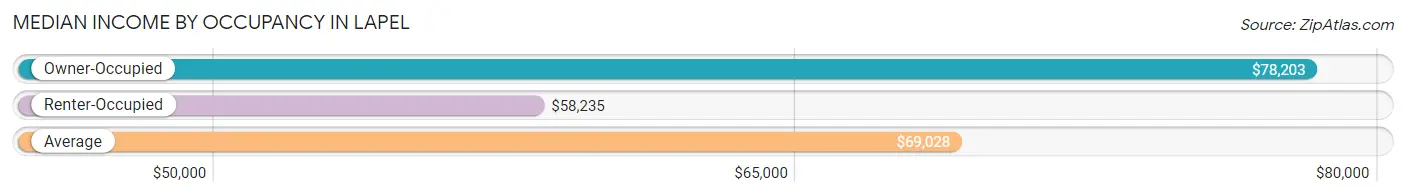
| Occupancy Type | # Households | Median Income |
| Owner-Occupied | 767 (73.0%) | $78,203 |
| Renter-Occupied | 284 (27.0%) | $58,235 |
| Average | 1,051 (100.0%) | $69,028 |
Occupancy by Householder Income Bracket in Lapel
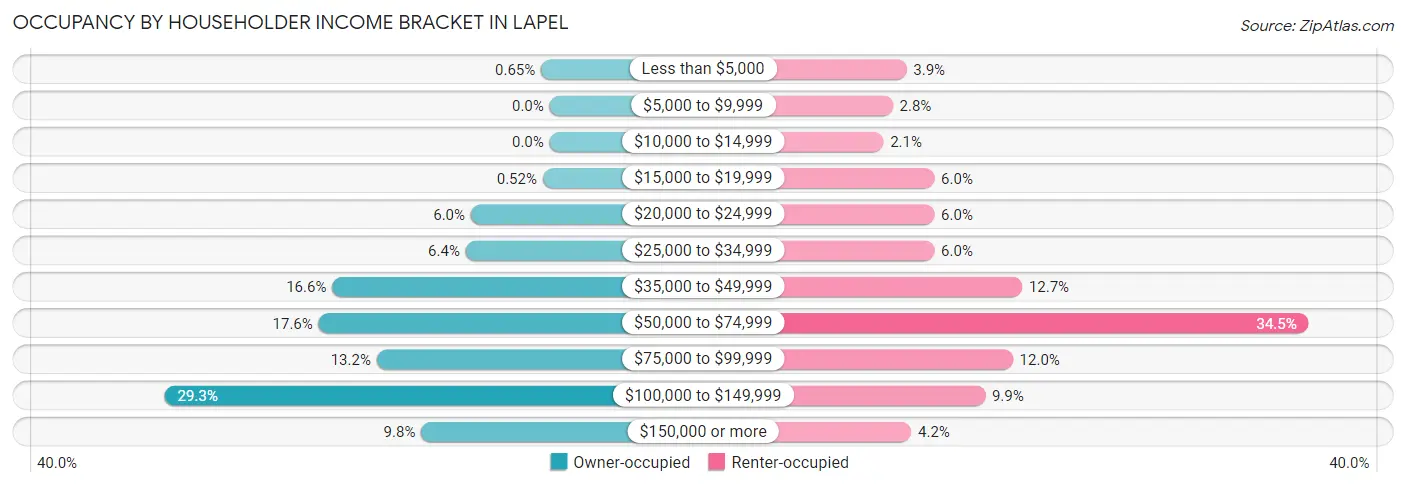
| Income Bracket | Owner-occupied | Renter-occupied |
| Less than $5,000 | 5 (0.6%) | 11 (3.9%) |
| $5,000 to $9,999 | 0 (0.0%) | 8 (2.8%) |
| $10,000 to $14,999 | 0 (0.0%) | 6 (2.1%) |
| $15,000 to $19,999 | 4 (0.5%) | 17 (6.0%) |
| $20,000 to $24,999 | 46 (6.0%) | 17 (6.0%) |
| $25,000 to $34,999 | 49 (6.4%) | 17 (6.0%) |
| $35,000 to $49,999 | 127 (16.6%) | 36 (12.7%) |
| $50,000 to $74,999 | 135 (17.6%) | 98 (34.5%) |
| $75,000 to $99,999 | 101 (13.2%) | 34 (12.0%) |
| $100,000 to $149,999 | 225 (29.3%) | 28 (9.9%) |
| $150,000 or more | 75 (9.8%) | 12 (4.2%) |
| Total | 767 (100.0%) | 284 (100.0%) |
Monthly Housing Cost Tiers in Lapel
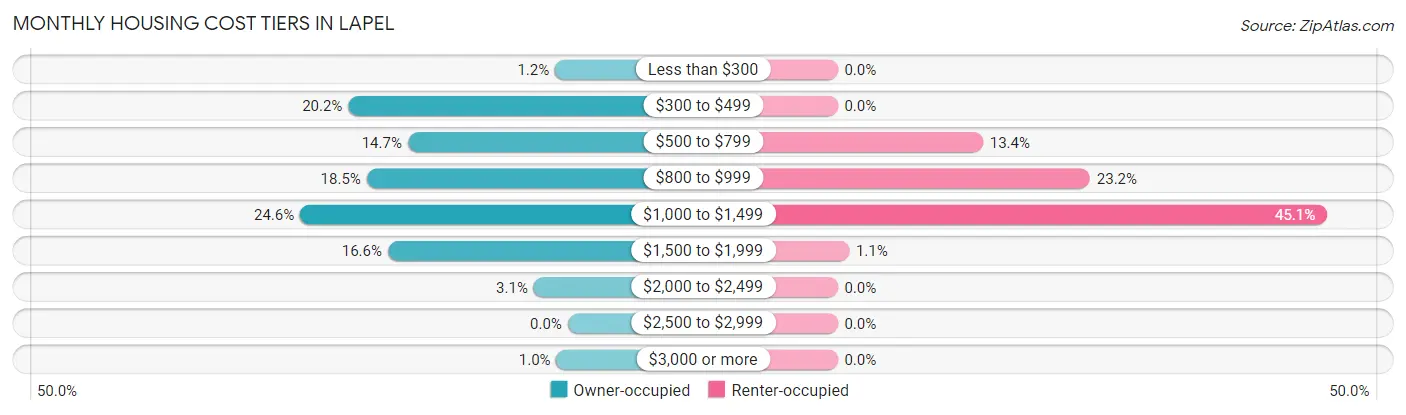
| Monthly Cost | Owner-occupied | Renter-occupied |
| Less than $300 | 9 (1.2%) | 0 (0.0%) |
| $300 to $499 | 155 (20.2%) | 0 (0.0%) |
| $500 to $799 | 113 (14.7%) | 38 (13.4%) |
| $800 to $999 | 142 (18.5%) | 66 (23.2%) |
| $1,000 to $1,499 | 189 (24.6%) | 128 (45.1%) |
| $1,500 to $1,999 | 127 (16.6%) | 3 (1.1%) |
| $2,000 to $2,499 | 24 (3.1%) | 0 (0.0%) |
| $2,500 to $2,999 | 0 (0.0%) | 0 (0.0%) |
| $3,000 or more | 8 (1.0%) | 0 (0.0%) |
| Total | 767 (100.0%) | 284 (100.0%) |
Physical Housing Characteristics in Lapel
Housing Structures in Lapel
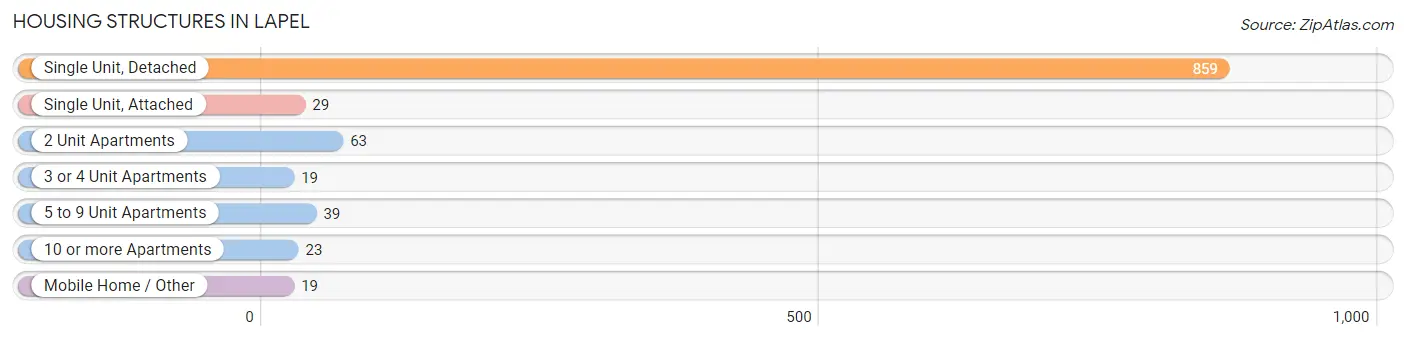
| Structure Type | # Housing Units | % Housing Units |
| Single Unit, Detached | 859 | 81.7% |
| Single Unit, Attached | 29 | 2.8% |
| 2 Unit Apartments | 63 | 6.0% |
| 3 or 4 Unit Apartments | 19 | 1.8% |
| 5 to 9 Unit Apartments | 39 | 3.7% |
| 10 or more Apartments | 23 | 2.2% |
| Mobile Home / Other | 19 | 1.8% |
| Total | 1,051 | 100.0% |
Housing Structures by Occupancy in Lapel
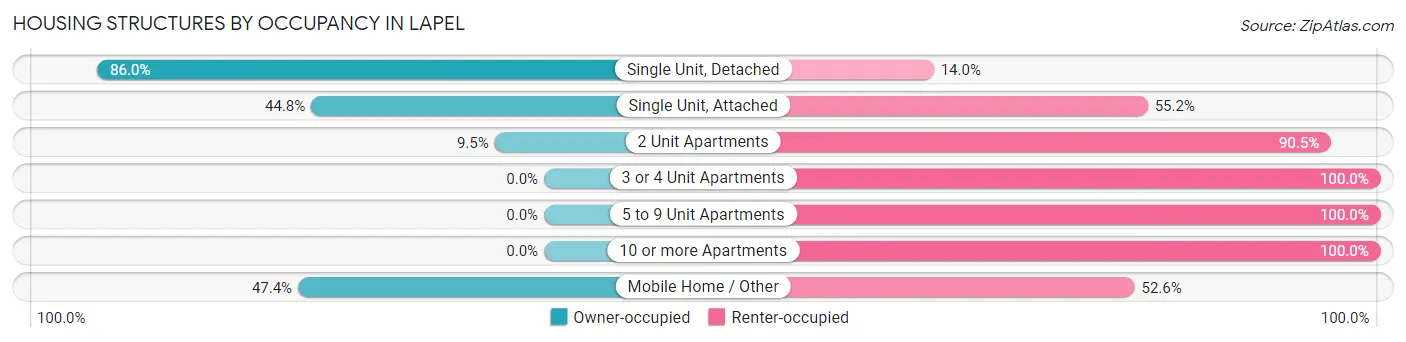
| Structure Type | Owner-occupied | Renter-occupied |
| Single Unit, Detached | 739 (86.0%) | 120 (14.0%) |
| Single Unit, Attached | 13 (44.8%) | 16 (55.2%) |
| 2 Unit Apartments | 6 (9.5%) | 57 (90.5%) |
| 3 or 4 Unit Apartments | 0 (0.0%) | 19 (100.0%) |
| 5 to 9 Unit Apartments | 0 (0.0%) | 39 (100.0%) |
| 10 or more Apartments | 0 (0.0%) | 23 (100.0%) |
| Mobile Home / Other | 9 (47.4%) | 10 (52.6%) |
| Total | 767 (73.0%) | 284 (27.0%) |
Housing Structures by Number of Rooms in Lapel
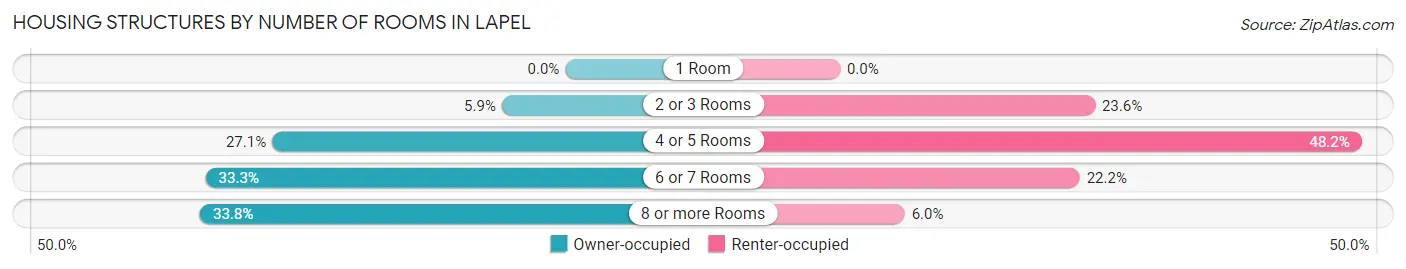
| Number of Rooms | Owner-occupied | Renter-occupied |
| 1 Room | 0 (0.0%) | 0 (0.0%) |
| 2 or 3 Rooms | 45 (5.9%) | 67 (23.6%) |
| 4 or 5 Rooms | 208 (27.1%) | 137 (48.2%) |
| 6 or 7 Rooms | 255 (33.3%) | 63 (22.2%) |
| 8 or more Rooms | 259 (33.8%) | 17 (6.0%) |
| Total | 767 (100.0%) | 284 (100.0%) |
Housing Structure by Heating Type in Lapel
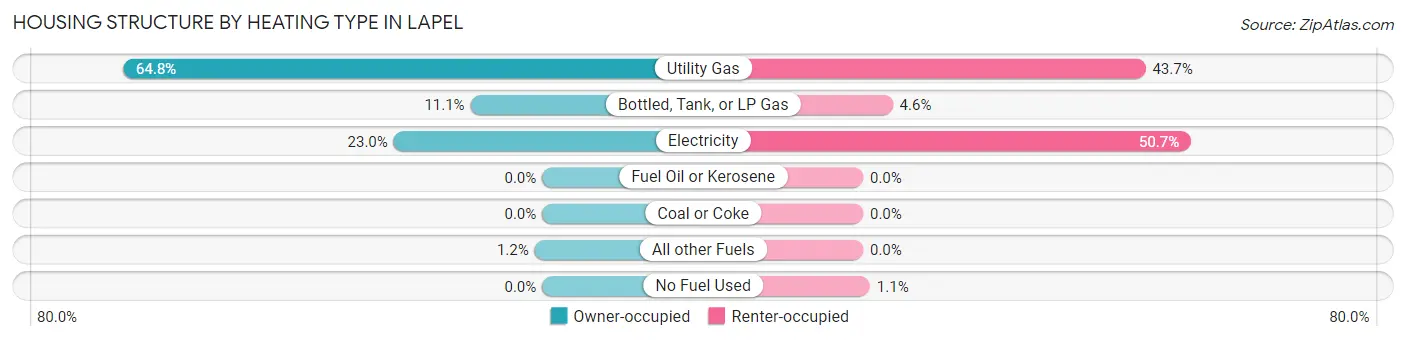
| Heating Type | Owner-occupied | Renter-occupied |
| Utility Gas | 497 (64.8%) | 124 (43.7%) |
| Bottled, Tank, or LP Gas | 85 (11.1%) | 13 (4.6%) |
| Electricity | 176 (23.0%) | 144 (50.7%) |
| Fuel Oil or Kerosene | 0 (0.0%) | 0 (0.0%) |
| Coal or Coke | 0 (0.0%) | 0 (0.0%) |
| All other Fuels | 9 (1.2%) | 0 (0.0%) |
| No Fuel Used | 0 (0.0%) | 3 (1.1%) |
| Total | 767 (100.0%) | 284 (100.0%) |
Household Vehicle Usage in Lapel
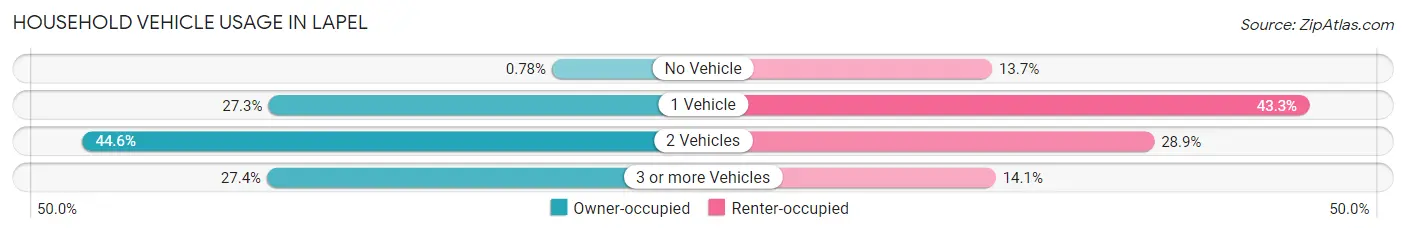
| Vehicles per Household | Owner-occupied | Renter-occupied |
| No Vehicle | 6 (0.8%) | 39 (13.7%) |
| 1 Vehicle | 209 (27.3%) | 123 (43.3%) |
| 2 Vehicles | 342 (44.6%) | 82 (28.9%) |
| 3 or more Vehicles | 210 (27.4%) | 40 (14.1%) |
| Total | 767 (100.0%) | 284 (100.0%) |
Real Estate & Mortgages in Lapel
Real Estate and Mortgage Overview in Lapel
| Characteristic | Without Mortgage | With Mortgage |
| Housing Units | 240 | 527 |
| Median Property Value | $145,500 | $174,700 |
| Median Household Income | $74,792 | $53 |
| Monthly Housing Costs | $439 | $8 |
| Real Estate Taxes | $1,508 | $6 |
Property Value by Mortgage Status in Lapel
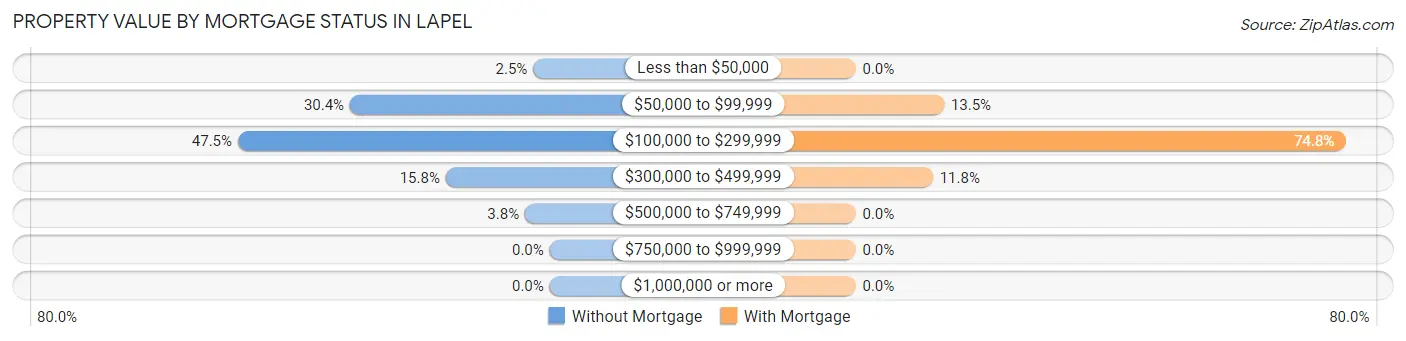
| Property Value | Without Mortgage | With Mortgage |
| Less than $50,000 | 6 (2.5%) | 0 (0.0%) |
| $50,000 to $99,999 | 73 (30.4%) | 71 (13.5%) |
| $100,000 to $299,999 | 114 (47.5%) | 394 (74.8%) |
| $300,000 to $499,999 | 38 (15.8%) | 62 (11.8%) |
| $500,000 to $749,999 | 9 (3.7%) | 0 (0.0%) |
| $750,000 to $999,999 | 0 (0.0%) | 0 (0.0%) |
| $1,000,000 or more | 0 (0.0%) | 0 (0.0%) |
| Total | 240 (100.0%) | 527 (100.0%) |
Household Income by Mortgage Status in Lapel
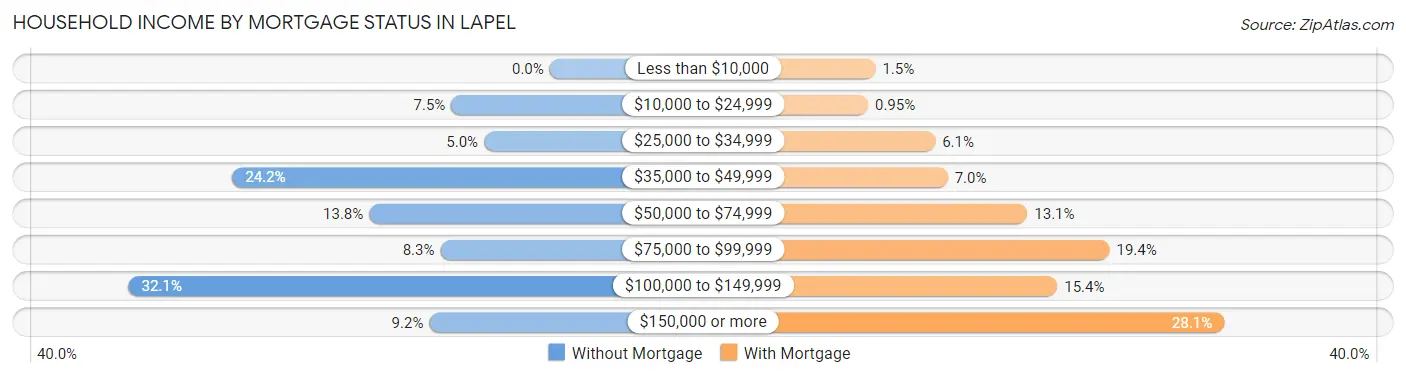
| Household Income | Without Mortgage | With Mortgage |
| Less than $10,000 | 0 (0.0%) | 8 (1.5%) |
| $10,000 to $24,999 | 18 (7.5%) | 5 (0.9%) |
| $25,000 to $34,999 | 12 (5.0%) | 32 (6.1%) |
| $35,000 to $49,999 | 58 (24.2%) | 37 (7.0%) |
| $50,000 to $74,999 | 33 (13.8%) | 69 (13.1%) |
| $75,000 to $99,999 | 20 (8.3%) | 102 (19.4%) |
| $100,000 to $149,999 | 77 (32.1%) | 81 (15.4%) |
| $150,000 or more | 22 (9.2%) | 148 (28.1%) |
| Total | 240 (100.0%) | 527 (100.0%) |
Property Value to Household Income Ratio in Lapel
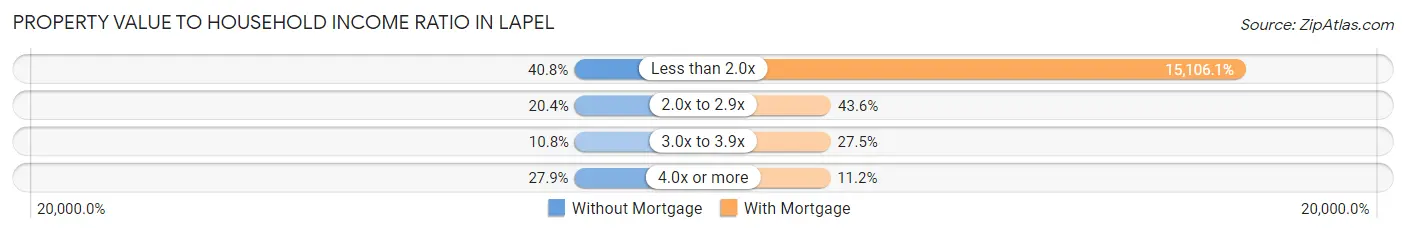
| Value-to-Income Ratio | Without Mortgage | With Mortgage |
| Less than 2.0x | 98 (40.8%) | 79,609 (15,106.1%) |
| 2.0x to 2.9x | 49 (20.4%) | 230 (43.6%) |
| 3.0x to 3.9x | 26 (10.8%) | 145 (27.5%) |
| 4.0x or more | 67 (27.9%) | 59 (11.2%) |
| Total | 240 (100.0%) | 527 (100.0%) |
Real Estate Taxes by Mortgage Status in Lapel
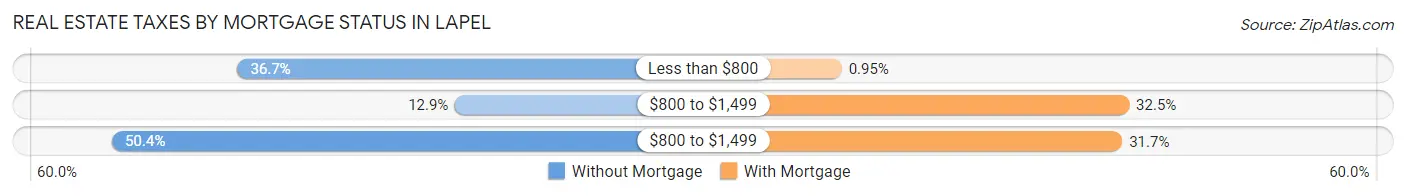
| Property Taxes | Without Mortgage | With Mortgage |
| Less than $800 | 88 (36.7%) | 5 (0.9%) |
| $800 to $1,499 | 31 (12.9%) | 171 (32.5%) |
| $800 to $1,499 | 121 (50.4%) | 167 (31.7%) |
| Total | 240 (100.0%) | 527 (100.0%) |
Health & Disability in Lapel
Health Insurance Coverage by Age in Lapel
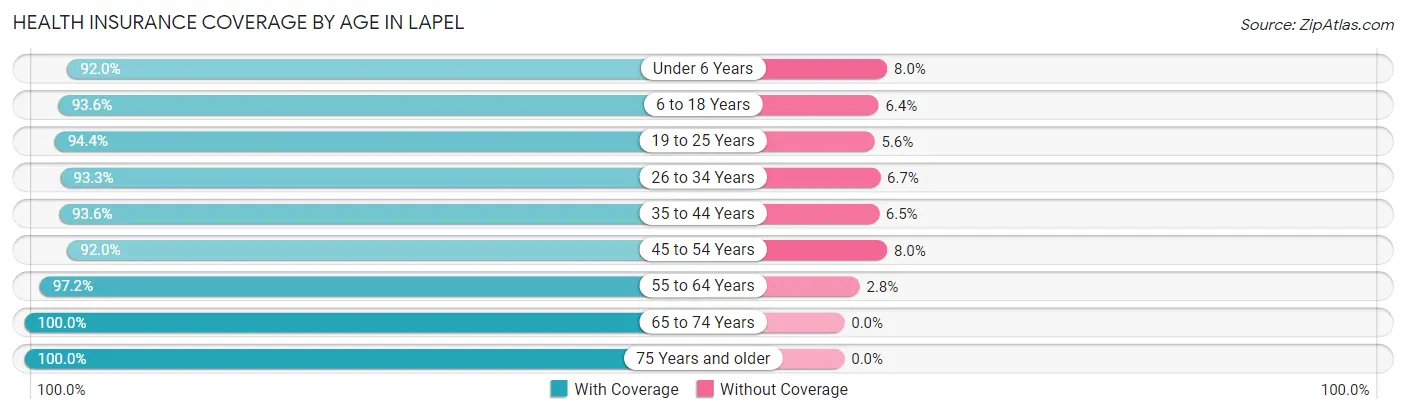
| Age Bracket | With Coverage | Without Coverage |
| Under 6 Years | 242 (92.0%) | 21 (8.0%) |
| 6 to 18 Years | 353 (93.6%) | 24 (6.4%) |
| 19 to 25 Years | 151 (94.4%) | 9 (5.6%) |
| 26 to 34 Years | 336 (93.3%) | 24 (6.7%) |
| 35 to 44 Years | 261 (93.5%) | 18 (6.5%) |
| 45 to 54 Years | 358 (92.0%) | 31 (8.0%) |
| 55 to 64 Years | 376 (97.2%) | 11 (2.8%) |
| 65 to 74 Years | 181 (100.0%) | 0 (0.0%) |
| 75 Years and older | 121 (100.0%) | 0 (0.0%) |
| Total | 2,379 (94.5%) | 138 (5.5%) |
Health Insurance Coverage by Citizenship Status in Lapel
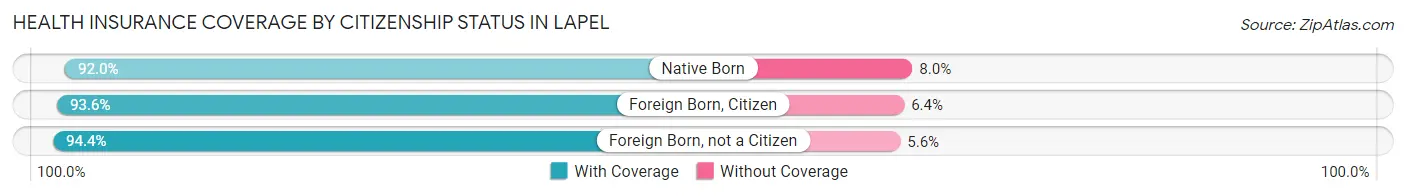
| Citizenship Status | With Coverage | Without Coverage |
| Native Born | 242 (92.0%) | 21 (8.0%) |
| Foreign Born, Citizen | 353 (93.6%) | 24 (6.4%) |
| Foreign Born, not a Citizen | 151 (94.4%) | 9 (5.6%) |
Health Insurance Coverage by Household Income in Lapel
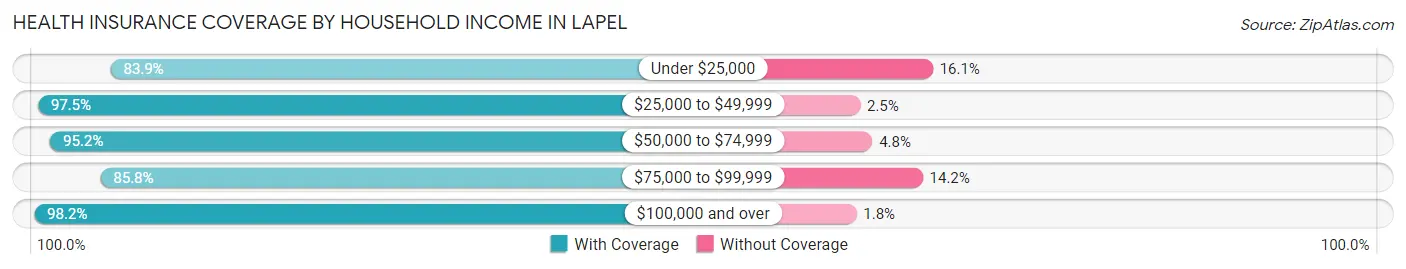
| Household Income | With Coverage | Without Coverage |
| Under $25,000 | 193 (83.9%) | 37 (16.1%) |
| $25,000 to $49,999 | 393 (97.5%) | 10 (2.5%) |
| $50,000 to $74,999 | 519 (95.2%) | 26 (4.8%) |
| $75,000 to $99,999 | 284 (85.8%) | 47 (14.2%) |
| $100,000 and over | 990 (98.2%) | 18 (1.8%) |
Public vs Private Health Insurance Coverage by Age in Lapel
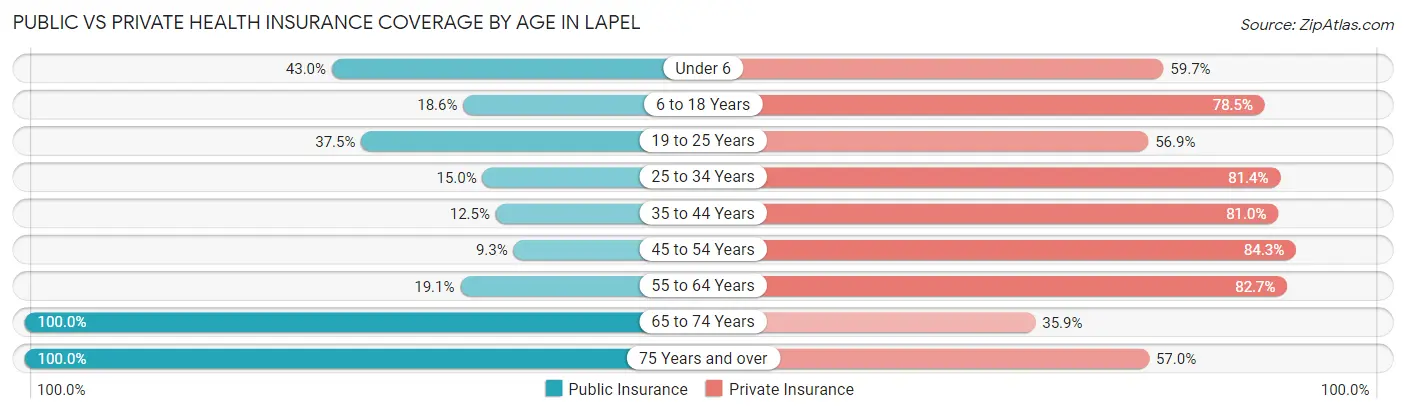
| Age Bracket | Public Insurance | Private Insurance |
| Under 6 | 113 (43.0%) | 157 (59.7%) |
| 6 to 18 Years | 70 (18.6%) | 296 (78.5%) |
| 19 to 25 Years | 60 (37.5%) | 91 (56.9%) |
| 25 to 34 Years | 54 (15.0%) | 293 (81.4%) |
| 35 to 44 Years | 35 (12.5%) | 226 (81.0%) |
| 45 to 54 Years | 36 (9.2%) | 328 (84.3%) |
| 55 to 64 Years | 74 (19.1%) | 320 (82.7%) |
| 65 to 74 Years | 181 (100.0%) | 65 (35.9%) |
| 75 Years and over | 121 (100.0%) | 69 (57.0%) |
| Total | 744 (29.6%) | 1,845 (73.3%) |
Disability Status by Sex by Age in Lapel
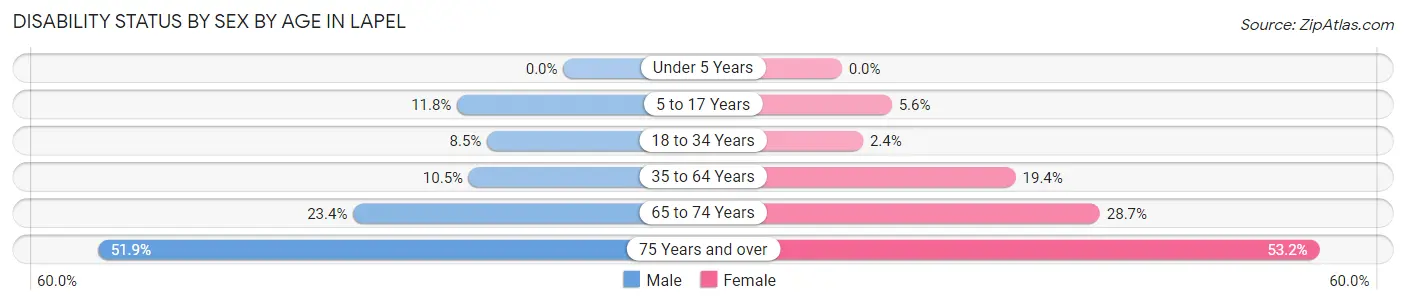
| Age Bracket | Male | Female |
| Under 5 Years | 0 (0.0%) | 0 (0.0%) |
| 5 to 17 Years | 26 (11.8%) | 10 (5.6%) |
| 18 to 34 Years | 19 (8.5%) | 7 (2.4%) |
| 35 to 64 Years | 55 (10.5%) | 103 (19.4%) |
| 65 to 74 Years | 22 (23.4%) | 25 (28.7%) |
| 75 Years and over | 14 (51.8%) | 50 (53.2%) |
Disability Class by Sex by Age in Lapel
Disability Class: Hearing Difficulty
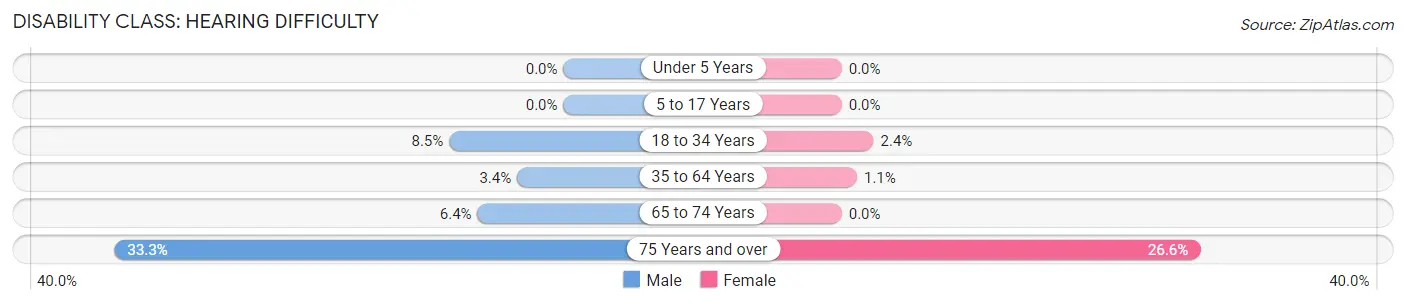
| Age Bracket | Male | Female |
| Under 5 Years | 0 (0.0%) | 0 (0.0%) |
| 5 to 17 Years | 0 (0.0%) | 0 (0.0%) |
| 18 to 34 Years | 19 (8.5%) | 7 (2.4%) |
| 35 to 64 Years | 18 (3.4%) | 6 (1.1%) |
| 65 to 74 Years | 6 (6.4%) | 0 (0.0%) |
| 75 Years and over | 9 (33.3%) | 25 (26.6%) |
Disability Class: Vision Difficulty
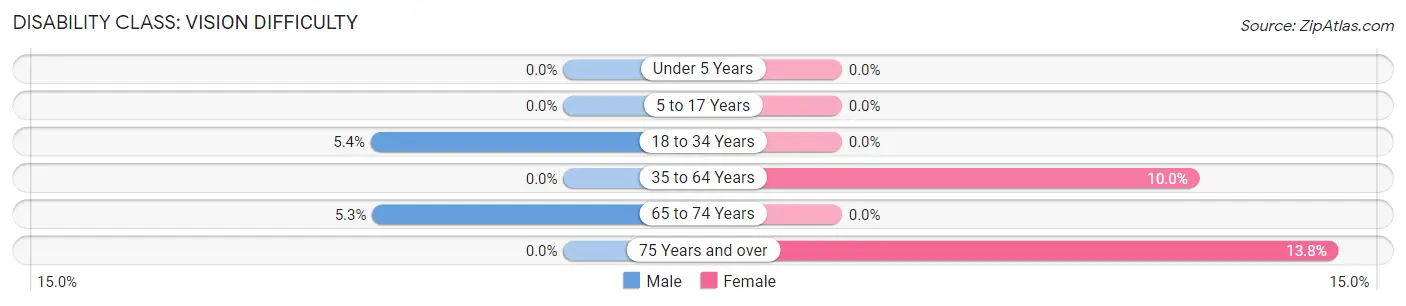
| Age Bracket | Male | Female |
| Under 5 Years | 0 (0.0%) | 0 (0.0%) |
| 5 to 17 Years | 0 (0.0%) | 0 (0.0%) |
| 18 to 34 Years | 12 (5.4%) | 0 (0.0%) |
| 35 to 64 Years | 0 (0.0%) | 53 (10.0%) |
| 65 to 74 Years | 5 (5.3%) | 0 (0.0%) |
| 75 Years and over | 0 (0.0%) | 13 (13.8%) |
Disability Class: Cognitive Difficulty
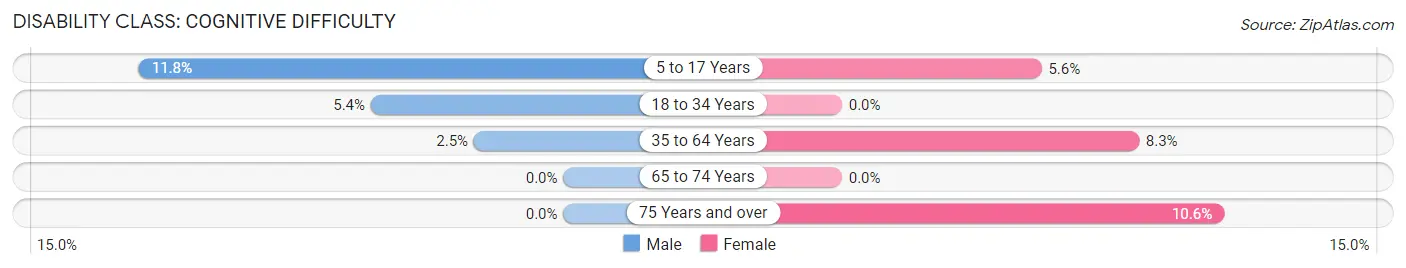
| Age Bracket | Male | Female |
| 5 to 17 Years | 26 (11.8%) | 10 (5.6%) |
| 18 to 34 Years | 12 (5.4%) | 0 (0.0%) |
| 35 to 64 Years | 13 (2.5%) | 44 (8.3%) |
| 65 to 74 Years | 0 (0.0%) | 0 (0.0%) |
| 75 Years and over | 0 (0.0%) | 10 (10.6%) |
Disability Class: Ambulatory Difficulty
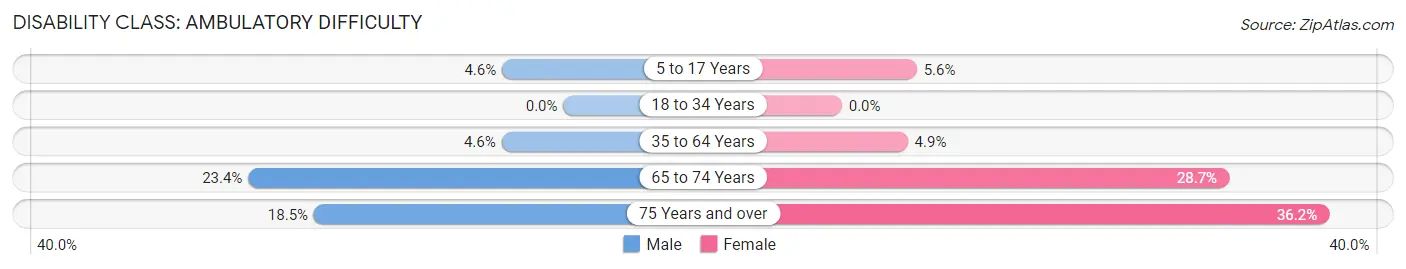
| Age Bracket | Male | Female |
| 5 to 17 Years | 10 (4.5%) | 10 (5.6%) |
| 18 to 34 Years | 0 (0.0%) | 0 (0.0%) |
| 35 to 64 Years | 24 (4.6%) | 26 (4.9%) |
| 65 to 74 Years | 22 (23.4%) | 25 (28.7%) |
| 75 Years and over | 5 (18.5%) | 34 (36.2%) |
Disability Class: Self-Care Difficulty
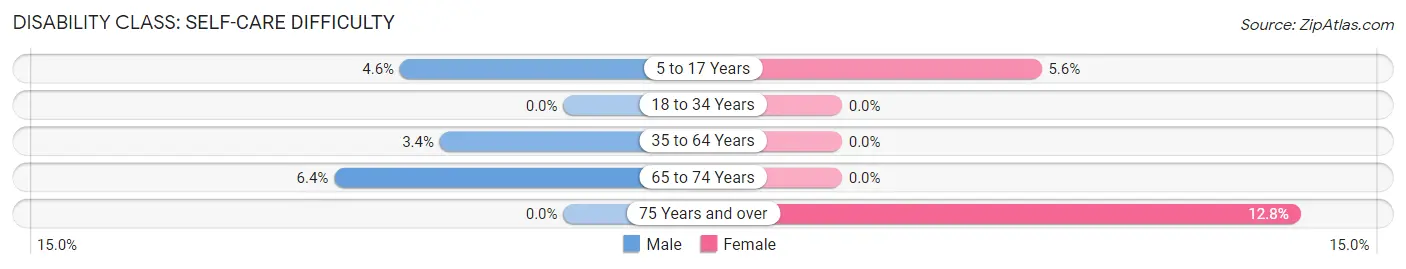
| Age Bracket | Male | Female |
| 5 to 17 Years | 10 (4.5%) | 10 (5.6%) |
| 18 to 34 Years | 0 (0.0%) | 0 (0.0%) |
| 35 to 64 Years | 18 (3.4%) | 0 (0.0%) |
| 65 to 74 Years | 6 (6.4%) | 0 (0.0%) |
| 75 Years and over | 0 (0.0%) | 12 (12.8%) |
Technology Access in Lapel
Computing Device Access in Lapel
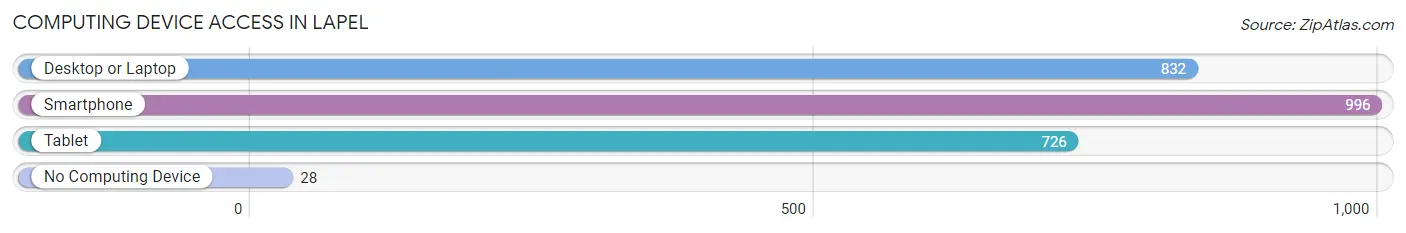
| Device Type | # Households | % Households |
| Desktop or Laptop | 832 | 79.2% |
| Smartphone | 996 | 94.8% |
| Tablet | 726 | 69.1% |
| No Computing Device | 28 | 2.7% |
| Total | 1,051 | 100.0% |
Internet Access in Lapel
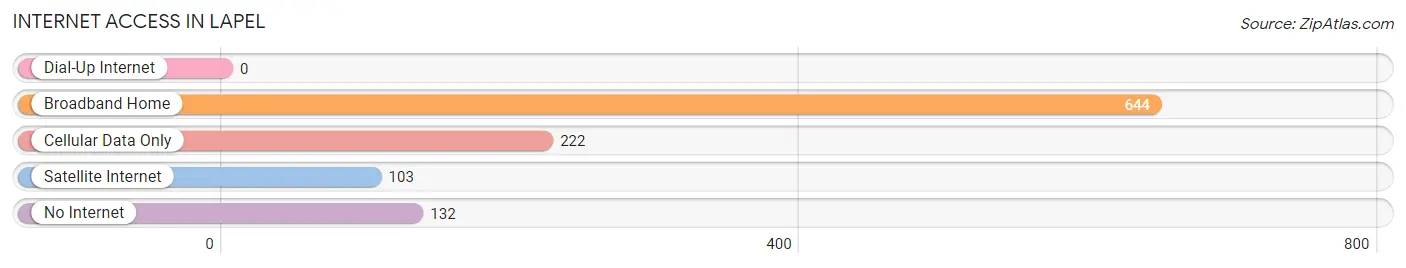
| Internet Type | # Households | % Households |
| Dial-Up Internet | 0 | 0.0% |
| Broadband Home | 644 | 61.3% |
| Cellular Data Only | 222 | 21.1% |
| Satellite Internet | 103 | 9.8% |
| No Internet | 132 | 12.6% |
| Total | 1,051 | 100.0% |
Lapel Summary
Lapel, Indiana is a small town located in Madison County, Indiana. It is situated in the east-central part of the state, about 25 miles northeast of Indianapolis. The town was founded in 1837 and has a population of 1,717 as of the 2010 census.
Geography
Lapel is located at 39°47'N 85°45'W. It is situated in the east-central part of the state, about 25 miles northeast of Indianapolis. The town is located in the White River Valley, which is part of the Central Till Plains region of Indiana. The town is surrounded by rolling hills and farmland. The White River flows through the town, and there are several small lakes and ponds in the area.
The town has a total area of 1.2 square miles, all of which is land. The elevation of the town is 845 feet above sea level.
History
Lapel was founded in 1837 by a group of settlers from North Carolina. The town was named after the Lapel family, who were among the first settlers. The town was originally a farming community, but it soon became a center for industry. In the late 19th century, the town was home to several factories, including a woolen mill, a flour mill, and a sawmill.
The town was also home to a number of churches, including the First Baptist Church, which was founded in 1837. The town also had a school, which was established in 1845.
In the early 20th century, the town was home to a number of businesses, including a bank, a newspaper, a hotel, and a movie theater. The town also had a number of stores, including a grocery store, a hardware store, and a drug store.
Economy
The economy of Lapel is largely based on agriculture and manufacturing. The town is home to several farms, which produce corn, soybeans, and wheat. The town is also home to several factories, which produce a variety of products, including furniture, clothing, and automotive parts.
The town is also home to a number of small businesses, including restaurants, shops, and service providers. The town also has a number of retail stores, including a grocery store, a hardware store, and a drug store.
Demographics
As of the 2010 census, the population of Lapel was 1,717. The racial makeup of the town was 97.2% White, 0.9% African American, 0.2% Native American, 0.2% Asian, 0.1% Pacific Islander, 0.3% from other races, and 1.2% from two or more races. Hispanic or Latino of any race were 1.2% of the population.
The median household income in Lapel was $45,938, and the median family income was $51,250. The per capita income in the town was $20,945. About 8.2% of families and 10.2% of the population were below the poverty line, including 14.2% of those under age 18 and 6.2% of those age 65 or over.
Conclusion
Lapel, Indiana is a small town located in Madison County, Indiana. It is situated in the east-central part of the state, about 25 miles northeast of Indianapolis. The town was founded in 1837 and has a population of 1,717 as of the 2010 census. The economy of Lapel is largely based on agriculture and manufacturing, and the town is home to several farms and factories. The median household income in Lapel was $45,938, and the median family income was $51,250. The racial makeup of the town was 97.2% White, 0.9% African American, 0.2% Native American, 0.2% Asian, 0.1% Pacific Islander, 0.3% from other races, and 1.2% from two or more races.
Common Questions
What is Per Capita Income in Lapel?
Per Capita income in Lapel is $34,761.
What is the Median Family Income in Lapel?
Median Family Income in Lapel is $82,778.
What is the Median Household income in Lapel?
Median Household Income in Lapel is $69,028.
What is Income or Wage Gap in Lapel?
Income or Wage Gap in Lapel is 36.1%.
Women in Lapel earn 63.9 cents for every dollar earned by a man.
What is Family Income Deficit in Lapel?
Family Income Deficit in Lapel is $6,650.
Families that are below poverty line in Lapel earn $6,650 less on average than the poverty threshold level.
What is Inequality or Gini Index in Lapel?
Inequality or Gini Index in Lapel is 0.33.
What is the Total Population of Lapel?
Total Population of Lapel is 2,517.
What is the Total Male Population of Lapel?
Total Male Population of Lapel is 1,161.
What is the Total Female Population of Lapel?
Total Female Population of Lapel is 1,356.
What is the Ratio of Males per 100 Females in Lapel?
There are 85.62 Males per 100 Females in Lapel.
What is the Ratio of Females per 100 Males in Lapel?
There are 116.80 Females per 100 Males in Lapel.
What is the Median Population Age in Lapel?
Median Population Age in Lapel is 37.3 Years.
What is the Average Family Size in Lapel
Average Family Size in Lapel is 3.0 People.
What is the Average Household Size in Lapel
Average Household Size in Lapel is 2.4 People.
How Large is the Labor Force in Lapel?
There are 1,432 People in the Labor Forcein in Lapel.
What is the Percentage of People in the Labor Force in Lapel?
73.7% of People are in the Labor Force in Lapel.
What is the Unemployment Rate in Lapel?
Unemployment Rate in Lapel is 3.2%.