Lake Village, IN Map & Demographics
Lake Village Map
Lake Village Overview
$34,481
PER CAPITA INCOME
$110,559
AVG FAMILY INCOME
44.0%
WAGE / INCOME GAP [ % ]
56.0¢/ $1
WAGE / INCOME GAP [ $ ]
0.49
INEQUALITY / GINI INDEX
579
TOTAL POPULATION
315
MALE POPULATION
264
FEMALE POPULATION
119.32
MALES / 100 FEMALES
83.81
FEMALES / 100 MALES
56.7
MEDIAN AGE
2.4
AVG FAMILY SIZE
2.0
AVG HOUSEHOLD SIZE
345
LABOR FORCE [ PEOPLE ]
61.6%
PERCENT IN LABOR FORCE
11.3%
UNEMPLOYMENT RATE
Lake Village Zip Codes
Lake Village Area Codes
Income in Lake Village
Income Overview in Lake Village
| Characteristic | Number | Measure |
| Per Capita Income | 579 | $34,481 |
| Median Family Income | 193 | $110,559 |
| Mean Family Income | 193 | $91,839 |
| Median Household Income | 295 | $0 |
| Mean Household Income | 295 | $62,837 |
| Income Deficit | 193 | $0 |
| Wage / Income Gap (%) | 579 | 44.00% |
| Wage / Income Gap ($) | 579 | 56.00¢ per $1 |
| Gini / Inequality Index | 579 | 0.49 |
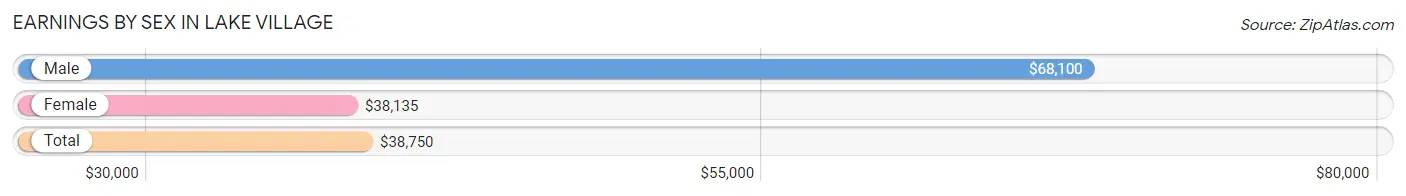
Earnings by Sex in Lake Village
Average Earnings in Lake Village are $38,750, $68,100 for men and $38,135 for women, a difference of 44.0%.
| Sex | Number | Average Earnings |
| Male | 172 (49.9%) | $68,100 |
| Female | 173 (50.1%) | $38,135 |
| Total | 345 (100.0%) | $38,750 |
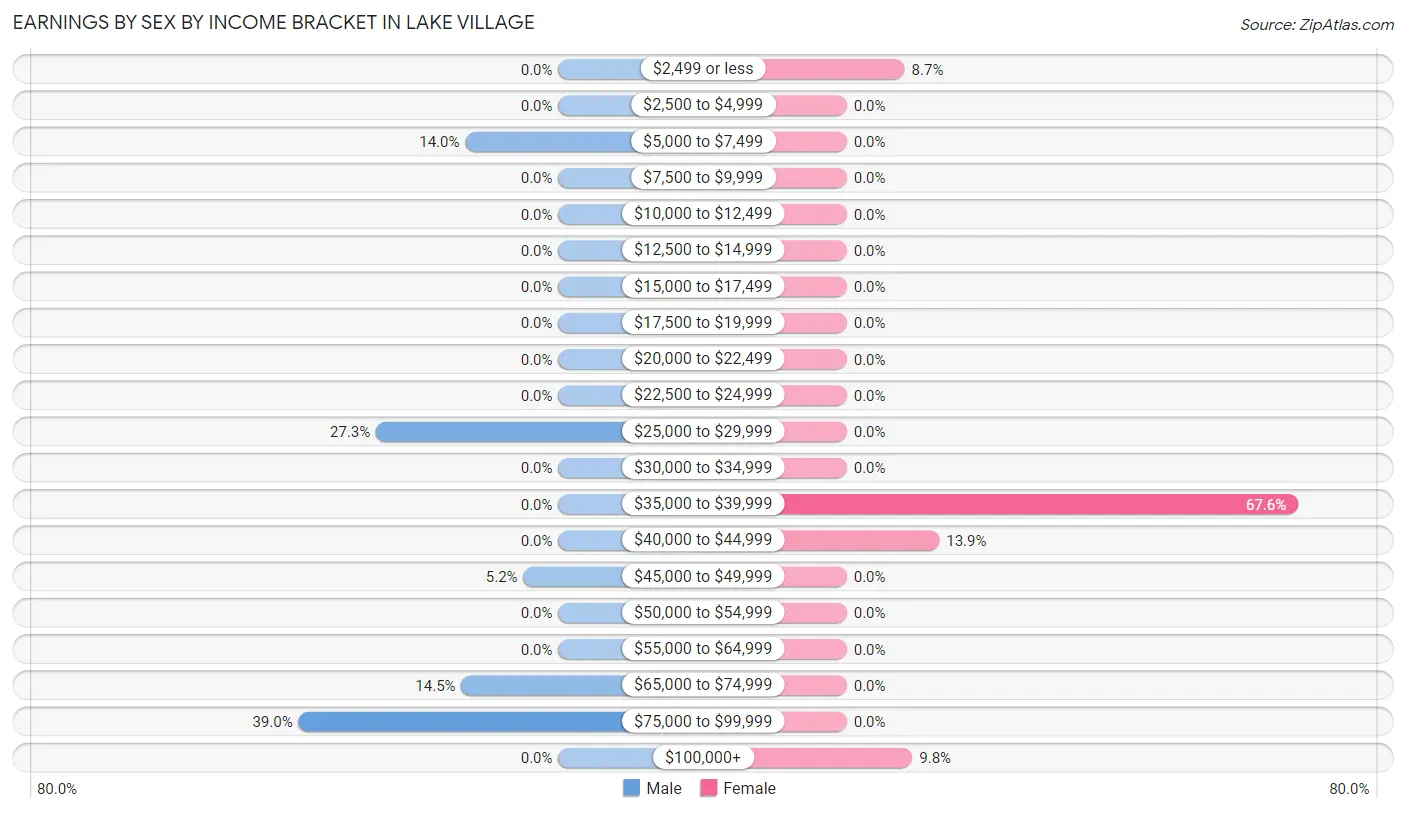
Earnings by Sex by Income Bracket in Lake Village
The most common earnings brackets in Lake Village are $75,000 to $99,999 for men (67 | 39.0%) and $35,000 to $39,999 for women (117 | 67.6%).
| Income | Male | Female |
| $2,499 or less | 0 (0.0%) | 15 (8.7%) |
| $2,500 to $4,999 | 0 (0.0%) | 0 (0.0%) |
| $5,000 to $7,499 | 24 (14.0%) | 0 (0.0%) |
| $7,500 to $9,999 | 0 (0.0%) | 0 (0.0%) |
| $10,000 to $12,499 | 0 (0.0%) | 0 (0.0%) |
| $12,500 to $14,999 | 0 (0.0%) | 0 (0.0%) |
| $15,000 to $17,499 | 0 (0.0%) | 0 (0.0%) |
| $17,500 to $19,999 | 0 (0.0%) | 0 (0.0%) |
| $20,000 to $22,499 | 0 (0.0%) | 0 (0.0%) |
| $22,500 to $24,999 | 0 (0.0%) | 0 (0.0%) |
| $25,000 to $29,999 | 47 (27.3%) | 0 (0.0%) |
| $30,000 to $34,999 | 0 (0.0%) | 0 (0.0%) |
| $35,000 to $39,999 | 0 (0.0%) | 117 (67.6%) |
| $40,000 to $44,999 | 0 (0.0%) | 24 (13.9%) |
| $45,000 to $49,999 | 9 (5.2%) | 0 (0.0%) |
| $50,000 to $54,999 | 0 (0.0%) | 0 (0.0%) |
| $55,000 to $64,999 | 0 (0.0%) | 0 (0.0%) |
| $65,000 to $74,999 | 25 (14.5%) | 0 (0.0%) |
| $75,000 to $99,999 | 67 (39.0%) | 0 (0.0%) |
| $100,000+ | 0 (0.0%) | 17 (9.8%) |
| Total | 172 (100.0%) | 173 (100.0%) |
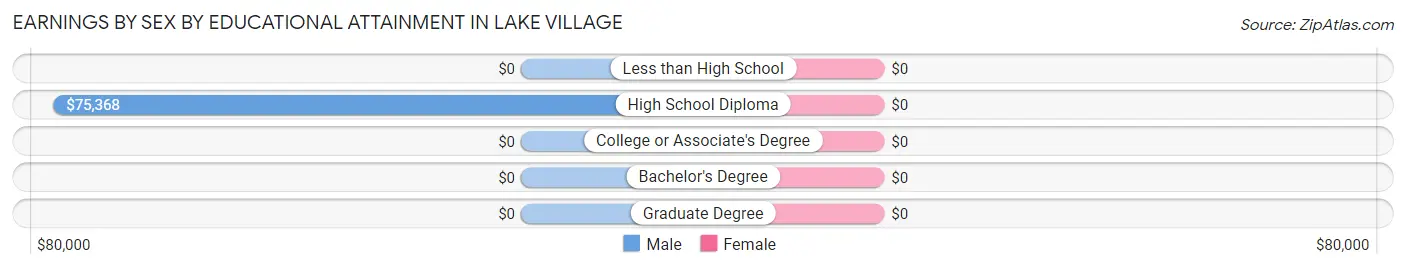
Earnings by Sex by Educational Attainment in Lake Village
| Educational Attainment | Male Income | Female Income |
| Less than High School | - | - |
| High School Diploma | $75,368 | $0 |
| College or Associate's Degree | - | - |
| Bachelor's Degree | - | - |
| Graduate Degree | - | - |
| Total | $69,750 | $38,443 |
Family Income in Lake Village
Family Income Brackets in Lake Village
According to the Lake Village family income data, there are 88 families falling into the $100,000 to $149,999 income range, which is the most common income bracket and makes up 45.6% of all families.
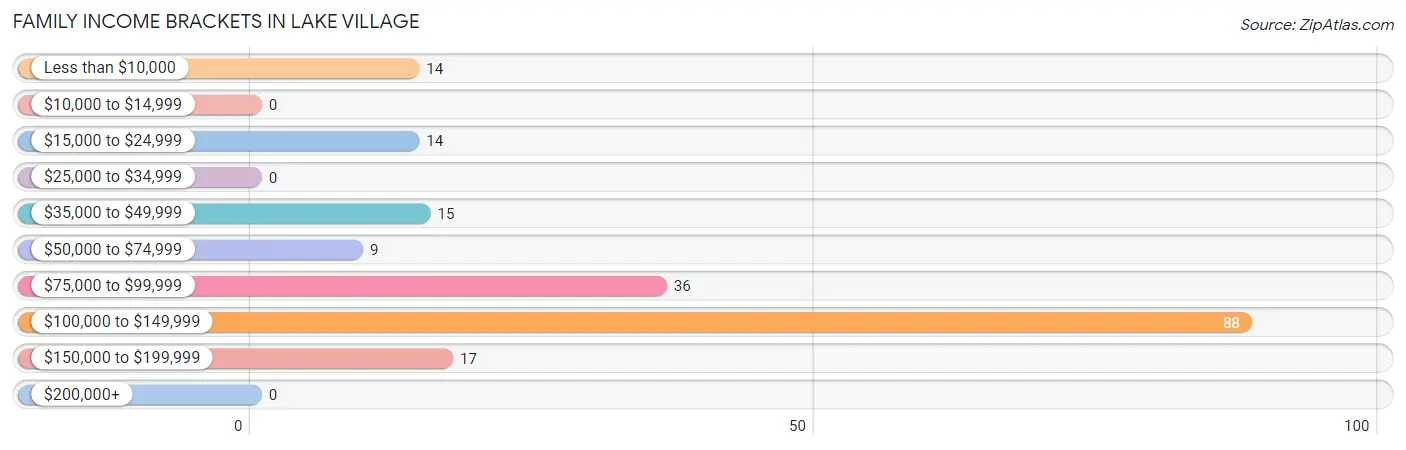
| Income Bracket | # Families | % Families |
| Less than $10,000 | 14 | 7.3% |
| $10,000 to $14,999 | 0 | 0.0% |
| $15,000 to $24,999 | 14 | 7.3% |
| $25,000 to $34,999 | 0 | 0.0% |
| $35,000 to $49,999 | 15 | 7.8% |
| $50,000 to $74,999 | 9 | 4.7% |
| $75,000 to $99,999 | 36 | 18.7% |
| $100,000 to $149,999 | 88 | 45.6% |
| $150,000 to $199,999 | 17 | 8.8% |
| $200,000+ | 0 | 0.0% |
Family Income by Famaliy Size in Lake Village
2-person families (176 | 91.2%) account for the highest median family income in Lake Village with $97,500 per family, while 2-person families (176 | 91.2%) have the highest median income of $48,750 per family member.
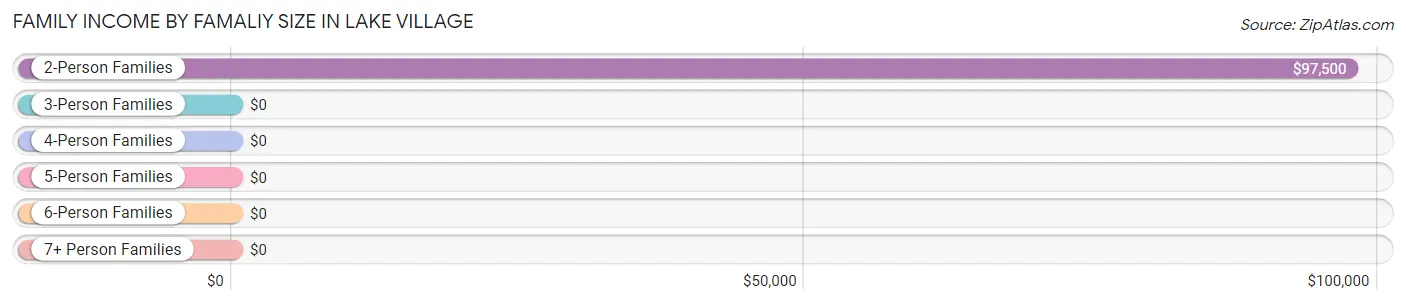
| Income Bracket | # Families | Median Income |
| 2-Person Families | 176 (91.2%) | $97,500 |
| 3-Person Families | 0 (0.0%) | $0 |
| 4-Person Families | 17 (8.8%) | $0 |
| 5-Person Families | 0 (0.0%) | $0 |
| 6-Person Families | 0 (0.0%) | $0 |
| 7+ Person Families | 0 (0.0%) | $0 |
| Total | 193 (100.0%) | $110,559 |
Family Income by Number of Earners in Lake Village
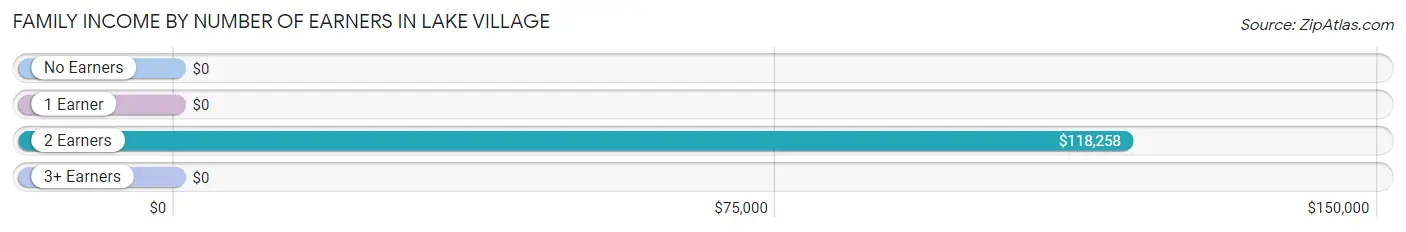
| Number of Earners | # Families | Median Income |
| No Earners | 51 (26.4%) | $0 |
| 1 Earner | 28 (14.5%) | $0 |
| 2 Earners | 114 (59.1%) | $118,258 |
| 3+ Earners | 0 (0.0%) | $0 |
| Total | 193 (100.0%) | $110,559 |
Household Income in Lake Village
Household Income Brackets in Lake Village
With 88 households falling in the category, the $100,000 to $149,999 income range is the most frequent in Lake Village, accounting for 29.8% of all households.
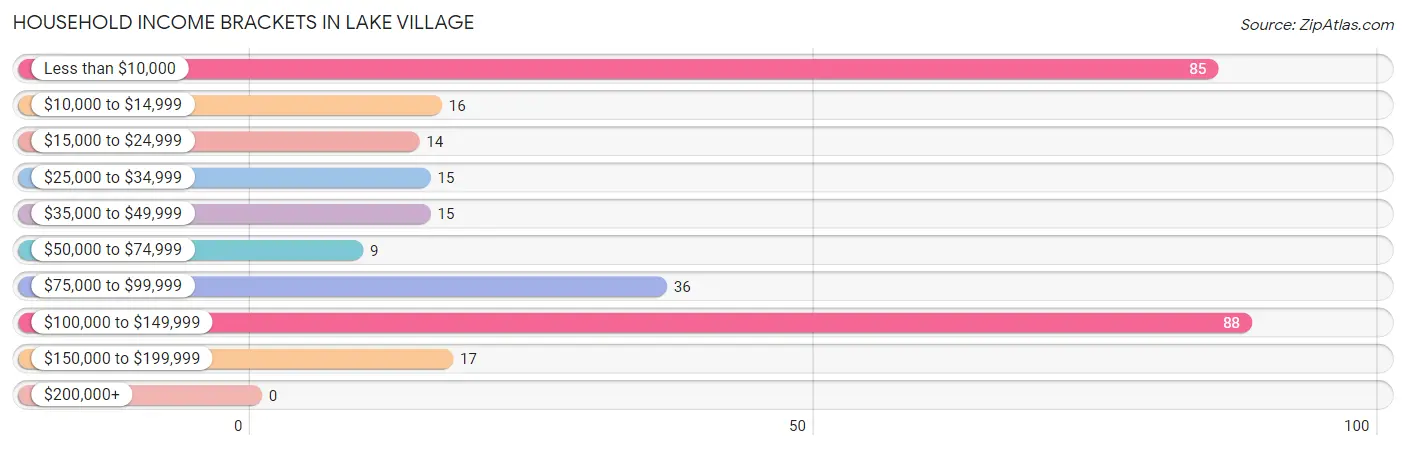
| Income Bracket | # Households | % Households |
| Less than $10,000 | 85 | 28.8% |
| $10,000 to $14,999 | 16 | 5.4% |
| $15,000 to $24,999 | 14 | 4.7% |
| $25,000 to $34,999 | 15 | 5.1% |
| $35,000 to $49,999 | 15 | 5.1% |
| $50,000 to $74,999 | 9 | 3.1% |
| $75,000 to $99,999 | 36 | 12.2% |
| $100,000 to $149,999 | 88 | 29.8% |
| $150,000 to $199,999 | 17 | 5.8% |
| $200,000+ | 0 | 0.0% |
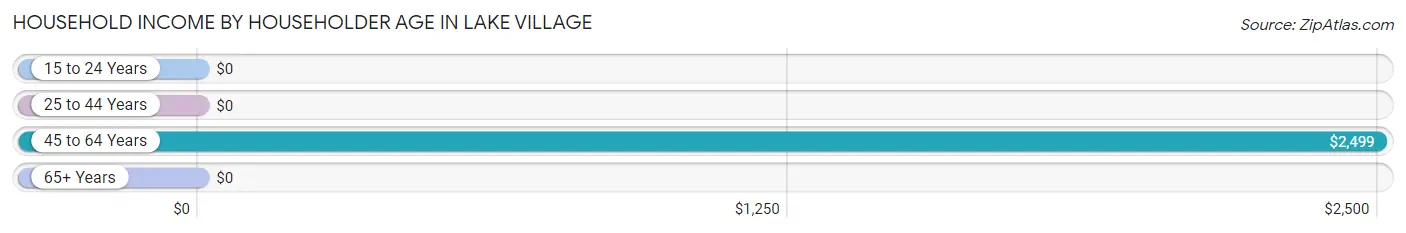
Household Income by Householder Age in Lake Village
The median household income in Lake Village is $0, with the highest median household income of $2,499 found in the 45 to 64 years age bracket for the primary householder. A total of 103 households (34.9%) fall into this category. Meanwhile, the 15 to 24 years age bracket for the primary householder has the lowest median household income of $0, with 24 households (8.1%) in this group.
| Income Bracket | # Households | Median Income |
| 15 to 24 Years | 24 (8.1%) | $0 |
| 25 to 44 Years | 71 (24.1%) | $0 |
| 45 to 64 Years | 103 (34.9%) | $2,499 |
| 65+ Years | 97 (32.9%) | $0 |
| Total | 295 (100.0%) | $0 |
Poverty in Lake Village
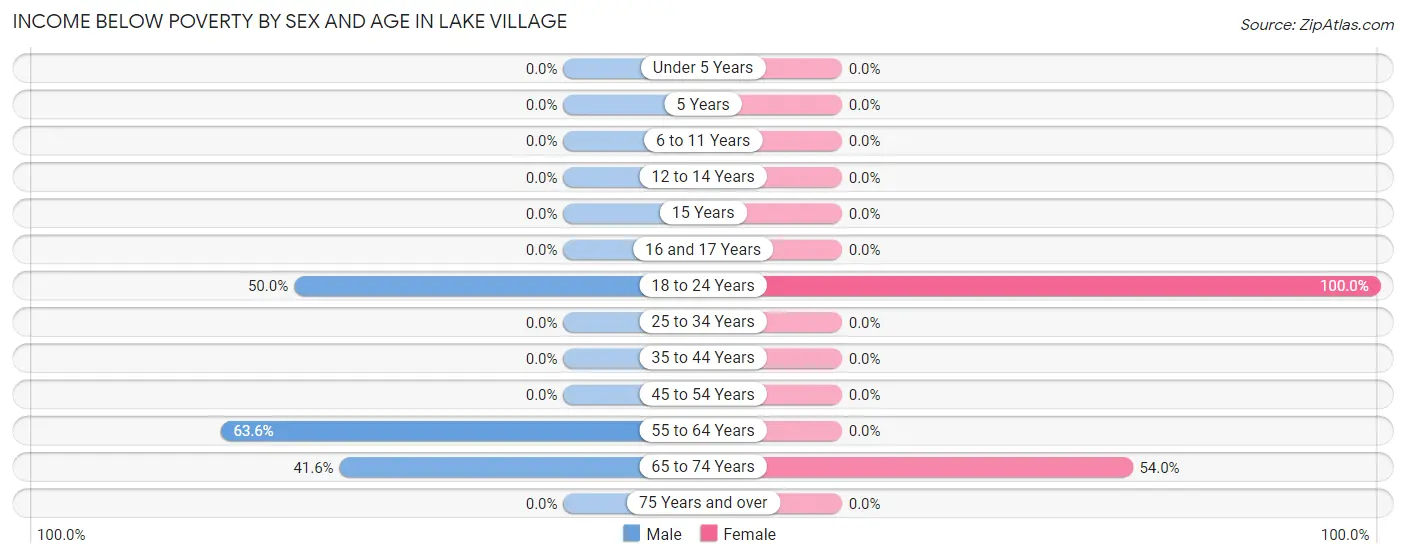
Income Below Poverty by Sex and Age in Lake Village
With 35.6% poverty level for males and 21.2% for females among the residents of Lake Village, 55 to 64 year old males and 18 to 24 year old females are the most vulnerable to poverty, with 56 males (63.6%) and 15 females (100.0%) in their respective age groups living below the poverty level.
| Age Bracket | Male | Female |
| Under 5 Years | 0 (0.0%) | 0 (0.0%) |
| 5 Years | 0 (0.0%) | 0 (0.0%) |
| 6 to 11 Years | 0 (0.0%) | 0 (0.0%) |
| 12 to 14 Years | 0 (0.0%) | 0 (0.0%) |
| 15 Years | 0 (0.0%) | 0 (0.0%) |
| 16 and 17 Years | 0 (0.0%) | 0 (0.0%) |
| 18 to 24 Years | 24 (50.0%) | 15 (100.0%) |
| 25 to 34 Years | 0 (0.0%) | 0 (0.0%) |
| 35 to 44 Years | 0 (0.0%) | 0 (0.0%) |
| 45 to 54 Years | 0 (0.0%) | 0 (0.0%) |
| 55 to 64 Years | 56 (63.6%) | 0 (0.0%) |
| 65 to 74 Years | 32 (41.6%) | 41 (53.9%) |
| 75 Years and over | 0 (0.0%) | 0 (0.0%) |
| Total | 112 (35.6%) | 56 (21.2%) |
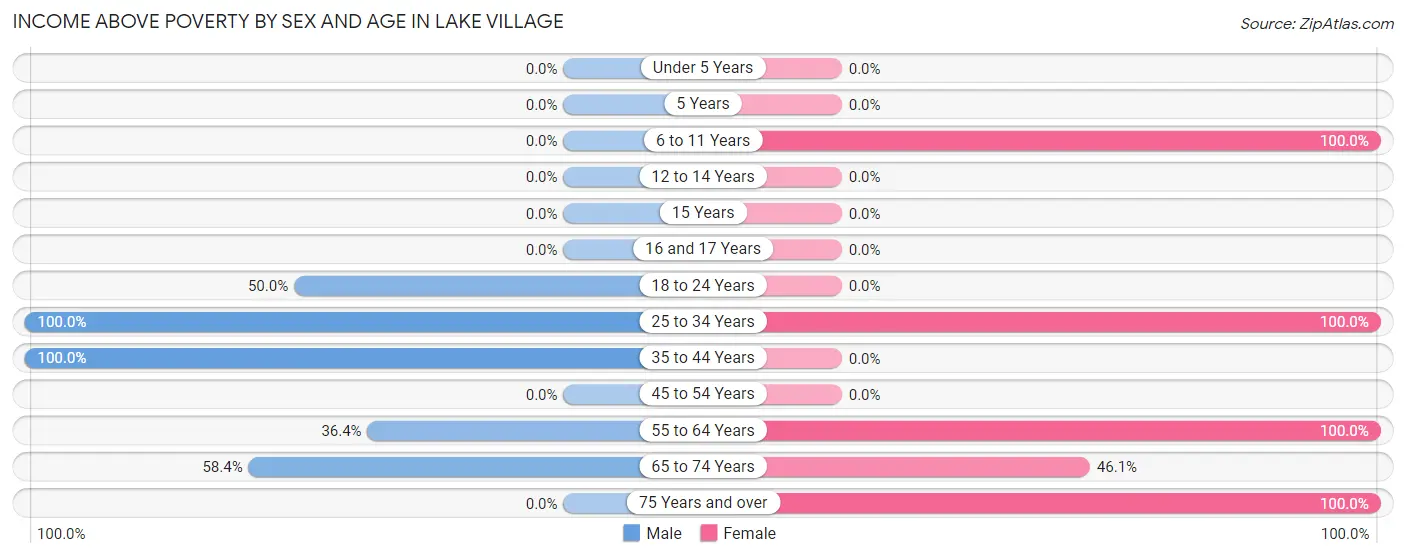
Income Above Poverty by Sex and Age in Lake Village
According to the poverty statistics in Lake Village, males aged 25 to 34 years and females aged 6 to 11 years are the age groups that are most secure financially, with 100.0% of males and 100.0% of females in these age groups living above the poverty line.
| Age Bracket | Male | Female |
| Under 5 Years | 0 (0.0%) | 0 (0.0%) |
| 5 Years | 0 (0.0%) | 0 (0.0%) |
| 6 to 11 Years | 0 (0.0%) | 19 (100.0%) |
| 12 to 14 Years | 0 (0.0%) | 0 (0.0%) |
| 15 Years | 0 (0.0%) | 0 (0.0%) |
| 16 and 17 Years | 0 (0.0%) | 0 (0.0%) |
| 18 to 24 Years | 24 (50.0%) | 0 (0.0%) |
| 25 to 34 Years | 77 (100.0%) | 84 (100.0%) |
| 35 to 44 Years | 25 (100.0%) | 0 (0.0%) |
| 45 to 54 Years | 0 (0.0%) | 0 (0.0%) |
| 55 to 64 Years | 32 (36.4%) | 57 (100.0%) |
| 65 to 74 Years | 45 (58.4%) | 35 (46.1%) |
| 75 Years and over | 0 (0.0%) | 13 (100.0%) |
| Total | 203 (64.4%) | 208 (78.8%) |
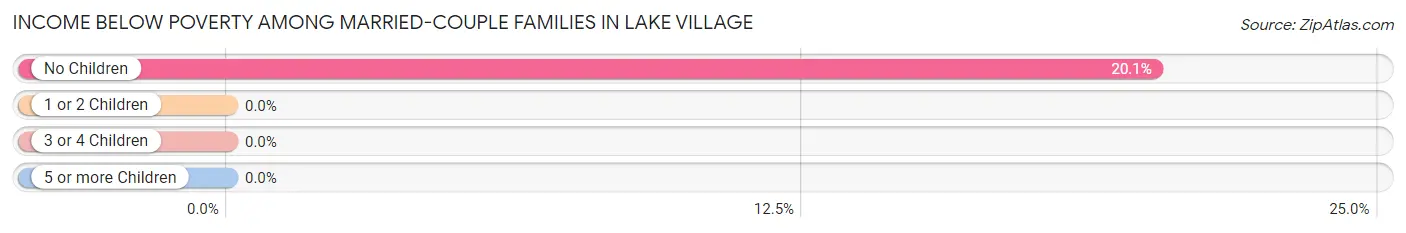
Income Below Poverty Among Married-Couple Families in Lake Village
The poverty statistics for married-couple families in Lake Village show that 17.9% or 28 of the total 156 families live below the poverty line. Families with no children have the highest poverty rate of 20.1%, comprising of 28 families. On the other hand, families with 1 or 2 children have the lowest poverty rate of 0.0%, which includes 0 families.
| Children | Above Poverty | Below Poverty |
| No Children | 111 (79.9%) | 28 (20.1%) |
| 1 or 2 Children | 17 (100.0%) | 0 (0.0%) |
| 3 or 4 Children | 0 (0.0%) | 0 (0.0%) |
| 5 or more Children | 0 (0.0%) | 0 (0.0%) |
| Total | 128 (82.1%) | 28 (17.9%) |
Income Below Poverty Among Single-Parent Households in Lake Village
| Children | Single Father | Single Mother |
| No Children | 0 (0.0%) | 0 (0.0%) |
| 1 or 2 Children | 0 (0.0%) | 0 (0.0%) |
| 3 or 4 Children | 0 (0.0%) | 0 (0.0%) |
| 5 or more Children | 0 (0.0%) | 0 (0.0%) |
| Total | 0 (0.0%) | 0 (0.0%) |
Income Below Poverty Among Married-Couple vs Single-Parent Households in Lake Village
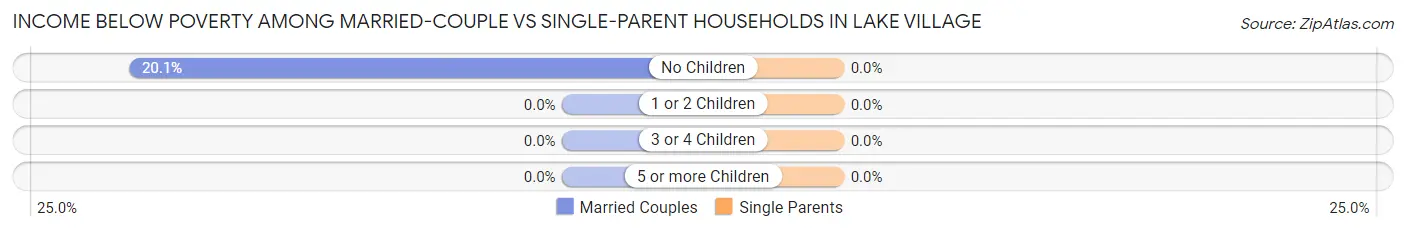
| Children | Married-Couple Families | Single-Parent Households |
| No Children | 28 (20.1%) | 0 (0.0%) |
| 1 or 2 Children | 0 (0.0%) | 0 (0.0%) |
| 3 or 4 Children | 0 (0.0%) | 0 (0.0%) |
| 5 or more Children | 0 (0.0%) | 0 (0.0%) |
| Total | 28 (17.9%) | 0 (0.0%) |
Race in Lake Village
The most populous races in Lake Village are , and White / Caucasian (579 | 100.0%).
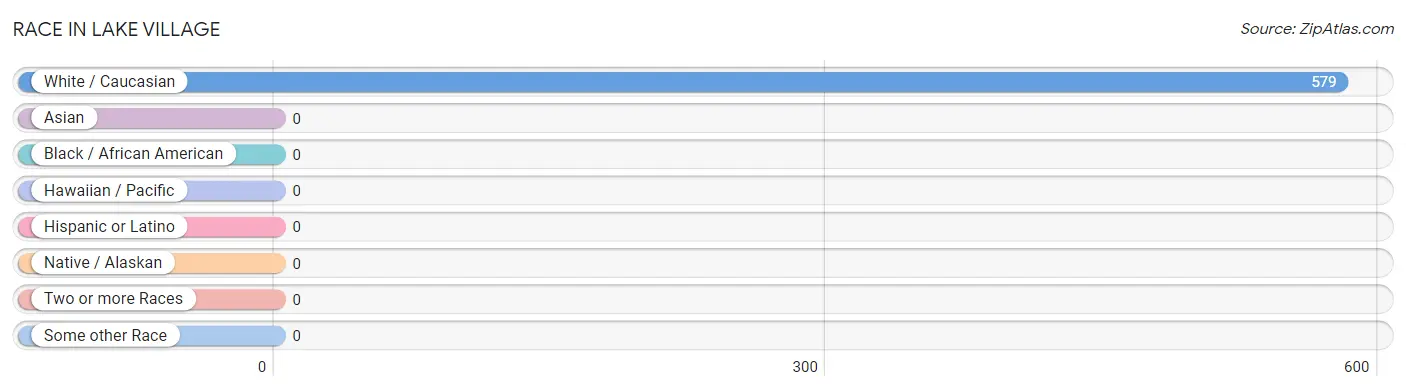
| Race | # Population | % Population |
| Asian | 0 | 0.0% |
| Black / African American | 0 | 0.0% |
| Hawaiian / Pacific | 0 | 0.0% |
| Hispanic or Latino | 0 | 0.0% |
| Native / Alaskan | 0 | 0.0% |
| White / Caucasian | 579 | 100.0% |
| Two or more Races | 0 | 0.0% |
| Some other Race | 0 | 0.0% |
| Total | 579 | 100.0% |
Ancestry in Lake Village
The most populous ancestries reported in Lake Village are Polish (121 | 20.9%), German (105 | 18.1%), American (93 | 16.1%), English (37 | 6.4%), and Russian (24 | 4.2%), together accounting for 65.6% of all Lake Village residents.
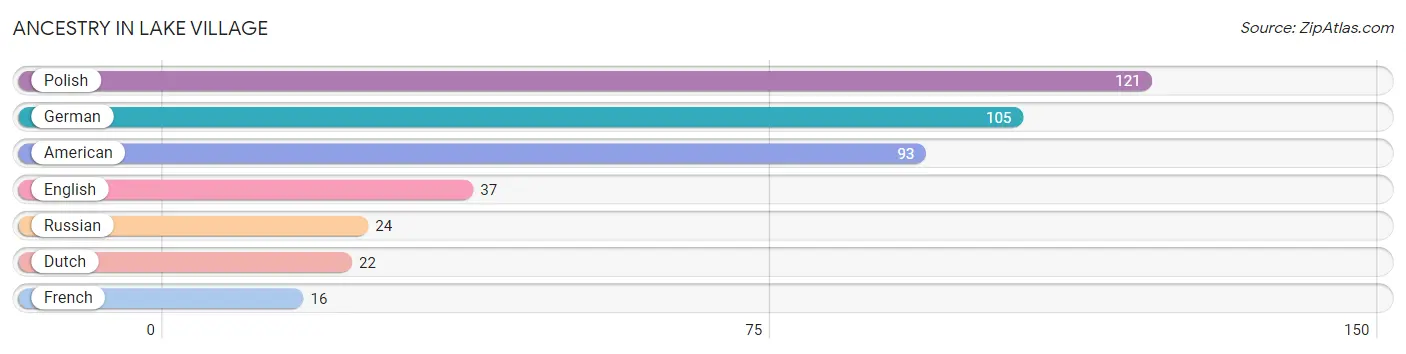
| Ancestry | # Population | % Population |
| American | 93 | 16.1% |
| Dutch | 22 | 3.8% |
| English | 37 | 6.4% |
| French | 16 | 2.8% |
| German | 105 | 18.1% |
| Polish | 121 | 20.9% |
| Russian | 24 | 4.2% | View All 7 Rows |
Immigrants in Lake Village

| Immigration Origin | # Population | % Population | View All 0 Rows |
Sex and Age in Lake Village
Sex and Age in Lake Village
The most populous age groups in Lake Village are 60 to 64 Years (56 | 17.8%) for men and 25 to 29 Years (46 | 17.4%) for women.
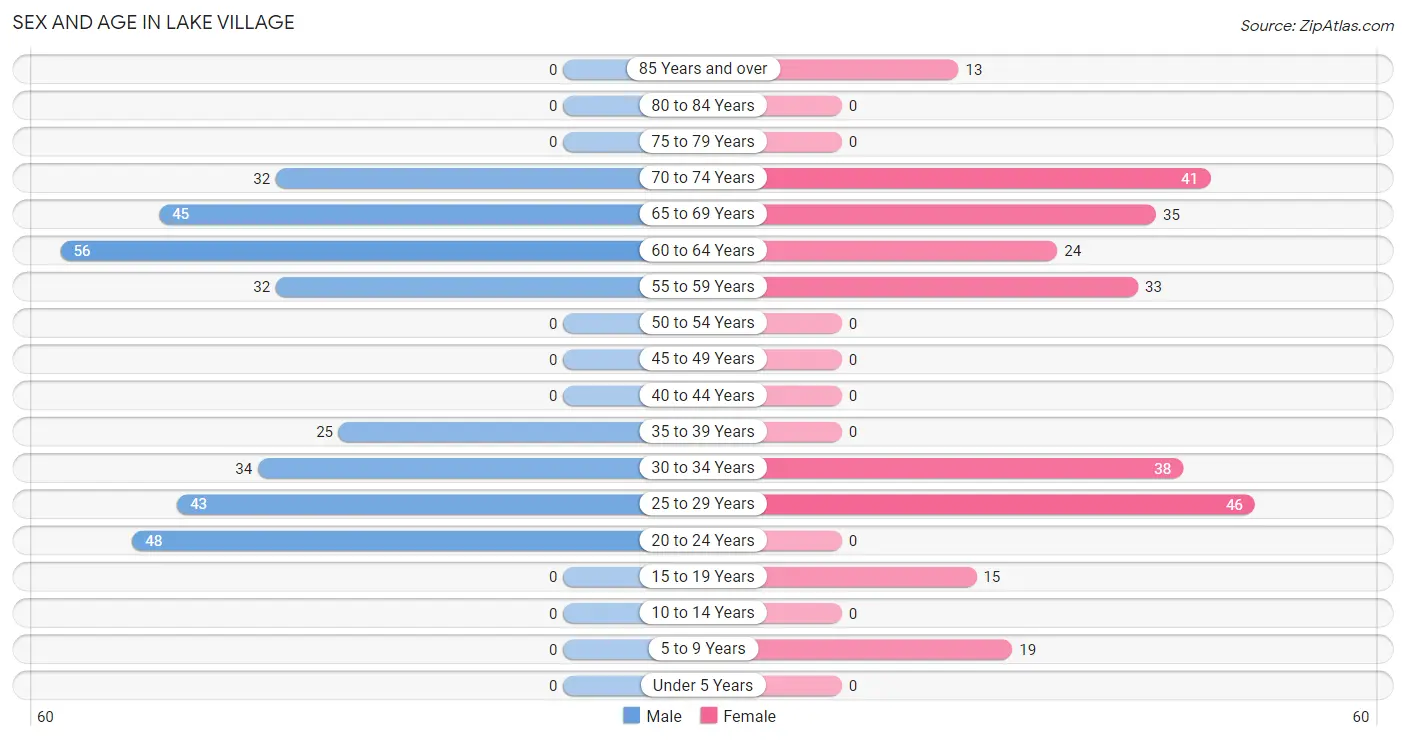
| Age Bracket | Male | Female |
| Under 5 Years | 0 (0.0%) | 0 (0.0%) |
| 5 to 9 Years | 0 (0.0%) | 19 (7.2%) |
| 10 to 14 Years | 0 (0.0%) | 0 (0.0%) |
| 15 to 19 Years | 0 (0.0%) | 15 (5.7%) |
| 20 to 24 Years | 48 (15.2%) | 0 (0.0%) |
| 25 to 29 Years | 43 (13.7%) | 46 (17.4%) |
| 30 to 34 Years | 34 (10.8%) | 38 (14.4%) |
| 35 to 39 Years | 25 (7.9%) | 0 (0.0%) |
| 40 to 44 Years | 0 (0.0%) | 0 (0.0%) |
| 45 to 49 Years | 0 (0.0%) | 0 (0.0%) |
| 50 to 54 Years | 0 (0.0%) | 0 (0.0%) |
| 55 to 59 Years | 32 (10.2%) | 33 (12.5%) |
| 60 to 64 Years | 56 (17.8%) | 24 (9.1%) |
| 65 to 69 Years | 45 (14.3%) | 35 (13.3%) |
| 70 to 74 Years | 32 (10.2%) | 41 (15.5%) |
| 75 to 79 Years | 0 (0.0%) | 0 (0.0%) |
| 80 to 84 Years | 0 (0.0%) | 0 (0.0%) |
| 85 Years and over | 0 (0.0%) | 13 (4.9%) |
| Total | 315 (100.0%) | 264 (100.0%) |
Families and Households in Lake Village
Median Family Size in Lake Village
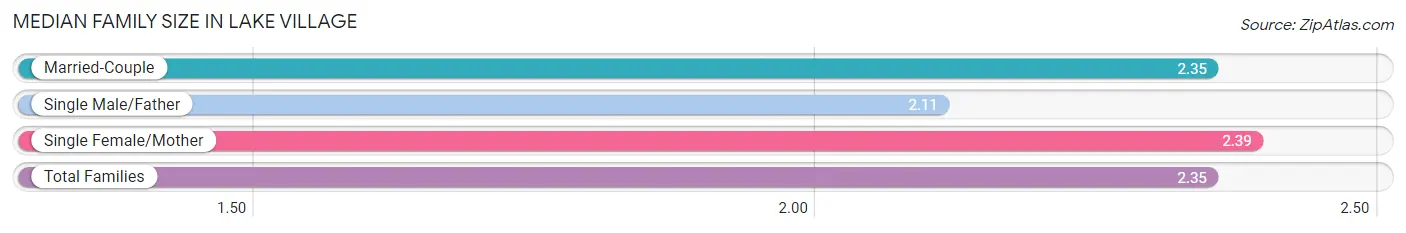
The median family size in Lake Village is 2.35 persons per family, with single female/mother families (28 | 14.5%) accounting for the largest median family size of 2.39 persons per family. On the other hand, single male/father families (9 | 4.7%) represent the smallest median family size with 2.11 persons per family.
| Family Type | # Families | Family Size |
| Married-Couple | 156 (80.8%) | 2.35 |
| Single Male/Father | 9 (4.7%) | 2.11 |
| Single Female/Mother | 28 (14.5%) | 2.39 |
| Total Families | 193 (100.0%) | 2.35 |
Median Household Size in Lake Village
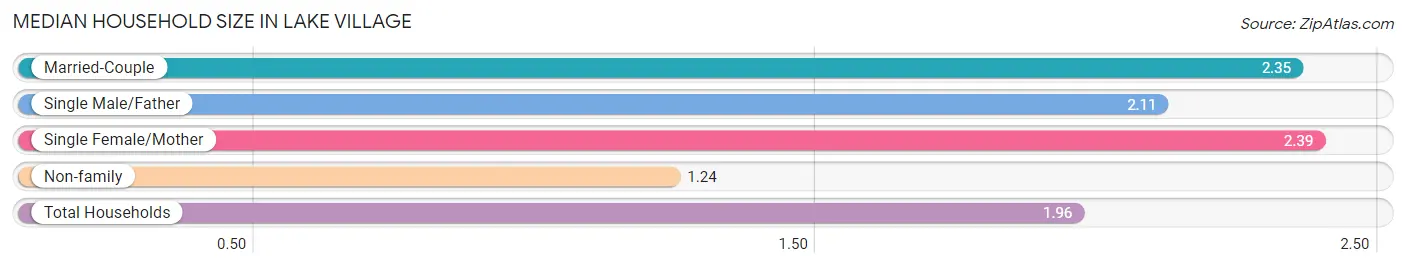
The median household size in Lake Village is 1.96 persons per household, with single female/mother households (28 | 9.5%) accounting for the largest median household size of 2.39 persons per household. non-family households (102 | 34.6%) represent the smallest median household size with 1.24 persons per household.
| Household Type | # Households | Household Size |
| Married-Couple | 156 (52.9%) | 2.35 |
| Single Male/Father | 9 (3.0%) | 2.11 |
| Single Female/Mother | 28 (9.5%) | 2.39 |
| Non-family | 102 (34.6%) | 1.24 |
| Total Households | 295 (100.0%) | 1.96 |
Household Size by Marriage Status in Lake Village
Out of a total of 295 households in Lake Village, 193 (65.4%) are family households, while 102 (34.6%) are nonfamily households. The most numerous type of family households are 2-person households, comprising 176, and the most common type of nonfamily households are 1-person households, comprising 87.
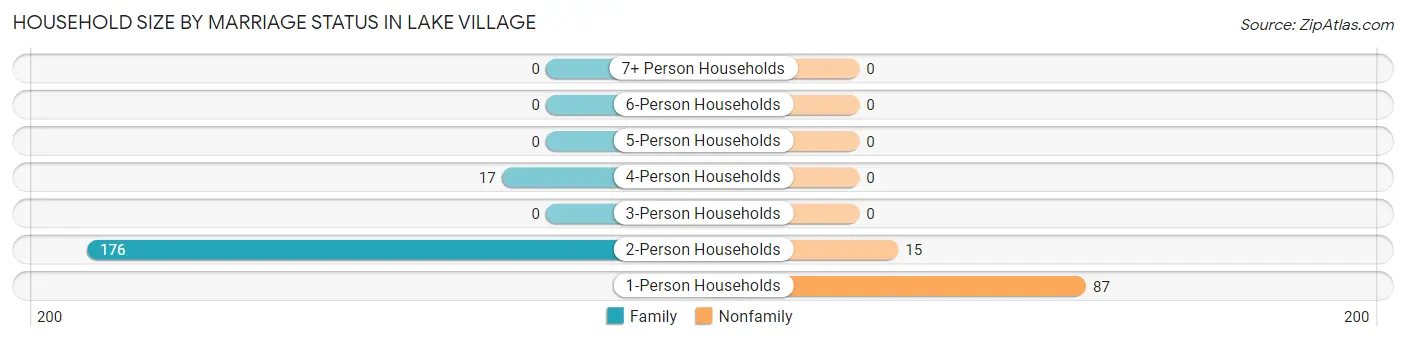
| Household Size | Family Households | Nonfamily Households |
| 1-Person Households | - | 87 (29.5%) |
| 2-Person Households | 176 (59.7%) | 15 (5.1%) |
| 3-Person Households | 0 (0.0%) | 0 (0.0%) |
| 4-Person Households | 17 (5.8%) | 0 (0.0%) |
| 5-Person Households | 0 (0.0%) | 0 (0.0%) |
| 6-Person Households | 0 (0.0%) | 0 (0.0%) |
| 7+ Person Households | 0 (0.0%) | 0 (0.0%) |
| Total | 193 (65.4%) | 102 (34.6%) |
Female Fertility in Lake Village
Fertility by Age in Lake Village
| Age Bracket | Women with Births | Births / 1,000 Women |
| 15 to 19 years | 0 (0.0%) | 0.0 |
| 20 to 34 years | 0 (0.0%) | 0.0 |
| 35 to 50 years | 0 (0.0%) | 0.0 |
| Total | 0 (0.0%) | 0.0 |
Fertility by Age by Marriage Status in Lake Village
| Age Bracket | Married | Unmarried |
| 15 to 19 years | 0 (0.0%) | 0 (0.0%) |
| 20 to 34 years | 0 (0.0%) | 0 (0.0%) |
| 35 to 50 years | 0 (0.0%) | 0 (0.0%) |
| Total | 0 (0.0%) | 0 (0.0%) |
Fertility by Education in Lake Village
| Educational Attainment | Women with Births | Births / 1,000 Women |
| Less than High School | 0 (0.0%) | 0.0 |
| High School Diploma | 0 (0.0%) | 0.0 |
| College or Associate's Degree | 0 (0.0%) | 0.0 |
| Bachelor's Degree | 0 (0.0%) | 0.0 |
| Graduate Degree | 0 (0.0%) | 0.0 |
| Total | 0 (0.0%) | 0.0 |
Fertility by Education by Marriage Status in Lake Village
| Educational Attainment | Married | Unmarried |
| Less than High School | 0 (0.0%) | 0 (0.0%) |
| High School Diploma | 0 (0.0%) | 0 (0.0%) |
| College or Associate's Degree | 0 (0.0%) | 0 (0.0%) |
| Bachelor's Degree | 0 (0.0%) | 0 (0.0%) |
| Graduate Degree | 0 (0.0%) | 0 (0.0%) |
| Total | 0 (0.0%) | 0 (0.0%) |
Employment Characteristics in Lake Village
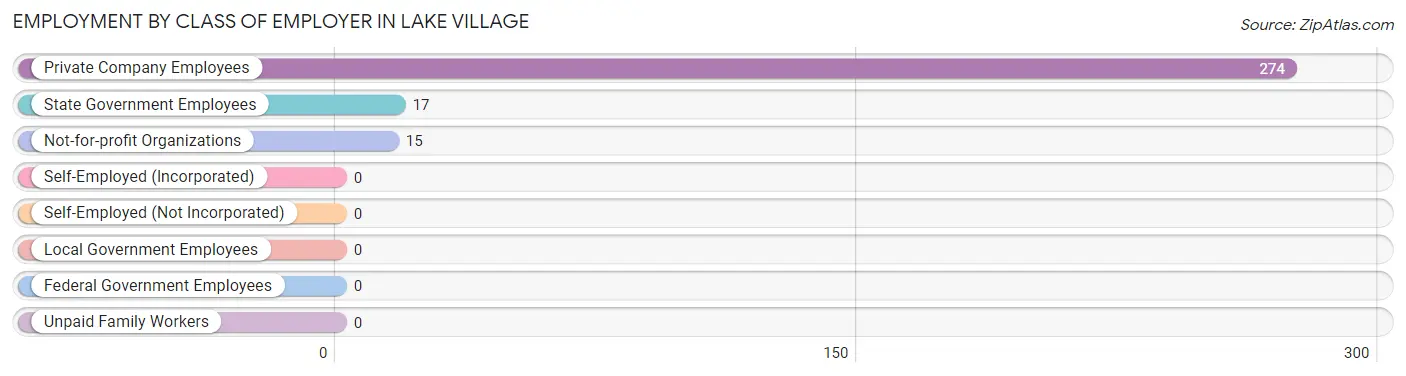
Employment by Class of Employer in Lake Village
Among the 306 employed individuals in Lake Village, private company employees (274 | 89.5%), state government employees (17 | 5.6%), and not-for-profit organizations (15 | 4.9%) make up the most common classes of employment.
| Employer Class | # Employees | % Employees |
| Private Company Employees | 274 | 89.5% |
| Self-Employed (Incorporated) | 0 | 0.0% |
| Self-Employed (Not Incorporated) | 0 | 0.0% |
| Not-for-profit Organizations | 15 | 4.9% |
| Local Government Employees | 0 | 0.0% |
| State Government Employees | 17 | 5.6% |
| Federal Government Employees | 0 | 0.0% |
| Unpaid Family Workers | 0 | 0.0% |
| Total | 306 | 100.0% |
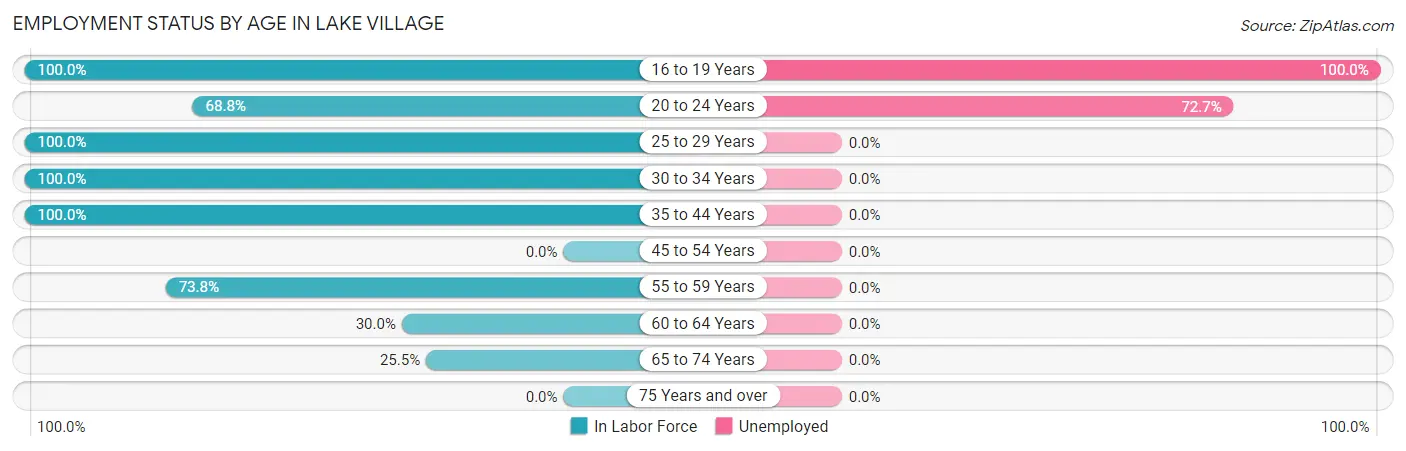
Employment Status by Age in Lake Village
According to the labor force statistics for Lake Village, out of the total population over 16 years of age (560), 61.6% or 345 individuals are in the labor force, with 11.3% or 39 of them unemployed. The age group with the highest labor force participation rate is 16 to 19 years, with 100.0% or 15 individuals in the labor force. Within the labor force, the 16 to 19 years age range has the highest percentage of unemployed individuals, with 100.0% or 15 of them being unemployed.
| Age Bracket | In Labor Force | Unemployed |
| 16 to 19 Years | 15 (100.0%) | 15 (100.0%) |
| 20 to 24 Years | 33 (68.8%) | 24 (72.7%) |
| 25 to 29 Years | 89 (100.0%) | 0 (0.0%) |
| 30 to 34 Years | 72 (100.0%) | 0 (0.0%) |
| 35 to 44 Years | 25 (100.0%) | 0 (0.0%) |
| 45 to 54 Years | 0 (0.0%) | 0 (0.0%) |
| 55 to 59 Years | 48 (73.8%) | 0 (0.0%) |
| 60 to 64 Years | 24 (30.0%) | 0 (0.0%) |
| 65 to 74 Years | 39 (25.5%) | 0 (0.0%) |
| 75 Years and over | 0 (0.0%) | 0 (0.0%) |
| Total | 345 (61.6%) | 39 (11.3%) |
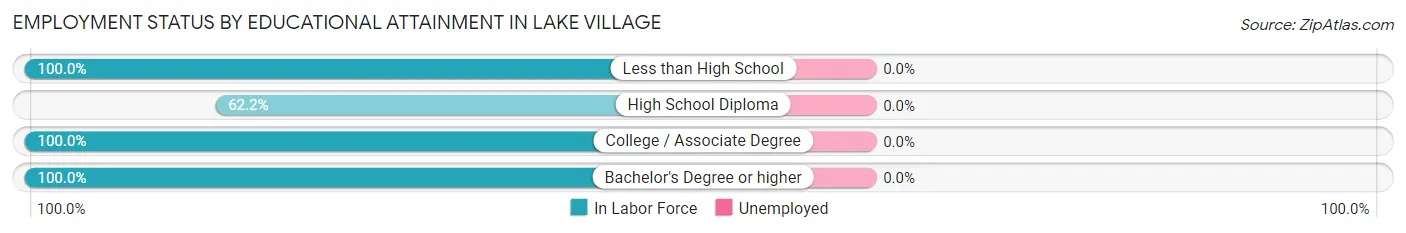
Employment Status by Educational Attainment in Lake Village
| Educational Attainment | In Labor Force | Unemployed |
| Less than High School | 24 (100.0%) | 0 (0.0%) |
| High School Diploma | 120 (62.2%) | 0 (0.0%) |
| College / Associate Degree | 53 (100.0%) | 0 (0.0%) |
| Bachelor's Degree or higher | 61 (100.0%) | 0 (0.0%) |
| Total | 258 (77.9%) | 0 (0.0%) |
Employment Occupations by Sex in Lake Village
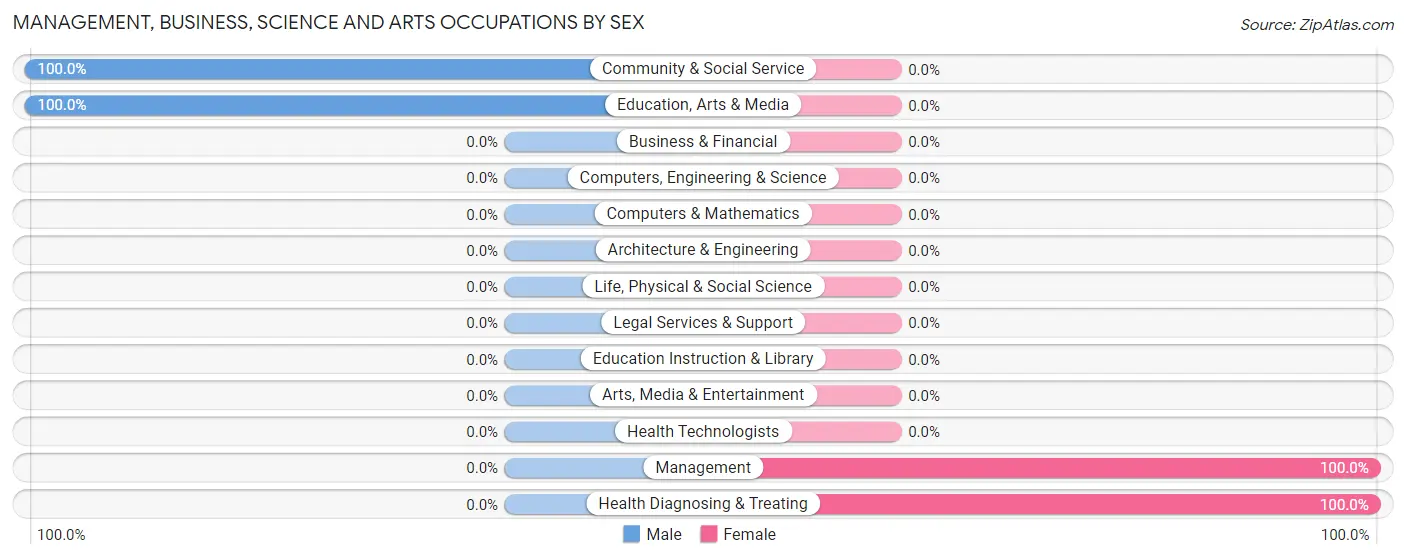
Management, Business, Science and Arts Occupations
The most common Management, Business, Science and Arts occupations in Lake Village are Health Diagnosing & Treating (38 | 12.4%), Management (17 | 5.6%), Community & Social Service (15 | 4.9%), and Education, Arts & Media (15 | 4.9%).
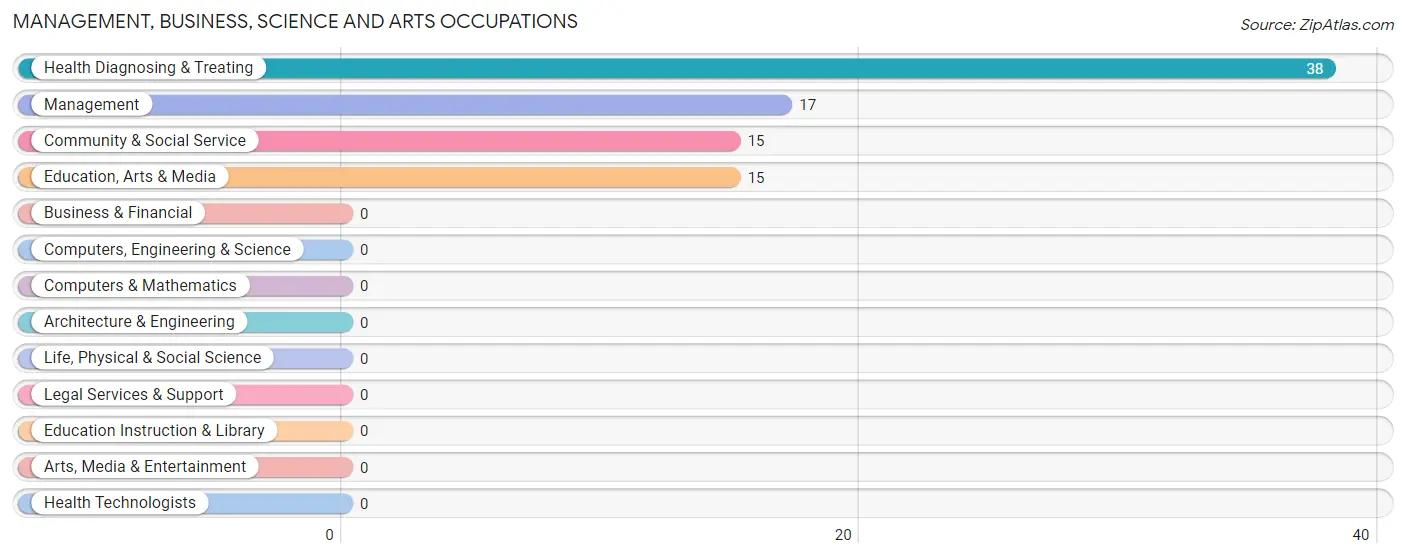
Management, Business, Science and Arts Occupations by Sex
Within the Management, Business, Science and Arts occupations in Lake Village, the most male-oriented occupations are Community & Social Service (100.0%), and Education, Arts & Media (100.0%), while the most female-oriented occupations are Management (100.0%), and Health Diagnosing & Treating (100.0%).
| Occupation | Male | Female |
| Management | 0 (0.0%) | 17 (100.0%) |
| Business & Financial | 0 (0.0%) | 0 (0.0%) |
| Computers, Engineering & Science | 0 (0.0%) | 0 (0.0%) |
| Computers & Mathematics | 0 (0.0%) | 0 (0.0%) |
| Architecture & Engineering | 0 (0.0%) | 0 (0.0%) |
| Life, Physical & Social Science | 0 (0.0%) | 0 (0.0%) |
| Community & Social Service | 15 (100.0%) | 0 (0.0%) |
| Education, Arts & Media | 15 (100.0%) | 0 (0.0%) |
| Legal Services & Support | 0 (0.0%) | 0 (0.0%) |
| Education Instruction & Library | 0 (0.0%) | 0 (0.0%) |
| Arts, Media & Entertainment | 0 (0.0%) | 0 (0.0%) |
| Health Diagnosing & Treating | 0 (0.0%) | 38 (100.0%) |
| Health Technologists | 0 (0.0%) | 0 (0.0%) |
| Total (Category) | 15 (21.4%) | 55 (78.6%) |
| Total (Overall) | 148 (48.4%) | 158 (51.6%) |
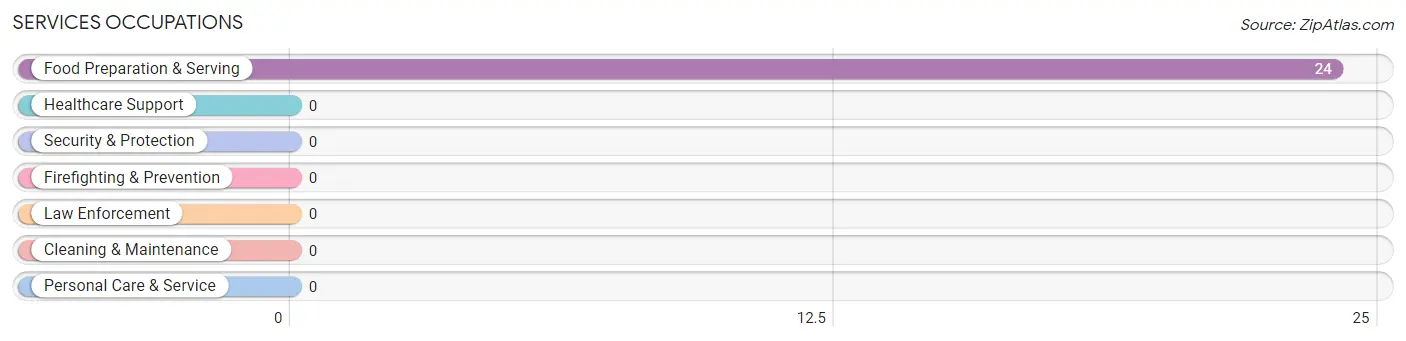
Services Occupations
The most common Services occupations in Lake Village are , and Food Preparation & Serving (24 | 7.8%).
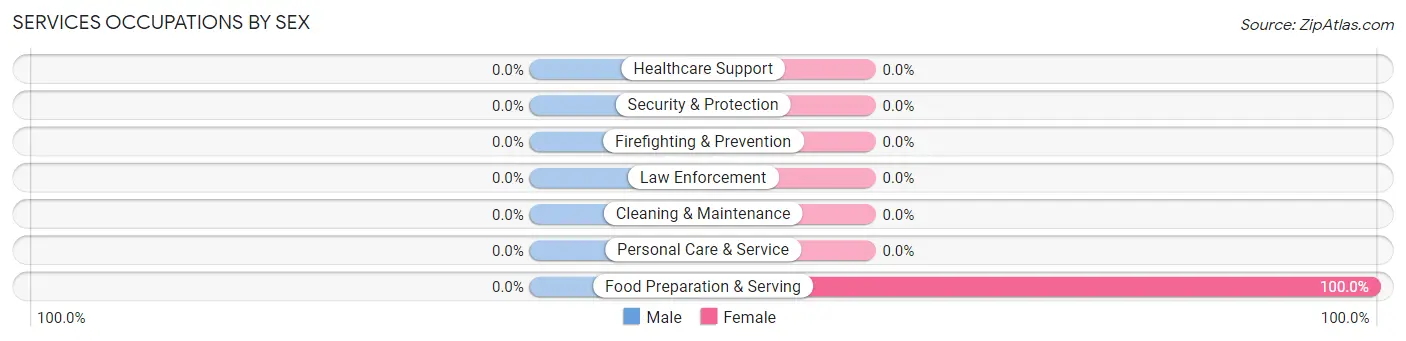
Services Occupations by Sex
| Occupation | Male | Female |
| Healthcare Support | 0 (0.0%) | 0 (0.0%) |
| Security & Protection | 0 (0.0%) | 0 (0.0%) |
| Firefighting & Prevention | 0 (0.0%) | 0 (0.0%) |
| Law Enforcement | 0 (0.0%) | 0 (0.0%) |
| Food Preparation & Serving | 0 (0.0%) | 24 (100.0%) |
| Cleaning & Maintenance | 0 (0.0%) | 0 (0.0%) |
| Personal Care & Service | 0 (0.0%) | 0 (0.0%) |
| Total (Category) | 0 (0.0%) | 24 (100.0%) |
| Total (Overall) | 148 (48.4%) | 158 (51.6%) |
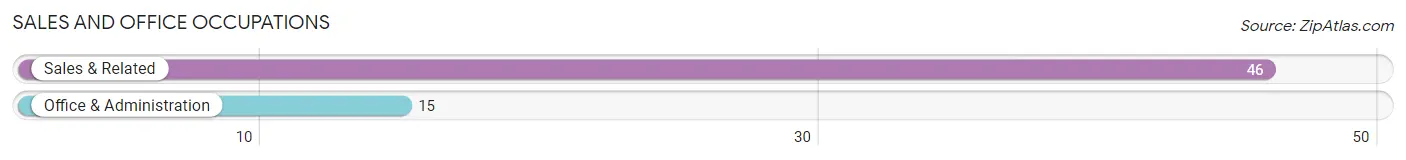
Sales and Office Occupations
The most common Sales and Office occupations in Lake Village are Sales & Related (46 | 15.0%), and Office & Administration (15 | 4.9%).
Sales and Office Occupations by Sex
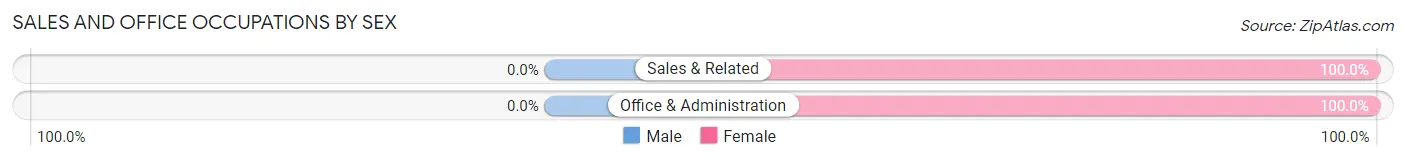
| Occupation | Male | Female |
| Sales & Related | 0 (0.0%) | 46 (100.0%) |
| Office & Administration | 0 (0.0%) | 15 (100.0%) |
| Total (Category) | 0 (0.0%) | 61 (100.0%) |
| Total (Overall) | 148 (48.4%) | 158 (51.6%) |
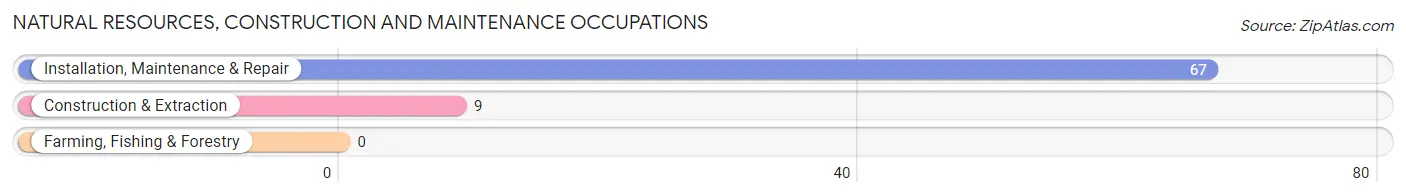
Natural Resources, Construction and Maintenance Occupations
The most common Natural Resources, Construction and Maintenance occupations in Lake Village are Installation, Maintenance & Repair (67 | 21.9%), and Construction & Extraction (9 | 2.9%).
Natural Resources, Construction and Maintenance Occupations by Sex
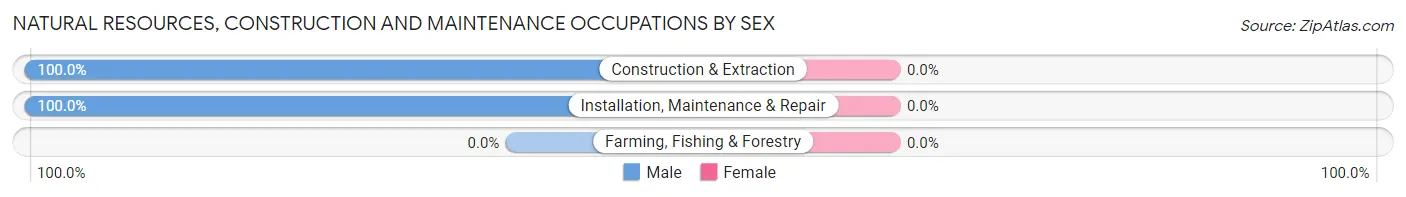
| Occupation | Male | Female |
| Farming, Fishing & Forestry | 0 (0.0%) | 0 (0.0%) |
| Construction & Extraction | 9 (100.0%) | 0 (0.0%) |
| Installation, Maintenance & Repair | 67 (100.0%) | 0 (0.0%) |
| Total (Category) | 76 (100.0%) | 0 (0.0%) |
| Total (Overall) | 148 (48.4%) | 158 (51.6%) |
Production, Transportation and Moving Occupations
The most common Production, Transportation and Moving occupations in Lake Village are Production (65 | 21.2%), and Transportation (10 | 3.3%).
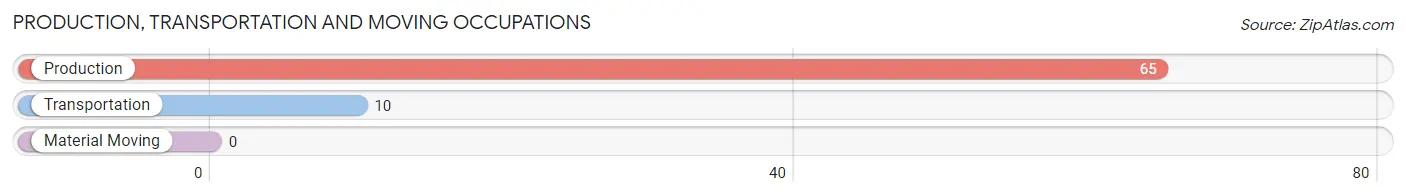
Production, Transportation and Moving Occupations by Sex
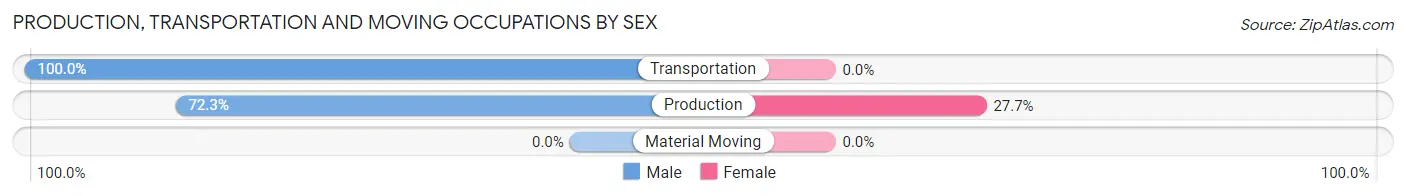
| Occupation | Male | Female |
| Production | 47 (72.3%) | 18 (27.7%) |
| Transportation | 10 (100.0%) | 0 (0.0%) |
| Material Moving | 0 (0.0%) | 0 (0.0%) |
| Total (Category) | 57 (76.0%) | 18 (24.0%) |
| Total (Overall) | 148 (48.4%) | 158 (51.6%) |
Employment Industries by Sex in Lake Village
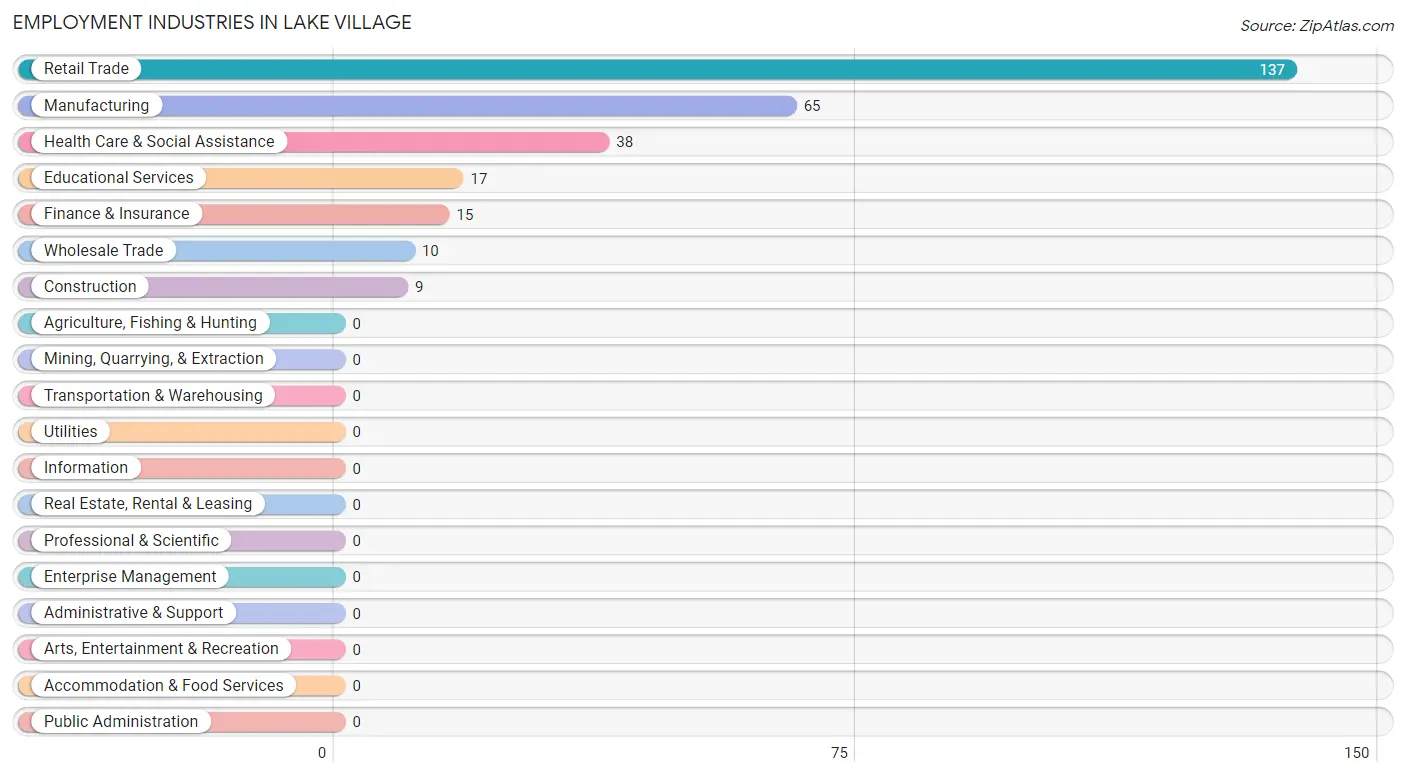
Employment Industries in Lake Village
The major employment industries in Lake Village include Retail Trade (137 | 44.8%), Manufacturing (65 | 21.2%), Health Care & Social Assistance (38 | 12.4%), Educational Services (17 | 5.6%), and Finance & Insurance (15 | 4.9%).
Employment Industries by Sex in Lake Village
The Lake Village industries that see more men than women are Construction (100.0%), Wholesale Trade (100.0%), and Manufacturing (72.3%), whereas the industries that tend to have a higher number of women are Finance & Insurance (100.0%), Educational Services (100.0%), and Health Care & Social Assistance (100.0%).
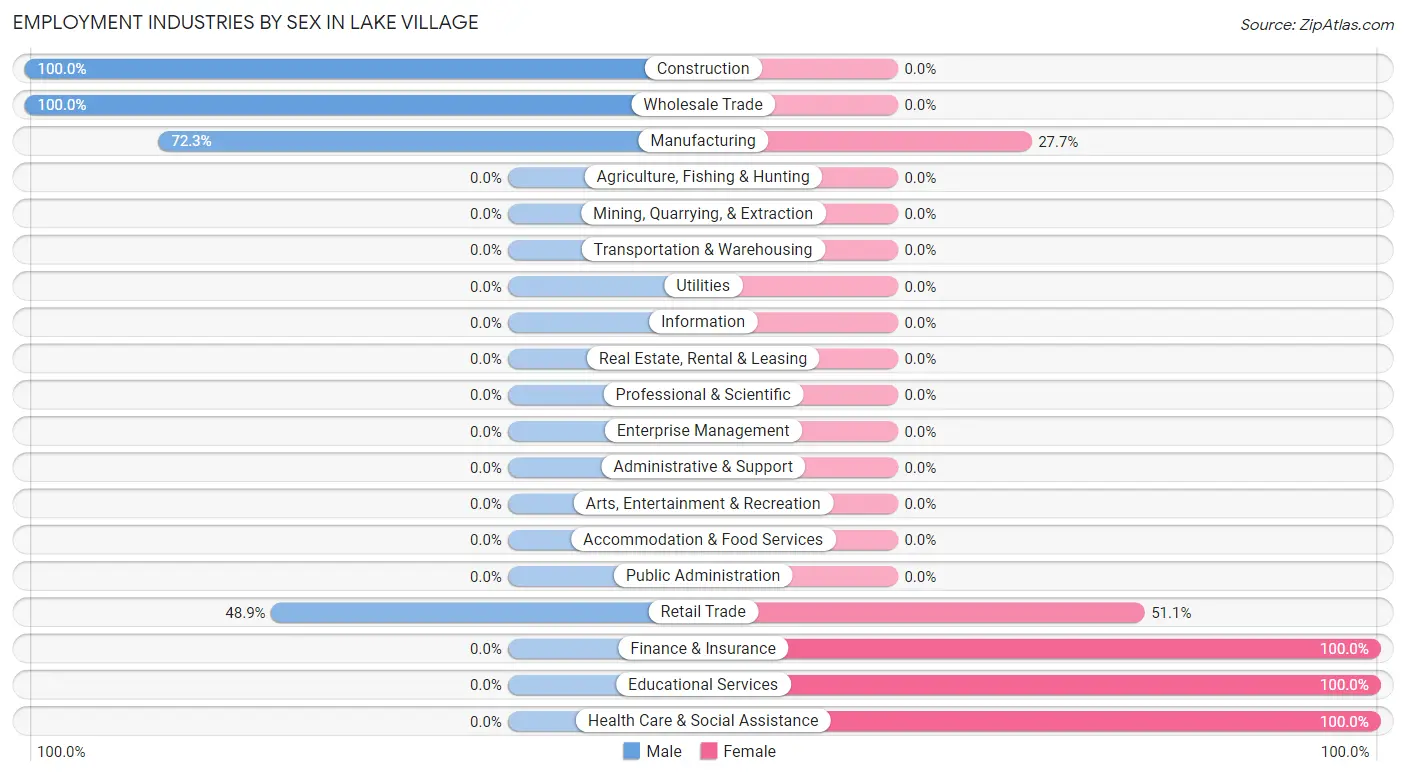
| Industry | Male | Female |
| Agriculture, Fishing & Hunting | 0 (0.0%) | 0 (0.0%) |
| Mining, Quarrying, & Extraction | 0 (0.0%) | 0 (0.0%) |
| Construction | 9 (100.0%) | 0 (0.0%) |
| Manufacturing | 47 (72.3%) | 18 (27.7%) |
| Wholesale Trade | 10 (100.0%) | 0 (0.0%) |
| Retail Trade | 67 (48.9%) | 70 (51.1%) |
| Transportation & Warehousing | 0 (0.0%) | 0 (0.0%) |
| Utilities | 0 (0.0%) | 0 (0.0%) |
| Information | 0 (0.0%) | 0 (0.0%) |
| Finance & Insurance | 0 (0.0%) | 15 (100.0%) |
| Real Estate, Rental & Leasing | 0 (0.0%) | 0 (0.0%) |
| Professional & Scientific | 0 (0.0%) | 0 (0.0%) |
| Enterprise Management | 0 (0.0%) | 0 (0.0%) |
| Administrative & Support | 0 (0.0%) | 0 (0.0%) |
| Educational Services | 0 (0.0%) | 17 (100.0%) |
| Health Care & Social Assistance | 0 (0.0%) | 38 (100.0%) |
| Arts, Entertainment & Recreation | 0 (0.0%) | 0 (0.0%) |
| Accommodation & Food Services | 0 (0.0%) | 0 (0.0%) |
| Public Administration | 0 (0.0%) | 0 (0.0%) |
| Total | 148 (48.4%) | 158 (51.6%) |
Education in Lake Village
School Enrollment in Lake Village
The most common levels of schooling among the 65 students in Lake Village are graduate / professional (46 | 70.8%), and kindergarten (19 | 29.2%).
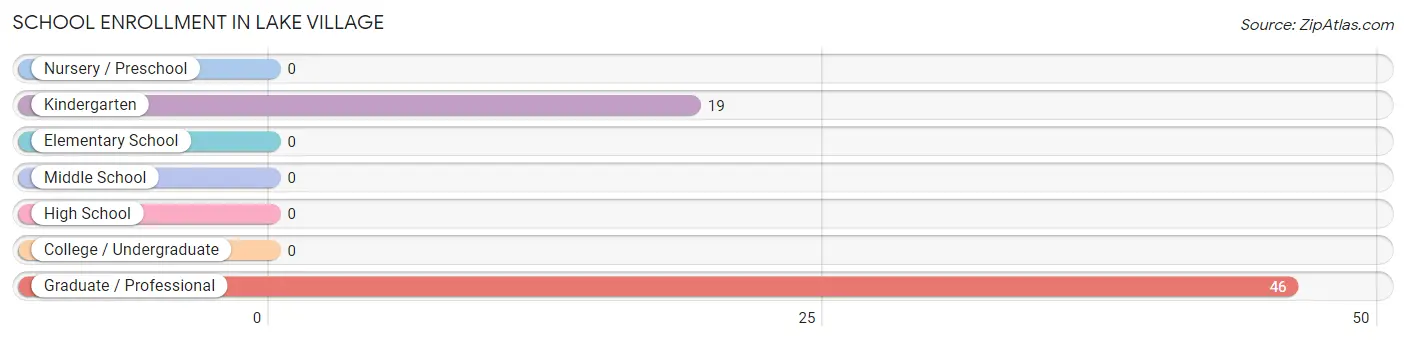
| School Level | # Students | % Students |
| Nursery / Preschool | 0 | 0.0% |
| Kindergarten | 19 | 29.2% |
| Elementary School | 0 | 0.0% |
| Middle School | 0 | 0.0% |
| High School | 0 | 0.0% |
| College / Undergraduate | 0 | 0.0% |
| Graduate / Professional | 46 | 70.8% |
| Total | 65 | 100.0% |
School Enrollment by Age by Funding Source in Lake Village
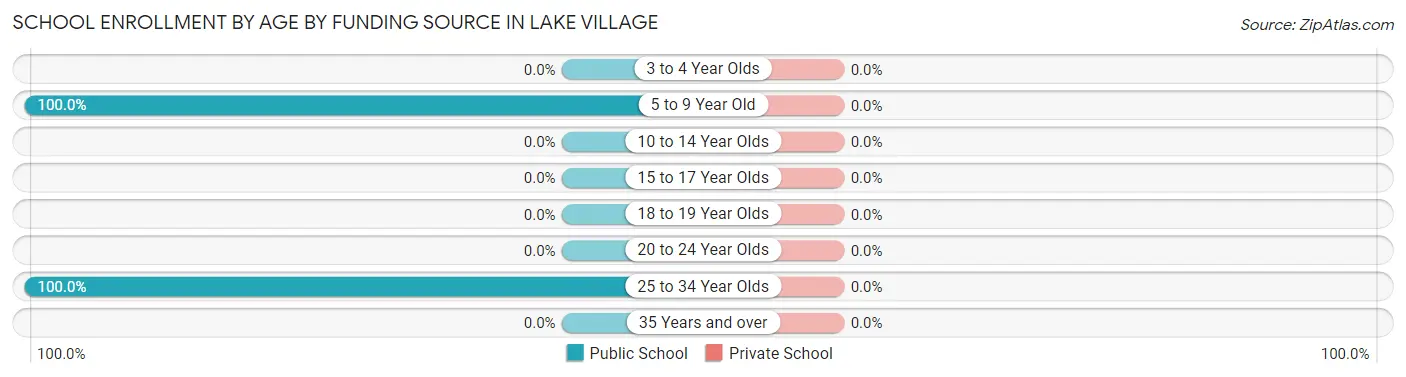
| Age Bracket | Public School | Private School |
| 3 to 4 Year Olds | 0 (0.0%) | 0 (0.0%) |
| 5 to 9 Year Old | 19 (100.0%) | 0 (0.0%) |
| 10 to 14 Year Olds | 0 (0.0%) | 0 (0.0%) |
| 15 to 17 Year Olds | 0 (0.0%) | 0 (0.0%) |
| 18 to 19 Year Olds | 0 (0.0%) | 0 (0.0%) |
| 20 to 24 Year Olds | 0 (0.0%) | 0 (0.0%) |
| 25 to 34 Year Olds | 46 (100.0%) | 0 (0.0%) |
| 35 Years and over | 0 (0.0%) | 0 (0.0%) |
| Total | 65 (100.0%) | 0 (0.0%) |
Educational Attainment by Field of Study in Lake Village
Education (46 | 59.0%), business (17 | 21.8%), and liberal arts & history (15 | 19.2%) are the most common fields of study among 78 individuals in Lake Village who have obtained a bachelor's degree or higher.
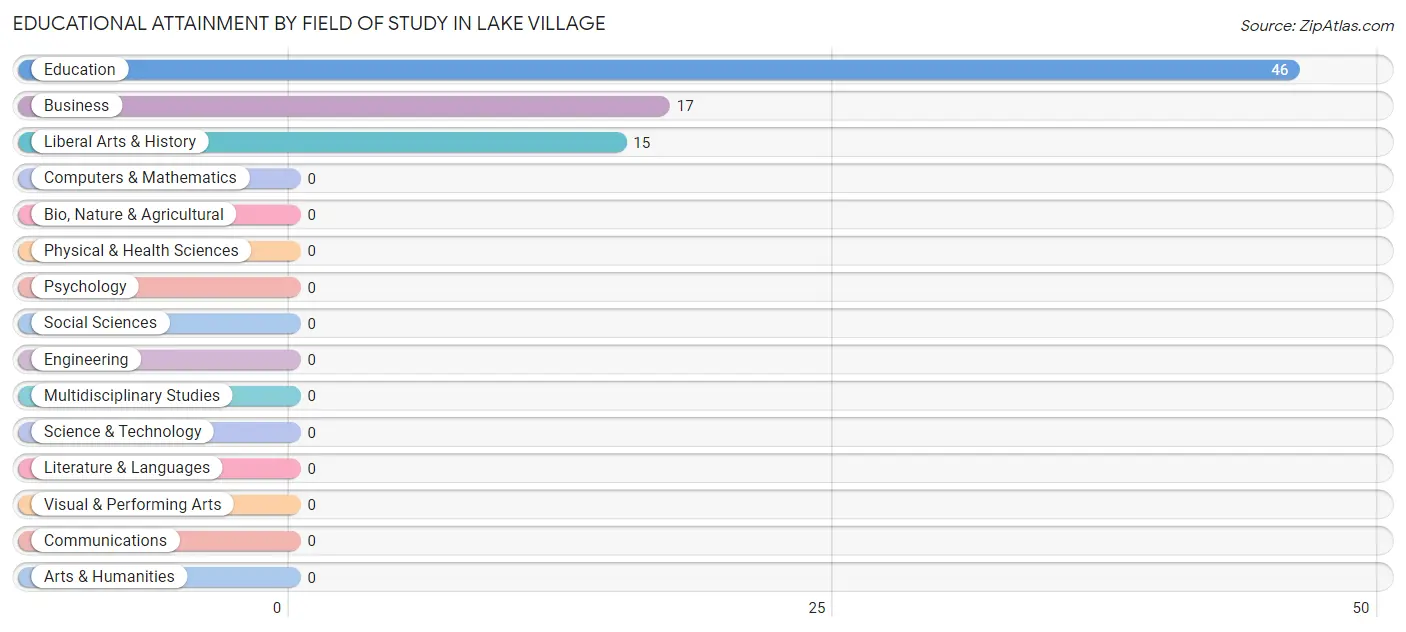
| Field of Study | # Graduates | % Graduates |
| Computers & Mathematics | 0 | 0.0% |
| Bio, Nature & Agricultural | 0 | 0.0% |
| Physical & Health Sciences | 0 | 0.0% |
| Psychology | 0 | 0.0% |
| Social Sciences | 0 | 0.0% |
| Engineering | 0 | 0.0% |
| Multidisciplinary Studies | 0 | 0.0% |
| Science & Technology | 0 | 0.0% |
| Business | 17 | 21.8% |
| Education | 46 | 59.0% |
| Literature & Languages | 0 | 0.0% |
| Liberal Arts & History | 15 | 19.2% |
| Visual & Performing Arts | 0 | 0.0% |
| Communications | 0 | 0.0% |
| Arts & Humanities | 0 | 0.0% |
| Total | 78 | 100.0% |
Transportation & Commute in Lake Village
Vehicle Availability by Sex in Lake Village
The most prevalent vehicle ownership categories in Lake Village are males with 2 vehicles (55, accounting for 37.2%) and females with 2 vehicles (87, making up 34.8%).
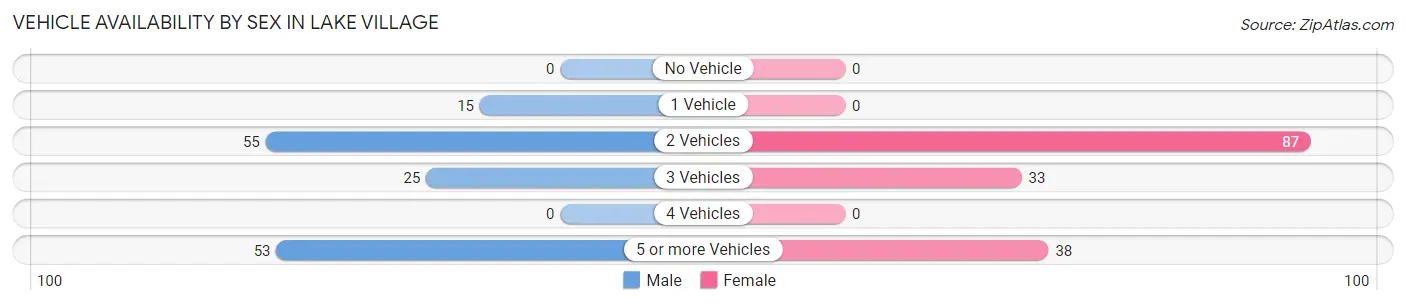
| Vehicles Available | Male | Female |
| No Vehicle | 0 (0.0%) | 0 (0.0%) |
| 1 Vehicle | 15 (10.1%) | 0 (0.0%) |
| 2 Vehicles | 55 (37.2%) | 87 (55.1%) |
| 3 Vehicles | 25 (16.9%) | 33 (20.9%) |
| 4 Vehicles | 0 (0.0%) | 0 (0.0%) |
| 5 or more Vehicles | 53 (35.8%) | 38 (24.0%) |
| Total | 148 (100.0%) | 158 (100.0%) |
Commute Time in Lake Village
The most frequently occuring commute durations in Lake Village are 45 to 59 minutes (91 commuters, 33.2%), 15 to 19 minutes (53 commuters, 19.3%), and 40 to 44 minutes (46 commuters, 16.8%).
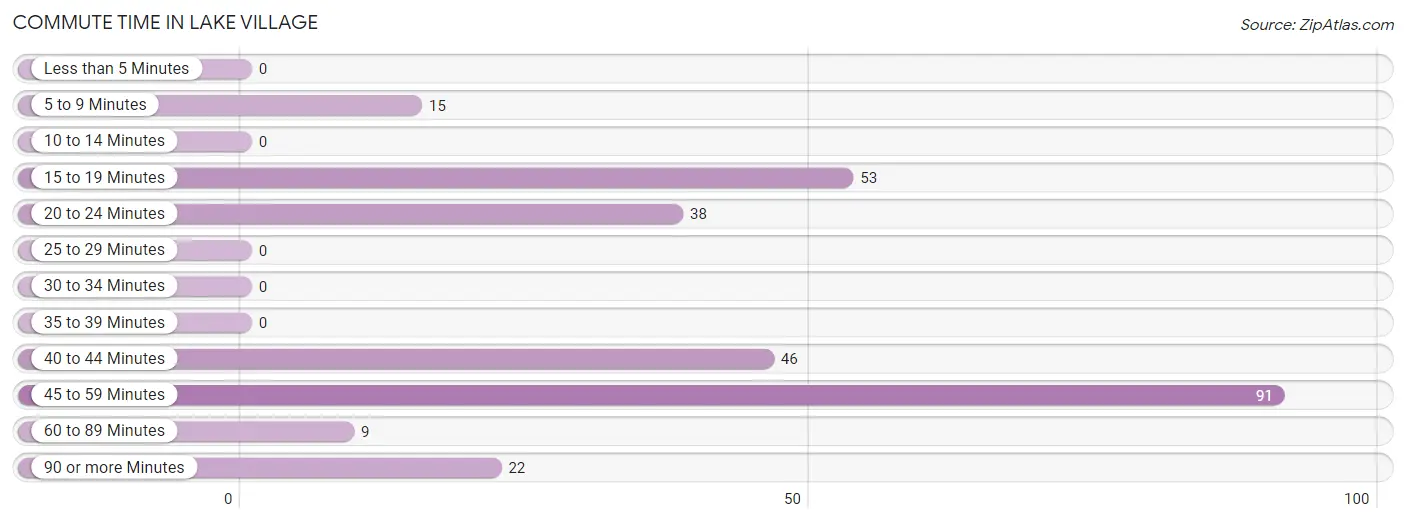
| Commute Time | # Commuters | % Commuters |
| Less than 5 Minutes | 0 | 0.0% |
| 5 to 9 Minutes | 15 | 5.5% |
| 10 to 14 Minutes | 0 | 0.0% |
| 15 to 19 Minutes | 53 | 19.3% |
| 20 to 24 Minutes | 38 | 13.9% |
| 25 to 29 Minutes | 0 | 0.0% |
| 30 to 34 Minutes | 0 | 0.0% |
| 35 to 39 Minutes | 0 | 0.0% |
| 40 to 44 Minutes | 46 | 16.8% |
| 45 to 59 Minutes | 91 | 33.2% |
| 60 to 89 Minutes | 9 | 3.3% |
| 90 or more Minutes | 22 | 8.0% |
Commute Time by Sex in Lake Village
The most common commute times in Lake Village are 45 to 59 minutes (67 commuters, 45.3%) for males and 40 to 44 minutes (46 commuters, 36.5%) for females.
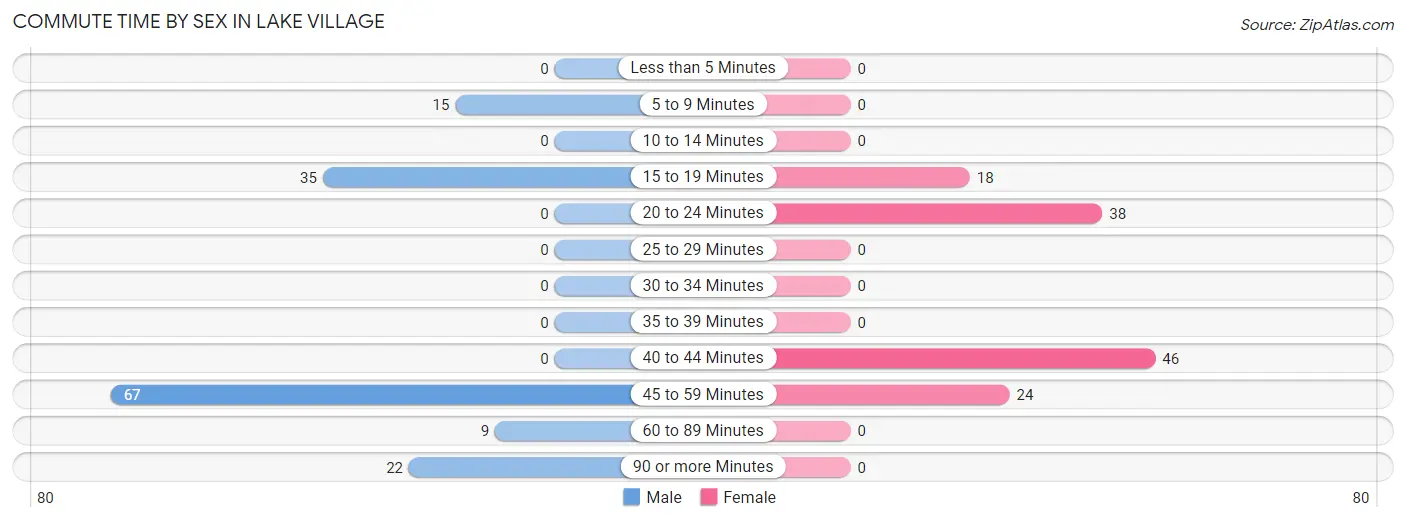
| Commute Time | Male | Female |
| Less than 5 Minutes | 0 (0.0%) | 0 (0.0%) |
| 5 to 9 Minutes | 15 (10.1%) | 0 (0.0%) |
| 10 to 14 Minutes | 0 (0.0%) | 0 (0.0%) |
| 15 to 19 Minutes | 35 (23.6%) | 18 (14.3%) |
| 20 to 24 Minutes | 0 (0.0%) | 38 (30.2%) |
| 25 to 29 Minutes | 0 (0.0%) | 0 (0.0%) |
| 30 to 34 Minutes | 0 (0.0%) | 0 (0.0%) |
| 35 to 39 Minutes | 0 (0.0%) | 0 (0.0%) |
| 40 to 44 Minutes | 0 (0.0%) | 46 (36.5%) |
| 45 to 59 Minutes | 67 (45.3%) | 24 (19.1%) |
| 60 to 89 Minutes | 9 (6.1%) | 0 (0.0%) |
| 90 or more Minutes | 22 (14.9%) | 0 (0.0%) |
Time of Departure to Work by Sex in Lake Village
The most frequent times of departure to work in Lake Village are 5:00 AM to 5:29 AM (58, 39.2%) for males and 6:30 AM to 6:59 AM (46, 36.5%) for females.
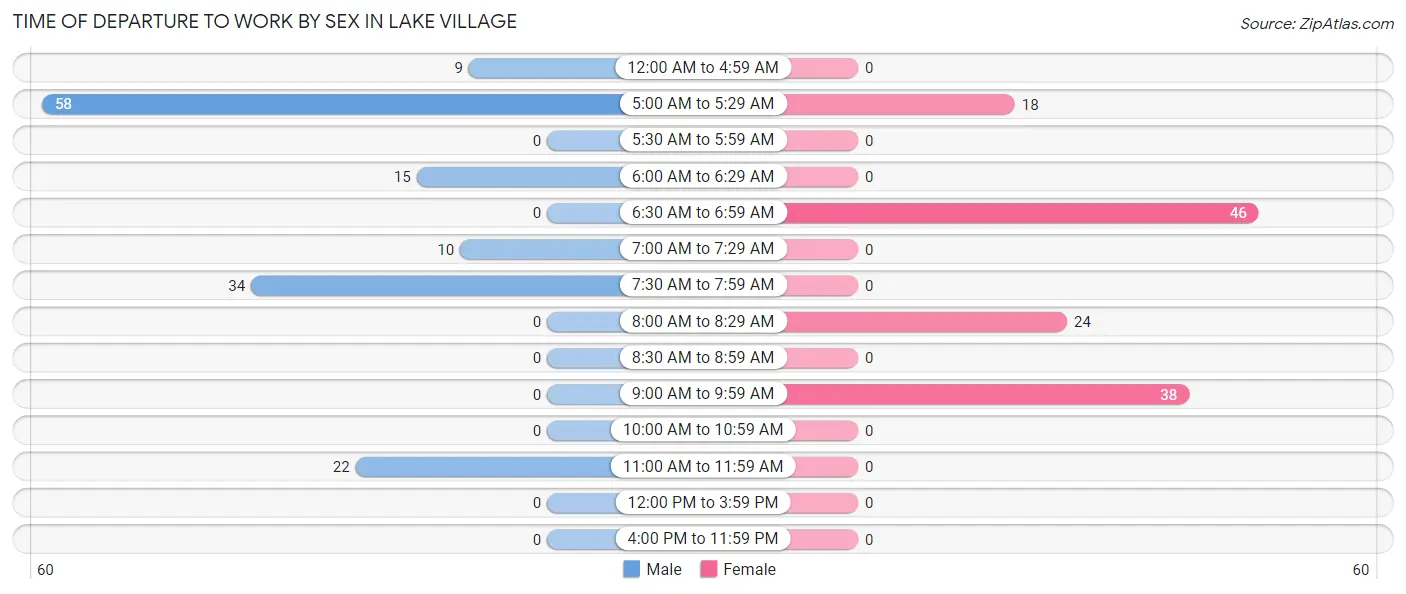
| Time of Departure | Male | Female |
| 12:00 AM to 4:59 AM | 9 (6.1%) | 0 (0.0%) |
| 5:00 AM to 5:29 AM | 58 (39.2%) | 18 (14.3%) |
| 5:30 AM to 5:59 AM | 0 (0.0%) | 0 (0.0%) |
| 6:00 AM to 6:29 AM | 15 (10.1%) | 0 (0.0%) |
| 6:30 AM to 6:59 AM | 0 (0.0%) | 46 (36.5%) |
| 7:00 AM to 7:29 AM | 10 (6.8%) | 0 (0.0%) |
| 7:30 AM to 7:59 AM | 34 (23.0%) | 0 (0.0%) |
| 8:00 AM to 8:29 AM | 0 (0.0%) | 24 (19.1%) |
| 8:30 AM to 8:59 AM | 0 (0.0%) | 0 (0.0%) |
| 9:00 AM to 9:59 AM | 0 (0.0%) | 38 (30.2%) |
| 10:00 AM to 10:59 AM | 0 (0.0%) | 0 (0.0%) |
| 11:00 AM to 11:59 AM | 22 (14.9%) | 0 (0.0%) |
| 12:00 PM to 3:59 PM | 0 (0.0%) | 0 (0.0%) |
| 4:00 PM to 11:59 PM | 0 (0.0%) | 0 (0.0%) |
| Total | 148 (100.0%) | 126 (100.0%) |
Housing Occupancy in Lake Village
Occupancy by Ownership in Lake Village
Of the total 295 dwellings in Lake Village, owner-occupied units account for 209 (70.9%), while renter-occupied units make up 86 (29.1%).
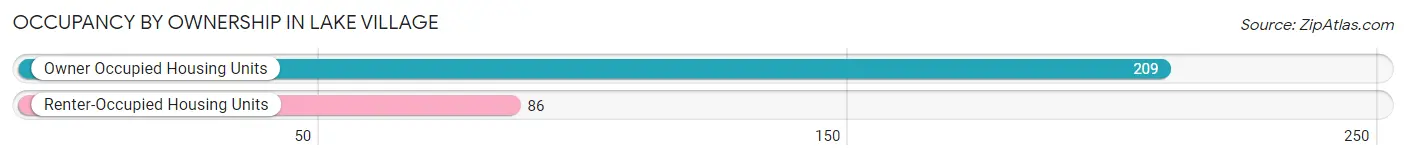
| Occupancy | # Housing Units | % Housing Units |
| Owner Occupied Housing Units | 209 | 70.9% |
| Renter-Occupied Housing Units | 86 | 29.1% |
| Total Occupied Housing Units | 295 | 100.0% |
Occupancy by Household Size in Lake Village
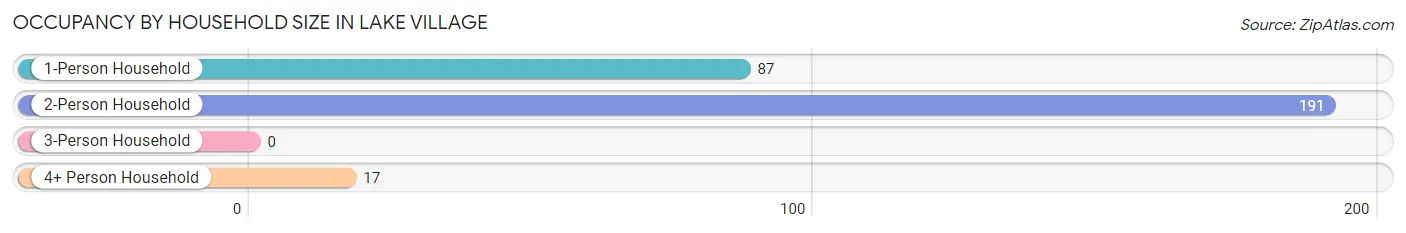
| Household Size | # Housing Units | % Housing Units |
| 1-Person Household | 87 | 29.5% |
| 2-Person Household | 191 | 64.7% |
| 3-Person Household | 0 | 0.0% |
| 4+ Person Household | 17 | 5.8% |
| Total Housing Units | 295 | 100.0% |
Occupancy by Ownership by Household Size in Lake Village
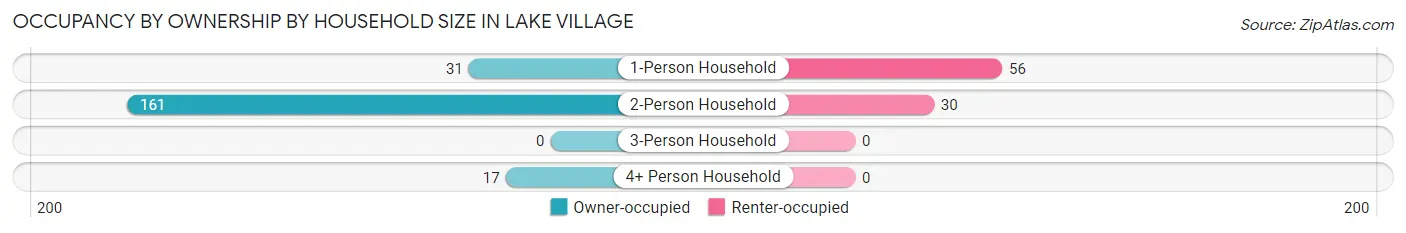
| Household Size | Owner-occupied | Renter-occupied |
| 1-Person Household | 31 (35.6%) | 56 (64.4%) |
| 2-Person Household | 161 (84.3%) | 30 (15.7%) |
| 3-Person Household | 0 (0.0%) | 0 (0.0%) |
| 4+ Person Household | 17 (100.0%) | 0 (0.0%) |
| Total Housing Units | 209 (70.9%) | 86 (29.1%) |
Occupancy by Educational Attainment in Lake Village
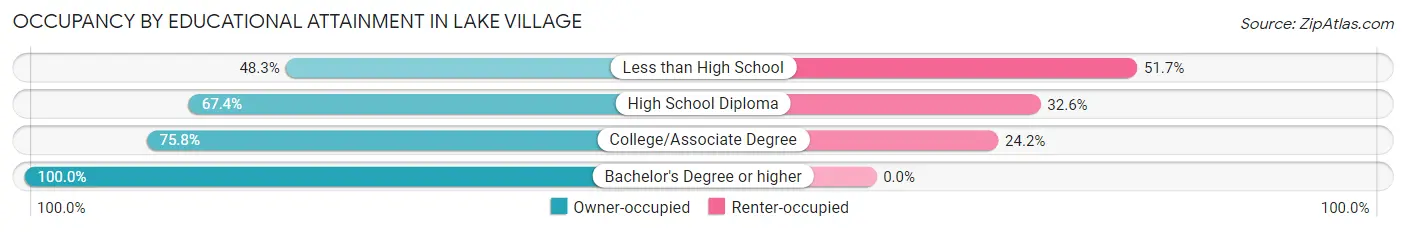
| Household Size | Owner-occupied | Renter-occupied |
| Less than High School | 14 (48.3%) | 15 (51.7%) |
| High School Diploma | 116 (67.4%) | 56 (32.6%) |
| College/Associate Degree | 47 (75.8%) | 15 (24.2%) |
| Bachelor's Degree or higher | 32 (100.0%) | 0 (0.0%) |
Occupancy by Age of Householder in Lake Village
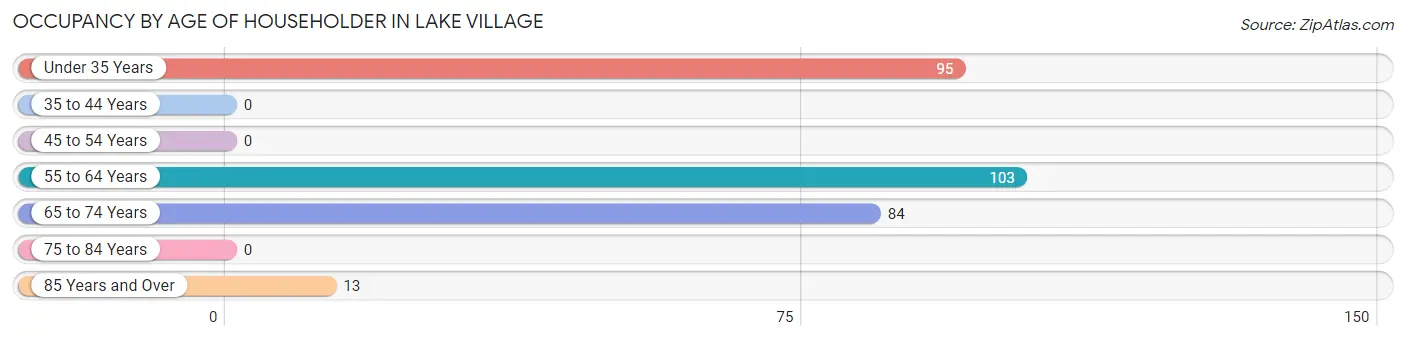
| Age Bracket | # Households | % Households |
| Under 35 Years | 95 | 32.2% |
| 35 to 44 Years | 0 | 0.0% |
| 45 to 54 Years | 0 | 0.0% |
| 55 to 64 Years | 103 | 34.9% |
| 65 to 74 Years | 84 | 28.5% |
| 75 to 84 Years | 0 | 0.0% |
| 85 Years and Over | 13 | 4.4% |
| Total | 295 | 100.0% |
Housing Finances in Lake Village
Median Income by Occupancy in Lake Village

| Occupancy Type | # Households | Median Income |
| Owner-Occupied | 209 (70.9%) | $110,033 |
| Renter-Occupied | 86 (29.1%) | $2,499 |
| Average | 295 (100.0%) | $0 |
Occupancy by Householder Income Bracket in Lake Village
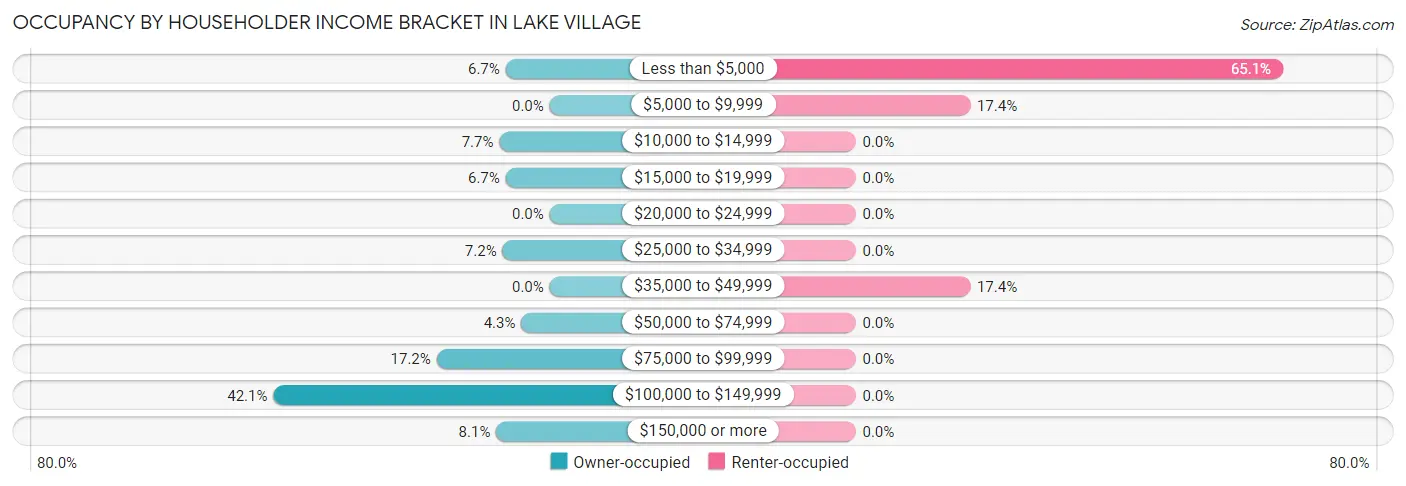
| Income Bracket | Owner-occupied | Renter-occupied |
| Less than $5,000 | 14 (6.7%) | 56 (65.1%) |
| $5,000 to $9,999 | 0 (0.0%) | 15 (17.4%) |
| $10,000 to $14,999 | 16 (7.7%) | 0 (0.0%) |
| $15,000 to $19,999 | 14 (6.7%) | 0 (0.0%) |
| $20,000 to $24,999 | 0 (0.0%) | 0 (0.0%) |
| $25,000 to $34,999 | 15 (7.2%) | 0 (0.0%) |
| $35,000 to $49,999 | 0 (0.0%) | 15 (17.4%) |
| $50,000 to $74,999 | 9 (4.3%) | 0 (0.0%) |
| $75,000 to $99,999 | 36 (17.2%) | 0 (0.0%) |
| $100,000 to $149,999 | 88 (42.1%) | 0 (0.0%) |
| $150,000 or more | 17 (8.1%) | 0 (0.0%) |
| Total | 209 (100.0%) | 86 (100.0%) |
Monthly Housing Cost Tiers in Lake Village
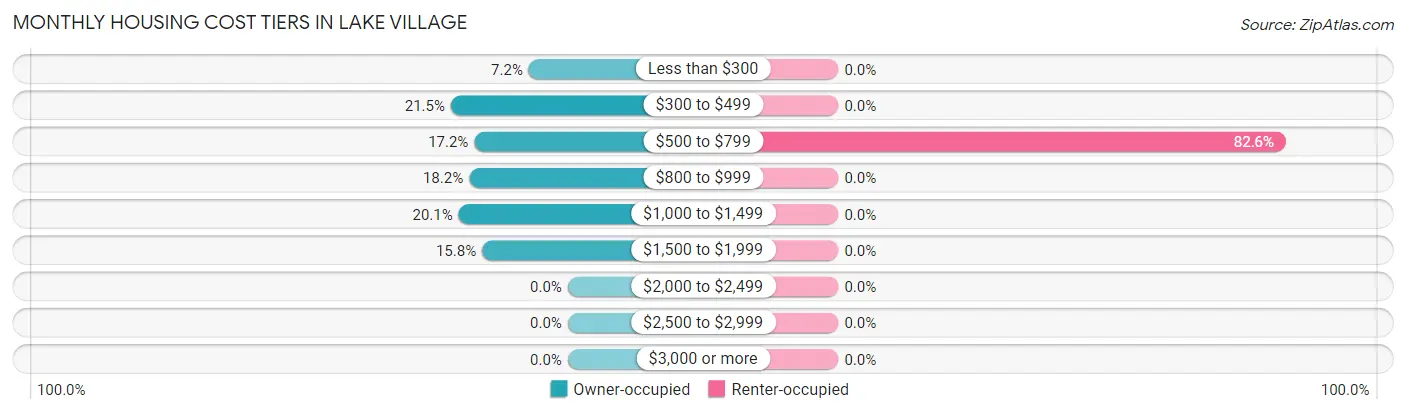
| Monthly Cost | Owner-occupied | Renter-occupied |
| Less than $300 | 15 (7.2%) | 0 (0.0%) |
| $300 to $499 | 45 (21.5%) | 0 (0.0%) |
| $500 to $799 | 36 (17.2%) | 71 (82.6%) |
| $800 to $999 | 38 (18.2%) | 0 (0.0%) |
| $1,000 to $1,499 | 42 (20.1%) | 0 (0.0%) |
| $1,500 to $1,999 | 33 (15.8%) | 0 (0.0%) |
| $2,000 to $2,499 | 0 (0.0%) | 0 (0.0%) |
| $2,500 to $2,999 | 0 (0.0%) | 0 (0.0%) |
| $3,000 or more | 0 (0.0%) | 0 (0.0%) |
| Total | 209 (100.0%) | 86 (100.0%) |
Physical Housing Characteristics in Lake Village
Housing Structures in Lake Village
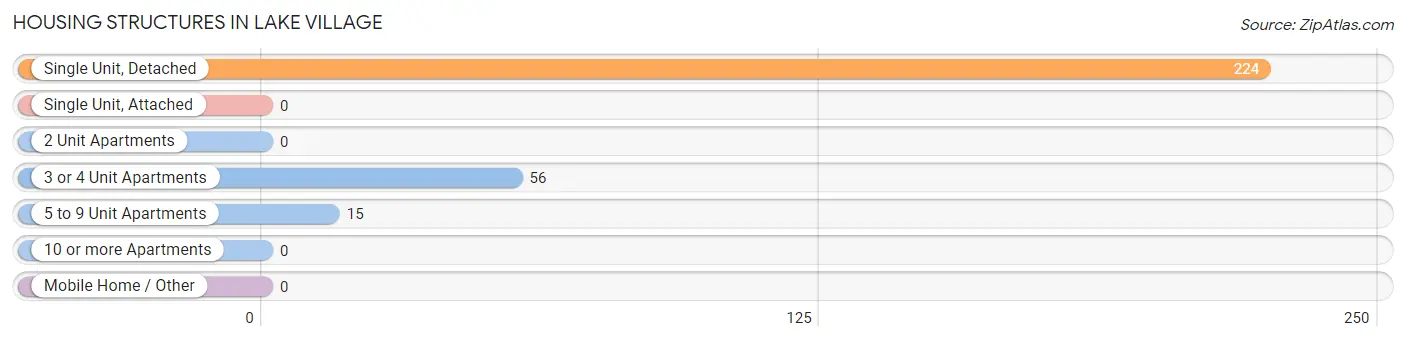
| Structure Type | # Housing Units | % Housing Units |
| Single Unit, Detached | 224 | 75.9% |
| Single Unit, Attached | 0 | 0.0% |
| 2 Unit Apartments | 0 | 0.0% |
| 3 or 4 Unit Apartments | 56 | 19.0% |
| 5 to 9 Unit Apartments | 15 | 5.1% |
| 10 or more Apartments | 0 | 0.0% |
| Mobile Home / Other | 0 | 0.0% |
| Total | 295 | 100.0% |
Housing Structures by Occupancy in Lake Village
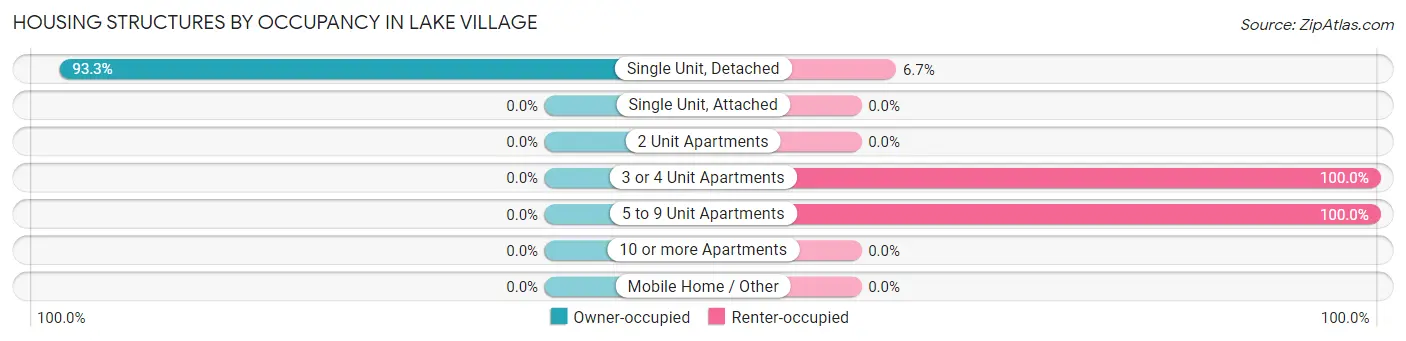
| Structure Type | Owner-occupied | Renter-occupied |
| Single Unit, Detached | 209 (93.3%) | 15 (6.7%) |
| Single Unit, Attached | 0 (0.0%) | 0 (0.0%) |
| 2 Unit Apartments | 0 (0.0%) | 0 (0.0%) |
| 3 or 4 Unit Apartments | 0 (0.0%) | 56 (100.0%) |
| 5 to 9 Unit Apartments | 0 (0.0%) | 15 (100.0%) |
| 10 or more Apartments | 0 (0.0%) | 0 (0.0%) |
| Mobile Home / Other | 0 (0.0%) | 0 (0.0%) |
| Total | 209 (70.9%) | 86 (29.1%) |
Housing Structures by Number of Rooms in Lake Village
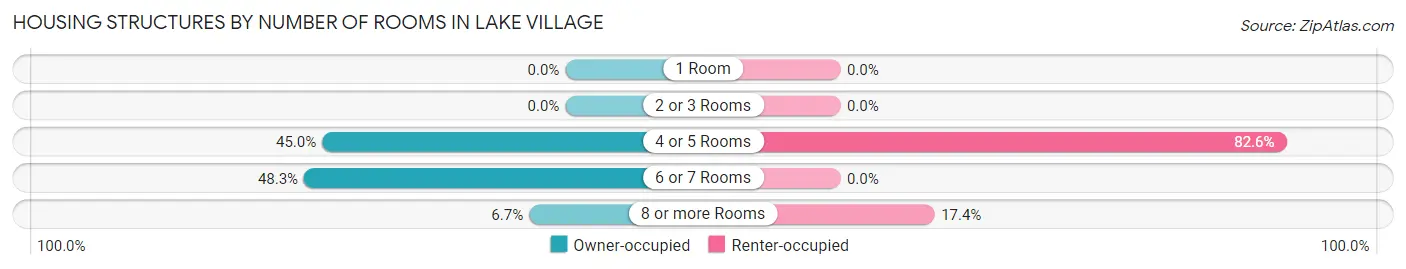
| Number of Rooms | Owner-occupied | Renter-occupied |
| 1 Room | 0 (0.0%) | 0 (0.0%) |
| 2 or 3 Rooms | 0 (0.0%) | 0 (0.0%) |
| 4 or 5 Rooms | 94 (45.0%) | 71 (82.6%) |
| 6 or 7 Rooms | 101 (48.3%) | 0 (0.0%) |
| 8 or more Rooms | 14 (6.7%) | 15 (17.4%) |
| Total | 209 (100.0%) | 86 (100.0%) |
Housing Structure by Heating Type in Lake Village
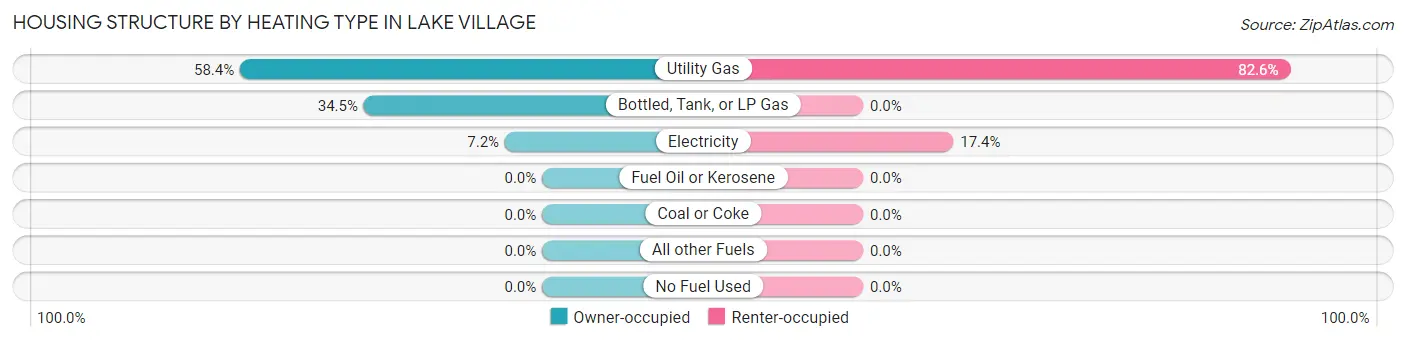
| Heating Type | Owner-occupied | Renter-occupied |
| Utility Gas | 122 (58.4%) | 71 (82.6%) |
| Bottled, Tank, or LP Gas | 72 (34.4%) | 0 (0.0%) |
| Electricity | 15 (7.2%) | 15 (17.4%) |
| Fuel Oil or Kerosene | 0 (0.0%) | 0 (0.0%) |
| Coal or Coke | 0 (0.0%) | 0 (0.0%) |
| All other Fuels | 0 (0.0%) | 0 (0.0%) |
| No Fuel Used | 0 (0.0%) | 0 (0.0%) |
| Total | 209 (100.0%) | 86 (100.0%) |
Household Vehicle Usage in Lake Village
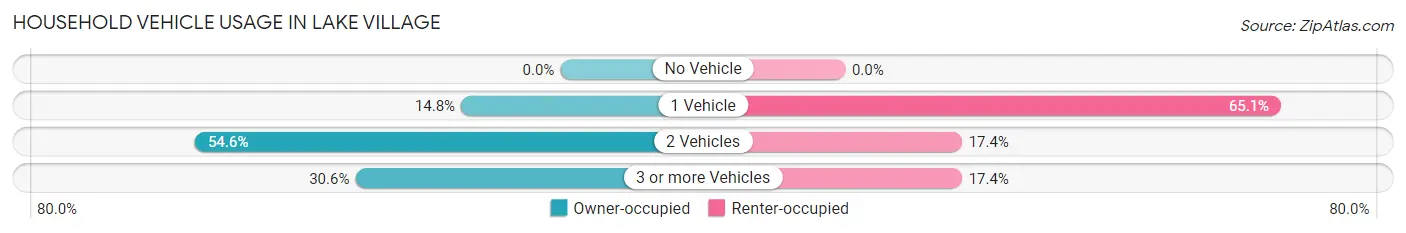
| Vehicles per Household | Owner-occupied | Renter-occupied |
| No Vehicle | 0 (0.0%) | 0 (0.0%) |
| 1 Vehicle | 31 (14.8%) | 56 (65.1%) |
| 2 Vehicles | 114 (54.5%) | 15 (17.4%) |
| 3 or more Vehicles | 64 (30.6%) | 15 (17.4%) |
| Total | 209 (100.0%) | 86 (100.0%) |
Real Estate & Mortgages in Lake Village
Real Estate and Mortgage Overview in Lake Village
| Characteristic | Without Mortgage | With Mortgage |
| Housing Units | 96 | 113 |
| Median Property Value | $153,800 | $129,800 |
| Median Household Income | - | - |
| Monthly Housing Costs | $461 | $0 |
| Real Estate Taxes | $1,676 | $0 |
Property Value by Mortgage Status in Lake Village
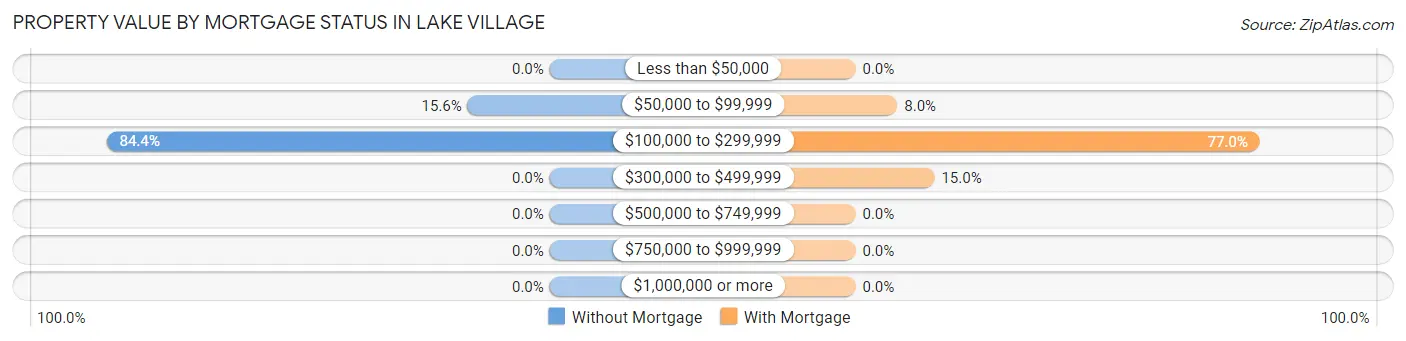
| Property Value | Without Mortgage | With Mortgage |
| Less than $50,000 | 0 (0.0%) | 0 (0.0%) |
| $50,000 to $99,999 | 15 (15.6%) | 9 (8.0%) |
| $100,000 to $299,999 | 81 (84.4%) | 87 (77.0%) |
| $300,000 to $499,999 | 0 (0.0%) | 17 (15.0%) |
| $500,000 to $749,999 | 0 (0.0%) | 0 (0.0%) |
| $750,000 to $999,999 | 0 (0.0%) | 0 (0.0%) |
| $1,000,000 or more | 0 (0.0%) | 0 (0.0%) |
| Total | 96 (100.0%) | 113 (100.0%) |
Household Income by Mortgage Status in Lake Village
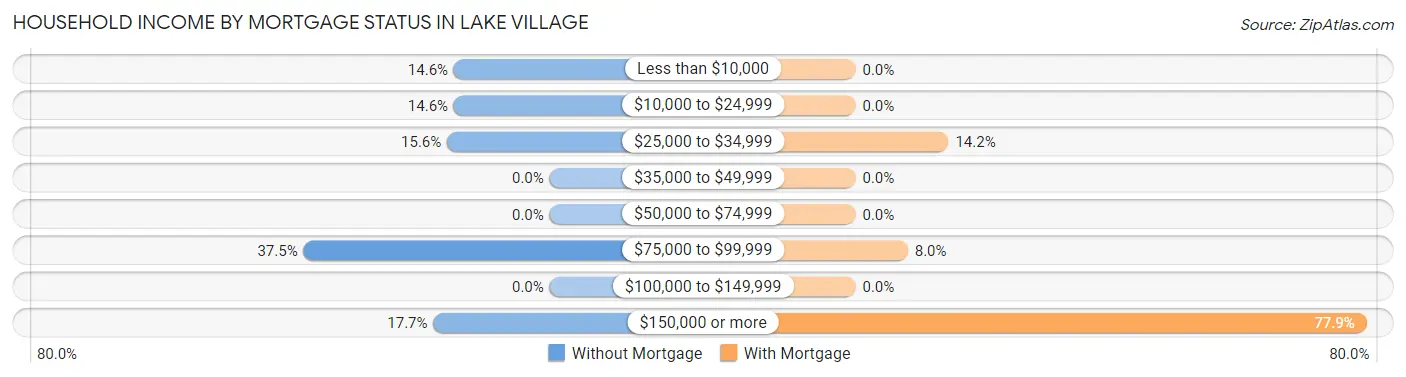
| Household Income | Without Mortgage | With Mortgage |
| Less than $10,000 | 14 (14.6%) | 0 (0.0%) |
| $10,000 to $24,999 | 14 (14.6%) | 0 (0.0%) |
| $25,000 to $34,999 | 15 (15.6%) | 16 (14.2%) |
| $35,000 to $49,999 | 0 (0.0%) | 0 (0.0%) |
| $50,000 to $74,999 | 0 (0.0%) | 0 (0.0%) |
| $75,000 to $99,999 | 36 (37.5%) | 9 (8.0%) |
| $100,000 to $149,999 | 0 (0.0%) | 0 (0.0%) |
| $150,000 or more | 17 (17.7%) | 88 (77.9%) |
| Total | 96 (100.0%) | 113 (100.0%) |
Property Value to Household Income Ratio in Lake Village
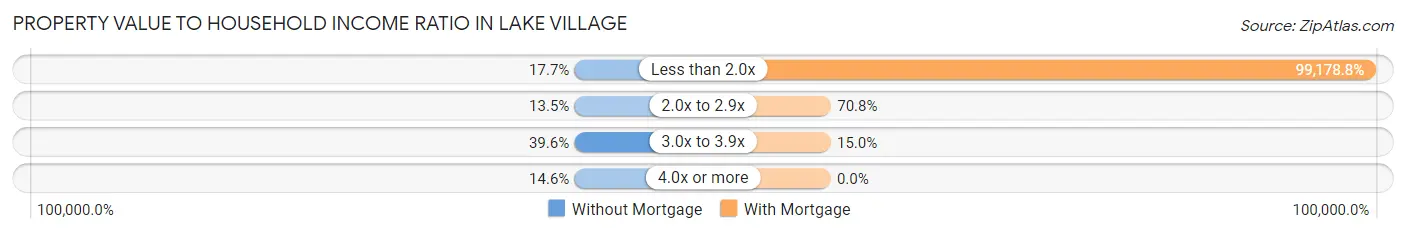
| Value-to-Income Ratio | Without Mortgage | With Mortgage |
| Less than 2.0x | 17 (17.7%) | 112,072 (99,178.8%) |
| 2.0x to 2.9x | 13 (13.5%) | 80 (70.8%) |
| 3.0x to 3.9x | 38 (39.6%) | 17 (15.0%) |
| 4.0x or more | 14 (14.6%) | 0 (0.0%) |
| Total | 96 (100.0%) | 113 (100.0%) |
Real Estate Taxes by Mortgage Status in Lake Village
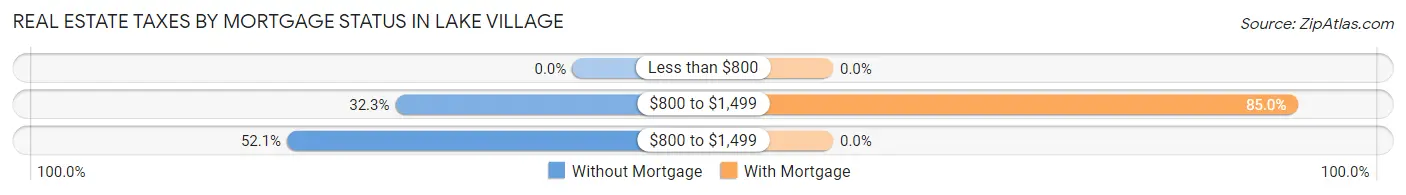
| Property Taxes | Without Mortgage | With Mortgage |
| Less than $800 | 0 (0.0%) | 0 (0.0%) |
| $800 to $1,499 | 31 (32.3%) | 96 (85.0%) |
| $800 to $1,499 | 50 (52.1%) | 0 (0.0%) |
| Total | 96 (100.0%) | 113 (100.0%) |
Health & Disability in Lake Village
Health Insurance Coverage by Age in Lake Village
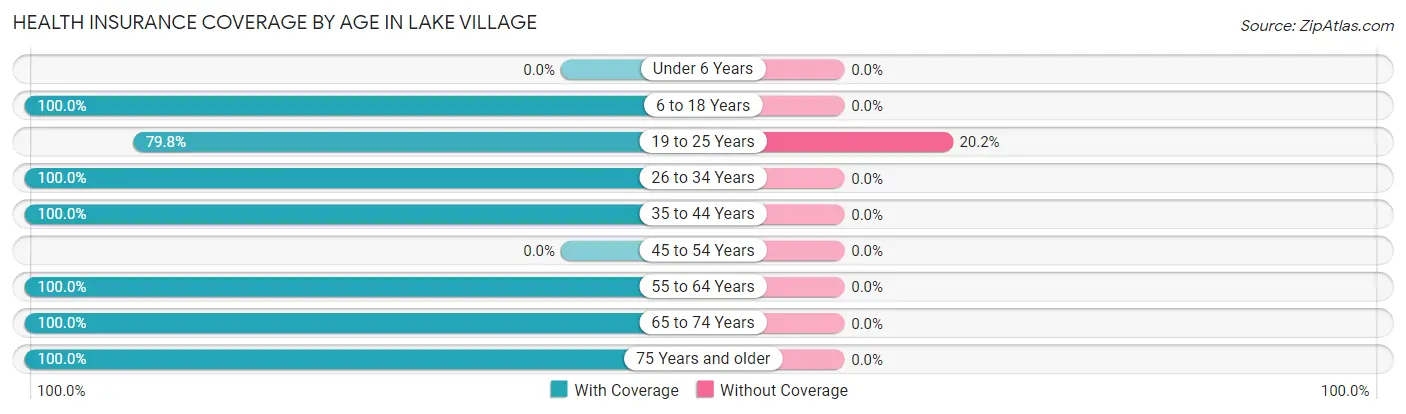
| Age Bracket | With Coverage | Without Coverage |
| Under 6 Years | 0 (0.0%) | 0 (0.0%) |
| 6 to 18 Years | 19 (100.0%) | 0 (0.0%) |
| 19 to 25 Years | 95 (79.8%) | 24 (20.2%) |
| 26 to 34 Years | 105 (100.0%) | 0 (0.0%) |
| 35 to 44 Years | 25 (100.0%) | 0 (0.0%) |
| 45 to 54 Years | 0 (0.0%) | 0 (0.0%) |
| 55 to 64 Years | 145 (100.0%) | 0 (0.0%) |
| 65 to 74 Years | 153 (100.0%) | 0 (0.0%) |
| 75 Years and older | 13 (100.0%) | 0 (0.0%) |
| Total | 555 (95.9%) | 24 (4.2%) |
Health Insurance Coverage by Citizenship Status in Lake Village
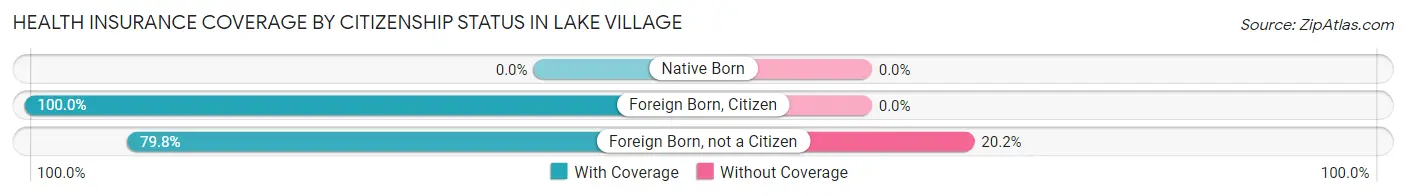
| Citizenship Status | With Coverage | Without Coverage |
| Native Born | 0 (0.0%) | 0 (0.0%) |
| Foreign Born, Citizen | 19 (100.0%) | 0 (0.0%) |
| Foreign Born, not a Citizen | 95 (79.8%) | 24 (20.2%) |
Health Insurance Coverage by Household Income in Lake Village
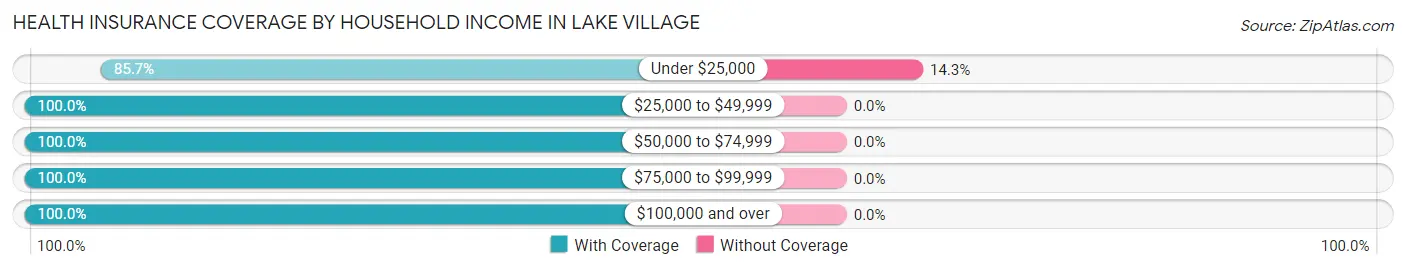
| Household Income | With Coverage | Without Coverage |
| Under $25,000 | 144 (85.7%) | 24 (14.3%) |
| $25,000 to $49,999 | 45 (100.0%) | 0 (0.0%) |
| $50,000 to $74,999 | 19 (100.0%) | 0 (0.0%) |
| $75,000 to $99,999 | 78 (100.0%) | 0 (0.0%) |
| $100,000 and over | 269 (100.0%) | 0 (0.0%) |
Public vs Private Health Insurance Coverage by Age in Lake Village
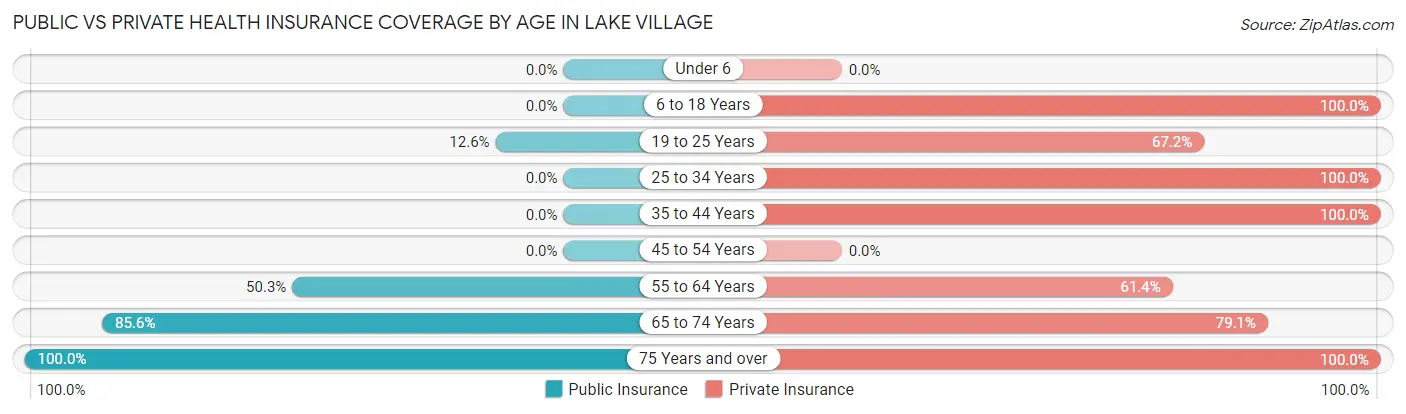
| Age Bracket | Public Insurance | Private Insurance |
| Under 6 | 0 (0.0%) | 0 (0.0%) |
| 6 to 18 Years | 0 (0.0%) | 19 (100.0%) |
| 19 to 25 Years | 15 (12.6%) | 80 (67.2%) |
| 25 to 34 Years | 0 (0.0%) | 105 (100.0%) |
| 35 to 44 Years | 0 (0.0%) | 25 (100.0%) |
| 45 to 54 Years | 0 (0.0%) | 0 (0.0%) |
| 55 to 64 Years | 73 (50.3%) | 89 (61.4%) |
| 65 to 74 Years | 131 (85.6%) | 121 (79.1%) |
| 75 Years and over | 13 (100.0%) | 13 (100.0%) |
| Total | 232 (40.1%) | 452 (78.1%) |
Disability Status by Sex by Age in Lake Village
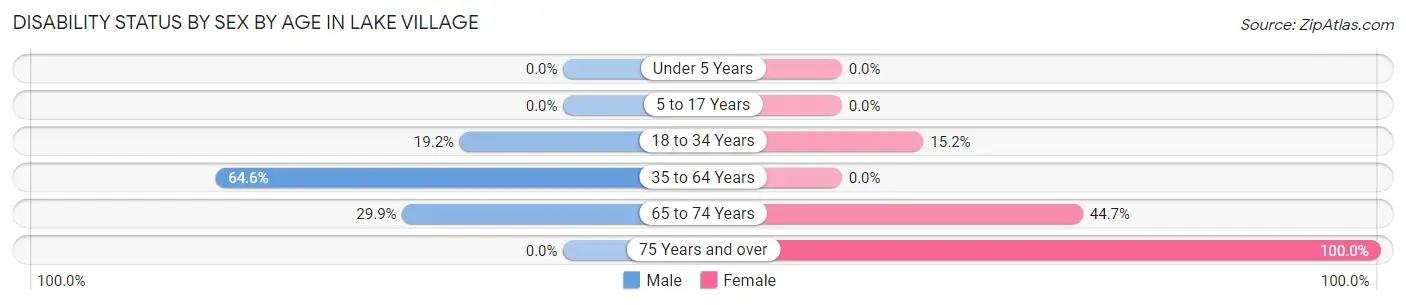
| Age Bracket | Male | Female |
| Under 5 Years | 0 (0.0%) | 0 (0.0%) |
| 5 to 17 Years | 0 (0.0%) | 0 (0.0%) |
| 18 to 34 Years | 24 (19.2%) | 15 (15.1%) |
| 35 to 64 Years | 73 (64.6%) | 0 (0.0%) |
| 65 to 74 Years | 23 (29.9%) | 34 (44.7%) |
| 75 Years and over | 0 (0.0%) | 13 (100.0%) |
Disability Class by Sex by Age in Lake Village
Disability Class: Hearing Difficulty
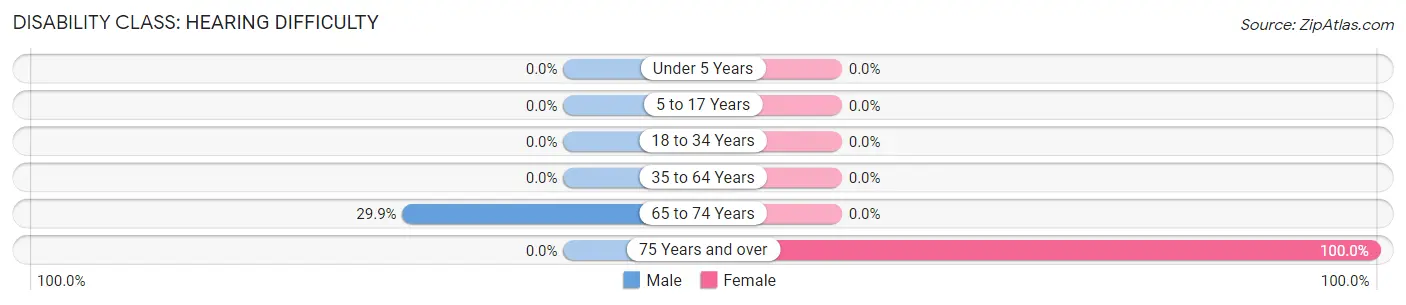
| Age Bracket | Male | Female |
| Under 5 Years | 0 (0.0%) | 0 (0.0%) |
| 5 to 17 Years | 0 (0.0%) | 0 (0.0%) |
| 18 to 34 Years | 0 (0.0%) | 0 (0.0%) |
| 35 to 64 Years | 0 (0.0%) | 0 (0.0%) |
| 65 to 74 Years | 23 (29.9%) | 0 (0.0%) |
| 75 Years and over | 0 (0.0%) | 13 (100.0%) |
Disability Class: Vision Difficulty
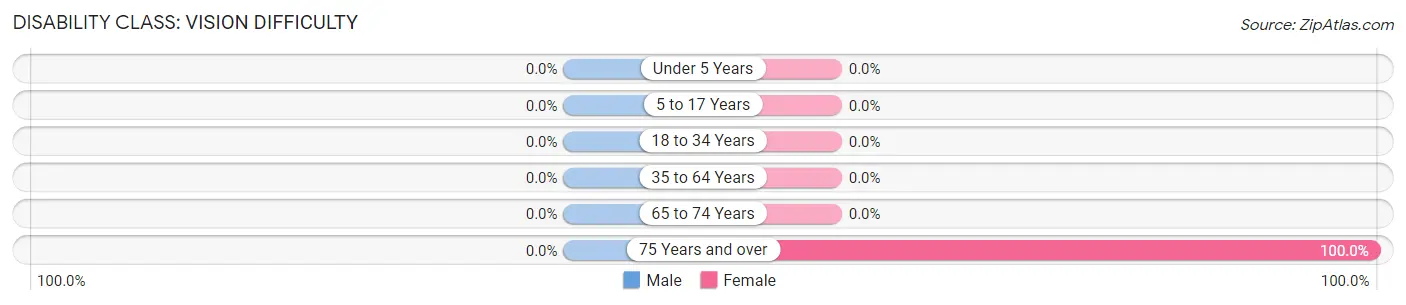
| Age Bracket | Male | Female |
| Under 5 Years | 0 (0.0%) | 0 (0.0%) |
| 5 to 17 Years | 0 (0.0%) | 0 (0.0%) |
| 18 to 34 Years | 0 (0.0%) | 0 (0.0%) |
| 35 to 64 Years | 0 (0.0%) | 0 (0.0%) |
| 65 to 74 Years | 0 (0.0%) | 0 (0.0%) |
| 75 Years and over | 0 (0.0%) | 13 (100.0%) |
Disability Class: Cognitive Difficulty
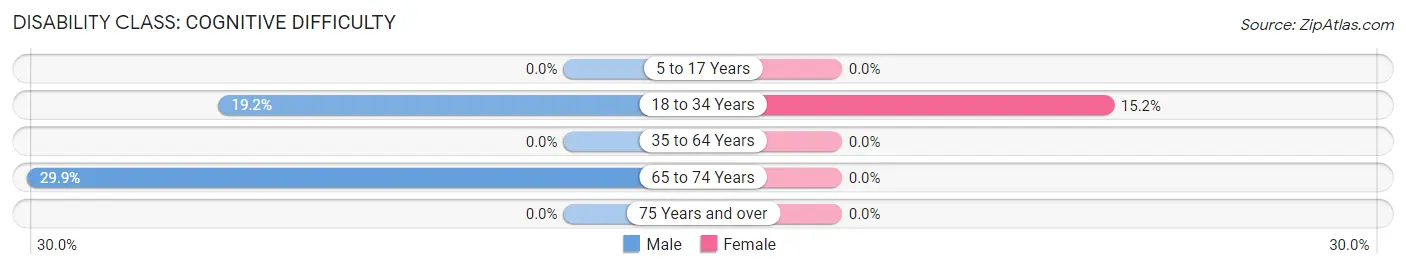
| Age Bracket | Male | Female |
| 5 to 17 Years | 0 (0.0%) | 0 (0.0%) |
| 18 to 34 Years | 24 (19.2%) | 15 (15.1%) |
| 35 to 64 Years | 0 (0.0%) | 0 (0.0%) |
| 65 to 74 Years | 23 (29.9%) | 0 (0.0%) |
| 75 Years and over | 0 (0.0%) | 0 (0.0%) |
Disability Class: Ambulatory Difficulty
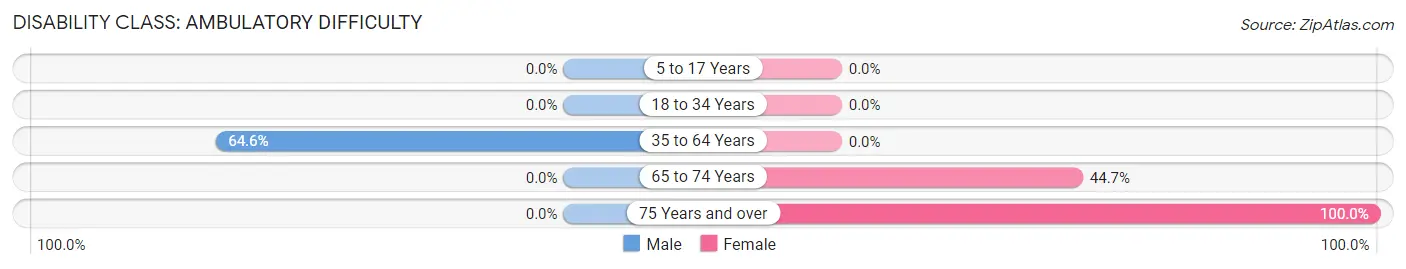
| Age Bracket | Male | Female |
| 5 to 17 Years | 0 (0.0%) | 0 (0.0%) |
| 18 to 34 Years | 0 (0.0%) | 0 (0.0%) |
| 35 to 64 Years | 73 (64.6%) | 0 (0.0%) |
| 65 to 74 Years | 0 (0.0%) | 34 (44.7%) |
| 75 Years and over | 0 (0.0%) | 13 (100.0%) |
Disability Class: Self-Care Difficulty
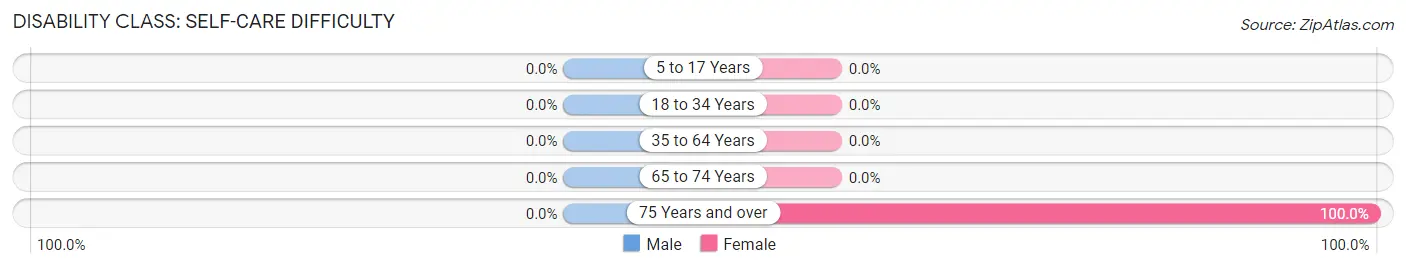
| Age Bracket | Male | Female |
| 5 to 17 Years | 0 (0.0%) | 0 (0.0%) |
| 18 to 34 Years | 0 (0.0%) | 0 (0.0%) |
| 35 to 64 Years | 0 (0.0%) | 0 (0.0%) |
| 65 to 74 Years | 0 (0.0%) | 0 (0.0%) |
| 75 Years and over | 0 (0.0%) | 13 (100.0%) |
Technology Access in Lake Village
Computing Device Access in Lake Village
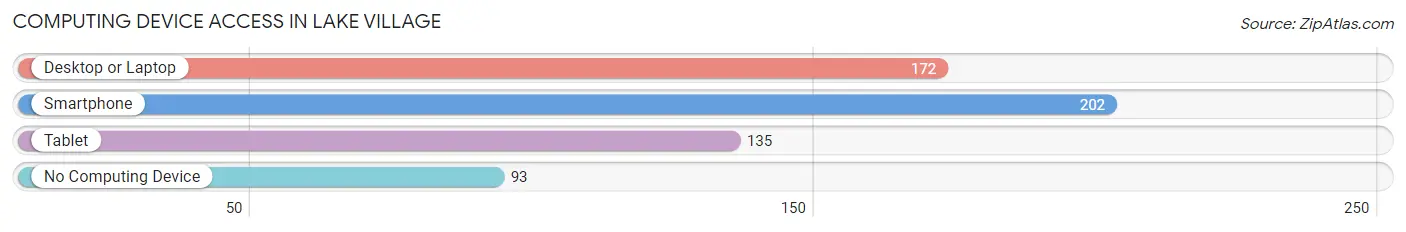
| Device Type | # Households | % Households |
| Desktop or Laptop | 172 | 58.3% |
| Smartphone | 202 | 68.5% |
| Tablet | 135 | 45.8% |
| No Computing Device | 93 | 31.5% |
| Total | 295 | 100.0% |
Internet Access in Lake Village
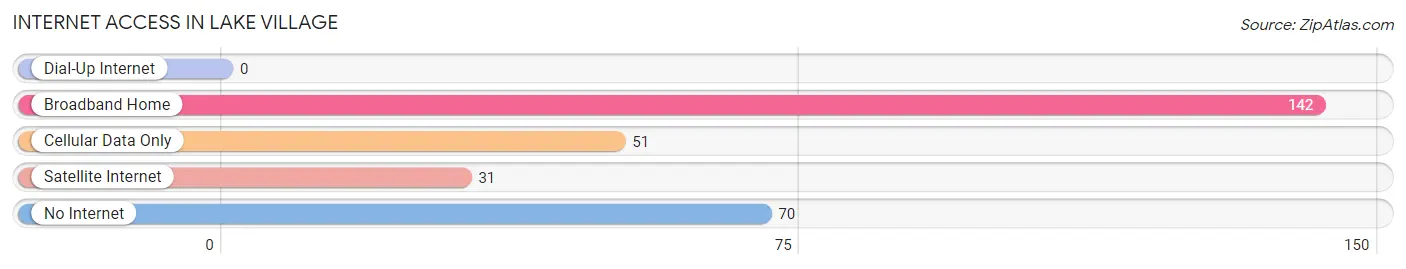
| Internet Type | # Households | % Households |
| Dial-Up Internet | 0 | 0.0% |
| Broadband Home | 142 | 48.1% |
| Cellular Data Only | 51 | 17.3% |
| Satellite Internet | 31 | 10.5% |
| No Internet | 70 | 23.7% |
| Total | 295 | 100.0% |
Lake Village Summary
Village of Lake
The Village of Lake is a small community located in the northwest corner of Indiana, in LaPorte County. It is situated on the banks of Lake Michigan, and is home to a population of just over 1,000 people. The village is known for its beautiful lakefront views, and its quaint, small-town atmosphere.
History
The Village of Lake was first settled in the early 1800s by a group of settlers from New England. The settlers were attracted to the area by the abundance of natural resources, including timber, fish, and game. The village was originally known as "Lakeport," and was incorporated in 1837.
In the late 1800s, the village began to grow and develop. The first school was built in 1876, and the first post office was established in 1877. The village was also home to a number of businesses, including a sawmill, a grist mill, and a general store.
In the early 1900s, the village began to experience a period of growth and prosperity. The population increased from just over 500 in 1900 to nearly 1,000 by 1920. During this time, the village was home to a number of businesses, including a hotel, a bank, a movie theater, and a number of stores.
Geography
The Village of Lake is located in the northwest corner of Indiana, in LaPorte County. It is situated on the banks of Lake Michigan, and is bordered by the towns of LaPorte, Michigan City, and New Buffalo. The village is located approximately 50 miles east of Chicago, and is accessible by car via Interstate 94.
The village is situated on a flat plain, with an elevation of approximately 600 feet above sea level. The climate is generally mild, with temperatures ranging from the low 30s in the winter to the mid-80s in the summer.
Economy
The economy of the Village of Lake is largely based on tourism and recreation. The village is home to a number of popular attractions, including a beach, a marina, and a number of restaurants and shops. The village is also home to a number of businesses, including a grocery store, a hardware store, and a number of other small businesses.
Demographics
As of the 2010 census, the population of the Village of Lake was 1,072. The population is largely white (94.3%), with a small percentage of African Americans (2.2%), Hispanics (1.7%), and Asians (1.2%). The median household income is $45,000, and the median home value is $150,000.
Conclusion
The Village of Lake is a small community located in the northwest corner of Indiana, in LaPorte County. It is situated on the banks of Lake Michigan, and is home to a population of just over 1,000 people. The village is known for its beautiful lakefront views, and its quaint, small-town atmosphere. The economy of the village is largely based on tourism and recreation, and the population is largely white. The village is a great place to live, work, and play, and is a great example of a small, rural community.
Common Questions
What is Per Capita Income in Lake Village?
Per Capita income in Lake Village is $34,481.
What is the Median Family Income in Lake Village?
Median Family Income in Lake Village is $110,559.
What is Income or Wage Gap in Lake Village?
Income or Wage Gap in Lake Village is 44.0%.
Women in Lake Village earn 56.0 cents for every dollar earned by a man.
What is Inequality or Gini Index in Lake Village?
Inequality or Gini Index in Lake Village is 0.49.
What is the Total Population of Lake Village?
Total Population of Lake Village is 579.
What is the Total Male Population of Lake Village?
Total Male Population of Lake Village is 315.
What is the Total Female Population of Lake Village?
Total Female Population of Lake Village is 264.
What is the Ratio of Males per 100 Females in Lake Village?
There are 119.32 Males per 100 Females in Lake Village.
What is the Ratio of Females per 100 Males in Lake Village?
There are 83.81 Females per 100 Males in Lake Village.
What is the Median Population Age in Lake Village?
Median Population Age in Lake Village is 56.7 Years.
What is the Average Family Size in Lake Village
Average Family Size in Lake Village is 2.4 People.
What is the Average Household Size in Lake Village
Average Household Size in Lake Village is 2.0 People.
How Large is the Labor Force in Lake Village?
There are 345 People in the Labor Forcein in Lake Village.
What is the Percentage of People in the Labor Force in Lake Village?
61.6% of People are in the Labor Force in Lake Village.
What is the Unemployment Rate in Lake Village?
Unemployment Rate in Lake Village is 11.3%.