La Fontaine, IN Map & Demographics
La Fontaine Map
La Fontaine Overview
$25,266
PER CAPITA INCOME
$49,444
AVG FAMILY INCOME
$53,558
AVG HOUSEHOLD INCOME
24.6%
WAGE / INCOME GAP [ % ]
75.4¢/ $1
WAGE / INCOME GAP [ $ ]
0.33
INEQUALITY / GINI INDEX
897
TOTAL POPULATION
436
MALE POPULATION
461
FEMALE POPULATION
94.58
MALES / 100 FEMALES
105.73
FEMALES / 100 MALES
42.3
MEDIAN AGE
2.9
AVG FAMILY SIZE
2.4
AVG HOUSEHOLD SIZE
435
LABOR FORCE [ PEOPLE ]
59.3%
PERCENT IN LABOR FORCE
1.4%
UNEMPLOYMENT RATE
La Fontaine Zip Codes
La Fontaine Area Codes
Income in La Fontaine
Income Overview in La Fontaine
Per Capita Income in La Fontaine is $25,266, while median incomes of families and households are $49,444 and $53,558 respectively.
| Characteristic | Number | Measure |
| Per Capita Income | 897 | $25,266 |
| Median Family Income | 234 | $49,444 |
| Mean Family Income | 234 | $65,122 |
| Median Household Income | 325 | $53,558 |
| Mean Household Income | 325 | $61,282 |
| Income Deficit | 234 | $0 |
| Wage / Income Gap (%) | 897 | 24.61% |
| Wage / Income Gap ($) | 897 | 75.39¢ per $1 |
| Gini / Inequality Index | 897 | 0.33 |
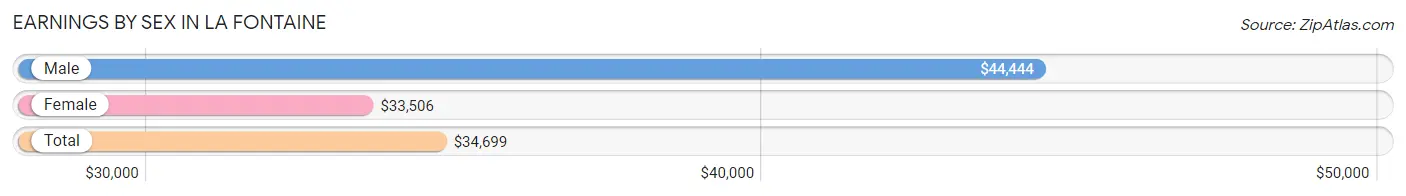
Earnings by Sex in La Fontaine
Average Earnings in La Fontaine are $34,699, $44,444 for men and $33,506 for women, a difference of 24.6%.
| Sex | Number | Average Earnings |
| Male | 220 (48.9%) | $44,444 |
| Female | 230 (51.1%) | $33,506 |
| Total | 450 (100.0%) | $34,699 |
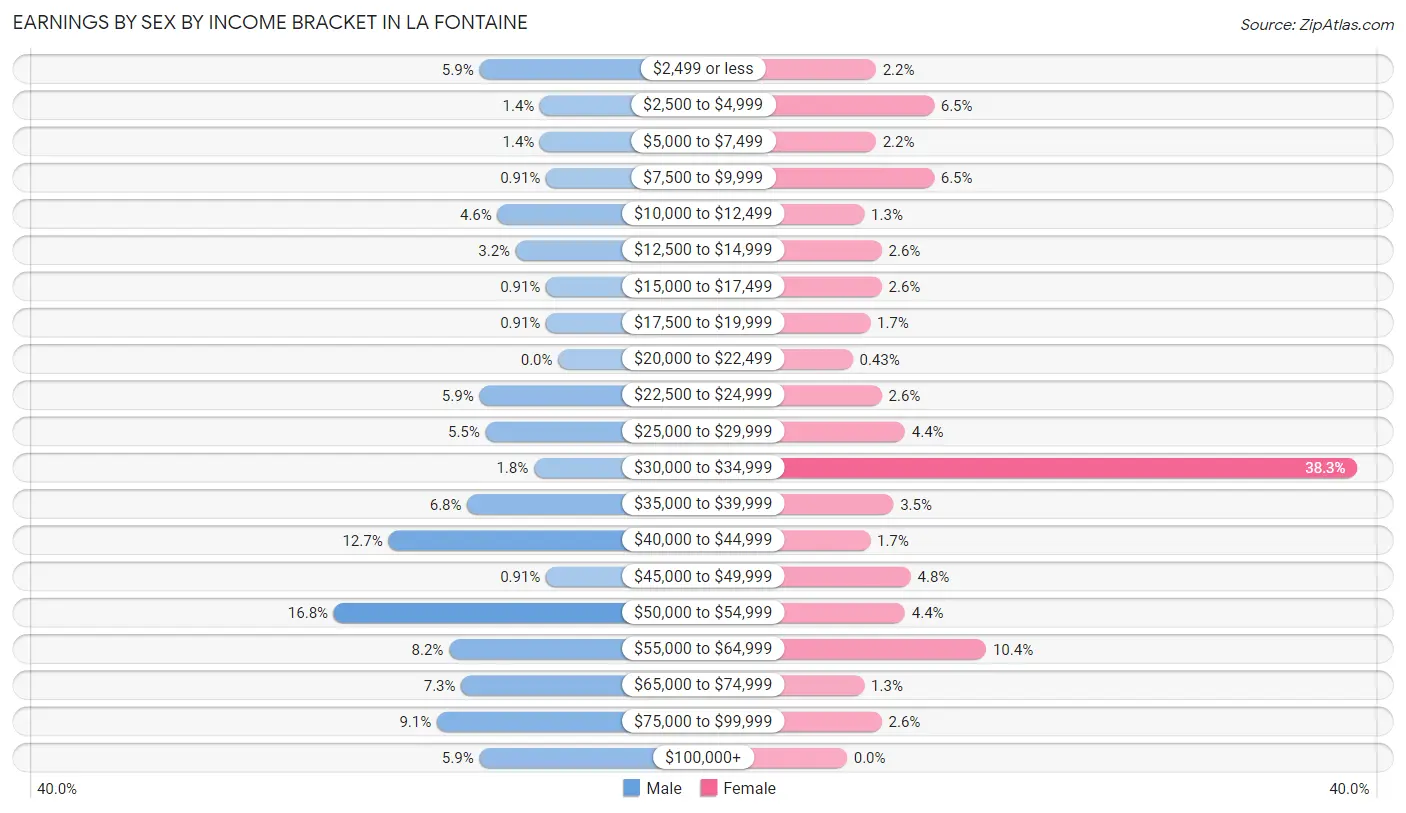
Earnings by Sex by Income Bracket in La Fontaine
The most common earnings brackets in La Fontaine are $50,000 to $54,999 for men (37 | 16.8%) and $30,000 to $34,999 for women (88 | 38.3%).
| Income | Male | Female |
| $2,499 or less | 13 (5.9%) | 5 (2.2%) |
| $2,500 to $4,999 | 3 (1.4%) | 15 (6.5%) |
| $5,000 to $7,499 | 3 (1.4%) | 5 (2.2%) |
| $7,500 to $9,999 | 2 (0.9%) | 15 (6.5%) |
| $10,000 to $12,499 | 10 (4.5%) | 3 (1.3%) |
| $12,500 to $14,999 | 7 (3.2%) | 6 (2.6%) |
| $15,000 to $17,499 | 2 (0.9%) | 6 (2.6%) |
| $17,500 to $19,999 | 2 (0.9%) | 4 (1.7%) |
| $20,000 to $22,499 | 0 (0.0%) | 1 (0.4%) |
| $22,500 to $24,999 | 13 (5.9%) | 6 (2.6%) |
| $25,000 to $29,999 | 12 (5.4%) | 10 (4.3%) |
| $30,000 to $34,999 | 4 (1.8%) | 88 (38.3%) |
| $35,000 to $39,999 | 15 (6.8%) | 8 (3.5%) |
| $40,000 to $44,999 | 28 (12.7%) | 4 (1.7%) |
| $45,000 to $49,999 | 2 (0.9%) | 11 (4.8%) |
| $50,000 to $54,999 | 37 (16.8%) | 10 (4.3%) |
| $55,000 to $64,999 | 18 (8.2%) | 24 (10.4%) |
| $65,000 to $74,999 | 16 (7.3%) | 3 (1.3%) |
| $75,000 to $99,999 | 20 (9.1%) | 6 (2.6%) |
| $100,000+ | 13 (5.9%) | 0 (0.0%) |
| Total | 220 (100.0%) | 230 (100.0%) |
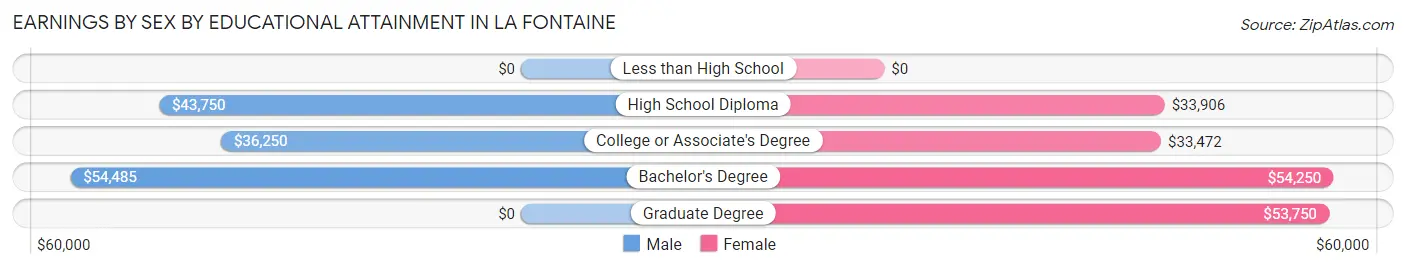
Earnings by Sex by Educational Attainment in La Fontaine
Average earnings in La Fontaine are $50,625 for men and $33,750 for women, a difference of 33.3%. Men with an educational attainment of bachelor's degree enjoy the highest average annual earnings of $54,485, while those with college or associate's degree education earn the least with $36,250. Women with an educational attainment of bachelor's degree earn the most with the average annual earnings of $54,250, while those with college or associate's degree education have the smallest earnings of $33,472.
| Educational Attainment | Male Income | Female Income |
| Less than High School | - | - |
| High School Diploma | $43,750 | $33,906 |
| College or Associate's Degree | $36,250 | $33,472 |
| Bachelor's Degree | $54,485 | $54,250 |
| Graduate Degree | - | - |
| Total | $50,625 | $33,750 |
Family Income in La Fontaine
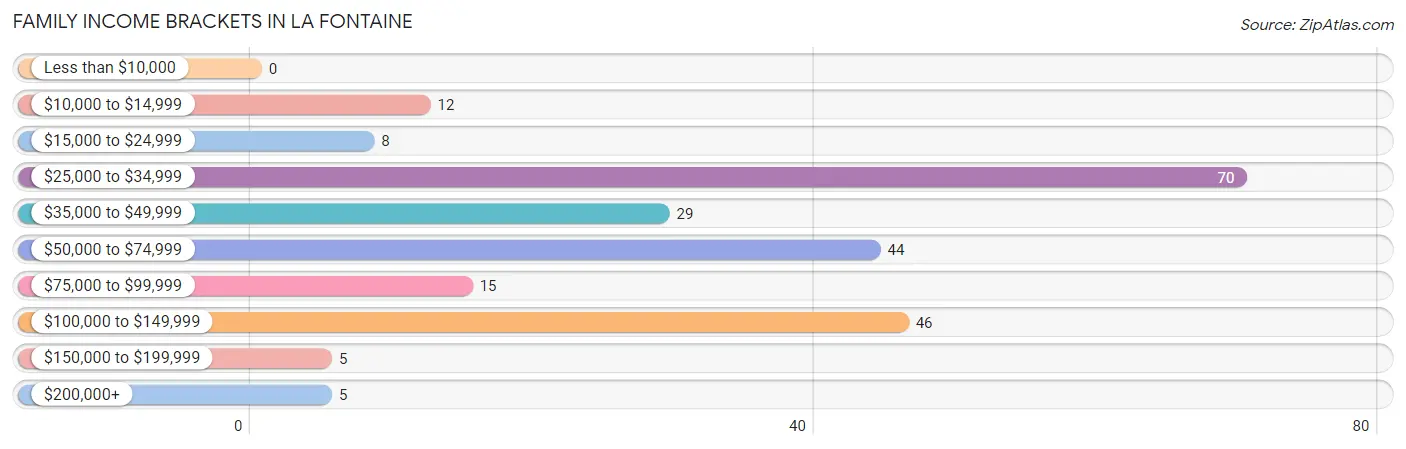
Family Income Brackets in La Fontaine
According to the La Fontaine family income data, there are 70 families falling into the $25,000 to $34,999 income range, which is the most common income bracket and makes up 29.9% of all families.
| Income Bracket | # Families | % Families |
| Less than $10,000 | 0 | 0.0% |
| $10,000 to $14,999 | 12 | 5.1% |
| $15,000 to $24,999 | 8 | 3.4% |
| $25,000 to $34,999 | 70 | 29.9% |
| $35,000 to $49,999 | 29 | 12.4% |
| $50,000 to $74,999 | 44 | 18.8% |
| $75,000 to $99,999 | 15 | 6.4% |
| $100,000 to $149,999 | 46 | 19.7% |
| $150,000 to $199,999 | 5 | 2.1% |
| $200,000+ | 5 | 2.1% |
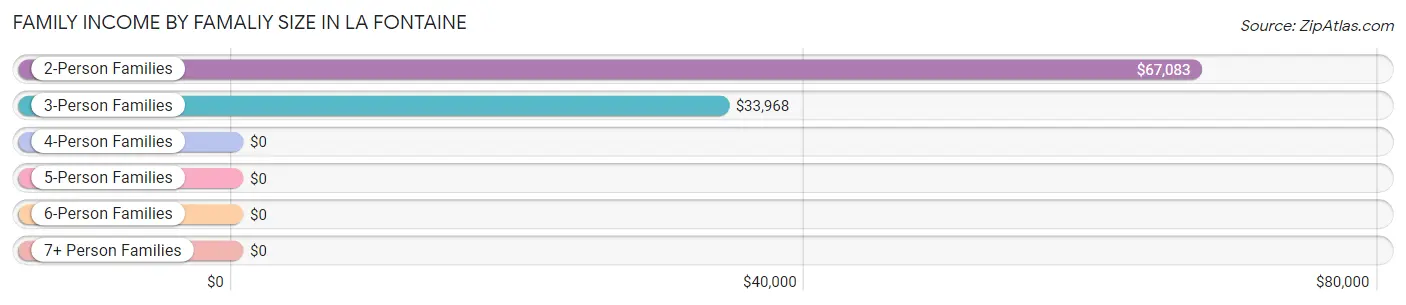
Family Income by Famaliy Size in La Fontaine
2-person families (81 | 34.6%) account for the highest median family income in La Fontaine with $67,083 per family, while 2-person families (81 | 34.6%) have the highest median income of $33,542 per family member.
| Income Bracket | # Families | Median Income |
| 2-Person Families | 81 (34.6%) | $67,083 |
| 3-Person Families | 92 (39.3%) | $33,968 |
| 4-Person Families | 45 (19.2%) | $0 |
| 5-Person Families | 6 (2.6%) | $0 |
| 6-Person Families | 10 (4.3%) | $0 |
| 7+ Person Families | 0 (0.0%) | $0 |
| Total | 234 (100.0%) | $49,444 |
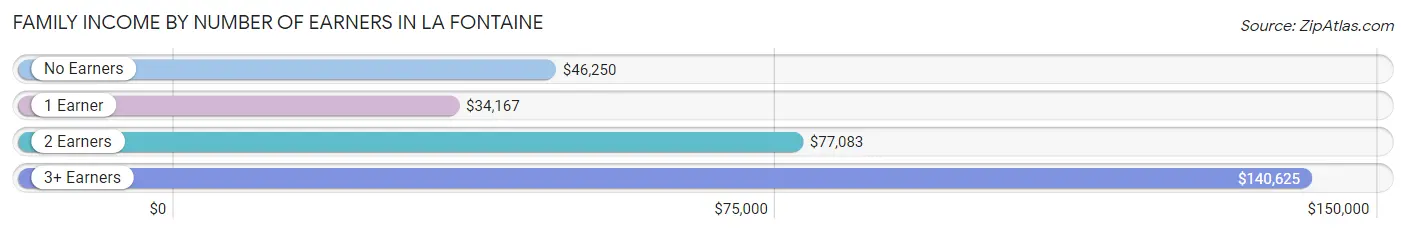
Family Income by Number of Earners in La Fontaine
The median family income in La Fontaine is $49,444, with families comprising 3+ earners (19) having the highest median family income of $140,625, while families with 1 earner (120) have the lowest median family income of $34,167, accounting for 8.1% and 51.3% of families, respectively.
| Number of Earners | # Families | Median Income |
| No Earners | 16 (6.8%) | $46,250 |
| 1 Earner | 120 (51.3%) | $34,167 |
| 2 Earners | 79 (33.8%) | $77,083 |
| 3+ Earners | 19 (8.1%) | $140,625 |
| Total | 234 (100.0%) | $49,444 |
Household Income in La Fontaine
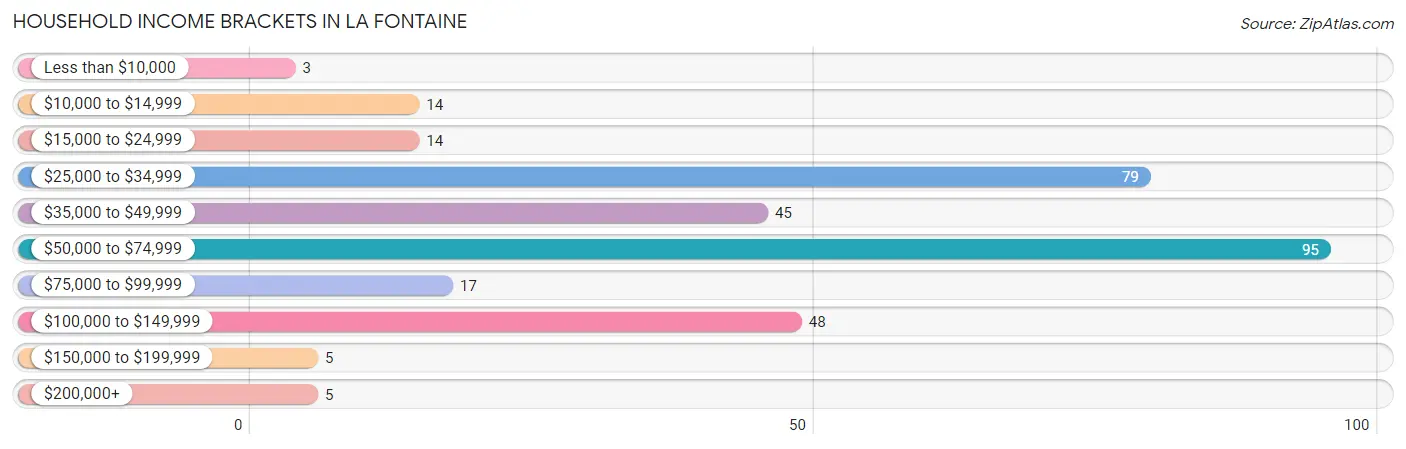
Household Income Brackets in La Fontaine
With 95 households falling in the category, the $50,000 to $74,999 income range is the most frequent in La Fontaine, accounting for 29.2% of all households. In contrast, only 3 households (0.9%) fall into the less than $10,000 income bracket, making it the least populous group.
| Income Bracket | # Households | % Households |
| Less than $10,000 | 3 | 0.9% |
| $10,000 to $14,999 | 14 | 4.3% |
| $15,000 to $24,999 | 14 | 4.3% |
| $25,000 to $34,999 | 79 | 24.3% |
| $35,000 to $49,999 | 45 | 13.8% |
| $50,000 to $74,999 | 95 | 29.2% |
| $75,000 to $99,999 | 17 | 5.2% |
| $100,000 to $149,999 | 48 | 14.8% |
| $150,000 to $199,999 | 5 | 1.5% |
| $200,000+ | 5 | 1.5% |
Household Income by Householder Age in La Fontaine
The median household income in La Fontaine is $53,558, with the highest median household income of $65,000 found in the 45 to 64 years age bracket for the primary householder. A total of 112 households (34.5%) fall into this category. Meanwhile, the 15 to 24 years age bracket for the primary householder has the lowest median household income of $0, with 11 households (3.4%) in this group.
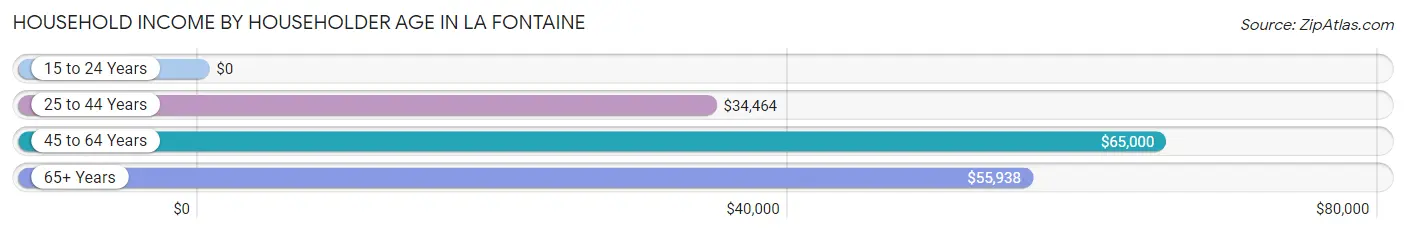
| Income Bracket | # Households | Median Income |
| 15 to 24 Years | 11 (3.4%) | $0 |
| 25 to 44 Years | 151 (46.5%) | $34,464 |
| 45 to 64 Years | 112 (34.5%) | $65,000 |
| 65+ Years | 51 (15.7%) | $55,938 |
| Total | 325 (100.0%) | $53,558 |
Poverty in La Fontaine
Income Below Poverty by Sex and Age in La Fontaine
With 19.3% poverty level for males and 11.4% for females among the residents of La Fontaine, 5 year old males and under 5 year old females are the most vulnerable to poverty, with 9 males (100.0%) and 25 females (65.8%) in their respective age groups living below the poverty level.
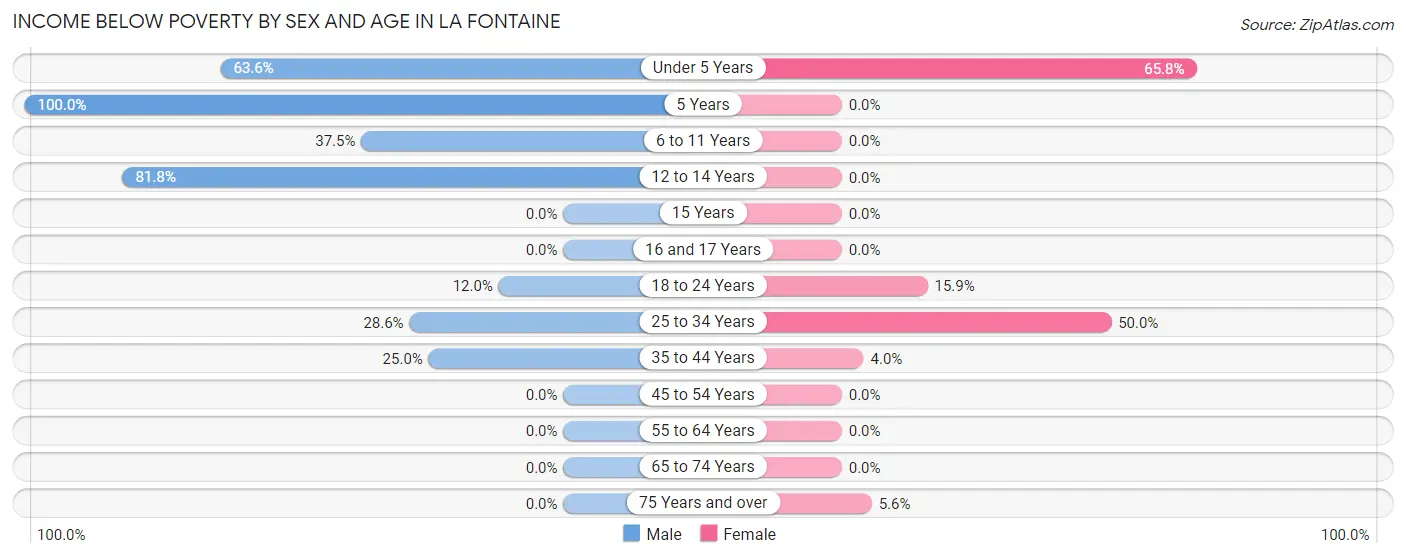
| Age Bracket | Male | Female |
| Under 5 Years | 21 (63.6%) | 25 (65.8%) |
| 5 Years | 9 (100.0%) | 0 (0.0%) |
| 6 to 11 Years | 9 (37.5%) | 0 (0.0%) |
| 12 to 14 Years | 9 (81.8%) | 0 (0.0%) |
| 15 Years | 0 (0.0%) | 0 (0.0%) |
| 16 and 17 Years | 0 (0.0%) | 0 (0.0%) |
| 18 to 24 Years | 3 (12.0%) | 7 (15.9%) |
| 25 to 34 Years | 20 (28.6%) | 7 (50.0%) |
| 35 to 44 Years | 5 (25.0%) | 4 (4.0%) |
| 45 to 54 Years | 0 (0.0%) | 0 (0.0%) |
| 55 to 64 Years | 0 (0.0%) | 0 (0.0%) |
| 65 to 74 Years | 0 (0.0%) | 0 (0.0%) |
| 75 Years and over | 0 (0.0%) | 1 (5.6%) |
| Total | 76 (19.3%) | 44 (11.4%) |
Income Above Poverty by Sex and Age in La Fontaine
According to the poverty statistics in La Fontaine, males aged 16 and 17 years and females aged 6 to 11 years are the age groups that are most secure financially, with 100.0% of males and 100.0% of females in these age groups living above the poverty line.
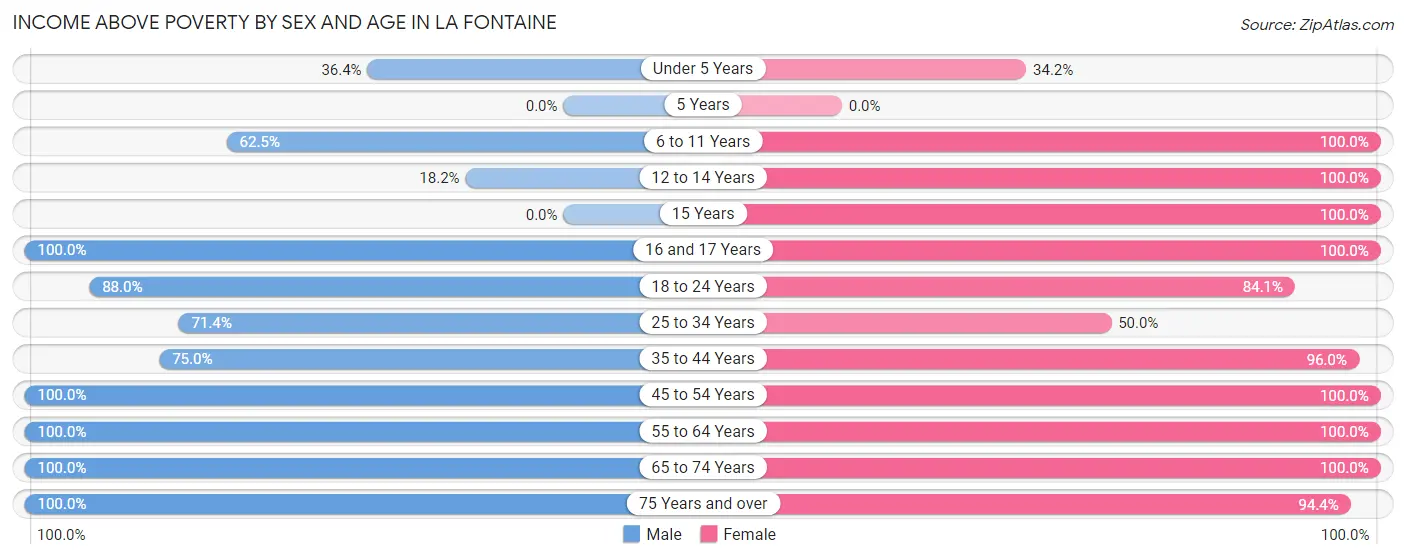
| Age Bracket | Male | Female |
| Under 5 Years | 12 (36.4%) | 13 (34.2%) |
| 5 Years | 0 (0.0%) | 0 (0.0%) |
| 6 to 11 Years | 15 (62.5%) | 10 (100.0%) |
| 12 to 14 Years | 2 (18.2%) | 7 (100.0%) |
| 15 Years | 0 (0.0%) | 28 (100.0%) |
| 16 and 17 Years | 51 (100.0%) | 16 (100.0%) |
| 18 to 24 Years | 22 (88.0%) | 37 (84.1%) |
| 25 to 34 Years | 50 (71.4%) | 7 (50.0%) |
| 35 to 44 Years | 15 (75.0%) | 95 (96.0%) |
| 45 to 54 Years | 75 (100.0%) | 60 (100.0%) |
| 55 to 64 Years | 28 (100.0%) | 32 (100.0%) |
| 65 to 74 Years | 33 (100.0%) | 21 (100.0%) |
| 75 Years and over | 14 (100.0%) | 17 (94.4%) |
| Total | 317 (80.7%) | 343 (88.6%) |
Income Below Poverty Among Married-Couple Families in La Fontaine
The poverty statistics for married-couple families in La Fontaine show that 3.0% or 4 of the total 134 families live below the poverty line. Families with 1 or 2 children have the highest poverty rate of 8.5%, comprising of 4 families. On the other hand, families with no children have the lowest poverty rate of 0.0%, which includes 0 families.
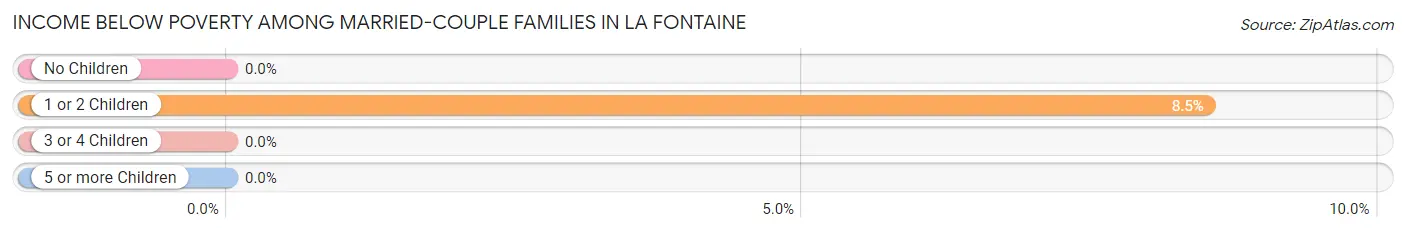
| Children | Above Poverty | Below Poverty |
| No Children | 84 (100.0%) | 0 (0.0%) |
| 1 or 2 Children | 43 (91.5%) | 4 (8.5%) |
| 3 or 4 Children | 3 (100.0%) | 0 (0.0%) |
| 5 or more Children | 0 (0.0%) | 0 (0.0%) |
| Total | 130 (97.0%) | 4 (3.0%) |
Income Below Poverty Among Single-Parent Households in La Fontaine
According to the poverty data in La Fontaine, 35.0% or 7 single-father households and 8.7% or 7 single-mother households are living below the poverty line. Among single-father households, those with no children have the highest poverty rate, with 2 households (100.0%) experiencing poverty. Likewise, among single-mother households, those with 5 or more children have the highest poverty rate, with 7 households (100.0%) falling below the poverty line.
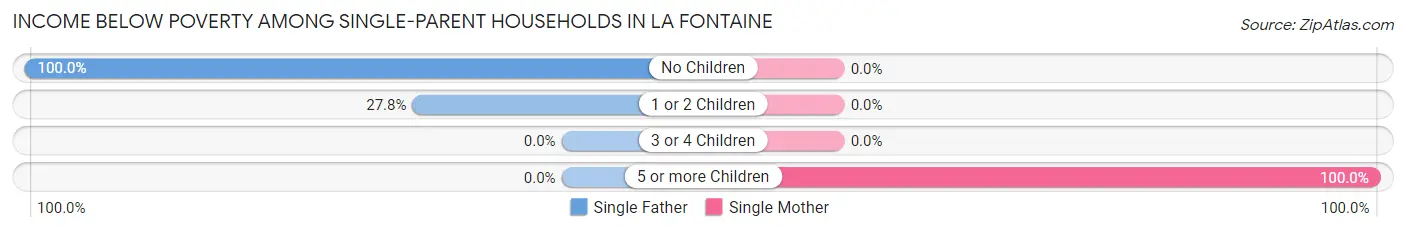
| Children | Single Father | Single Mother |
| No Children | 2 (100.0%) | 0 (0.0%) |
| 1 or 2 Children | 5 (27.8%) | 0 (0.0%) |
| 3 or 4 Children | 0 (0.0%) | 0 (0.0%) |
| 5 or more Children | 0 (0.0%) | 7 (100.0%) |
| Total | 7 (35.0%) | 7 (8.7%) |
Income Below Poverty Among Married-Couple vs Single-Parent Households in La Fontaine
The poverty data for La Fontaine shows that 4 of the married-couple family households (3.0%) and 14 of the single-parent households (14.0%) are living below the poverty level. Within the married-couple family households, those with 1 or 2 children have the highest poverty rate, with 4 households (8.5%) falling below the poverty line. Among the single-parent households, those with 5 or more children have the highest poverty rate, with 7 household (100.0%) living below poverty.
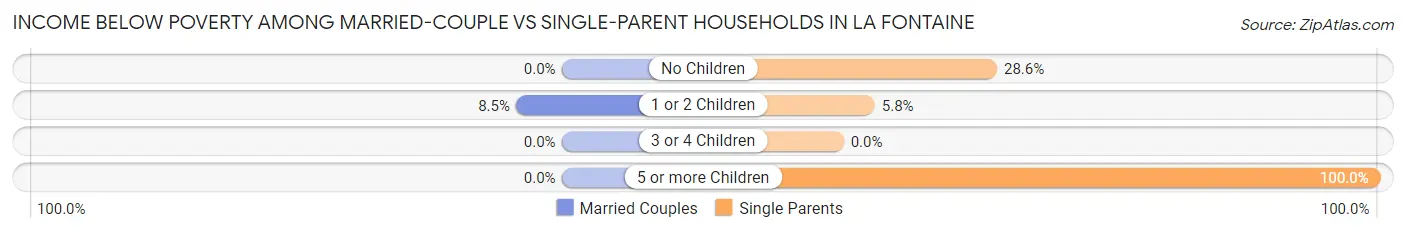
| Children | Married-Couple Families | Single-Parent Households |
| No Children | 0 (0.0%) | 2 (28.6%) |
| 1 or 2 Children | 4 (8.5%) | 5 (5.8%) |
| 3 or 4 Children | 0 (0.0%) | 0 (0.0%) |
| 5 or more Children | 0 (0.0%) | 7 (100.0%) |
| Total | 4 (3.0%) | 14 (14.0%) |
Race in La Fontaine
The most populous races in La Fontaine are White / Caucasian (856 | 95.4%), Asian (24 | 2.7%), and Hispanic or Latino (17 | 1.9%).
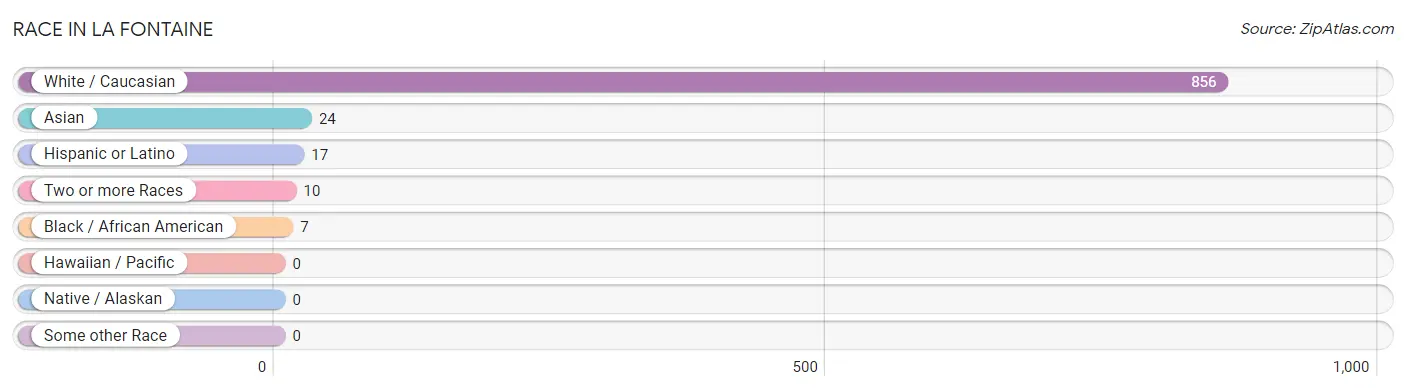
| Race | # Population | % Population |
| Asian | 24 | 2.7% |
| Black / African American | 7 | 0.8% |
| Hawaiian / Pacific | 0 | 0.0% |
| Hispanic or Latino | 17 | 1.9% |
| Native / Alaskan | 0 | 0.0% |
| White / Caucasian | 856 | 95.4% |
| Two or more Races | 10 | 1.1% |
| Some other Race | 0 | 0.0% |
| Total | 897 | 100.0% |
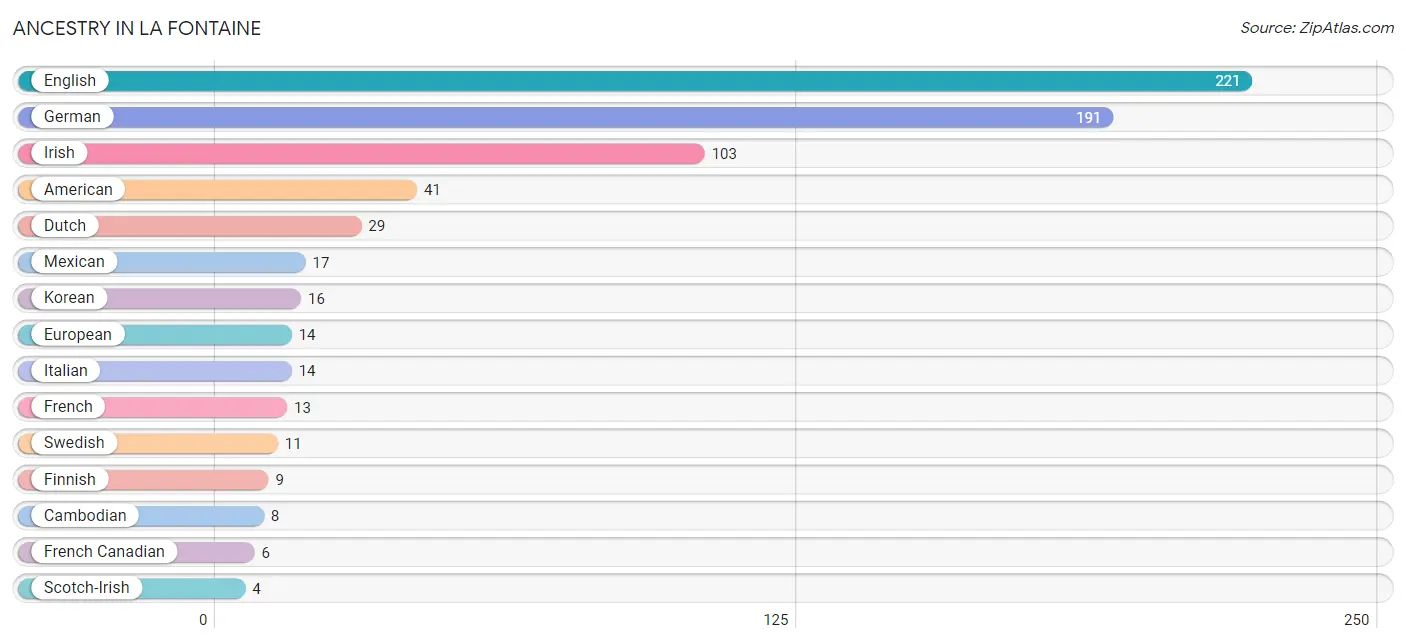
Ancestry in La Fontaine
The most populous ancestries reported in La Fontaine are English (221 | 24.6%), German (191 | 21.3%), Irish (103 | 11.5%), American (41 | 4.6%), and Dutch (29 | 3.2%), together accounting for 65.2% of all La Fontaine residents.
| Ancestry | # Population | % Population |
| African | 2 | 0.2% |
| American | 41 | 4.6% |
| Cambodian | 8 | 0.9% |
| Czech | 1 | 0.1% |
| Czechoslovakian | 2 | 0.2% |
| Dutch | 29 | 3.2% |
| English | 221 | 24.6% |
| European | 14 | 1.6% |
| Finnish | 9 | 1.0% |
| French | 13 | 1.5% |
| French Canadian | 6 | 0.7% |
| German | 191 | 21.3% |
| Irish | 103 | 11.5% |
| Italian | 14 | 1.6% |
| Korean | 16 | 1.8% |
| Mexican | 17 | 1.9% |
| Russian | 3 | 0.3% |
| Scotch-Irish | 4 | 0.4% |
| Scottish | 3 | 0.3% |
| Slovak | 3 | 0.3% |
| Subsaharan African | 2 | 0.2% |
| Swedish | 11 | 1.2% |
| Swiss | 2 | 0.2% |
| Welsh | 2 | 0.2% | View All 24 Rows |
Immigrants in La Fontaine
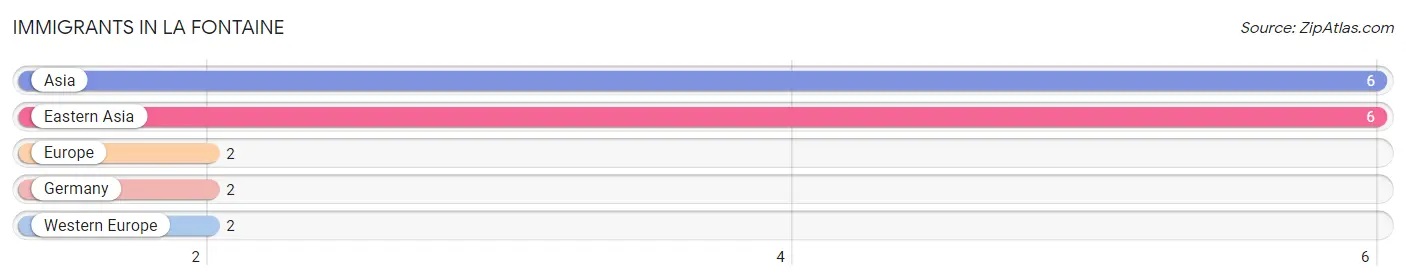
The most numerous immigrant groups reported in La Fontaine came from Asia (6 | 0.7%), Eastern Asia (6 | 0.7%), Europe (2 | 0.2%), Germany (2 | 0.2%), and Western Europe (2 | 0.2%), together accounting for 2.0% of all La Fontaine residents.
| Immigration Origin | # Population | % Population |
| Asia | 6 | 0.7% |
| Eastern Asia | 6 | 0.7% |
| Europe | 2 | 0.2% |
| Germany | 2 | 0.2% |
| Western Europe | 2 | 0.2% | View All 5 Rows |
Sex and Age in La Fontaine
Sex and Age in La Fontaine
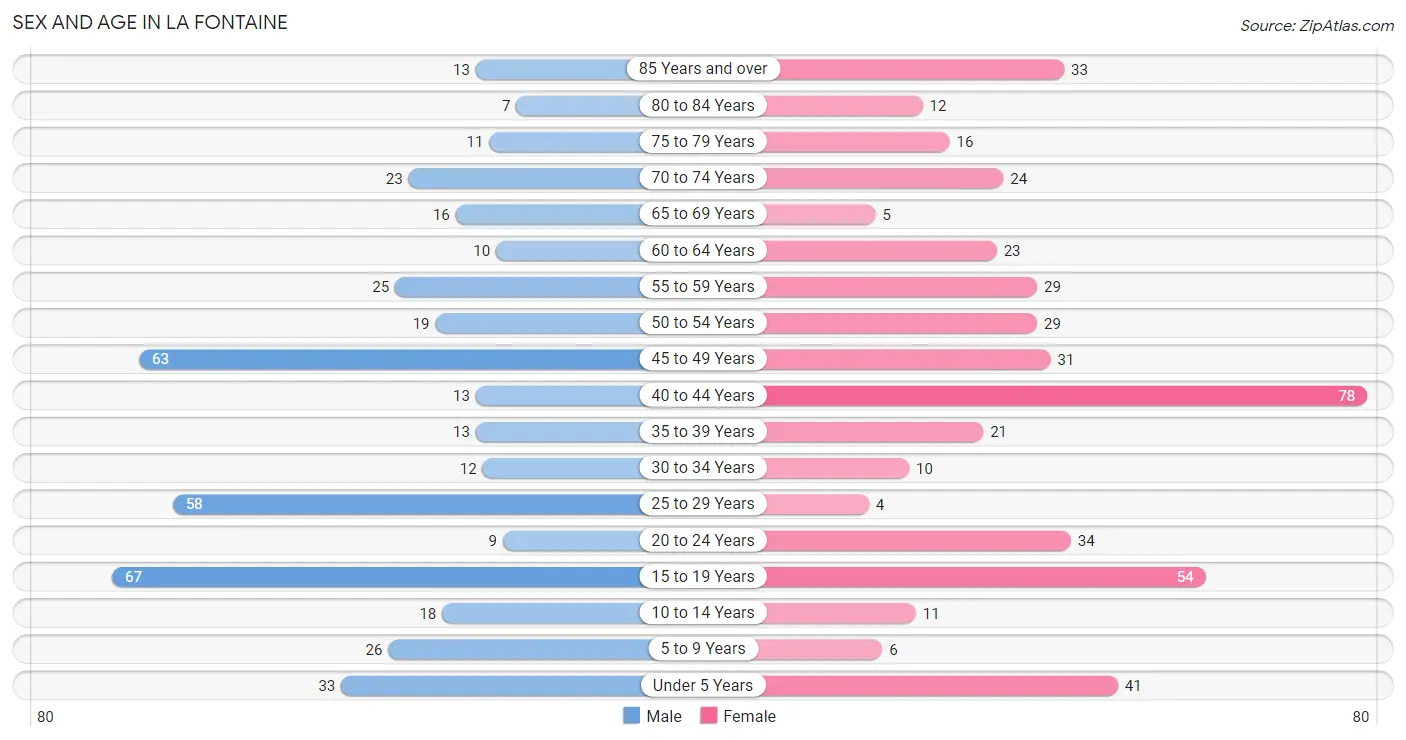
The most populous age groups in La Fontaine are 15 to 19 Years (67 | 15.4%) for men and 40 to 44 Years (78 | 16.9%) for women.
| Age Bracket | Male | Female |
| Under 5 Years | 33 (7.6%) | 41 (8.9%) |
| 5 to 9 Years | 26 (6.0%) | 6 (1.3%) |
| 10 to 14 Years | 18 (4.1%) | 11 (2.4%) |
| 15 to 19 Years | 67 (15.4%) | 54 (11.7%) |
| 20 to 24 Years | 9 (2.1%) | 34 (7.4%) |
| 25 to 29 Years | 58 (13.3%) | 4 (0.9%) |
| 30 to 34 Years | 12 (2.8%) | 10 (2.2%) |
| 35 to 39 Years | 13 (3.0%) | 21 (4.6%) |
| 40 to 44 Years | 13 (3.0%) | 78 (16.9%) |
| 45 to 49 Years | 63 (14.4%) | 31 (6.7%) |
| 50 to 54 Years | 19 (4.4%) | 29 (6.3%) |
| 55 to 59 Years | 25 (5.7%) | 29 (6.3%) |
| 60 to 64 Years | 10 (2.3%) | 23 (5.0%) |
| 65 to 69 Years | 16 (3.7%) | 5 (1.1%) |
| 70 to 74 Years | 23 (5.3%) | 24 (5.2%) |
| 75 to 79 Years | 11 (2.5%) | 16 (3.5%) |
| 80 to 84 Years | 7 (1.6%) | 12 (2.6%) |
| 85 Years and over | 13 (3.0%) | 33 (7.2%) |
| Total | 436 (100.0%) | 461 (100.0%) |
Families and Households in La Fontaine
Median Family Size in La Fontaine
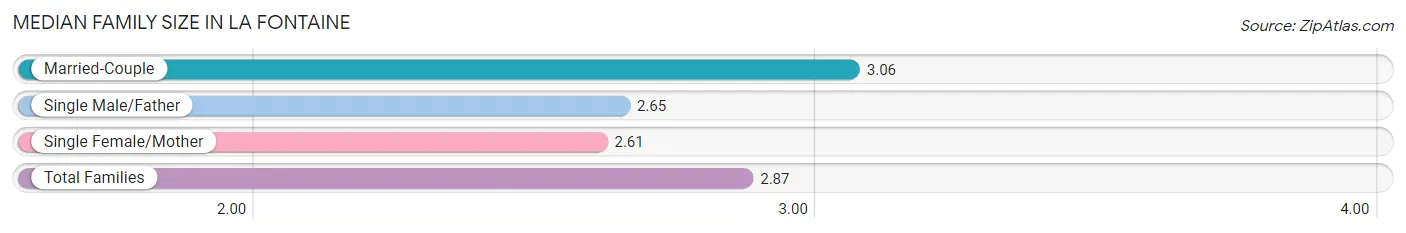
The median family size in La Fontaine is 2.87 persons per family, with married-couple families (134 | 57.3%) accounting for the largest median family size of 3.06 persons per family. On the other hand, single female/mother families (80 | 34.2%) represent the smallest median family size with 2.61 persons per family.
| Family Type | # Families | Family Size |
| Married-Couple | 134 (57.3%) | 3.06 |
| Single Male/Father | 20 (8.6%) | 2.65 |
| Single Female/Mother | 80 (34.2%) | 2.61 |
| Total Families | 234 (100.0%) | 2.87 |
Median Household Size in La Fontaine
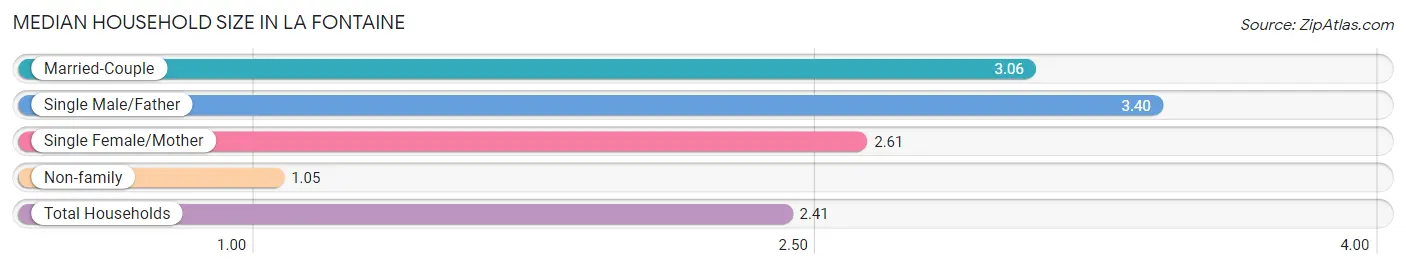
The median household size in La Fontaine is 2.41 persons per household, with single male/father households (20 | 6.1%) accounting for the largest median household size of 3.4 persons per household. non-family households (91 | 28.0%) represent the smallest median household size with 1.05 persons per household.
| Household Type | # Households | Household Size |
| Married-Couple | 134 (41.2%) | 3.06 |
| Single Male/Father | 20 (6.1%) | 3.40 |
| Single Female/Mother | 80 (24.6%) | 2.61 |
| Non-family | 91 (28.0%) | 1.05 |
| Total Households | 325 (100.0%) | 2.41 |
Household Size by Marriage Status in La Fontaine
Out of a total of 325 households in La Fontaine, 234 (72.0%) are family households, while 91 (28.0%) are nonfamily households. The most numerous type of family households are 3-person households, comprising 86, and the most common type of nonfamily households are 1-person households, comprising 88.
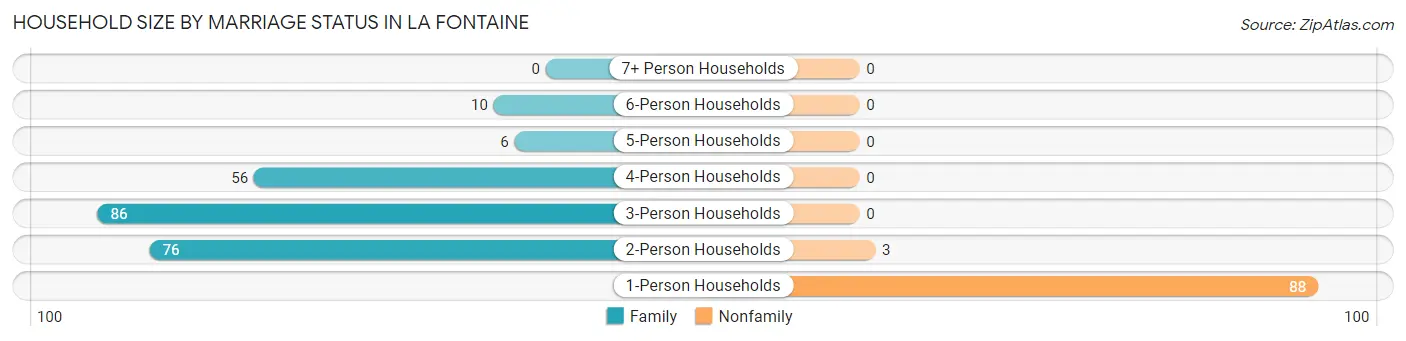
| Household Size | Family Households | Nonfamily Households |
| 1-Person Households | - | 88 (27.1%) |
| 2-Person Households | 76 (23.4%) | 3 (0.9%) |
| 3-Person Households | 86 (26.5%) | 0 (0.0%) |
| 4-Person Households | 56 (17.2%) | 0 (0.0%) |
| 5-Person Households | 6 (1.8%) | 0 (0.0%) |
| 6-Person Households | 10 (3.1%) | 0 (0.0%) |
| 7+ Person Households | 0 (0.0%) | 0 (0.0%) |
| Total | 234 (72.0%) | 91 (28.0%) |
Female Fertility in La Fontaine
Fertility by Age in La Fontaine
Average fertility rate in La Fontaine is 58.0 births per 1,000 women. Women in the age bracket of 20 to 34 years have the highest fertility rate with 292.0 births per 1,000 women. Women in the age bracket of 20 to 34 years acount for 100.0% of all women with births.
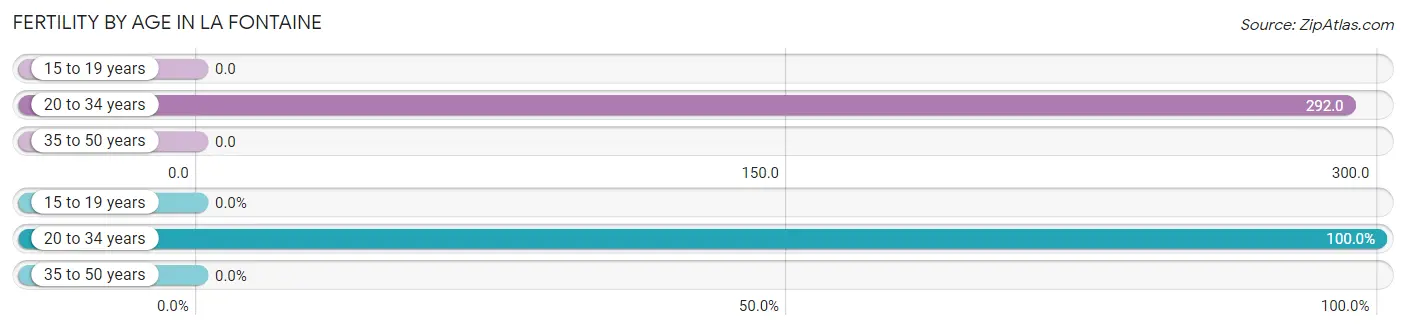
| Age Bracket | Women with Births | Births / 1,000 Women |
| 15 to 19 years | 0 (0.0%) | 0.0 |
| 20 to 34 years | 14 (100.0%) | 292.0 |
| 35 to 50 years | 0 (0.0%) | 0.0 |
| Total | 14 (100.0%) | 58.0 |
Fertility by Age by Marriage Status in La Fontaine
50.0% of women with births (14) in La Fontaine are married. The highest percentage of unmarried women with births falls into 20 to 34 years age bracket with 50.0% of them unmarried at the time of birth, while the lowest percentage of unmarried women with births belong to 20 to 34 years age bracket with 50.0% of them unmarried.
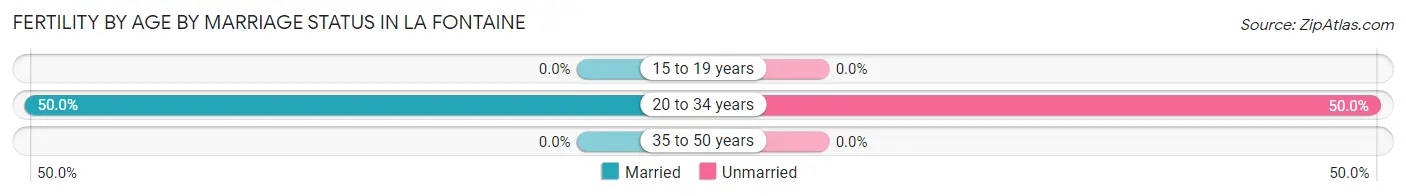
| Age Bracket | Married | Unmarried |
| 15 to 19 years | 0 (0.0%) | 0 (0.0%) |
| 20 to 34 years | 7 (50.0%) | 7 (50.0%) |
| 35 to 50 years | 0 (0.0%) | 0 (0.0%) |
| Total | 7 (50.0%) | 7 (50.0%) |
Fertility by Education in La Fontaine
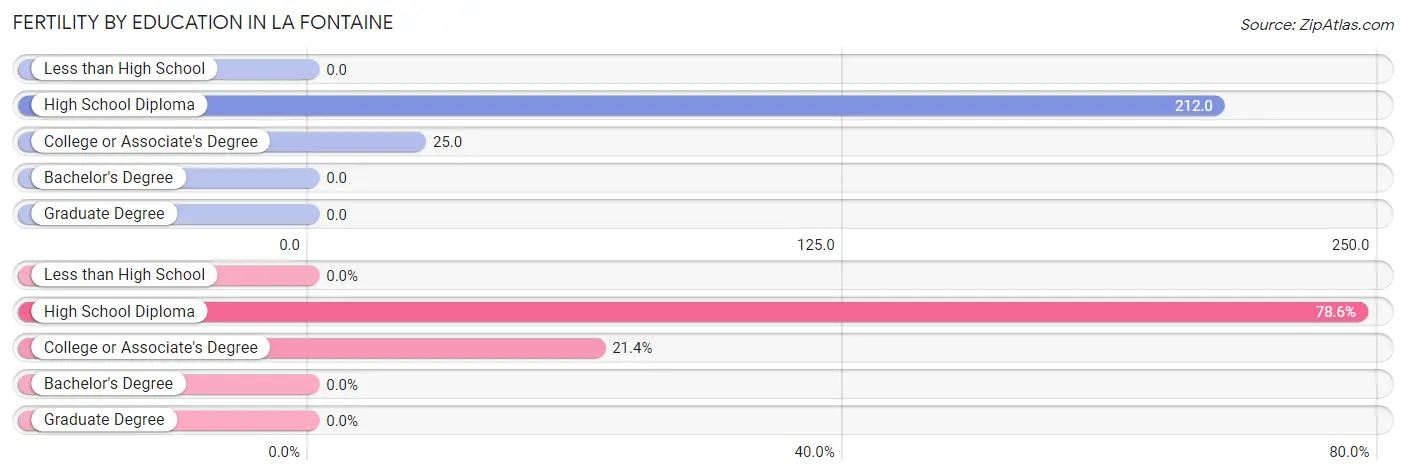
| Educational Attainment | Women with Births | Births / 1,000 Women |
| Less than High School | 0 (0.0%) | 0.0 |
| High School Diploma | 11 (78.6%) | 212.0 |
| College or Associate's Degree | 3 (21.4%) | 25.0 |
| Bachelor's Degree | 0 (0.0%) | 0.0 |
| Graduate Degree | 0 (0.0%) | 0.0 |
| Total | 14 (100.0%) | 58.0 |
Fertility by Education by Marriage Status in La Fontaine
50.0% of women with births in La Fontaine are unmarried. Women with the educational attainment of college or associate's degree are most likely to be married with 100.0% of them married at childbirth, while women with the educational attainment of high school diploma are least likely to be married with 63.6% of them unmarried at childbirth.
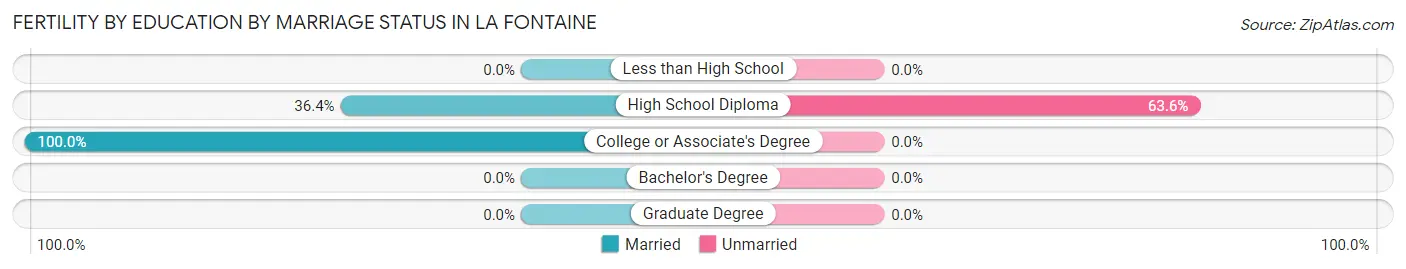
| Educational Attainment | Married | Unmarried |
| Less than High School | 0 (0.0%) | 0 (0.0%) |
| High School Diploma | 4 (36.4%) | 7 (63.6%) |
| College or Associate's Degree | 3 (100.0%) | 0 (0.0%) |
| Bachelor's Degree | 0 (0.0%) | 0 (0.0%) |
| Graduate Degree | 0 (0.0%) | 0 (0.0%) |
| Total | 7 (50.0%) | 7 (50.0%) |
Employment Characteristics in La Fontaine
Employment by Class of Employer in La Fontaine
Among the 427 employed individuals in La Fontaine, private company employees (282 | 66.0%), not-for-profit organizations (50 | 11.7%), and local government employees (31 | 7.3%) make up the most common classes of employment.
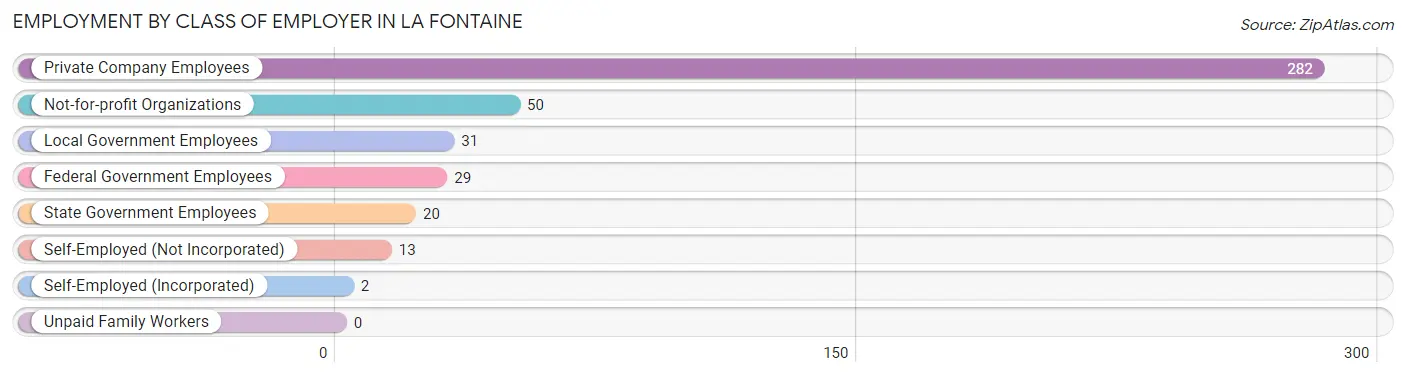
| Employer Class | # Employees | % Employees |
| Private Company Employees | 282 | 66.0% |
| Self-Employed (Incorporated) | 2 | 0.5% |
| Self-Employed (Not Incorporated) | 13 | 3.0% |
| Not-for-profit Organizations | 50 | 11.7% |
| Local Government Employees | 31 | 7.3% |
| State Government Employees | 20 | 4.7% |
| Federal Government Employees | 29 | 6.8% |
| Unpaid Family Workers | 0 | 0.0% |
| Total | 427 | 100.0% |
Employment Status by Age in La Fontaine
According to the labor force statistics for La Fontaine, out of the total population over 16 years of age (734), 59.3% or 435 individuals are in the labor force, with 1.4% or 6 of them unemployed. The age group with the highest labor force participation rate is 35 to 44 years, with 92.8% or 116 individuals in the labor force. Within the labor force, the 65 to 74 years age range has the highest percentage of unemployed individuals, with 18.2% or 2 of them being unemployed.
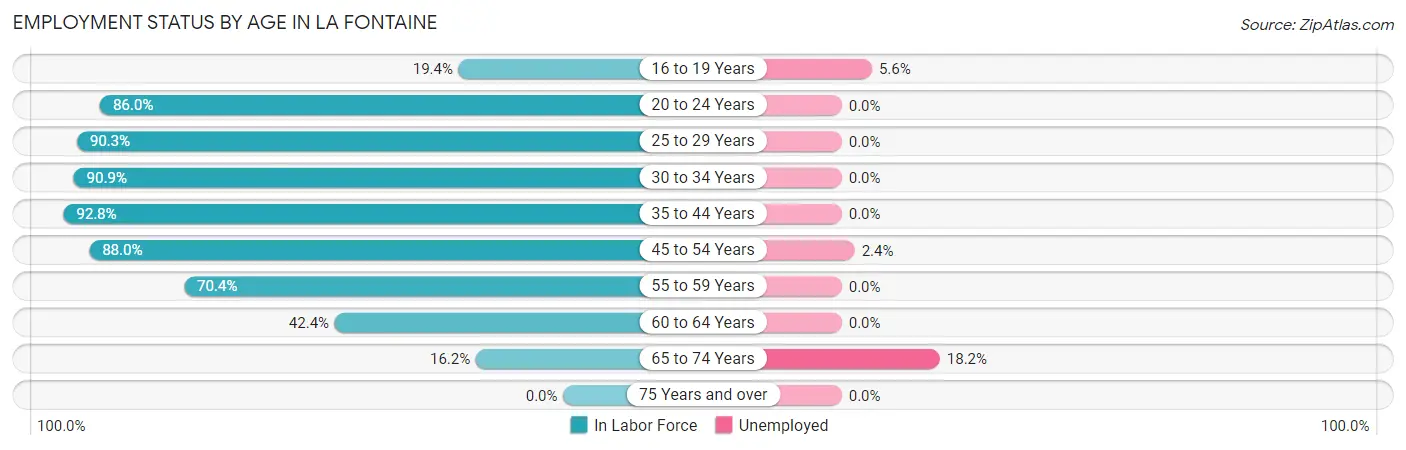
| Age Bracket | In Labor Force | Unemployed |
| 16 to 19 Years | 18 (19.4%) | 1 (5.6%) |
| 20 to 24 Years | 37 (86.0%) | 0 (0.0%) |
| 25 to 29 Years | 56 (90.3%) | 0 (0.0%) |
| 30 to 34 Years | 20 (90.9%) | 0 (0.0%) |
| 35 to 44 Years | 116 (92.8%) | 0 (0.0%) |
| 45 to 54 Years | 125 (88.0%) | 3 (2.4%) |
| 55 to 59 Years | 38 (70.4%) | 0 (0.0%) |
| 60 to 64 Years | 14 (42.4%) | 0 (0.0%) |
| 65 to 74 Years | 11 (16.2%) | 2 (18.2%) |
| 75 Years and over | 0 (0.0%) | 0 (0.0%) |
| Total | 435 (59.3%) | 6 (1.4%) |
Employment Status by Educational Attainment in La Fontaine
According to labor force statistics for La Fontaine, 84.2% of individuals (369) out of the total population between 25 and 64 years of age (438) are in the labor force, with 0.8% or 3 of them being unemployed. The group with the highest labor force participation rate are those with the educational attainment of bachelor's degree or higher, with 91.7% or 77 individuals in the labor force. Within the labor force, individuals with high school diploma education have the highest percentage of unemployment, with 2.9% or 3 of them being unemployed.
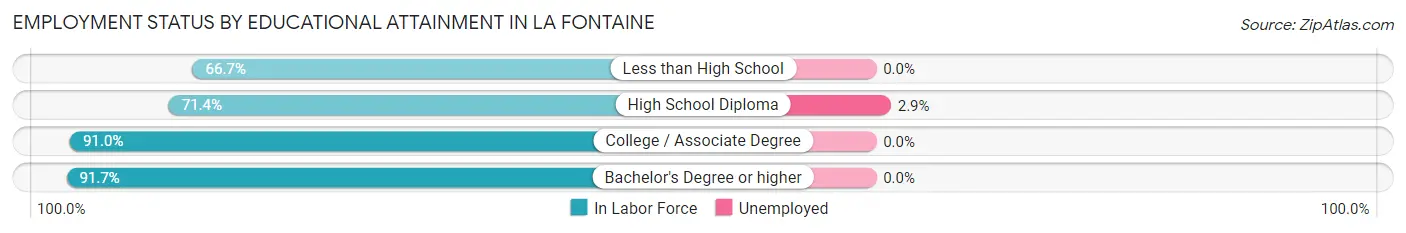
| Educational Attainment | In Labor Force | Unemployed |
| Less than High School | 4 (66.7%) | 0 (0.0%) |
| High School Diploma | 105 (71.4%) | 4 (2.9%) |
| College / Associate Degree | 183 (91.0%) | 0 (0.0%) |
| Bachelor's Degree or higher | 77 (91.7%) | 0 (0.0%) |
| Total | 369 (84.2%) | 4 (0.8%) |
Employment Occupations by Sex in La Fontaine
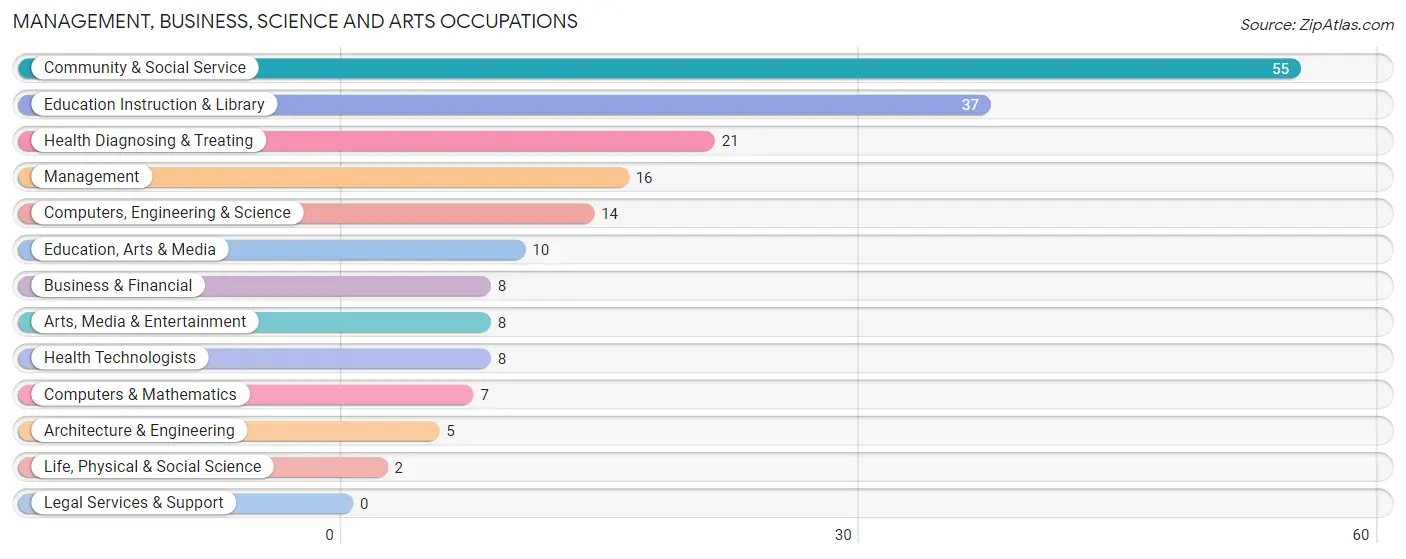
Management, Business, Science and Arts Occupations
The most common Management, Business, Science and Arts occupations in La Fontaine are Community & Social Service (55 | 12.8%), Education Instruction & Library (37 | 8.6%), Health Diagnosing & Treating (21 | 4.9%), Management (16 | 3.7%), and Computers, Engineering & Science (14 | 3.3%).
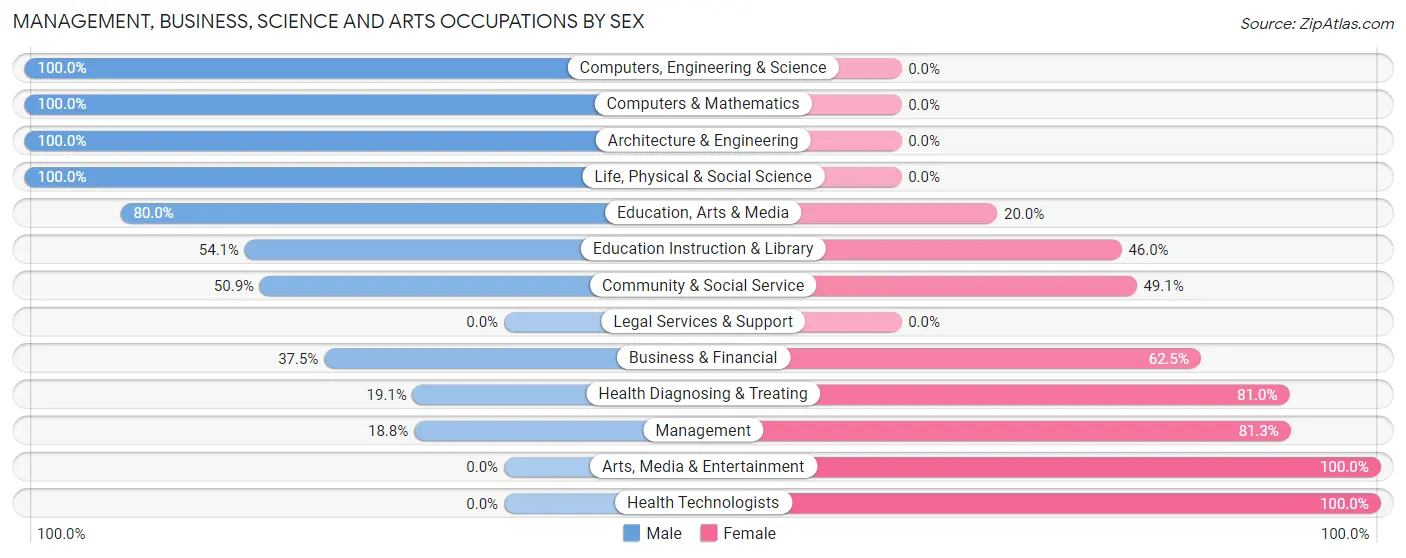
Management, Business, Science and Arts Occupations by Sex
Within the Management, Business, Science and Arts occupations in La Fontaine, the most male-oriented occupations are Computers, Engineering & Science (100.0%), Computers & Mathematics (100.0%), and Architecture & Engineering (100.0%), while the most female-oriented occupations are Arts, Media & Entertainment (100.0%), Health Technologists (100.0%), and Management (81.2%).
| Occupation | Male | Female |
| Management | 3 (18.8%) | 13 (81.2%) |
| Business & Financial | 3 (37.5%) | 5 (62.5%) |
| Computers, Engineering & Science | 14 (100.0%) | 0 (0.0%) |
| Computers & Mathematics | 7 (100.0%) | 0 (0.0%) |
| Architecture & Engineering | 5 (100.0%) | 0 (0.0%) |
| Life, Physical & Social Science | 2 (100.0%) | 0 (0.0%) |
| Community & Social Service | 28 (50.9%) | 27 (49.1%) |
| Education, Arts & Media | 8 (80.0%) | 2 (20.0%) |
| Legal Services & Support | 0 (0.0%) | 0 (0.0%) |
| Education Instruction & Library | 20 (54.0%) | 17 (46.0%) |
| Arts, Media & Entertainment | 0 (0.0%) | 8 (100.0%) |
| Health Diagnosing & Treating | 4 (19.1%) | 17 (80.9%) |
| Health Technologists | 0 (0.0%) | 8 (100.0%) |
| Total (Category) | 52 (45.6%) | 62 (54.4%) |
| Total (Overall) | 203 (47.3%) | 226 (52.7%) |
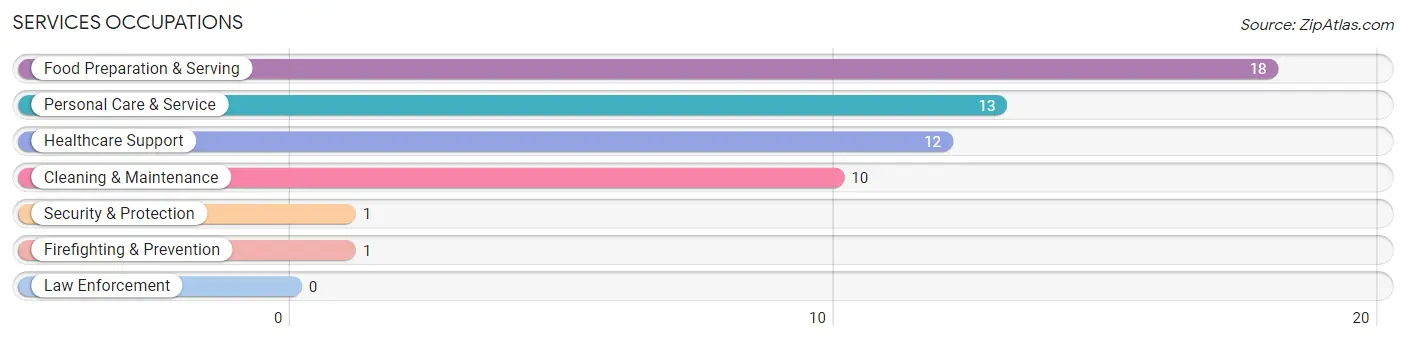
Services Occupations
The most common Services occupations in La Fontaine are Food Preparation & Serving (18 | 4.2%), Personal Care & Service (13 | 3.0%), Healthcare Support (12 | 2.8%), Cleaning & Maintenance (10 | 2.3%), and Security & Protection (1 | 0.2%).
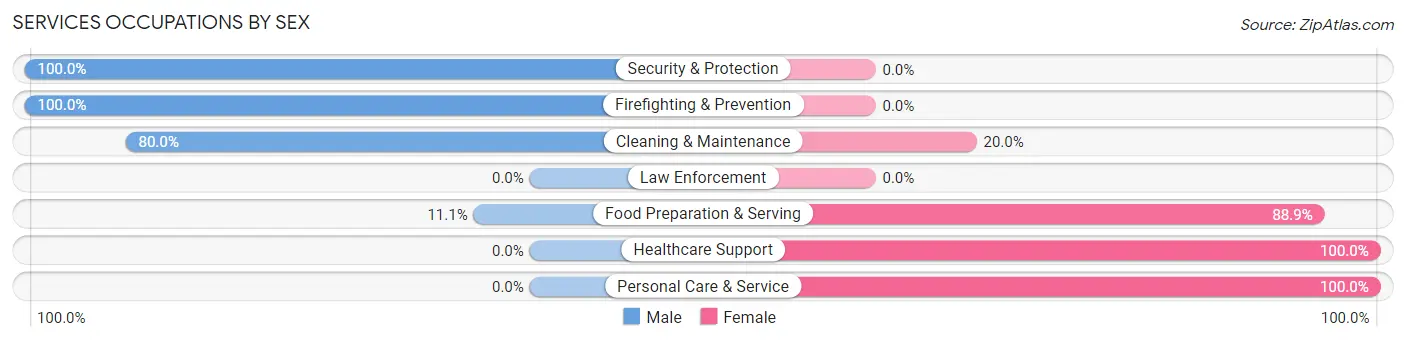
Services Occupations by Sex
Within the Services occupations in La Fontaine, the most male-oriented occupations are Security & Protection (100.0%), Firefighting & Prevention (100.0%), and Cleaning & Maintenance (80.0%), while the most female-oriented occupations are Healthcare Support (100.0%), Personal Care & Service (100.0%), and Food Preparation & Serving (88.9%).
| Occupation | Male | Female |
| Healthcare Support | 0 (0.0%) | 12 (100.0%) |
| Security & Protection | 1 (100.0%) | 0 (0.0%) |
| Firefighting & Prevention | 1 (100.0%) | 0 (0.0%) |
| Law Enforcement | 0 (0.0%) | 0 (0.0%) |
| Food Preparation & Serving | 2 (11.1%) | 16 (88.9%) |
| Cleaning & Maintenance | 8 (80.0%) | 2 (20.0%) |
| Personal Care & Service | 0 (0.0%) | 13 (100.0%) |
| Total (Category) | 11 (20.4%) | 43 (79.6%) |
| Total (Overall) | 203 (47.3%) | 226 (52.7%) |
Sales and Office Occupations
The most common Sales and Office occupations in La Fontaine are Office & Administration (101 | 23.5%), and Sales & Related (34 | 7.9%).
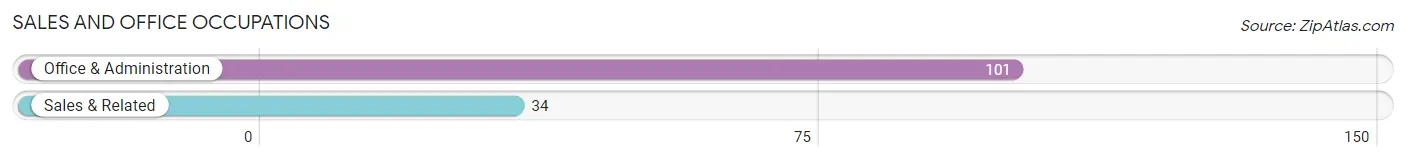
Sales and Office Occupations by Sex
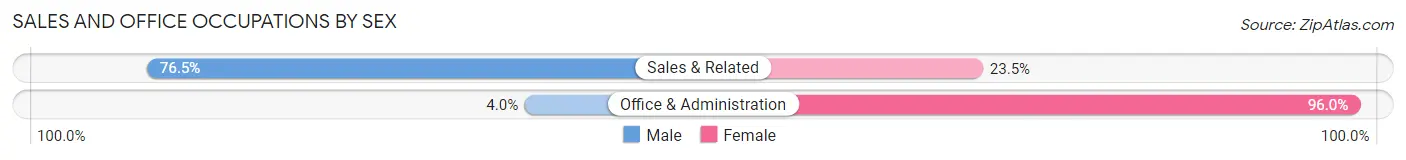
| Occupation | Male | Female |
| Sales & Related | 26 (76.5%) | 8 (23.5%) |
| Office & Administration | 4 (4.0%) | 97 (96.0%) |
| Total (Category) | 30 (22.2%) | 105 (77.8%) |
| Total (Overall) | 203 (47.3%) | 226 (52.7%) |
Natural Resources, Construction and Maintenance Occupations
The most common Natural Resources, Construction and Maintenance occupations in La Fontaine are Construction & Extraction (17 | 4.0%), Installation, Maintenance & Repair (13 | 3.0%), and Farming, Fishing & Forestry (3 | 0.7%).
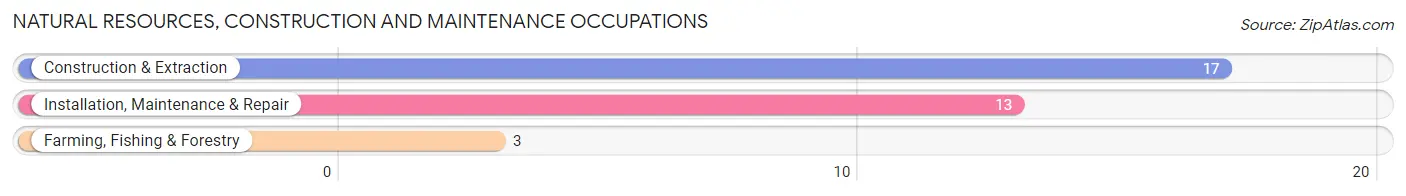
Natural Resources, Construction and Maintenance Occupations by Sex
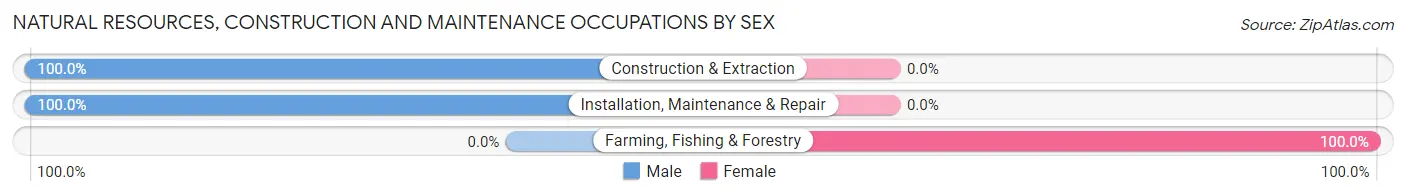
| Occupation | Male | Female |
| Farming, Fishing & Forestry | 0 (0.0%) | 3 (100.0%) |
| Construction & Extraction | 17 (100.0%) | 0 (0.0%) |
| Installation, Maintenance & Repair | 13 (100.0%) | 0 (0.0%) |
| Total (Category) | 30 (90.9%) | 3 (9.1%) |
| Total (Overall) | 203 (47.3%) | 226 (52.7%) |
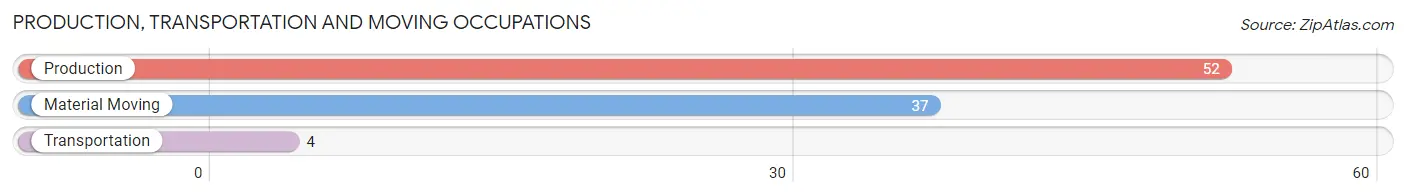
Production, Transportation and Moving Occupations
The most common Production, Transportation and Moving occupations in La Fontaine are Production (52 | 12.1%), Material Moving (37 | 8.6%), and Transportation (4 | 0.9%).
Production, Transportation and Moving Occupations by Sex
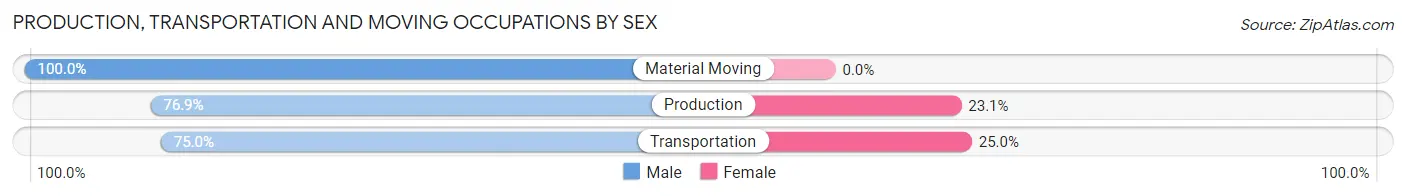
| Occupation | Male | Female |
| Production | 40 (76.9%) | 12 (23.1%) |
| Transportation | 3 (75.0%) | 1 (25.0%) |
| Material Moving | 37 (100.0%) | 0 (0.0%) |
| Total (Category) | 80 (86.0%) | 13 (14.0%) |
| Total (Overall) | 203 (47.3%) | 226 (52.7%) |
Employment Industries by Sex in La Fontaine
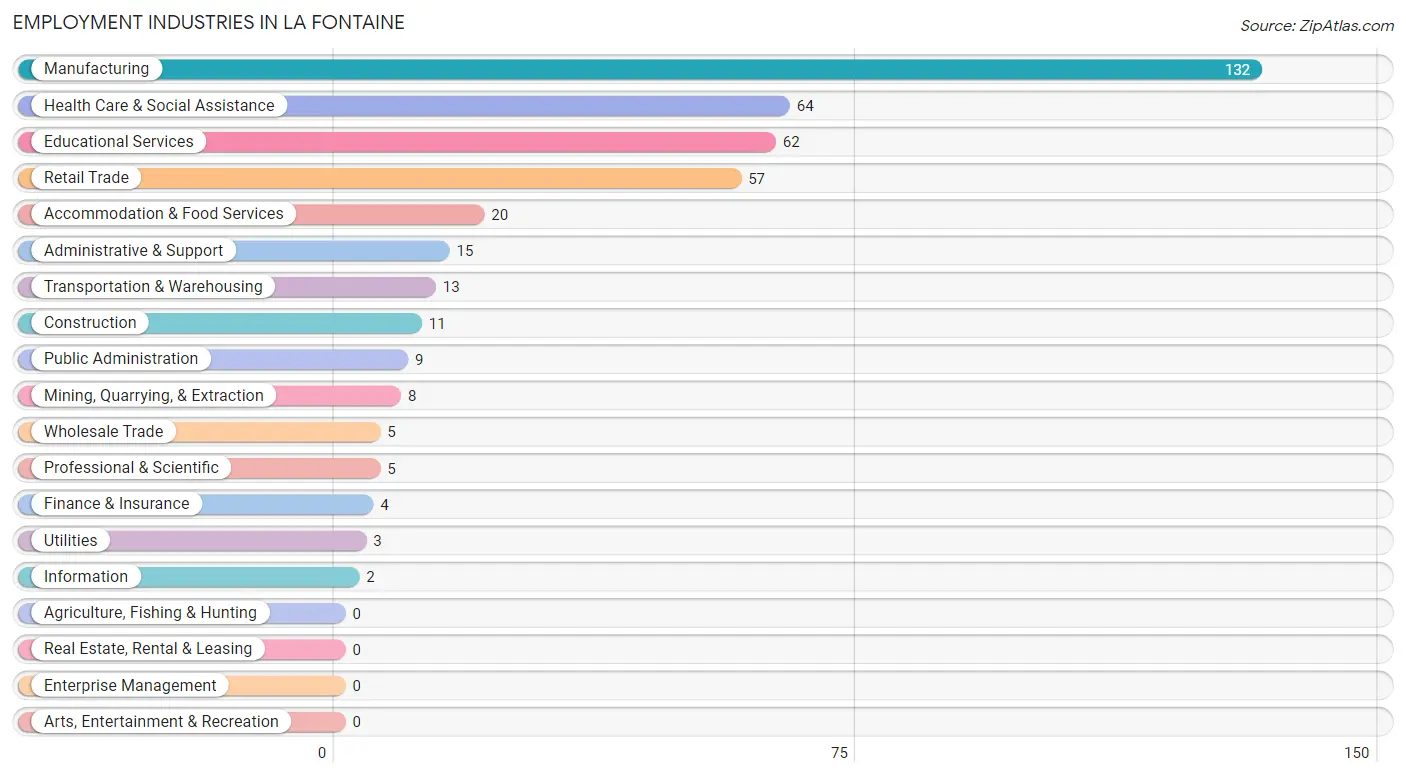
Employment Industries in La Fontaine
The major employment industries in La Fontaine include Manufacturing (132 | 30.8%), Health Care & Social Assistance (64 | 14.9%), Educational Services (62 | 14.4%), Retail Trade (57 | 13.3%), and Accommodation & Food Services (20 | 4.7%).
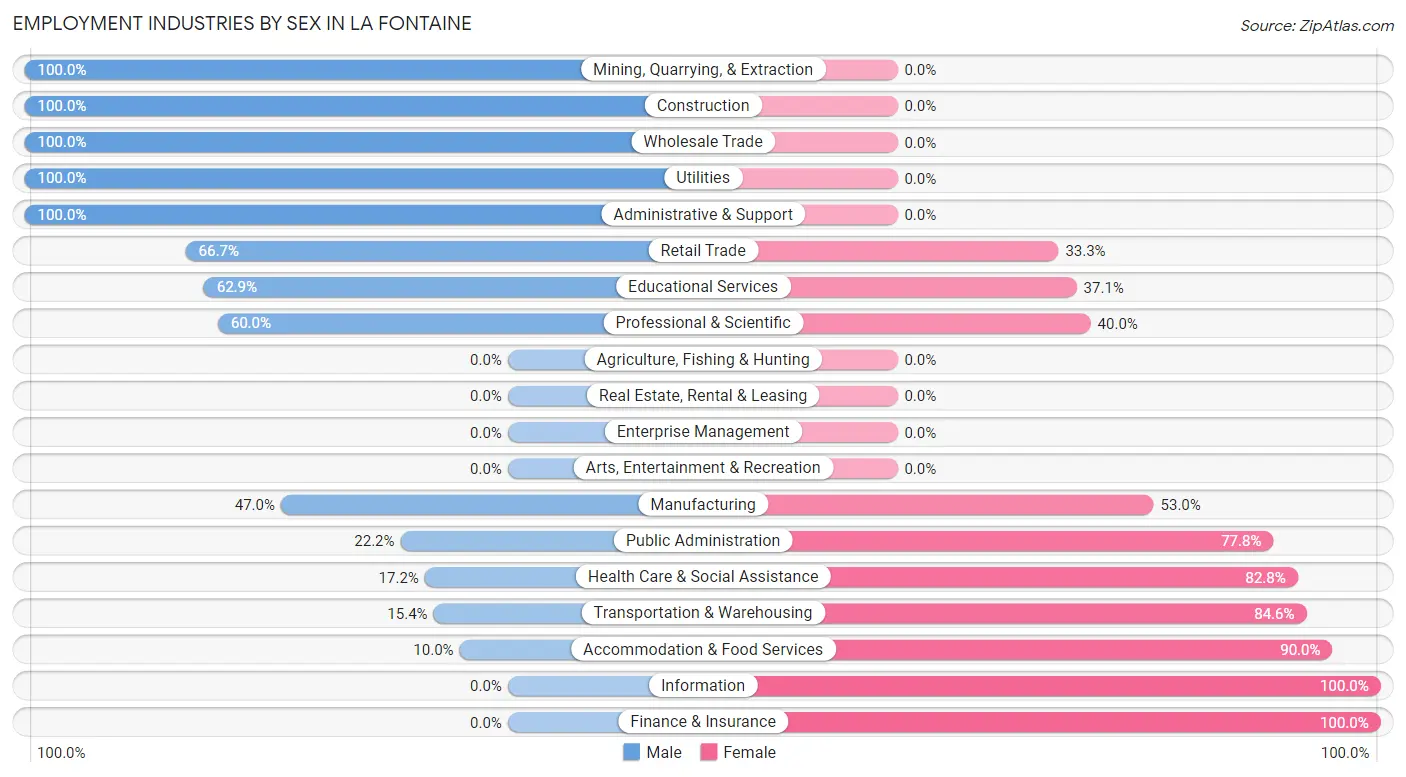
Employment Industries by Sex in La Fontaine
The La Fontaine industries that see more men than women are Mining, Quarrying, & Extraction (100.0%), Construction (100.0%), and Wholesale Trade (100.0%), whereas the industries that tend to have a higher number of women are Information (100.0%), Finance & Insurance (100.0%), and Accommodation & Food Services (90.0%).
| Industry | Male | Female |
| Agriculture, Fishing & Hunting | 0 (0.0%) | 0 (0.0%) |
| Mining, Quarrying, & Extraction | 8 (100.0%) | 0 (0.0%) |
| Construction | 11 (100.0%) | 0 (0.0%) |
| Manufacturing | 62 (47.0%) | 70 (53.0%) |
| Wholesale Trade | 5 (100.0%) | 0 (0.0%) |
| Retail Trade | 38 (66.7%) | 19 (33.3%) |
| Transportation & Warehousing | 2 (15.4%) | 11 (84.6%) |
| Utilities | 3 (100.0%) | 0 (0.0%) |
| Information | 0 (0.0%) | 2 (100.0%) |
| Finance & Insurance | 0 (0.0%) | 4 (100.0%) |
| Real Estate, Rental & Leasing | 0 (0.0%) | 0 (0.0%) |
| Professional & Scientific | 3 (60.0%) | 2 (40.0%) |
| Enterprise Management | 0 (0.0%) | 0 (0.0%) |
| Administrative & Support | 15 (100.0%) | 0 (0.0%) |
| Educational Services | 39 (62.9%) | 23 (37.1%) |
| Health Care & Social Assistance | 11 (17.2%) | 53 (82.8%) |
| Arts, Entertainment & Recreation | 0 (0.0%) | 0 (0.0%) |
| Accommodation & Food Services | 2 (10.0%) | 18 (90.0%) |
| Public Administration | 2 (22.2%) | 7 (77.8%) |
| Total | 203 (47.3%) | 226 (52.7%) |
Education in La Fontaine
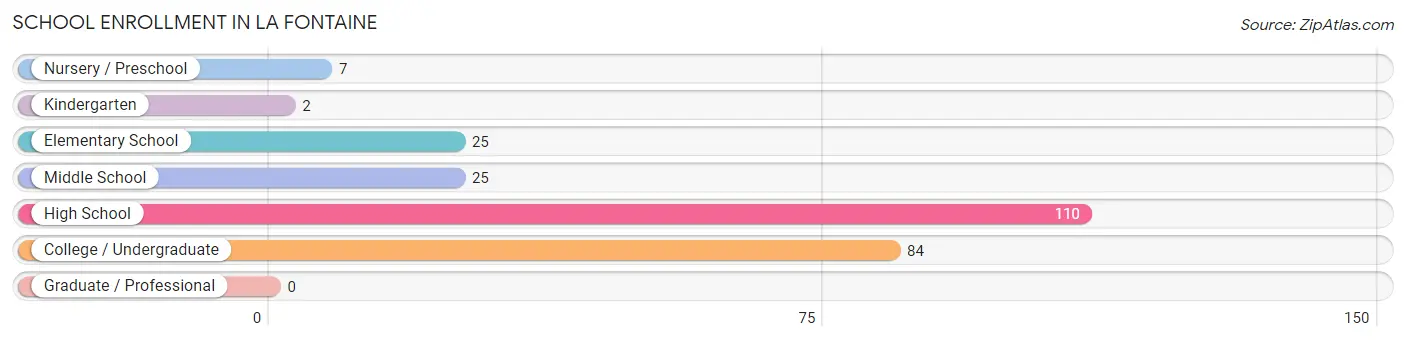
School Enrollment in La Fontaine
The most common levels of schooling among the 253 students in La Fontaine are high school (110 | 43.5%), college / undergraduate (84 | 33.2%), and elementary school (25 | 9.9%).
| School Level | # Students | % Students |
| Nursery / Preschool | 7 | 2.8% |
| Kindergarten | 2 | 0.8% |
| Elementary School | 25 | 9.9% |
| Middle School | 25 | 9.9% |
| High School | 110 | 43.5% |
| College / Undergraduate | 84 | 33.2% |
| Graduate / Professional | 0 | 0.0% |
| Total | 253 | 100.0% |
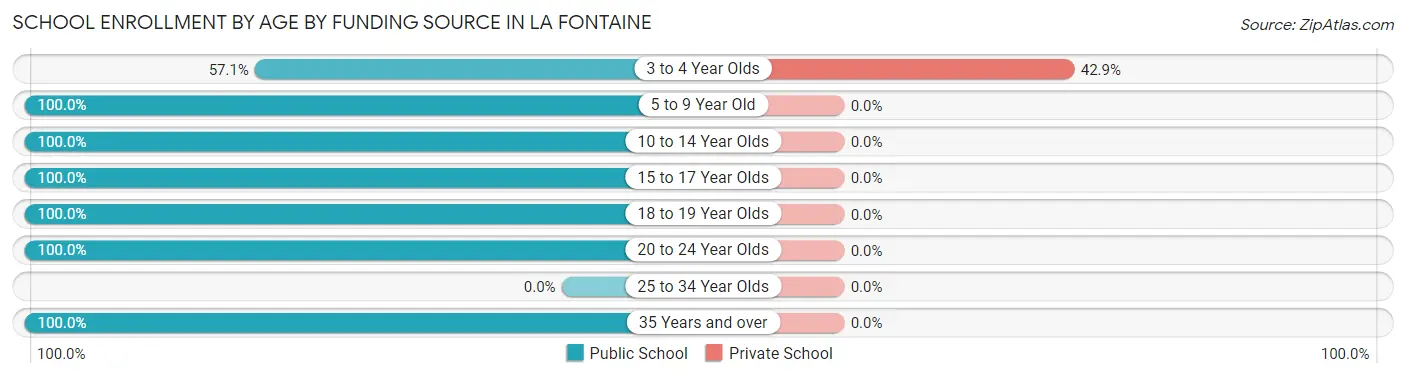
School Enrollment by Age by Funding Source in La Fontaine
Out of a total of 253 students who are enrolled in schools in La Fontaine, 3 (1.2%) attend a private institution, while the remaining 250 (98.8%) are enrolled in public schools. The age group of 3 to 4 year olds has the highest likelihood of being enrolled in private schools, with 3 (42.9% in the age bracket) enrolled. Conversely, the age group of 5 to 9 year old has the lowest likelihood of being enrolled in a private school, with 23 (100.0% in the age bracket) attending a public institution.
| Age Bracket | Public School | Private School |
| 3 to 4 Year Olds | 4 (57.1%) | 3 (42.9%) |
| 5 to 9 Year Old | 23 (100.0%) | 0 (0.0%) |
| 10 to 14 Year Olds | 29 (100.0%) | 0 (0.0%) |
| 15 to 17 Year Olds | 95 (100.0%) | 0 (0.0%) |
| 18 to 19 Year Olds | 18 (100.0%) | 0 (0.0%) |
| 20 to 24 Year Olds | 16 (100.0%) | 0 (0.0%) |
| 25 to 34 Year Olds | 0 (0.0%) | 0 (0.0%) |
| 35 Years and over | 65 (100.0%) | 0 (0.0%) |
| Total | 250 (98.8%) | 3 (1.2%) |
Educational Attainment by Field of Study in La Fontaine
Education (49 | 41.9%), arts & humanities (15 | 12.8%), science & technology (13 | 11.1%), computers & mathematics (8 | 6.8%), and psychology (8 | 6.8%) are the most common fields of study among 117 individuals in La Fontaine who have obtained a bachelor's degree or higher.
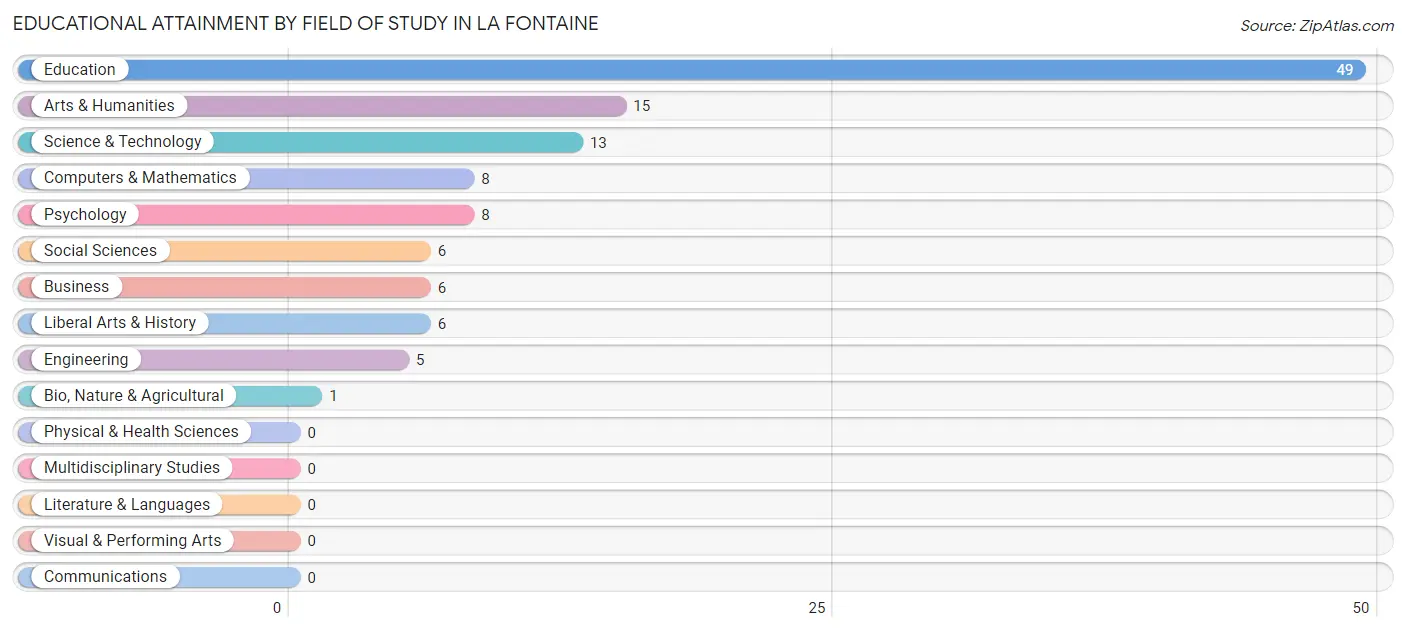
| Field of Study | # Graduates | % Graduates |
| Computers & Mathematics | 8 | 6.8% |
| Bio, Nature & Agricultural | 1 | 0.9% |
| Physical & Health Sciences | 0 | 0.0% |
| Psychology | 8 | 6.8% |
| Social Sciences | 6 | 5.1% |
| Engineering | 5 | 4.3% |
| Multidisciplinary Studies | 0 | 0.0% |
| Science & Technology | 13 | 11.1% |
| Business | 6 | 5.1% |
| Education | 49 | 41.9% |
| Literature & Languages | 0 | 0.0% |
| Liberal Arts & History | 6 | 5.1% |
| Visual & Performing Arts | 0 | 0.0% |
| Communications | 0 | 0.0% |
| Arts & Humanities | 15 | 12.8% |
| Total | 117 | 100.0% |
Transportation & Commute in La Fontaine
Vehicle Availability by Sex in La Fontaine
The most prevalent vehicle ownership categories in La Fontaine are males with 2 vehicles (64, accounting for 31.5%) and females with 2 vehicles (130, making up 28.6%).
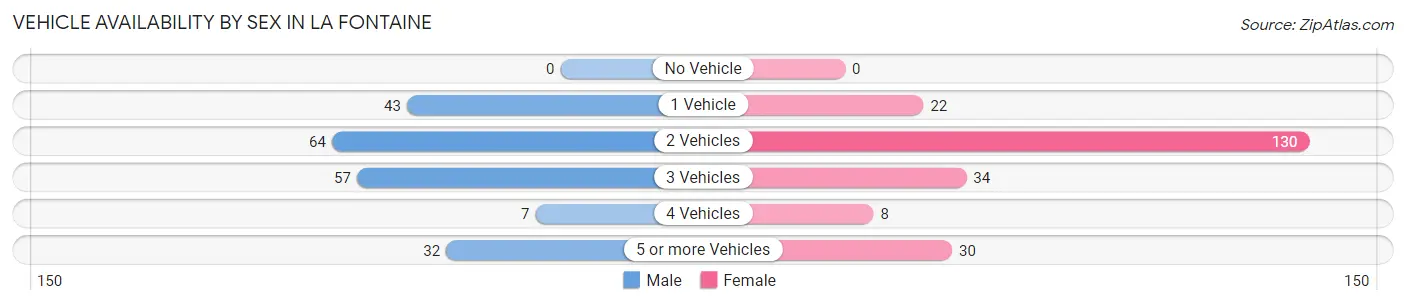
| Vehicles Available | Male | Female |
| No Vehicle | 0 (0.0%) | 0 (0.0%) |
| 1 Vehicle | 43 (21.2%) | 22 (9.8%) |
| 2 Vehicles | 64 (31.5%) | 130 (58.0%) |
| 3 Vehicles | 57 (28.1%) | 34 (15.2%) |
| 4 Vehicles | 7 (3.5%) | 8 (3.6%) |
| 5 or more Vehicles | 32 (15.8%) | 30 (13.4%) |
| Total | 203 (100.0%) | 224 (100.0%) |
Commute Time in La Fontaine
The most frequently occuring commute durations in La Fontaine are 20 to 24 minutes (181 commuters, 43.2%), 10 to 14 minutes (64 commuters, 15.3%), and 15 to 19 minutes (56 commuters, 13.4%).
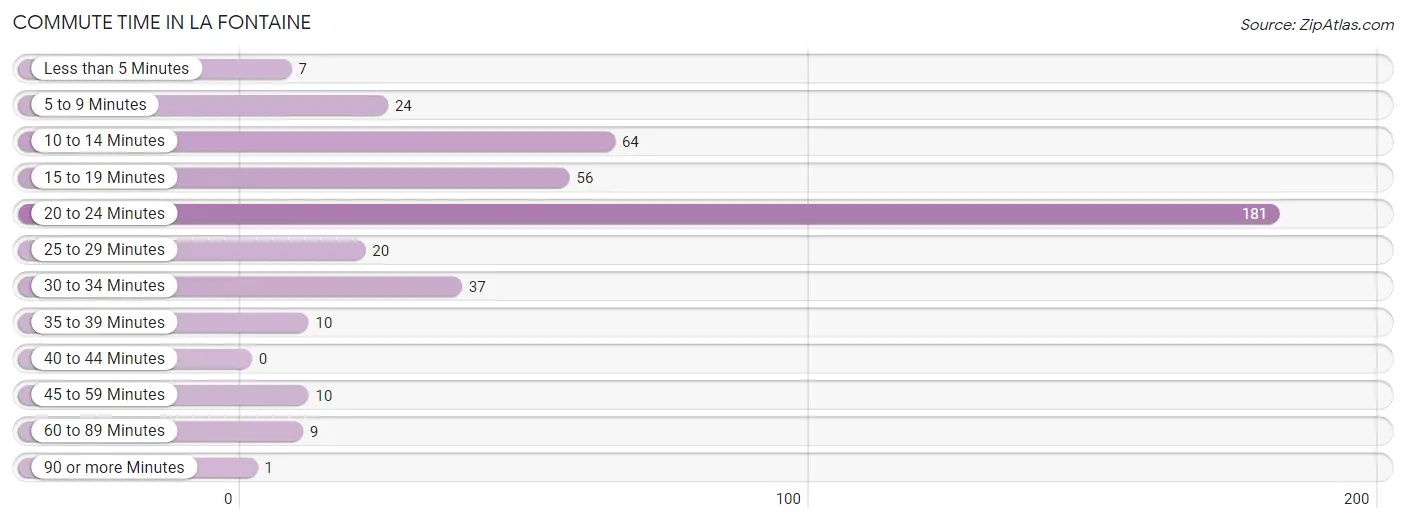
| Commute Time | # Commuters | % Commuters |
| Less than 5 Minutes | 7 | 1.7% |
| 5 to 9 Minutes | 24 | 5.7% |
| 10 to 14 Minutes | 64 | 15.3% |
| 15 to 19 Minutes | 56 | 13.4% |
| 20 to 24 Minutes | 181 | 43.2% |
| 25 to 29 Minutes | 20 | 4.8% |
| 30 to 34 Minutes | 37 | 8.8% |
| 35 to 39 Minutes | 10 | 2.4% |
| 40 to 44 Minutes | 0 | 0.0% |
| 45 to 59 Minutes | 10 | 2.4% |
| 60 to 89 Minutes | 9 | 2.1% |
| 90 or more Minutes | 1 | 0.2% |
Commute Time by Sex in La Fontaine
The most common commute times in La Fontaine are 20 to 24 minutes (60 commuters, 29.6%) for males and 20 to 24 minutes (121 commuters, 56.0%) for females.
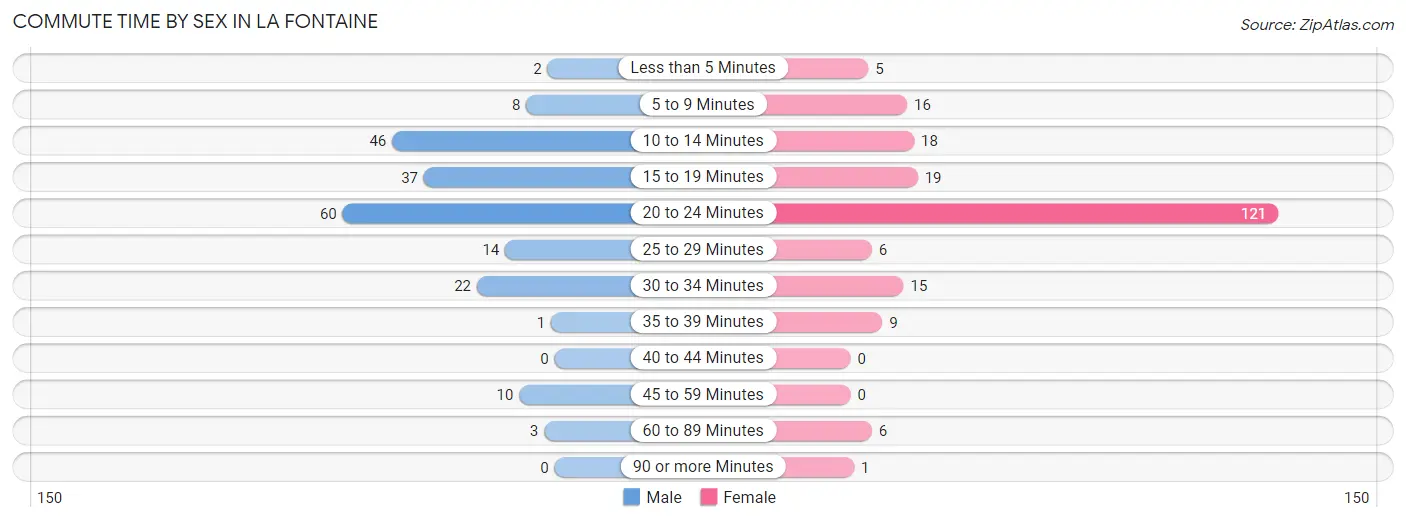
| Commute Time | Male | Female |
| Less than 5 Minutes | 2 (1.0%) | 5 (2.3%) |
| 5 to 9 Minutes | 8 (3.9%) | 16 (7.4%) |
| 10 to 14 Minutes | 46 (22.7%) | 18 (8.3%) |
| 15 to 19 Minutes | 37 (18.2%) | 19 (8.8%) |
| 20 to 24 Minutes | 60 (29.6%) | 121 (56.0%) |
| 25 to 29 Minutes | 14 (6.9%) | 6 (2.8%) |
| 30 to 34 Minutes | 22 (10.8%) | 15 (6.9%) |
| 35 to 39 Minutes | 1 (0.5%) | 9 (4.2%) |
| 40 to 44 Minutes | 0 (0.0%) | 0 (0.0%) |
| 45 to 59 Minutes | 10 (4.9%) | 0 (0.0%) |
| 60 to 89 Minutes | 3 (1.5%) | 6 (2.8%) |
| 90 or more Minutes | 0 (0.0%) | 1 (0.5%) |
Time of Departure to Work by Sex in La Fontaine
The most frequent times of departure to work in La Fontaine are 7:30 AM to 7:59 AM (45, 22.2%) for males and 7:30 AM to 7:59 AM (83, 38.4%) for females.
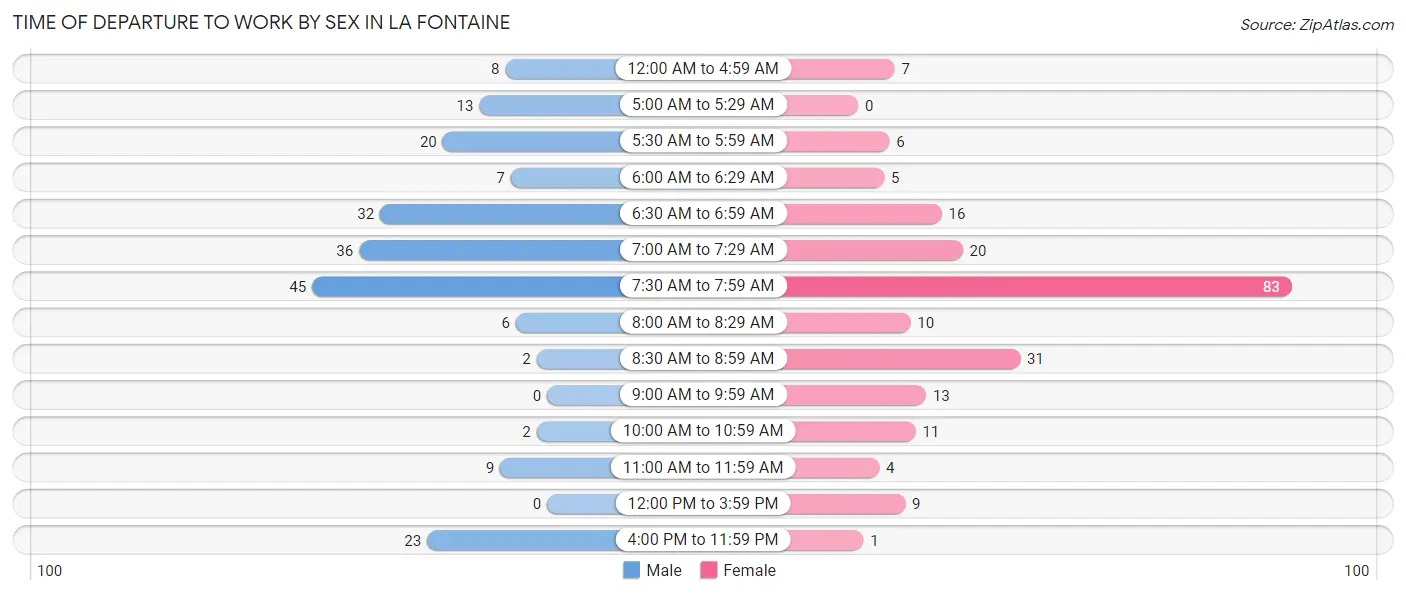
| Time of Departure | Male | Female |
| 12:00 AM to 4:59 AM | 8 (3.9%) | 7 (3.2%) |
| 5:00 AM to 5:29 AM | 13 (6.4%) | 0 (0.0%) |
| 5:30 AM to 5:59 AM | 20 (9.9%) | 6 (2.8%) |
| 6:00 AM to 6:29 AM | 7 (3.5%) | 5 (2.3%) |
| 6:30 AM to 6:59 AM | 32 (15.8%) | 16 (7.4%) |
| 7:00 AM to 7:29 AM | 36 (17.7%) | 20 (9.3%) |
| 7:30 AM to 7:59 AM | 45 (22.2%) | 83 (38.4%) |
| 8:00 AM to 8:29 AM | 6 (3.0%) | 10 (4.6%) |
| 8:30 AM to 8:59 AM | 2 (1.0%) | 31 (14.3%) |
| 9:00 AM to 9:59 AM | 0 (0.0%) | 13 (6.0%) |
| 10:00 AM to 10:59 AM | 2 (1.0%) | 11 (5.1%) |
| 11:00 AM to 11:59 AM | 9 (4.4%) | 4 (1.8%) |
| 12:00 PM to 3:59 PM | 0 (0.0%) | 9 (4.2%) |
| 4:00 PM to 11:59 PM | 23 (11.3%) | 1 (0.5%) |
| Total | 203 (100.0%) | 216 (100.0%) |
Housing Occupancy in La Fontaine
Occupancy by Ownership in La Fontaine
Of the total 325 dwellings in La Fontaine, owner-occupied units account for 279 (85.9%), while renter-occupied units make up 46 (14.1%).
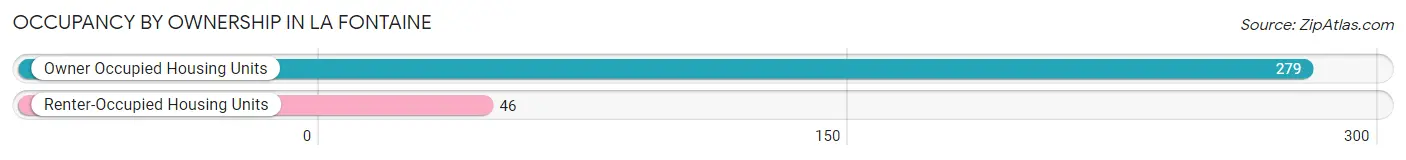
| Occupancy | # Housing Units | % Housing Units |
| Owner Occupied Housing Units | 279 | 85.9% |
| Renter-Occupied Housing Units | 46 | 14.1% |
| Total Occupied Housing Units | 325 | 100.0% |
Occupancy by Household Size in La Fontaine
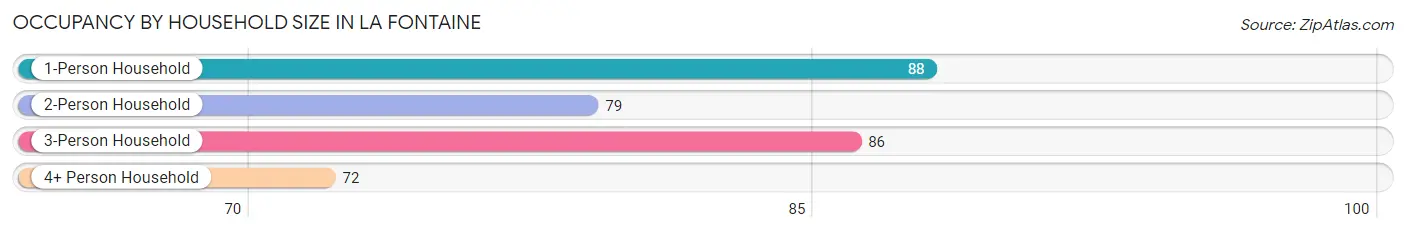
| Household Size | # Housing Units | % Housing Units |
| 1-Person Household | 88 | 27.1% |
| 2-Person Household | 79 | 24.3% |
| 3-Person Household | 86 | 26.5% |
| 4+ Person Household | 72 | 22.2% |
| Total Housing Units | 325 | 100.0% |
Occupancy by Ownership by Household Size in La Fontaine
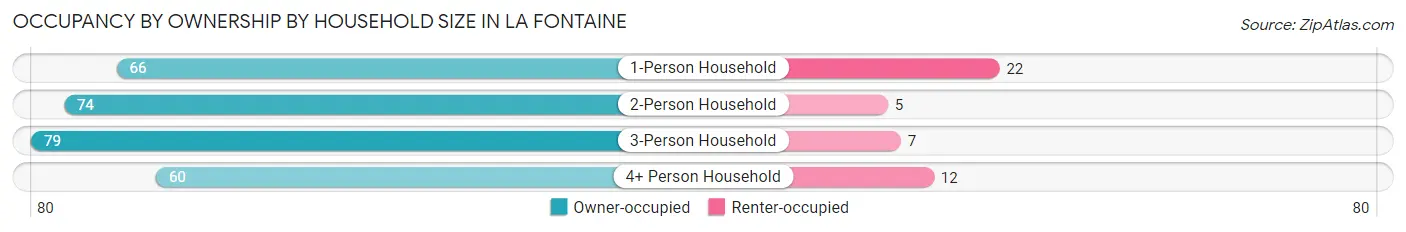
| Household Size | Owner-occupied | Renter-occupied |
| 1-Person Household | 66 (75.0%) | 22 (25.0%) |
| 2-Person Household | 74 (93.7%) | 5 (6.3%) |
| 3-Person Household | 79 (91.9%) | 7 (8.1%) |
| 4+ Person Household | 60 (83.3%) | 12 (16.7%) |
| Total Housing Units | 279 (85.9%) | 46 (14.1%) |
Occupancy by Educational Attainment in La Fontaine
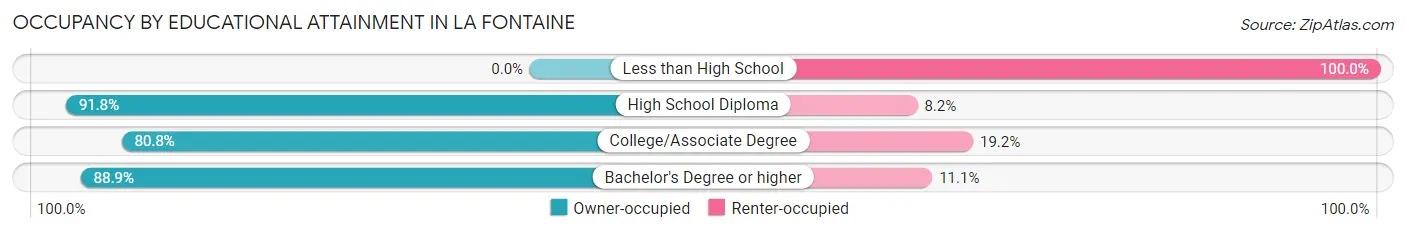
| Household Size | Owner-occupied | Renter-occupied |
| Less than High School | 0 (0.0%) | 1 (100.0%) |
| High School Diploma | 101 (91.8%) | 9 (8.2%) |
| College/Associate Degree | 122 (80.8%) | 29 (19.2%) |
| Bachelor's Degree or higher | 56 (88.9%) | 7 (11.1%) |
Occupancy by Age of Householder in La Fontaine
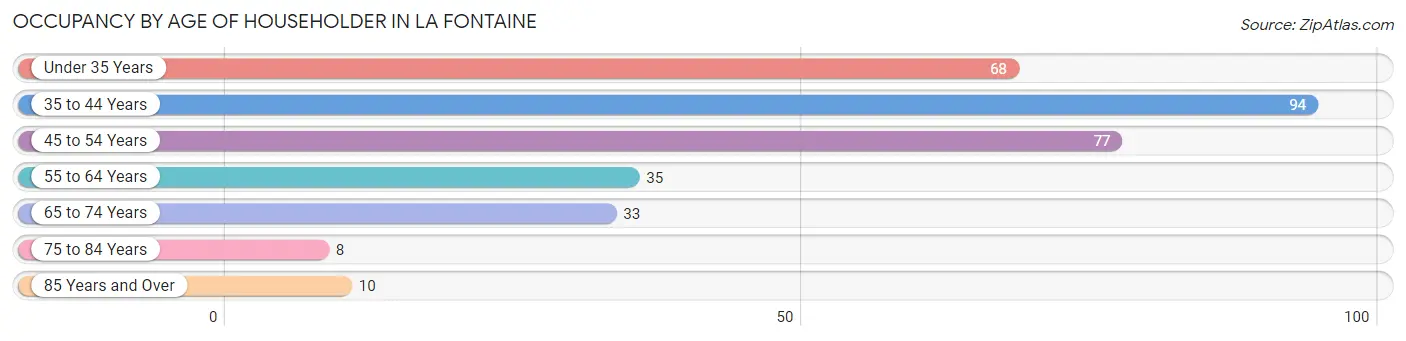
| Age Bracket | # Households | % Households |
| Under 35 Years | 68 | 20.9% |
| 35 to 44 Years | 94 | 28.9% |
| 45 to 54 Years | 77 | 23.7% |
| 55 to 64 Years | 35 | 10.8% |
| 65 to 74 Years | 33 | 10.2% |
| 75 to 84 Years | 8 | 2.5% |
| 85 Years and Over | 10 | 3.1% |
| Total | 325 | 100.0% |
Housing Finances in La Fontaine
Median Income by Occupancy in La Fontaine
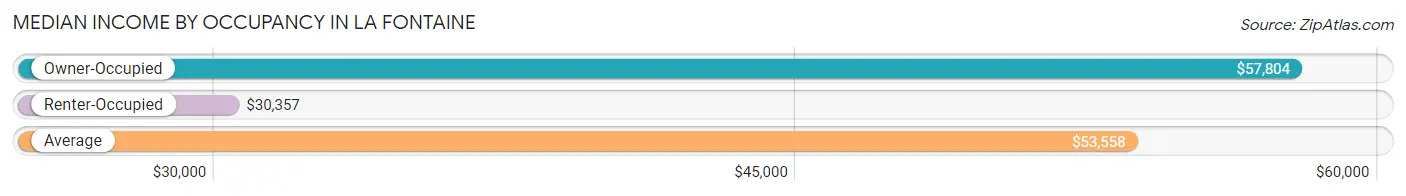
| Occupancy Type | # Households | Median Income |
| Owner-Occupied | 279 (85.9%) | $57,804 |
| Renter-Occupied | 46 (14.1%) | $30,357 |
| Average | 325 (100.0%) | $53,558 |
Occupancy by Householder Income Bracket in La Fontaine
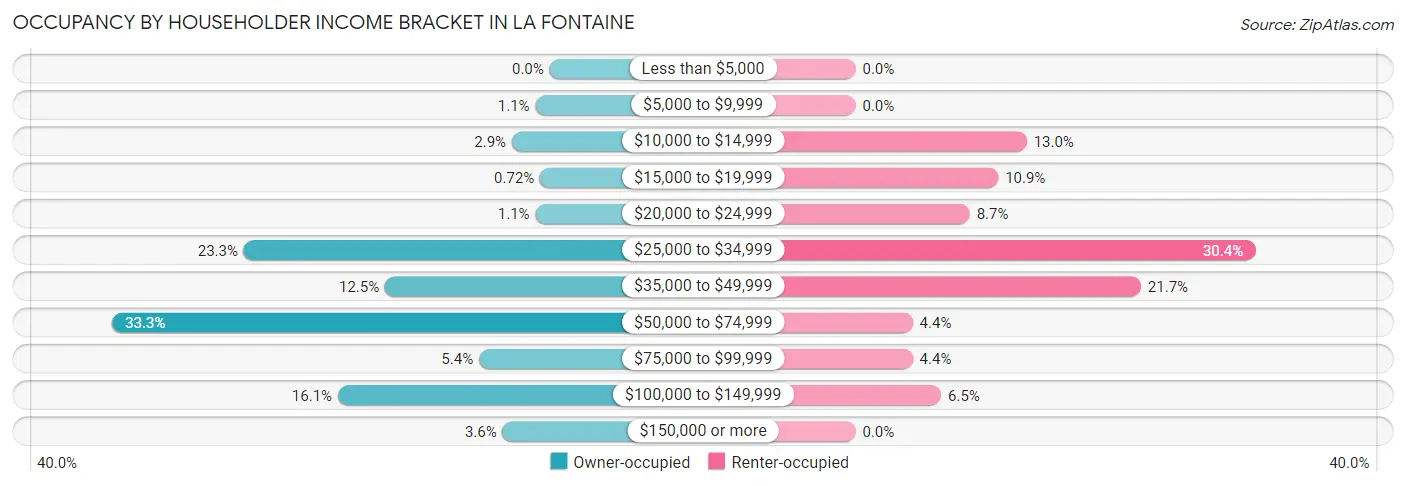
| Income Bracket | Owner-occupied | Renter-occupied |
| Less than $5,000 | 0 (0.0%) | 0 (0.0%) |
| $5,000 to $9,999 | 3 (1.1%) | 0 (0.0%) |
| $10,000 to $14,999 | 8 (2.9%) | 6 (13.0%) |
| $15,000 to $19,999 | 2 (0.7%) | 5 (10.9%) |
| $20,000 to $24,999 | 3 (1.1%) | 4 (8.7%) |
| $25,000 to $34,999 | 65 (23.3%) | 14 (30.4%) |
| $35,000 to $49,999 | 35 (12.5%) | 10 (21.7%) |
| $50,000 to $74,999 | 93 (33.3%) | 2 (4.3%) |
| $75,000 to $99,999 | 15 (5.4%) | 2 (4.3%) |
| $100,000 to $149,999 | 45 (16.1%) | 3 (6.5%) |
| $150,000 or more | 10 (3.6%) | 0 (0.0%) |
| Total | 279 (100.0%) | 46 (100.0%) |
Monthly Housing Cost Tiers in La Fontaine
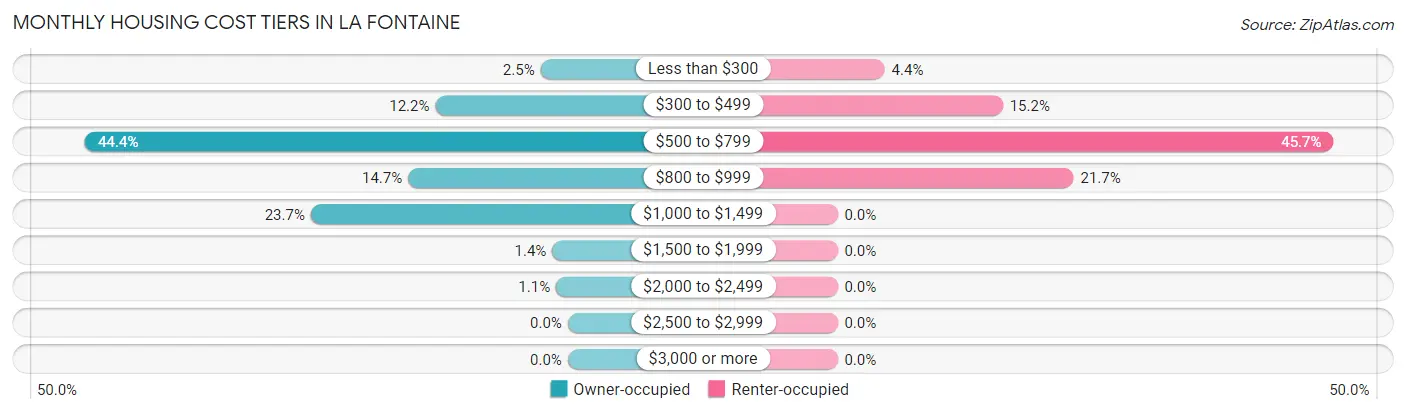
| Monthly Cost | Owner-occupied | Renter-occupied |
| Less than $300 | 7 (2.5%) | 2 (4.3%) |
| $300 to $499 | 34 (12.2%) | 7 (15.2%) |
| $500 to $799 | 124 (44.4%) | 21 (45.7%) |
| $800 to $999 | 41 (14.7%) | 10 (21.7%) |
| $1,000 to $1,499 | 66 (23.7%) | 0 (0.0%) |
| $1,500 to $1,999 | 4 (1.4%) | 0 (0.0%) |
| $2,000 to $2,499 | 3 (1.1%) | 0 (0.0%) |
| $2,500 to $2,999 | 0 (0.0%) | 0 (0.0%) |
| $3,000 or more | 0 (0.0%) | 0 (0.0%) |
| Total | 279 (100.0%) | 46 (100.0%) |
Physical Housing Characteristics in La Fontaine
Housing Structures in La Fontaine
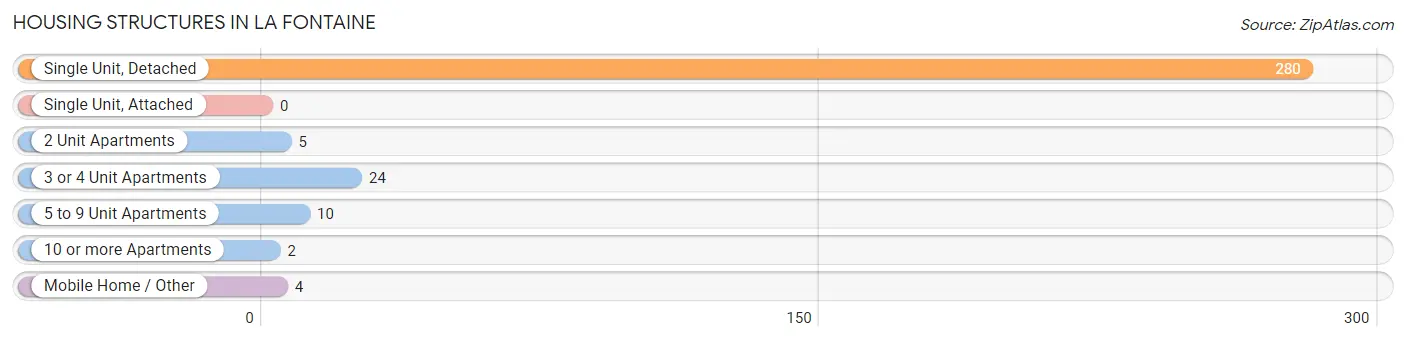
| Structure Type | # Housing Units | % Housing Units |
| Single Unit, Detached | 280 | 86.2% |
| Single Unit, Attached | 0 | 0.0% |
| 2 Unit Apartments | 5 | 1.5% |
| 3 or 4 Unit Apartments | 24 | 7.4% |
| 5 to 9 Unit Apartments | 10 | 3.1% |
| 10 or more Apartments | 2 | 0.6% |
| Mobile Home / Other | 4 | 1.2% |
| Total | 325 | 100.0% |
Housing Structures by Occupancy in La Fontaine
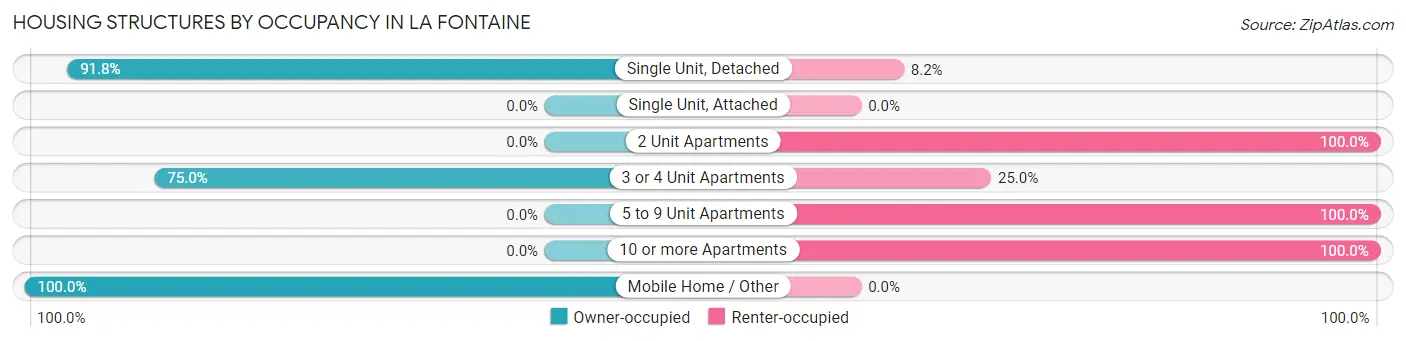
| Structure Type | Owner-occupied | Renter-occupied |
| Single Unit, Detached | 257 (91.8%) | 23 (8.2%) |
| Single Unit, Attached | 0 (0.0%) | 0 (0.0%) |
| 2 Unit Apartments | 0 (0.0%) | 5 (100.0%) |
| 3 or 4 Unit Apartments | 18 (75.0%) | 6 (25.0%) |
| 5 to 9 Unit Apartments | 0 (0.0%) | 10 (100.0%) |
| 10 or more Apartments | 0 (0.0%) | 2 (100.0%) |
| Mobile Home / Other | 4 (100.0%) | 0 (0.0%) |
| Total | 279 (85.9%) | 46 (14.1%) |
Housing Structures by Number of Rooms in La Fontaine
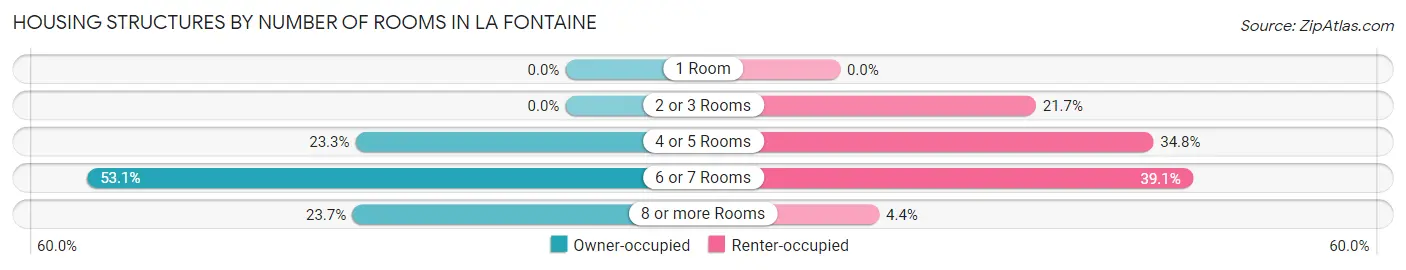
| Number of Rooms | Owner-occupied | Renter-occupied |
| 1 Room | 0 (0.0%) | 0 (0.0%) |
| 2 or 3 Rooms | 0 (0.0%) | 10 (21.7%) |
| 4 or 5 Rooms | 65 (23.3%) | 16 (34.8%) |
| 6 or 7 Rooms | 148 (53.0%) | 18 (39.1%) |
| 8 or more Rooms | 66 (23.7%) | 2 (4.3%) |
| Total | 279 (100.0%) | 46 (100.0%) |
Housing Structure by Heating Type in La Fontaine
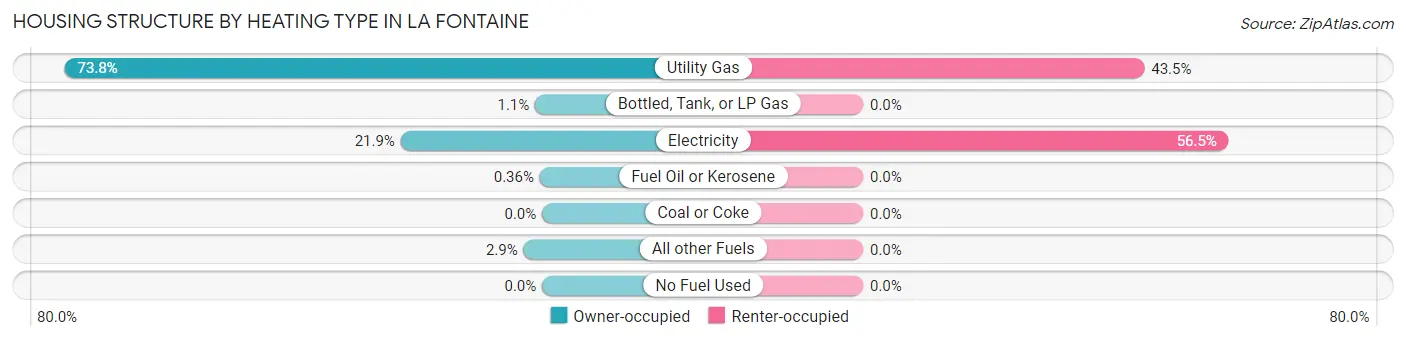
| Heating Type | Owner-occupied | Renter-occupied |
| Utility Gas | 206 (73.8%) | 20 (43.5%) |
| Bottled, Tank, or LP Gas | 3 (1.1%) | 0 (0.0%) |
| Electricity | 61 (21.9%) | 26 (56.5%) |
| Fuel Oil or Kerosene | 1 (0.4%) | 0 (0.0%) |
| Coal or Coke | 0 (0.0%) | 0 (0.0%) |
| All other Fuels | 8 (2.9%) | 0 (0.0%) |
| No Fuel Used | 0 (0.0%) | 0 (0.0%) |
| Total | 279 (100.0%) | 46 (100.0%) |
Household Vehicle Usage in La Fontaine
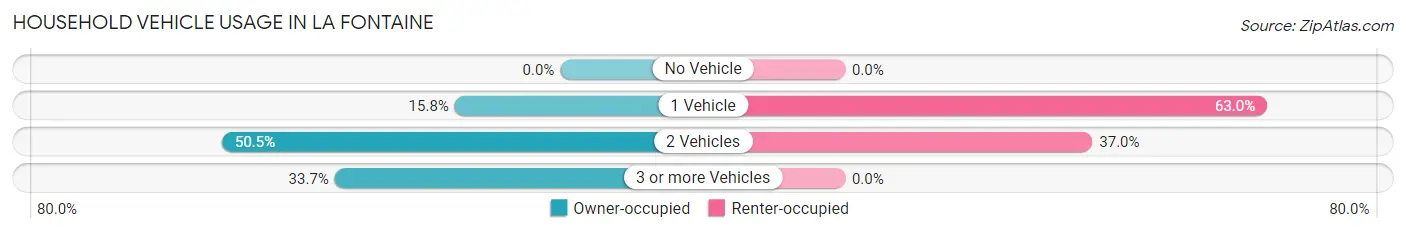
| Vehicles per Household | Owner-occupied | Renter-occupied |
| No Vehicle | 0 (0.0%) | 0 (0.0%) |
| 1 Vehicle | 44 (15.8%) | 29 (63.0%) |
| 2 Vehicles | 141 (50.5%) | 17 (37.0%) |
| 3 or more Vehicles | 94 (33.7%) | 0 (0.0%) |
| Total | 279 (100.0%) | 46 (100.0%) |
Real Estate & Mortgages in La Fontaine
Real Estate and Mortgage Overview in La Fontaine
| Characteristic | Without Mortgage | With Mortgage |
| Housing Units | 61 | 218 |
| Median Property Value | $92,800 | $75,000 |
| Median Household Income | $70,625 | $9 |
| Monthly Housing Costs | $472 | $0 |
| Real Estate Taxes | $389 | $71 |
Property Value by Mortgage Status in La Fontaine
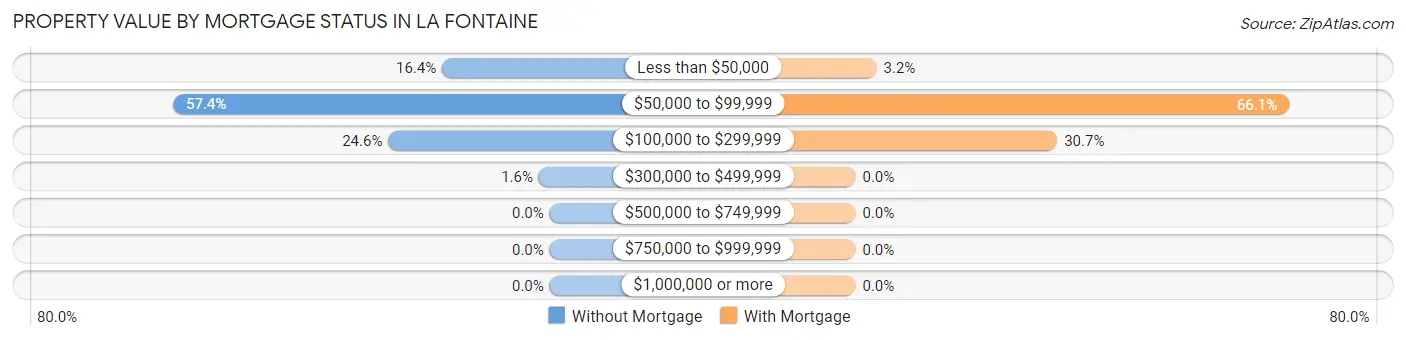
| Property Value | Without Mortgage | With Mortgage |
| Less than $50,000 | 10 (16.4%) | 7 (3.2%) |
| $50,000 to $99,999 | 35 (57.4%) | 144 (66.1%) |
| $100,000 to $299,999 | 15 (24.6%) | 67 (30.7%) |
| $300,000 to $499,999 | 1 (1.6%) | 0 (0.0%) |
| $500,000 to $749,999 | 0 (0.0%) | 0 (0.0%) |
| $750,000 to $999,999 | 0 (0.0%) | 0 (0.0%) |
| $1,000,000 or more | 0 (0.0%) | 0 (0.0%) |
| Total | 61 (100.0%) | 218 (100.0%) |
Household Income by Mortgage Status in La Fontaine
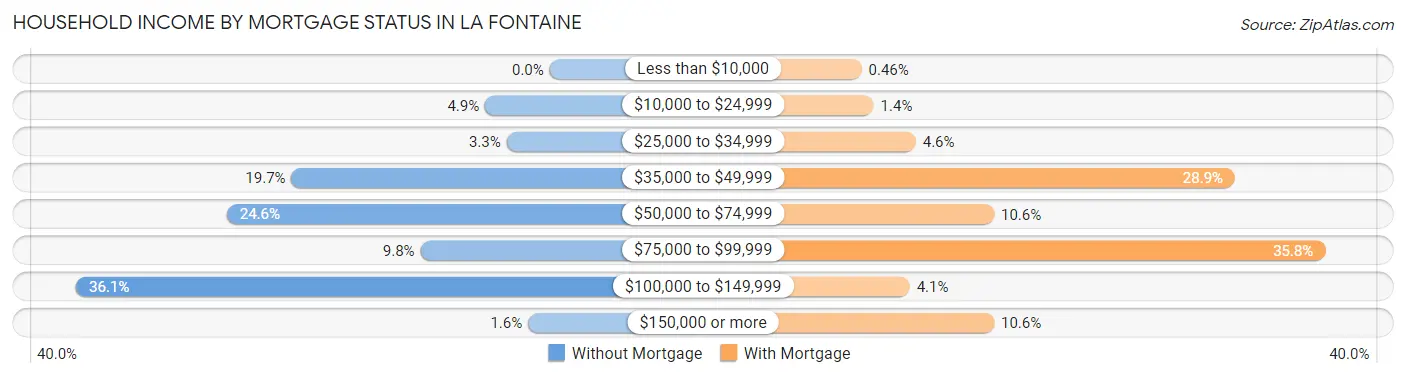
| Household Income | Without Mortgage | With Mortgage |
| Less than $10,000 | 0 (0.0%) | 1 (0.5%) |
| $10,000 to $24,999 | 3 (4.9%) | 3 (1.4%) |
| $25,000 to $34,999 | 2 (3.3%) | 10 (4.6%) |
| $35,000 to $49,999 | 12 (19.7%) | 63 (28.9%) |
| $50,000 to $74,999 | 15 (24.6%) | 23 (10.5%) |
| $75,000 to $99,999 | 6 (9.8%) | 78 (35.8%) |
| $100,000 to $149,999 | 22 (36.1%) | 9 (4.1%) |
| $150,000 or more | 1 (1.6%) | 23 (10.5%) |
| Total | 61 (100.0%) | 218 (100.0%) |
Property Value to Household Income Ratio in La Fontaine
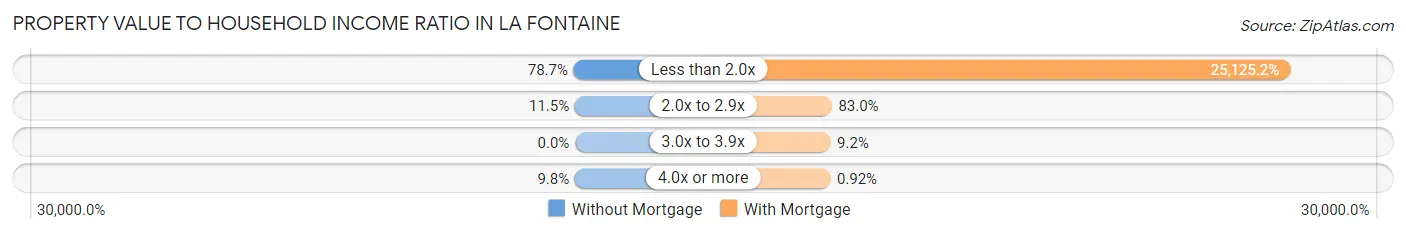
| Value-to-Income Ratio | Without Mortgage | With Mortgage |
| Less than 2.0x | 48 (78.7%) | 54,773 (25,125.2%) |
| 2.0x to 2.9x | 7 (11.5%) | 181 (83.0%) |
| 3.0x to 3.9x | 0 (0.0%) | 20 (9.2%) |
| 4.0x or more | 6 (9.8%) | 2 (0.9%) |
| Total | 61 (100.0%) | 218 (100.0%) |
Real Estate Taxes by Mortgage Status in La Fontaine
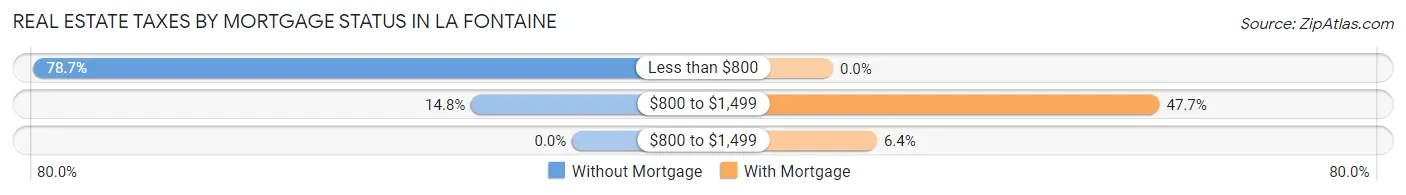
| Property Taxes | Without Mortgage | With Mortgage |
| Less than $800 | 48 (78.7%) | 0 (0.0%) |
| $800 to $1,499 | 9 (14.7%) | 104 (47.7%) |
| $800 to $1,499 | 0 (0.0%) | 14 (6.4%) |
| Total | 61 (100.0%) | 218 (100.0%) |
Health & Disability in La Fontaine
Health Insurance Coverage by Age in La Fontaine
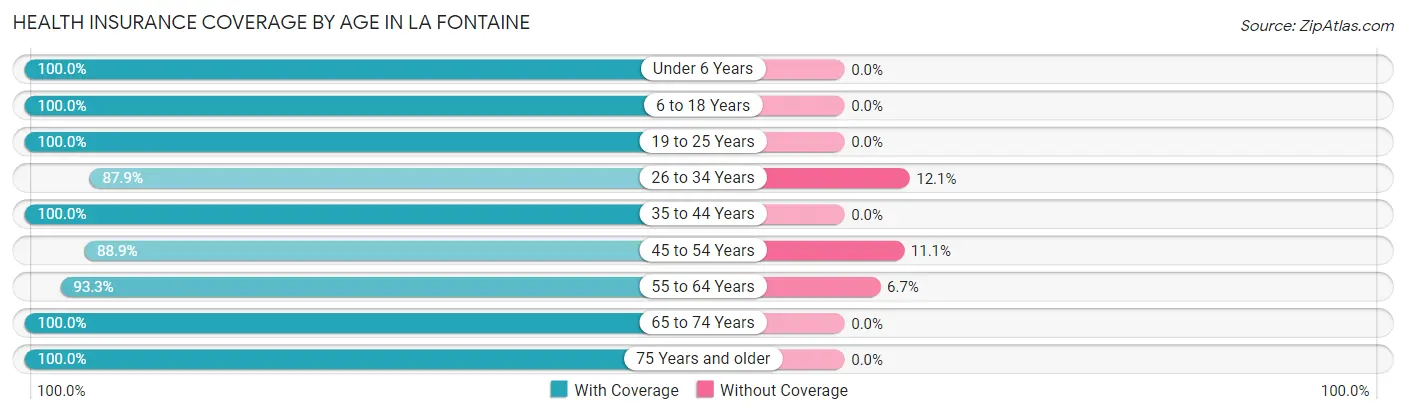
| Age Bracket | With Coverage | Without Coverage |
| Under 6 Years | 83 (100.0%) | 0 (0.0%) |
| 6 to 18 Years | 165 (100.0%) | 0 (0.0%) |
| 19 to 25 Years | 69 (100.0%) | 0 (0.0%) |
| 26 to 34 Years | 58 (87.9%) | 8 (12.1%) |
| 35 to 44 Years | 119 (100.0%) | 0 (0.0%) |
| 45 to 54 Years | 120 (88.9%) | 15 (11.1%) |
| 55 to 64 Years | 56 (93.3%) | 4 (6.7%) |
| 65 to 74 Years | 54 (100.0%) | 0 (0.0%) |
| 75 Years and older | 32 (100.0%) | 0 (0.0%) |
| Total | 756 (96.6%) | 27 (3.5%) |
Health Insurance Coverage by Citizenship Status in La Fontaine
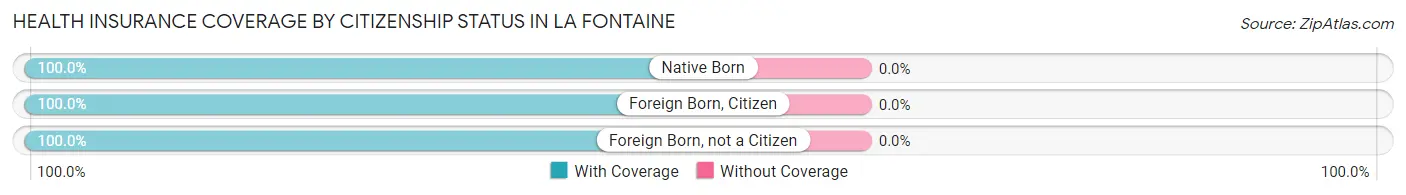
| Citizenship Status | With Coverage | Without Coverage |
| Native Born | 83 (100.0%) | 0 (0.0%) |
| Foreign Born, Citizen | 165 (100.0%) | 0 (0.0%) |
| Foreign Born, not a Citizen | 69 (100.0%) | 0 (0.0%) |
Health Insurance Coverage by Household Income in La Fontaine
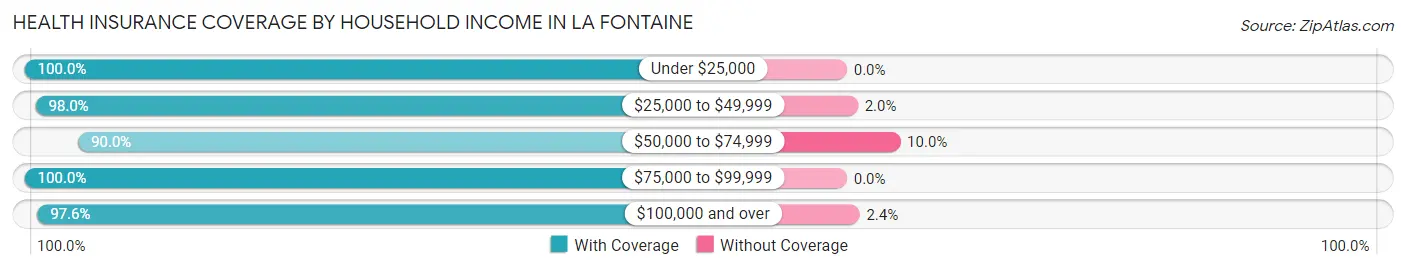
| Household Income | With Coverage | Without Coverage |
| Under $25,000 | 119 (100.0%) | 0 (0.0%) |
| $25,000 to $49,999 | 240 (98.0%) | 5 (2.0%) |
| $50,000 to $74,999 | 153 (90.0%) | 17 (10.0%) |
| $75,000 to $99,999 | 38 (100.0%) | 0 (0.0%) |
| $100,000 and over | 206 (97.6%) | 5 (2.4%) |
Public vs Private Health Insurance Coverage by Age in La Fontaine
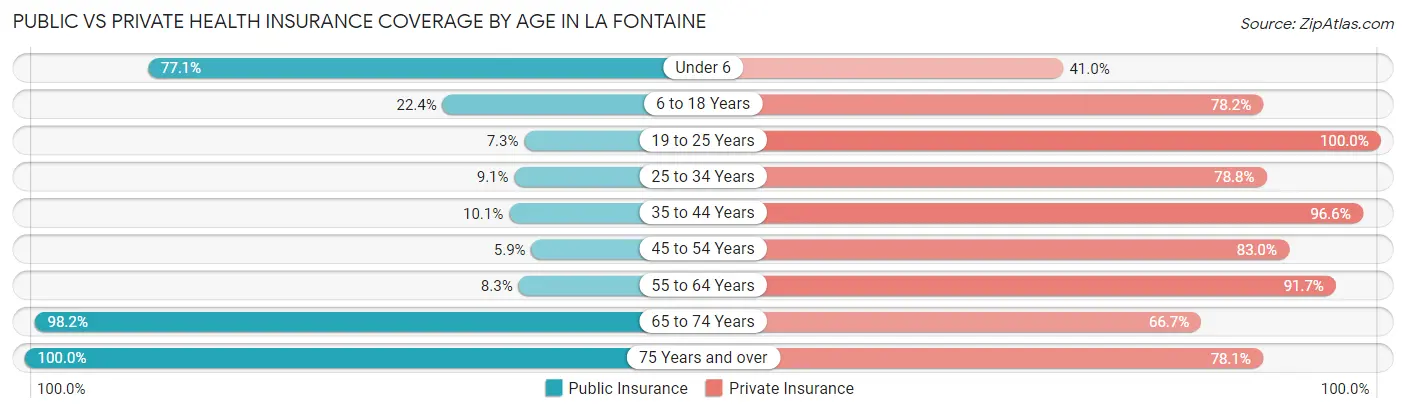
| Age Bracket | Public Insurance | Private Insurance |
| Under 6 | 64 (77.1%) | 34 (41.0%) |
| 6 to 18 Years | 37 (22.4%) | 129 (78.2%) |
| 19 to 25 Years | 5 (7.2%) | 69 (100.0%) |
| 25 to 34 Years | 6 (9.1%) | 52 (78.8%) |
| 35 to 44 Years | 12 (10.1%) | 115 (96.6%) |
| 45 to 54 Years | 8 (5.9%) | 112 (83.0%) |
| 55 to 64 Years | 5 (8.3%) | 55 (91.7%) |
| 65 to 74 Years | 53 (98.2%) | 36 (66.7%) |
| 75 Years and over | 32 (100.0%) | 25 (78.1%) |
| Total | 222 (28.3%) | 627 (80.1%) |
Disability Status by Sex by Age in La Fontaine
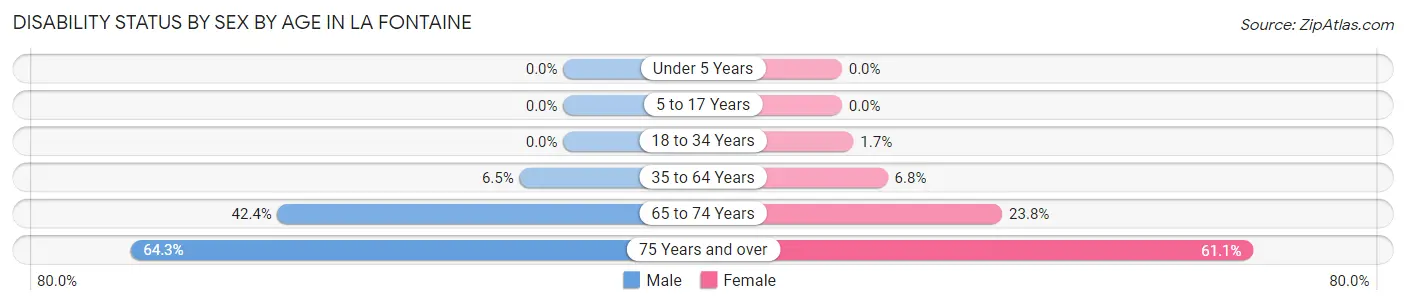
| Age Bracket | Male | Female |
| Under 5 Years | 0 (0.0%) | 0 (0.0%) |
| 5 to 17 Years | 0 (0.0%) | 0 (0.0%) |
| 18 to 34 Years | 0 (0.0%) | 1 (1.7%) |
| 35 to 64 Years | 8 (6.5%) | 13 (6.8%) |
| 65 to 74 Years | 14 (42.4%) | 5 (23.8%) |
| 75 Years and over | 9 (64.3%) | 11 (61.1%) |
Disability Class by Sex by Age in La Fontaine
Disability Class: Hearing Difficulty
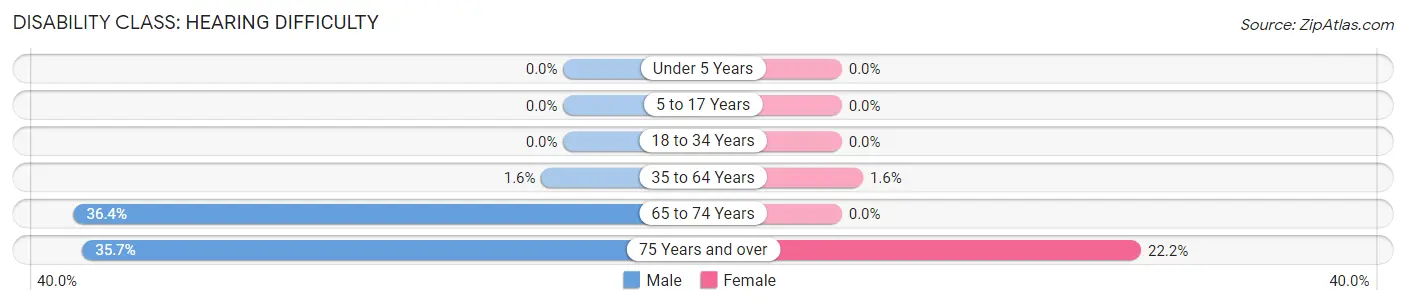
| Age Bracket | Male | Female |
| Under 5 Years | 0 (0.0%) | 0 (0.0%) |
| 5 to 17 Years | 0 (0.0%) | 0 (0.0%) |
| 18 to 34 Years | 0 (0.0%) | 0 (0.0%) |
| 35 to 64 Years | 2 (1.6%) | 3 (1.6%) |
| 65 to 74 Years | 12 (36.4%) | 0 (0.0%) |
| 75 Years and over | 5 (35.7%) | 4 (22.2%) |
Disability Class: Vision Difficulty
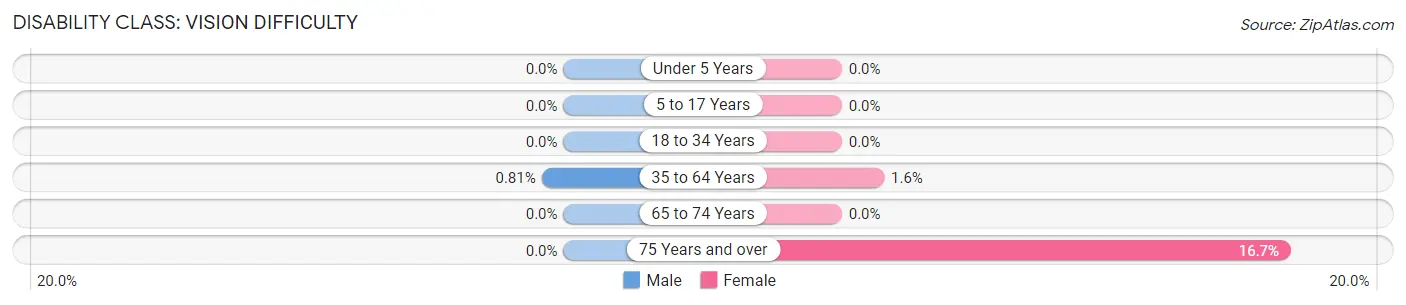
| Age Bracket | Male | Female |
| Under 5 Years | 0 (0.0%) | 0 (0.0%) |
| 5 to 17 Years | 0 (0.0%) | 0 (0.0%) |
| 18 to 34 Years | 0 (0.0%) | 0 (0.0%) |
| 35 to 64 Years | 1 (0.8%) | 3 (1.6%) |
| 65 to 74 Years | 0 (0.0%) | 0 (0.0%) |
| 75 Years and over | 0 (0.0%) | 3 (16.7%) |
Disability Class: Cognitive Difficulty
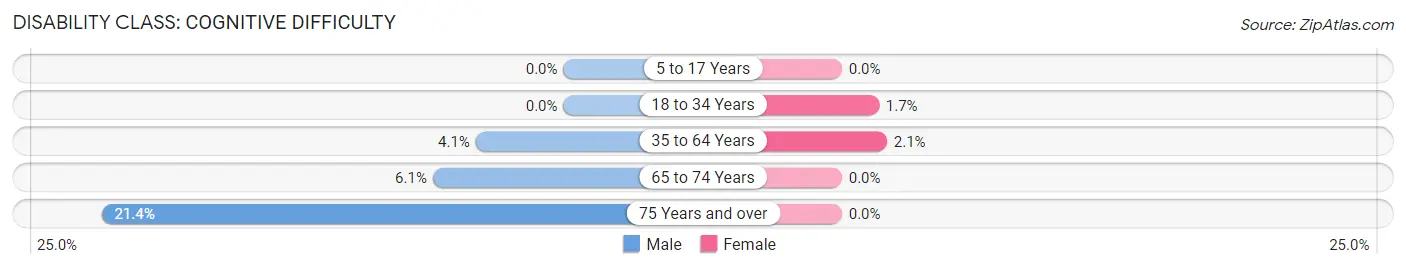
| Age Bracket | Male | Female |
| 5 to 17 Years | 0 (0.0%) | 0 (0.0%) |
| 18 to 34 Years | 0 (0.0%) | 1 (1.7%) |
| 35 to 64 Years | 5 (4.1%) | 4 (2.1%) |
| 65 to 74 Years | 2 (6.1%) | 0 (0.0%) |
| 75 Years and over | 3 (21.4%) | 0 (0.0%) |
Disability Class: Ambulatory Difficulty
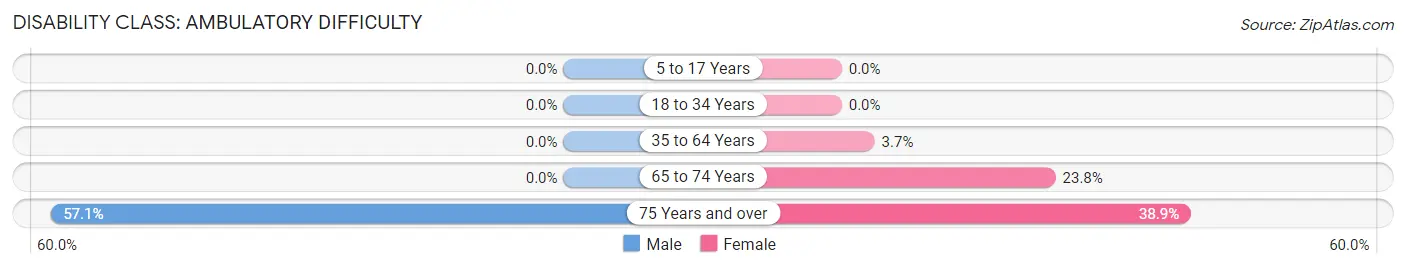
| Age Bracket | Male | Female |
| 5 to 17 Years | 0 (0.0%) | 0 (0.0%) |
| 18 to 34 Years | 0 (0.0%) | 0 (0.0%) |
| 35 to 64 Years | 0 (0.0%) | 7 (3.7%) |
| 65 to 74 Years | 0 (0.0%) | 5 (23.8%) |
| 75 Years and over | 8 (57.1%) | 7 (38.9%) |
Disability Class: Self-Care Difficulty
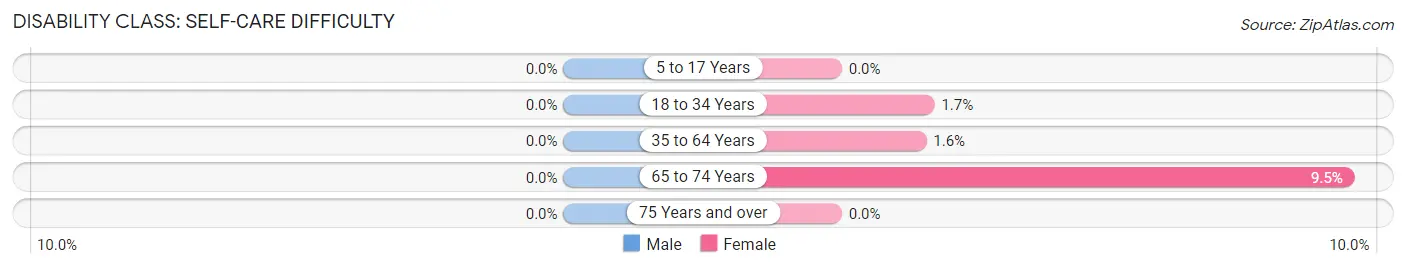
| Age Bracket | Male | Female |
| 5 to 17 Years | 0 (0.0%) | 0 (0.0%) |
| 18 to 34 Years | 0 (0.0%) | 1 (1.7%) |
| 35 to 64 Years | 0 (0.0%) | 3 (1.6%) |
| 65 to 74 Years | 0 (0.0%) | 2 (9.5%) |
| 75 Years and over | 0 (0.0%) | 0 (0.0%) |
Technology Access in La Fontaine
Computing Device Access in La Fontaine
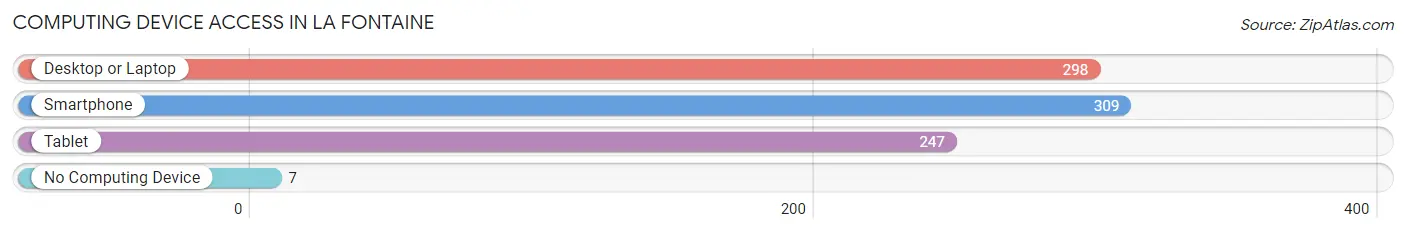
| Device Type | # Households | % Households |
| Desktop or Laptop | 298 | 91.7% |
| Smartphone | 309 | 95.1% |
| Tablet | 247 | 76.0% |
| No Computing Device | 7 | 2.1% |
| Total | 325 | 100.0% |
Internet Access in La Fontaine
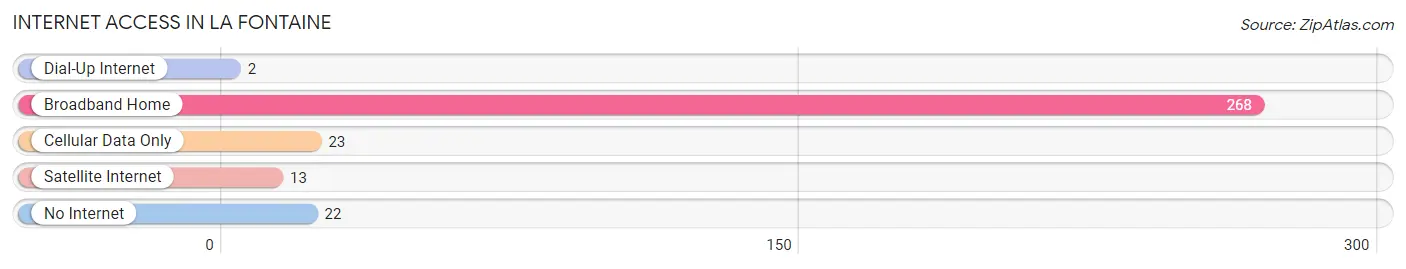
| Internet Type | # Households | % Households |
| Dial-Up Internet | 2 | 0.6% |
| Broadband Home | 268 | 82.5% |
| Cellular Data Only | 23 | 7.1% |
| Satellite Internet | 13 | 4.0% |
| No Internet | 22 | 6.8% |
| Total | 325 | 100.0% |
La Fontaine Summary
La Fontaine is a small town located in Wabash County, Indiana. It is situated in the Wabash River Valley, approximately 20 miles south of Fort Wayne. The town was founded in 1837 and is named after the nearby La Fontaine Creek. As of the 2010 census, the population of La Fontaine was 1,072.
History
La Fontaine was founded in 1837 by a group of settlers from Ohio. The town was named after the nearby La Fontaine Creek, which was named after the French explorer, Robert La Salle. The town was originally a farming community, but it soon developed into a small industrial center. The first industry in La Fontaine was a sawmill, which was built in 1838. This was followed by a gristmill, a woolen mill, and a tannery.
In 1851, the Wabash and Erie Canal was completed, connecting La Fontaine to the Ohio River. This allowed for increased trade and commerce in the area, and the town began to grow. By the late 19th century, La Fontaine had become a thriving community with a variety of businesses, including a bank, a newspaper, a hotel, and several churches.
Geography
La Fontaine is located in Wabash County, Indiana. It is situated in the Wabash River Valley, approximately 20 miles south of Fort Wayne. The town is located at an elevation of 845 feet above sea level. The total area of La Fontaine is 0.7 square miles, all of which is land.
The climate in La Fontaine is classified as humid continental. The average temperature in the summer is around 75 degrees Fahrenheit, and the average temperature in the winter is around 30 degrees Fahrenheit. The average annual precipitation is around 40 inches.
Economy
The economy of La Fontaine is largely based on agriculture and manufacturing. The town is home to several small businesses, including a grocery store, a hardware store, and a restaurant. The town also has a few small manufacturing companies, including a plastics factory and a metal fabrication plant.
The town is also home to a few large employers, including a medical center and a trucking company. The medical center is the largest employer in the town, employing over 500 people.
Demographics
As of the 2010 census, the population of La Fontaine was 1,072. The racial makeup of the town was 97.2% White, 0.7% African American, 0.2% Native American, 0.2% Asian, 0.2% from other races, and 1.7% from two or more races. Hispanic or Latino of any race were 1.2% of the population.
The median household income in La Fontaine was $41,250, and the median family income was $50,000. The per capita income was $20,845. About 11.2% of families and 14.2% of the population were below the poverty line, including 18.2% of those under age 18 and 8.3% of those age 65 or over.
Common Questions
What is Per Capita Income in La Fontaine?
Per Capita income in La Fontaine is $25,266.
What is the Median Family Income in La Fontaine?
Median Family Income in La Fontaine is $49,444.
What is the Median Household income in La Fontaine?
Median Household Income in La Fontaine is $53,558.
What is Income or Wage Gap in La Fontaine?
Income or Wage Gap in La Fontaine is 24.6%.
Women in La Fontaine earn 75.4 cents for every dollar earned by a man.
What is Inequality or Gini Index in La Fontaine?
Inequality or Gini Index in La Fontaine is 0.33.
What is the Total Population of La Fontaine?
Total Population of La Fontaine is 897.
What is the Total Male Population of La Fontaine?
Total Male Population of La Fontaine is 436.
What is the Total Female Population of La Fontaine?
Total Female Population of La Fontaine is 461.
What is the Ratio of Males per 100 Females in La Fontaine?
There are 94.58 Males per 100 Females in La Fontaine.
What is the Ratio of Females per 100 Males in La Fontaine?
There are 105.73 Females per 100 Males in La Fontaine.
What is the Median Population Age in La Fontaine?
Median Population Age in La Fontaine is 42.3 Years.
What is the Average Family Size in La Fontaine
Average Family Size in La Fontaine is 2.9 People.
What is the Average Household Size in La Fontaine
Average Household Size in La Fontaine is 2.4 People.
How Large is the Labor Force in La Fontaine?
There are 435 People in the Labor Forcein in La Fontaine.
What is the Percentage of People in the Labor Force in La Fontaine?
59.3% of People are in the Labor Force in La Fontaine.
What is the Unemployment Rate in La Fontaine?
Unemployment Rate in La Fontaine is 1.4%.