Jonesboro, IN Map & Demographics
Jonesboro Map
Jonesboro Overview
$27,887
PER CAPITA INCOME
$54,044
AVG FAMILY INCOME
$42,500
AVG HOUSEHOLD INCOME
33.4%
WAGE / INCOME GAP [ % ]
66.6¢/ $1
WAGE / INCOME GAP [ $ ]
0.33
INEQUALITY / GINI INDEX
1,541
TOTAL POPULATION
762
MALE POPULATION
779
FEMALE POPULATION
97.82
MALES / 100 FEMALES
102.23
FEMALES / 100 MALES
46.8
MEDIAN AGE
2.6
AVG FAMILY SIZE
2.0
AVG HOUSEHOLD SIZE
800
LABOR FORCE [ PEOPLE ]
62.0%
PERCENT IN LABOR FORCE
5.9%
UNEMPLOYMENT RATE
Jonesboro Zip Codes
Jonesboro Area Codes
Income in Jonesboro
Income Overview in Jonesboro
Per Capita Income in Jonesboro is $27,887, while median incomes of families and households are $54,044 and $42,500 respectively.
| Characteristic | Number | Measure |
| Per Capita Income | 1,541 | $27,887 |
| Median Family Income | 440 | $54,044 |
| Mean Family Income | 440 | $66,241 |
| Median Household Income | 778 | $42,500 |
| Mean Household Income | 778 | $55,609 |
| Income Deficit | 440 | $0 |
| Wage / Income Gap (%) | 1,541 | 33.44% |
| Wage / Income Gap ($) | 1,541 | 66.56¢ per $1 |
| Gini / Inequality Index | 1,541 | 0.33 |
Earnings by Sex in Jonesboro
Average Earnings in Jonesboro are $40,152, $41,417 for men and $27,569 for women, a difference of 33.4%.
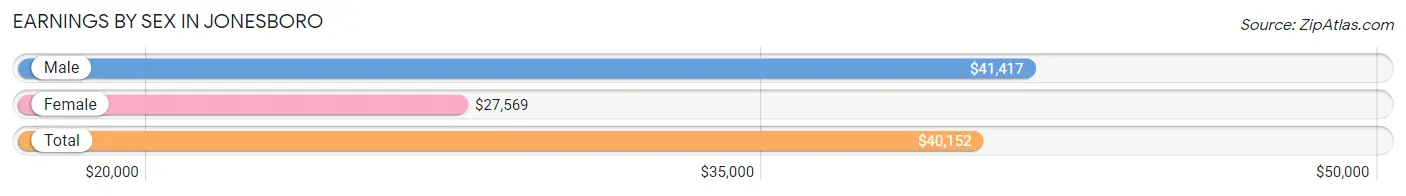
| Sex | Number | Average Earnings |
| Male | 431 (51.8%) | $41,417 |
| Female | 401 (48.2%) | $27,569 |
| Total | 832 (100.0%) | $40,152 |
Earnings by Sex by Income Bracket in Jonesboro
The most common earnings brackets in Jonesboro are $40,000 to $44,999 for men (145 | 33.6%) and $22,500 to $24,999 for women (60 | 15.0%).
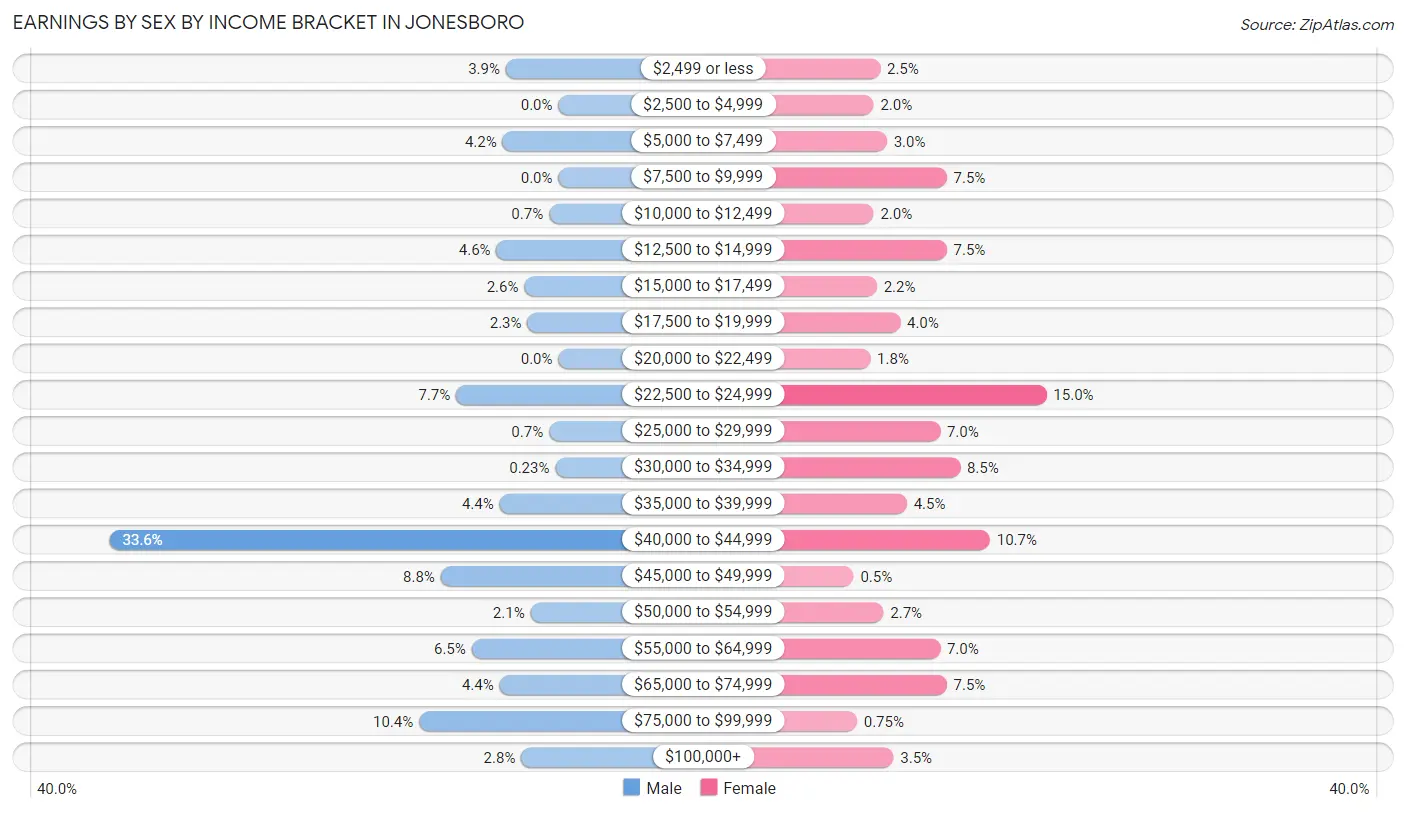
| Income | Male | Female |
| $2,499 or less | 17 (3.9%) | 10 (2.5%) |
| $2,500 to $4,999 | 0 (0.0%) | 8 (2.0%) |
| $5,000 to $7,499 | 18 (4.2%) | 12 (3.0%) |
| $7,500 to $9,999 | 0 (0.0%) | 30 (7.5%) |
| $10,000 to $12,499 | 3 (0.7%) | 8 (2.0%) |
| $12,500 to $14,999 | 20 (4.6%) | 30 (7.5%) |
| $15,000 to $17,499 | 11 (2.5%) | 9 (2.2%) |
| $17,500 to $19,999 | 10 (2.3%) | 16 (4.0%) |
| $20,000 to $22,499 | 0 (0.0%) | 7 (1.8%) |
| $22,500 to $24,999 | 33 (7.7%) | 60 (15.0%) |
| $25,000 to $29,999 | 3 (0.7%) | 28 (7.0%) |
| $30,000 to $34,999 | 1 (0.2%) | 34 (8.5%) |
| $35,000 to $39,999 | 19 (4.4%) | 18 (4.5%) |
| $40,000 to $44,999 | 145 (33.6%) | 43 (10.7%) |
| $45,000 to $49,999 | 38 (8.8%) | 2 (0.5%) |
| $50,000 to $54,999 | 9 (2.1%) | 11 (2.7%) |
| $55,000 to $64,999 | 28 (6.5%) | 28 (7.0%) |
| $65,000 to $74,999 | 19 (4.4%) | 30 (7.5%) |
| $75,000 to $99,999 | 45 (10.4%) | 3 (0.7%) |
| $100,000+ | 12 (2.8%) | 14 (3.5%) |
| Total | 431 (100.0%) | 401 (100.0%) |
Earnings by Sex by Educational Attainment in Jonesboro
Average earnings in Jonesboro are $41,577 for men and $28,264 for women, a difference of 32.0%. Men with an educational attainment of bachelor's degree enjoy the highest average annual earnings of $56,875, while those with less than high school education earn the least with $24,205. Women with an educational attainment of bachelor's degree earn the most with the average annual earnings of $40,208, while those with college or associate's degree education have the smallest earnings of $24,826.
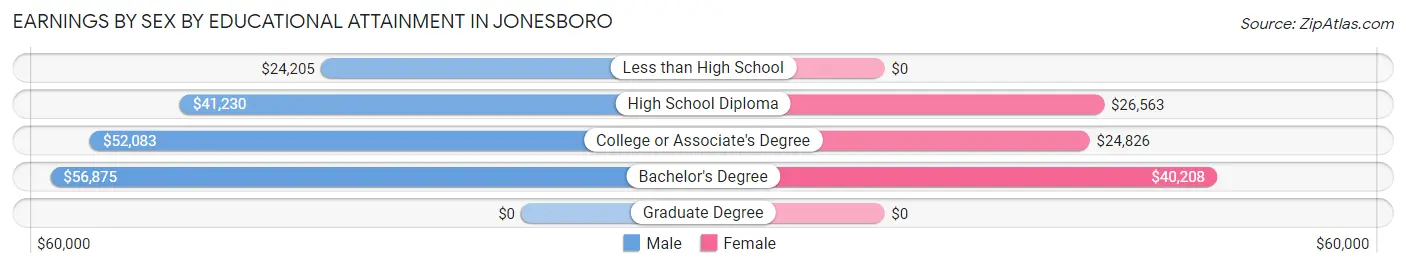
| Educational Attainment | Male Income | Female Income |
| Less than High School | $24,205 | $0 |
| High School Diploma | $41,230 | $26,563 |
| College or Associate's Degree | $52,083 | $24,826 |
| Bachelor's Degree | $56,875 | $40,208 |
| Graduate Degree | - | - |
| Total | $41,577 | $28,264 |
Family Income in Jonesboro
Family Income Brackets in Jonesboro
According to the Jonesboro family income data, there are 106 families falling into the $50,000 to $74,999 income range, which is the most common income bracket and makes up 24.1% of all families. Conversely, the less than $10,000 income bracket is the least frequent group with only 3 families (0.7%) belonging to this category.
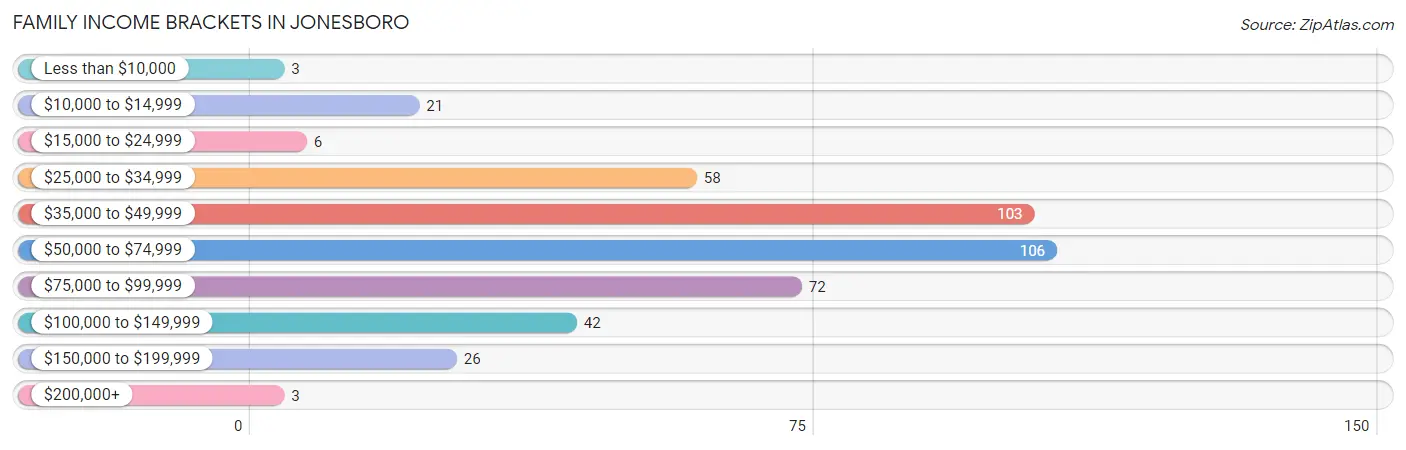
| Income Bracket | # Families | % Families |
| Less than $10,000 | 3 | 0.7% |
| $10,000 to $14,999 | 21 | 4.8% |
| $15,000 to $24,999 | 6 | 1.4% |
| $25,000 to $34,999 | 58 | 13.2% |
| $35,000 to $49,999 | 103 | 23.4% |
| $50,000 to $74,999 | 106 | 24.1% |
| $75,000 to $99,999 | 72 | 16.4% |
| $100,000 to $149,999 | 42 | 9.5% |
| $150,000 to $199,999 | 26 | 5.9% |
| $200,000+ | 3 | 0.7% |
Family Income by Famaliy Size in Jonesboro
3-person families (97 | 22.1%) account for the highest median family income in Jonesboro with $73,984 per family, while 2-person families (260 | 59.1%) have the highest median income of $25,782 per family member.
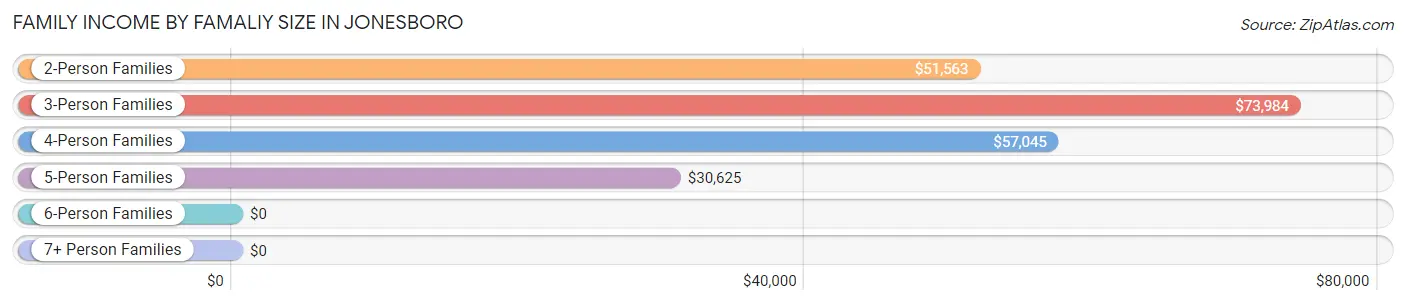
| Income Bracket | # Families | Median Income |
| 2-Person Families | 260 (59.1%) | $51,563 |
| 3-Person Families | 97 (22.1%) | $73,984 |
| 4-Person Families | 42 (9.6%) | $57,045 |
| 5-Person Families | 38 (8.6%) | $30,625 |
| 6-Person Families | 3 (0.7%) | $0 |
| 7+ Person Families | 0 (0.0%) | $0 |
| Total | 440 (100.0%) | $54,044 |
Family Income by Number of Earners in Jonesboro
The median family income in Jonesboro is $54,044, with families comprising 3+ earners (31) having the highest median family income of $108,250, while families with 1 earner (147) have the lowest median family income of $39,917, accounting for 7.0% and 33.4% of families, respectively.
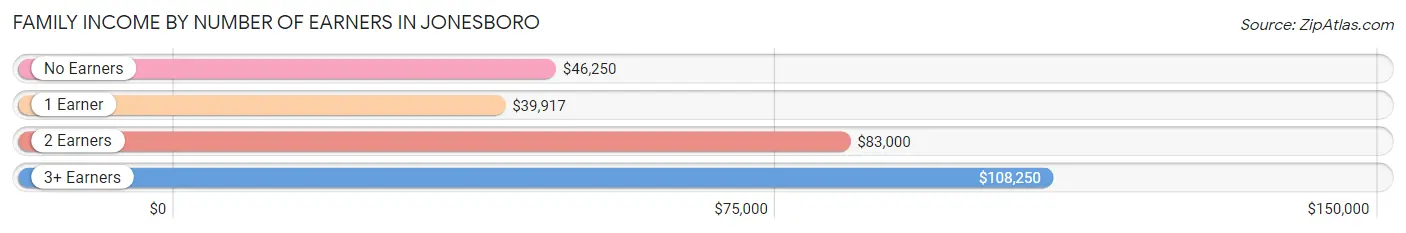
| Number of Earners | # Families | Median Income |
| No Earners | 88 (20.0%) | $46,250 |
| 1 Earner | 147 (33.4%) | $39,917 |
| 2 Earners | 174 (39.6%) | $83,000 |
| 3+ Earners | 31 (7.0%) | $108,250 |
| Total | 440 (100.0%) | $54,044 |
Household Income in Jonesboro
Household Income Brackets in Jonesboro
With 255 households falling in the category, the $35,000 to $49,999 income range is the most frequent in Jonesboro, accounting for 32.8% of all households. In contrast, only 3 households (0.4%) fall into the $200,000+ income bracket, making it the least populous group.
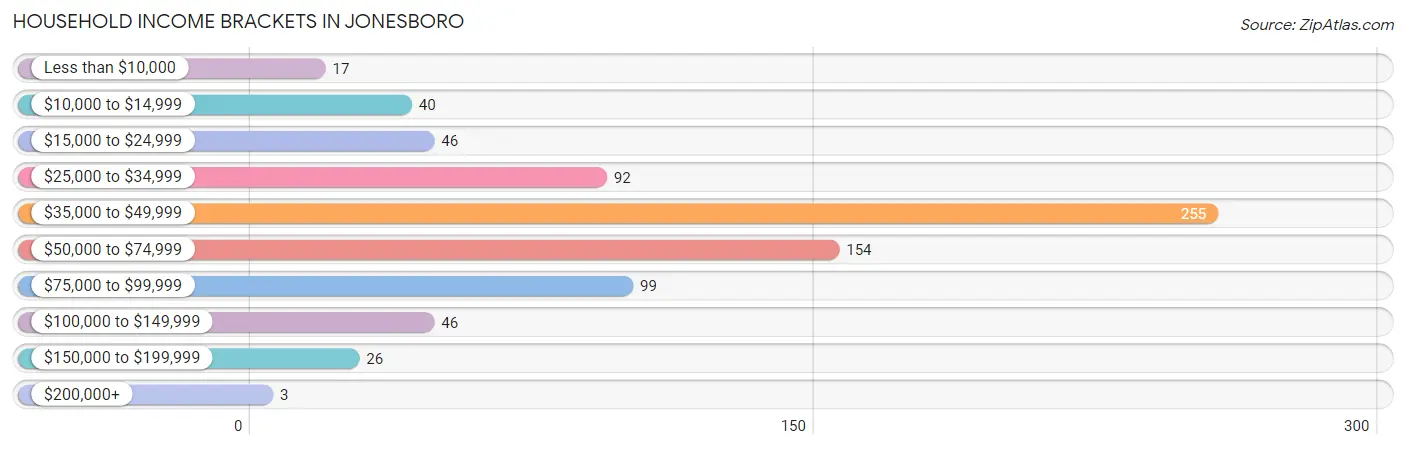
| Income Bracket | # Households | % Households |
| Less than $10,000 | 17 | 2.2% |
| $10,000 to $14,999 | 40 | 5.1% |
| $15,000 to $24,999 | 46 | 5.9% |
| $25,000 to $34,999 | 92 | 11.8% |
| $35,000 to $49,999 | 255 | 32.8% |
| $50,000 to $74,999 | 154 | 19.8% |
| $75,000 to $99,999 | 99 | 12.7% |
| $100,000 to $149,999 | 46 | 5.9% |
| $150,000 to $199,999 | 26 | 3.3% |
| $200,000+ | 3 | 0.4% |
Household Income by Householder Age in Jonesboro
The median household income in Jonesboro is $42,500, with the highest median household income of $63,500 found in the 45 to 64 years age bracket for the primary householder. A total of 290 households (37.3%) fall into this category. Meanwhile, the 25 to 44 years age bracket for the primary householder has the lowest median household income of $41,131, with 281 households (36.1%) in this group.
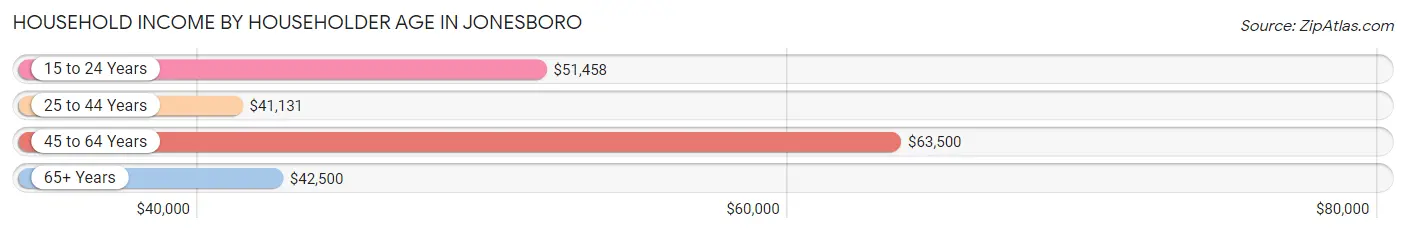
| Income Bracket | # Households | Median Income |
| 15 to 24 Years | 11 (1.4%) | $51,458 |
| 25 to 44 Years | 281 (36.1%) | $41,131 |
| 45 to 64 Years | 290 (37.3%) | $63,500 |
| 65+ Years | 196 (25.2%) | $42,500 |
| Total | 778 (100.0%) | $42,500 |
Poverty in Jonesboro
Income Below Poverty by Sex and Age in Jonesboro
With 6.8% poverty level for males and 21.8% for females among the residents of Jonesboro, 12 to 14 year old males and 6 to 11 year old females are the most vulnerable to poverty, with 10 males (32.3%) and 28 females (82.4%) in their respective age groups living below the poverty level.
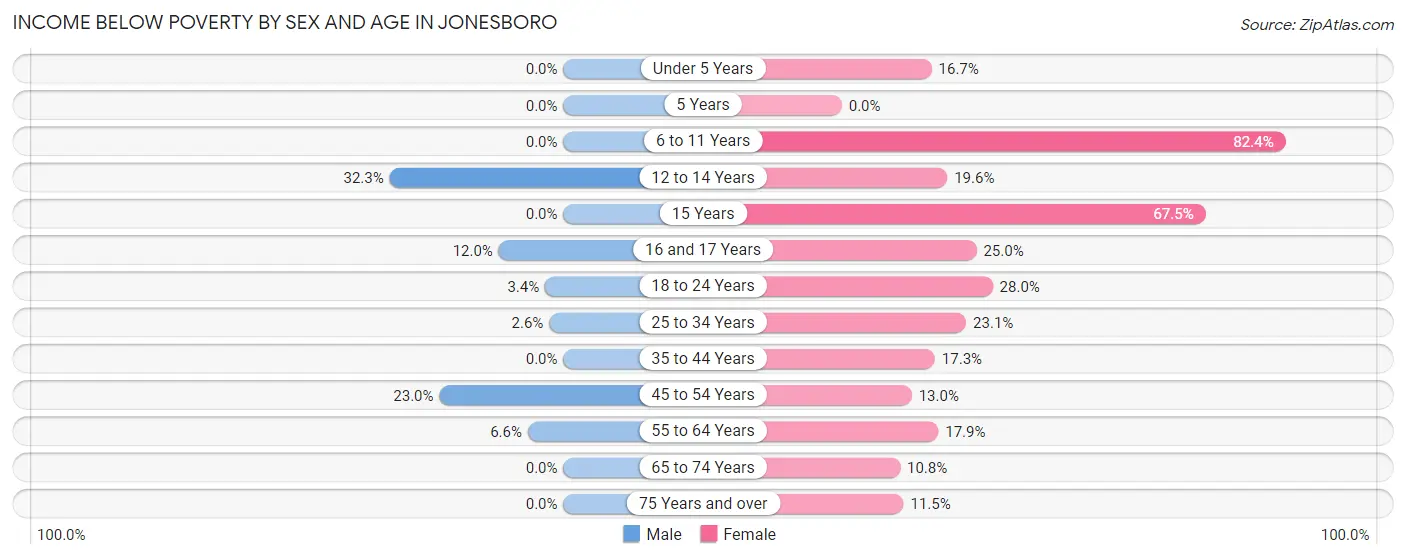
| Age Bracket | Male | Female |
| Under 5 Years | 0 (0.0%) | 6 (16.7%) |
| 5 Years | 0 (0.0%) | 0 (0.0%) |
| 6 to 11 Years | 0 (0.0%) | 28 (82.4%) |
| 12 to 14 Years | 10 (32.3%) | 9 (19.6%) |
| 15 Years | 0 (0.0%) | 27 (67.5%) |
| 16 and 17 Years | 3 (12.0%) | 1 (25.0%) |
| 18 to 24 Years | 2 (3.4%) | 7 (28.0%) |
| 25 to 34 Years | 1 (2.6%) | 18 (23.1%) |
| 35 to 44 Years | 0 (0.0%) | 14 (17.3%) |
| 45 to 54 Years | 29 (23.0%) | 17 (13.0%) |
| 55 to 64 Years | 7 (6.6%) | 24 (17.9%) |
| 65 to 74 Years | 0 (0.0%) | 8 (10.8%) |
| 75 Years and over | 0 (0.0%) | 11 (11.5%) |
| Total | 52 (6.8%) | 170 (21.8%) |
Income Above Poverty by Sex and Age in Jonesboro
According to the poverty statistics in Jonesboro, males aged under 5 years and females aged 65 to 74 years are the age groups that are most secure financially, with 100.0% of males and 89.2% of females in these age groups living above the poverty line.
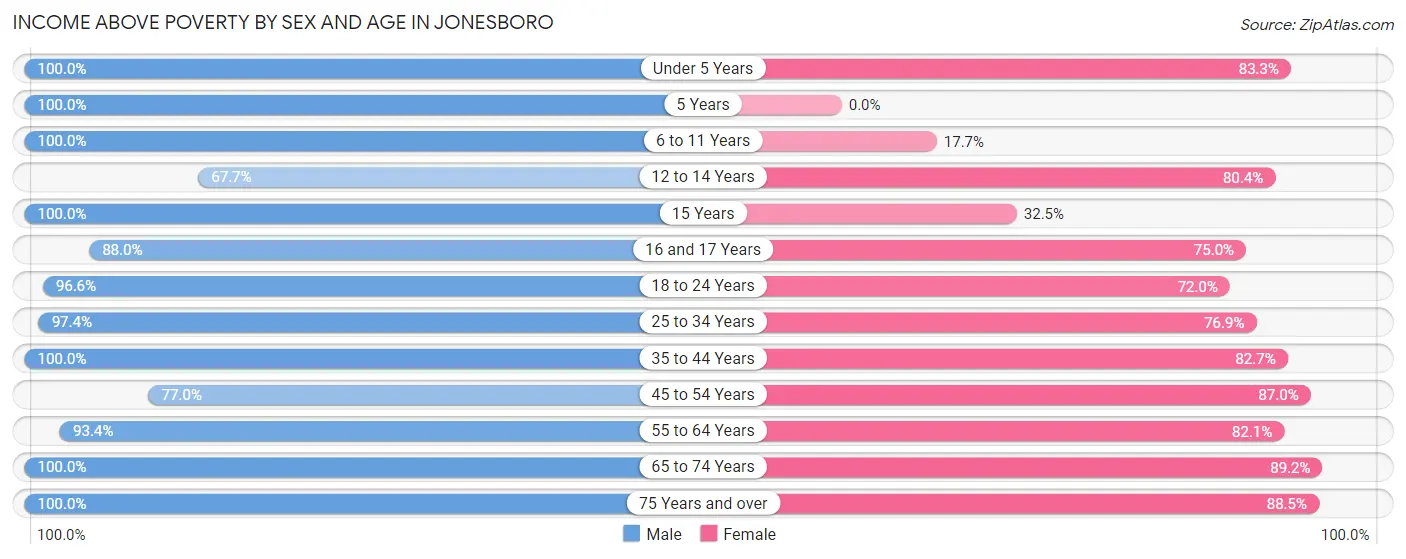
| Age Bracket | Male | Female |
| Under 5 Years | 7 (100.0%) | 30 (83.3%) |
| 5 Years | 8 (100.0%) | 0 (0.0%) |
| 6 to 11 Years | 45 (100.0%) | 6 (17.6%) |
| 12 to 14 Years | 21 (67.7%) | 37 (80.4%) |
| 15 Years | 3 (100.0%) | 13 (32.5%) |
| 16 and 17 Years | 22 (88.0%) | 3 (75.0%) |
| 18 to 24 Years | 57 (96.6%) | 18 (72.0%) |
| 25 to 34 Years | 37 (97.4%) | 60 (76.9%) |
| 35 to 44 Years | 194 (100.0%) | 67 (82.7%) |
| 45 to 54 Years | 97 (77.0%) | 114 (87.0%) |
| 55 to 64 Years | 99 (93.4%) | 110 (82.1%) |
| 65 to 74 Years | 49 (100.0%) | 66 (89.2%) |
| 75 Years and over | 71 (100.0%) | 85 (88.5%) |
| Total | 710 (93.2%) | 609 (78.2%) |
Income Below Poverty Among Married-Couple Families in Jonesboro
The poverty statistics for married-couple families in Jonesboro show that 7.8% or 24 of the total 308 families live below the poverty line. Families with 3 or 4 children have the highest poverty rate of 56.2%, comprising of 9 families. On the other hand, families with 1 or 2 children have the lowest poverty rate of 0.0%, which includes 0 families.
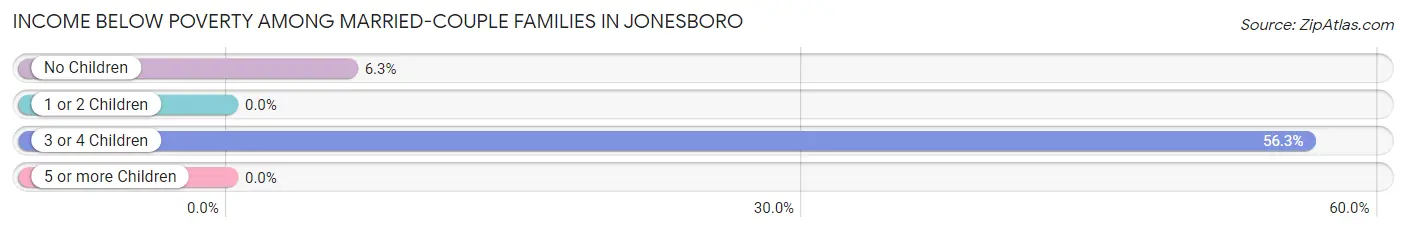
| Children | Above Poverty | Below Poverty |
| No Children | 225 (93.8%) | 15 (6.2%) |
| 1 or 2 Children | 52 (100.0%) | 0 (0.0%) |
| 3 or 4 Children | 7 (43.8%) | 9 (56.2%) |
| 5 or more Children | 0 (0.0%) | 0 (0.0%) |
| Total | 284 (92.2%) | 24 (7.8%) |
Income Below Poverty Among Single-Parent Households in Jonesboro
According to the poverty data in Jonesboro, 7.1% or 2 single-father households and 27.9% or 29 single-mother households are living below the poverty line. Among single-father households, those with 1 or 2 children have the highest poverty rate, with 2 households (10.5%) experiencing poverty. Likewise, among single-mother households, those with 3 or 4 children have the highest poverty rate, with 16 households (64.0%) falling below the poverty line.
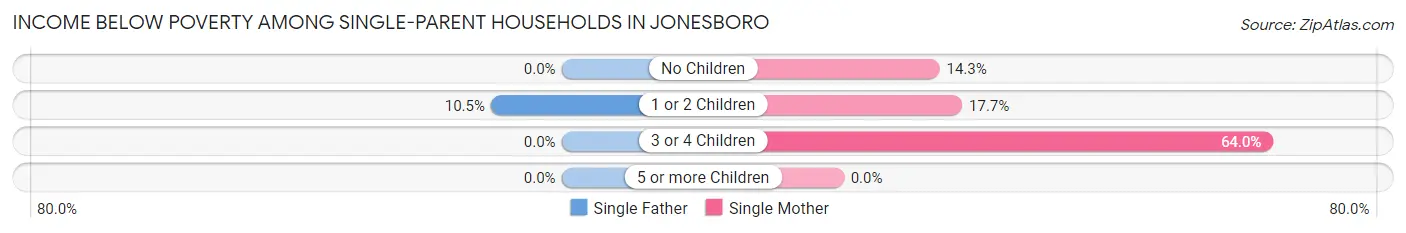
| Children | Single Father | Single Mother |
| No Children | 0 (0.0%) | 4 (14.3%) |
| 1 or 2 Children | 2 (10.5%) | 9 (17.6%) |
| 3 or 4 Children | 0 (0.0%) | 16 (64.0%) |
| 5 or more Children | 0 (0.0%) | 0 (0.0%) |
| Total | 2 (7.1%) | 29 (27.9%) |
Income Below Poverty Among Married-Couple vs Single-Parent Households in Jonesboro
The poverty data for Jonesboro shows that 24 of the married-couple family households (7.8%) and 31 of the single-parent households (23.5%) are living below the poverty level. Within the married-couple family households, those with 3 or 4 children have the highest poverty rate, with 9 households (56.2%) falling below the poverty line. Among the single-parent households, those with 3 or 4 children have the highest poverty rate, with 16 household (64.0%) living below poverty.
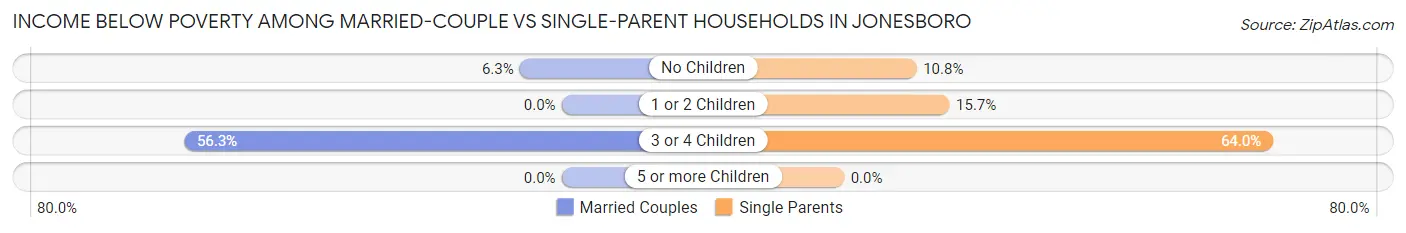
| Children | Married-Couple Families | Single-Parent Households |
| No Children | 15 (6.2%) | 4 (10.8%) |
| 1 or 2 Children | 0 (0.0%) | 11 (15.7%) |
| 3 or 4 Children | 9 (56.2%) | 16 (64.0%) |
| 5 or more Children | 0 (0.0%) | 0 (0.0%) |
| Total | 24 (7.8%) | 31 (23.5%) |
Race in Jonesboro
The most populous races in Jonesboro are White / Caucasian (1,495 | 97.0%), Hispanic or Latino (66 | 4.3%), and Two or more Races (24 | 1.6%).
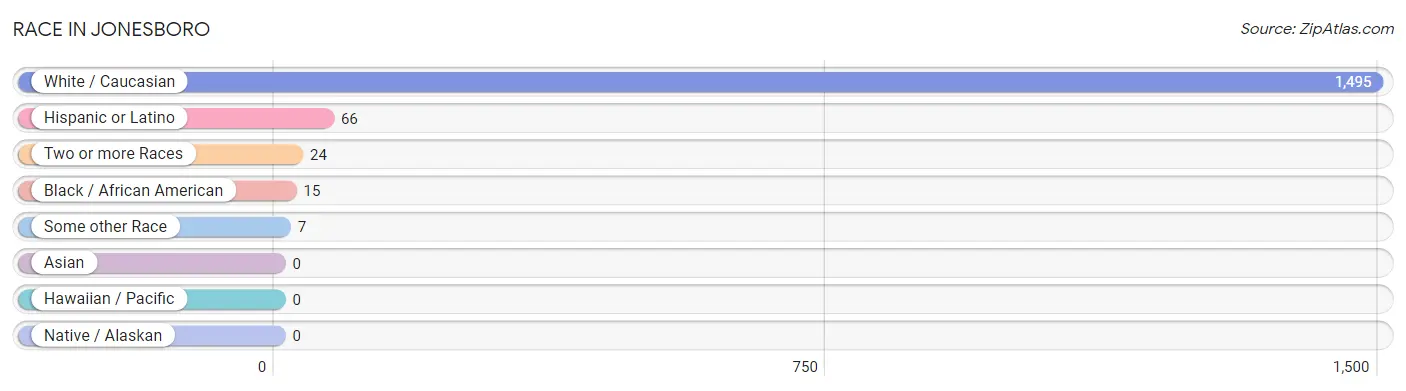
| Race | # Population | % Population |
| Asian | 0 | 0.0% |
| Black / African American | 15 | 1.0% |
| Hawaiian / Pacific | 0 | 0.0% |
| Hispanic or Latino | 66 | 4.3% |
| Native / Alaskan | 0 | 0.0% |
| White / Caucasian | 1,495 | 97.0% |
| Two or more Races | 24 | 1.6% |
| Some other Race | 7 | 0.4% |
| Total | 1,541 | 100.0% |
Ancestry in Jonesboro
The most populous ancestries reported in Jonesboro are German (281 | 18.2%), Irish (227 | 14.7%), American (214 | 13.9%), English (210 | 13.6%), and Mexican (42 | 2.7%), together accounting for 63.2% of all Jonesboro residents.
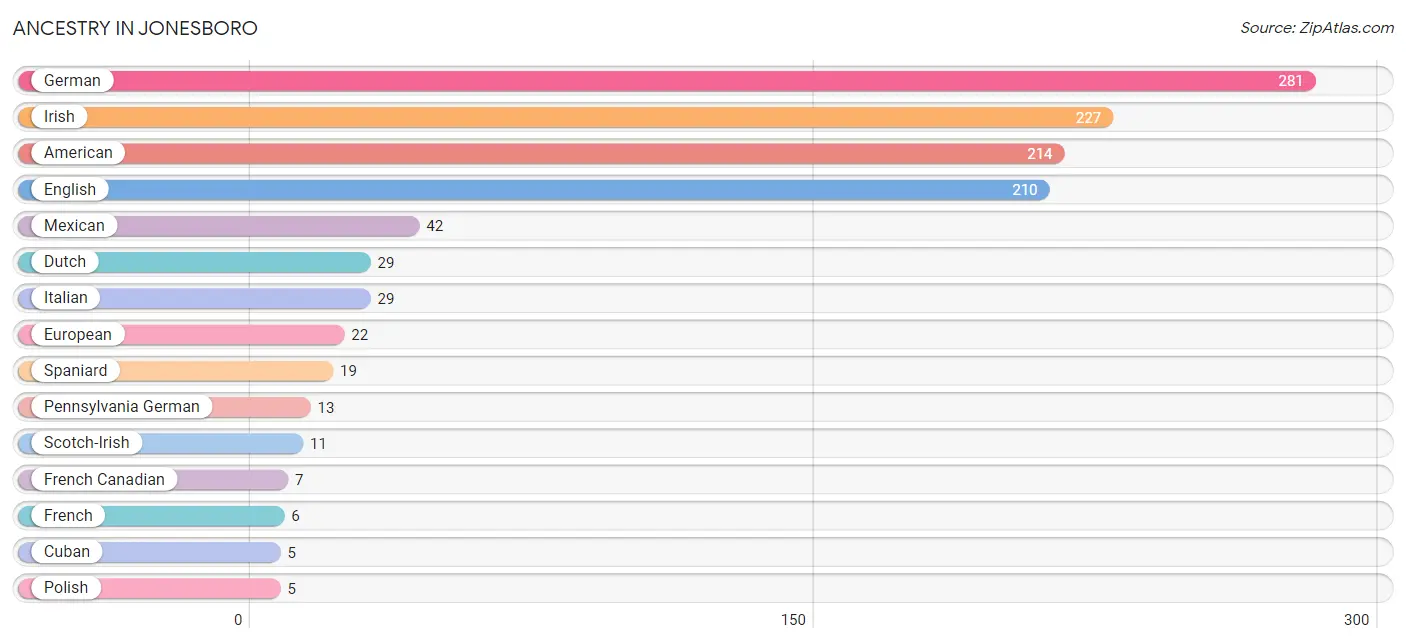
| Ancestry | # Population | % Population |
| American | 214 | 13.9% |
| British | 1 | 0.1% |
| Cherokee | 1 | 0.1% |
| Chippewa | 1 | 0.1% |
| Crow | 2 | 0.1% |
| Cuban | 5 | 0.3% |
| Dutch | 29 | 1.9% |
| English | 210 | 13.6% |
| European | 22 | 1.4% |
| Finnish | 2 | 0.1% |
| French | 6 | 0.4% |
| French Canadian | 7 | 0.4% |
| German | 281 | 18.2% |
| Irish | 227 | 14.7% |
| Italian | 29 | 1.9% |
| Macedonian | 3 | 0.2% |
| Mexican | 42 | 2.7% |
| Norwegian | 2 | 0.1% |
| Pennsylvania German | 13 | 0.8% |
| Polish | 5 | 0.3% |
| Scotch-Irish | 11 | 0.7% |
| Scottish | 5 | 0.3% |
| Spaniard | 19 | 1.2% | View All 23 Rows |
Immigrants in Jonesboro
The most numerous immigrant groups reported in Jonesboro came from Canada (8 | 0.5%), Europe (5 | 0.3%), Southern Europe (5 | 0.3%), Spain (5 | 0.3%), and Central America (2 | 0.1%), together accounting for 1.6% of all Jonesboro residents.
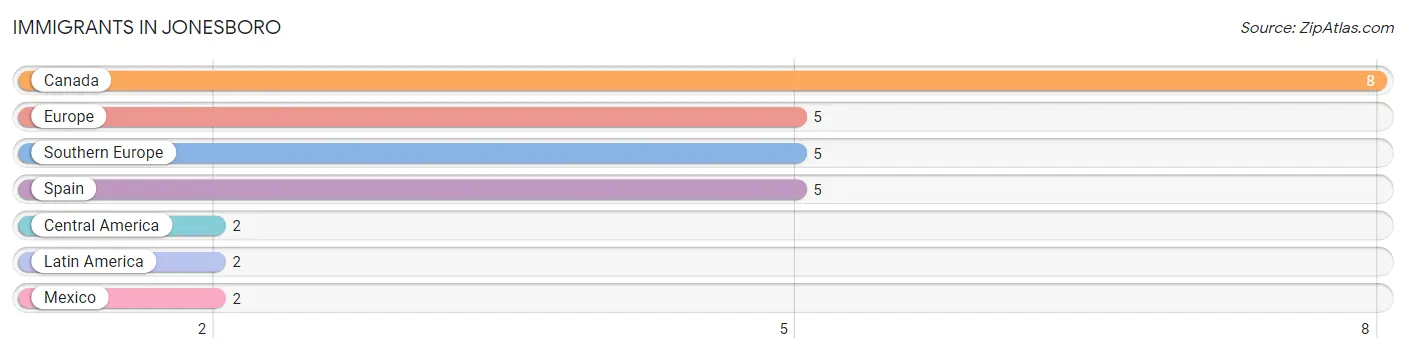
| Immigration Origin | # Population | % Population |
| Canada | 8 | 0.5% |
| Central America | 2 | 0.1% |
| Europe | 5 | 0.3% |
| Latin America | 2 | 0.1% |
| Mexico | 2 | 0.1% |
| Southern Europe | 5 | 0.3% |
| Spain | 5 | 0.3% | View All 7 Rows |
Sex and Age in Jonesboro
Sex and Age in Jonesboro
The most populous age groups in Jonesboro are 40 to 44 Years (147 | 19.3%) for men and 55 to 59 Years (82 | 10.5%) for women.
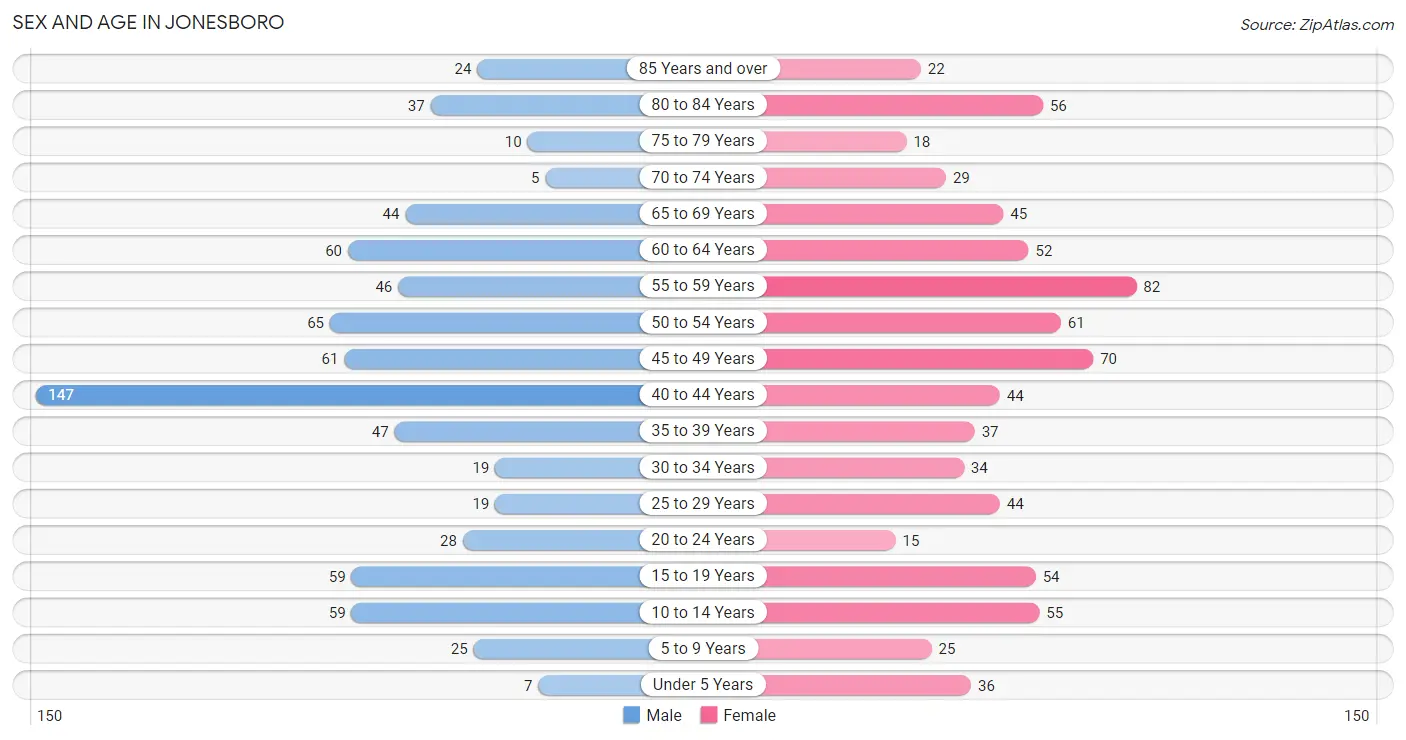
| Age Bracket | Male | Female |
| Under 5 Years | 7 (0.9%) | 36 (4.6%) |
| 5 to 9 Years | 25 (3.3%) | 25 (3.2%) |
| 10 to 14 Years | 59 (7.7%) | 55 (7.1%) |
| 15 to 19 Years | 59 (7.7%) | 54 (6.9%) |
| 20 to 24 Years | 28 (3.7%) | 15 (1.9%) |
| 25 to 29 Years | 19 (2.5%) | 44 (5.7%) |
| 30 to 34 Years | 19 (2.5%) | 34 (4.4%) |
| 35 to 39 Years | 47 (6.2%) | 37 (4.8%) |
| 40 to 44 Years | 147 (19.3%) | 44 (5.7%) |
| 45 to 49 Years | 61 (8.0%) | 70 (9.0%) |
| 50 to 54 Years | 65 (8.5%) | 61 (7.8%) |
| 55 to 59 Years | 46 (6.0%) | 82 (10.5%) |
| 60 to 64 Years | 60 (7.9%) | 52 (6.7%) |
| 65 to 69 Years | 44 (5.8%) | 45 (5.8%) |
| 70 to 74 Years | 5 (0.7%) | 29 (3.7%) |
| 75 to 79 Years | 10 (1.3%) | 18 (2.3%) |
| 80 to 84 Years | 37 (4.9%) | 56 (7.2%) |
| 85 Years and over | 24 (3.2%) | 22 (2.8%) |
| Total | 762 (100.0%) | 779 (100.0%) |
Families and Households in Jonesboro
Median Family Size in Jonesboro
The median family size in Jonesboro is 2.61 persons per family, with married-couple families (308 | 70.0%) accounting for the largest median family size of 2.68 persons per family. On the other hand, single female/mother families (104 | 23.6%) represent the smallest median family size with 2.41 persons per family.
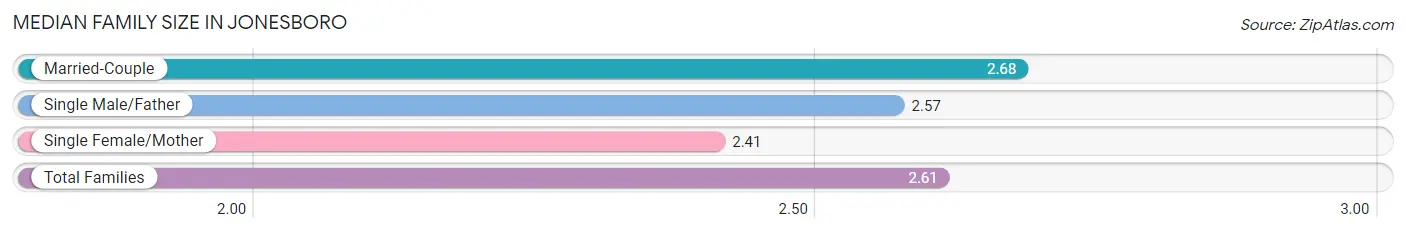
| Family Type | # Families | Family Size |
| Married-Couple | 308 (70.0%) | 2.68 |
| Single Male/Father | 28 (6.4%) | 2.57 |
| Single Female/Mother | 104 (23.6%) | 2.41 |
| Total Families | 440 (100.0%) | 2.61 |
Median Household Size in Jonesboro
The median household size in Jonesboro is 1.98 persons per household, with single male/father households (28 | 3.6%) accounting for the largest median household size of 3.07 persons per household. non-family households (338 | 43.4%) represent the smallest median household size with 1.09 persons per household.
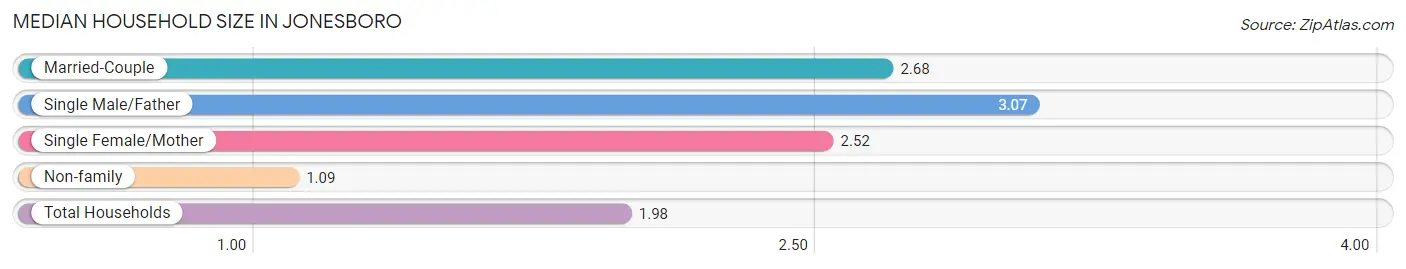
| Household Type | # Households | Household Size |
| Married-Couple | 308 (39.6%) | 2.68 |
| Single Male/Father | 28 (3.6%) | 3.07 |
| Single Female/Mother | 104 (13.4%) | 2.52 |
| Non-family | 338 (43.4%) | 1.09 |
| Total Households | 778 (100.0%) | 1.98 |
Household Size by Marriage Status in Jonesboro
Out of a total of 778 households in Jonesboro, 440 (56.6%) are family households, while 338 (43.4%) are nonfamily households. The most numerous type of family households are 2-person households, comprising 254, and the most common type of nonfamily households are 1-person households, comprising 309.
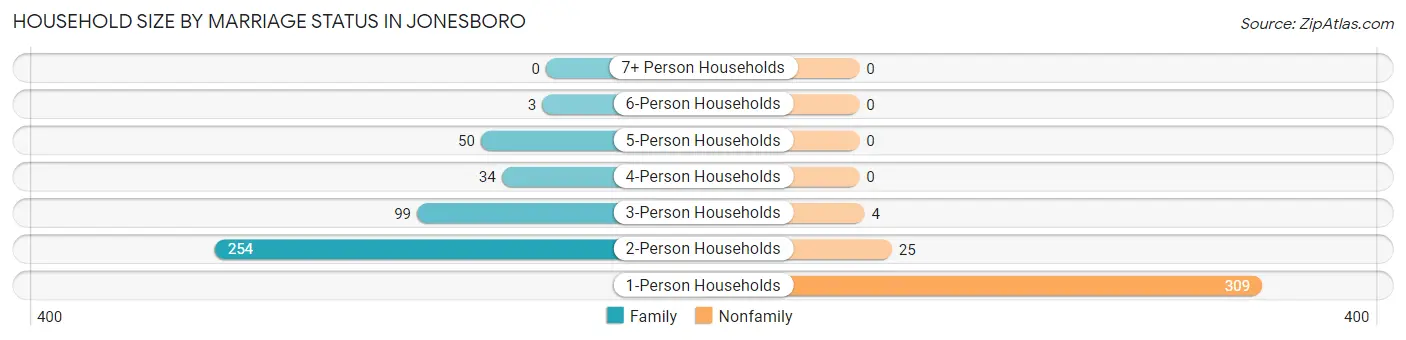
| Household Size | Family Households | Nonfamily Households |
| 1-Person Households | - | 309 (39.7%) |
| 2-Person Households | 254 (32.7%) | 25 (3.2%) |
| 3-Person Households | 99 (12.7%) | 4 (0.5%) |
| 4-Person Households | 34 (4.4%) | 0 (0.0%) |
| 5-Person Households | 50 (6.4%) | 0 (0.0%) |
| 6-Person Households | 3 (0.4%) | 0 (0.0%) |
| 7+ Person Households | 0 (0.0%) | 0 (0.0%) |
| Total | 440 (56.6%) | 338 (43.4%) |
Female Fertility in Jonesboro
Fertility by Age in Jonesboro
Average fertility rate in Jonesboro is 6.0 births per 1,000 women. Women in the age bracket of 20 to 34 years have the highest fertility rate with 22.0 births per 1,000 women. Women in the age bracket of 20 to 34 years acount for 100.0% of all women with births.
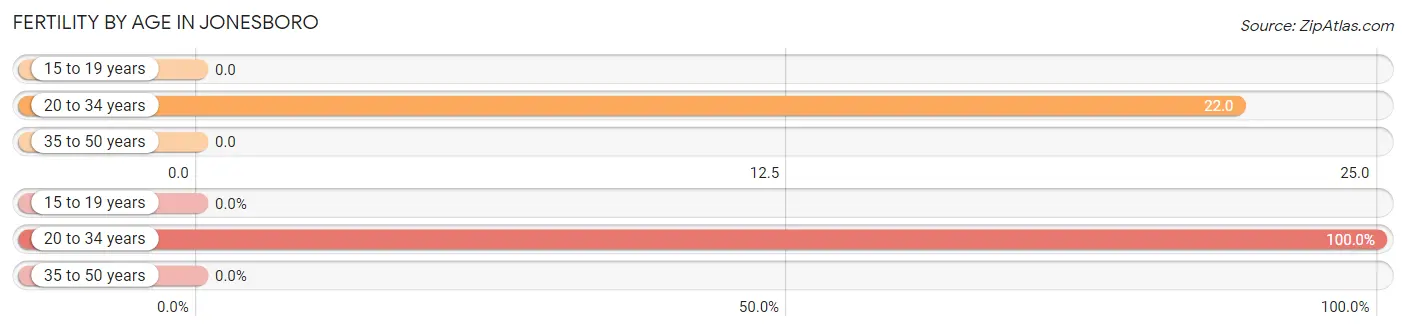
| Age Bracket | Women with Births | Births / 1,000 Women |
| 15 to 19 years | 0 (0.0%) | 0.0 |
| 20 to 34 years | 2 (100.0%) | 22.0 |
| 35 to 50 years | 0 (0.0%) | 0.0 |
| Total | 2 (100.0%) | 6.0 |
Fertility by Age by Marriage Status in Jonesboro
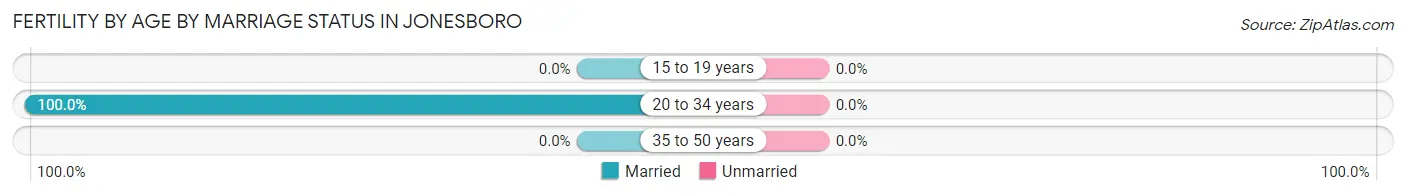
| Age Bracket | Married | Unmarried |
| 15 to 19 years | 0 (0.0%) | 0 (0.0%) |
| 20 to 34 years | 2 (100.0%) | 0 (0.0%) |
| 35 to 50 years | 0 (0.0%) | 0 (0.0%) |
| Total | 2 (100.0%) | 0 (0.0%) |
Fertility by Education in Jonesboro
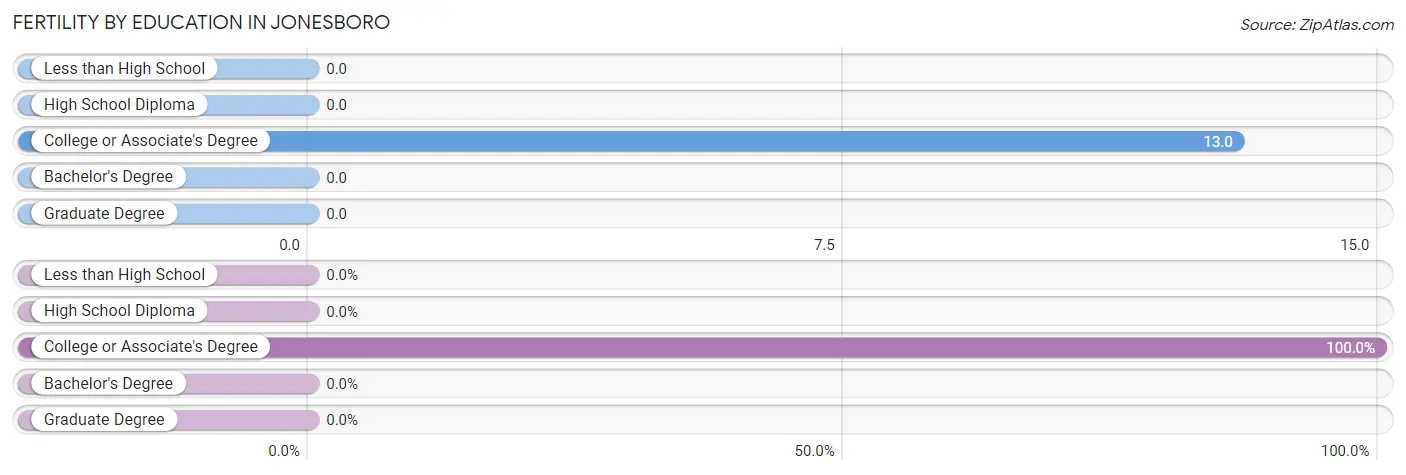
| Educational Attainment | Women with Births | Births / 1,000 Women |
| Less than High School | 0 (0.0%) | 0.0 |
| High School Diploma | 0 (0.0%) | 0.0 |
| College or Associate's Degree | 2 (100.0%) | 13.0 |
| Bachelor's Degree | 0 (0.0%) | 0.0 |
| Graduate Degree | 0 (0.0%) | 0.0 |
| Total | 2 (100.0%) | 6.0 |
Fertility by Education by Marriage Status in Jonesboro
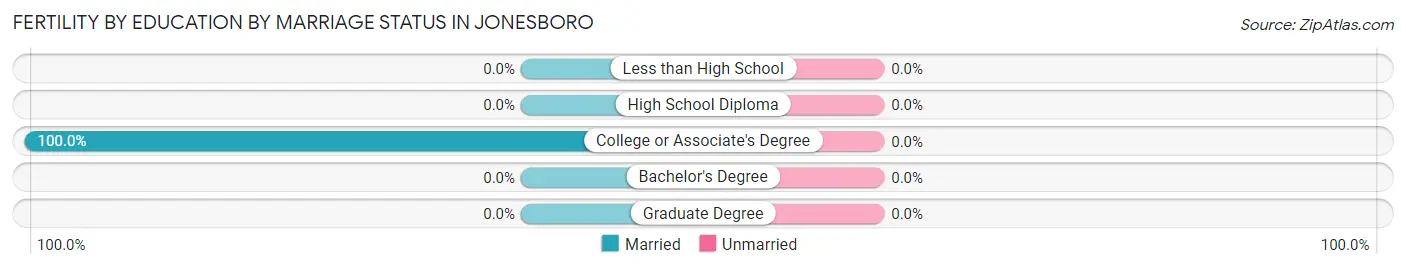
| Educational Attainment | Married | Unmarried |
| Less than High School | 0 (0.0%) | 0 (0.0%) |
| High School Diploma | 0 (0.0%) | 0 (0.0%) |
| College or Associate's Degree | 2 (100.0%) | 0 (0.0%) |
| Bachelor's Degree | 0 (0.0%) | 0 (0.0%) |
| Graduate Degree | 0 (0.0%) | 0 (0.0%) |
| Total | 2 (100.0%) | 0 (0.0%) |
Employment Characteristics in Jonesboro
Employment by Class of Employer in Jonesboro
Among the 728 employed individuals in Jonesboro, private company employees (566 | 77.7%), not-for-profit organizations (53 | 7.3%), and self-employed (not incorporated) (41 | 5.6%) make up the most common classes of employment.
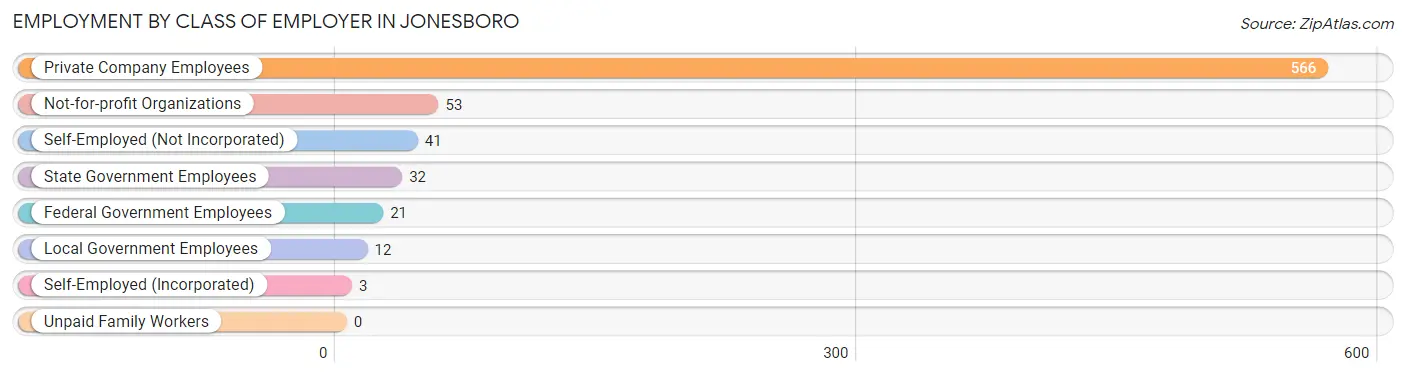
| Employer Class | # Employees | % Employees |
| Private Company Employees | 566 | 77.7% |
| Self-Employed (Incorporated) | 3 | 0.4% |
| Self-Employed (Not Incorporated) | 41 | 5.6% |
| Not-for-profit Organizations | 53 | 7.3% |
| Local Government Employees | 12 | 1.7% |
| State Government Employees | 32 | 4.4% |
| Federal Government Employees | 21 | 2.9% |
| Unpaid Family Workers | 0 | 0.0% |
| Total | 728 | 100.0% |
Employment Status by Age in Jonesboro
According to the labor force statistics for Jonesboro, out of the total population over 16 years of age (1,291), 62.0% or 800 individuals are in the labor force, with 5.9% or 47 of them unemployed. The age group with the highest labor force participation rate is 25 to 29 years, with 100.0% or 63 individuals in the labor force. Within the labor force, the 75 years and over age range has the highest percentage of unemployed individuals, with 100.0% or 3 of them being unemployed.
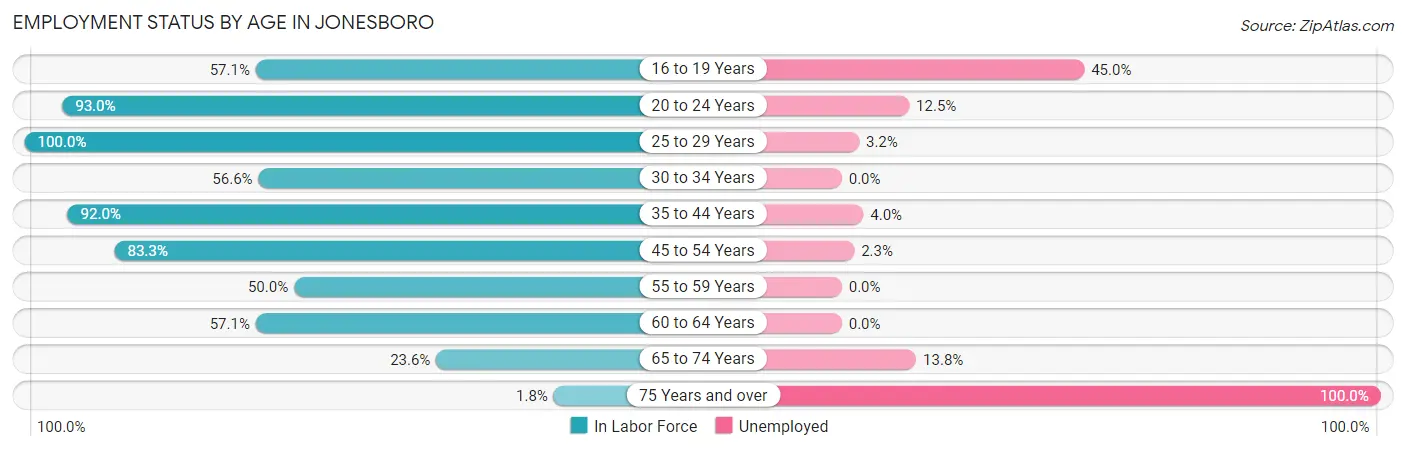
| Age Bracket | In Labor Force | Unemployed |
| 16 to 19 Years | 40 (57.1%) | 18 (45.0%) |
| 20 to 24 Years | 40 (93.0%) | 5 (12.5%) |
| 25 to 29 Years | 63 (100.0%) | 2 (3.2%) |
| 30 to 34 Years | 30 (56.6%) | 0 (0.0%) |
| 35 to 44 Years | 253 (92.0%) | 10 (4.0%) |
| 45 to 54 Years | 214 (83.3%) | 5 (2.3%) |
| 55 to 59 Years | 64 (50.0%) | 0 (0.0%) |
| 60 to 64 Years | 64 (57.1%) | 0 (0.0%) |
| 65 to 74 Years | 29 (23.6%) | 4 (13.8%) |
| 75 Years and over | 3 (1.8%) | 3 (100.0%) |
| Total | 800 (62.0%) | 47 (5.9%) |
Employment Status by Educational Attainment in Jonesboro
According to labor force statistics for Jonesboro, 77.5% of individuals (688) out of the total population between 25 and 64 years of age (888) are in the labor force, with 2.5% or 17 of them being unemployed. The group with the highest labor force participation rate are those with the educational attainment of bachelor's degree or higher, with 91.4% or 106 individuals in the labor force. Within the labor force, individuals with less than high school education have the highest percentage of unemployment, with 7.7% or 1 of them being unemployed.
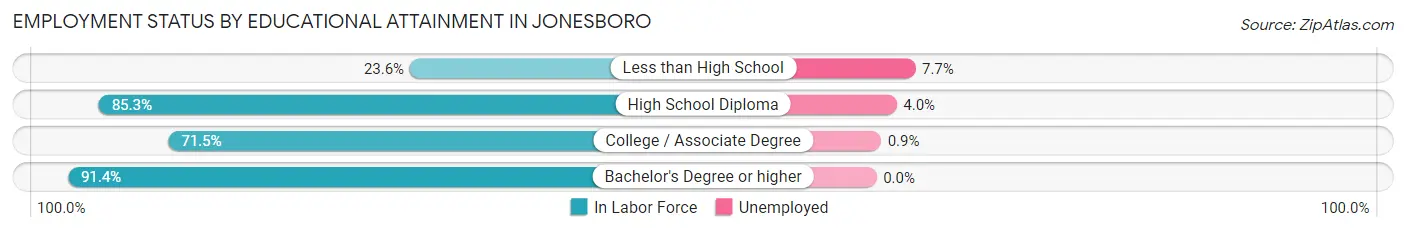
| Educational Attainment | In Labor Force | Unemployed |
| Less than High School | 13 (23.6%) | 4 (7.7%) |
| High School Diploma | 348 (85.3%) | 16 (4.0%) |
| College / Associate Degree | 221 (71.5%) | 3 (0.9%) |
| Bachelor's Degree or higher | 106 (91.4%) | 0 (0.0%) |
| Total | 688 (77.5%) | 22 (2.5%) |
Employment Occupations by Sex in Jonesboro
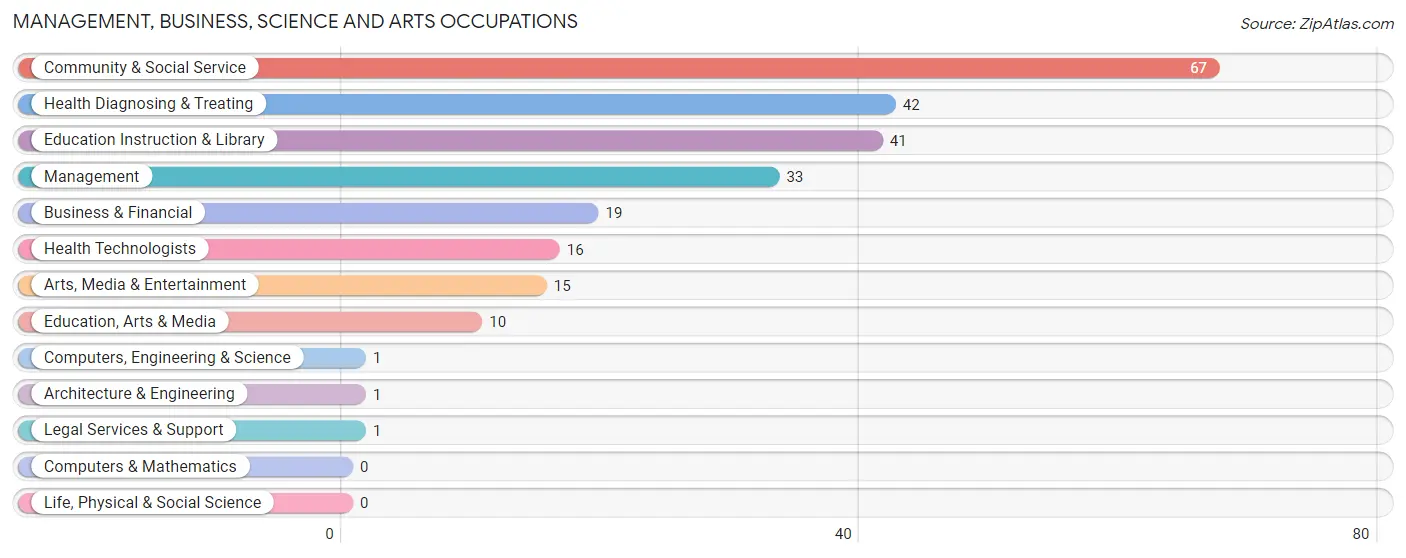
Management, Business, Science and Arts Occupations
The most common Management, Business, Science and Arts occupations in Jonesboro are Community & Social Service (67 | 8.9%), Health Diagnosing & Treating (42 | 5.6%), Education Instruction & Library (41 | 5.4%), Management (33 | 4.4%), and Business & Financial (19 | 2.5%).
Management, Business, Science and Arts Occupations by Sex
Within the Management, Business, Science and Arts occupations in Jonesboro, the most male-oriented occupations are Computers, Engineering & Science (100.0%), Architecture & Engineering (100.0%), and Management (48.5%), while the most female-oriented occupations are Legal Services & Support (100.0%), Arts, Media & Entertainment (100.0%), and Health Technologists (100.0%).
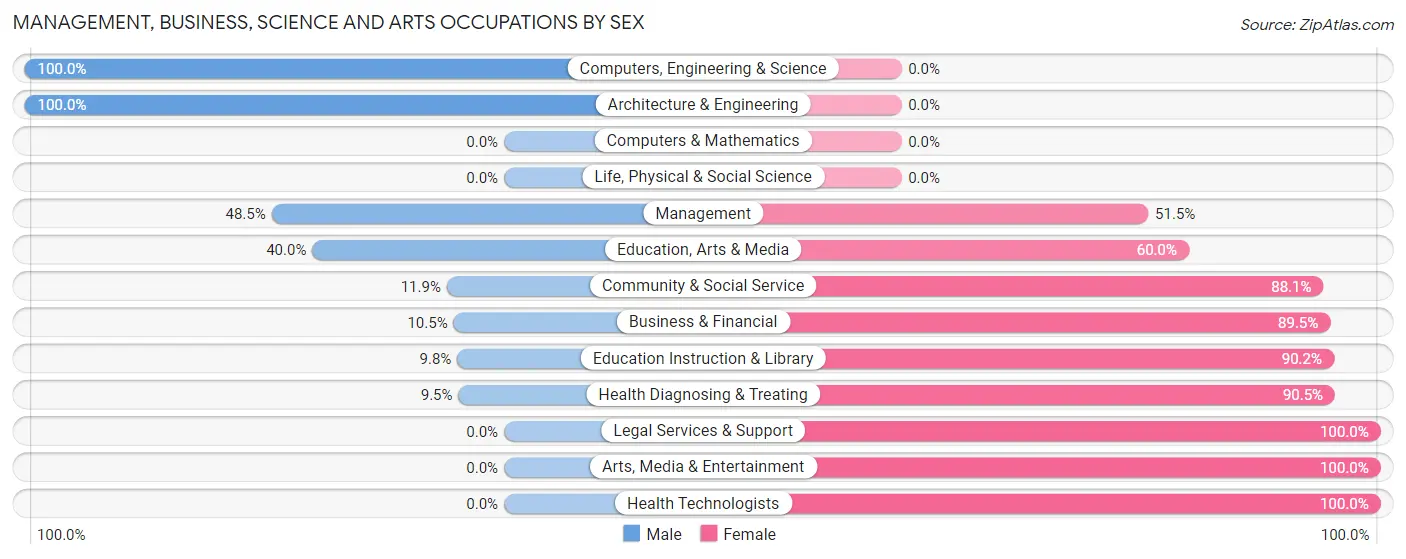
| Occupation | Male | Female |
| Management | 16 (48.5%) | 17 (51.5%) |
| Business & Financial | 2 (10.5%) | 17 (89.5%) |
| Computers, Engineering & Science | 1 (100.0%) | 0 (0.0%) |
| Computers & Mathematics | 0 (0.0%) | 0 (0.0%) |
| Architecture & Engineering | 1 (100.0%) | 0 (0.0%) |
| Life, Physical & Social Science | 0 (0.0%) | 0 (0.0%) |
| Community & Social Service | 8 (11.9%) | 59 (88.1%) |
| Education, Arts & Media | 4 (40.0%) | 6 (60.0%) |
| Legal Services & Support | 0 (0.0%) | 1 (100.0%) |
| Education Instruction & Library | 4 (9.8%) | 37 (90.2%) |
| Arts, Media & Entertainment | 0 (0.0%) | 15 (100.0%) |
| Health Diagnosing & Treating | 4 (9.5%) | 38 (90.5%) |
| Health Technologists | 0 (0.0%) | 16 (100.0%) |
| Total (Category) | 31 (19.1%) | 131 (80.9%) |
| Total (Overall) | 399 (53.0%) | 354 (47.0%) |
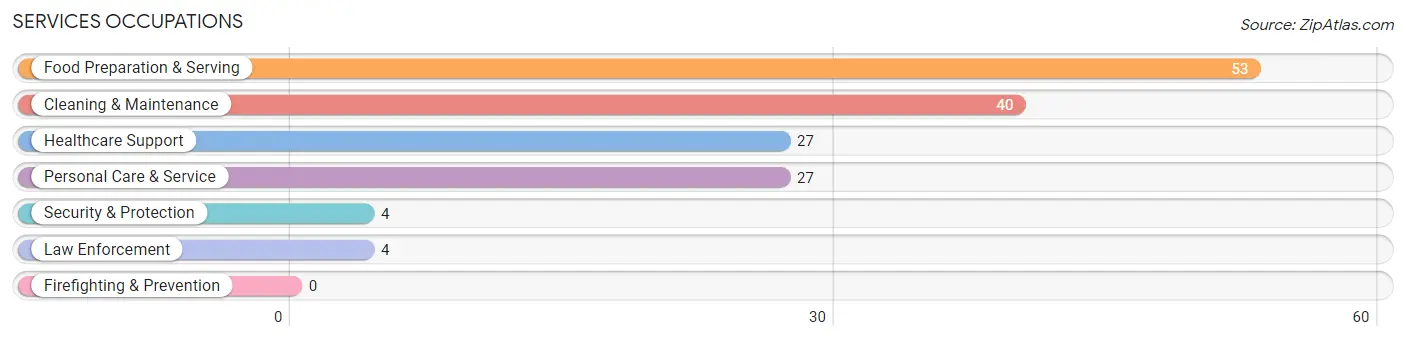
Services Occupations
The most common Services occupations in Jonesboro are Food Preparation & Serving (53 | 7.0%), Cleaning & Maintenance (40 | 5.3%), Healthcare Support (27 | 3.6%), Personal Care & Service (27 | 3.6%), and Security & Protection (4 | 0.5%).
Services Occupations by Sex
Within the Services occupations in Jonesboro, the most male-oriented occupations are Security & Protection (100.0%), Law Enforcement (100.0%), and Cleaning & Maintenance (70.0%), while the most female-oriented occupations are Healthcare Support (100.0%), Food Preparation & Serving (73.6%), and Personal Care & Service (48.1%).
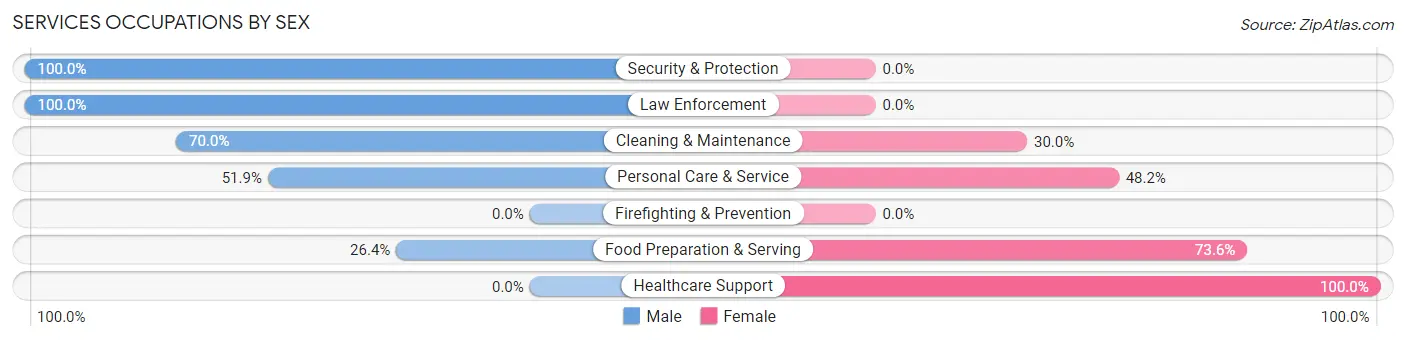
| Occupation | Male | Female |
| Healthcare Support | 0 (0.0%) | 27 (100.0%) |
| Security & Protection | 4 (100.0%) | 0 (0.0%) |
| Firefighting & Prevention | 0 (0.0%) | 0 (0.0%) |
| Law Enforcement | 4 (100.0%) | 0 (0.0%) |
| Food Preparation & Serving | 14 (26.4%) | 39 (73.6%) |
| Cleaning & Maintenance | 28 (70.0%) | 12 (30.0%) |
| Personal Care & Service | 14 (51.8%) | 13 (48.1%) |
| Total (Category) | 60 (39.7%) | 91 (60.3%) |
| Total (Overall) | 399 (53.0%) | 354 (47.0%) |
Sales and Office Occupations
The most common Sales and Office occupations in Jonesboro are Office & Administration (80 | 10.6%), and Sales & Related (24 | 3.2%).
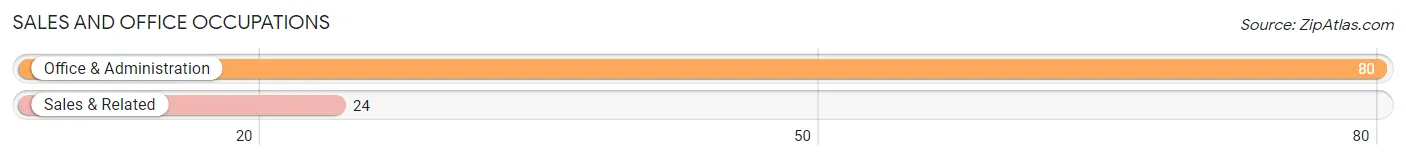
Sales and Office Occupations by Sex
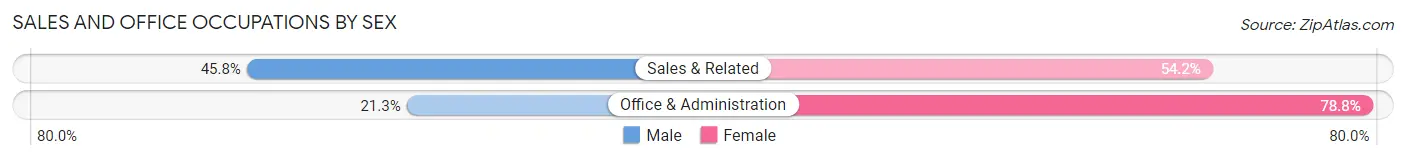
| Occupation | Male | Female |
| Sales & Related | 11 (45.8%) | 13 (54.2%) |
| Office & Administration | 17 (21.2%) | 63 (78.7%) |
| Total (Category) | 28 (26.9%) | 76 (73.1%) |
| Total (Overall) | 399 (53.0%) | 354 (47.0%) |
Natural Resources, Construction and Maintenance Occupations
The most common Natural Resources, Construction and Maintenance occupations in Jonesboro are Installation, Maintenance & Repair (148 | 19.7%), and Construction & Extraction (47 | 6.2%).
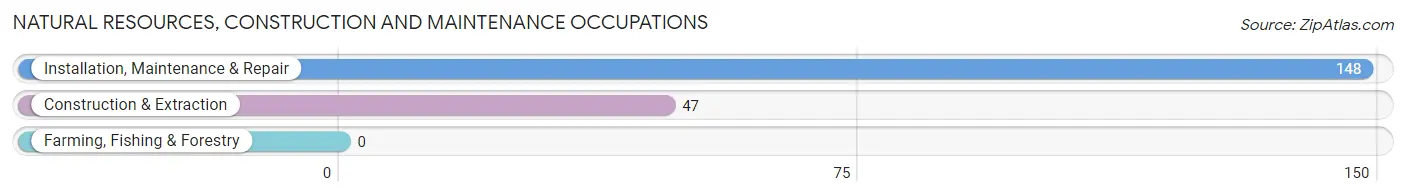
Natural Resources, Construction and Maintenance Occupations by Sex
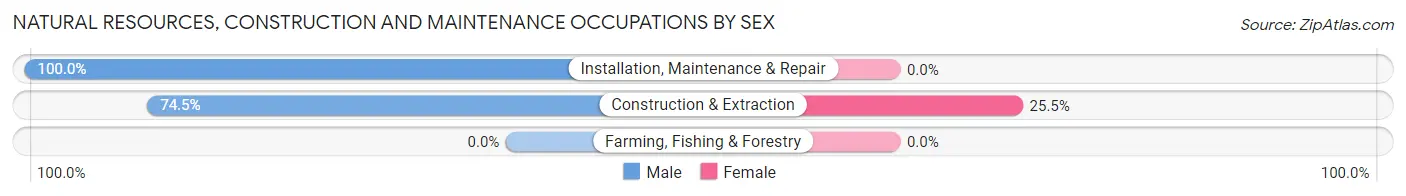
| Occupation | Male | Female |
| Farming, Fishing & Forestry | 0 (0.0%) | 0 (0.0%) |
| Construction & Extraction | 35 (74.5%) | 12 (25.5%) |
| Installation, Maintenance & Repair | 148 (100.0%) | 0 (0.0%) |
| Total (Category) | 183 (93.9%) | 12 (6.1%) |
| Total (Overall) | 399 (53.0%) | 354 (47.0%) |
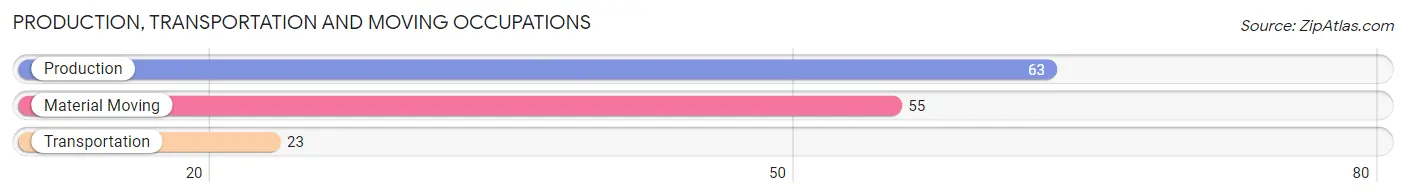
Production, Transportation and Moving Occupations
The most common Production, Transportation and Moving occupations in Jonesboro are Production (63 | 8.4%), Material Moving (55 | 7.3%), and Transportation (23 | 3.0%).
Production, Transportation and Moving Occupations by Sex
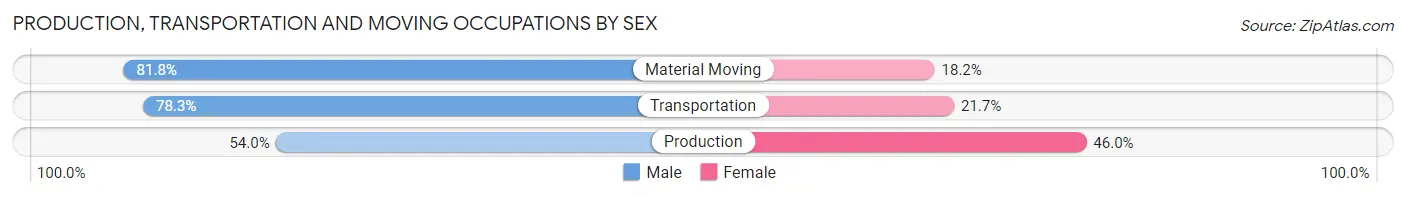
| Occupation | Male | Female |
| Production | 34 (54.0%) | 29 (46.0%) |
| Transportation | 18 (78.3%) | 5 (21.7%) |
| Material Moving | 45 (81.8%) | 10 (18.2%) |
| Total (Category) | 97 (68.8%) | 44 (31.2%) |
| Total (Overall) | 399 (53.0%) | 354 (47.0%) |
Employment Industries by Sex in Jonesboro
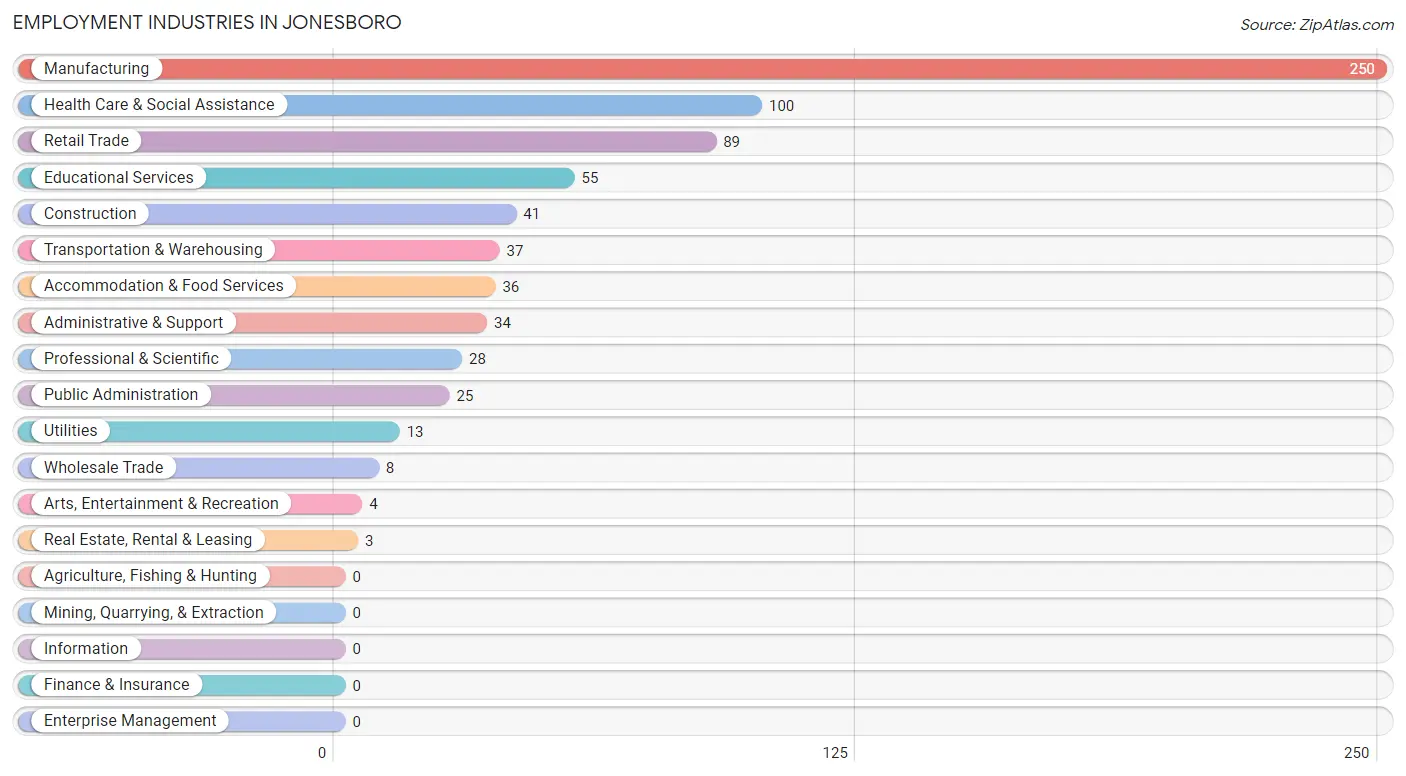
Employment Industries in Jonesboro
The major employment industries in Jonesboro include Manufacturing (250 | 33.2%), Health Care & Social Assistance (100 | 13.3%), Retail Trade (89 | 11.8%), Educational Services (55 | 7.3%), and Construction (41 | 5.4%).
Employment Industries by Sex in Jonesboro
The Jonesboro industries that see more men than women are Real Estate, Rental & Leasing (100.0%), Transportation & Warehousing (89.2%), and Manufacturing (84.0%), whereas the industries that tend to have a higher number of women are Wholesale Trade (100.0%), Arts, Entertainment & Recreation (100.0%), and Professional & Scientific (92.9%).
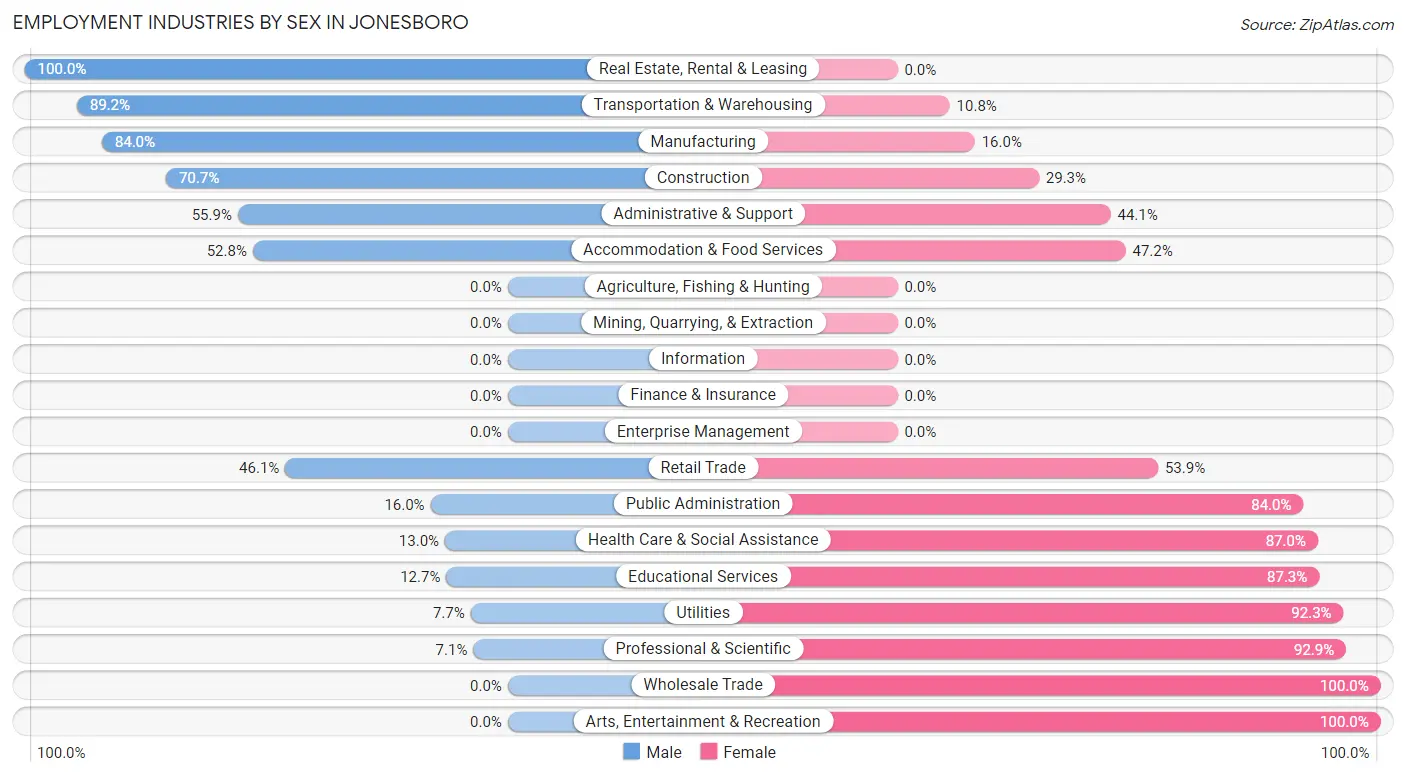
| Industry | Male | Female |
| Agriculture, Fishing & Hunting | 0 (0.0%) | 0 (0.0%) |
| Mining, Quarrying, & Extraction | 0 (0.0%) | 0 (0.0%) |
| Construction | 29 (70.7%) | 12 (29.3%) |
| Manufacturing | 210 (84.0%) | 40 (16.0%) |
| Wholesale Trade | 0 (0.0%) | 8 (100.0%) |
| Retail Trade | 41 (46.1%) | 48 (53.9%) |
| Transportation & Warehousing | 33 (89.2%) | 4 (10.8%) |
| Utilities | 1 (7.7%) | 12 (92.3%) |
| Information | 0 (0.0%) | 0 (0.0%) |
| Finance & Insurance | 0 (0.0%) | 0 (0.0%) |
| Real Estate, Rental & Leasing | 3 (100.0%) | 0 (0.0%) |
| Professional & Scientific | 2 (7.1%) | 26 (92.9%) |
| Enterprise Management | 0 (0.0%) | 0 (0.0%) |
| Administrative & Support | 19 (55.9%) | 15 (44.1%) |
| Educational Services | 7 (12.7%) | 48 (87.3%) |
| Health Care & Social Assistance | 13 (13.0%) | 87 (87.0%) |
| Arts, Entertainment & Recreation | 0 (0.0%) | 4 (100.0%) |
| Accommodation & Food Services | 19 (52.8%) | 17 (47.2%) |
| Public Administration | 4 (16.0%) | 21 (84.0%) |
| Total | 399 (53.0%) | 354 (47.0%) |
Education in Jonesboro
School Enrollment in Jonesboro
The most common levels of schooling among the 292 students in Jonesboro are high school (113 | 38.7%), middle school (93 | 31.9%), and elementary school (43 | 14.7%).
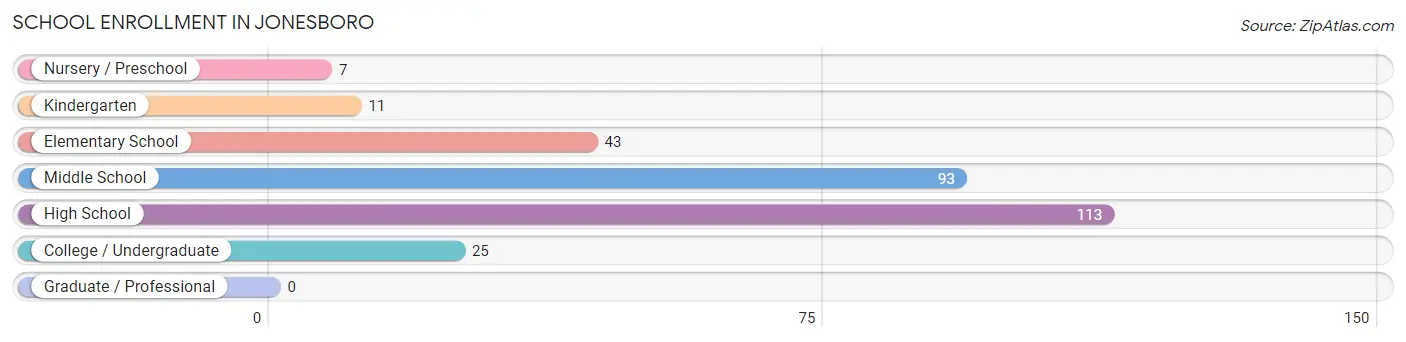
| School Level | # Students | % Students |
| Nursery / Preschool | 7 | 2.4% |
| Kindergarten | 11 | 3.8% |
| Elementary School | 43 | 14.7% |
| Middle School | 93 | 31.9% |
| High School | 113 | 38.7% |
| College / Undergraduate | 25 | 8.6% |
| Graduate / Professional | 0 | 0.0% |
| Total | 292 | 100.0% |
School Enrollment by Age by Funding Source in Jonesboro
Out of a total of 292 students who are enrolled in schools in Jonesboro, 22 (7.5%) attend a private institution, while the remaining 270 (92.5%) are enrolled in public schools. The age group of 20 to 24 year olds has the highest likelihood of being enrolled in private schools, with 1 (33.3% in the age bracket) enrolled. Conversely, the age group of 10 to 14 year olds has the lowest likelihood of being enrolled in a private school, with 114 (100.0% in the age bracket) attending a public institution.
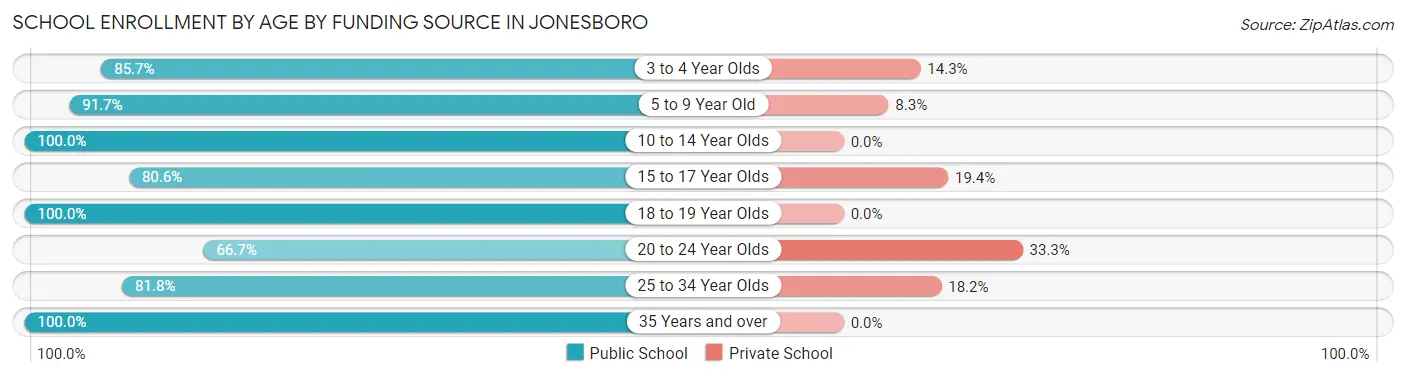
| Age Bracket | Public School | Private School |
| 3 to 4 Year Olds | 6 (85.7%) | 1 (14.3%) |
| 5 to 9 Year Old | 44 (91.7%) | 4 (8.3%) |
| 10 to 14 Year Olds | 114 (100.0%) | 0 (0.0%) |
| 15 to 17 Year Olds | 58 (80.6%) | 14 (19.4%) |
| 18 to 19 Year Olds | 32 (100.0%) | 0 (0.0%) |
| 20 to 24 Year Olds | 2 (66.7%) | 1 (33.3%) |
| 25 to 34 Year Olds | 9 (81.8%) | 2 (18.2%) |
| 35 Years and over | 5 (100.0%) | 0 (0.0%) |
| Total | 270 (92.5%) | 22 (7.5%) |
Educational Attainment by Field of Study in Jonesboro
Education (38 | 28.8%), business (23 | 17.4%), liberal arts & history (17 | 12.9%), science & technology (11 | 8.3%), and arts & humanities (10 | 7.6%) are the most common fields of study among 132 individuals in Jonesboro who have obtained a bachelor's degree or higher.
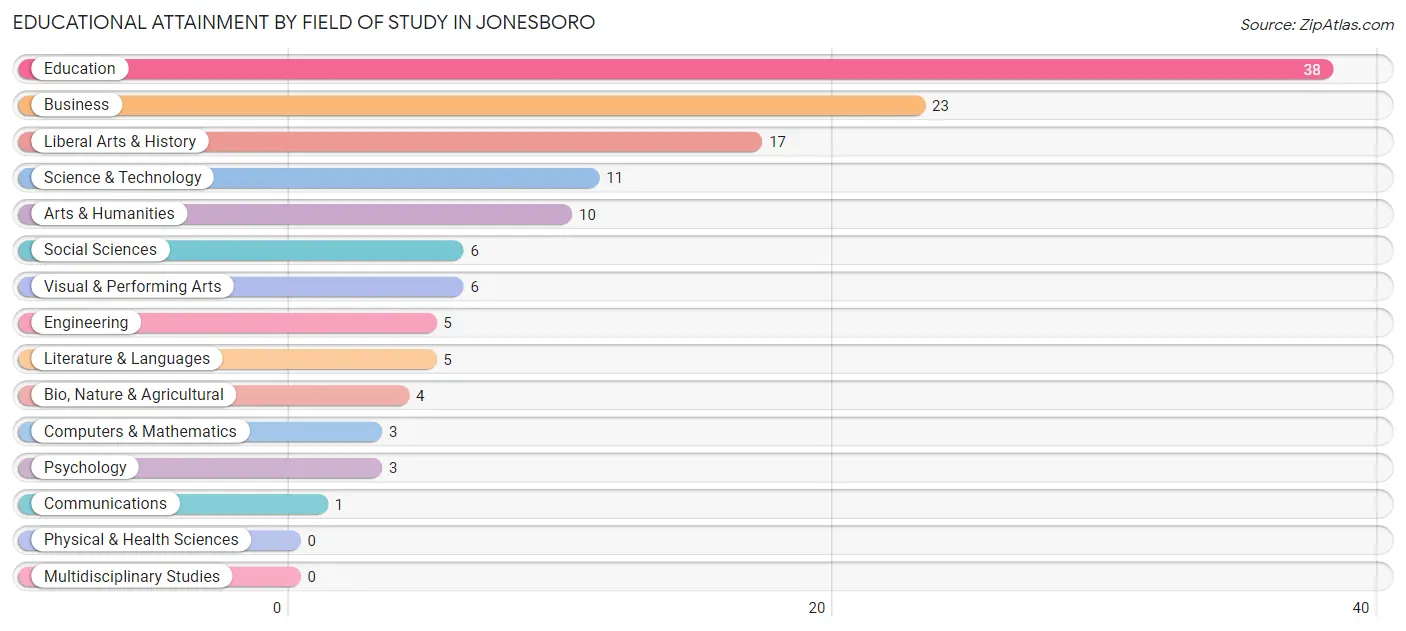
| Field of Study | # Graduates | % Graduates |
| Computers & Mathematics | 3 | 2.3% |
| Bio, Nature & Agricultural | 4 | 3.0% |
| Physical & Health Sciences | 0 | 0.0% |
| Psychology | 3 | 2.3% |
| Social Sciences | 6 | 4.5% |
| Engineering | 5 | 3.8% |
| Multidisciplinary Studies | 0 | 0.0% |
| Science & Technology | 11 | 8.3% |
| Business | 23 | 17.4% |
| Education | 38 | 28.8% |
| Literature & Languages | 5 | 3.8% |
| Liberal Arts & History | 17 | 12.9% |
| Visual & Performing Arts | 6 | 4.5% |
| Communications | 1 | 0.8% |
| Arts & Humanities | 10 | 7.6% |
| Total | 132 | 100.0% |
Transportation & Commute in Jonesboro
Vehicle Availability by Sex in Jonesboro
The most prevalent vehicle ownership categories in Jonesboro are males with 2 vehicles (230, accounting for 58.5%) and females with 2 vehicles (98, making up 68.7%).
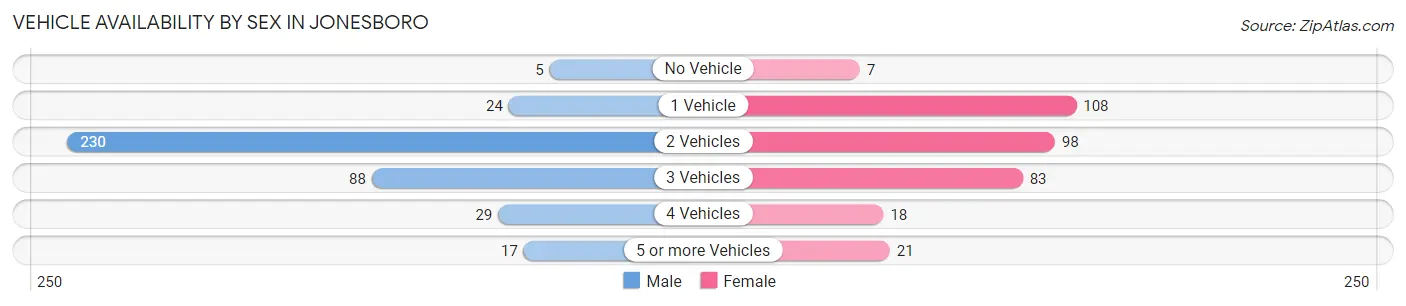
| Vehicles Available | Male | Female |
| No Vehicle | 5 (1.3%) | 7 (2.1%) |
| 1 Vehicle | 24 (6.1%) | 108 (32.2%) |
| 2 Vehicles | 230 (58.5%) | 98 (29.2%) |
| 3 Vehicles | 88 (22.4%) | 83 (24.8%) |
| 4 Vehicles | 29 (7.4%) | 18 (5.4%) |
| 5 or more Vehicles | 17 (4.3%) | 21 (6.3%) |
| Total | 393 (100.0%) | 335 (100.0%) |
Commute Time in Jonesboro
The most frequently occuring commute durations in Jonesboro are 15 to 19 minutes (319 commuters, 45.1%), 10 to 14 minutes (86 commuters, 12.2%), and 20 to 24 minutes (83 commuters, 11.7%).
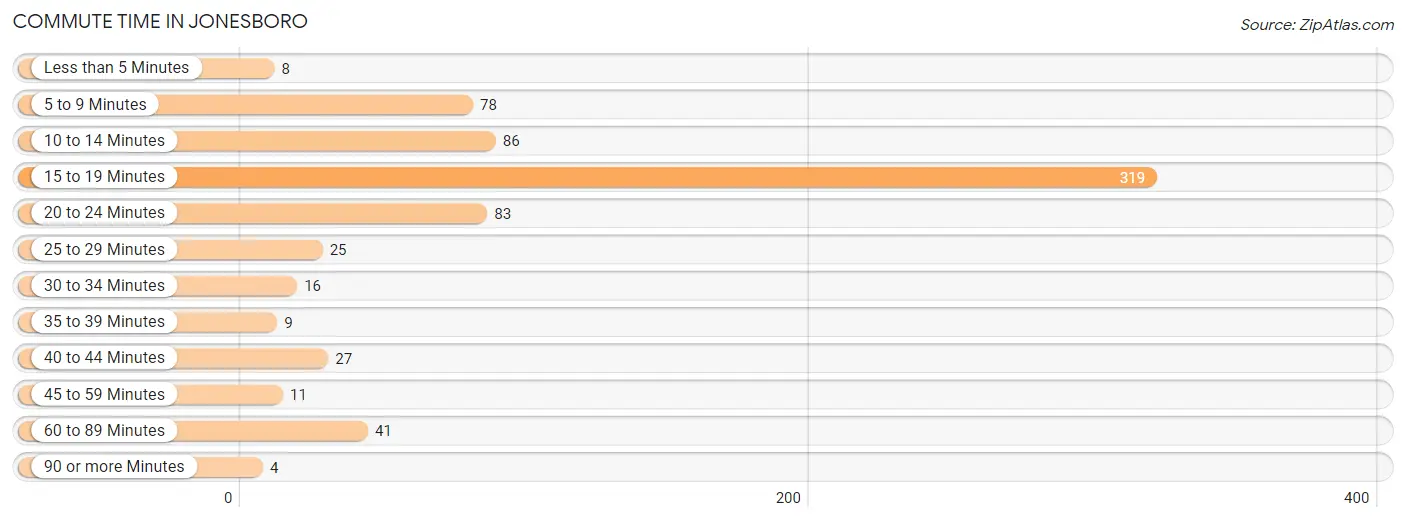
| Commute Time | # Commuters | % Commuters |
| Less than 5 Minutes | 8 | 1.1% |
| 5 to 9 Minutes | 78 | 11.0% |
| 10 to 14 Minutes | 86 | 12.2% |
| 15 to 19 Minutes | 319 | 45.1% |
| 20 to 24 Minutes | 83 | 11.7% |
| 25 to 29 Minutes | 25 | 3.5% |
| 30 to 34 Minutes | 16 | 2.3% |
| 35 to 39 Minutes | 9 | 1.3% |
| 40 to 44 Minutes | 27 | 3.8% |
| 45 to 59 Minutes | 11 | 1.6% |
| 60 to 89 Minutes | 41 | 5.8% |
| 90 or more Minutes | 4 | 0.6% |
Commute Time by Sex in Jonesboro
The most common commute times in Jonesboro are 15 to 19 minutes (209 commuters, 53.6%) for males and 15 to 19 minutes (110 commuters, 34.7%) for females.
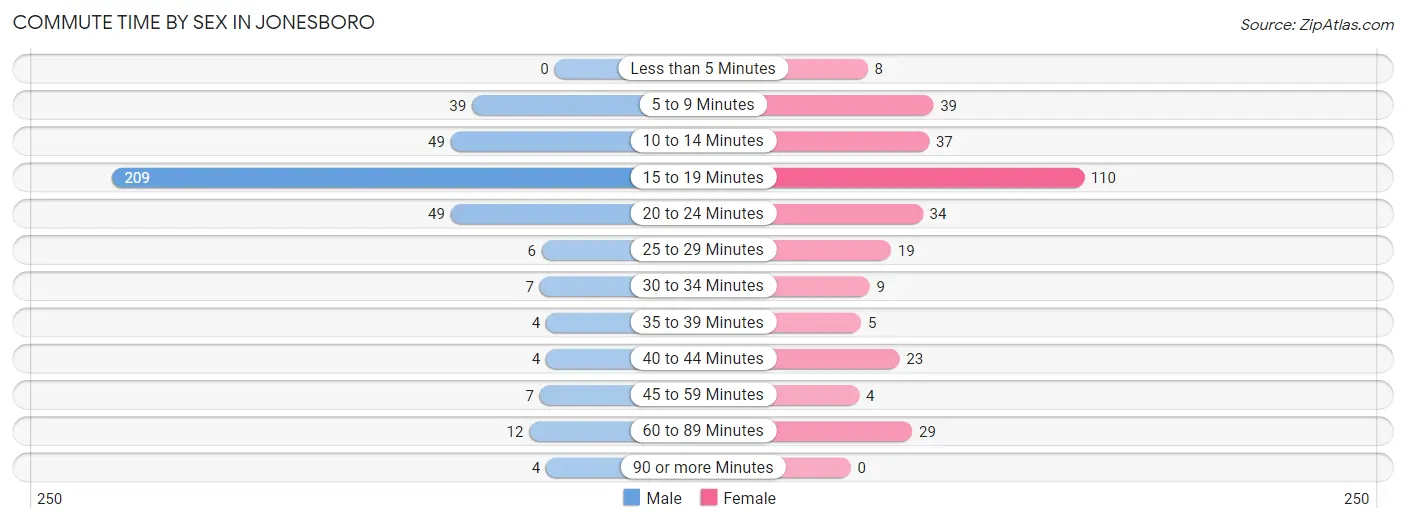
| Commute Time | Male | Female |
| Less than 5 Minutes | 0 (0.0%) | 8 (2.5%) |
| 5 to 9 Minutes | 39 (10.0%) | 39 (12.3%) |
| 10 to 14 Minutes | 49 (12.6%) | 37 (11.7%) |
| 15 to 19 Minutes | 209 (53.6%) | 110 (34.7%) |
| 20 to 24 Minutes | 49 (12.6%) | 34 (10.7%) |
| 25 to 29 Minutes | 6 (1.5%) | 19 (6.0%) |
| 30 to 34 Minutes | 7 (1.8%) | 9 (2.8%) |
| 35 to 39 Minutes | 4 (1.0%) | 5 (1.6%) |
| 40 to 44 Minutes | 4 (1.0%) | 23 (7.3%) |
| 45 to 59 Minutes | 7 (1.8%) | 4 (1.3%) |
| 60 to 89 Minutes | 12 (3.1%) | 29 (9.1%) |
| 90 or more Minutes | 4 (1.0%) | 0 (0.0%) |
Time of Departure to Work by Sex in Jonesboro
The most frequent times of departure to work in Jonesboro are 7:30 AM to 7:59 AM (158, 40.5%) for males and 7:30 AM to 7:59 AM (49, 15.5%) for females.
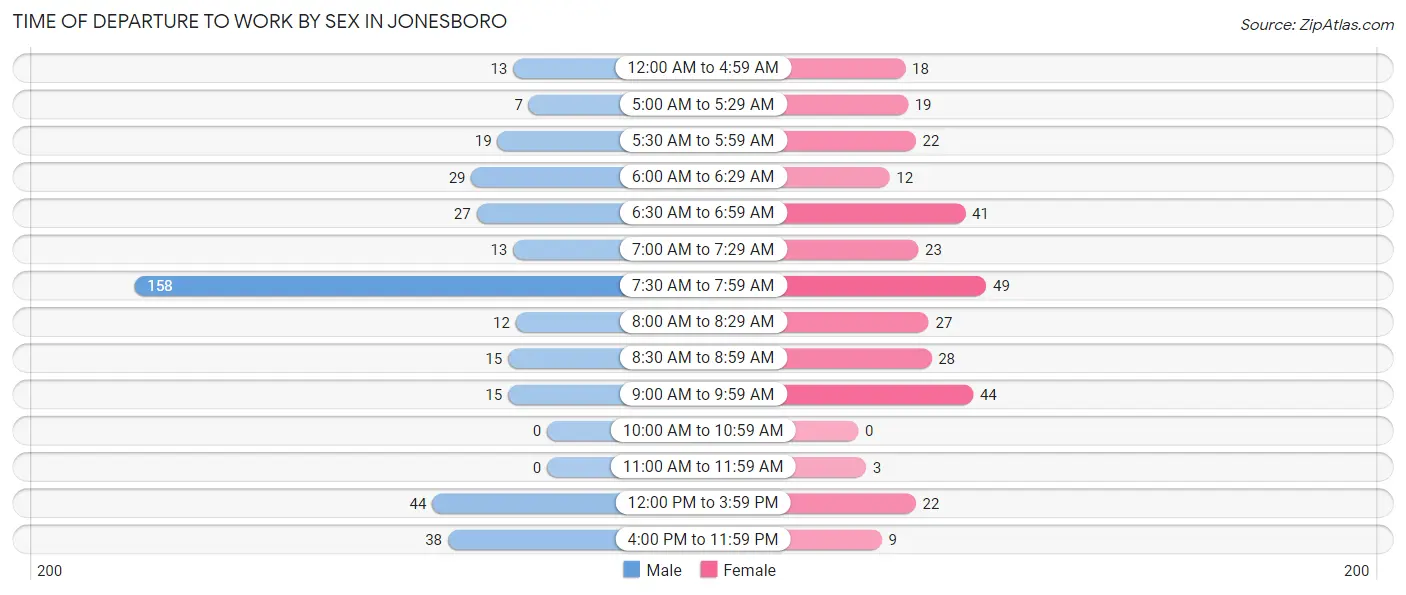
| Time of Departure | Male | Female |
| 12:00 AM to 4:59 AM | 13 (3.3%) | 18 (5.7%) |
| 5:00 AM to 5:29 AM | 7 (1.8%) | 19 (6.0%) |
| 5:30 AM to 5:59 AM | 19 (4.9%) | 22 (6.9%) |
| 6:00 AM to 6:29 AM | 29 (7.4%) | 12 (3.8%) |
| 6:30 AM to 6:59 AM | 27 (6.9%) | 41 (12.9%) |
| 7:00 AM to 7:29 AM | 13 (3.3%) | 23 (7.3%) |
| 7:30 AM to 7:59 AM | 158 (40.5%) | 49 (15.5%) |
| 8:00 AM to 8:29 AM | 12 (3.1%) | 27 (8.5%) |
| 8:30 AM to 8:59 AM | 15 (3.8%) | 28 (8.8%) |
| 9:00 AM to 9:59 AM | 15 (3.8%) | 44 (13.9%) |
| 10:00 AM to 10:59 AM | 0 (0.0%) | 0 (0.0%) |
| 11:00 AM to 11:59 AM | 0 (0.0%) | 3 (0.9%) |
| 12:00 PM to 3:59 PM | 44 (11.3%) | 22 (6.9%) |
| 4:00 PM to 11:59 PM | 38 (9.7%) | 9 (2.8%) |
| Total | 390 (100.0%) | 317 (100.0%) |
Housing Occupancy in Jonesboro
Occupancy by Ownership in Jonesboro
Of the total 778 dwellings in Jonesboro, owner-occupied units account for 589 (75.7%), while renter-occupied units make up 189 (24.3%).
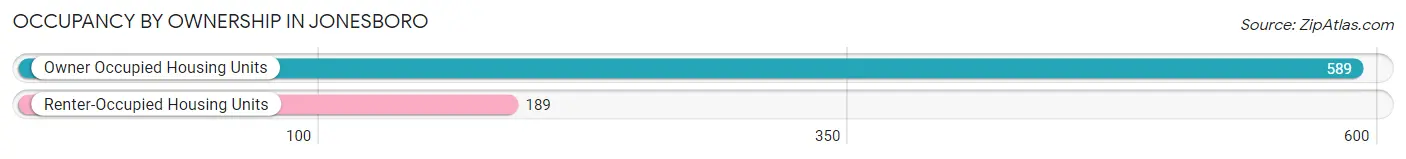
| Occupancy | # Housing Units | % Housing Units |
| Owner Occupied Housing Units | 589 | 75.7% |
| Renter-Occupied Housing Units | 189 | 24.3% |
| Total Occupied Housing Units | 778 | 100.0% |
Occupancy by Household Size in Jonesboro
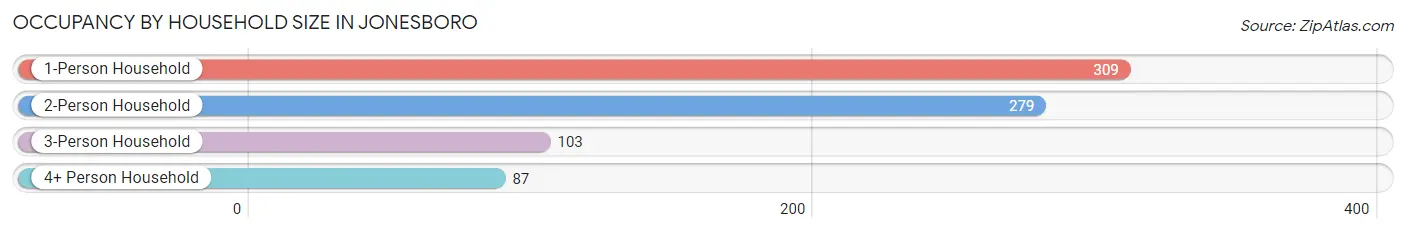
| Household Size | # Housing Units | % Housing Units |
| 1-Person Household | 309 | 39.7% |
| 2-Person Household | 279 | 35.9% |
| 3-Person Household | 103 | 13.2% |
| 4+ Person Household | 87 | 11.2% |
| Total Housing Units | 778 | 100.0% |
Occupancy by Ownership by Household Size in Jonesboro
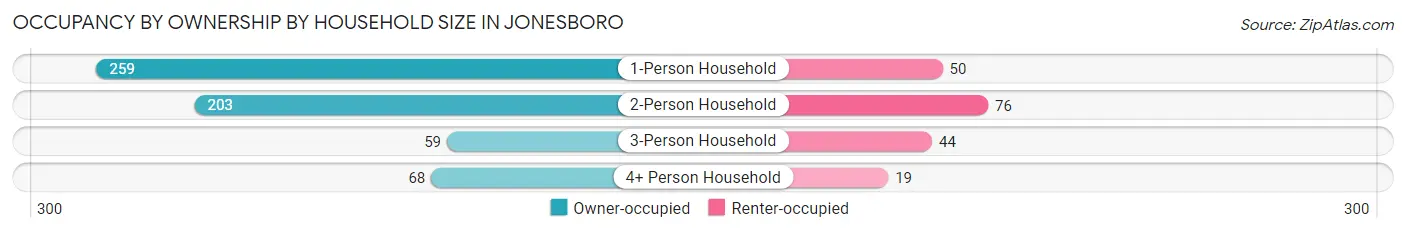
| Household Size | Owner-occupied | Renter-occupied |
| 1-Person Household | 259 (83.8%) | 50 (16.2%) |
| 2-Person Household | 203 (72.8%) | 76 (27.2%) |
| 3-Person Household | 59 (57.3%) | 44 (42.7%) |
| 4+ Person Household | 68 (78.2%) | 19 (21.8%) |
| Total Housing Units | 589 (75.7%) | 189 (24.3%) |
Occupancy by Educational Attainment in Jonesboro
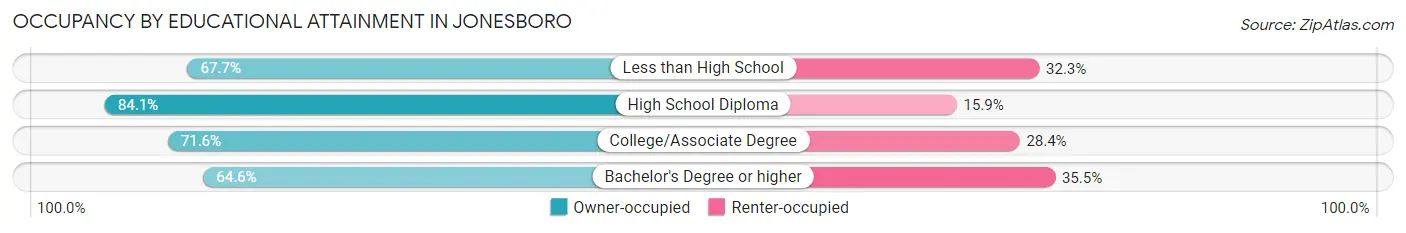
| Household Size | Owner-occupied | Renter-occupied |
| Less than High School | 44 (67.7%) | 21 (32.3%) |
| High School Diploma | 285 (84.1%) | 54 (15.9%) |
| College/Associate Degree | 189 (71.6%) | 75 (28.4%) |
| Bachelor's Degree or higher | 71 (64.5%) | 39 (35.4%) |
Occupancy by Age of Householder in Jonesboro
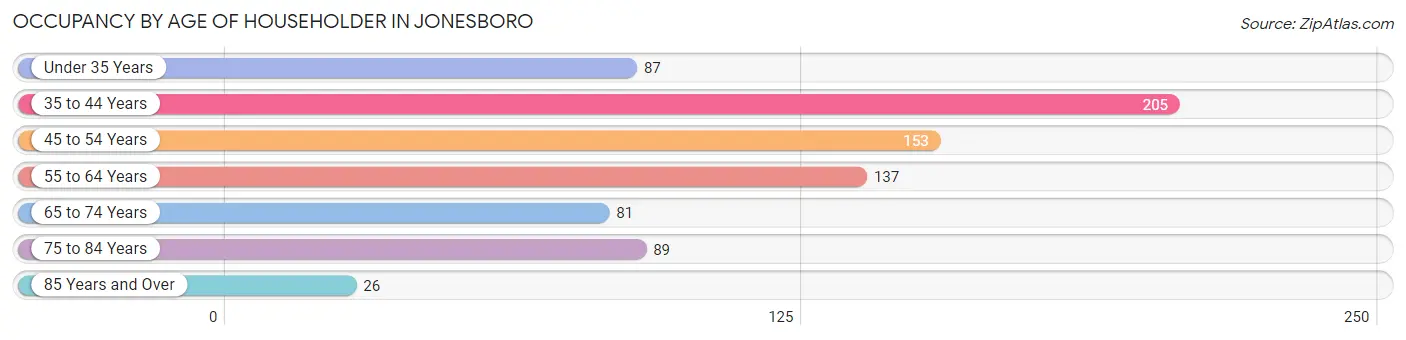
| Age Bracket | # Households | % Households |
| Under 35 Years | 87 | 11.2% |
| 35 to 44 Years | 205 | 26.4% |
| 45 to 54 Years | 153 | 19.7% |
| 55 to 64 Years | 137 | 17.6% |
| 65 to 74 Years | 81 | 10.4% |
| 75 to 84 Years | 89 | 11.4% |
| 85 Years and Over | 26 | 3.3% |
| Total | 778 | 100.0% |
Housing Finances in Jonesboro
Median Income by Occupancy in Jonesboro
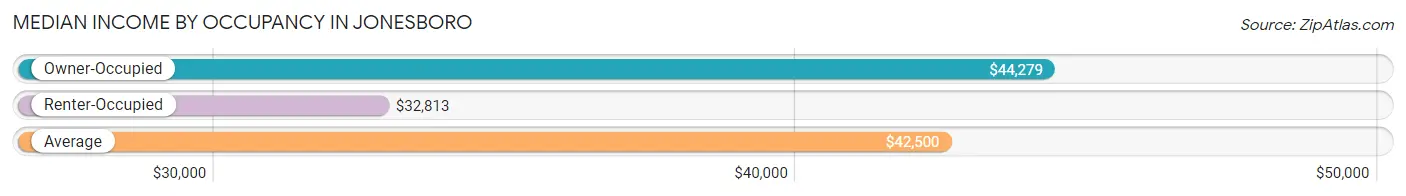
| Occupancy Type | # Households | Median Income |
| Owner-Occupied | 589 (75.7%) | $44,279 |
| Renter-Occupied | 189 (24.3%) | $32,813 |
| Average | 778 (100.0%) | $42,500 |
Occupancy by Householder Income Bracket in Jonesboro
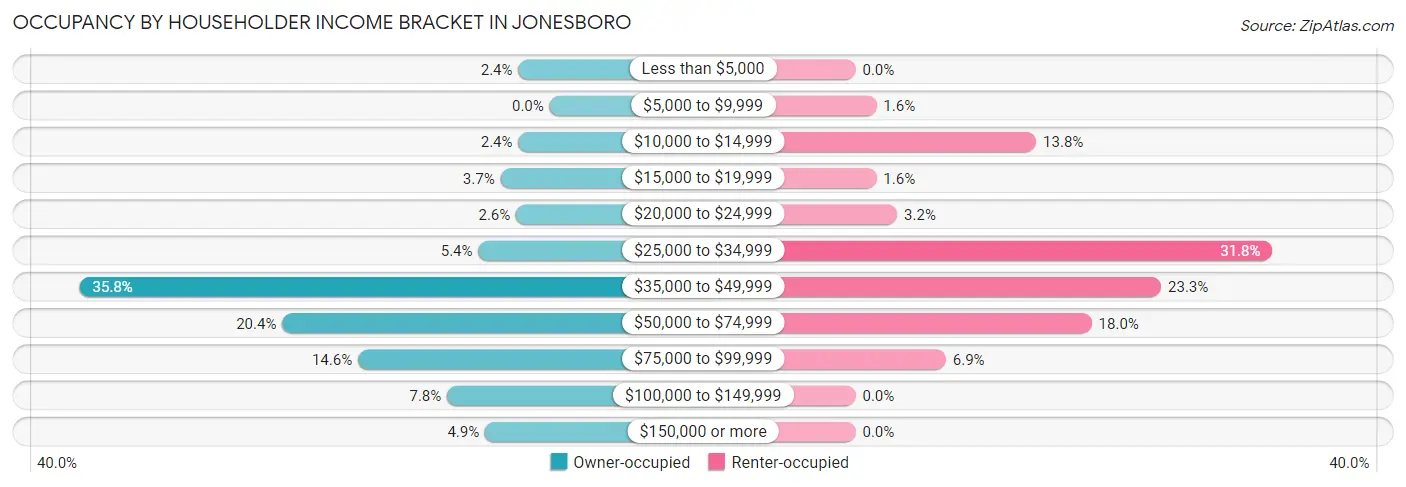
| Income Bracket | Owner-occupied | Renter-occupied |
| Less than $5,000 | 14 (2.4%) | 0 (0.0%) |
| $5,000 to $9,999 | 0 (0.0%) | 3 (1.6%) |
| $10,000 to $14,999 | 14 (2.4%) | 26 (13.8%) |
| $15,000 to $19,999 | 22 (3.7%) | 3 (1.6%) |
| $20,000 to $24,999 | 15 (2.5%) | 6 (3.2%) |
| $25,000 to $34,999 | 32 (5.4%) | 60 (31.8%) |
| $35,000 to $49,999 | 211 (35.8%) | 44 (23.3%) |
| $50,000 to $74,999 | 120 (20.4%) | 34 (18.0%) |
| $75,000 to $99,999 | 86 (14.6%) | 13 (6.9%) |
| $100,000 to $149,999 | 46 (7.8%) | 0 (0.0%) |
| $150,000 or more | 29 (4.9%) | 0 (0.0%) |
| Total | 589 (100.0%) | 189 (100.0%) |
Monthly Housing Cost Tiers in Jonesboro
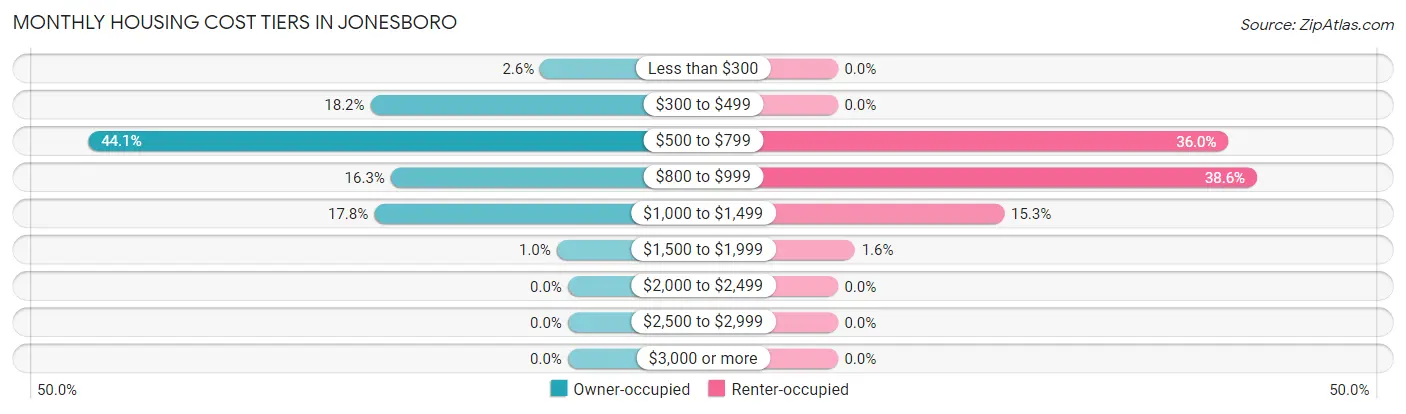
| Monthly Cost | Owner-occupied | Renter-occupied |
| Less than $300 | 15 (2.5%) | 0 (0.0%) |
| $300 to $499 | 107 (18.2%) | 0 (0.0%) |
| $500 to $799 | 260 (44.1%) | 68 (36.0%) |
| $800 to $999 | 96 (16.3%) | 73 (38.6%) |
| $1,000 to $1,499 | 105 (17.8%) | 29 (15.3%) |
| $1,500 to $1,999 | 6 (1.0%) | 3 (1.6%) |
| $2,000 to $2,499 | 0 (0.0%) | 0 (0.0%) |
| $2,500 to $2,999 | 0 (0.0%) | 0 (0.0%) |
| $3,000 or more | 0 (0.0%) | 0 (0.0%) |
| Total | 589 (100.0%) | 189 (100.0%) |
Physical Housing Characteristics in Jonesboro
Housing Structures in Jonesboro
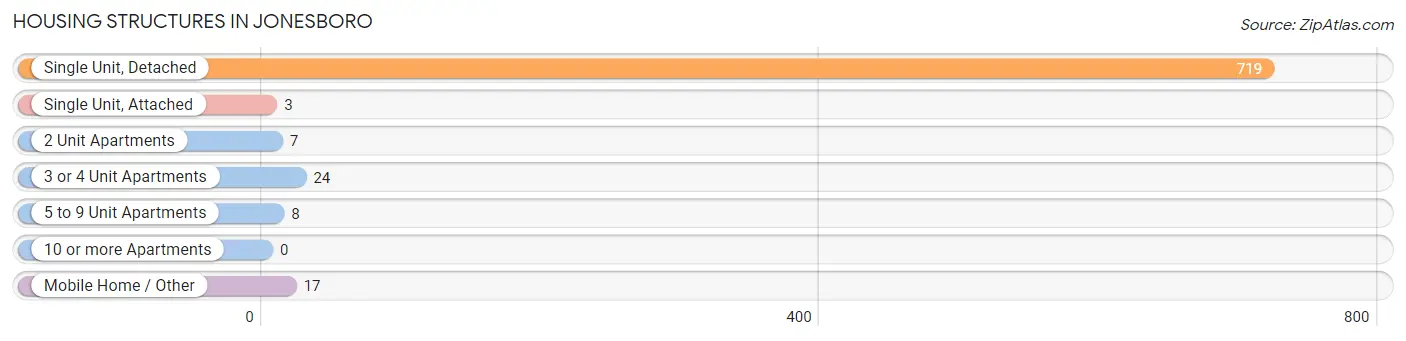
| Structure Type | # Housing Units | % Housing Units |
| Single Unit, Detached | 719 | 92.4% |
| Single Unit, Attached | 3 | 0.4% |
| 2 Unit Apartments | 7 | 0.9% |
| 3 or 4 Unit Apartments | 24 | 3.1% |
| 5 to 9 Unit Apartments | 8 | 1.0% |
| 10 or more Apartments | 0 | 0.0% |
| Mobile Home / Other | 17 | 2.2% |
| Total | 778 | 100.0% |
Housing Structures by Occupancy in Jonesboro
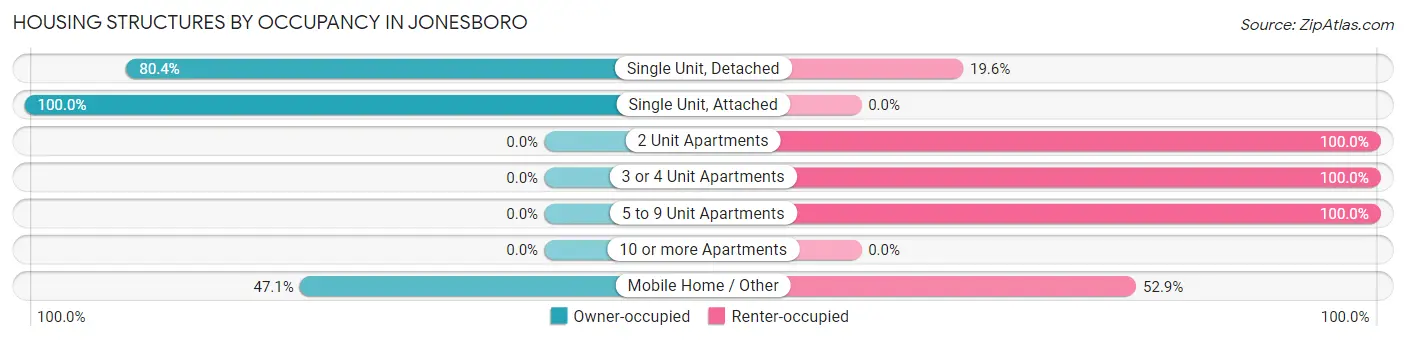
| Structure Type | Owner-occupied | Renter-occupied |
| Single Unit, Detached | 578 (80.4%) | 141 (19.6%) |
| Single Unit, Attached | 3 (100.0%) | 0 (0.0%) |
| 2 Unit Apartments | 0 (0.0%) | 7 (100.0%) |
| 3 or 4 Unit Apartments | 0 (0.0%) | 24 (100.0%) |
| 5 to 9 Unit Apartments | 0 (0.0%) | 8 (100.0%) |
| 10 or more Apartments | 0 (0.0%) | 0 (0.0%) |
| Mobile Home / Other | 8 (47.1%) | 9 (52.9%) |
| Total | 589 (75.7%) | 189 (24.3%) |
Housing Structures by Number of Rooms in Jonesboro
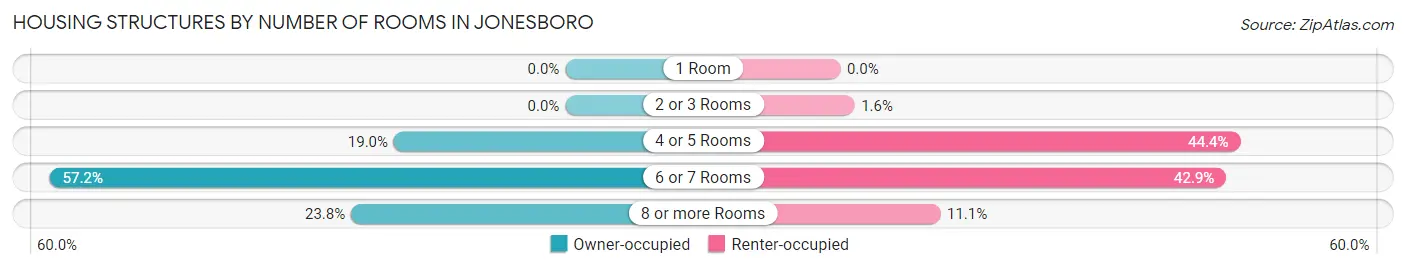
| Number of Rooms | Owner-occupied | Renter-occupied |
| 1 Room | 0 (0.0%) | 0 (0.0%) |
| 2 or 3 Rooms | 0 (0.0%) | 3 (1.6%) |
| 4 or 5 Rooms | 112 (19.0%) | 84 (44.4%) |
| 6 or 7 Rooms | 337 (57.2%) | 81 (42.9%) |
| 8 or more Rooms | 140 (23.8%) | 21 (11.1%) |
| Total | 589 (100.0%) | 189 (100.0%) |
Housing Structure by Heating Type in Jonesboro
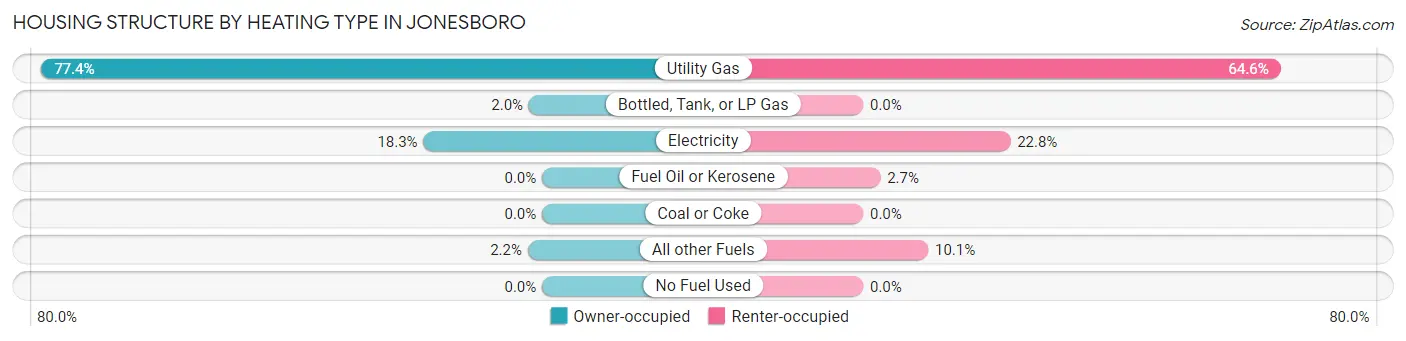
| Heating Type | Owner-occupied | Renter-occupied |
| Utility Gas | 456 (77.4%) | 122 (64.5%) |
| Bottled, Tank, or LP Gas | 12 (2.0%) | 0 (0.0%) |
| Electricity | 108 (18.3%) | 43 (22.8%) |
| Fuel Oil or Kerosene | 0 (0.0%) | 5 (2.6%) |
| Coal or Coke | 0 (0.0%) | 0 (0.0%) |
| All other Fuels | 13 (2.2%) | 19 (10.1%) |
| No Fuel Used | 0 (0.0%) | 0 (0.0%) |
| Total | 589 (100.0%) | 189 (100.0%) |
Household Vehicle Usage in Jonesboro
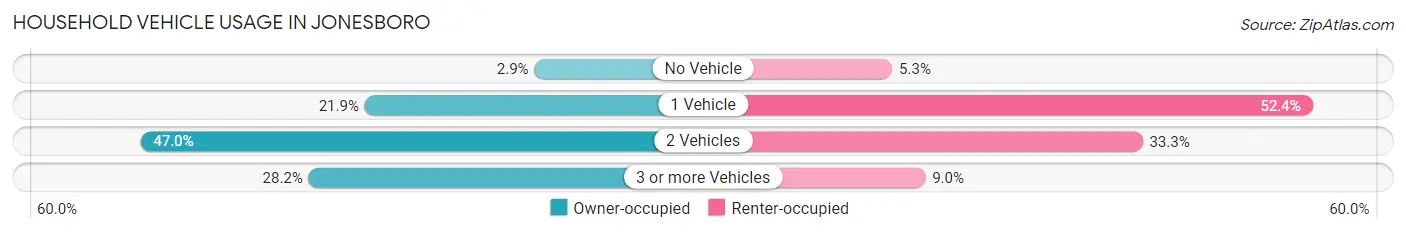
| Vehicles per Household | Owner-occupied | Renter-occupied |
| No Vehicle | 17 (2.9%) | 10 (5.3%) |
| 1 Vehicle | 129 (21.9%) | 99 (52.4%) |
| 2 Vehicles | 277 (47.0%) | 63 (33.3%) |
| 3 or more Vehicles | 166 (28.2%) | 17 (9.0%) |
| Total | 589 (100.0%) | 189 (100.0%) |
Real Estate & Mortgages in Jonesboro
Real Estate and Mortgage Overview in Jonesboro
| Characteristic | Without Mortgage | With Mortgage |
| Housing Units | 173 | 416 |
| Median Property Value | $68,900 | $75,700 |
| Median Household Income | $52,697 | $26 |
| Monthly Housing Costs | $452 | $0 |
| Real Estate Taxes | $571 | $33 |
Property Value by Mortgage Status in Jonesboro
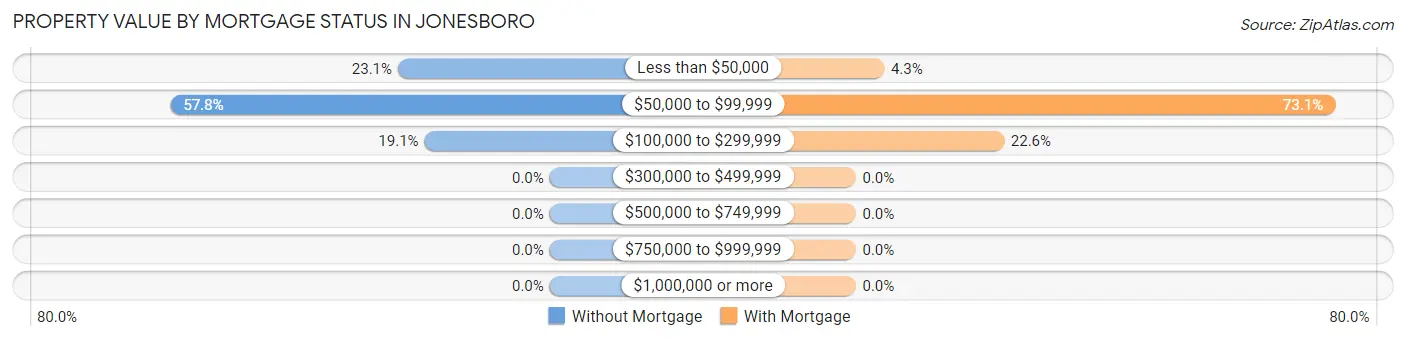
| Property Value | Without Mortgage | With Mortgage |
| Less than $50,000 | 40 (23.1%) | 18 (4.3%) |
| $50,000 to $99,999 | 100 (57.8%) | 304 (73.1%) |
| $100,000 to $299,999 | 33 (19.1%) | 94 (22.6%) |
| $300,000 to $499,999 | 0 (0.0%) | 0 (0.0%) |
| $500,000 to $749,999 | 0 (0.0%) | 0 (0.0%) |
| $750,000 to $999,999 | 0 (0.0%) | 0 (0.0%) |
| $1,000,000 or more | 0 (0.0%) | 0 (0.0%) |
| Total | 173 (100.0%) | 416 (100.0%) |
Household Income by Mortgage Status in Jonesboro
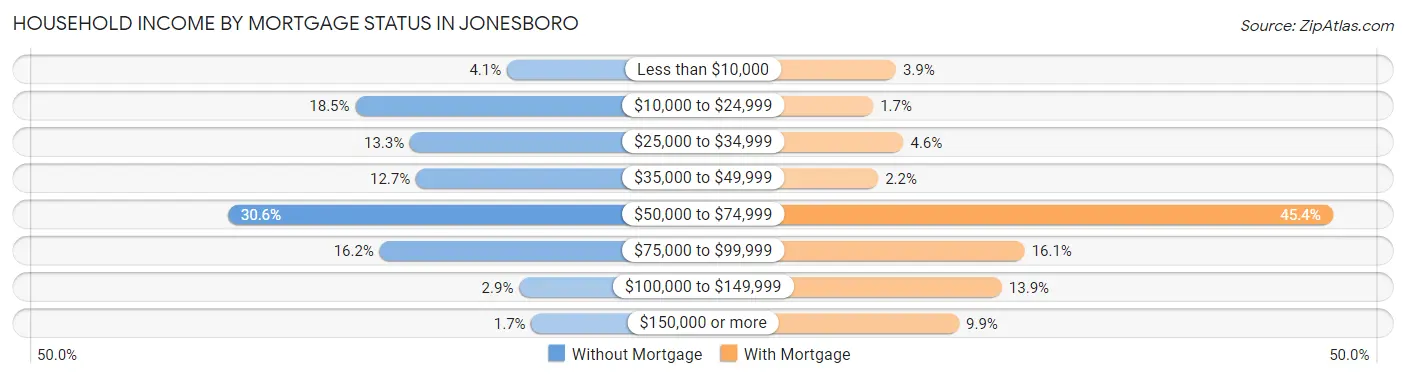
| Household Income | Without Mortgage | With Mortgage |
| Less than $10,000 | 7 (4.1%) | 16 (3.8%) |
| $10,000 to $24,999 | 32 (18.5%) | 7 (1.7%) |
| $25,000 to $34,999 | 23 (13.3%) | 19 (4.6%) |
| $35,000 to $49,999 | 22 (12.7%) | 9 (2.2%) |
| $50,000 to $74,999 | 53 (30.6%) | 189 (45.4%) |
| $75,000 to $99,999 | 28 (16.2%) | 67 (16.1%) |
| $100,000 to $149,999 | 5 (2.9%) | 58 (13.9%) |
| $150,000 or more | 3 (1.7%) | 41 (9.9%) |
| Total | 173 (100.0%) | 416 (100.0%) |
Property Value to Household Income Ratio in Jonesboro
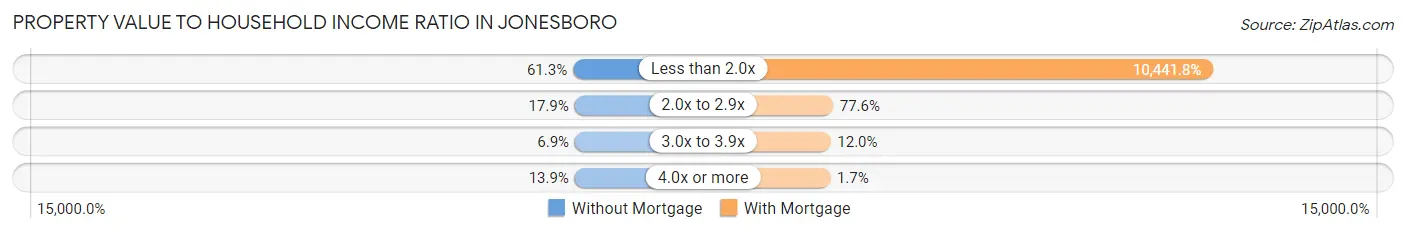
| Value-to-Income Ratio | Without Mortgage | With Mortgage |
| Less than 2.0x | 106 (61.3%) | 43,438 (10,441.8%) |
| 2.0x to 2.9x | 31 (17.9%) | 323 (77.6%) |
| 3.0x to 3.9x | 12 (6.9%) | 50 (12.0%) |
| 4.0x or more | 24 (13.9%) | 7 (1.7%) |
| Total | 173 (100.0%) | 416 (100.0%) |
Real Estate Taxes by Mortgage Status in Jonesboro
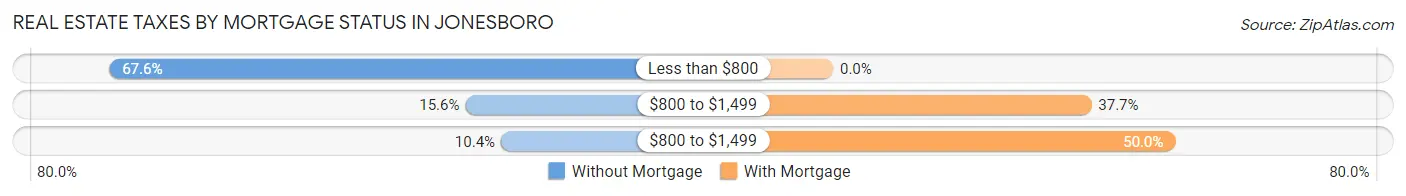
| Property Taxes | Without Mortgage | With Mortgage |
| Less than $800 | 117 (67.6%) | 0 (0.0%) |
| $800 to $1,499 | 27 (15.6%) | 157 (37.7%) |
| $800 to $1,499 | 18 (10.4%) | 208 (50.0%) |
| Total | 173 (100.0%) | 416 (100.0%) |
Health & Disability in Jonesboro
Health Insurance Coverage by Age in Jonesboro
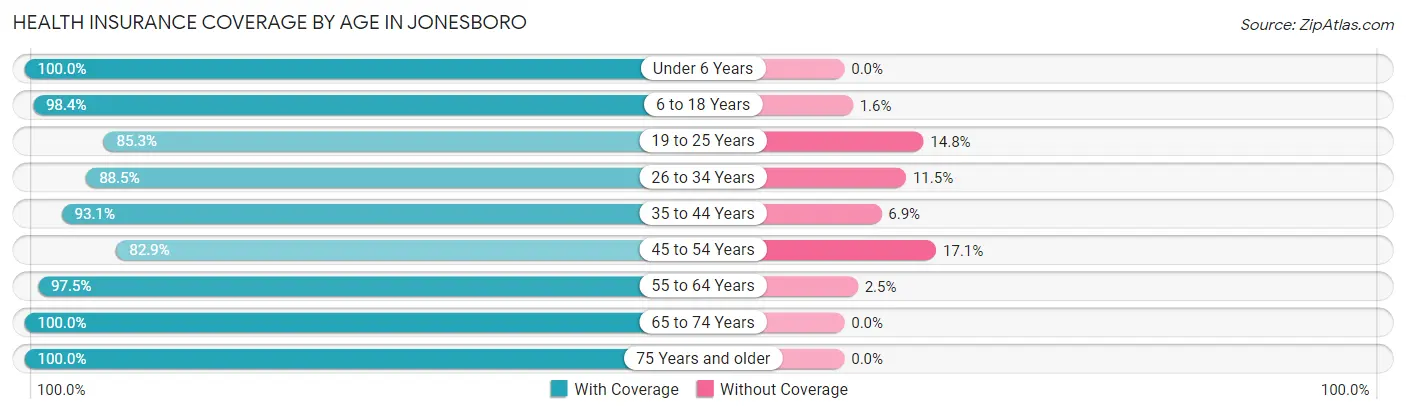
| Age Bracket | With Coverage | Without Coverage |
| Under 6 Years | 51 (100.0%) | 0 (0.0%) |
| 6 to 18 Years | 250 (98.4%) | 4 (1.6%) |
| 19 to 25 Years | 52 (85.3%) | 9 (14.7%) |
| 26 to 34 Years | 100 (88.5%) | 13 (11.5%) |
| 35 to 44 Years | 256 (93.1%) | 19 (6.9%) |
| 45 to 54 Years | 213 (82.9%) | 44 (17.1%) |
| 55 to 64 Years | 234 (97.5%) | 6 (2.5%) |
| 65 to 74 Years | 123 (100.0%) | 0 (0.0%) |
| 75 Years and older | 167 (100.0%) | 0 (0.0%) |
| Total | 1,446 (93.8%) | 95 (6.2%) |
Health Insurance Coverage by Citizenship Status in Jonesboro
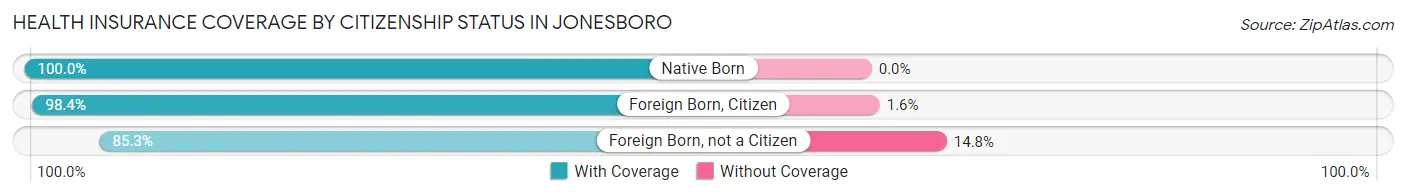
| Citizenship Status | With Coverage | Without Coverage |
| Native Born | 51 (100.0%) | 0 (0.0%) |
| Foreign Born, Citizen | 250 (98.4%) | 4 (1.6%) |
| Foreign Born, not a Citizen | 52 (85.3%) | 9 (14.7%) |
Health Insurance Coverage by Household Income in Jonesboro
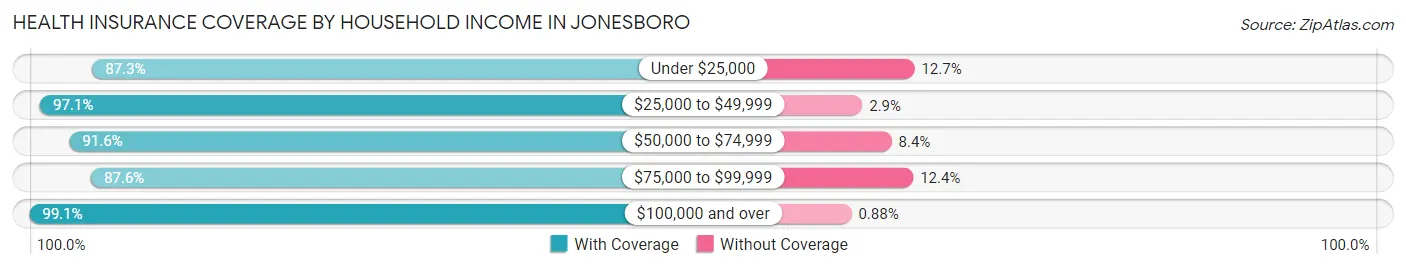
| Household Income | With Coverage | Without Coverage |
| Under $25,000 | 124 (87.3%) | 18 (12.7%) |
| $25,000 to $49,999 | 569 (97.1%) | 17 (2.9%) |
| $50,000 to $74,999 | 338 (91.6%) | 31 (8.4%) |
| $75,000 to $99,999 | 190 (87.6%) | 27 (12.4%) |
| $100,000 and over | 225 (99.1%) | 2 (0.9%) |
Public vs Private Health Insurance Coverage by Age in Jonesboro
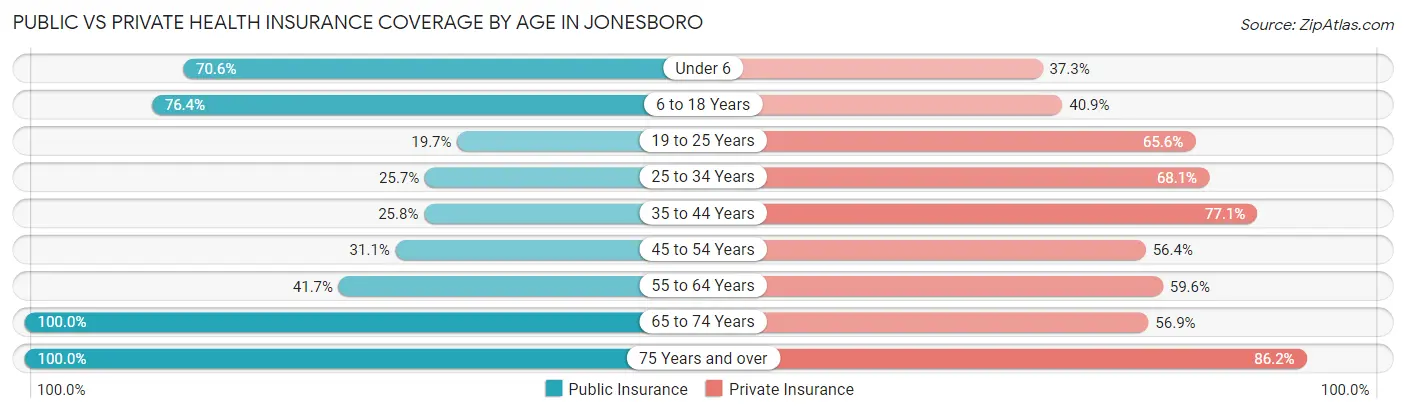
| Age Bracket | Public Insurance | Private Insurance |
| Under 6 | 36 (70.6%) | 19 (37.2%) |
| 6 to 18 Years | 194 (76.4%) | 104 (40.9%) |
| 19 to 25 Years | 12 (19.7%) | 40 (65.6%) |
| 25 to 34 Years | 29 (25.7%) | 77 (68.1%) |
| 35 to 44 Years | 71 (25.8%) | 212 (77.1%) |
| 45 to 54 Years | 80 (31.1%) | 145 (56.4%) |
| 55 to 64 Years | 100 (41.7%) | 143 (59.6%) |
| 65 to 74 Years | 123 (100.0%) | 70 (56.9%) |
| 75 Years and over | 167 (100.0%) | 144 (86.2%) |
| Total | 812 (52.7%) | 954 (61.9%) |
Disability Status by Sex by Age in Jonesboro
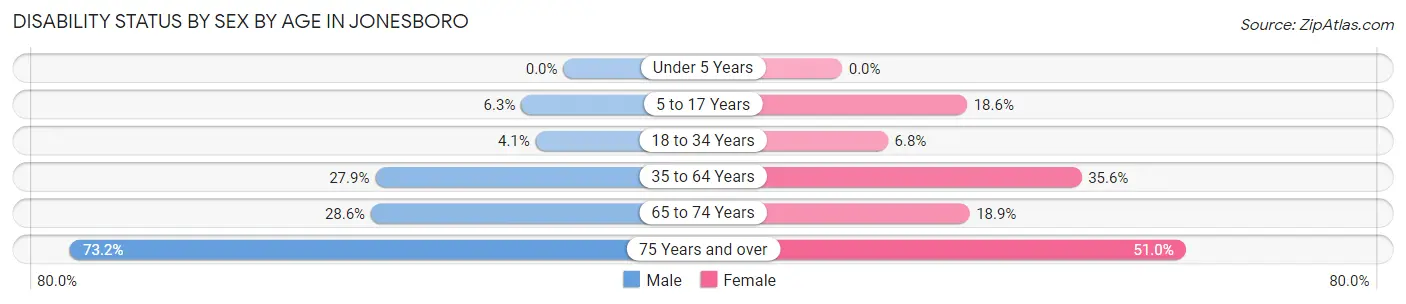
| Age Bracket | Male | Female |
| Under 5 Years | 0 (0.0%) | 0 (0.0%) |
| 5 to 17 Years | 7 (6.2%) | 23 (18.5%) |
| 18 to 34 Years | 4 (4.1%) | 7 (6.8%) |
| 35 to 64 Years | 119 (27.9%) | 123 (35.5%) |
| 65 to 74 Years | 14 (28.6%) | 14 (18.9%) |
| 75 Years and over | 52 (73.2%) | 49 (51.0%) |
Disability Class by Sex by Age in Jonesboro
Disability Class: Hearing Difficulty
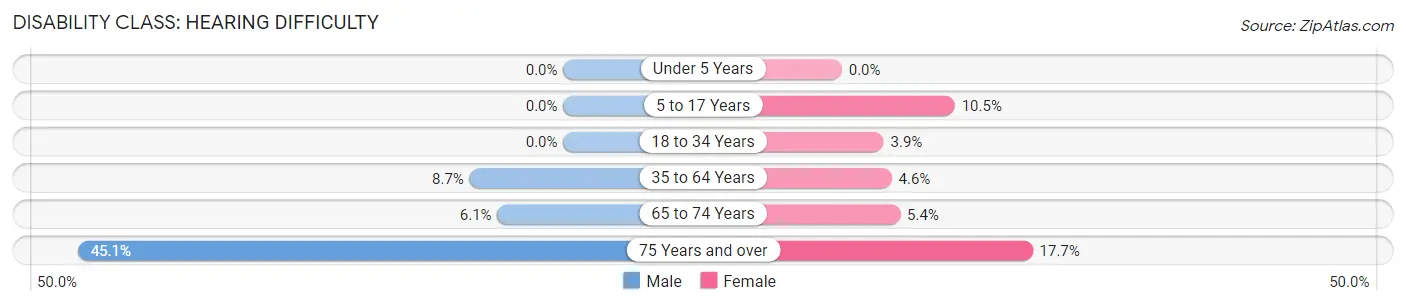
| Age Bracket | Male | Female |
| Under 5 Years | 0 (0.0%) | 0 (0.0%) |
| 5 to 17 Years | 0 (0.0%) | 13 (10.5%) |
| 18 to 34 Years | 0 (0.0%) | 4 (3.9%) |
| 35 to 64 Years | 37 (8.7%) | 16 (4.6%) |
| 65 to 74 Years | 3 (6.1%) | 4 (5.4%) |
| 75 Years and over | 32 (45.1%) | 17 (17.7%) |
Disability Class: Vision Difficulty
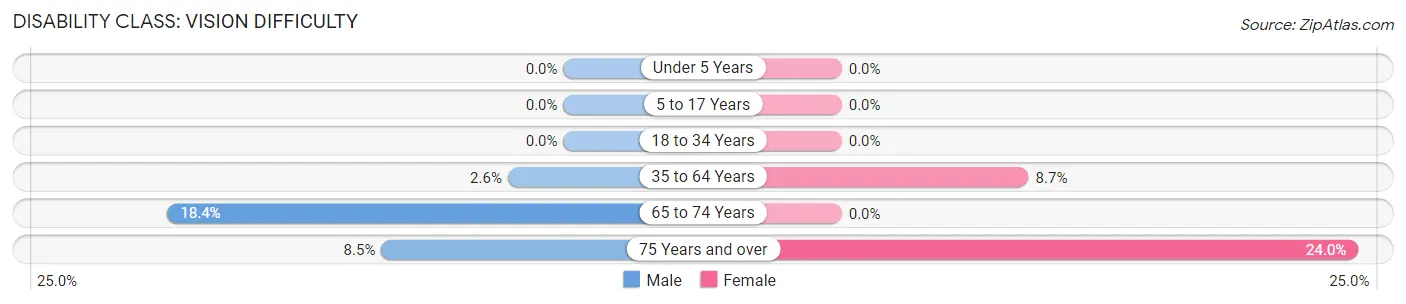
| Age Bracket | Male | Female |
| Under 5 Years | 0 (0.0%) | 0 (0.0%) |
| 5 to 17 Years | 0 (0.0%) | 0 (0.0%) |
| 18 to 34 Years | 0 (0.0%) | 0 (0.0%) |
| 35 to 64 Years | 11 (2.6%) | 30 (8.7%) |
| 65 to 74 Years | 9 (18.4%) | 0 (0.0%) |
| 75 Years and over | 6 (8.5%) | 23 (24.0%) |
Disability Class: Cognitive Difficulty
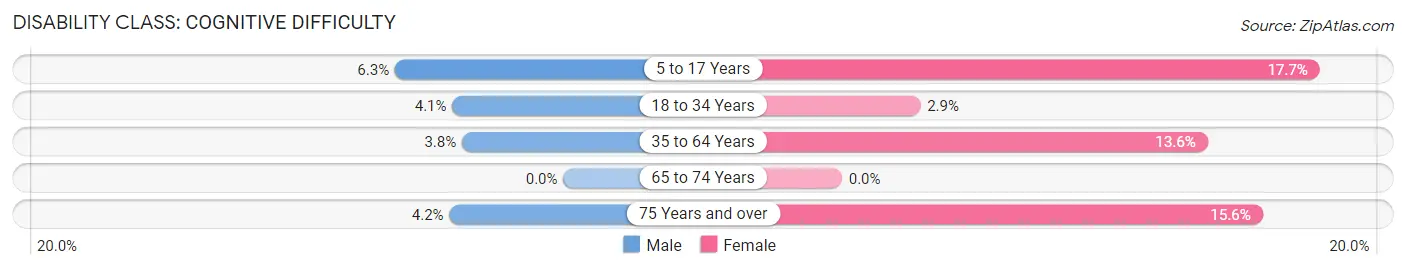
| Age Bracket | Male | Female |
| 5 to 17 Years | 7 (6.2%) | 22 (17.7%) |
| 18 to 34 Years | 4 (4.1%) | 3 (2.9%) |
| 35 to 64 Years | 16 (3.8%) | 47 (13.6%) |
| 65 to 74 Years | 0 (0.0%) | 0 (0.0%) |
| 75 Years and over | 3 (4.2%) | 15 (15.6%) |
Disability Class: Ambulatory Difficulty
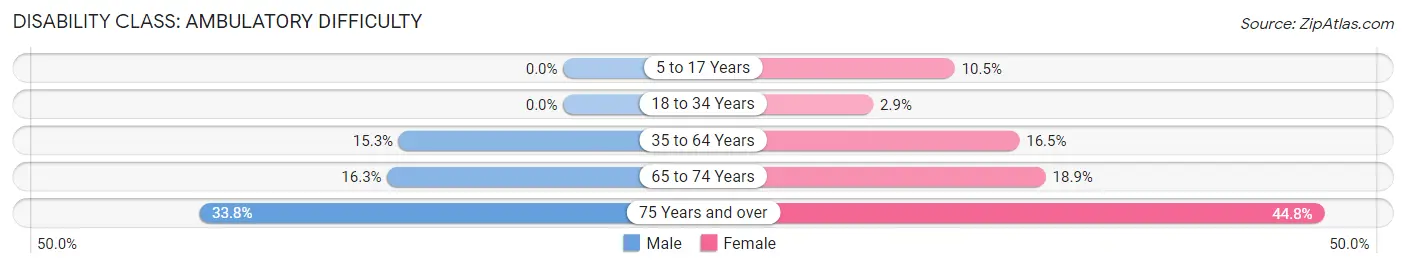
| Age Bracket | Male | Female |
| 5 to 17 Years | 0 (0.0%) | 13 (10.5%) |
| 18 to 34 Years | 0 (0.0%) | 3 (2.9%) |
| 35 to 64 Years | 65 (15.3%) | 57 (16.5%) |
| 65 to 74 Years | 8 (16.3%) | 14 (18.9%) |
| 75 Years and over | 24 (33.8%) | 43 (44.8%) |
Disability Class: Self-Care Difficulty
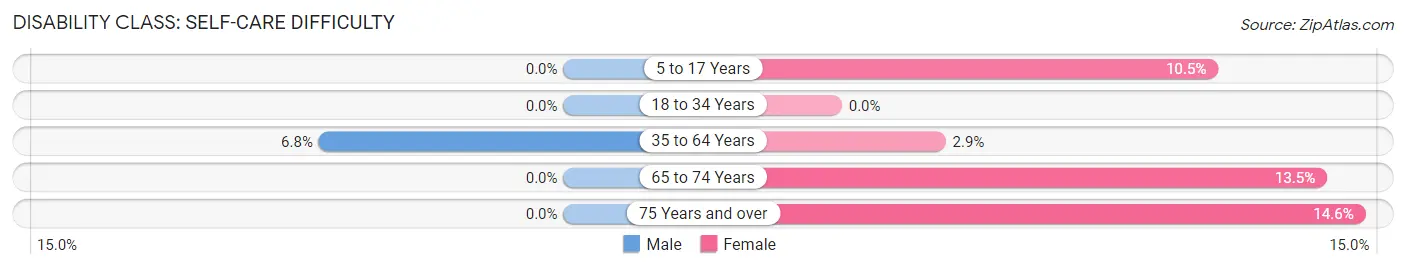
| Age Bracket | Male | Female |
| 5 to 17 Years | 0 (0.0%) | 13 (10.5%) |
| 18 to 34 Years | 0 (0.0%) | 0 (0.0%) |
| 35 to 64 Years | 29 (6.8%) | 10 (2.9%) |
| 65 to 74 Years | 0 (0.0%) | 10 (13.5%) |
| 75 Years and over | 0 (0.0%) | 14 (14.6%) |
Technology Access in Jonesboro
Computing Device Access in Jonesboro
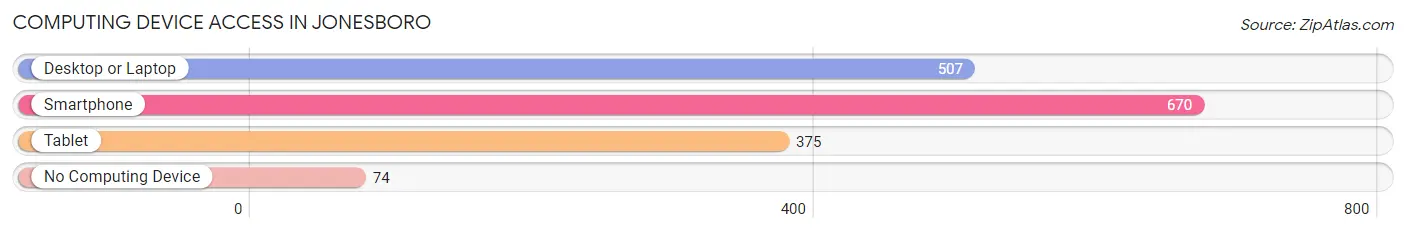
| Device Type | # Households | % Households |
| Desktop or Laptop | 507 | 65.2% |
| Smartphone | 670 | 86.1% |
| Tablet | 375 | 48.2% |
| No Computing Device | 74 | 9.5% |
| Total | 778 | 100.0% |
Internet Access in Jonesboro
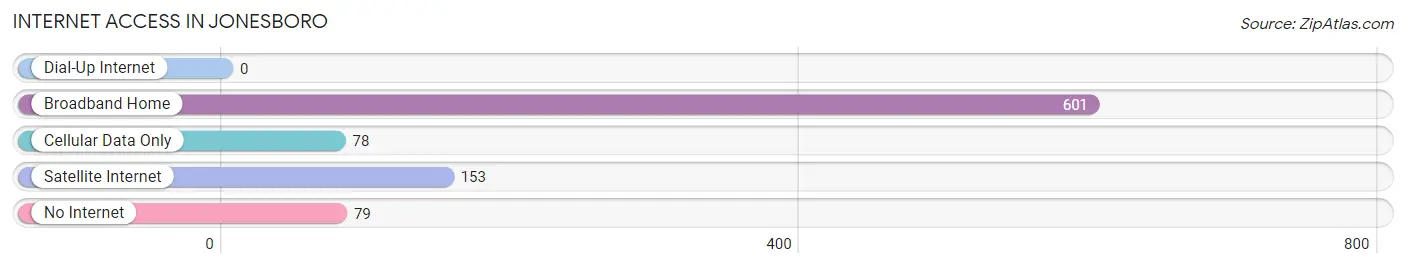
| Internet Type | # Households | % Households |
| Dial-Up Internet | 0 | 0.0% |
| Broadband Home | 601 | 77.2% |
| Cellular Data Only | 78 | 10.0% |
| Satellite Internet | 153 | 19.7% |
| No Internet | 79 | 10.2% |
| Total | 778 | 100.0% |
Jonesboro Summary
Jonesboro is a small town located in Grant County, Indiana. It is situated in the northeastern part of the state, about 25 miles from the state capital of Indianapolis. The town has a population of approximately 1,500 people and is part of the Marion metropolitan statistical area.
History
Jonesboro was founded in 1837 by William Jones, a Quaker from North Carolina. He purchased the land from the government and named the town after himself. The town was incorporated in 1845 and was the first town in Grant County.
The town was a major stop on the Underground Railroad, with many slaves escaping to freedom in Canada. The town was also a major stop on the Wabash and Erie Canal, which was built in the 1840s. The canal was used to transport goods and people from the Ohio River to Lake Erie.
Geography
Jonesboro is located in the northeastern part of Grant County, Indiana. It is situated on the banks of the Mississinewa River, which flows through the town. The town is surrounded by farmland and is located about 25 miles from the state capital of Indianapolis.
The town has a total area of 0.7 square miles, all of which is land. The town has a humid continental climate, with hot summers and cold winters.
Economy
The economy of Jonesboro is largely based on agriculture. The town is home to several farms, which produce corn, soybeans, and wheat. The town also has a few small businesses, including a grocery store, a hardware store, and a few restaurants.
The town is also home to a few manufacturing companies, including a plastics factory and a metal fabrication plant. The town is also home to a few small technology companies, which provide software and web development services.
Demographics
As of the 2010 census, Jonesboro had a population of 1,500 people. The racial makeup of the town was 97.3% White, 0.7% African American, 0.3% Native American, 0.3% Asian, and 1.3% from other races. Hispanic or Latino of any race were 1.3% of the population.
The median income for a household in the town was $37,500, and the median income for a family was $45,000. The per capita income for the town was $18,000. About 10.7% of families and 13.3% of the population were below the poverty line, including 17.3% of those under age 18 and 8.3% of those age 65 or over.
Common Questions
What is Per Capita Income in Jonesboro?
Per Capita income in Jonesboro is $27,887.
What is the Median Family Income in Jonesboro?
Median Family Income in Jonesboro is $54,044.
What is the Median Household income in Jonesboro?
Median Household Income in Jonesboro is $42,500.
What is Income or Wage Gap in Jonesboro?
Income or Wage Gap in Jonesboro is 33.4%.
Women in Jonesboro earn 66.6 cents for every dollar earned by a man.
What is Inequality or Gini Index in Jonesboro?
Inequality or Gini Index in Jonesboro is 0.33.
What is the Total Population of Jonesboro?
Total Population of Jonesboro is 1,541.
What is the Total Male Population of Jonesboro?
Total Male Population of Jonesboro is 762.
What is the Total Female Population of Jonesboro?
Total Female Population of Jonesboro is 779.
What is the Ratio of Males per 100 Females in Jonesboro?
There are 97.82 Males per 100 Females in Jonesboro.
What is the Ratio of Females per 100 Males in Jonesboro?
There are 102.23 Females per 100 Males in Jonesboro.
What is the Median Population Age in Jonesboro?
Median Population Age in Jonesboro is 46.8 Years.
What is the Average Family Size in Jonesboro
Average Family Size in Jonesboro is 2.6 People.
What is the Average Household Size in Jonesboro
Average Household Size in Jonesboro is 2.0 People.
How Large is the Labor Force in Jonesboro?
There are 800 People in the Labor Forcein in Jonesboro.
What is the Percentage of People in the Labor Force in Jonesboro?
62.0% of People are in the Labor Force in Jonesboro.
What is the Unemployment Rate in Jonesboro?
Unemployment Rate in Jonesboro is 5.9%.