Huntington, IN Map & Demographics
Huntington Map
Huntington Overview
$25,652
PER CAPITA INCOME
$61,141
AVG FAMILY INCOME
$50,748
AVG HOUSEHOLD INCOME
43.3%
WAGE / INCOME GAP [ % ]
56.7¢/ $1
WAGE / INCOME GAP [ $ ]
$7,666
FAMILY INCOME DEFICIT
0.41
INEQUALITY / GINI INDEX
17,017
TOTAL POPULATION
8,139
MALE POPULATION
8,878
FEMALE POPULATION
91.68
MALES / 100 FEMALES
109.08
FEMALES / 100 MALES
36.6
MEDIAN AGE
2.9
AVG FAMILY SIZE
2.3
AVG HOUSEHOLD SIZE
8,454
LABOR FORCE [ PEOPLE ]
61.0%
PERCENT IN LABOR FORCE
5.2%
UNEMPLOYMENT RATE
Huntington Zip Codes
Huntington Area Codes
Income in Huntington
Income Overview in Huntington
Per Capita Income in Huntington is $25,652, while median incomes of families and households are $61,141 and $50,748 respectively.
| Characteristic | Number | Measure |
| Per Capita Income | 17,017 | $25,652 |
| Median Family Income | 3,979 | $61,141 |
| Mean Family Income | 3,979 | $72,347 |
| Median Household Income | 6,928 | $50,748 |
| Mean Household Income | 6,928 | $61,254 |
| Income Deficit | 3,979 | $7,666 |
| Wage / Income Gap (%) | 17,017 | 43.25% |
| Wage / Income Gap ($) | 17,017 | 56.75¢ per $1 |
| Gini / Inequality Index | 17,017 | 0.41 |
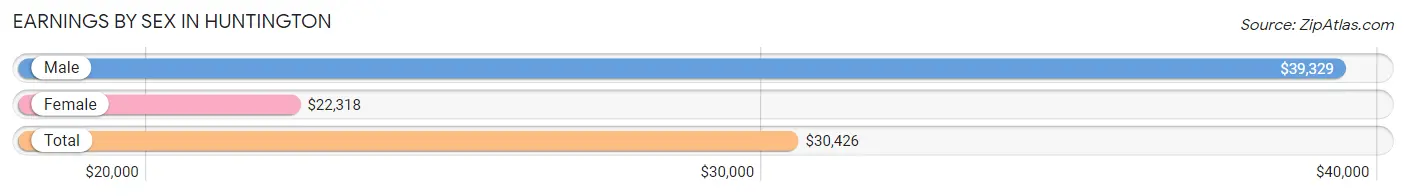
Earnings by Sex in Huntington
Average Earnings in Huntington are $30,426, $39,329 for men and $22,318 for women, a difference of 43.2%.
| Sex | Number | Average Earnings |
| Male | 4,639 (51.4%) | $39,329 |
| Female | 4,385 (48.6%) | $22,318 |
| Total | 9,024 (100.0%) | $30,426 |
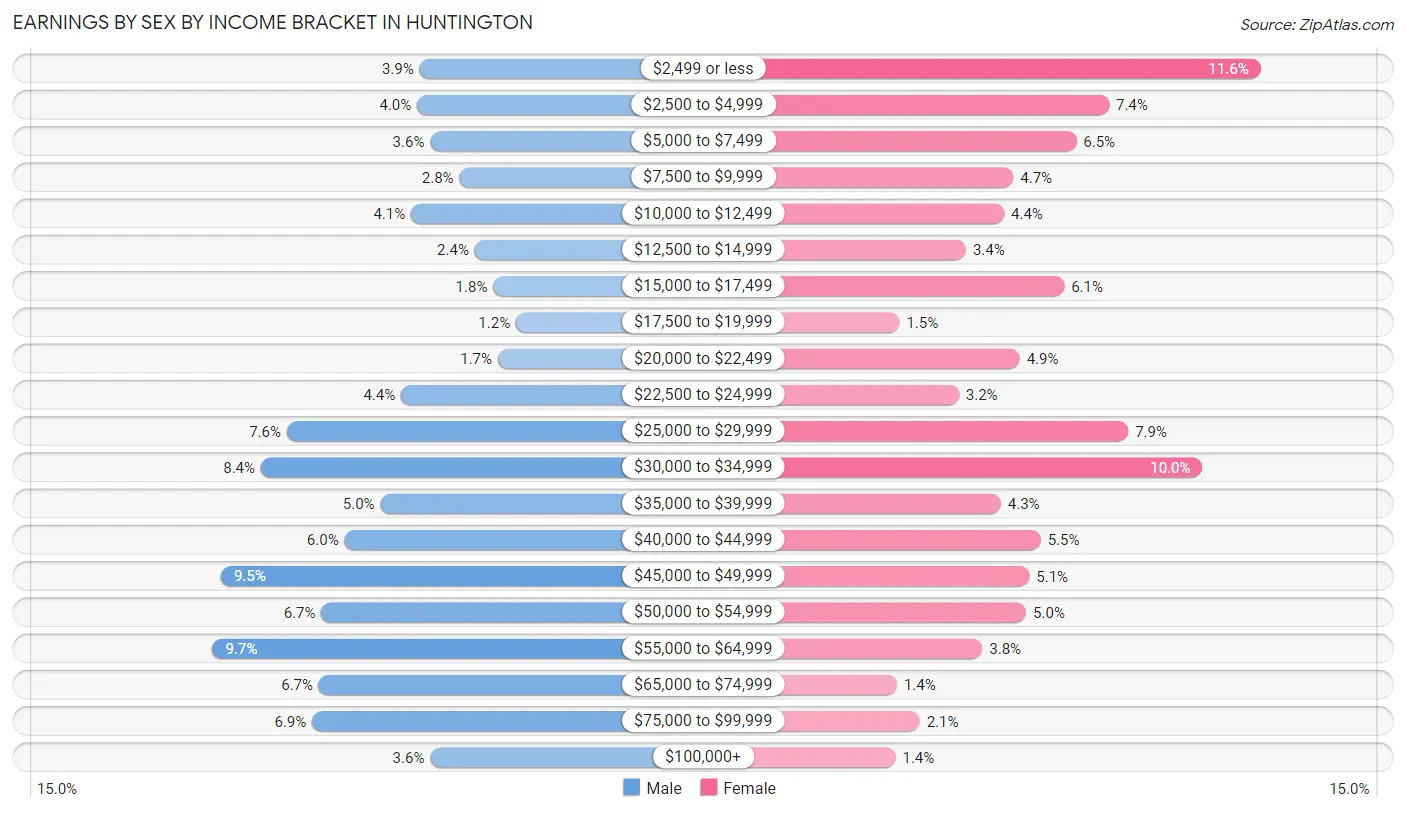
Earnings by Sex by Income Bracket in Huntington
The most common earnings brackets in Huntington are $55,000 to $64,999 for men (451 | 9.7%) and $2,499 or less for women (510 | 11.6%).
| Income | Male | Female |
| $2,499 or less | 181 (3.9%) | 510 (11.6%) |
| $2,500 to $4,999 | 184 (4.0%) | 323 (7.4%) |
| $5,000 to $7,499 | 167 (3.6%) | 283 (6.5%) |
| $7,500 to $9,999 | 129 (2.8%) | 205 (4.7%) |
| $10,000 to $12,499 | 192 (4.1%) | 194 (4.4%) |
| $12,500 to $14,999 | 109 (2.4%) | 147 (3.4%) |
| $15,000 to $17,499 | 85 (1.8%) | 268 (6.1%) |
| $17,500 to $19,999 | 55 (1.2%) | 65 (1.5%) |
| $20,000 to $22,499 | 79 (1.7%) | 213 (4.9%) |
| $22,500 to $24,999 | 205 (4.4%) | 138 (3.2%) |
| $25,000 to $29,999 | 354 (7.6%) | 347 (7.9%) |
| $30,000 to $34,999 | 388 (8.4%) | 438 (10.0%) |
| $35,000 to $39,999 | 232 (5.0%) | 190 (4.3%) |
| $40,000 to $44,999 | 279 (6.0%) | 239 (5.4%) |
| $45,000 to $49,999 | 440 (9.5%) | 225 (5.1%) |
| $50,000 to $54,999 | 309 (6.7%) | 221 (5.0%) |
| $55,000 to $64,999 | 451 (9.7%) | 167 (3.8%) |
| $65,000 to $74,999 | 312 (6.7%) | 62 (1.4%) |
| $75,000 to $99,999 | 321 (6.9%) | 90 (2.1%) |
| $100,000+ | 167 (3.6%) | 60 (1.4%) |
| Total | 4,639 (100.0%) | 4,385 (100.0%) |
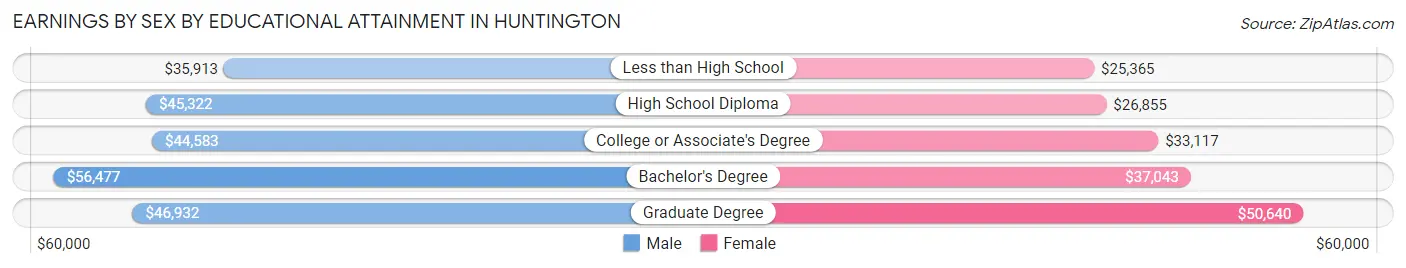
Earnings by Sex by Educational Attainment in Huntington
Average earnings in Huntington are $45,712 for men and $30,506 for women, a difference of 33.3%. Men with an educational attainment of bachelor's degree enjoy the highest average annual earnings of $56,477, while those with less than high school education earn the least with $35,913. Women with an educational attainment of graduate degree earn the most with the average annual earnings of $50,640, while those with less than high school education have the smallest earnings of $25,365.
| Educational Attainment | Male Income | Female Income |
| Less than High School | $35,913 | $25,365 |
| High School Diploma | $45,322 | $26,855 |
| College or Associate's Degree | $44,583 | $33,117 |
| Bachelor's Degree | $56,477 | $37,043 |
| Graduate Degree | $46,932 | $50,640 |
| Total | $45,712 | $30,506 |
Family Income in Huntington
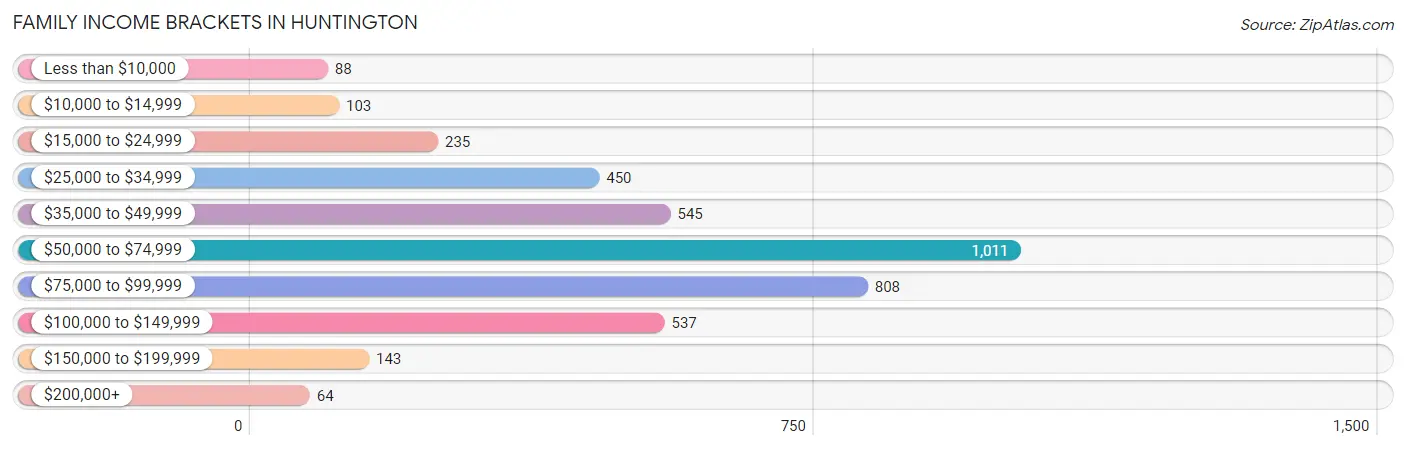
Family Income Brackets in Huntington
According to the Huntington family income data, there are 1,011 families falling into the $50,000 to $74,999 income range, which is the most common income bracket and makes up 25.4% of all families. Conversely, the $200,000+ income bracket is the least frequent group with only 64 families (1.6%) belonging to this category.
| Income Bracket | # Families | % Families |
| Less than $10,000 | 88 | 2.2% |
| $10,000 to $14,999 | 103 | 2.6% |
| $15,000 to $24,999 | 235 | 5.9% |
| $25,000 to $34,999 | 450 | 11.3% |
| $35,000 to $49,999 | 545 | 13.7% |
| $50,000 to $74,999 | 1,011 | 25.4% |
| $75,000 to $99,999 | 808 | 20.3% |
| $100,000 to $149,999 | 537 | 13.5% |
| $150,000 to $199,999 | 143 | 3.6% |
| $200,000+ | 64 | 1.6% |
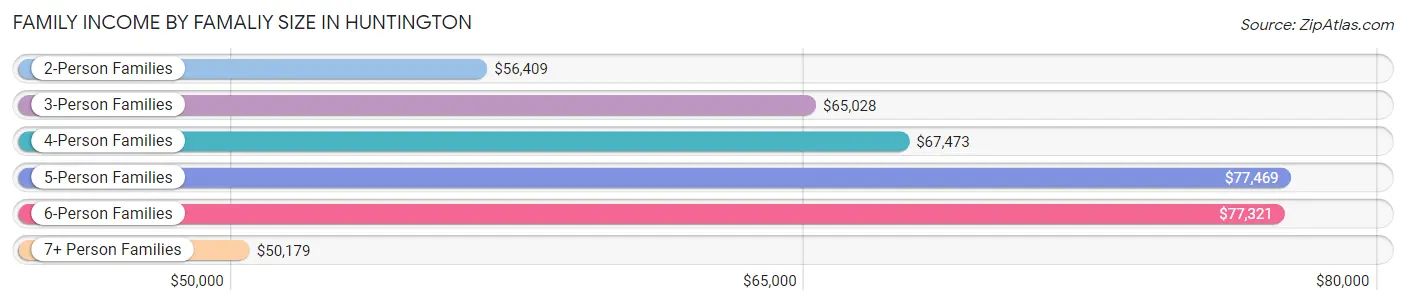
Family Income by Famaliy Size in Huntington
5-person families (231 | 5.8%) account for the highest median family income in Huntington with $77,469 per family, while 2-person families (2,008 | 50.5%) have the highest median income of $28,204 per family member.
| Income Bracket | # Families | Median Income |
| 2-Person Families | 2,008 (50.5%) | $56,409 |
| 3-Person Families | 769 (19.3%) | $65,028 |
| 4-Person Families | 713 (17.9%) | $67,473 |
| 5-Person Families | 231 (5.8%) | $77,469 |
| 6-Person Families | 199 (5.0%) | $77,321 |
| 7+ Person Families | 59 (1.5%) | $50,179 |
| Total | 3,979 (100.0%) | $61,141 |
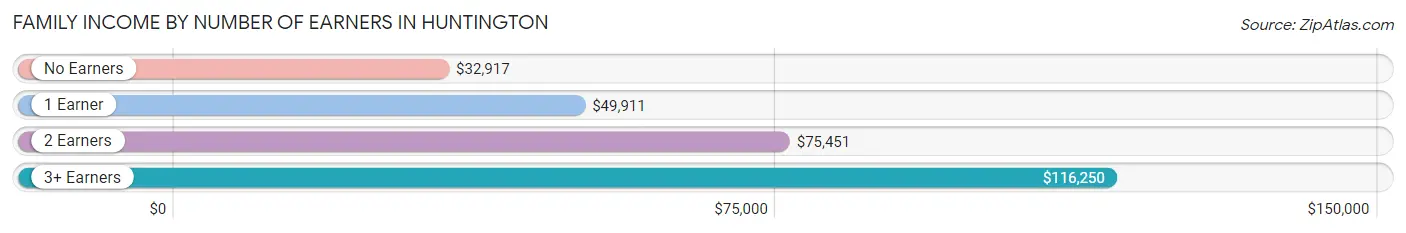
Family Income by Number of Earners in Huntington
The median family income in Huntington is $61,141, with families comprising 3+ earners (270) having the highest median family income of $116,250, while families with no earners (465) have the lowest median family income of $32,917, accounting for 6.8% and 11.7% of families, respectively.
| Number of Earners | # Families | Median Income |
| No Earners | 465 (11.7%) | $32,917 |
| 1 Earner | 1,513 (38.0%) | $49,911 |
| 2 Earners | 1,731 (43.5%) | $75,451 |
| 3+ Earners | 270 (6.8%) | $116,250 |
| Total | 3,979 (100.0%) | $61,141 |
Household Income in Huntington
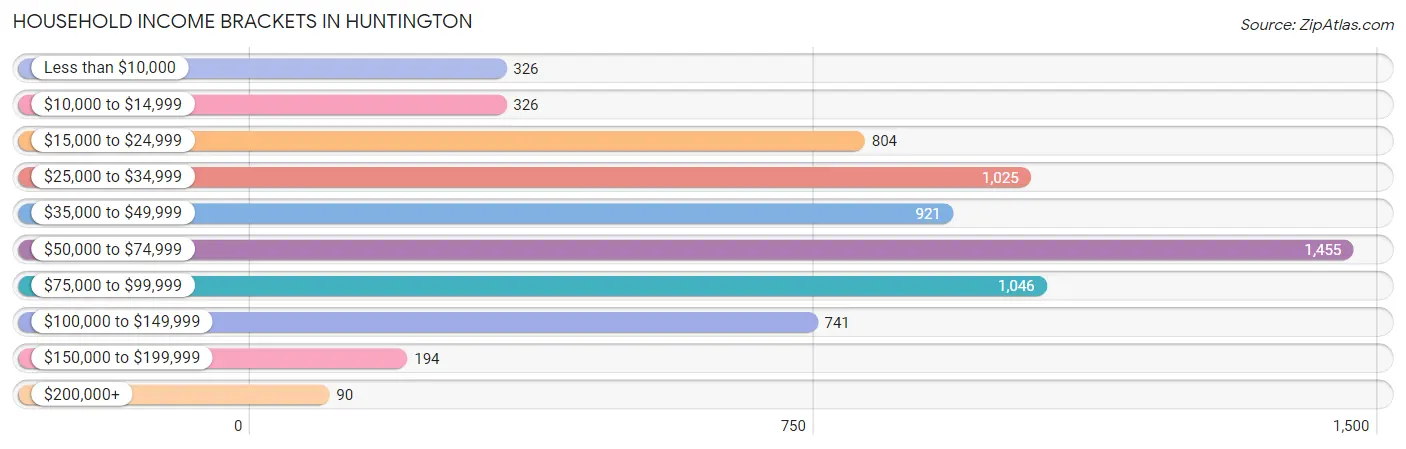
Household Income Brackets in Huntington
With 1,455 households falling in the category, the $50,000 to $74,999 income range is the most frequent in Huntington, accounting for 21.0% of all households. In contrast, only 90 households (1.3%) fall into the $200,000+ income bracket, making it the least populous group.
| Income Bracket | # Households | % Households |
| Less than $10,000 | 326 | 4.7% |
| $10,000 to $14,999 | 326 | 4.7% |
| $15,000 to $24,999 | 804 | 11.6% |
| $25,000 to $34,999 | 1,025 | 14.8% |
| $35,000 to $49,999 | 921 | 13.3% |
| $50,000 to $74,999 | 1,455 | 21.0% |
| $75,000 to $99,999 | 1,046 | 15.1% |
| $100,000 to $149,999 | 741 | 10.7% |
| $150,000 to $199,999 | 194 | 2.8% |
| $200,000+ | 90 | 1.3% |
Household Income by Householder Age in Huntington
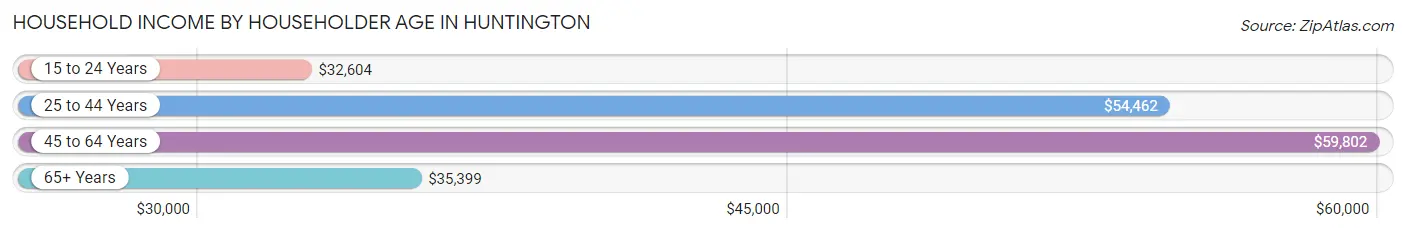
The median household income in Huntington is $50,748, with the highest median household income of $59,802 found in the 45 to 64 years age bracket for the primary householder. A total of 2,585 households (37.3%) fall into this category. Meanwhile, the 15 to 24 years age bracket for the primary householder has the lowest median household income of $32,604, with 481 households (6.9%) in this group.
| Income Bracket | # Households | Median Income |
| 15 to 24 Years | 481 (6.9%) | $32,604 |
| 25 to 44 Years | 2,208 (31.9%) | $54,462 |
| 45 to 64 Years | 2,585 (37.3%) | $59,802 |
| 65+ Years | 1,654 (23.9%) | $35,399 |
| Total | 6,928 (100.0%) | $50,748 |
Poverty in Huntington
Income Below Poverty by Sex and Age in Huntington
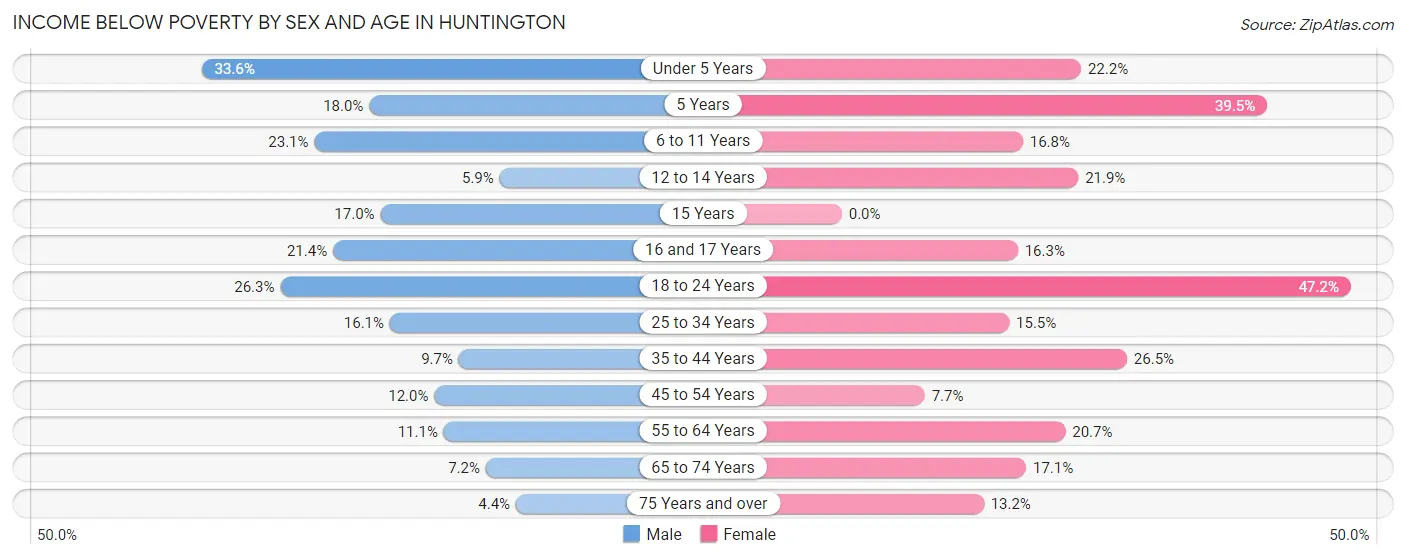
With 15.1% poverty level for males and 19.9% for females among the residents of Huntington, under 5 year old males and 18 to 24 year old females are the most vulnerable to poverty, with 136 males (33.6%) and 298 females (47.2%) in their respective age groups living below the poverty level.
| Age Bracket | Male | Female |
| Under 5 Years | 136 (33.6%) | 105 (22.2%) |
| 5 Years | 20 (18.0%) | 30 (39.5%) |
| 6 to 11 Years | 125 (23.1%) | 107 (16.8%) |
| 12 to 14 Years | 17 (5.9%) | 77 (21.9%) |
| 15 Years | 18 (17.0%) | 0 (0.0%) |
| 16 and 17 Years | 59 (21.4%) | 41 (16.3%) |
| 18 to 24 Years | 228 (26.3%) | 298 (47.2%) |
| 25 to 34 Years | 170 (16.1%) | 166 (15.5%) |
| 35 to 44 Years | 105 (9.7%) | 259 (26.5%) |
| 45 to 54 Years | 112 (12.0%) | 77 (7.7%) |
| 55 to 64 Years | 119 (11.1%) | 225 (20.7%) |
| 65 to 74 Years | 42 (7.2%) | 119 (17.1%) |
| 75 Years and over | 19 (4.4%) | 94 (13.2%) |
| Total | 1,170 (15.1%) | 1,598 (19.9%) |
Income Above Poverty by Sex and Age in Huntington
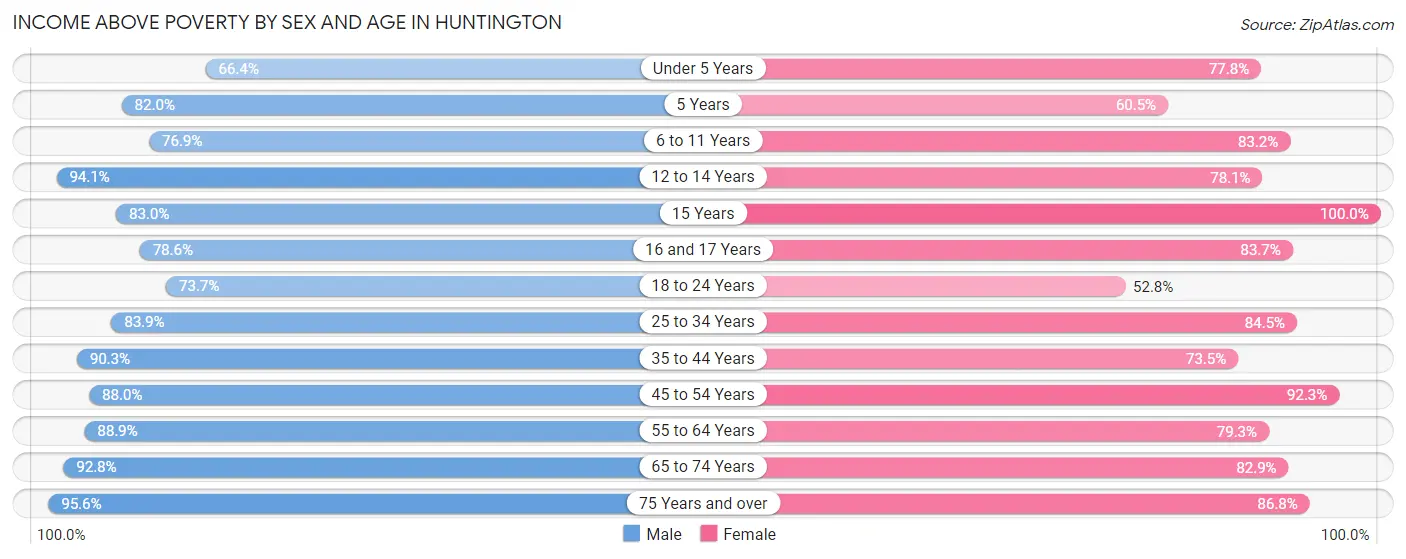
According to the poverty statistics in Huntington, males aged 75 years and over and females aged 15 years are the age groups that are most secure financially, with 95.6% of males and 100.0% of females in these age groups living above the poverty line.
| Age Bracket | Male | Female |
| Under 5 Years | 269 (66.4%) | 368 (77.8%) |
| 5 Years | 91 (82.0%) | 46 (60.5%) |
| 6 to 11 Years | 416 (76.9%) | 530 (83.2%) |
| 12 to 14 Years | 270 (94.1%) | 274 (78.1%) |
| 15 Years | 88 (83.0%) | 81 (100.0%) |
| 16 and 17 Years | 217 (78.6%) | 210 (83.7%) |
| 18 to 24 Years | 640 (73.7%) | 333 (52.8%) |
| 25 to 34 Years | 886 (83.9%) | 903 (84.5%) |
| 35 to 44 Years | 977 (90.3%) | 720 (73.5%) |
| 45 to 54 Years | 823 (88.0%) | 923 (92.3%) |
| 55 to 64 Years | 953 (88.9%) | 860 (79.3%) |
| 65 to 74 Years | 541 (92.8%) | 577 (82.9%) |
| 75 Years and over | 413 (95.6%) | 620 (86.8%) |
| Total | 6,584 (84.9%) | 6,445 (80.1%) |
Income Below Poverty Among Married-Couple Families in Huntington
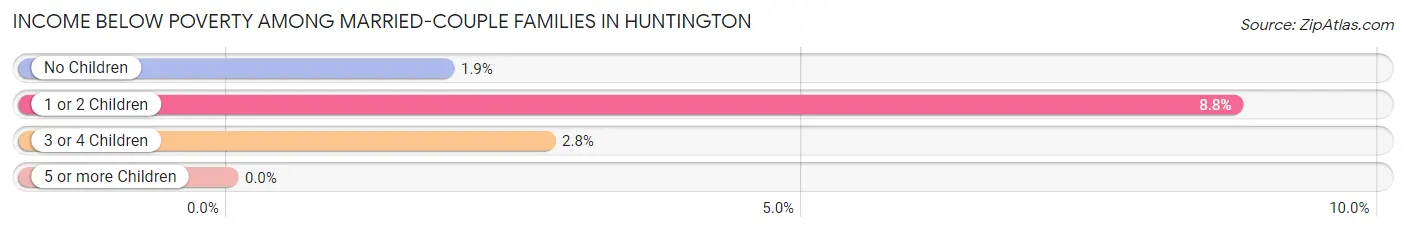
The poverty statistics for married-couple families in Huntington show that 4.1% or 108 of the total 2,642 families live below the poverty line. Families with 1 or 2 children have the highest poverty rate of 8.7%, comprising of 71 families. On the other hand, families with no children have the lowest poverty rate of 1.9%, which includes 29 families.
| Children | Above Poverty | Below Poverty |
| No Children | 1,512 (98.1%) | 29 (1.9%) |
| 1 or 2 Children | 740 (91.2%) | 71 (8.7%) |
| 3 or 4 Children | 282 (97.2%) | 8 (2.8%) |
| 5 or more Children | 0 (0.0%) | 0 (0.0%) |
| Total | 2,534 (95.9%) | 108 (4.1%) |
Income Below Poverty Among Single-Parent Households in Huntington
According to the poverty data in Huntington, 17.1% or 67 single-father households and 30.0% or 284 single-mother households are living below the poverty line. Among single-father households, those with 3 or 4 children have the highest poverty rate, with 21 households (24.7%) experiencing poverty. Likewise, among single-mother households, those with 5 or more children have the highest poverty rate, with 28 households (45.9%) falling below the poverty line.
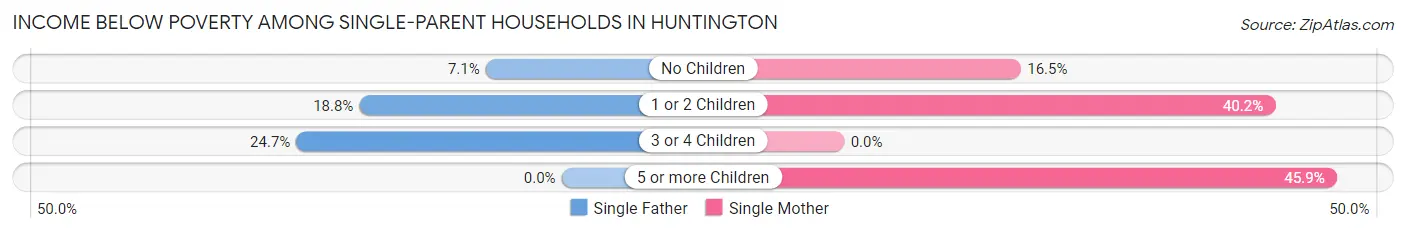
| Children | Single Father | Single Mother |
| No Children | 7 (7.1%) | 62 (16.5%) |
| 1 or 2 Children | 39 (18.8%) | 194 (40.2%) |
| 3 or 4 Children | 21 (24.7%) | 0 (0.0%) |
| 5 or more Children | 0 (0.0%) | 28 (45.9%) |
| Total | 67 (17.1%) | 284 (30.0%) |
Income Below Poverty Among Married-Couple vs Single-Parent Households in Huntington
The poverty data for Huntington shows that 108 of the married-couple family households (4.1%) and 351 of the single-parent households (26.3%) are living below the poverty level. Within the married-couple family households, those with 1 or 2 children have the highest poverty rate, with 71 households (8.7%) falling below the poverty line. Among the single-parent households, those with 5 or more children have the highest poverty rate, with 28 household (45.9%) living below poverty.
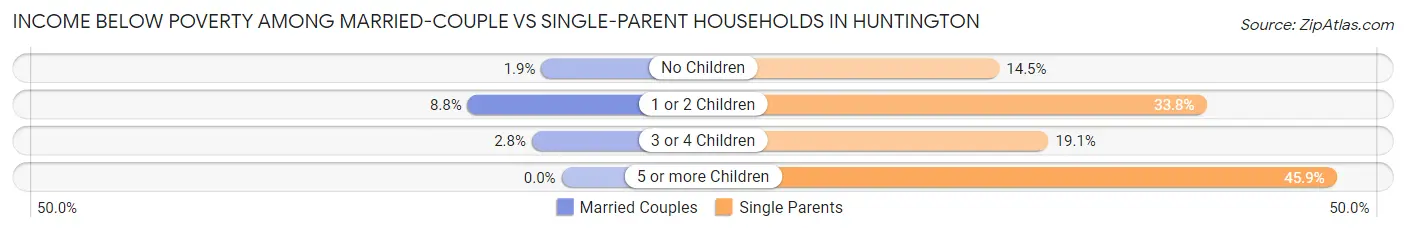
| Children | Married-Couple Families | Single-Parent Households |
| No Children | 29 (1.9%) | 69 (14.5%) |
| 1 or 2 Children | 71 (8.7%) | 233 (33.8%) |
| 3 or 4 Children | 8 (2.8%) | 21 (19.1%) |
| 5 or more Children | 0 (0.0%) | 28 (45.9%) |
| Total | 108 (4.1%) | 351 (26.3%) |
Race in Huntington
The most populous races in Huntington are White / Caucasian (15,968 | 93.8%), Hispanic or Latino (542 | 3.2%), and Two or more Races (305 | 1.8%).
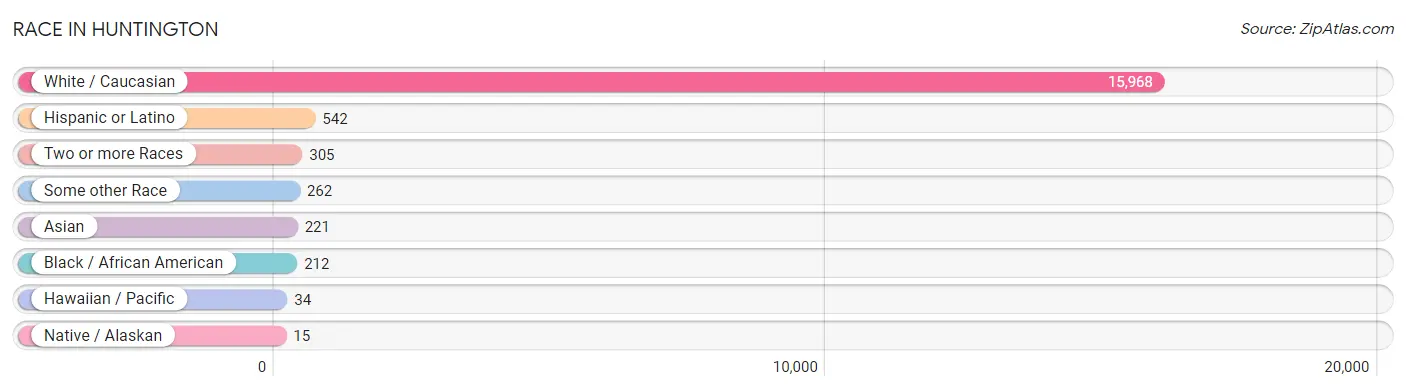
| Race | # Population | % Population |
| Asian | 221 | 1.3% |
| Black / African American | 212 | 1.3% |
| Hawaiian / Pacific | 34 | 0.2% |
| Hispanic or Latino | 542 | 3.2% |
| Native / Alaskan | 15 | 0.1% |
| White / Caucasian | 15,968 | 93.8% |
| Two or more Races | 305 | 1.8% |
| Some other Race | 262 | 1.5% |
| Total | 17,017 | 100.0% |
Ancestry in Huntington
The most populous ancestries reported in Huntington are German (4,237 | 24.9%), English (1,771 | 10.4%), Irish (1,687 | 9.9%), American (1,312 | 7.7%), and Mexican (433 | 2.5%), together accounting for 55.5% of all Huntington residents.
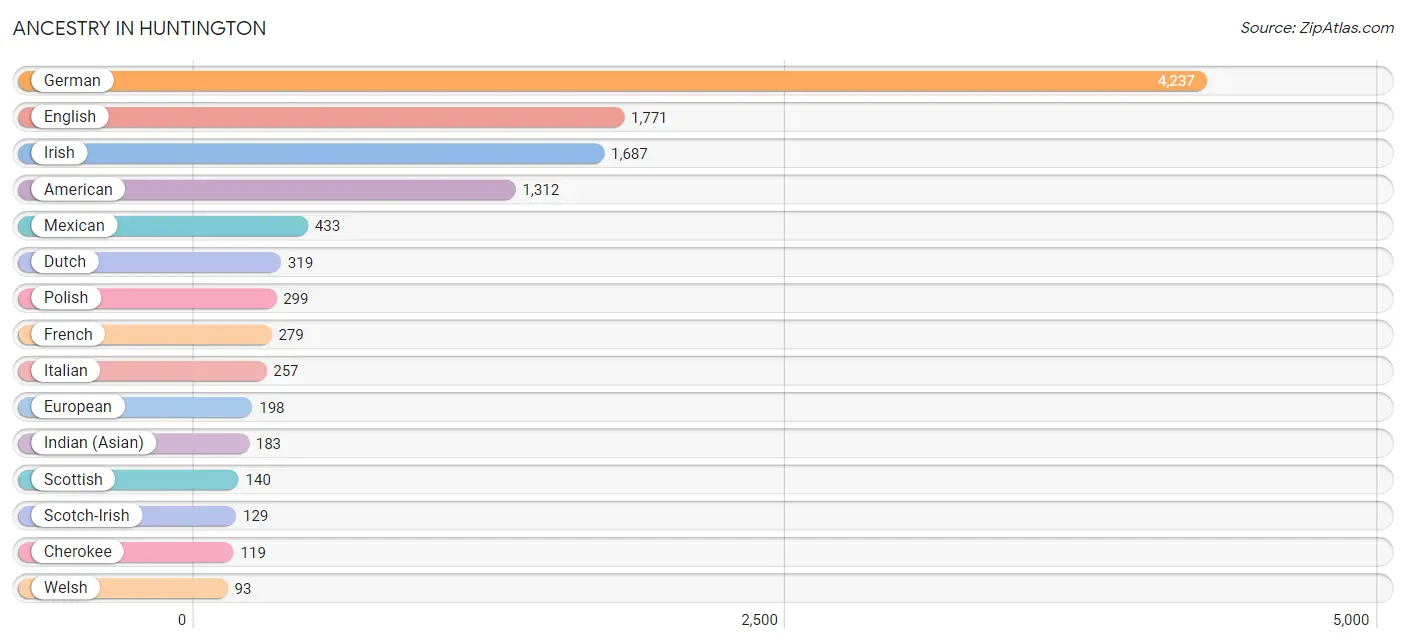
| Ancestry | # Population | % Population |
| African | 48 | 0.3% |
| American | 1,312 | 7.7% |
| Arab | 18 | 0.1% |
| Argentinean | 4 | 0.0% |
| Armenian | 11 | 0.1% |
| Austrian | 22 | 0.1% |
| Bahamian | 37 | 0.2% |
| Belgian | 8 | 0.1% |
| Bhutanese | 11 | 0.1% |
| Blackfeet | 14 | 0.1% |
| British | 72 | 0.4% |
| Burmese | 23 | 0.1% |
| Canadian | 2 | 0.0% |
| Central American | 13 | 0.1% |
| Cherokee | 119 | 0.7% |
| Colombian | 4 | 0.0% |
| Czech | 22 | 0.1% |
| Danish | 3 | 0.0% |
| Dominican | 19 | 0.1% |
| Dutch | 319 | 1.9% |
| Eastern European | 50 | 0.3% |
| English | 1,771 | 10.4% |
| European | 198 | 1.2% |
| Finnish | 4 | 0.0% |
| French | 279 | 1.6% |
| French Canadian | 8 | 0.1% |
| German | 4,237 | 24.9% |
| Guamanian / Chamorro | 34 | 0.2% |
| Honduran | 5 | 0.0% |
| Hungarian | 59 | 0.4% |
| Indian (Asian) | 183 | 1.1% |
| Irish | 1,687 | 9.9% |
| Italian | 257 | 1.5% |
| Korean | 3 | 0.0% |
| Malaysian | 7 | 0.0% |
| Mexican | 433 | 2.5% |
| Moroccan | 7 | 0.0% |
| Northern European | 11 | 0.1% |
| Norwegian | 82 | 0.5% |
| Pennsylvania German | 11 | 0.1% |
| Polish | 299 | 1.8% |
| Puerto Rican | 46 | 0.3% |
| Russian | 10 | 0.1% |
| Salvadoran | 8 | 0.1% |
| Scotch-Irish | 129 | 0.8% |
| Scottish | 140 | 0.8% |
| South American | 8 | 0.1% |
| Spanish | 1 | 0.0% |
| Subsaharan African | 48 | 0.3% |
| Swedish | 39 | 0.2% |
| Swiss | 32 | 0.2% |
| Thai | 19 | 0.1% |
| Ukrainian | 51 | 0.3% |
| Welsh | 93 | 0.5% | View All 54 Rows |
Immigrants in Huntington
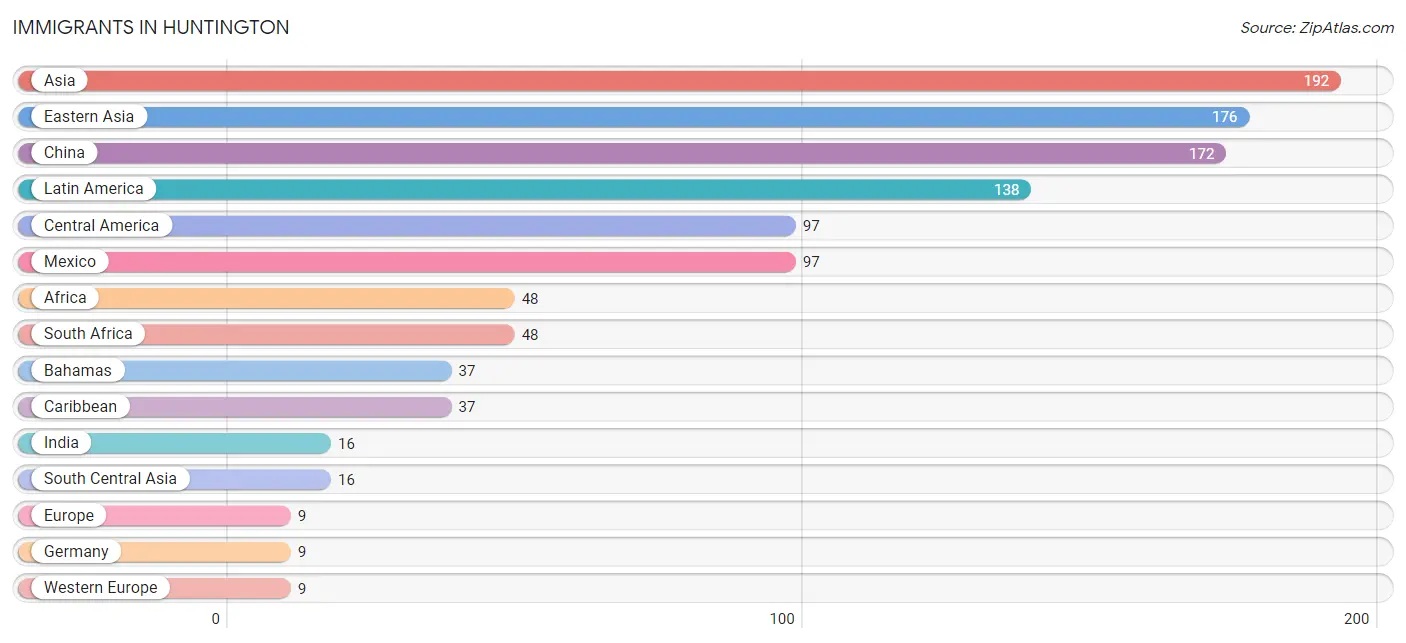
The most numerous immigrant groups reported in Huntington came from Asia (192 | 1.1%), Eastern Asia (176 | 1.0%), China (172 | 1.0%), Latin America (138 | 0.8%), and Central America (97 | 0.6%), together accounting for 4.5% of all Huntington residents.
| Immigration Origin | # Population | % Population |
| Africa | 48 | 0.3% |
| Argentina | 4 | 0.0% |
| Asia | 192 | 1.1% |
| Bahamas | 37 | 0.2% |
| Caribbean | 37 | 0.2% |
| Central America | 97 | 0.6% |
| China | 172 | 1.0% |
| Eastern Asia | 176 | 1.0% |
| Europe | 9 | 0.1% |
| Germany | 9 | 0.1% |
| India | 16 | 0.1% |
| Korea | 4 | 0.0% |
| Latin America | 138 | 0.8% |
| Mexico | 97 | 0.6% |
| South Africa | 48 | 0.3% |
| South America | 4 | 0.0% |
| South Central Asia | 16 | 0.1% |
| Western Europe | 9 | 0.1% | View All 18 Rows |
Sex and Age in Huntington
Sex and Age in Huntington
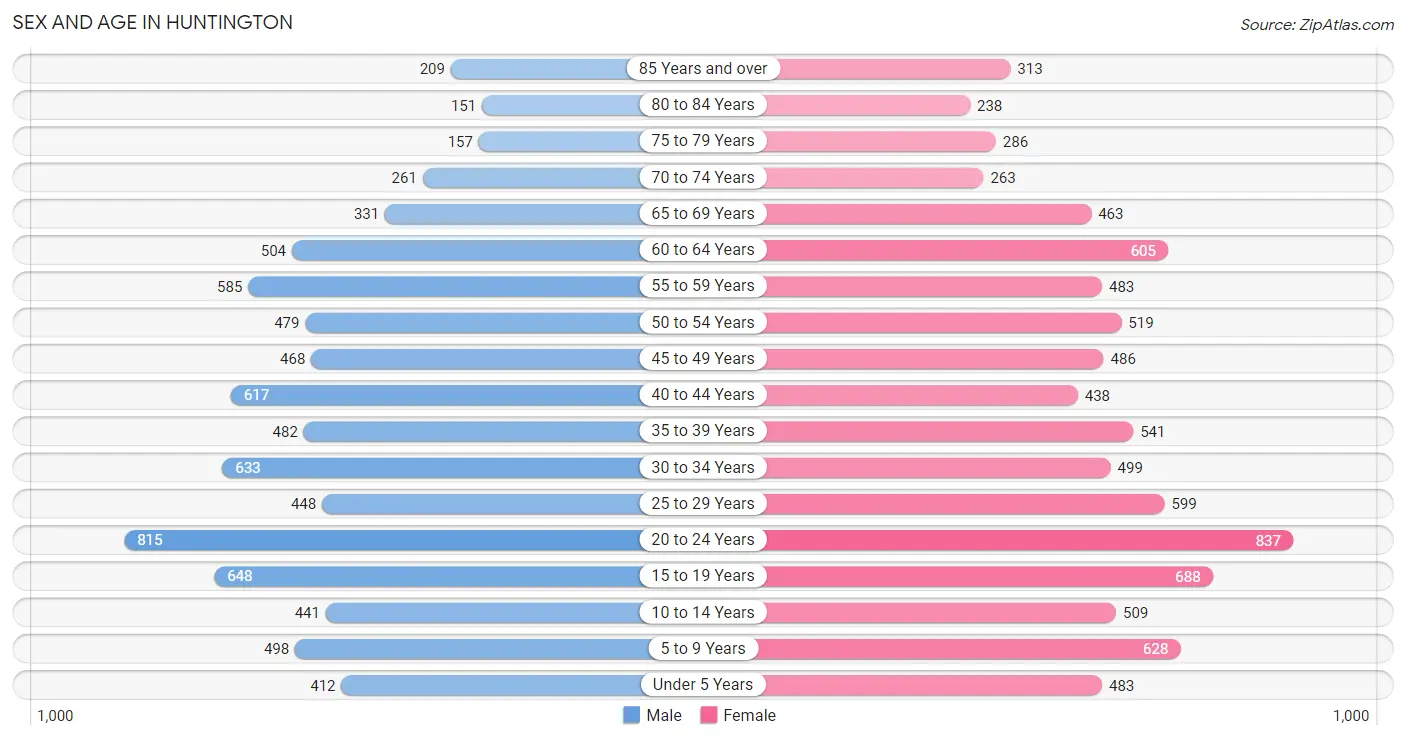
The most populous age groups in Huntington are 20 to 24 Years (815 | 10.0%) for men and 20 to 24 Years (837 | 9.4%) for women.
| Age Bracket | Male | Female |
| Under 5 Years | 412 (5.1%) | 483 (5.4%) |
| 5 to 9 Years | 498 (6.1%) | 628 (7.1%) |
| 10 to 14 Years | 441 (5.4%) | 509 (5.7%) |
| 15 to 19 Years | 648 (8.0%) | 688 (7.7%) |
| 20 to 24 Years | 815 (10.0%) | 837 (9.4%) |
| 25 to 29 Years | 448 (5.5%) | 599 (6.8%) |
| 30 to 34 Years | 633 (7.8%) | 499 (5.6%) |
| 35 to 39 Years | 482 (5.9%) | 541 (6.1%) |
| 40 to 44 Years | 617 (7.6%) | 438 (4.9%) |
| 45 to 49 Years | 468 (5.8%) | 486 (5.5%) |
| 50 to 54 Years | 479 (5.9%) | 519 (5.9%) |
| 55 to 59 Years | 585 (7.2%) | 483 (5.4%) |
| 60 to 64 Years | 504 (6.2%) | 605 (6.8%) |
| 65 to 69 Years | 331 (4.1%) | 463 (5.2%) |
| 70 to 74 Years | 261 (3.2%) | 263 (3.0%) |
| 75 to 79 Years | 157 (1.9%) | 286 (3.2%) |
| 80 to 84 Years | 151 (1.9%) | 238 (2.7%) |
| 85 Years and over | 209 (2.6%) | 313 (3.5%) |
| Total | 8,139 (100.0%) | 8,878 (100.0%) |
Families and Households in Huntington
Median Family Size in Huntington
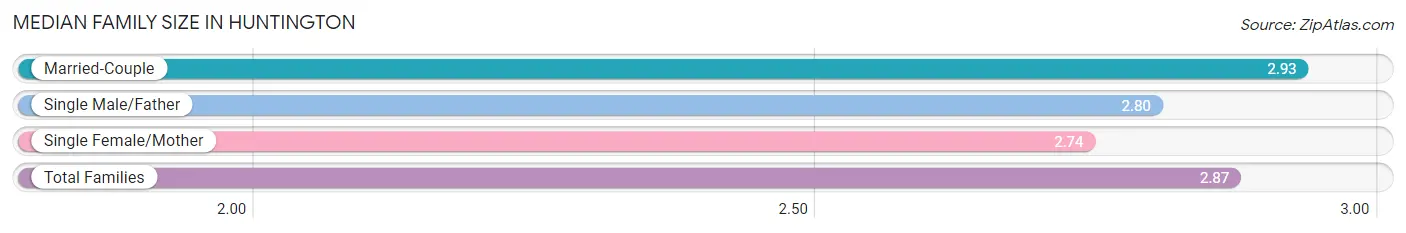
The median family size in Huntington is 2.87 persons per family, with married-couple families (2,642 | 66.4%) accounting for the largest median family size of 2.93 persons per family. On the other hand, single female/mother families (946 | 23.8%) represent the smallest median family size with 2.74 persons per family.
| Family Type | # Families | Family Size |
| Married-Couple | 2,642 (66.4%) | 2.93 |
| Single Male/Father | 391 (9.8%) | 2.80 |
| Single Female/Mother | 946 (23.8%) | 2.74 |
| Total Families | 3,979 (100.0%) | 2.87 |
Median Household Size in Huntington
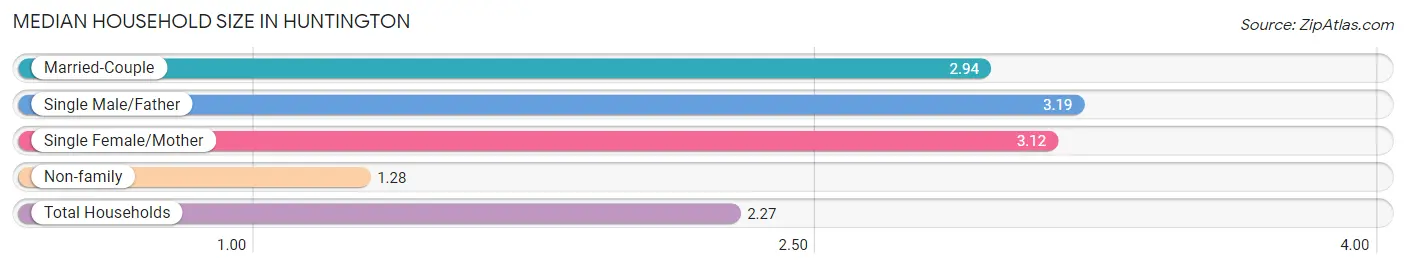
The median household size in Huntington is 2.27 persons per household, with single male/father households (391 | 5.6%) accounting for the largest median household size of 3.19 persons per household. non-family households (2,949 | 42.6%) represent the smallest median household size with 1.28 persons per household.
| Household Type | # Households | Household Size |
| Married-Couple | 2,642 (38.1%) | 2.94 |
| Single Male/Father | 391 (5.6%) | 3.19 |
| Single Female/Mother | 946 (13.7%) | 3.12 |
| Non-family | 2,949 (42.6%) | 1.28 |
| Total Households | 6,928 (100.0%) | 2.27 |
Household Size by Marriage Status in Huntington
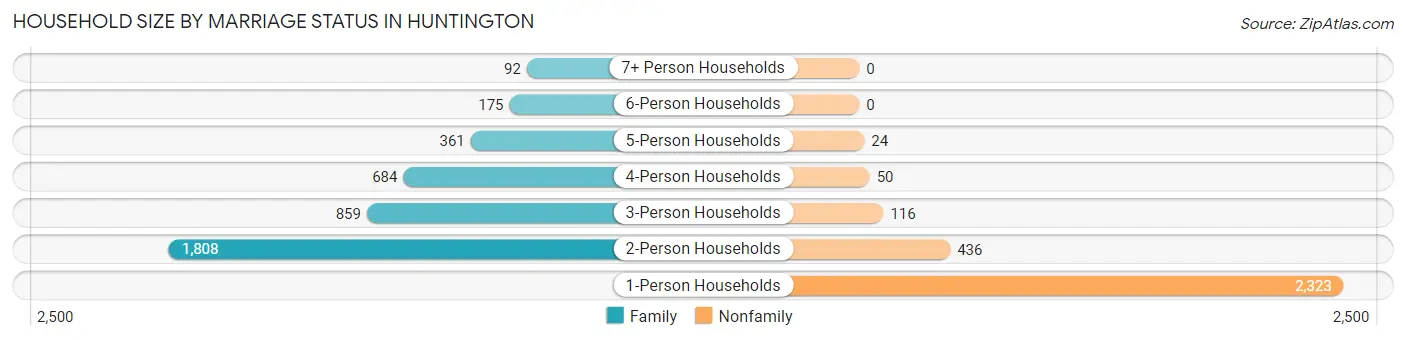
Out of a total of 6,928 households in Huntington, 3,979 (57.4%) are family households, while 2,949 (42.6%) are nonfamily households. The most numerous type of family households are 2-person households, comprising 1,808, and the most common type of nonfamily households are 1-person households, comprising 2,323.
| Household Size | Family Households | Nonfamily Households |
| 1-Person Households | - | 2,323 (33.5%) |
| 2-Person Households | 1,808 (26.1%) | 436 (6.3%) |
| 3-Person Households | 859 (12.4%) | 116 (1.7%) |
| 4-Person Households | 684 (9.9%) | 50 (0.7%) |
| 5-Person Households | 361 (5.2%) | 24 (0.4%) |
| 6-Person Households | 175 (2.5%) | 0 (0.0%) |
| 7+ Person Households | 92 (1.3%) | 0 (0.0%) |
| Total | 3,979 (57.4%) | 2,949 (42.6%) |
Female Fertility in Huntington
Fertility by Age in Huntington
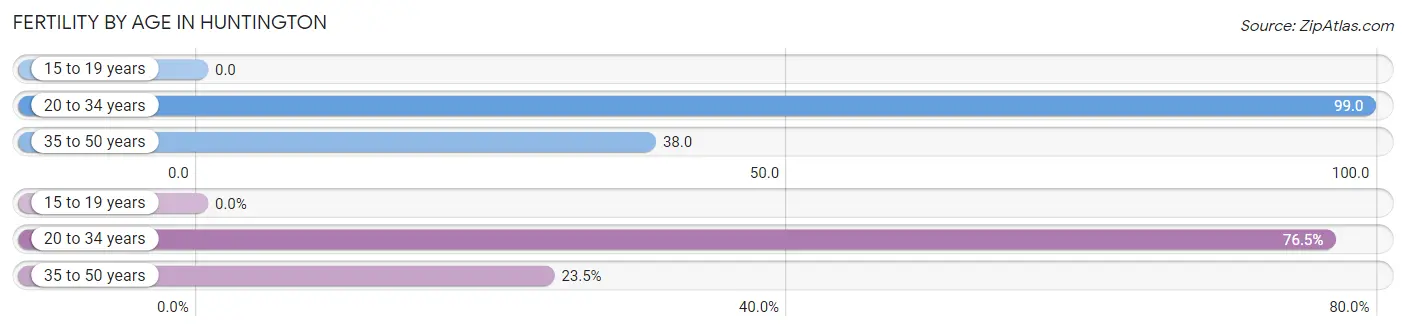
Average fertility rate in Huntington is 60.0 births per 1,000 women. Women in the age bracket of 20 to 34 years have the highest fertility rate with 99.0 births per 1,000 women. Women in the age bracket of 20 to 34 years acount for 76.5% of all women with births.
| Age Bracket | Women with Births | Births / 1,000 Women |
| 15 to 19 years | 0 (0.0%) | 0.0 |
| 20 to 34 years | 192 (76.5%) | 99.0 |
| 35 to 50 years | 59 (23.5%) | 38.0 |
| Total | 251 (100.0%) | 60.0 |
Fertility by Age by Marriage Status in Huntington
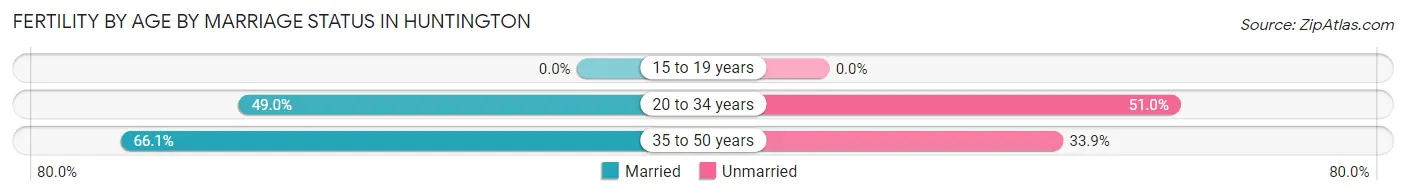
53.0% of women with births (251) in Huntington are married. The highest percentage of unmarried women with births falls into 20 to 34 years age bracket with 51.0% of them unmarried at the time of birth, while the lowest percentage of unmarried women with births belong to 35 to 50 years age bracket with 33.9% of them unmarried.
| Age Bracket | Married | Unmarried |
| 15 to 19 years | 0 (0.0%) | 0 (0.0%) |
| 20 to 34 years | 94 (49.0%) | 98 (51.0%) |
| 35 to 50 years | 39 (66.1%) | 20 (33.9%) |
| Total | 133 (53.0%) | 118 (47.0%) |
Fertility by Education in Huntington
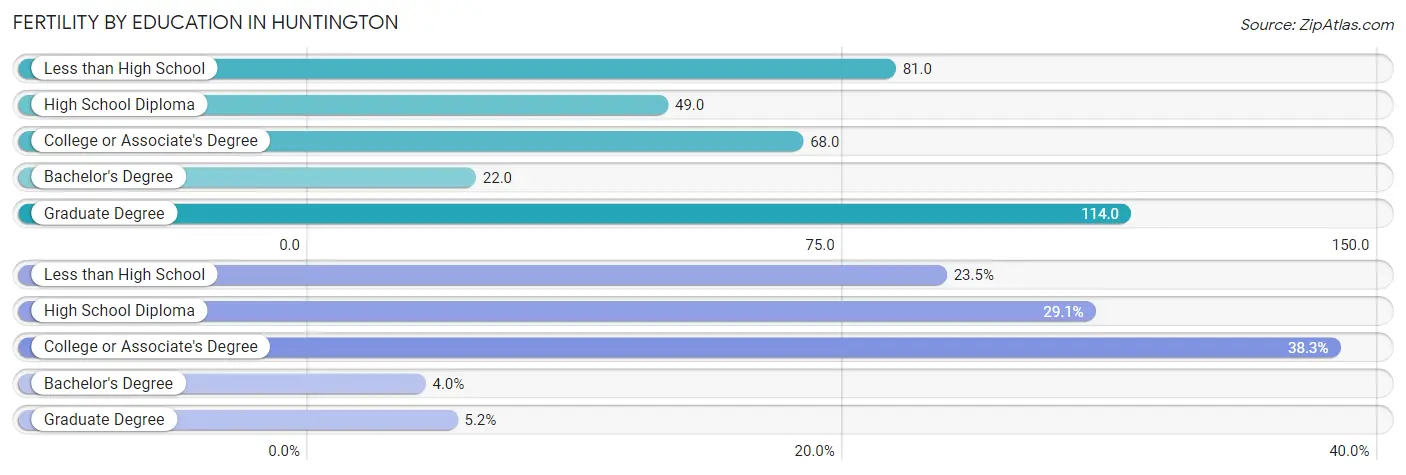
Average fertility rate in Huntington is 60.0 births per 1,000 women. Women with the education attainment of graduate degree have the highest fertility rate of 114.0 births per 1,000 women, while women with the education attainment of bachelor's degree have the lowest fertility at 22.0 births per 1,000 women. Women with the education attainment of college or associate's degree represent 38.3% of all women with births.
| Educational Attainment | Women with Births | Births / 1,000 Women |
| Less than High School | 59 (23.5%) | 81.0 |
| High School Diploma | 73 (29.1%) | 49.0 |
| College or Associate's Degree | 96 (38.3%) | 68.0 |
| Bachelor's Degree | 10 (4.0%) | 22.0 |
| Graduate Degree | 13 (5.2%) | 114.0 |
| Total | 251 (100.0%) | 60.0 |
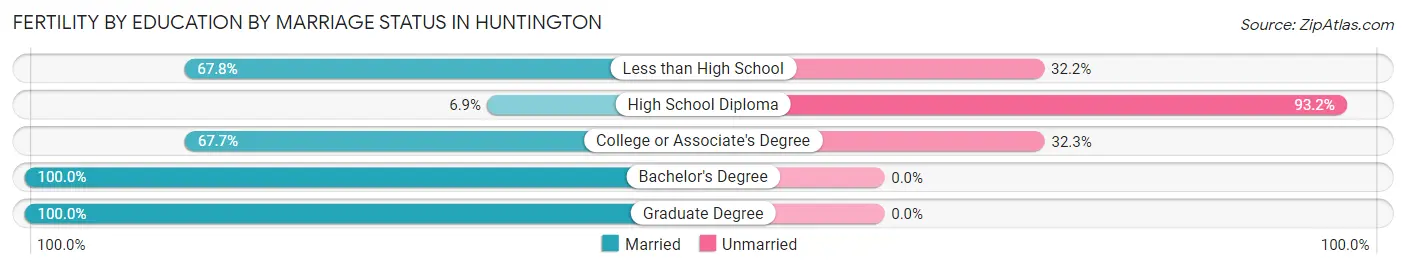
Fertility by Education by Marriage Status in Huntington
47.0% of women with births in Huntington are unmarried. Women with the educational attainment of bachelor's degree are most likely to be married with 100.0% of them married at childbirth, while women with the educational attainment of high school diploma are least likely to be married with 93.1% of them unmarried at childbirth.
| Educational Attainment | Married | Unmarried |
| Less than High School | 40 (67.8%) | 19 (32.2%) |
| High School Diploma | 5 (6.9%) | 68 (93.1%) |
| College or Associate's Degree | 65 (67.7%) | 31 (32.3%) |
| Bachelor's Degree | 10 (100.0%) | 0 (0.0%) |
| Graduate Degree | 13 (100.0%) | 0 (0.0%) |
| Total | 133 (53.0%) | 118 (47.0%) |
Employment Characteristics in Huntington
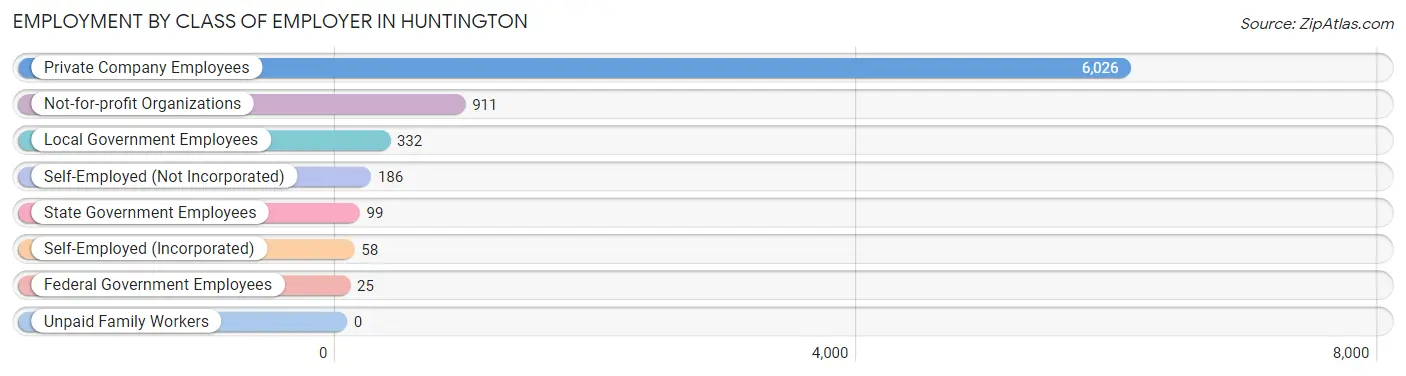
Employment by Class of Employer in Huntington
Among the 7,637 employed individuals in Huntington, private company employees (6,026 | 78.9%), not-for-profit organizations (911 | 11.9%), and local government employees (332 | 4.3%) make up the most common classes of employment.
| Employer Class | # Employees | % Employees |
| Private Company Employees | 6,026 | 78.9% |
| Self-Employed (Incorporated) | 58 | 0.8% |
| Self-Employed (Not Incorporated) | 186 | 2.4% |
| Not-for-profit Organizations | 911 | 11.9% |
| Local Government Employees | 332 | 4.3% |
| State Government Employees | 99 | 1.3% |
| Federal Government Employees | 25 | 0.3% |
| Unpaid Family Workers | 0 | 0.0% |
| Total | 7,637 | 100.0% |
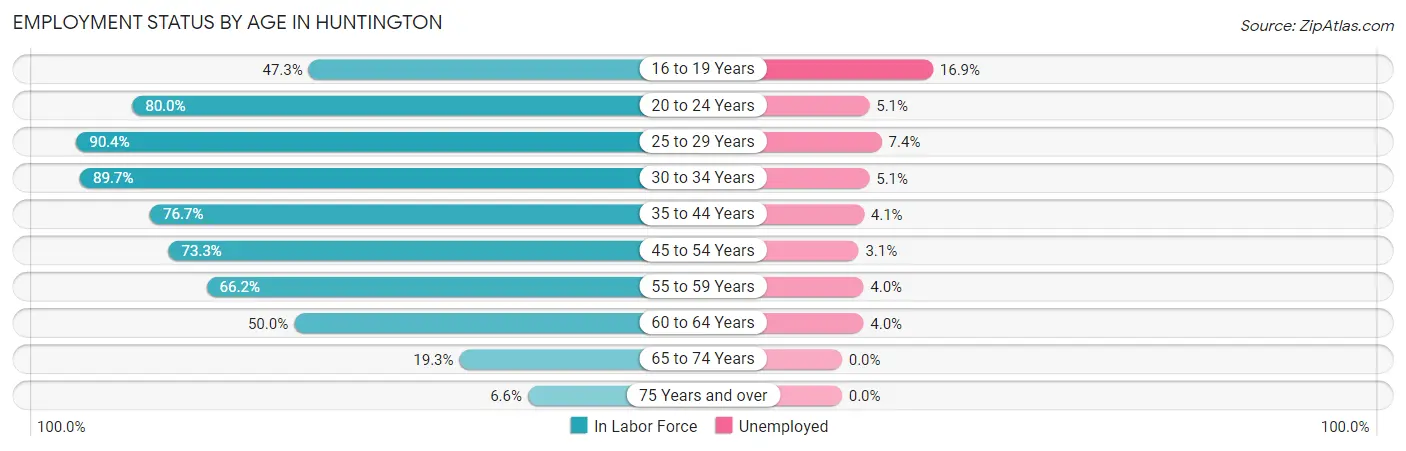
Employment Status by Age in Huntington
According to the labor force statistics for Huntington, out of the total population over 16 years of age (13,859), 61.0% or 8,454 individuals are in the labor force, with 5.2% or 440 of them unemployed. The age group with the highest labor force participation rate is 25 to 29 years, with 90.4% or 946 individuals in the labor force. Within the labor force, the 16 to 19 years age range has the highest percentage of unemployed individuals, with 16.9% or 92 of them being unemployed.
| Age Bracket | In Labor Force | Unemployed |
| 16 to 19 Years | 543 (47.3%) | 92 (16.9%) |
| 20 to 24 Years | 1,322 (80.0%) | 67 (5.1%) |
| 25 to 29 Years | 946 (90.4%) | 70 (7.4%) |
| 30 to 34 Years | 1,015 (89.7%) | 52 (5.1%) |
| 35 to 44 Years | 1,594 (76.7%) | 65 (4.1%) |
| 45 to 54 Years | 1,431 (73.3%) | 44 (3.1%) |
| 55 to 59 Years | 707 (66.2%) | 28 (4.0%) |
| 60 to 64 Years | 554 (50.0%) | 22 (4.0%) |
| 65 to 74 Years | 254 (19.3%) | 0 (0.0%) |
| 75 Years and over | 89 (6.6%) | 0 (0.0%) |
| Total | 8,454 (61.0%) | 440 (5.2%) |
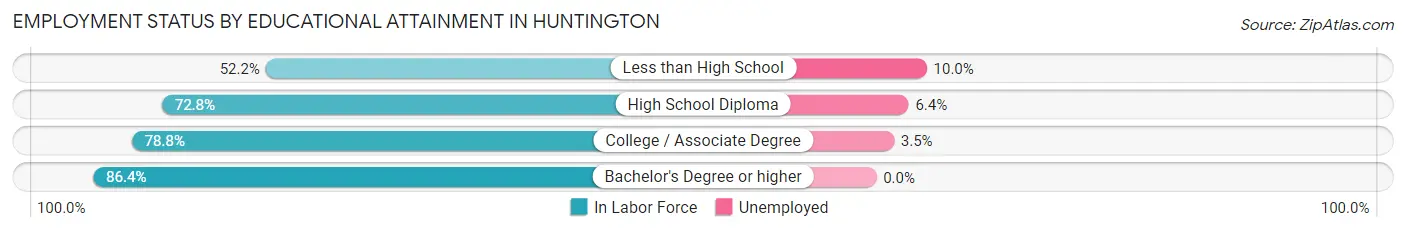
Employment Status by Educational Attainment in Huntington
According to labor force statistics for Huntington, 74.5% of individuals (6,248) out of the total population between 25 and 64 years of age (8,386) are in the labor force, with 4.5% or 281 of them being unemployed. The group with the highest labor force participation rate are those with the educational attainment of bachelor's degree or higher, with 86.4% or 1,242 individuals in the labor force. Within the labor force, individuals with less than high school education have the highest percentage of unemployment, with 10.0% or 52 of them being unemployed.
| Educational Attainment | In Labor Force | Unemployed |
| Less than High School | 521 (52.2%) | 100 (10.0%) |
| High School Diploma | 2,498 (72.8%) | 220 (6.4%) |
| College / Associate Degree | 1,983 (78.8%) | 88 (3.5%) |
| Bachelor's Degree or higher | 1,242 (86.4%) | 0 (0.0%) |
| Total | 6,248 (74.5%) | 377 (4.5%) |
Employment Occupations by Sex in Huntington
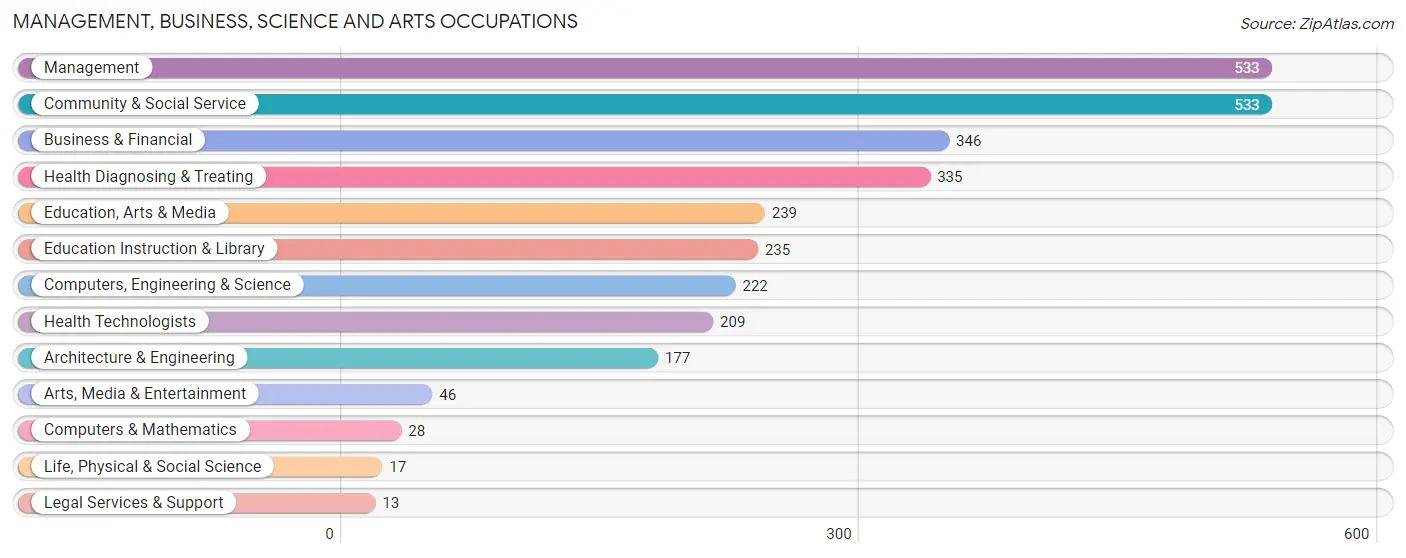
Management, Business, Science and Arts Occupations
The most common Management, Business, Science and Arts occupations in Huntington are Management (533 | 6.7%), Community & Social Service (533 | 6.7%), Business & Financial (346 | 4.3%), Health Diagnosing & Treating (335 | 4.2%), and Education, Arts & Media (239 | 3.0%).
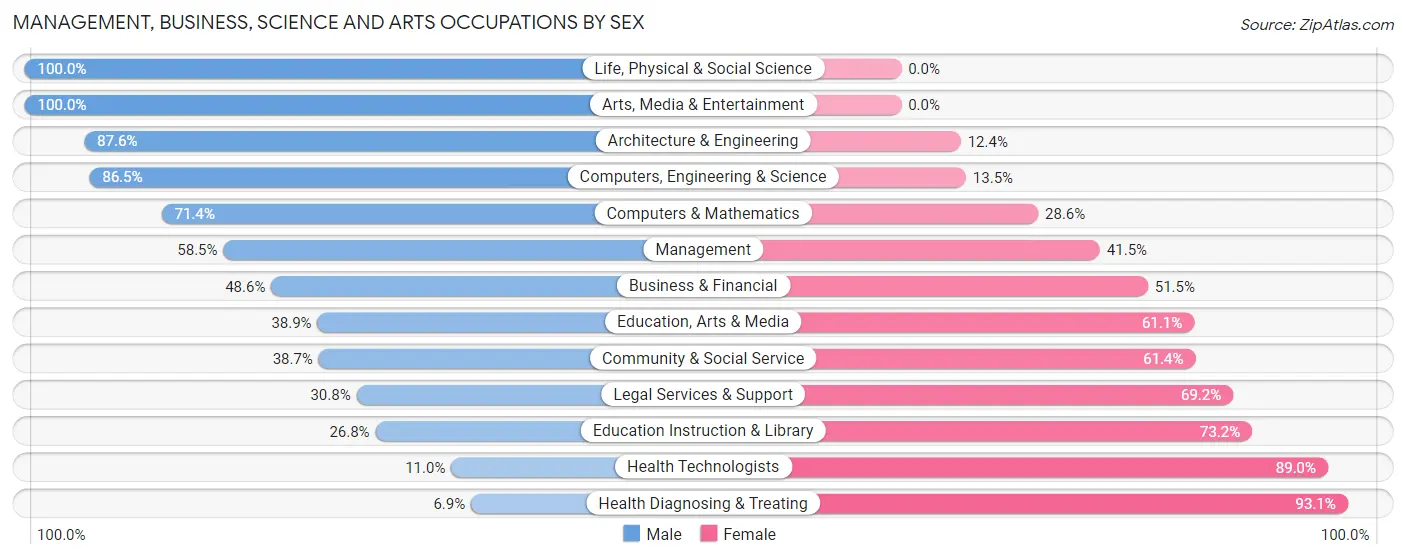
Management, Business, Science and Arts Occupations by Sex
Within the Management, Business, Science and Arts occupations in Huntington, the most male-oriented occupations are Life, Physical & Social Science (100.0%), Arts, Media & Entertainment (100.0%), and Architecture & Engineering (87.6%), while the most female-oriented occupations are Health Diagnosing & Treating (93.1%), Health Technologists (89.0%), and Education Instruction & Library (73.2%).
| Occupation | Male | Female |
| Management | 312 (58.5%) | 221 (41.5%) |
| Business & Financial | 168 (48.5%) | 178 (51.4%) |
| Computers, Engineering & Science | 192 (86.5%) | 30 (13.5%) |
| Computers & Mathematics | 20 (71.4%) | 8 (28.6%) |
| Architecture & Engineering | 155 (87.6%) | 22 (12.4%) |
| Life, Physical & Social Science | 17 (100.0%) | 0 (0.0%) |
| Community & Social Service | 206 (38.7%) | 327 (61.4%) |
| Education, Arts & Media | 93 (38.9%) | 146 (61.1%) |
| Legal Services & Support | 4 (30.8%) | 9 (69.2%) |
| Education Instruction & Library | 63 (26.8%) | 172 (73.2%) |
| Arts, Media & Entertainment | 46 (100.0%) | 0 (0.0%) |
| Health Diagnosing & Treating | 23 (6.9%) | 312 (93.1%) |
| Health Technologists | 23 (11.0%) | 186 (89.0%) |
| Total (Category) | 901 (45.8%) | 1,068 (54.2%) |
| Total (Overall) | 4,230 (52.8%) | 3,780 (47.2%) |
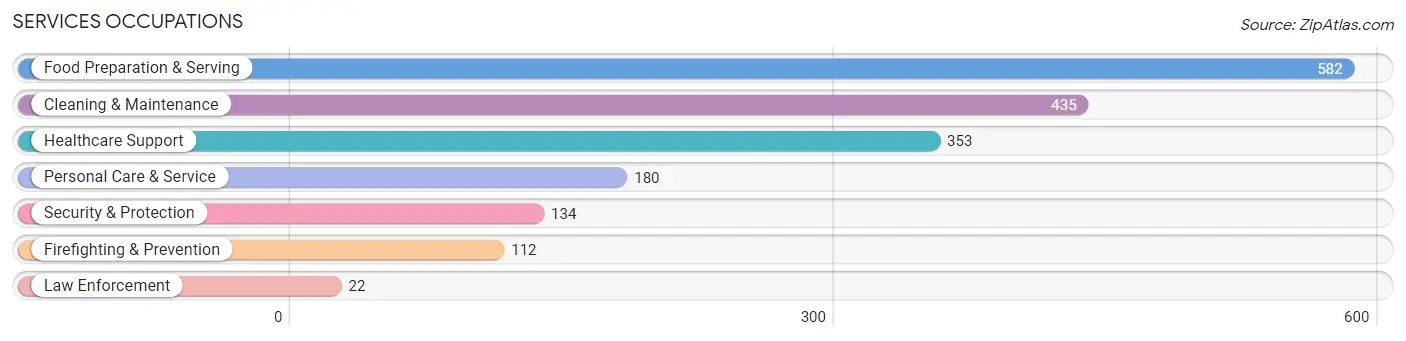
Services Occupations
The most common Services occupations in Huntington are Food Preparation & Serving (582 | 7.3%), Cleaning & Maintenance (435 | 5.4%), Healthcare Support (353 | 4.4%), Personal Care & Service (180 | 2.2%), and Security & Protection (134 | 1.7%).
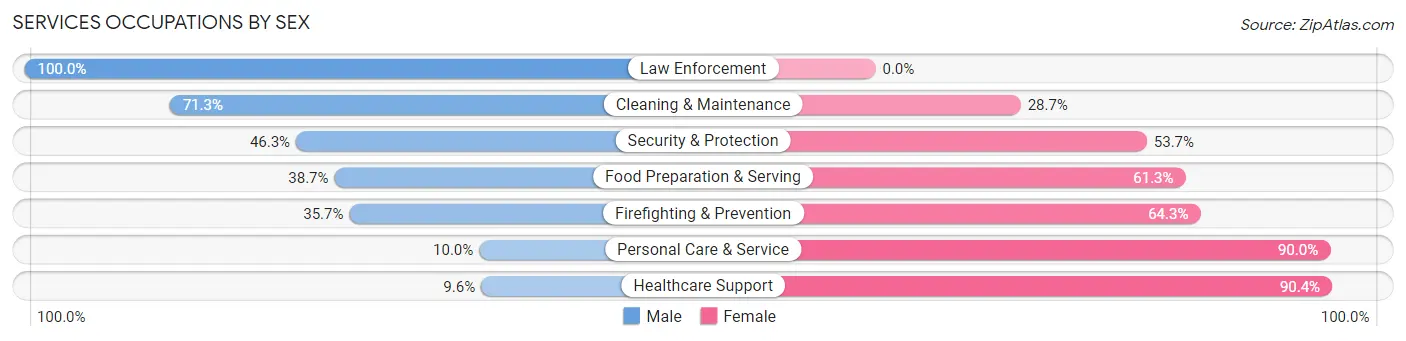
Services Occupations by Sex
Within the Services occupations in Huntington, the most male-oriented occupations are Law Enforcement (100.0%), Cleaning & Maintenance (71.3%), and Security & Protection (46.3%), while the most female-oriented occupations are Healthcare Support (90.4%), Personal Care & Service (90.0%), and Firefighting & Prevention (64.3%).
| Occupation | Male | Female |
| Healthcare Support | 34 (9.6%) | 319 (90.4%) |
| Security & Protection | 62 (46.3%) | 72 (53.7%) |
| Firefighting & Prevention | 40 (35.7%) | 72 (64.3%) |
| Law Enforcement | 22 (100.0%) | 0 (0.0%) |
| Food Preparation & Serving | 225 (38.7%) | 357 (61.3%) |
| Cleaning & Maintenance | 310 (71.3%) | 125 (28.7%) |
| Personal Care & Service | 18 (10.0%) | 162 (90.0%) |
| Total (Category) | 649 (38.5%) | 1,035 (61.5%) |
| Total (Overall) | 4,230 (52.8%) | 3,780 (47.2%) |
Sales and Office Occupations
The most common Sales and Office occupations in Huntington are Office & Administration (732 | 9.1%), and Sales & Related (627 | 7.8%).
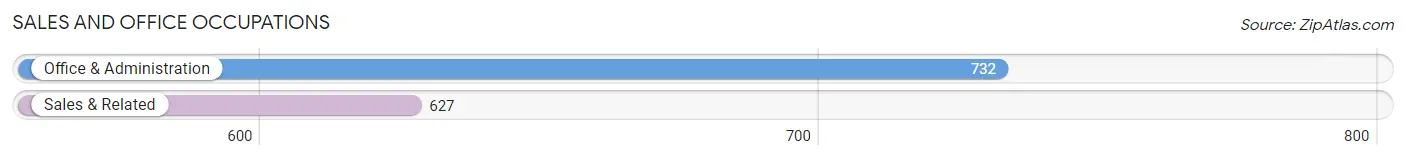
Sales and Office Occupations by Sex
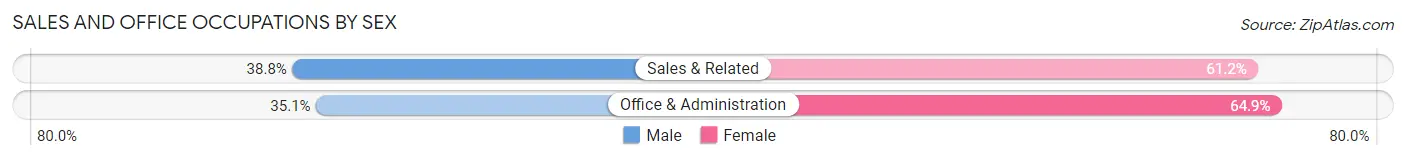
| Occupation | Male | Female |
| Sales & Related | 243 (38.8%) | 384 (61.2%) |
| Office & Administration | 257 (35.1%) | 475 (64.9%) |
| Total (Category) | 500 (36.8%) | 859 (63.2%) |
| Total (Overall) | 4,230 (52.8%) | 3,780 (47.2%) |
Natural Resources, Construction and Maintenance Occupations
The most common Natural Resources, Construction and Maintenance occupations in Huntington are Construction & Extraction (331 | 4.1%), Installation, Maintenance & Repair (162 | 2.0%), and Farming, Fishing & Forestry (53 | 0.7%).
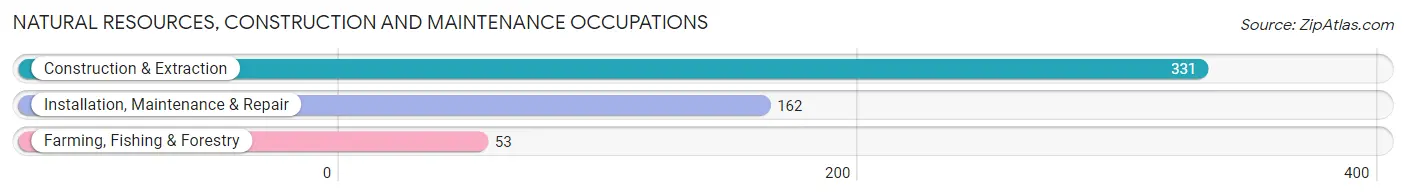
Natural Resources, Construction and Maintenance Occupations by Sex
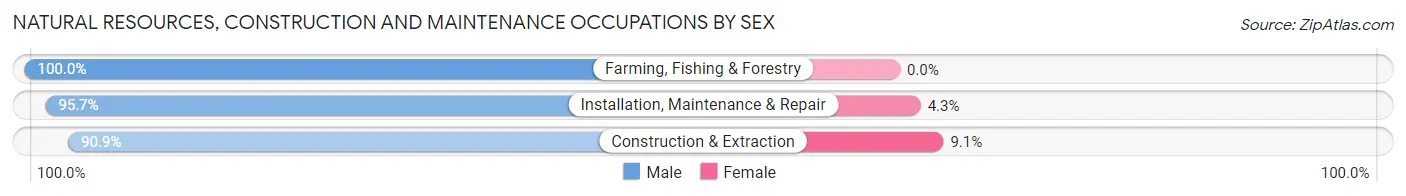
| Occupation | Male | Female |
| Farming, Fishing & Forestry | 53 (100.0%) | 0 (0.0%) |
| Construction & Extraction | 301 (90.9%) | 30 (9.1%) |
| Installation, Maintenance & Repair | 155 (95.7%) | 7 (4.3%) |
| Total (Category) | 509 (93.2%) | 37 (6.8%) |
| Total (Overall) | 4,230 (52.8%) | 3,780 (47.2%) |
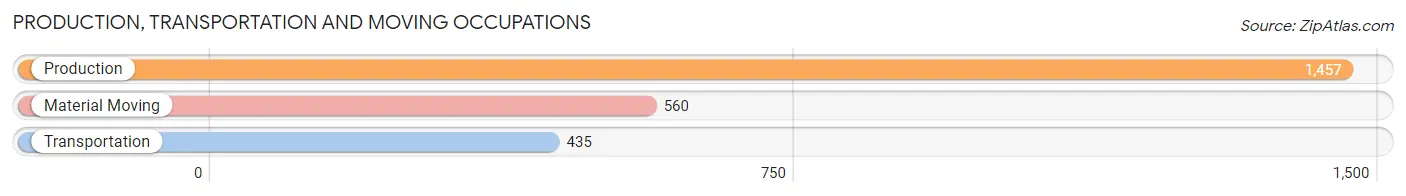
Production, Transportation and Moving Occupations
The most common Production, Transportation and Moving occupations in Huntington are Production (1,457 | 18.2%), Material Moving (560 | 7.0%), and Transportation (435 | 5.4%).
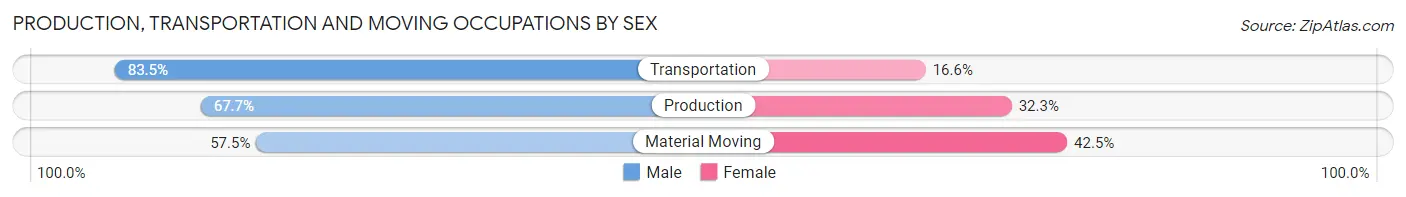
Production, Transportation and Moving Occupations by Sex
| Occupation | Male | Female |
| Production | 986 (67.7%) | 471 (32.3%) |
| Transportation | 363 (83.5%) | 72 (16.6%) |
| Material Moving | 322 (57.5%) | 238 (42.5%) |
| Total (Category) | 1,671 (68.1%) | 781 (31.9%) |
| Total (Overall) | 4,230 (52.8%) | 3,780 (47.2%) |
Employment Industries by Sex in Huntington
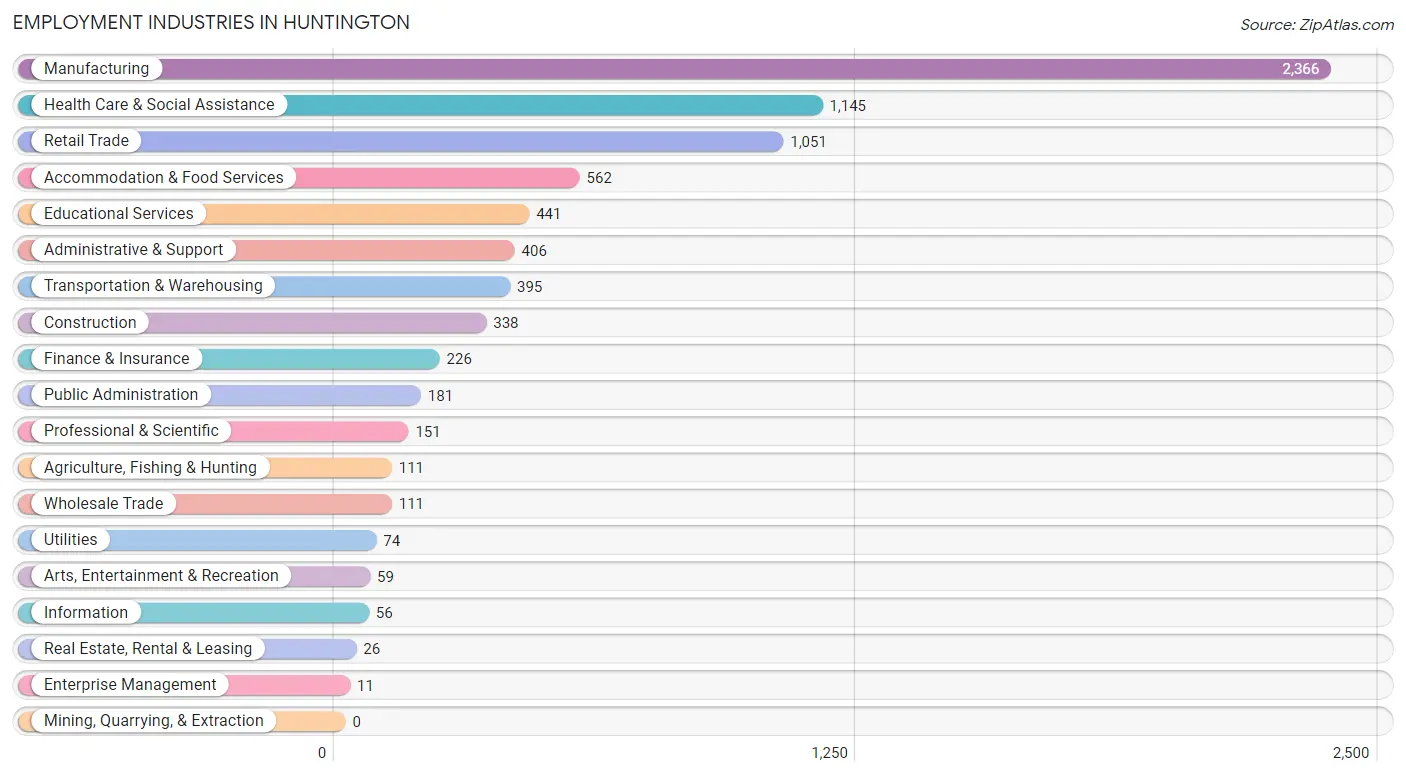
Employment Industries in Huntington
The major employment industries in Huntington include Manufacturing (2,366 | 29.5%), Health Care & Social Assistance (1,145 | 14.3%), Retail Trade (1,051 | 13.1%), Accommodation & Food Services (562 | 7.0%), and Educational Services (441 | 5.5%).
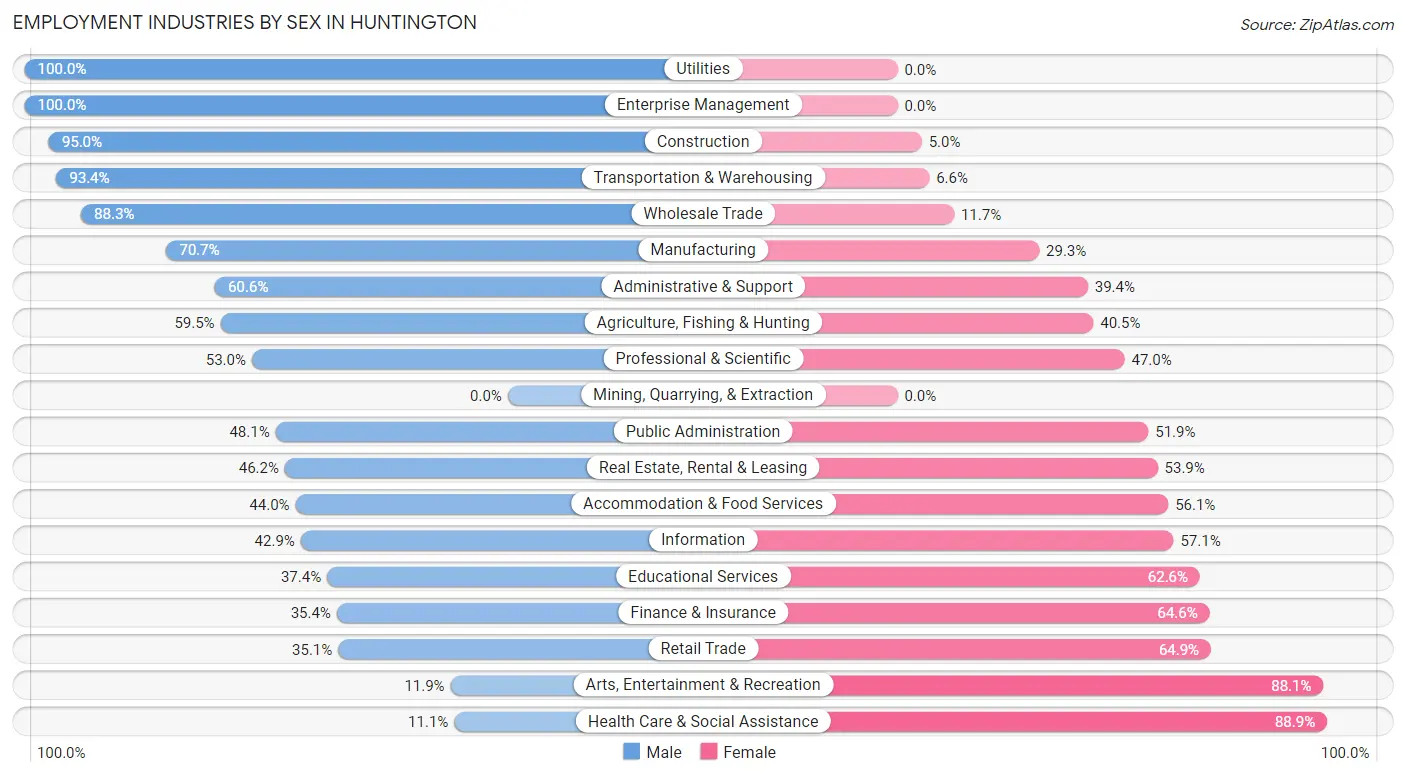
Employment Industries by Sex in Huntington
The Huntington industries that see more men than women are Utilities (100.0%), Enterprise Management (100.0%), and Construction (95.0%), whereas the industries that tend to have a higher number of women are Health Care & Social Assistance (88.9%), Arts, Entertainment & Recreation (88.1%), and Retail Trade (64.9%).
| Industry | Male | Female |
| Agriculture, Fishing & Hunting | 66 (59.5%) | 45 (40.5%) |
| Mining, Quarrying, & Extraction | 0 (0.0%) | 0 (0.0%) |
| Construction | 321 (95.0%) | 17 (5.0%) |
| Manufacturing | 1,672 (70.7%) | 694 (29.3%) |
| Wholesale Trade | 98 (88.3%) | 13 (11.7%) |
| Retail Trade | 369 (35.1%) | 682 (64.9%) |
| Transportation & Warehousing | 369 (93.4%) | 26 (6.6%) |
| Utilities | 74 (100.0%) | 0 (0.0%) |
| Information | 24 (42.9%) | 32 (57.1%) |
| Finance & Insurance | 80 (35.4%) | 146 (64.6%) |
| Real Estate, Rental & Leasing | 12 (46.2%) | 14 (53.8%) |
| Professional & Scientific | 80 (53.0%) | 71 (47.0%) |
| Enterprise Management | 11 (100.0%) | 0 (0.0%) |
| Administrative & Support | 246 (60.6%) | 160 (39.4%) |
| Educational Services | 165 (37.4%) | 276 (62.6%) |
| Health Care & Social Assistance | 127 (11.1%) | 1,018 (88.9%) |
| Arts, Entertainment & Recreation | 7 (11.9%) | 52 (88.1%) |
| Accommodation & Food Services | 247 (44.0%) | 315 (56.0%) |
| Public Administration | 87 (48.1%) | 94 (51.9%) |
| Total | 4,230 (52.8%) | 3,780 (47.2%) |
Education in Huntington
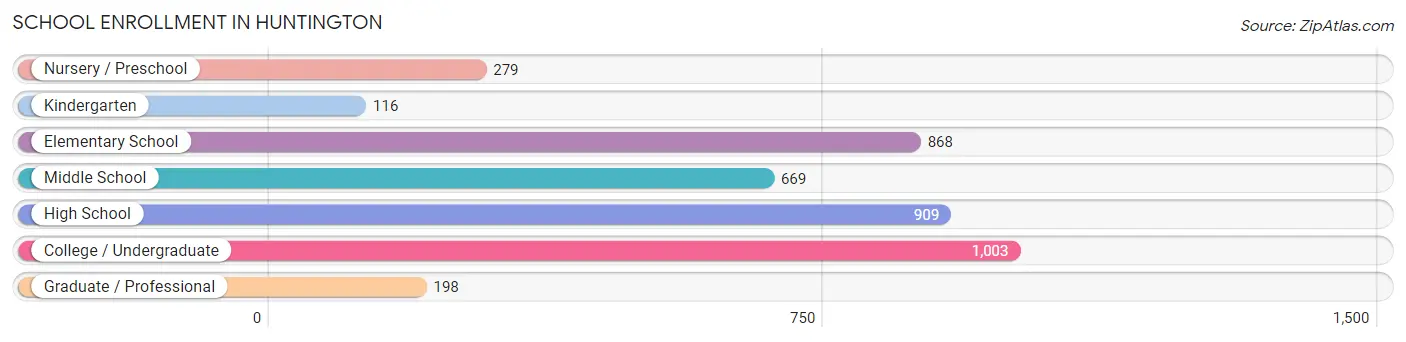
School Enrollment in Huntington
The most common levels of schooling among the 4,042 students in Huntington are college / undergraduate (1,003 | 24.8%), high school (909 | 22.5%), and elementary school (868 | 21.5%).
| School Level | # Students | % Students |
| Nursery / Preschool | 279 | 6.9% |
| Kindergarten | 116 | 2.9% |
| Elementary School | 868 | 21.5% |
| Middle School | 669 | 16.6% |
| High School | 909 | 22.5% |
| College / Undergraduate | 1,003 | 24.8% |
| Graduate / Professional | 198 | 4.9% |
| Total | 4,042 | 100.0% |
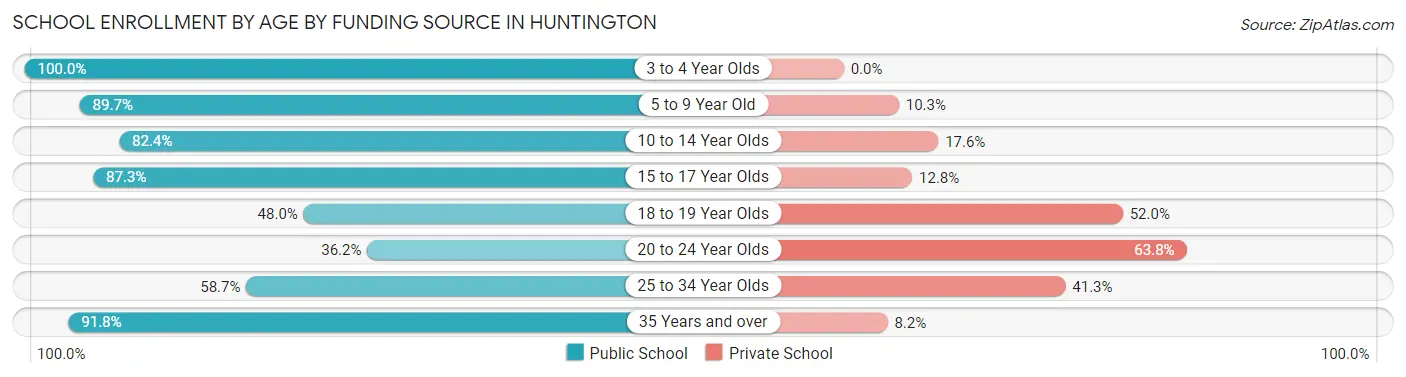
School Enrollment by Age by Funding Source in Huntington
Out of a total of 4,042 students who are enrolled in schools in Huntington, 1,047 (25.9%) attend a private institution, while the remaining 2,995 (74.1%) are enrolled in public schools. The age group of 20 to 24 year olds has the highest likelihood of being enrolled in private schools, with 390 (63.8% in the age bracket) enrolled. Conversely, the age group of 3 to 4 year olds has the lowest likelihood of being enrolled in a private school, with 192 (100.0% in the age bracket) attending a public institution.
| Age Bracket | Public School | Private School |
| 3 to 4 Year Olds | 192 (100.0%) | 0 (0.0%) |
| 5 to 9 Year Old | 892 (89.7%) | 102 (10.3%) |
| 10 to 14 Year Olds | 702 (82.4%) | 150 (17.6%) |
| 15 to 17 Year Olds | 575 (87.3%) | 84 (12.8%) |
| 18 to 19 Year Olds | 231 (48.0%) | 250 (52.0%) |
| 20 to 24 Year Olds | 221 (36.2%) | 390 (63.8%) |
| 25 to 34 Year Olds | 91 (58.7%) | 64 (41.3%) |
| 35 Years and over | 90 (91.8%) | 8 (8.2%) |
| Total | 2,995 (74.1%) | 1,047 (25.9%) |
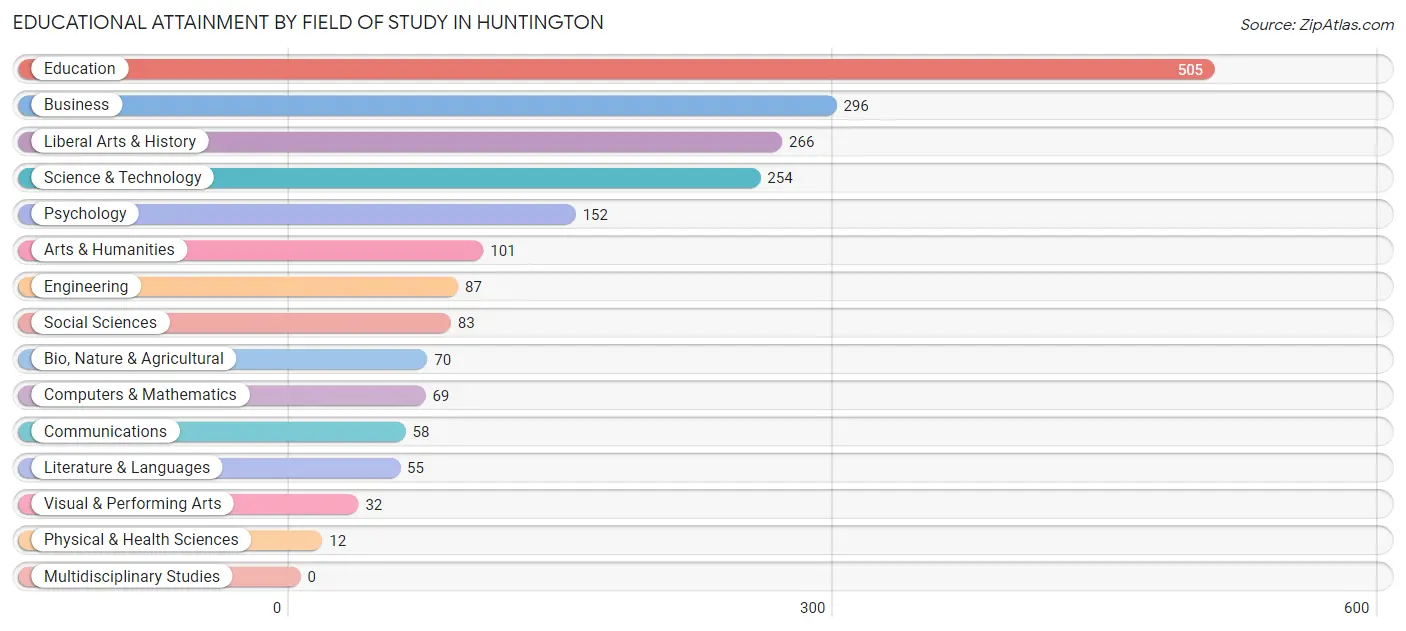
Educational Attainment by Field of Study in Huntington
Education (505 | 24.7%), business (296 | 14.5%), liberal arts & history (266 | 13.0%), science & technology (254 | 12.4%), and psychology (152 | 7.4%) are the most common fields of study among 2,040 individuals in Huntington who have obtained a bachelor's degree or higher.
| Field of Study | # Graduates | % Graduates |
| Computers & Mathematics | 69 | 3.4% |
| Bio, Nature & Agricultural | 70 | 3.4% |
| Physical & Health Sciences | 12 | 0.6% |
| Psychology | 152 | 7.4% |
| Social Sciences | 83 | 4.1% |
| Engineering | 87 | 4.3% |
| Multidisciplinary Studies | 0 | 0.0% |
| Science & Technology | 254 | 12.4% |
| Business | 296 | 14.5% |
| Education | 505 | 24.7% |
| Literature & Languages | 55 | 2.7% |
| Liberal Arts & History | 266 | 13.0% |
| Visual & Performing Arts | 32 | 1.6% |
| Communications | 58 | 2.8% |
| Arts & Humanities | 101 | 5.0% |
| Total | 2,040 | 100.0% |
Transportation & Commute in Huntington
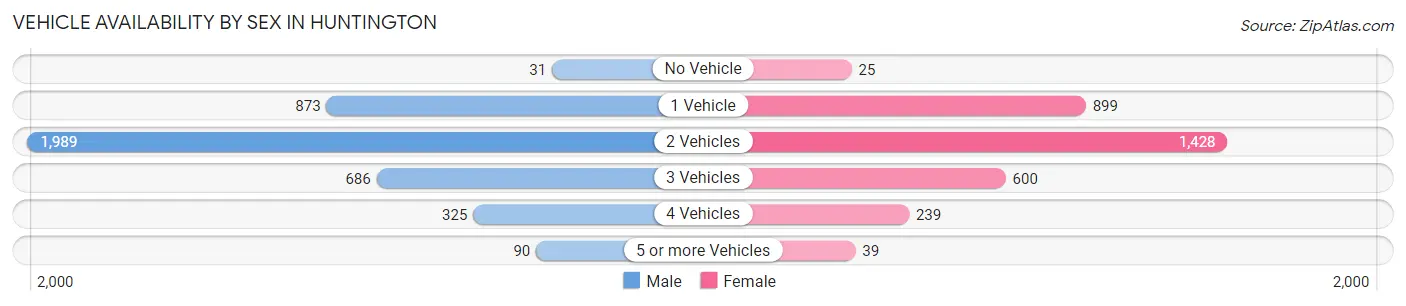
Vehicle Availability by Sex in Huntington
The most prevalent vehicle ownership categories in Huntington are males with 2 vehicles (1,989, accounting for 49.8%) and females with 2 vehicles (1,428, making up 61.6%).
| Vehicles Available | Male | Female |
| No Vehicle | 31 (0.8%) | 25 (0.8%) |
| 1 Vehicle | 873 (21.9%) | 899 (27.8%) |
| 2 Vehicles | 1,989 (49.8%) | 1,428 (44.2%) |
| 3 Vehicles | 686 (17.2%) | 600 (18.6%) |
| 4 Vehicles | 325 (8.1%) | 239 (7.4%) |
| 5 or more Vehicles | 90 (2.2%) | 39 (1.2%) |
| Total | 3,994 (100.0%) | 3,230 (100.0%) |
Commute Time in Huntington
The most frequently occuring commute durations in Huntington are 10 to 14 minutes (1,715 commuters, 23.4%), 5 to 9 minutes (1,710 commuters, 23.3%), and 30 to 34 minutes (744 commuters, 10.1%).
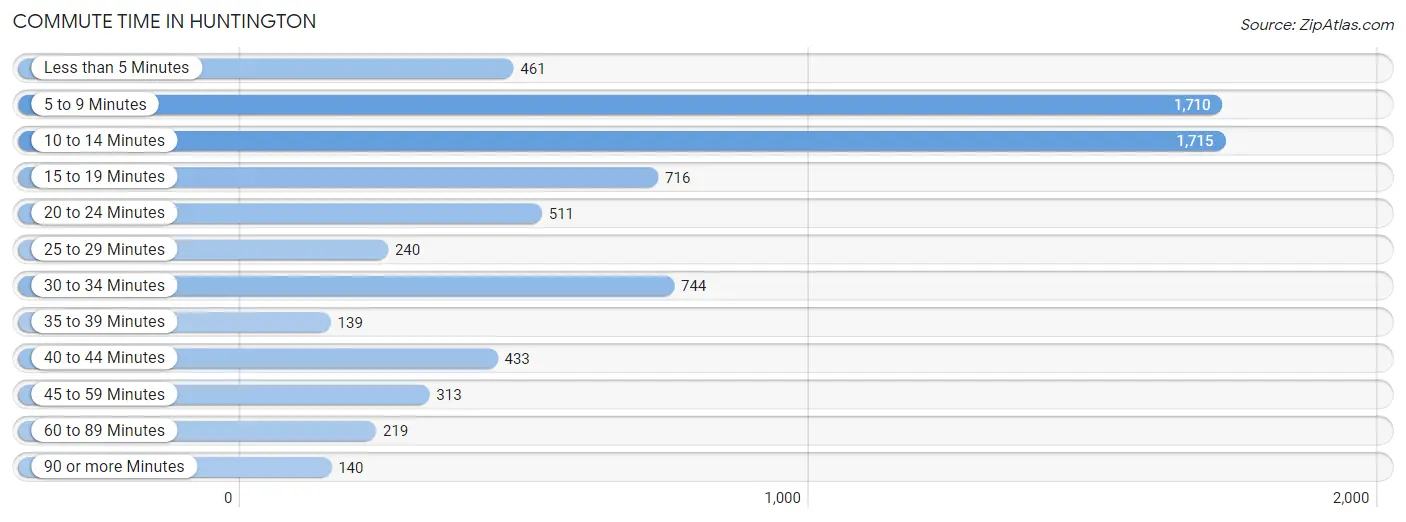
| Commute Time | # Commuters | % Commuters |
| Less than 5 Minutes | 461 | 6.3% |
| 5 to 9 Minutes | 1,710 | 23.3% |
| 10 to 14 Minutes | 1,715 | 23.4% |
| 15 to 19 Minutes | 716 | 9.8% |
| 20 to 24 Minutes | 511 | 7.0% |
| 25 to 29 Minutes | 240 | 3.3% |
| 30 to 34 Minutes | 744 | 10.1% |
| 35 to 39 Minutes | 139 | 1.9% |
| 40 to 44 Minutes | 433 | 5.9% |
| 45 to 59 Minutes | 313 | 4.3% |
| 60 to 89 Minutes | 219 | 3.0% |
| 90 or more Minutes | 140 | 1.9% |
Commute Time by Sex in Huntington
The most common commute times in Huntington are 10 to 14 minutes (1,038 commuters, 25.6%) for males and 5 to 9 minutes (908 commuters, 27.6%) for females.
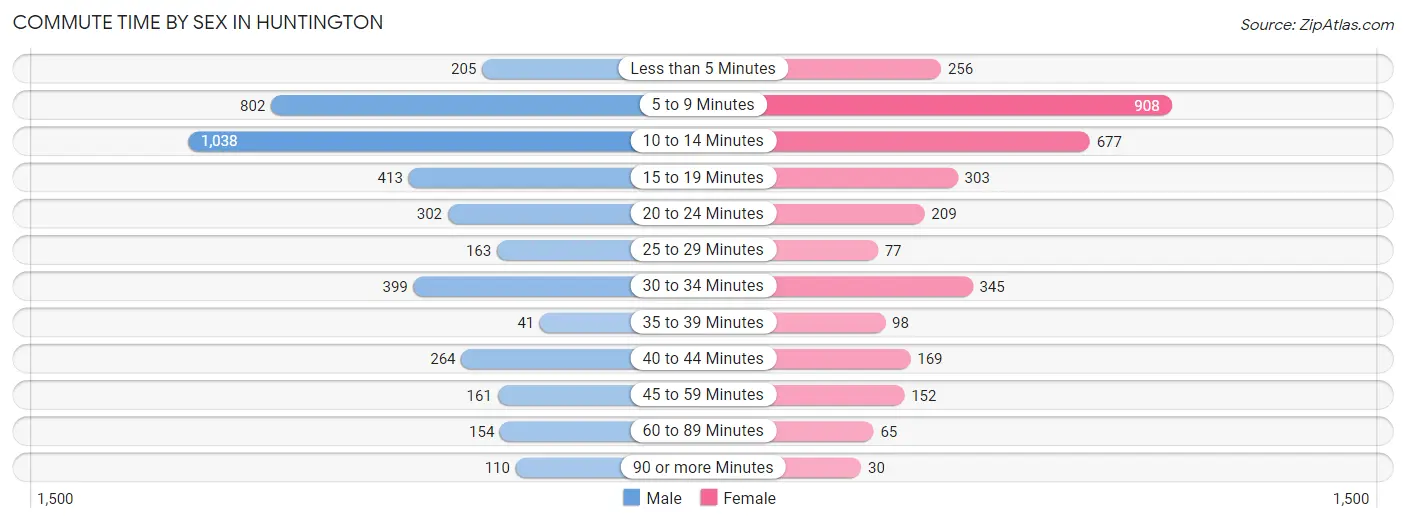
| Commute Time | Male | Female |
| Less than 5 Minutes | 205 (5.1%) | 256 (7.8%) |
| 5 to 9 Minutes | 802 (19.8%) | 908 (27.6%) |
| 10 to 14 Minutes | 1,038 (25.6%) | 677 (20.6%) |
| 15 to 19 Minutes | 413 (10.2%) | 303 (9.2%) |
| 20 to 24 Minutes | 302 (7.4%) | 209 (6.4%) |
| 25 to 29 Minutes | 163 (4.0%) | 77 (2.3%) |
| 30 to 34 Minutes | 399 (9.9%) | 345 (10.5%) |
| 35 to 39 Minutes | 41 (1.0%) | 98 (3.0%) |
| 40 to 44 Minutes | 264 (6.5%) | 169 (5.1%) |
| 45 to 59 Minutes | 161 (4.0%) | 152 (4.6%) |
| 60 to 89 Minutes | 154 (3.8%) | 65 (2.0%) |
| 90 or more Minutes | 110 (2.7%) | 30 (0.9%) |
Time of Departure to Work by Sex in Huntington
The most frequent times of departure to work in Huntington are 12:00 PM to 3:59 PM (614, 15.1%) for males and 12:00 PM to 3:59 PM (584, 17.8%) for females.
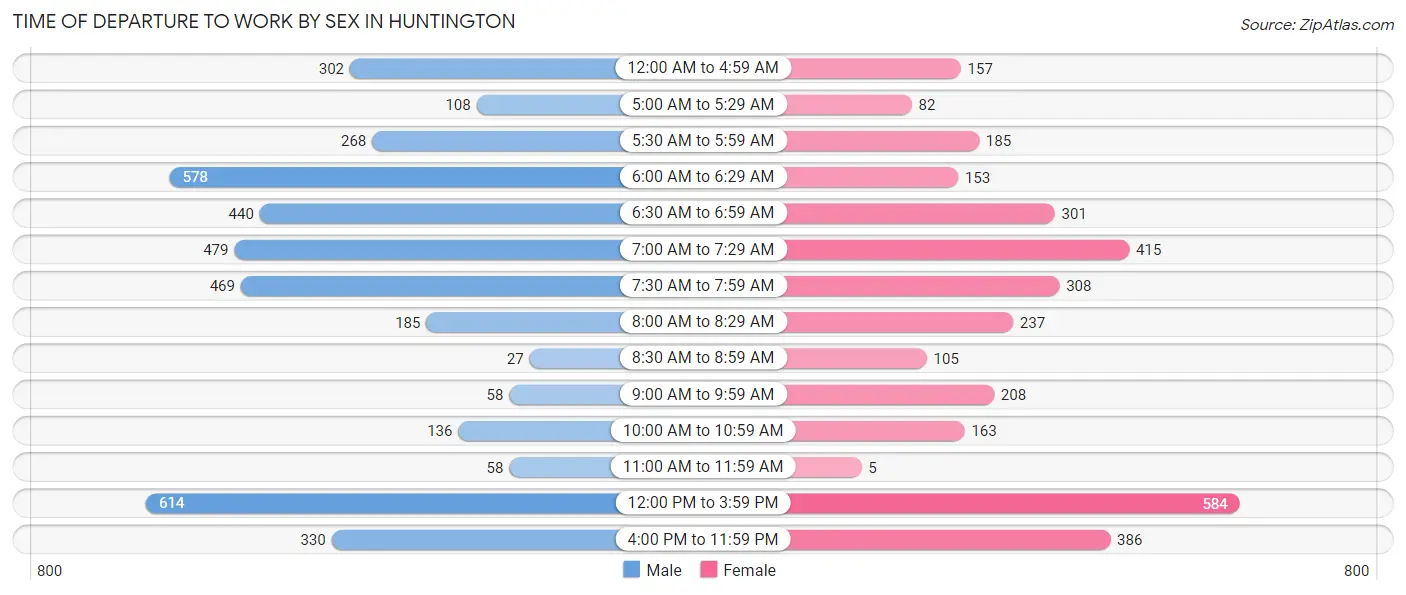
| Time of Departure | Male | Female |
| 12:00 AM to 4:59 AM | 302 (7.4%) | 157 (4.8%) |
| 5:00 AM to 5:29 AM | 108 (2.7%) | 82 (2.5%) |
| 5:30 AM to 5:59 AM | 268 (6.6%) | 185 (5.6%) |
| 6:00 AM to 6:29 AM | 578 (14.3%) | 153 (4.6%) |
| 6:30 AM to 6:59 AM | 440 (10.9%) | 301 (9.1%) |
| 7:00 AM to 7:29 AM | 479 (11.8%) | 415 (12.6%) |
| 7:30 AM to 7:59 AM | 469 (11.6%) | 308 (9.4%) |
| 8:00 AM to 8:29 AM | 185 (4.6%) | 237 (7.2%) |
| 8:30 AM to 8:59 AM | 27 (0.7%) | 105 (3.2%) |
| 9:00 AM to 9:59 AM | 58 (1.4%) | 208 (6.3%) |
| 10:00 AM to 10:59 AM | 136 (3.4%) | 163 (5.0%) |
| 11:00 AM to 11:59 AM | 58 (1.4%) | 5 (0.2%) |
| 12:00 PM to 3:59 PM | 614 (15.1%) | 584 (17.8%) |
| 4:00 PM to 11:59 PM | 330 (8.1%) | 386 (11.7%) |
| Total | 4,052 (100.0%) | 3,289 (100.0%) |
Housing Occupancy in Huntington
Occupancy by Ownership in Huntington
Of the total 6,928 dwellings in Huntington, owner-occupied units account for 4,356 (62.9%), while renter-occupied units make up 2,572 (37.1%).
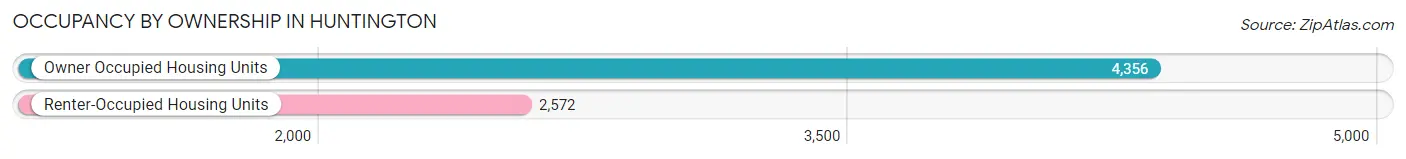
| Occupancy | # Housing Units | % Housing Units |
| Owner Occupied Housing Units | 4,356 | 62.9% |
| Renter-Occupied Housing Units | 2,572 | 37.1% |
| Total Occupied Housing Units | 6,928 | 100.0% |
Occupancy by Household Size in Huntington
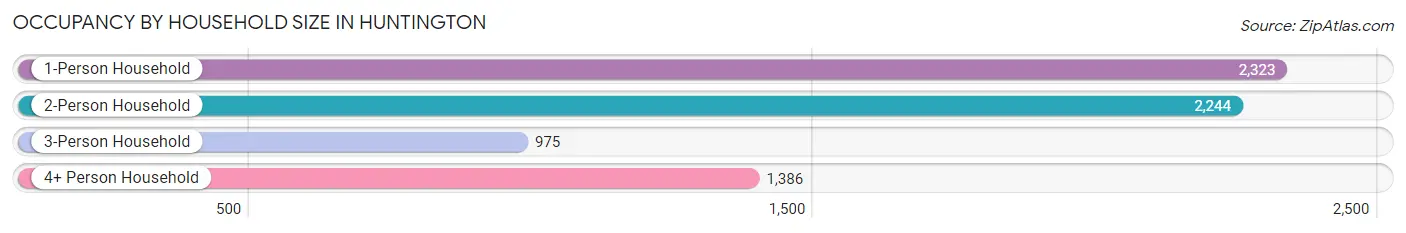
| Household Size | # Housing Units | % Housing Units |
| 1-Person Household | 2,323 | 33.5% |
| 2-Person Household | 2,244 | 32.4% |
| 3-Person Household | 975 | 14.1% |
| 4+ Person Household | 1,386 | 20.0% |
| Total Housing Units | 6,928 | 100.0% |
Occupancy by Ownership by Household Size in Huntington
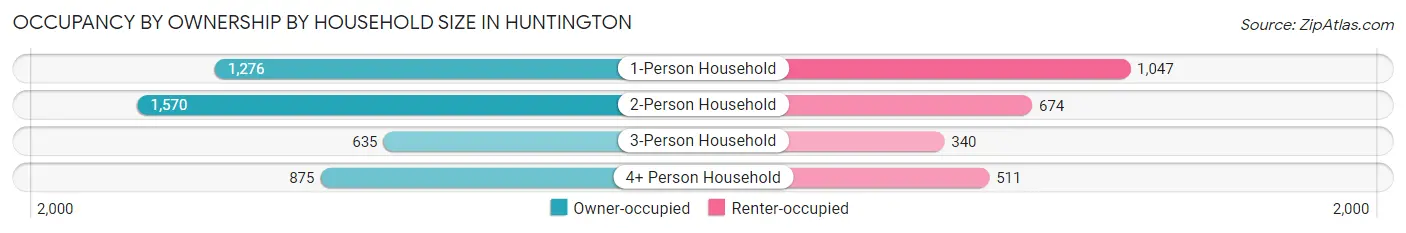
| Household Size | Owner-occupied | Renter-occupied |
| 1-Person Household | 1,276 (54.9%) | 1,047 (45.1%) |
| 2-Person Household | 1,570 (70.0%) | 674 (30.0%) |
| 3-Person Household | 635 (65.1%) | 340 (34.9%) |
| 4+ Person Household | 875 (63.1%) | 511 (36.9%) |
| Total Housing Units | 4,356 (62.9%) | 2,572 (37.1%) |
Occupancy by Educational Attainment in Huntington
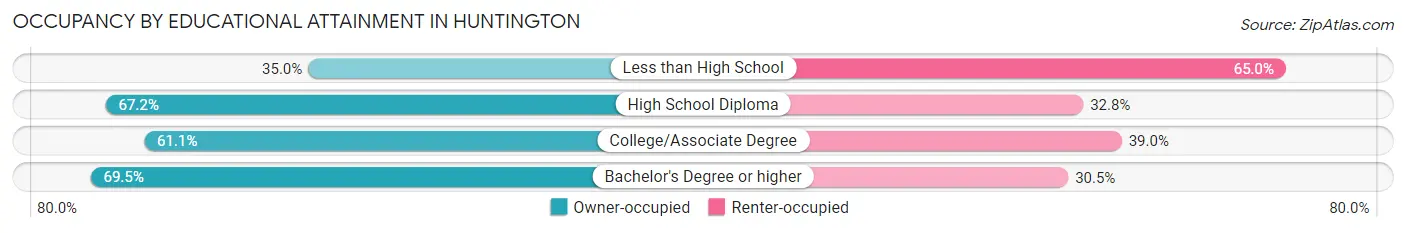
| Household Size | Owner-occupied | Renter-occupied |
| Less than High School | 234 (35.0%) | 434 (65.0%) |
| High School Diploma | 1,978 (67.2%) | 967 (32.8%) |
| College/Associate Degree | 1,160 (61.1%) | 740 (39.0%) |
| Bachelor's Degree or higher | 984 (69.5%) | 431 (30.5%) |
Occupancy by Age of Householder in Huntington
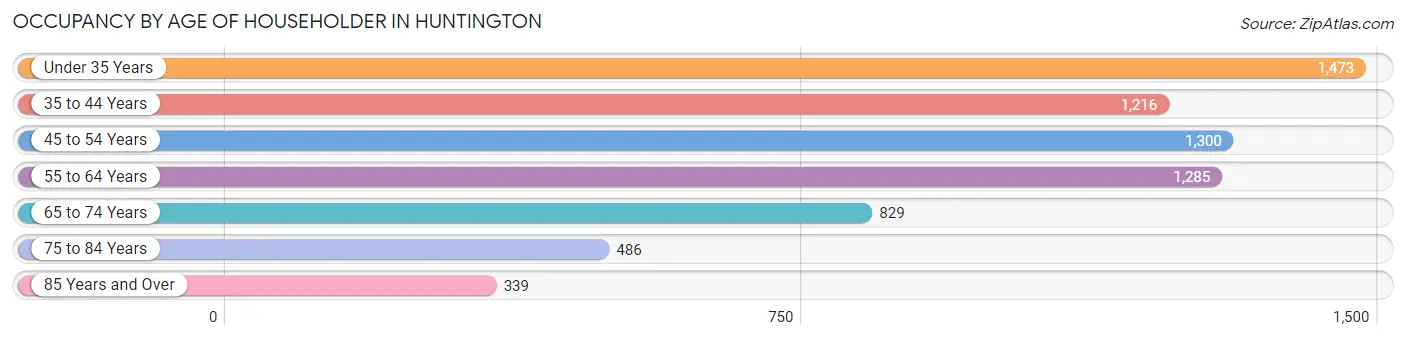
| Age Bracket | # Households | % Households |
| Under 35 Years | 1,473 | 21.3% |
| 35 to 44 Years | 1,216 | 17.5% |
| 45 to 54 Years | 1,300 | 18.8% |
| 55 to 64 Years | 1,285 | 18.5% |
| 65 to 74 Years | 829 | 12.0% |
| 75 to 84 Years | 486 | 7.0% |
| 85 Years and Over | 339 | 4.9% |
| Total | 6,928 | 100.0% |
Housing Finances in Huntington
Median Income by Occupancy in Huntington
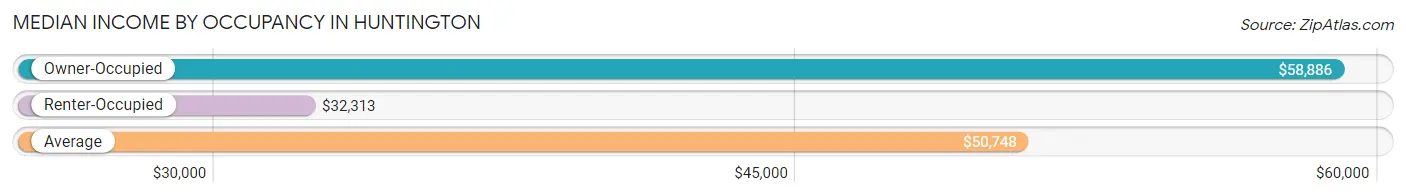
| Occupancy Type | # Households | Median Income |
| Owner-Occupied | 4,356 (62.9%) | $58,886 |
| Renter-Occupied | 2,572 (37.1%) | $32,313 |
| Average | 6,928 (100.0%) | $50,748 |
Occupancy by Householder Income Bracket in Huntington
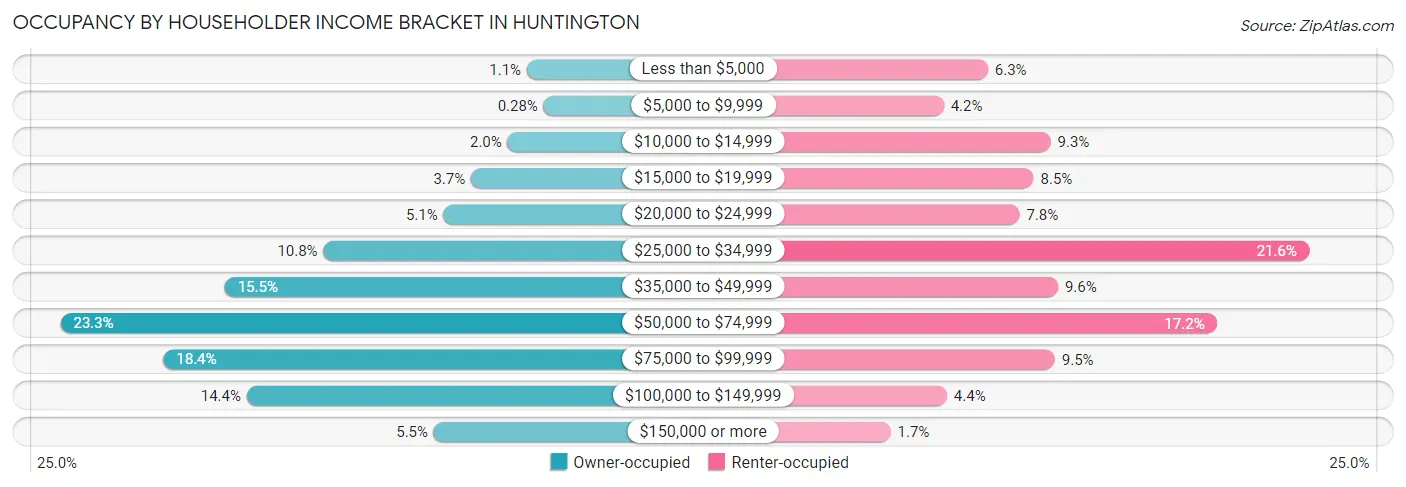
| Income Bracket | Owner-occupied | Renter-occupied |
| Less than $5,000 | 47 (1.1%) | 162 (6.3%) |
| $5,000 to $9,999 | 12 (0.3%) | 108 (4.2%) |
| $10,000 to $14,999 | 87 (2.0%) | 239 (9.3%) |
| $15,000 to $19,999 | 163 (3.7%) | 218 (8.5%) |
| $20,000 to $24,999 | 220 (5.1%) | 201 (7.8%) |
| $25,000 to $34,999 | 469 (10.8%) | 555 (21.6%) |
| $35,000 to $49,999 | 674 (15.5%) | 248 (9.6%) |
| $50,000 to $74,999 | 1,015 (23.3%) | 442 (17.2%) |
| $75,000 to $99,999 | 801 (18.4%) | 244 (9.5%) |
| $100,000 to $149,999 | 628 (14.4%) | 112 (4.3%) |
| $150,000 or more | 240 (5.5%) | 43 (1.7%) |
| Total | 4,356 (100.0%) | 2,572 (100.0%) |
Monthly Housing Cost Tiers in Huntington
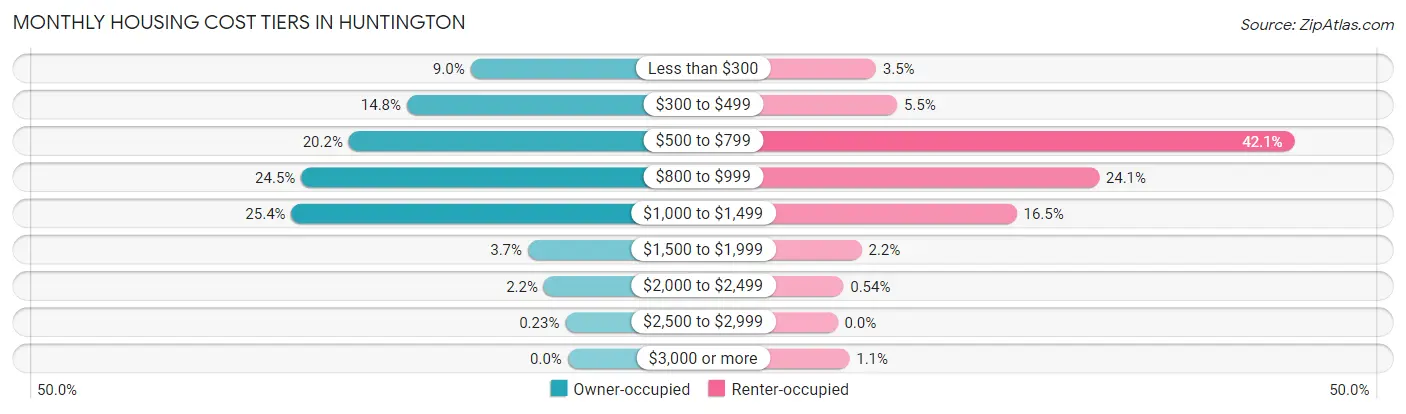
| Monthly Cost | Owner-occupied | Renter-occupied |
| Less than $300 | 390 (8.9%) | 91 (3.5%) |
| $300 to $499 | 645 (14.8%) | 141 (5.5%) |
| $500 to $799 | 878 (20.2%) | 1,082 (42.1%) |
| $800 to $999 | 1,069 (24.5%) | 619 (24.1%) |
| $1,000 to $1,499 | 1,108 (25.4%) | 424 (16.5%) |
| $1,500 to $1,999 | 160 (3.7%) | 57 (2.2%) |
| $2,000 to $2,499 | 96 (2.2%) | 14 (0.5%) |
| $2,500 to $2,999 | 10 (0.2%) | 0 (0.0%) |
| $3,000 or more | 0 (0.0%) | 28 (1.1%) |
| Total | 4,356 (100.0%) | 2,572 (100.0%) |
Physical Housing Characteristics in Huntington
Housing Structures in Huntington
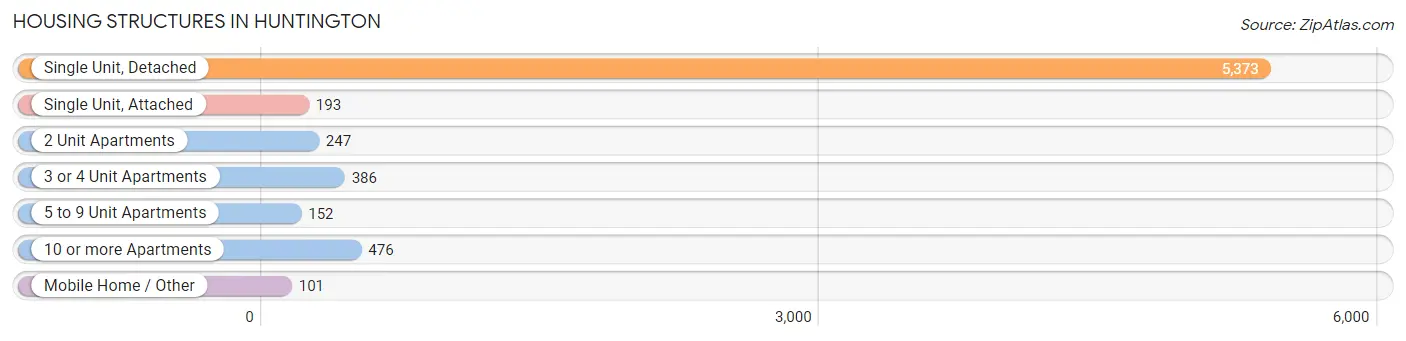
| Structure Type | # Housing Units | % Housing Units |
| Single Unit, Detached | 5,373 | 77.5% |
| Single Unit, Attached | 193 | 2.8% |
| 2 Unit Apartments | 247 | 3.6% |
| 3 or 4 Unit Apartments | 386 | 5.6% |
| 5 to 9 Unit Apartments | 152 | 2.2% |
| 10 or more Apartments | 476 | 6.9% |
| Mobile Home / Other | 101 | 1.5% |
| Total | 6,928 | 100.0% |
Housing Structures by Occupancy in Huntington
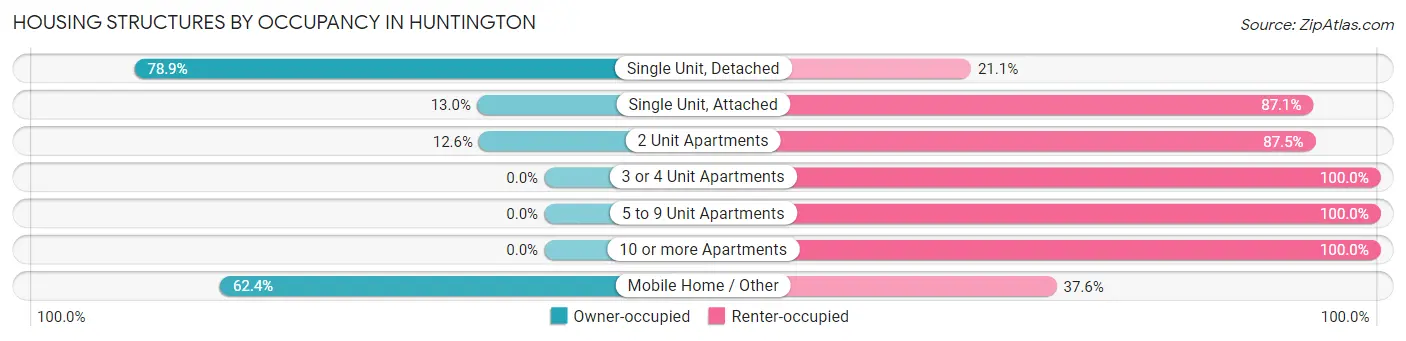
| Structure Type | Owner-occupied | Renter-occupied |
| Single Unit, Detached | 4,237 (78.9%) | 1,136 (21.1%) |
| Single Unit, Attached | 25 (13.0%) | 168 (87.1%) |
| 2 Unit Apartments | 31 (12.6%) | 216 (87.5%) |
| 3 or 4 Unit Apartments | 0 (0.0%) | 386 (100.0%) |
| 5 to 9 Unit Apartments | 0 (0.0%) | 152 (100.0%) |
| 10 or more Apartments | 0 (0.0%) | 476 (100.0%) |
| Mobile Home / Other | 63 (62.4%) | 38 (37.6%) |
| Total | 4,356 (62.9%) | 2,572 (37.1%) |
Housing Structures by Number of Rooms in Huntington
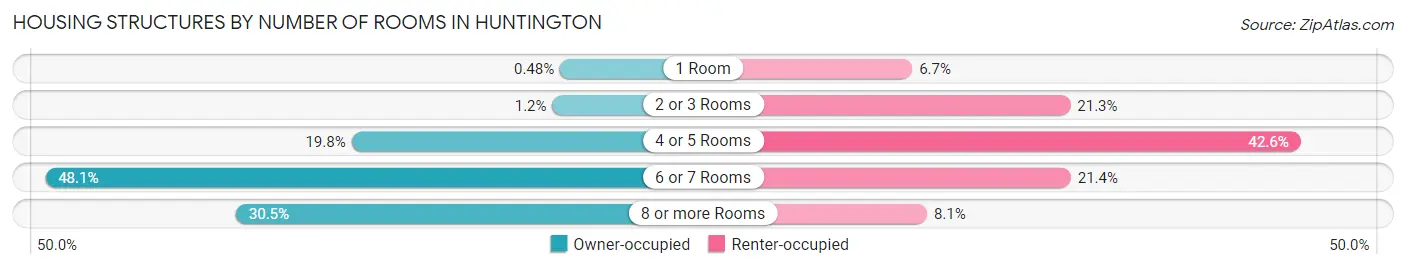
| Number of Rooms | Owner-occupied | Renter-occupied |
| 1 Room | 21 (0.5%) | 172 (6.7%) |
| 2 or 3 Rooms | 52 (1.2%) | 548 (21.3%) |
| 4 or 5 Rooms | 861 (19.8%) | 1,096 (42.6%) |
| 6 or 7 Rooms | 2,095 (48.1%) | 549 (21.3%) |
| 8 or more Rooms | 1,327 (30.5%) | 207 (8.1%) |
| Total | 4,356 (100.0%) | 2,572 (100.0%) |
Housing Structure by Heating Type in Huntington
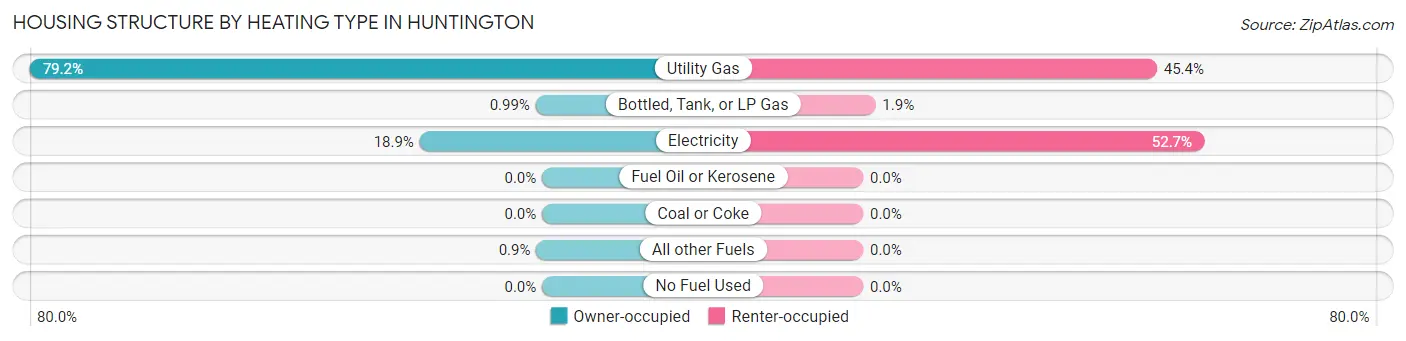
| Heating Type | Owner-occupied | Renter-occupied |
| Utility Gas | 3,450 (79.2%) | 1,168 (45.4%) |
| Bottled, Tank, or LP Gas | 43 (1.0%) | 49 (1.9%) |
| Electricity | 824 (18.9%) | 1,355 (52.7%) |
| Fuel Oil or Kerosene | 0 (0.0%) | 0 (0.0%) |
| Coal or Coke | 0 (0.0%) | 0 (0.0%) |
| All other Fuels | 39 (0.9%) | 0 (0.0%) |
| No Fuel Used | 0 (0.0%) | 0 (0.0%) |
| Total | 4,356 (100.0%) | 2,572 (100.0%) |
Household Vehicle Usage in Huntington
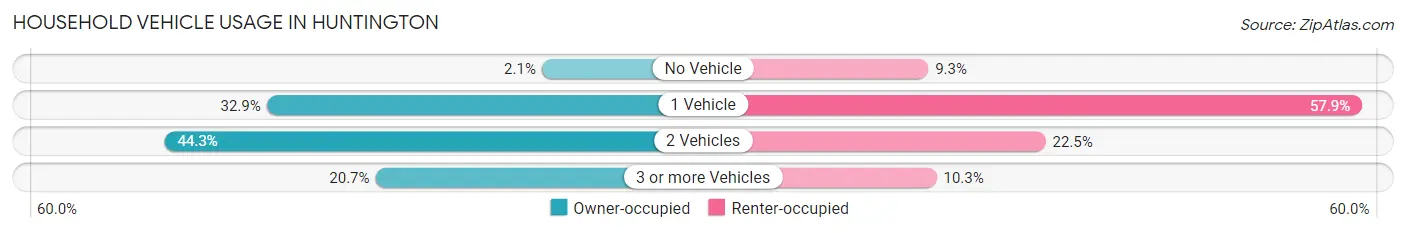
| Vehicles per Household | Owner-occupied | Renter-occupied |
| No Vehicle | 90 (2.1%) | 240 (9.3%) |
| 1 Vehicle | 1,433 (32.9%) | 1,490 (57.9%) |
| 2 Vehicles | 1,931 (44.3%) | 578 (22.5%) |
| 3 or more Vehicles | 902 (20.7%) | 264 (10.3%) |
| Total | 4,356 (100.0%) | 2,572 (100.0%) |
Real Estate & Mortgages in Huntington
Real Estate and Mortgage Overview in Huntington
| Characteristic | Without Mortgage | With Mortgage |
| Housing Units | 1,293 | 3,063 |
| Median Property Value | $86,900 | $97,200 |
| Median Household Income | $38,199 | $170 |
| Monthly Housing Costs | $366 | $0 |
| Real Estate Taxes | $830 | $142 |
Property Value by Mortgage Status in Huntington
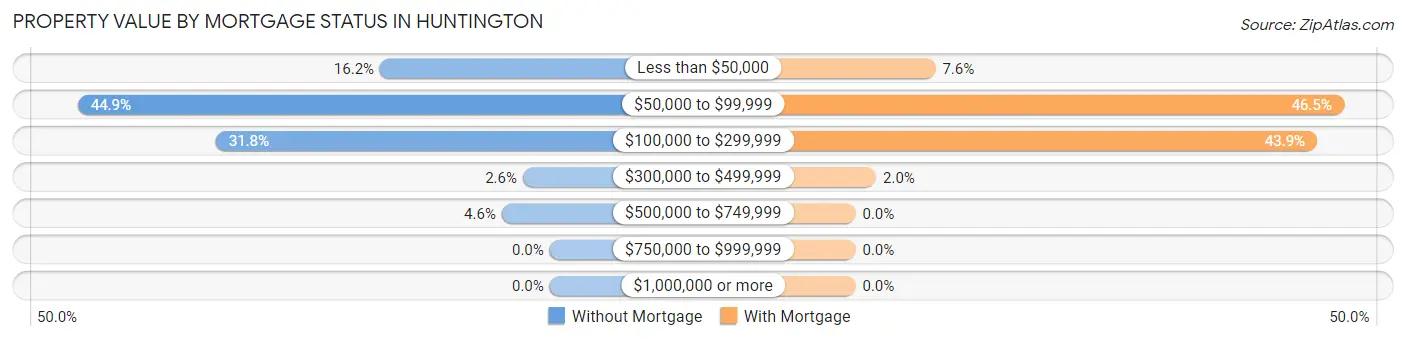
| Property Value | Without Mortgage | With Mortgage |
| Less than $50,000 | 209 (16.2%) | 233 (7.6%) |
| $50,000 to $99,999 | 581 (44.9%) | 1,424 (46.5%) |
| $100,000 to $299,999 | 411 (31.8%) | 1,346 (43.9%) |
| $300,000 to $499,999 | 33 (2.5%) | 60 (2.0%) |
| $500,000 to $749,999 | 59 (4.6%) | 0 (0.0%) |
| $750,000 to $999,999 | 0 (0.0%) | 0 (0.0%) |
| $1,000,000 or more | 0 (0.0%) | 0 (0.0%) |
| Total | 1,293 (100.0%) | 3,063 (100.0%) |
Household Income by Mortgage Status in Huntington
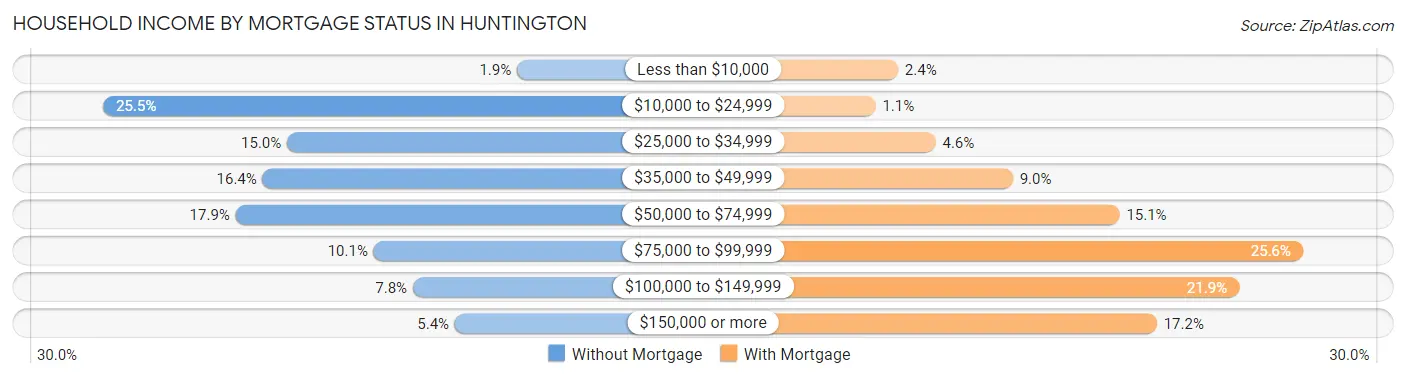
| Household Income | Without Mortgage | With Mortgage |
| Less than $10,000 | 24 (1.9%) | 74 (2.4%) |
| $10,000 to $24,999 | 330 (25.5%) | 35 (1.1%) |
| $25,000 to $34,999 | 194 (15.0%) | 140 (4.6%) |
| $35,000 to $49,999 | 212 (16.4%) | 275 (9.0%) |
| $50,000 to $74,999 | 232 (17.9%) | 462 (15.1%) |
| $75,000 to $99,999 | 130 (10.1%) | 783 (25.6%) |
| $100,000 to $149,999 | 101 (7.8%) | 671 (21.9%) |
| $150,000 or more | 70 (5.4%) | 527 (17.2%) |
| Total | 1,293 (100.0%) | 3,063 (100.0%) |
Property Value to Household Income Ratio in Huntington
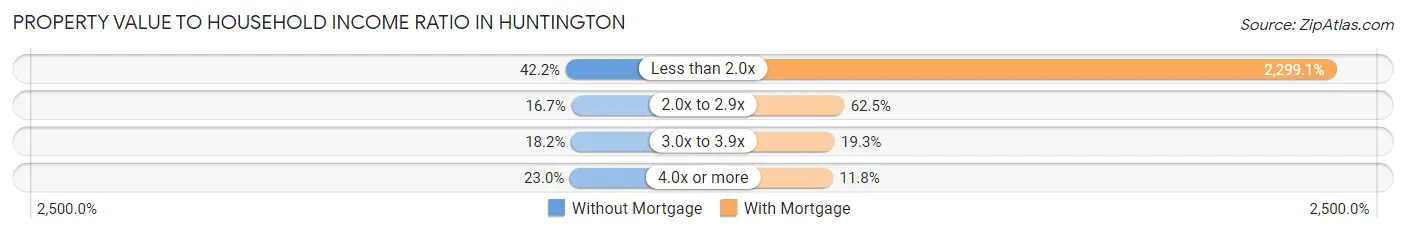
| Value-to-Income Ratio | Without Mortgage | With Mortgage |
| Less than 2.0x | 545 (42.1%) | 70,422 (2,299.1%) |
| 2.0x to 2.9x | 216 (16.7%) | 1,915 (62.5%) |
| 3.0x to 3.9x | 235 (18.2%) | 591 (19.3%) |
| 4.0x or more | 297 (23.0%) | 360 (11.7%) |
| Total | 1,293 (100.0%) | 3,063 (100.0%) |
Real Estate Taxes by Mortgage Status in Huntington
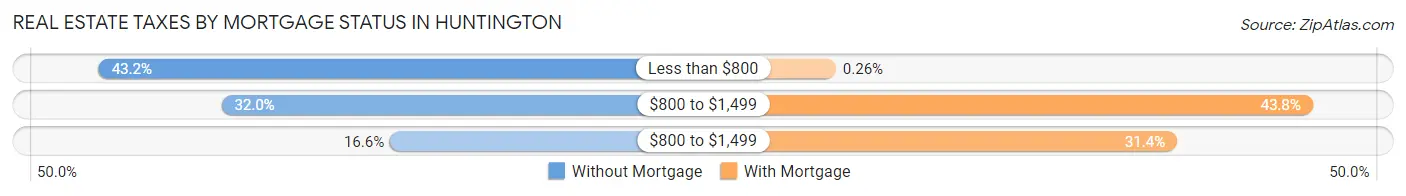
| Property Taxes | Without Mortgage | With Mortgage |
| Less than $800 | 559 (43.2%) | 8 (0.3%) |
| $800 to $1,499 | 414 (32.0%) | 1,342 (43.8%) |
| $800 to $1,499 | 215 (16.6%) | 962 (31.4%) |
| Total | 1,293 (100.0%) | 3,063 (100.0%) |
Health & Disability in Huntington
Health Insurance Coverage by Age in Huntington
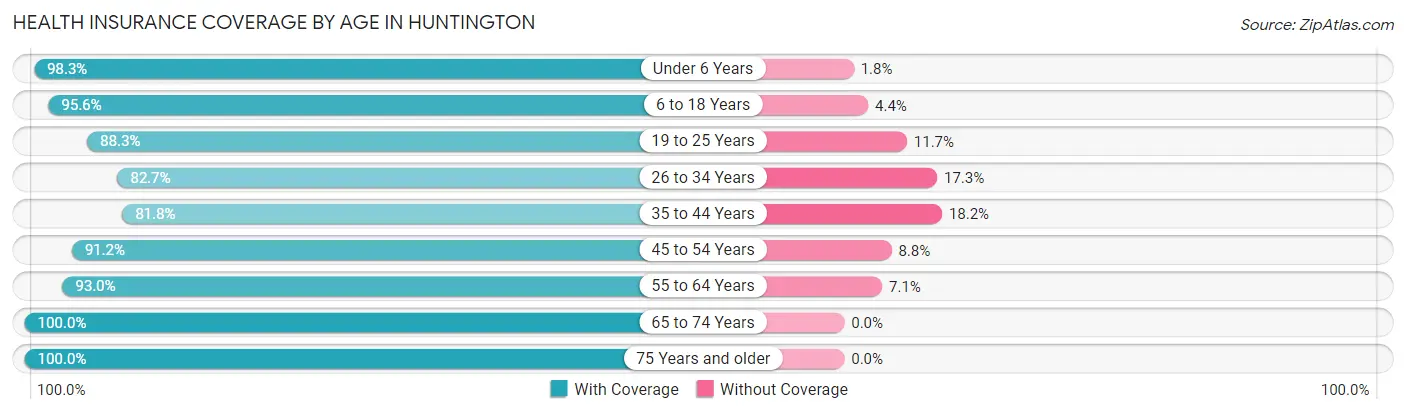
| Age Bracket | With Coverage | Without Coverage |
| Under 6 Years | 1,068 (98.3%) | 19 (1.8%) |
| 6 to 18 Years | 2,691 (95.6%) | 125 (4.4%) |
| 19 to 25 Years | 2,013 (88.3%) | 266 (11.7%) |
| 26 to 34 Years | 1,569 (82.7%) | 328 (17.3%) |
| 35 to 44 Years | 1,689 (81.8%) | 376 (18.2%) |
| 45 to 54 Years | 1,765 (91.2%) | 170 (8.8%) |
| 55 to 64 Years | 2,004 (92.9%) | 152 (7.0%) |
| 65 to 74 Years | 1,279 (100.0%) | 0 (0.0%) |
| 75 Years and older | 1,146 (100.0%) | 0 (0.0%) |
| Total | 15,224 (91.4%) | 1,436 (8.6%) |
Health Insurance Coverage by Citizenship Status in Huntington
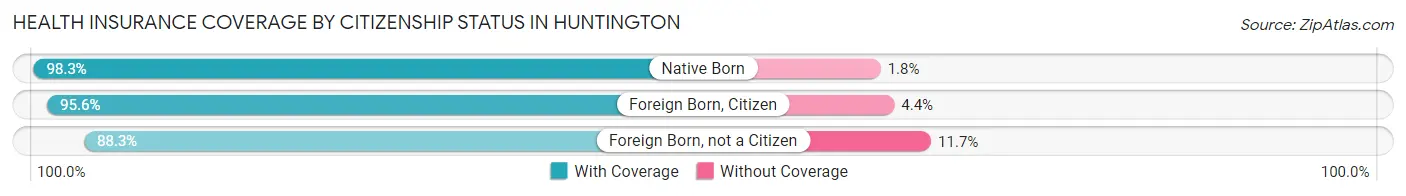
| Citizenship Status | With Coverage | Without Coverage |
| Native Born | 1,068 (98.3%) | 19 (1.8%) |
| Foreign Born, Citizen | 2,691 (95.6%) | 125 (4.4%) |
| Foreign Born, not a Citizen | 2,013 (88.3%) | 266 (11.7%) |
Health Insurance Coverage by Household Income in Huntington
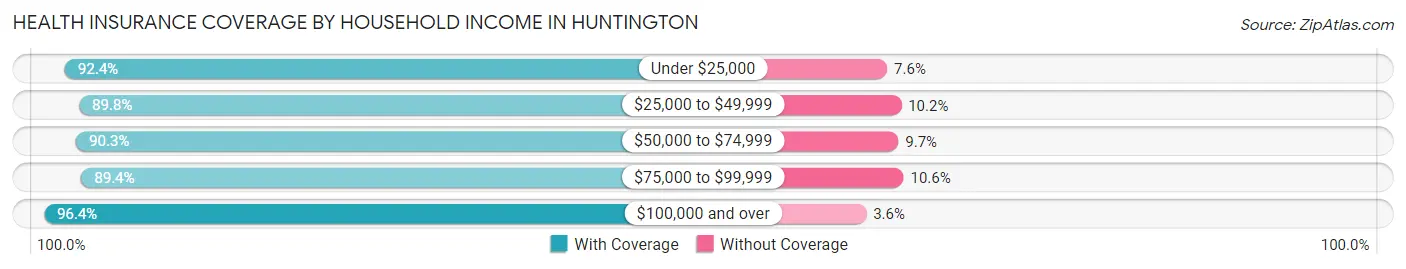
| Household Income | With Coverage | Without Coverage |
| Under $25,000 | 2,030 (92.4%) | 166 (7.6%) |
| $25,000 to $49,999 | 3,267 (89.8%) | 371 (10.2%) |
| $50,000 to $74,999 | 3,113 (90.3%) | 333 (9.7%) |
| $75,000 to $99,999 | 2,787 (89.4%) | 332 (10.6%) |
| $100,000 and over | 3,239 (96.4%) | 122 (3.6%) |
Public vs Private Health Insurance Coverage by Age in Huntington
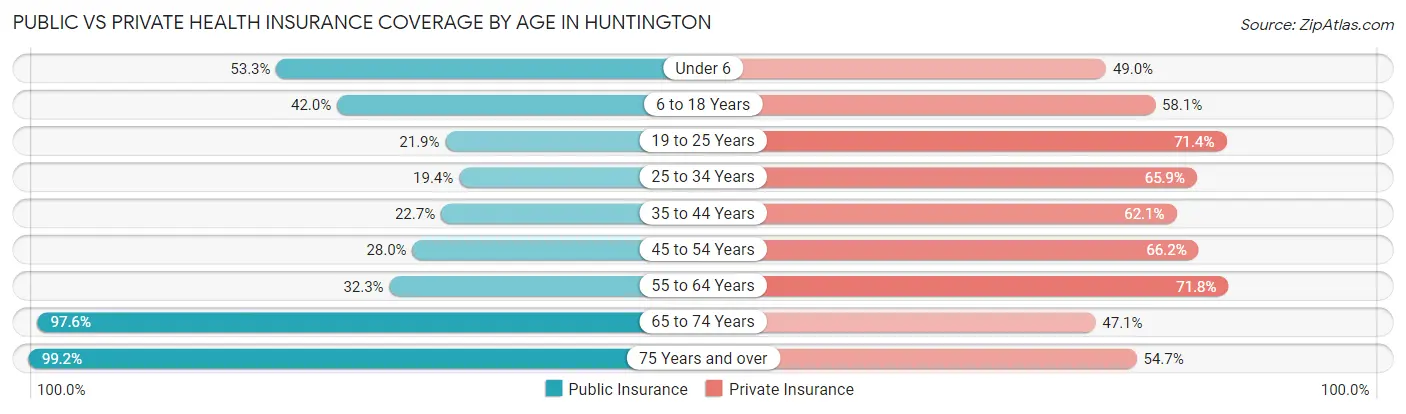
| Age Bracket | Public Insurance | Private Insurance |
| Under 6 | 579 (53.3%) | 533 (49.0%) |
| 6 to 18 Years | 1,183 (42.0%) | 1,637 (58.1%) |
| 19 to 25 Years | 499 (21.9%) | 1,626 (71.4%) |
| 25 to 34 Years | 367 (19.4%) | 1,250 (65.9%) |
| 35 to 44 Years | 469 (22.7%) | 1,282 (62.1%) |
| 45 to 54 Years | 542 (28.0%) | 1,281 (66.2%) |
| 55 to 64 Years | 696 (32.3%) | 1,547 (71.8%) |
| 65 to 74 Years | 1,248 (97.6%) | 602 (47.1%) |
| 75 Years and over | 1,137 (99.2%) | 627 (54.7%) |
| Total | 6,720 (40.3%) | 10,385 (62.3%) |
Disability Status by Sex by Age in Huntington
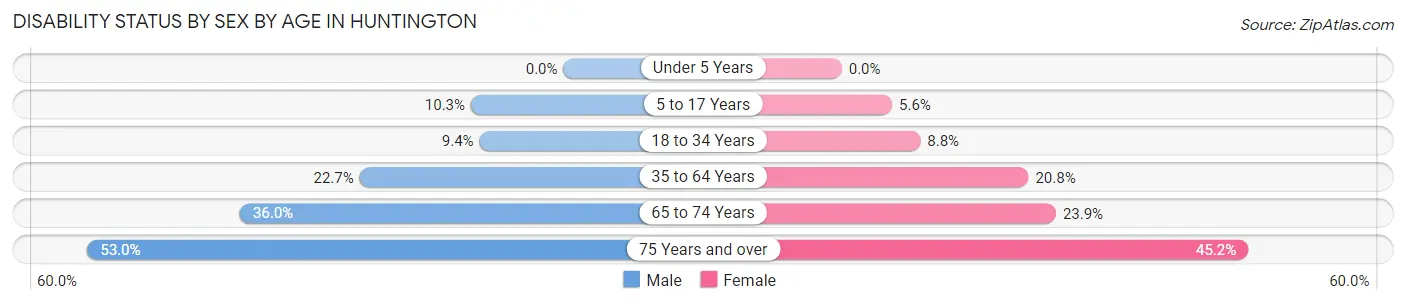
| Age Bracket | Male | Female |
| Under 5 Years | 0 (0.0%) | 0 (0.0%) |
| 5 to 17 Years | 136 (10.3%) | 83 (5.6%) |
| 18 to 34 Years | 198 (9.3%) | 198 (8.7%) |
| 35 to 64 Years | 702 (22.7%) | 637 (20.8%) |
| 65 to 74 Years | 210 (36.0%) | 166 (23.8%) |
| 75 Years and over | 229 (53.0%) | 323 (45.2%) |
Disability Class by Sex by Age in Huntington
Disability Class: Hearing Difficulty
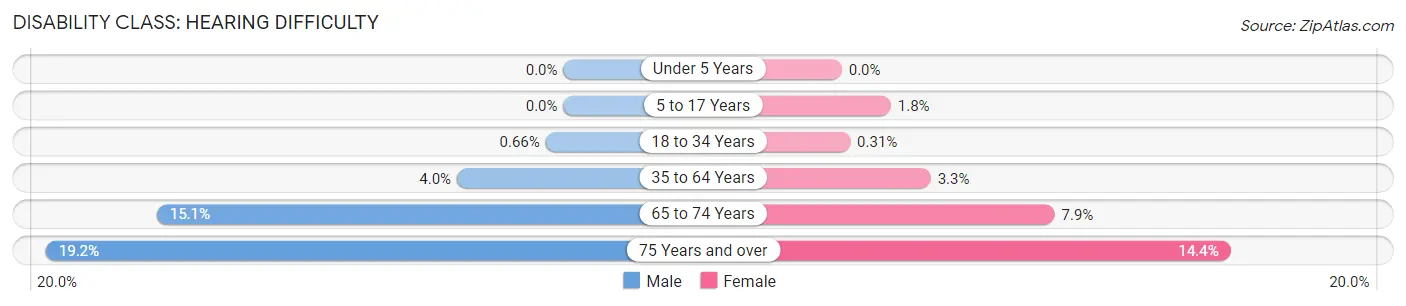
| Age Bracket | Male | Female |
| Under 5 Years | 0 (0.0%) | 0 (0.0%) |
| 5 to 17 Years | 0 (0.0%) | 27 (1.8%) |
| 18 to 34 Years | 14 (0.7%) | 7 (0.3%) |
| 35 to 64 Years | 122 (4.0%) | 101 (3.3%) |
| 65 to 74 Years | 88 (15.1%) | 55 (7.9%) |
| 75 Years and over | 83 (19.2%) | 103 (14.4%) |
Disability Class: Vision Difficulty
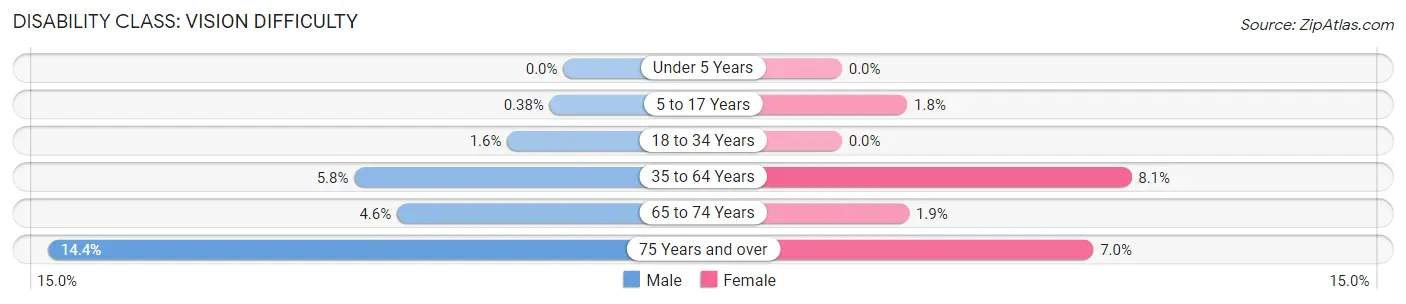
| Age Bracket | Male | Female |
| Under 5 Years | 0 (0.0%) | 0 (0.0%) |
| 5 to 17 Years | 5 (0.4%) | 27 (1.8%) |
| 18 to 34 Years | 33 (1.6%) | 0 (0.0%) |
| 35 to 64 Years | 180 (5.8%) | 247 (8.1%) |
| 65 to 74 Years | 27 (4.6%) | 13 (1.9%) |
| 75 Years and over | 62 (14.3%) | 50 (7.0%) |
Disability Class: Cognitive Difficulty
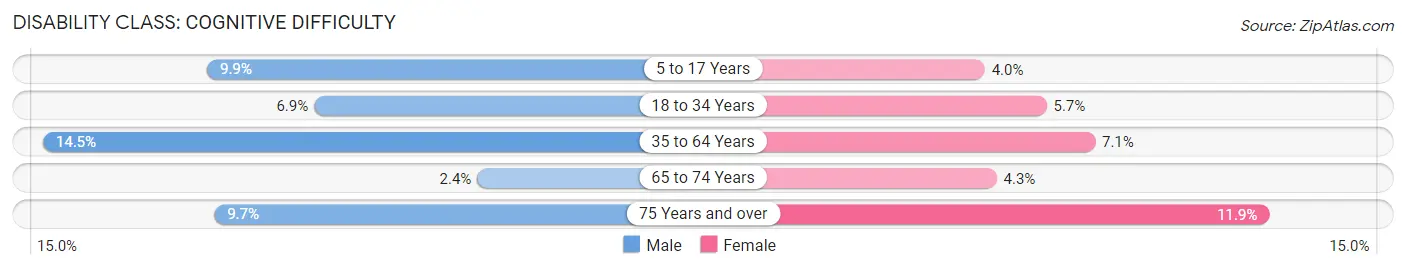
| Age Bracket | Male | Female |
| 5 to 17 Years | 131 (9.9%) | 59 (4.0%) |
| 18 to 34 Years | 147 (6.9%) | 129 (5.7%) |
| 35 to 64 Years | 448 (14.5%) | 216 (7.0%) |
| 65 to 74 Years | 14 (2.4%) | 30 (4.3%) |
| 75 Years and over | 42 (9.7%) | 85 (11.9%) |
Disability Class: Ambulatory Difficulty
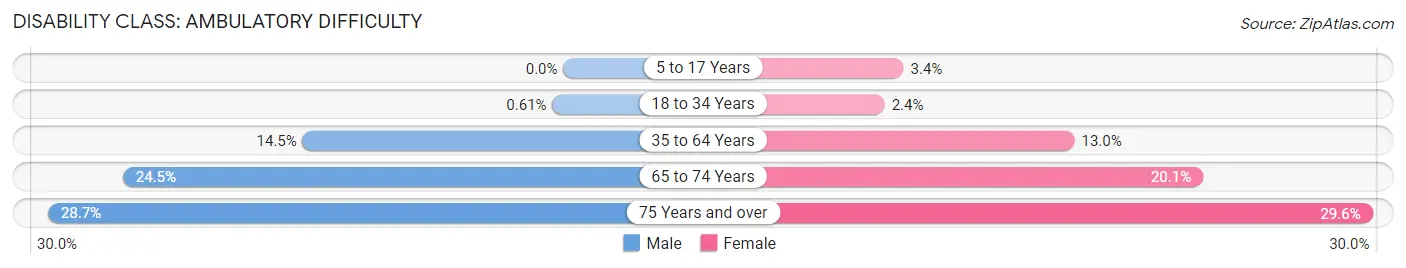
| Age Bracket | Male | Female |
| 5 to 17 Years | 0 (0.0%) | 51 (3.4%) |
| 18 to 34 Years | 13 (0.6%) | 54 (2.4%) |
| 35 to 64 Years | 449 (14.5%) | 397 (13.0%) |
| 65 to 74 Years | 143 (24.5%) | 140 (20.1%) |
| 75 Years and over | 124 (28.7%) | 211 (29.5%) |
Disability Class: Self-Care Difficulty
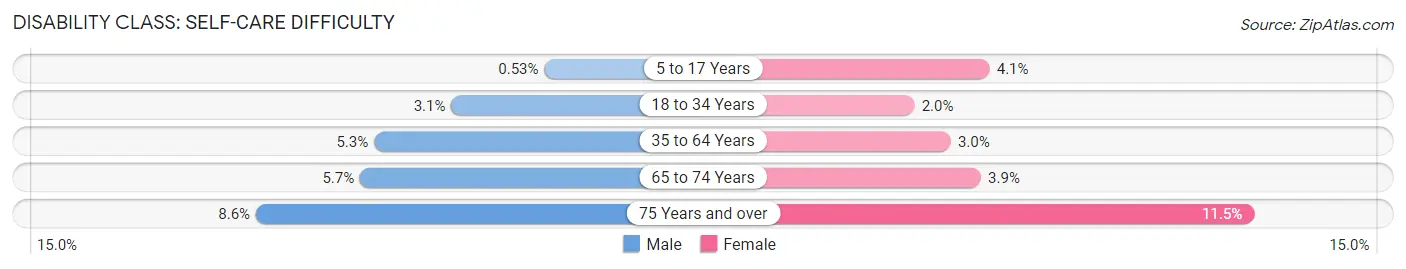
| Age Bracket | Male | Female |
| 5 to 17 Years | 7 (0.5%) | 61 (4.1%) |
| 18 to 34 Years | 66 (3.1%) | 46 (2.0%) |
| 35 to 64 Years | 163 (5.3%) | 93 (3.0%) |
| 65 to 74 Years | 33 (5.7%) | 27 (3.9%) |
| 75 Years and over | 37 (8.6%) | 82 (11.5%) |
Technology Access in Huntington
Computing Device Access in Huntington
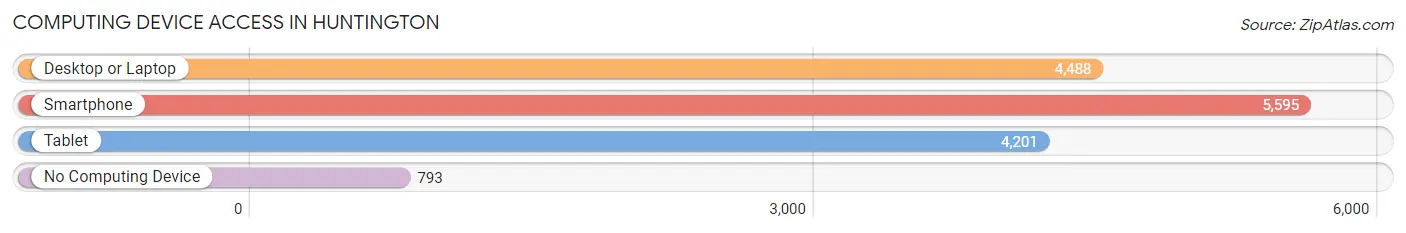
| Device Type | # Households | % Households |
| Desktop or Laptop | 4,488 | 64.8% |
| Smartphone | 5,595 | 80.8% |
| Tablet | 4,201 | 60.6% |
| No Computing Device | 793 | 11.5% |
| Total | 6,928 | 100.0% |
Internet Access in Huntington
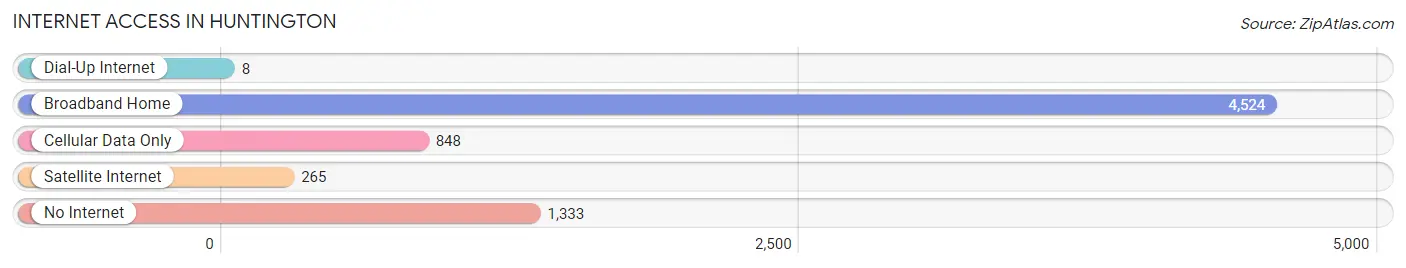
| Internet Type | # Households | % Households |
| Dial-Up Internet | 8 | 0.1% |
| Broadband Home | 4,524 | 65.3% |
| Cellular Data Only | 848 | 12.2% |
| Satellite Internet | 265 | 3.8% |
| No Internet | 1,333 | 19.2% |
| Total | 6,928 | 100.0% |
Huntington Summary
Huntington, Indiana is a city located in Huntington County, Indiana, United States. It is the county seat of Huntington County and is located along the Wabash River. The city is home to Huntington University, a private liberal arts college, and the Huntington County Community School Corporation. The population of Huntington was 17,391 at the 2010 census.
History
The area that is now Huntington was first settled in 1834 by a group of settlers from Ohio. The town was originally called Huntington Court House, and was named after Samuel Huntington, a signer of the Declaration of Independence. The town was incorporated in 1866.
In the late 19th century, Huntington was a major railroad hub, with several railroads running through the city. The railroads brought economic growth to the city, and by the early 20th century, Huntington was a thriving industrial center. The city was home to several factories, including a glass factory, a paper mill, and a foundry.
Geography
Huntington is located in Huntington County, Indiana, at 40°51'N 85°27'W (40.851, -85.450). The city is situated along the Wabash River, and is located about 50 miles northeast of Fort Wayne. The city has a total area of 8.2 square miles, all of which is land.
Economy
Huntington's economy is largely based on manufacturing and healthcare. The city is home to several manufacturing companies, including a glass factory, a paper mill, and a foundry. The city is also home to several healthcare facilities, including a hospital, a nursing home, and several medical clinics.
The city is also home to Huntington University, a private liberal arts college. The university is the largest employer in the city, and provides jobs for over 1,000 people.
Demographics
As of the 2010 census, the population of Huntington was 17,391. The racial makeup of the city was 92.2% White, 2.7% African American, 0.3% Native American, 0.7% Asian, 0.1% Pacific Islander, 2.2% from other races, and 1.8% from two or more races. Hispanic or Latino of any race were 4.2% of the population.
The median income for a household in the city was $37,945, and the median income for a family was $45,945. The per capita income for the city was $19,845. About 11.2% of families and 14.2% of the population were below the poverty line, including 19.2% of those under age 18 and 8.2% of those age 65 or over.
Common Questions
What is Per Capita Income in Huntington?
Per Capita income in Huntington is $25,652.
What is the Median Family Income in Huntington?
Median Family Income in Huntington is $61,141.
What is the Median Household income in Huntington?
Median Household Income in Huntington is $50,748.
What is Income or Wage Gap in Huntington?
Income or Wage Gap in Huntington is 43.3%.
Women in Huntington earn 56.7 cents for every dollar earned by a man.
What is Family Income Deficit in Huntington?
Family Income Deficit in Huntington is $7,666.
Families that are below poverty line in Huntington earn $7,666 less on average than the poverty threshold level.
What is Inequality or Gini Index in Huntington?
Inequality or Gini Index in Huntington is 0.41.
What is the Total Population of Huntington?
Total Population of Huntington is 17,017.
What is the Total Male Population of Huntington?
Total Male Population of Huntington is 8,139.
What is the Total Female Population of Huntington?
Total Female Population of Huntington is 8,878.
What is the Ratio of Males per 100 Females in Huntington?
There are 91.68 Males per 100 Females in Huntington.
What is the Ratio of Females per 100 Males in Huntington?
There are 109.08 Females per 100 Males in Huntington.
What is the Median Population Age in Huntington?
Median Population Age in Huntington is 36.6 Years.
What is the Average Family Size in Huntington
Average Family Size in Huntington is 2.9 People.
What is the Average Household Size in Huntington
Average Household Size in Huntington is 2.3 People.
How Large is the Labor Force in Huntington?
There are 8,454 People in the Labor Forcein in Huntington.
What is the Percentage of People in the Labor Force in Huntington?
61.0% of People are in the Labor Force in Huntington.
What is the Unemployment Rate in Huntington?
Unemployment Rate in Huntington is 5.2%.