Howe, IN Map & Demographics
Howe Map
Howe Overview
$24,501
PER CAPITA INCOME
$47,883
AVG FAMILY INCOME
$48,051
AVG HOUSEHOLD INCOME
0.27
INEQUALITY / GINI INDEX
803
TOTAL POPULATION
464
MALE POPULATION
339
FEMALE POPULATION
136.87
MALES / 100 FEMALES
73.06
FEMALES / 100 MALES
33.1
MEDIAN AGE
2.7
AVG FAMILY SIZE
2.4
AVG HOUSEHOLD SIZE
412
LABOR FORCE [ PEOPLE ]
64.1%
PERCENT IN LABOR FORCE
Howe Zip Codes
Howe Area Codes
Income in Howe
Income Overview in Howe
Per Capita Income in Howe is $24,501, while median incomes of families and households are $47,883 and $48,051 respectively.
| Characteristic | Number | Measure |
| Per Capita Income | 803 | $24,501 |
| Median Family Income | 245 | $47,883 |
| Mean Family Income | 245 | $57,950 |
| Median Household Income | 297 | $48,051 |
| Mean Household Income | 297 | $56,078 |
| Income Deficit | 245 | $0 |
| Wage / Income Gap (%) | 803 | 0.00% |
| Wage / Income Gap ($) | 803 | 100.00¢ per $1 |
| Gini / Inequality Index | 803 | 0.27 |
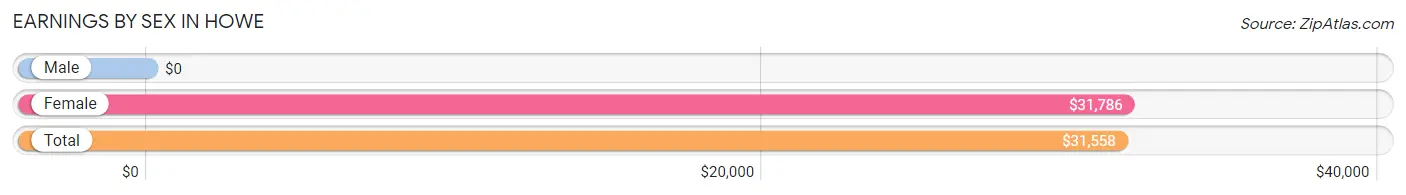
Earnings by Sex in Howe
| Sex | Number | Average Earnings |
| Male | 140 (32.3%) | $0 |
| Female | 294 (67.7%) | $31,786 |
| Total | 434 (100.0%) | $31,558 |
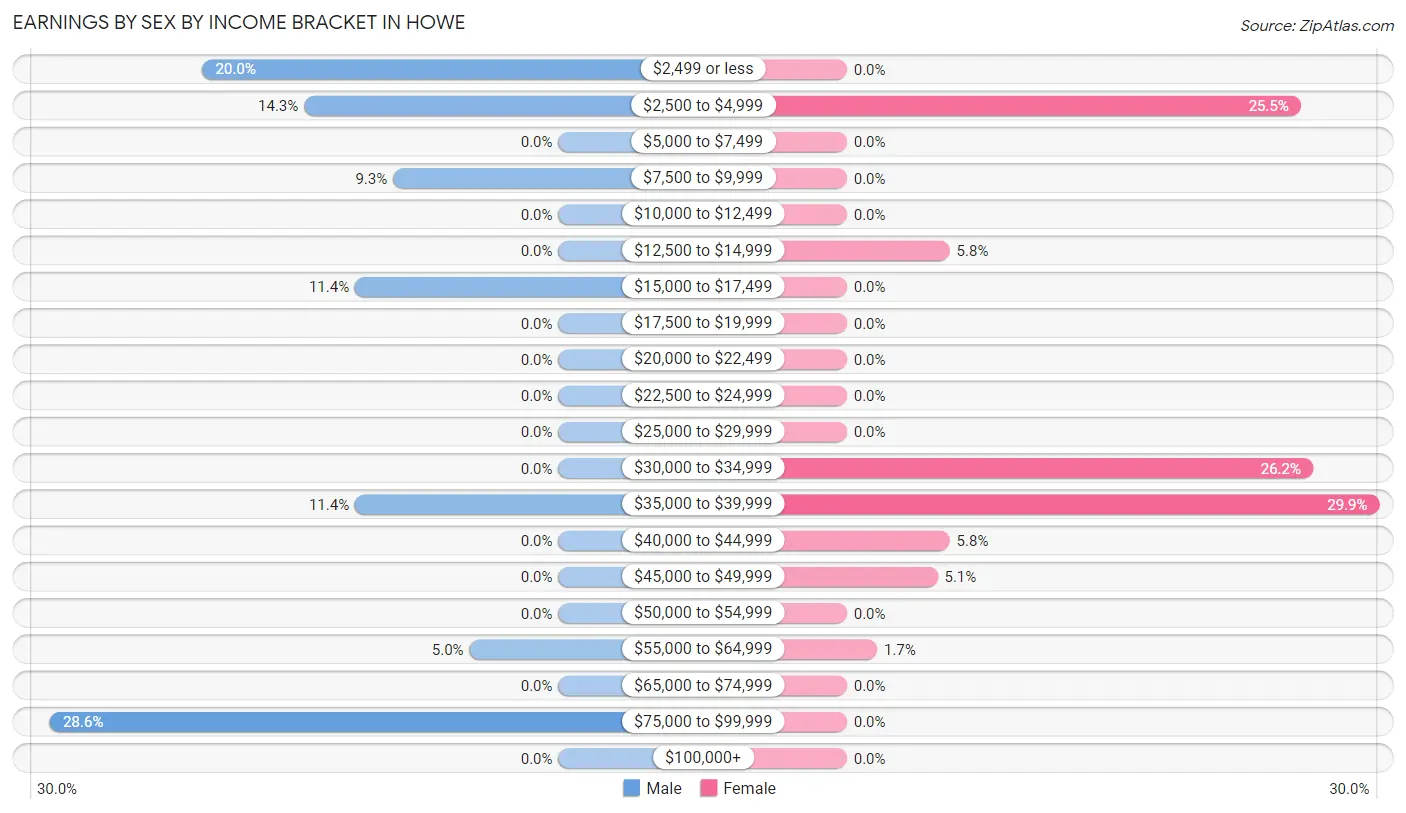
Earnings by Sex by Income Bracket in Howe
The most common earnings brackets in Howe are $75,000 to $99,999 for men (40 | 28.6%) and $35,000 to $39,999 for women (88 | 29.9%).
| Income | Male | Female |
| $2,499 or less | 28 (20.0%) | 0 (0.0%) |
| $2,500 to $4,999 | 20 (14.3%) | 75 (25.5%) |
| $5,000 to $7,499 | 0 (0.0%) | 0 (0.0%) |
| $7,500 to $9,999 | 13 (9.3%) | 0 (0.0%) |
| $10,000 to $12,499 | 0 (0.0%) | 0 (0.0%) |
| $12,500 to $14,999 | 0 (0.0%) | 17 (5.8%) |
| $15,000 to $17,499 | 16 (11.4%) | 0 (0.0%) |
| $17,500 to $19,999 | 0 (0.0%) | 0 (0.0%) |
| $20,000 to $22,499 | 0 (0.0%) | 0 (0.0%) |
| $22,500 to $24,999 | 0 (0.0%) | 0 (0.0%) |
| $25,000 to $29,999 | 0 (0.0%) | 0 (0.0%) |
| $30,000 to $34,999 | 0 (0.0%) | 77 (26.2%) |
| $35,000 to $39,999 | 16 (11.4%) | 88 (29.9%) |
| $40,000 to $44,999 | 0 (0.0%) | 17 (5.8%) |
| $45,000 to $49,999 | 0 (0.0%) | 15 (5.1%) |
| $50,000 to $54,999 | 0 (0.0%) | 0 (0.0%) |
| $55,000 to $64,999 | 7 (5.0%) | 5 (1.7%) |
| $65,000 to $74,999 | 0 (0.0%) | 0 (0.0%) |
| $75,000 to $99,999 | 40 (28.6%) | 0 (0.0%) |
| $100,000+ | 0 (0.0%) | 0 (0.0%) |
| Total | 140 (100.0%) | 294 (100.0%) |
Earnings by Sex by Educational Attainment in Howe
| Educational Attainment | Male Income | Female Income |
| Less than High School | - | - |
| High School Diploma | - | - |
| College or Associate's Degree | - | - |
| Bachelor's Degree | - | - |
| Graduate Degree | - | - |
| Total | - | - |
Family Income in Howe
Family Income Brackets in Howe
According to the Howe family income data, there are 175 families falling into the $35,000 to $49,999 income range, which is the most common income bracket and makes up 71.4% of all families.
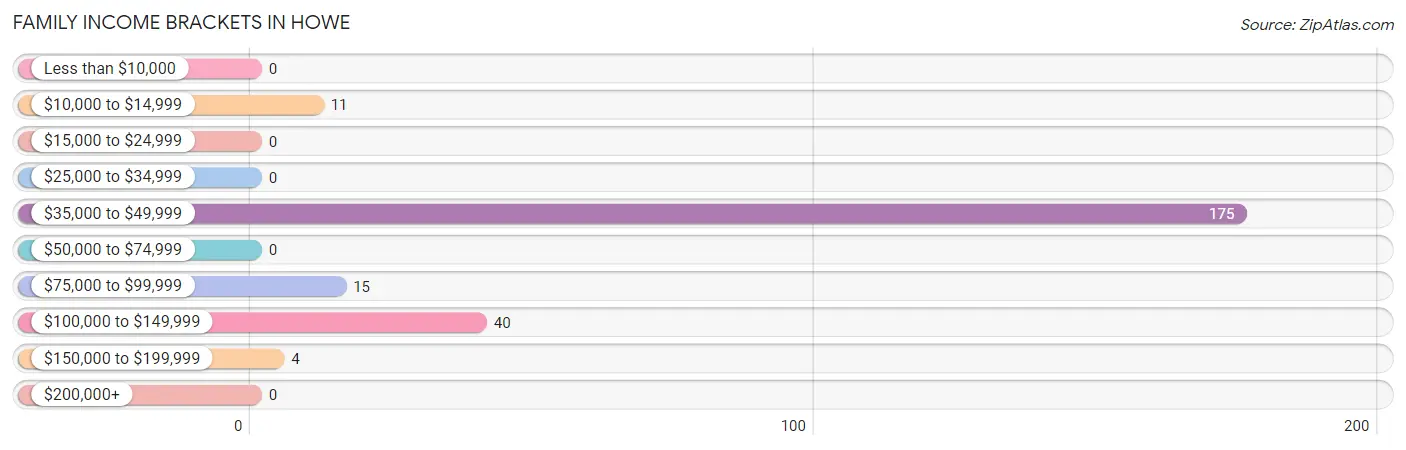
| Income Bracket | # Families | % Families |
| Less than $10,000 | 0 | 0.0% |
| $10,000 to $14,999 | 11 | 4.5% |
| $15,000 to $24,999 | 0 | 0.0% |
| $25,000 to $34,999 | 0 | 0.0% |
| $35,000 to $49,999 | 175 | 71.4% |
| $50,000 to $74,999 | 0 | 0.0% |
| $75,000 to $99,999 | 15 | 6.1% |
| $100,000 to $149,999 | 40 | 16.3% |
| $150,000 to $199,999 | 4 | 1.6% |
| $200,000+ | 0 | 0.0% |
Family Income by Famaliy Size in Howe
3-person families (59 | 24.1%) account for the highest median family income in Howe with $115,906 per family, while 3-person families (59 | 24.1%) have the highest median income of $38,635 per family member.
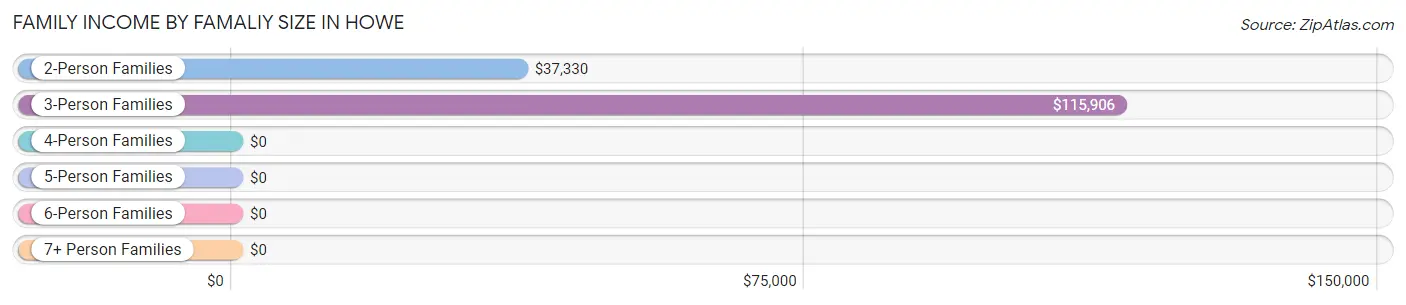
| Income Bracket | # Families | Median Income |
| 2-Person Families | 186 (75.9%) | $37,330 |
| 3-Person Families | 59 (24.1%) | $115,906 |
| 4-Person Families | 0 (0.0%) | $0 |
| 5-Person Families | 0 (0.0%) | $0 |
| 6-Person Families | 0 (0.0%) | $0 |
| 7+ Person Families | 0 (0.0%) | $0 |
| Total | 245 (100.0%) | $47,883 |
Family Income by Number of Earners in Howe
| Number of Earners | # Families | Median Income |
| No Earners | 23 (9.4%) | $0 |
| 1 Earner | 163 (66.5%) | $0 |
| 2 Earners | 55 (22.5%) | $0 |
| 3+ Earners | 4 (1.6%) | $0 |
| Total | 245 (100.0%) | $47,883 |
Household Income in Howe
Household Income Brackets in Howe
With 193 households falling in the category, the $35,000 to $49,999 income range is the most frequent in Howe, accounting for 65.0% of all households.
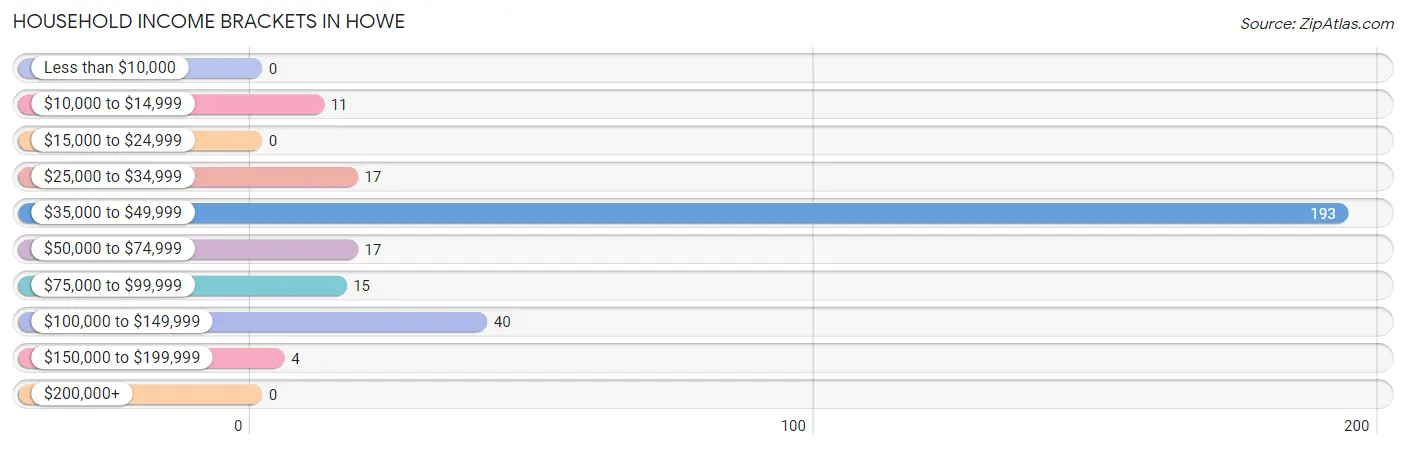
| Income Bracket | # Households | % Households |
| Less than $10,000 | 0 | 0.0% |
| $10,000 to $14,999 | 11 | 3.7% |
| $15,000 to $24,999 | 0 | 0.0% |
| $25,000 to $34,999 | 17 | 5.7% |
| $35,000 to $49,999 | 193 | 65.0% |
| $50,000 to $74,999 | 17 | 5.7% |
| $75,000 to $99,999 | 15 | 5.1% |
| $100,000 to $149,999 | 40 | 13.5% |
| $150,000 to $199,999 | 4 | 1.3% |
| $200,000+ | 0 | 0.0% |
Household Income by Householder Age in Howe
The median household income in Howe is $48,051, with the highest median household income of $48,441 found in the 65+ years age bracket for the primary householder. A total of 150 households (50.5%) fall into this category. Meanwhile, the 15 to 24 years age bracket for the primary householder has the lowest median household income of $0, with 40 households (13.5%) in this group.
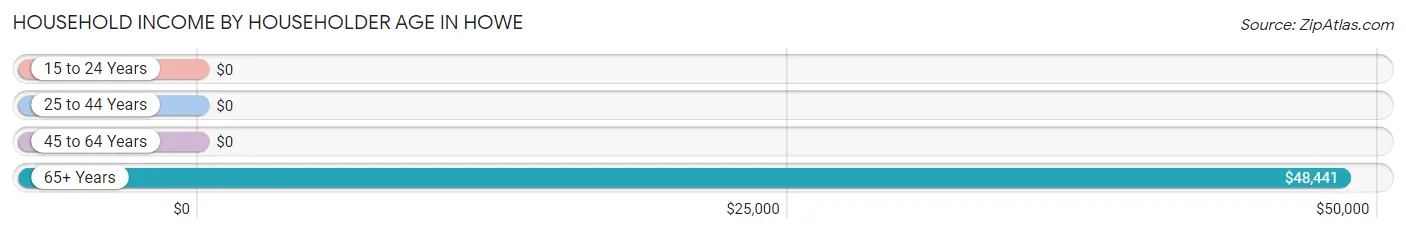
| Income Bracket | # Households | Median Income |
| 15 to 24 Years | 40 (13.5%) | $0 |
| 25 to 44 Years | 103 (34.7%) | $0 |
| 45 to 64 Years | 4 (1.3%) | $0 |
| 65+ Years | 150 (50.5%) | $48,441 |
| Total | 297 (100.0%) | $48,051 |
Poverty in Howe
Income Below Poverty by Sex and Age in Howe
With 3.0% poverty level for males and 3.3% for females among the residents of Howe, 65 to 74 year old males and 65 to 74 year old females are the most vulnerable to poverty, with 11 males (100.0%) and 11 females (9.4%) in their respective age groups living below the poverty level.
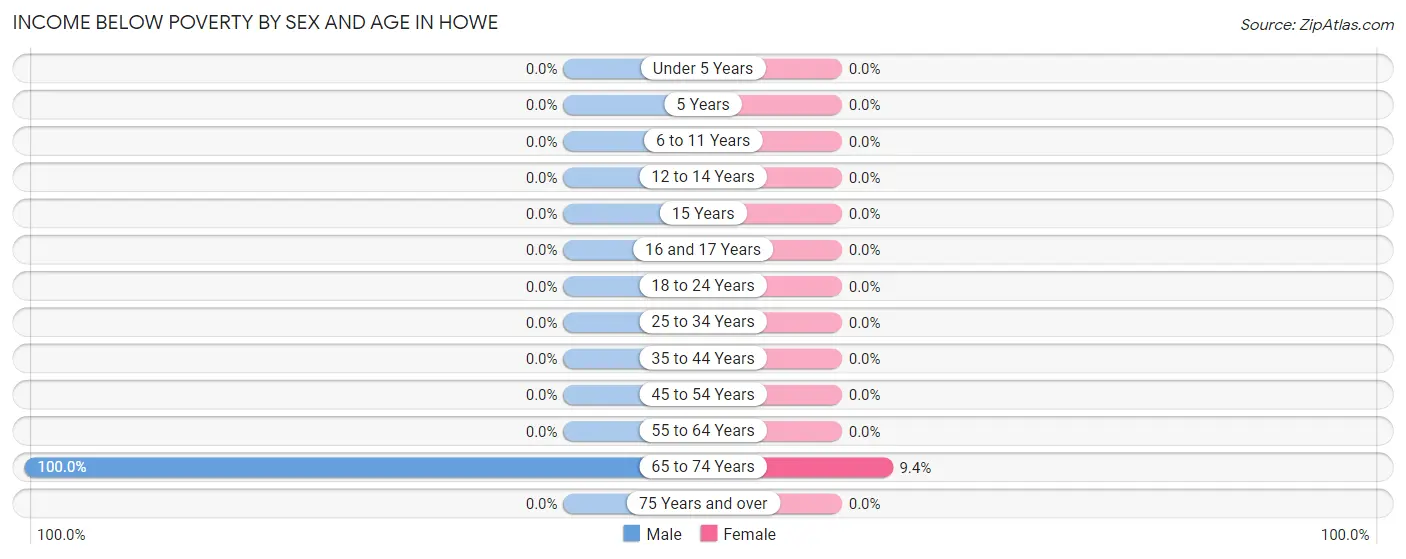
| Age Bracket | Male | Female |
| Under 5 Years | 0 (0.0%) | 0 (0.0%) |
| 5 Years | 0 (0.0%) | 0 (0.0%) |
| 6 to 11 Years | 0 (0.0%) | 0 (0.0%) |
| 12 to 14 Years | 0 (0.0%) | 0 (0.0%) |
| 15 Years | 0 (0.0%) | 0 (0.0%) |
| 16 and 17 Years | 0 (0.0%) | 0 (0.0%) |
| 18 to 24 Years | 0 (0.0%) | 0 (0.0%) |
| 25 to 34 Years | 0 (0.0%) | 0 (0.0%) |
| 35 to 44 Years | 0 (0.0%) | 0 (0.0%) |
| 45 to 54 Years | 0 (0.0%) | 0 (0.0%) |
| 55 to 64 Years | 0 (0.0%) | 0 (0.0%) |
| 65 to 74 Years | 11 (100.0%) | 11 (9.4%) |
| 75 Years and over | 0 (0.0%) | 0 (0.0%) |
| Total | 11 (3.0%) | 11 (3.3%) |
Income Above Poverty by Sex and Age in Howe
According to the poverty statistics in Howe, males aged under 5 years and females aged 18 to 24 years are the age groups that are most secure financially, with 100.0% of males and 100.0% of females in these age groups living above the poverty line.
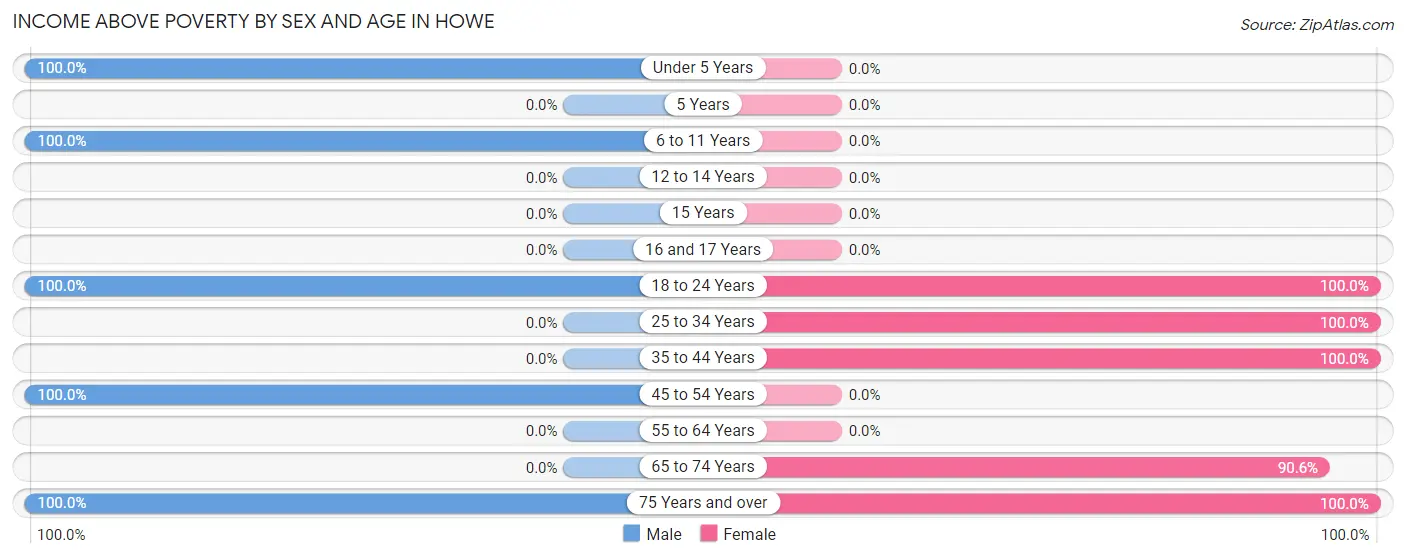
| Age Bracket | Male | Female |
| Under 5 Years | 143 (100.0%) | 0 (0.0%) |
| 5 Years | 0 (0.0%) | 0 (0.0%) |
| 6 to 11 Years | 12 (100.0%) | 0 (0.0%) |
| 12 to 14 Years | 0 (0.0%) | 0 (0.0%) |
| 15 Years | 0 (0.0%) | 0 (0.0%) |
| 16 and 17 Years | 0 (0.0%) | 0 (0.0%) |
| 18 to 24 Years | 59 (100.0%) | 77 (100.0%) |
| 25 to 34 Years | 0 (0.0%) | 93 (100.0%) |
| 35 to 44 Years | 0 (0.0%) | 15 (100.0%) |
| 45 to 54 Years | 129 (100.0%) | 0 (0.0%) |
| 55 to 64 Years | 0 (0.0%) | 0 (0.0%) |
| 65 to 74 Years | 0 (0.0%) | 106 (90.6%) |
| 75 Years and over | 12 (100.0%) | 35 (100.0%) |
| Total | 355 (97.0%) | 326 (96.7%) |
Income Below Poverty Among Married-Couple Families in Howe
The poverty statistics for married-couple families in Howe show that 17.5% or 11 of the total 63 families live below the poverty line. Families with no children have the highest poverty rate of 47.8%, comprising of 11 families. On the other hand, families with 1 or 2 children have the lowest poverty rate of 0.0%, which includes 0 families.
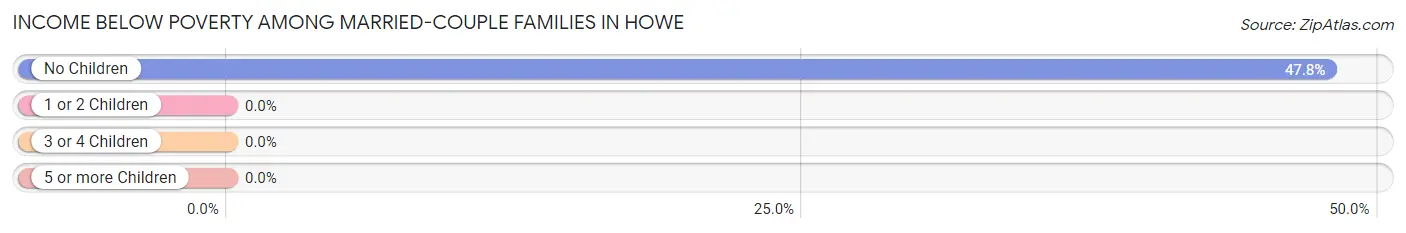
| Children | Above Poverty | Below Poverty |
| No Children | 12 (52.2%) | 11 (47.8%) |
| 1 or 2 Children | 40 (100.0%) | 0 (0.0%) |
| 3 or 4 Children | 0 (0.0%) | 0 (0.0%) |
| 5 or more Children | 0 (0.0%) | 0 (0.0%) |
| Total | 52 (82.5%) | 11 (17.5%) |
Income Below Poverty Among Single-Parent Households in Howe
| Children | Single Father | Single Mother |
| No Children | 0 (0.0%) | 0 (0.0%) |
| 1 or 2 Children | 0 (0.0%) | 0 (0.0%) |
| 3 or 4 Children | 0 (0.0%) | 0 (0.0%) |
| 5 or more Children | 0 (0.0%) | 0 (0.0%) |
| Total | 0 (0.0%) | 0 (0.0%) |
Income Below Poverty Among Married-Couple vs Single-Parent Households in Howe
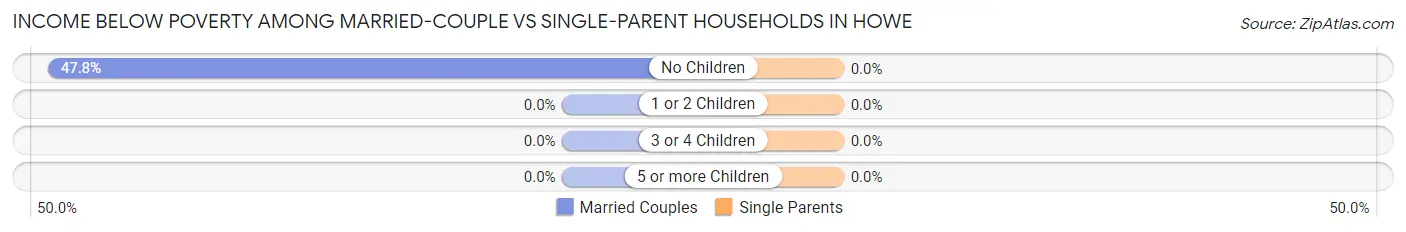
| Children | Married-Couple Families | Single-Parent Households |
| No Children | 11 (47.8%) | 0 (0.0%) |
| 1 or 2 Children | 0 (0.0%) | 0 (0.0%) |
| 3 or 4 Children | 0 (0.0%) | 0 (0.0%) |
| 5 or more Children | 0 (0.0%) | 0 (0.0%) |
| Total | 11 (17.5%) | 0 (0.0%) |
Race in Howe
The most populous races in Howe are White / Caucasian (744 | 92.6%), Two or more Races (32 | 4.0%), and Hispanic or Latino (28 | 3.5%).
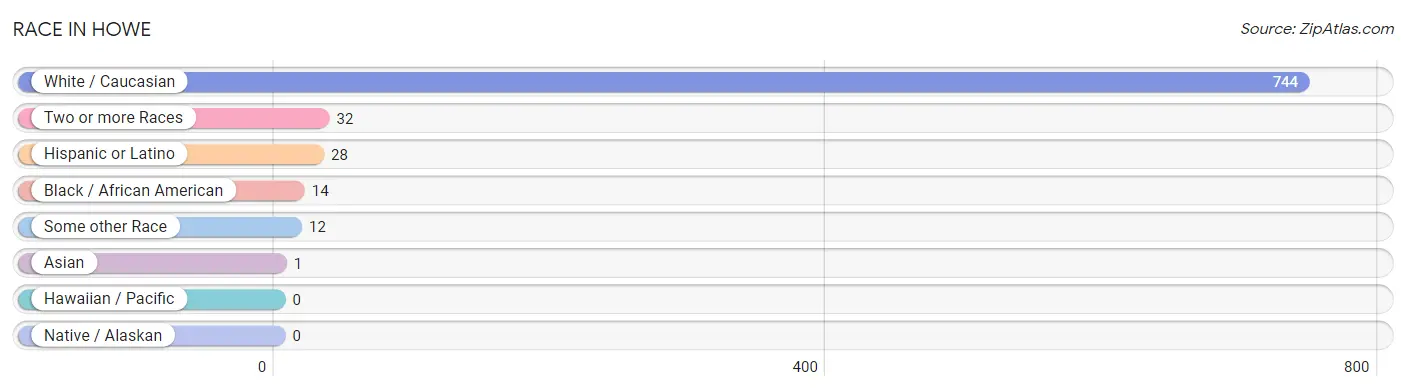
| Race | # Population | % Population |
| Asian | 1 | 0.1% |
| Black / African American | 14 | 1.7% |
| Hawaiian / Pacific | 0 | 0.0% |
| Hispanic or Latino | 28 | 3.5% |
| Native / Alaskan | 0 | 0.0% |
| White / Caucasian | 744 | 92.6% |
| Two or more Races | 32 | 4.0% |
| Some other Race | 12 | 1.5% |
| Total | 803 | 100.0% |
Ancestry in Howe
The most populous ancestries reported in Howe are English (248 | 30.9%), European (174 | 21.7%), German (91 | 11.3%), Irish (58 | 7.2%), and Mexican (28 | 3.5%), together accounting for 74.6% of all Howe residents.
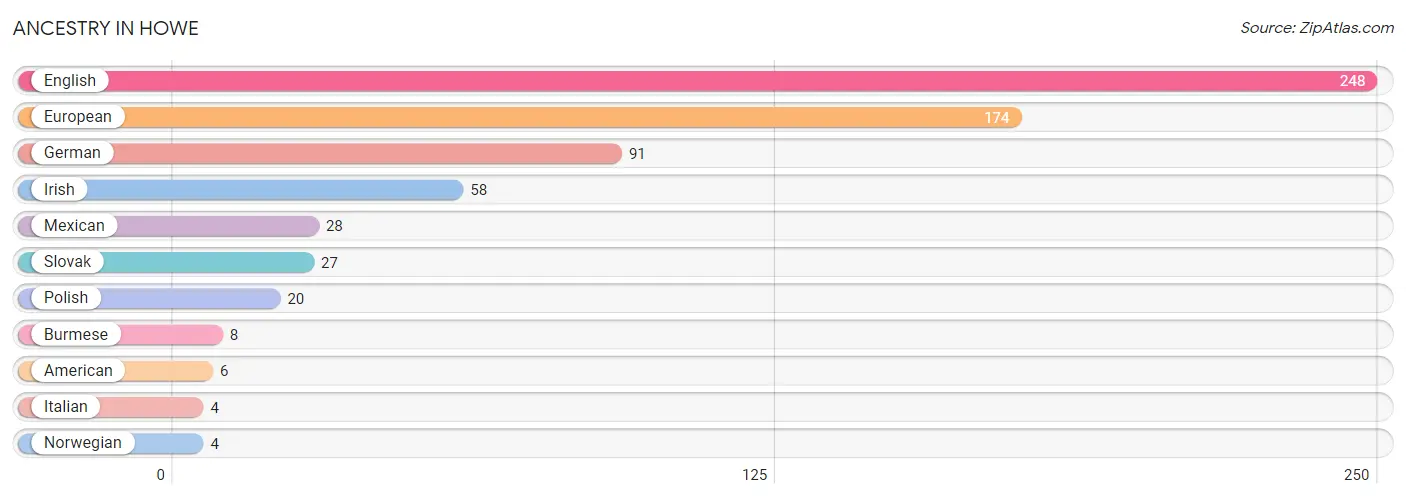
| Ancestry | # Population | % Population |
| American | 6 | 0.7% |
| Burmese | 8 | 1.0% |
| English | 248 | 30.9% |
| European | 174 | 21.7% |
| German | 91 | 11.3% |
| Irish | 58 | 7.2% |
| Italian | 4 | 0.5% |
| Mexican | 28 | 3.5% |
| Norwegian | 4 | 0.5% |
| Polish | 20 | 2.5% |
| Slovak | 27 | 3.4% | View All 11 Rows |
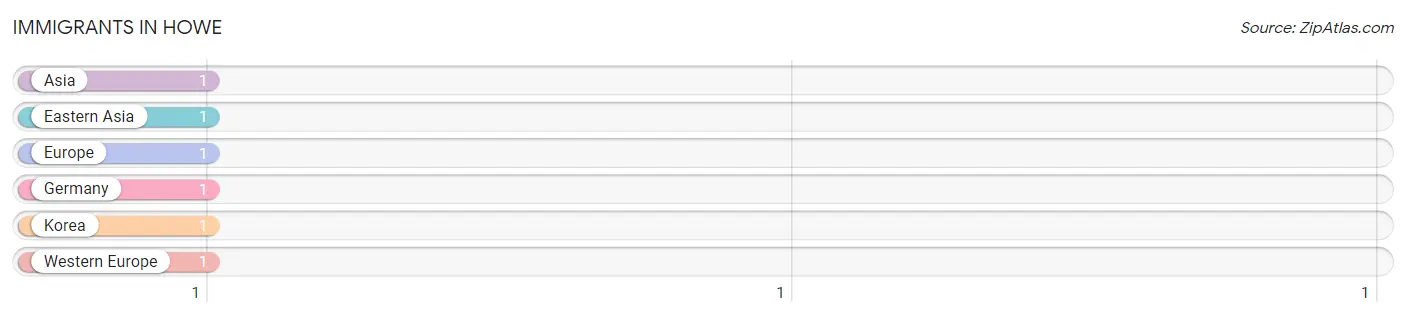
Immigrants in Howe
The most numerous immigrant groups reported in Howe came from Asia (1 | 0.1%), Eastern Asia (1 | 0.1%), Europe (1 | 0.1%), Germany (1 | 0.1%), and Korea (1 | 0.1%), together accounting for 0.6% of all Howe residents.
| Immigration Origin | # Population | % Population |
| Asia | 1 | 0.1% |
| Eastern Asia | 1 | 0.1% |
| Europe | 1 | 0.1% |
| Germany | 1 | 0.1% |
| Korea | 1 | 0.1% |
| Western Europe | 1 | 0.1% | View All 6 Rows |
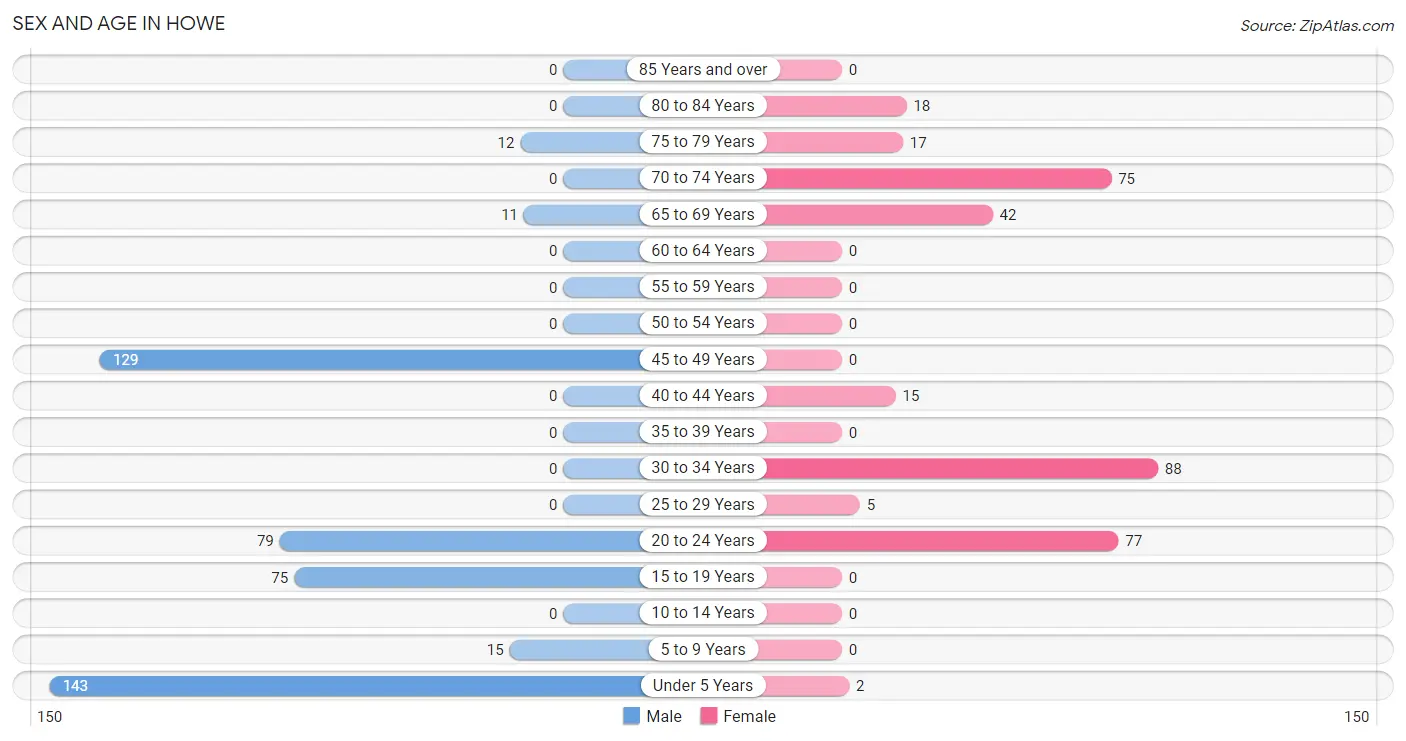
Sex and Age in Howe
Sex and Age in Howe
The most populous age groups in Howe are Under 5 Years (143 | 30.8%) for men and 30 to 34 Years (88 | 26.0%) for women.
| Age Bracket | Male | Female |
| Under 5 Years | 143 (30.8%) | 2 (0.6%) |
| 5 to 9 Years | 15 (3.2%) | 0 (0.0%) |
| 10 to 14 Years | 0 (0.0%) | 0 (0.0%) |
| 15 to 19 Years | 75 (16.2%) | 0 (0.0%) |
| 20 to 24 Years | 79 (17.0%) | 77 (22.7%) |
| 25 to 29 Years | 0 (0.0%) | 5 (1.5%) |
| 30 to 34 Years | 0 (0.0%) | 88 (26.0%) |
| 35 to 39 Years | 0 (0.0%) | 0 (0.0%) |
| 40 to 44 Years | 0 (0.0%) | 15 (4.4%) |
| 45 to 49 Years | 129 (27.8%) | 0 (0.0%) |
| 50 to 54 Years | 0 (0.0%) | 0 (0.0%) |
| 55 to 59 Years | 0 (0.0%) | 0 (0.0%) |
| 60 to 64 Years | 0 (0.0%) | 0 (0.0%) |
| 65 to 69 Years | 11 (2.4%) | 42 (12.4%) |
| 70 to 74 Years | 0 (0.0%) | 75 (22.1%) |
| 75 to 79 Years | 12 (2.6%) | 17 (5.0%) |
| 80 to 84 Years | 0 (0.0%) | 18 (5.3%) |
| 85 Years and over | 0 (0.0%) | 0 (0.0%) |
| Total | 464 (100.0%) | 339 (100.0%) |
Families and Households in Howe
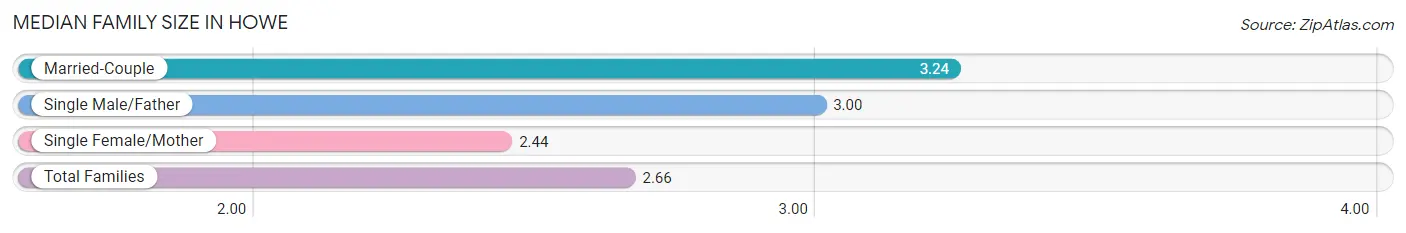
Median Family Size in Howe
The median family size in Howe is 2.66 persons per family, with married-couple families (63 | 25.7%) accounting for the largest median family size of 3.24 persons per family. On the other hand, single female/mother families (178 | 72.7%) represent the smallest median family size with 2.44 persons per family.
| Family Type | # Families | Family Size |
| Married-Couple | 63 (25.7%) | 3.24 |
| Single Male/Father | 4 (1.6%) | 3.00 |
| Single Female/Mother | 178 (72.7%) | 2.44 |
| Total Families | 245 (100.0%) | 2.66 |
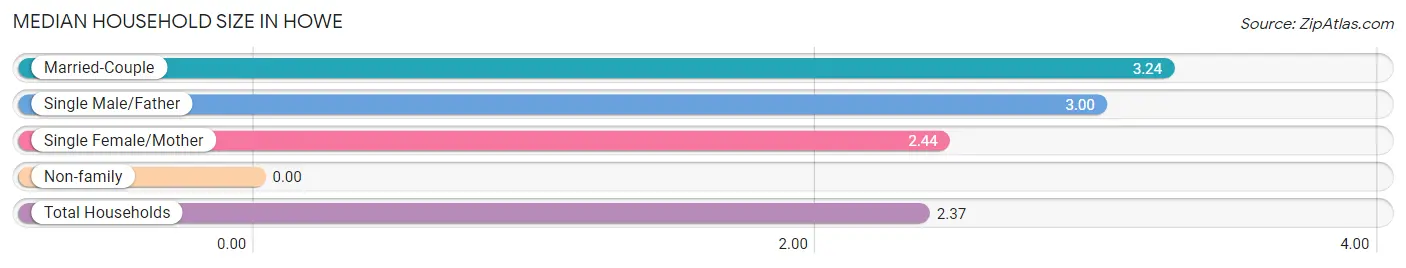
Median Household Size in Howe
| Household Type | # Households | Household Size |
| Married-Couple | 63 (21.2%) | 3.24 |
| Single Male/Father | 4 (1.3%) | 3.00 |
| Single Female/Mother | 178 (59.9%) | 2.44 |
| Non-family | 52 (17.5%) | - |
| Total Households | 297 (100.0%) | 2.37 |
Household Size by Marriage Status in Howe
Out of a total of 297 households in Howe, 245 (82.5%) are family households, while 52 (17.5%) are nonfamily households. The most numerous type of family households are 2-person households, comprising 186, and the most common type of nonfamily households are 1-person households, comprising 52.
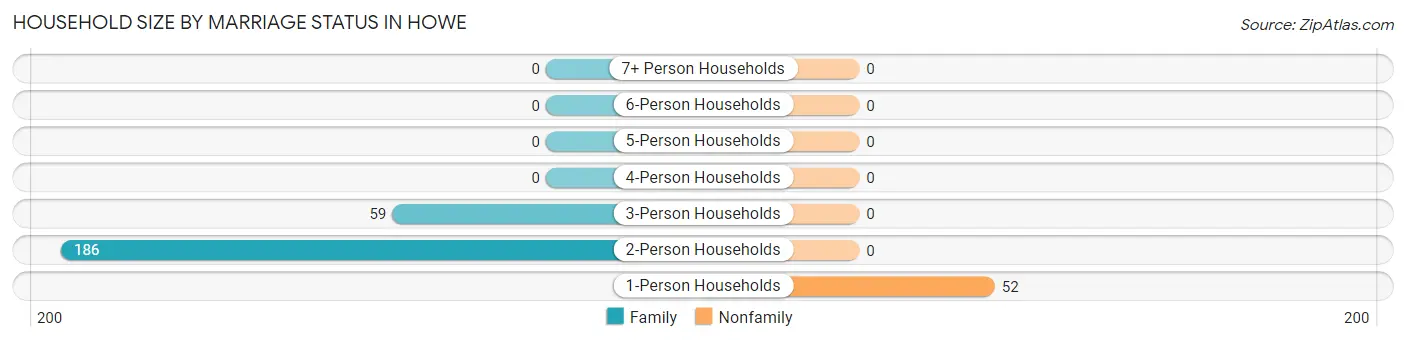
| Household Size | Family Households | Nonfamily Households |
| 1-Person Households | - | 52 (17.5%) |
| 2-Person Households | 186 (62.6%) | 0 (0.0%) |
| 3-Person Households | 59 (19.9%) | 0 (0.0%) |
| 4-Person Households | 0 (0.0%) | 0 (0.0%) |
| 5-Person Households | 0 (0.0%) | 0 (0.0%) |
| 6-Person Households | 0 (0.0%) | 0 (0.0%) |
| 7+ Person Households | 0 (0.0%) | 0 (0.0%) |
| Total | 245 (82.5%) | 52 (17.5%) |
Female Fertility in Howe
Fertility by Age in Howe
Average fertility rate in Howe is 27.0 births per 1,000 women. Women in the age bracket of 20 to 34 years have the highest fertility rate with 29.0 births per 1,000 women. Women in the age bracket of 20 to 34 years acount for 100.0% of all women with births.
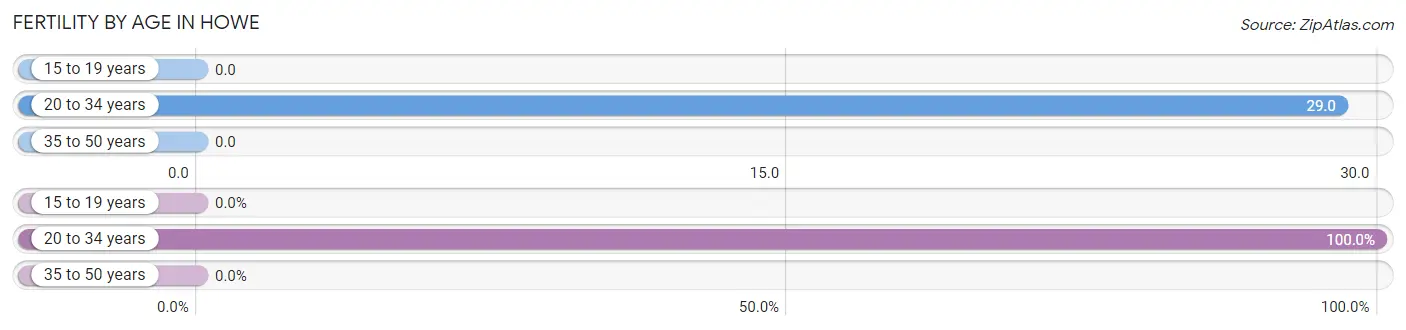
| Age Bracket | Women with Births | Births / 1,000 Women |
| 15 to 19 years | 0 (0.0%) | 0.0 |
| 20 to 34 years | 5 (100.0%) | 29.0 |
| 35 to 50 years | 0 (0.0%) | 0.0 |
| Total | 5 (100.0%) | 27.0 |
Fertility by Age by Marriage Status in Howe
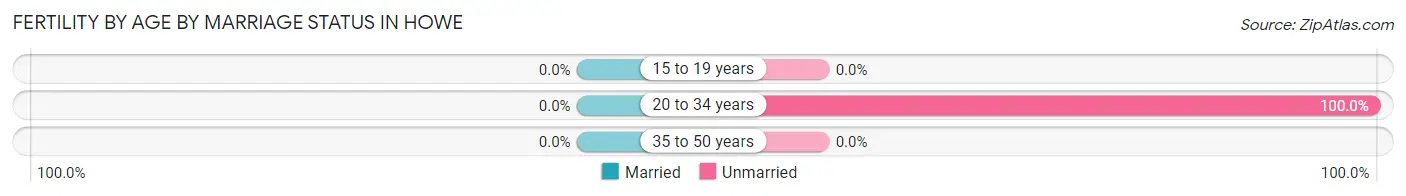
| Age Bracket | Married | Unmarried |
| 15 to 19 years | 0 (0.0%) | 0 (0.0%) |
| 20 to 34 years | 0 (0.0%) | 5 (100.0%) |
| 35 to 50 years | 0 (0.0%) | 0 (0.0%) |
| Total | 0 (0.0%) | 5 (100.0%) |
Fertility by Education in Howe
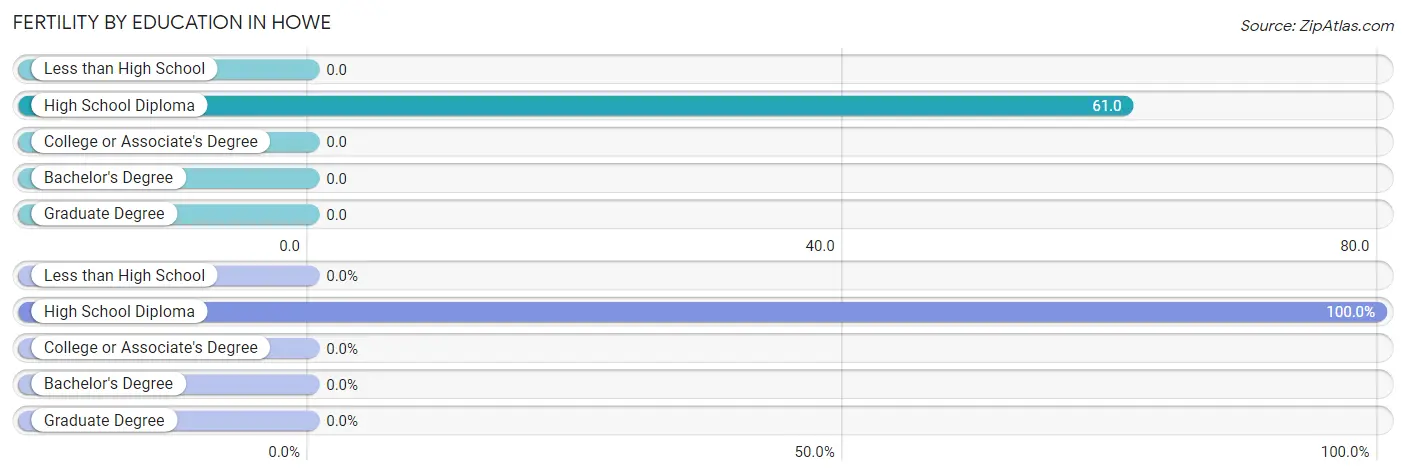
| Educational Attainment | Women with Births | Births / 1,000 Women |
| Less than High School | 0 (0.0%) | 0.0 |
| High School Diploma | 5 (100.0%) | 61.0 |
| College or Associate's Degree | 0 (0.0%) | 0.0 |
| Bachelor's Degree | 0 (0.0%) | 0.0 |
| Graduate Degree | 0 (0.0%) | 0.0 |
| Total | 5 (100.0%) | 27.0 |
Fertility by Education by Marriage Status in Howe
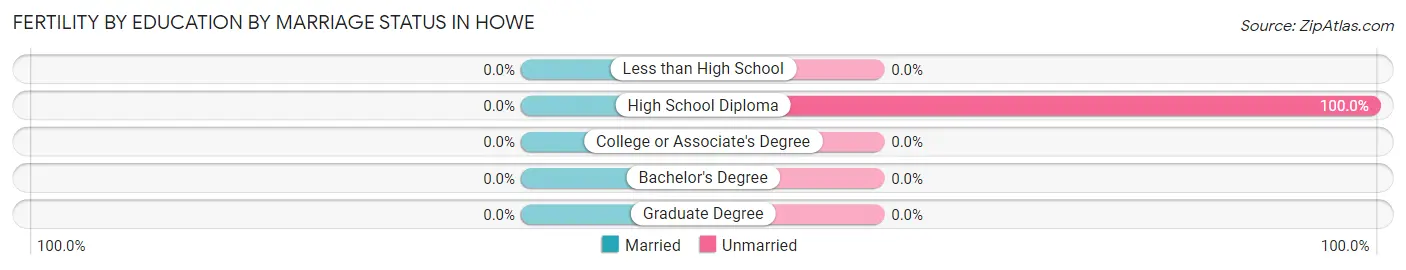
| Educational Attainment | Married | Unmarried |
| Less than High School | 0 (0.0%) | 0 (0.0%) |
| High School Diploma | 0 (0.0%) | 5 (100.0%) |
| College or Associate's Degree | 0 (0.0%) | 0 (0.0%) |
| Bachelor's Degree | 0 (0.0%) | 0 (0.0%) |
| Graduate Degree | 0 (0.0%) | 0 (0.0%) |
| Total | 0 (0.0%) | 5 (100.0%) |
Employment Characteristics in Howe
Employment by Class of Employer in Howe
Among the 412 employed individuals in Howe, private company employees (317 | 76.9%), self-employed (not incorporated) (75 | 18.2%), and not-for-profit organizations (15 | 3.6%) make up the most common classes of employment.
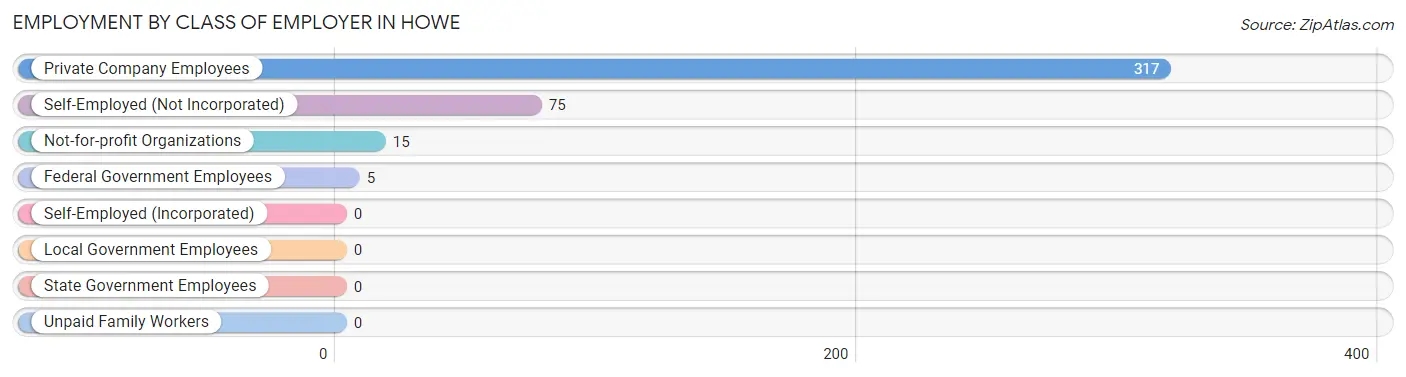
| Employer Class | # Employees | % Employees |
| Private Company Employees | 317 | 76.9% |
| Self-Employed (Incorporated) | 0 | 0.0% |
| Self-Employed (Not Incorporated) | 75 | 18.2% |
| Not-for-profit Organizations | 15 | 3.6% |
| Local Government Employees | 0 | 0.0% |
| State Government Employees | 0 | 0.0% |
| Federal Government Employees | 5 | 1.2% |
| Unpaid Family Workers | 0 | 0.0% |
| Total | 412 | 100.0% |
Employment Status by Age in Howe
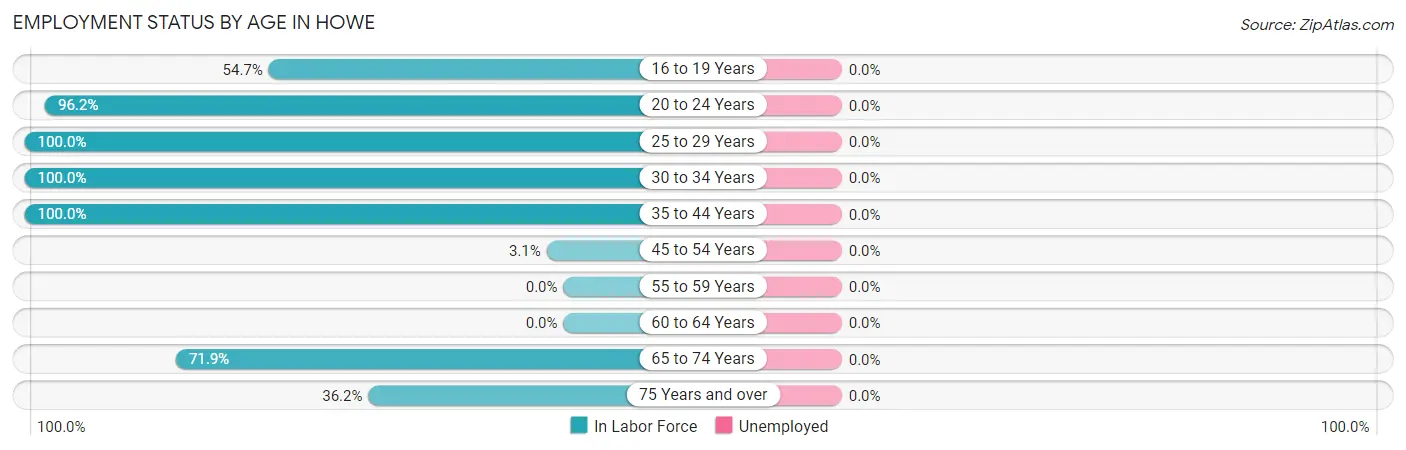
| Age Bracket | In Labor Force | Unemployed |
| 16 to 19 Years | 41 (54.7%) | 0 (0.0%) |
| 20 to 24 Years | 150 (96.2%) | 0 (0.0%) |
| 25 to 29 Years | 5 (100.0%) | 0 (0.0%) |
| 30 to 34 Years | 88 (100.0%) | 0 (0.0%) |
| 35 to 44 Years | 15 (100.0%) | 0 (0.0%) |
| 45 to 54 Years | 4 (3.1%) | 0 (0.0%) |
| 55 to 59 Years | 0 (0.0%) | 0 (0.0%) |
| 60 to 64 Years | 0 (0.0%) | 0 (0.0%) |
| 65 to 74 Years | 92 (71.9%) | 0 (0.0%) |
| 75 Years and over | 17 (36.2%) | 0 (0.0%) |
| Total | 412 (64.1%) | 0 (0.0%) |
Employment Status by Educational Attainment in Howe
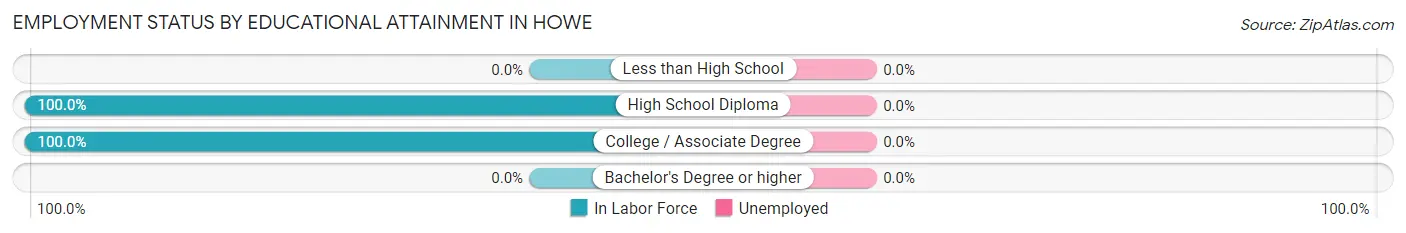
| Educational Attainment | In Labor Force | Unemployed |
| Less than High School | 0 (0.0%) | 0 (0.0%) |
| High School Diploma | 9 (100.0%) | 0 (0.0%) |
| College / Associate Degree | 103 (100.0%) | 0 (0.0%) |
| Bachelor's Degree or higher | 0 (0.0%) | 0 (0.0%) |
| Total | 112 (47.3%) | 0 (0.0%) |
Employment Occupations by Sex in Howe
Management, Business, Science and Arts Occupations
The most common Management, Business, Science and Arts occupations in Howe are , and Management (16 | 3.9%).
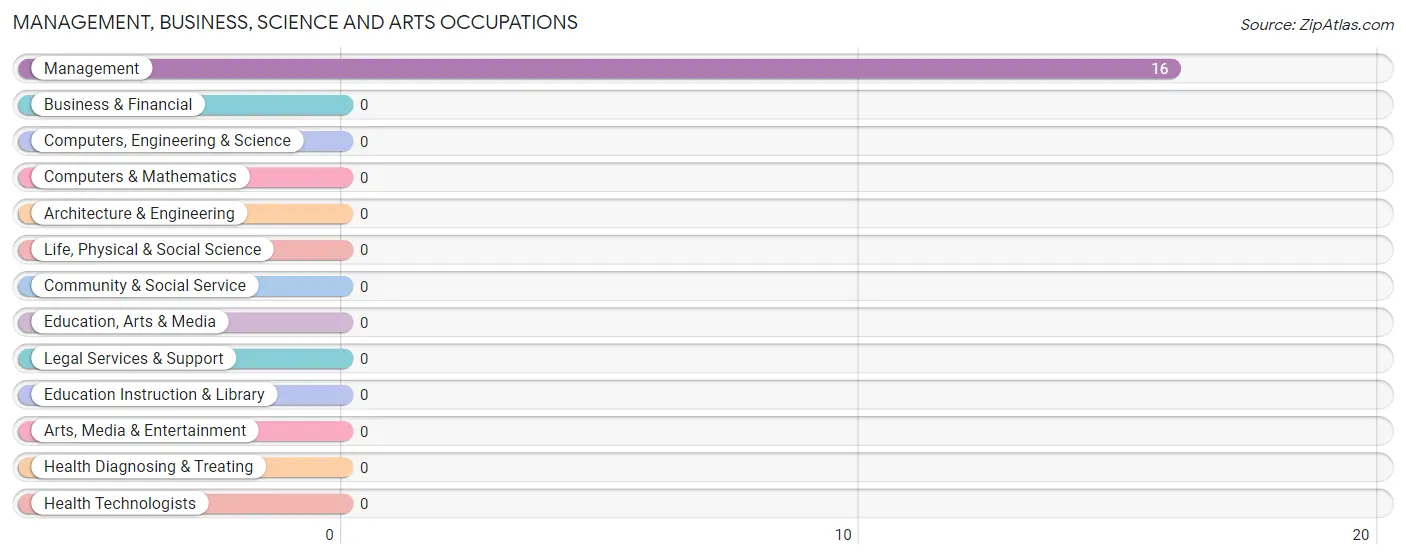
Management, Business, Science and Arts Occupations by Sex
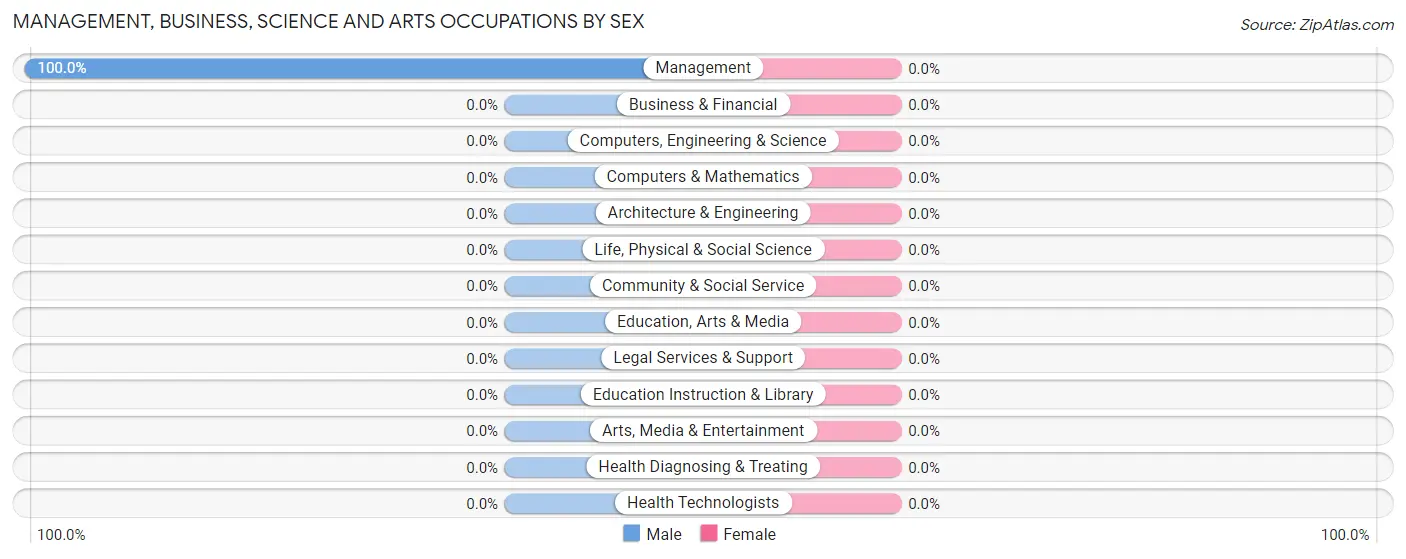
| Occupation | Male | Female |
| Management | 16 (100.0%) | 0 (0.0%) |
| Business & Financial | 0 (0.0%) | 0 (0.0%) |
| Computers, Engineering & Science | 0 (0.0%) | 0 (0.0%) |
| Computers & Mathematics | 0 (0.0%) | 0 (0.0%) |
| Architecture & Engineering | 0 (0.0%) | 0 (0.0%) |
| Life, Physical & Social Science | 0 (0.0%) | 0 (0.0%) |
| Community & Social Service | 0 (0.0%) | 0 (0.0%) |
| Education, Arts & Media | 0 (0.0%) | 0 (0.0%) |
| Legal Services & Support | 0 (0.0%) | 0 (0.0%) |
| Education Instruction & Library | 0 (0.0%) | 0 (0.0%) |
| Arts, Media & Entertainment | 0 (0.0%) | 0 (0.0%) |
| Health Diagnosing & Treating | 0 (0.0%) | 0 (0.0%) |
| Health Technologists | 0 (0.0%) | 0 (0.0%) |
| Total (Category) | 16 (100.0%) | 0 (0.0%) |
| Total (Overall) | 118 (28.6%) | 294 (71.4%) |
Services Occupations
The most common Services occupations in Howe are Personal Care & Service (75 | 18.2%), Food Preparation & Serving (26 | 6.3%), and Healthcare Support (15 | 3.6%).
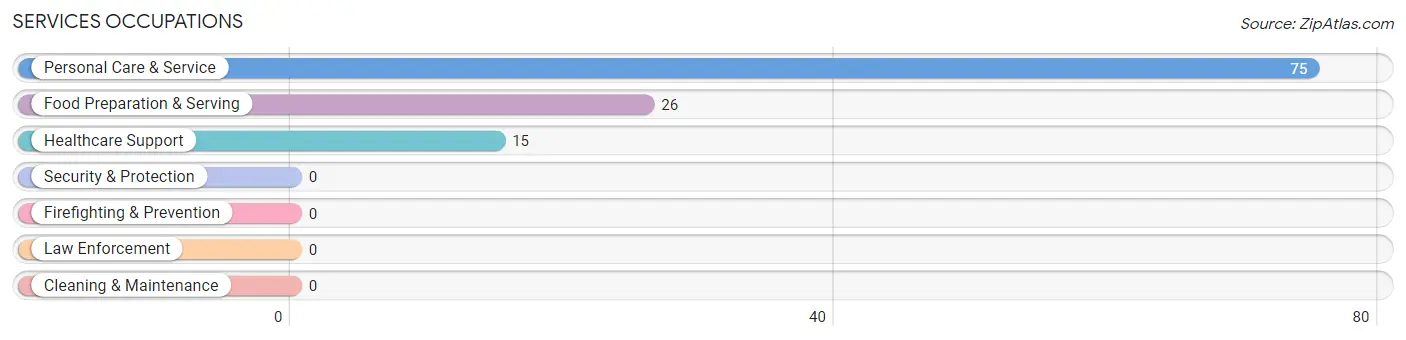
Services Occupations by Sex
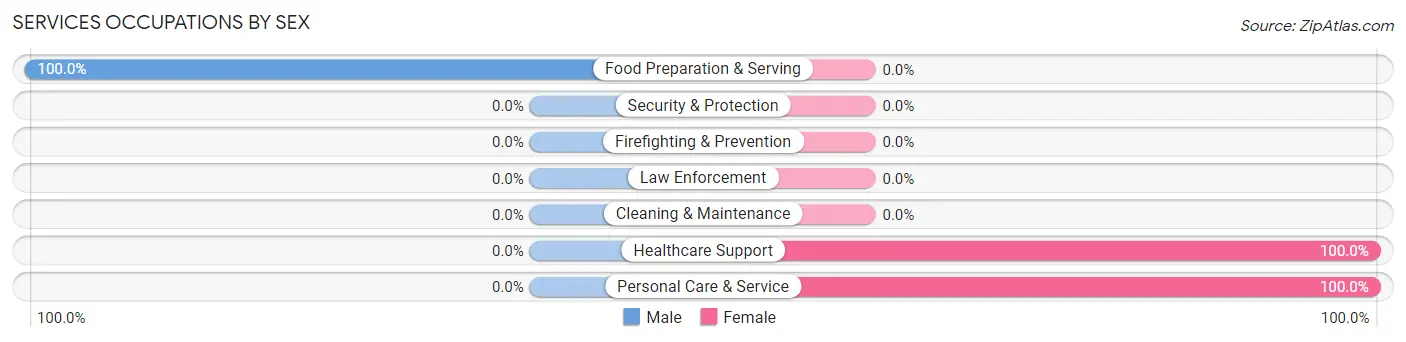
| Occupation | Male | Female |
| Healthcare Support | 0 (0.0%) | 15 (100.0%) |
| Security & Protection | 0 (0.0%) | 0 (0.0%) |
| Firefighting & Prevention | 0 (0.0%) | 0 (0.0%) |
| Law Enforcement | 0 (0.0%) | 0 (0.0%) |
| Food Preparation & Serving | 26 (100.0%) | 0 (0.0%) |
| Cleaning & Maintenance | 0 (0.0%) | 0 (0.0%) |
| Personal Care & Service | 0 (0.0%) | 75 (100.0%) |
| Total (Category) | 26 (22.4%) | 90 (77.6%) |
| Total (Overall) | 118 (28.6%) | 294 (71.4%) |
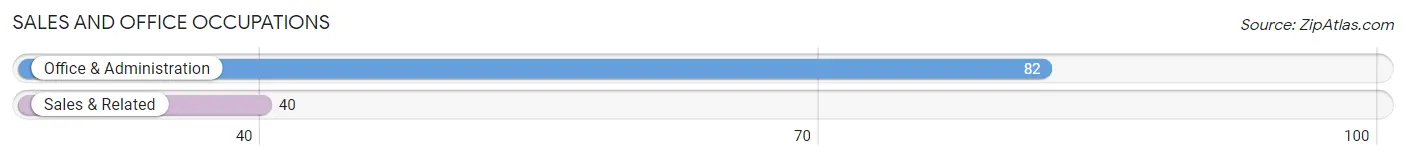
Sales and Office Occupations
The most common Sales and Office occupations in Howe are Office & Administration (82 | 19.9%), and Sales & Related (40 | 9.7%).
Sales and Office Occupations by Sex
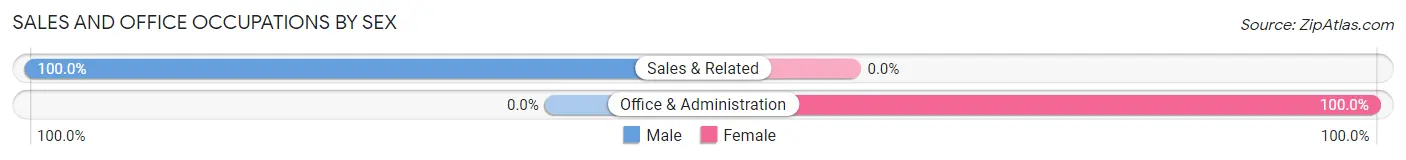
| Occupation | Male | Female |
| Sales & Related | 40 (100.0%) | 0 (0.0%) |
| Office & Administration | 0 (0.0%) | 82 (100.0%) |
| Total (Category) | 40 (32.8%) | 82 (67.2%) |
| Total (Overall) | 118 (28.6%) | 294 (71.4%) |
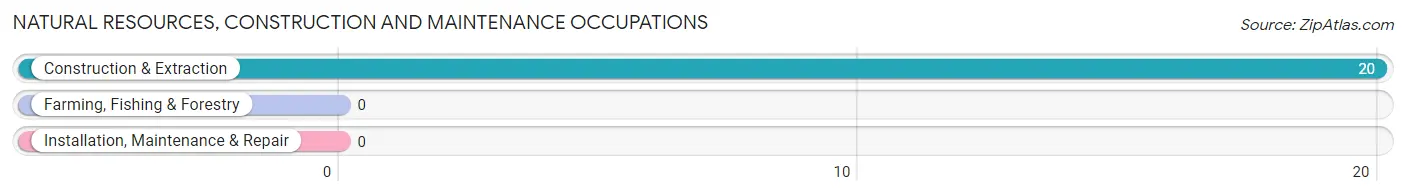
Natural Resources, Construction and Maintenance Occupations
The most common Natural Resources, Construction and Maintenance occupations in Howe are , and Construction & Extraction (20 | 4.9%).
Natural Resources, Construction and Maintenance Occupations by Sex
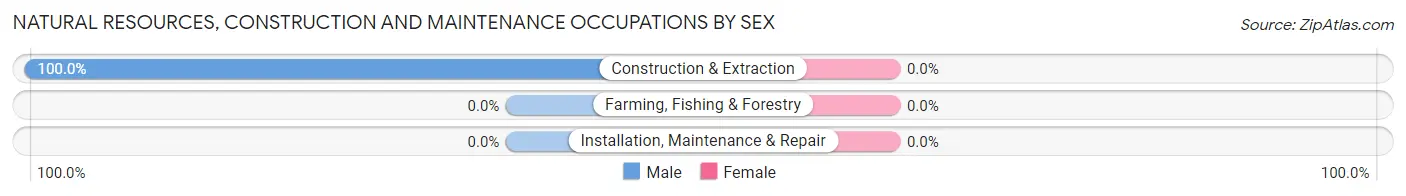
| Occupation | Male | Female |
| Farming, Fishing & Forestry | 0 (0.0%) | 0 (0.0%) |
| Construction & Extraction | 20 (100.0%) | 0 (0.0%) |
| Installation, Maintenance & Repair | 0 (0.0%) | 0 (0.0%) |
| Total (Category) | 20 (100.0%) | 0 (0.0%) |
| Total (Overall) | 118 (28.6%) | 294 (71.4%) |
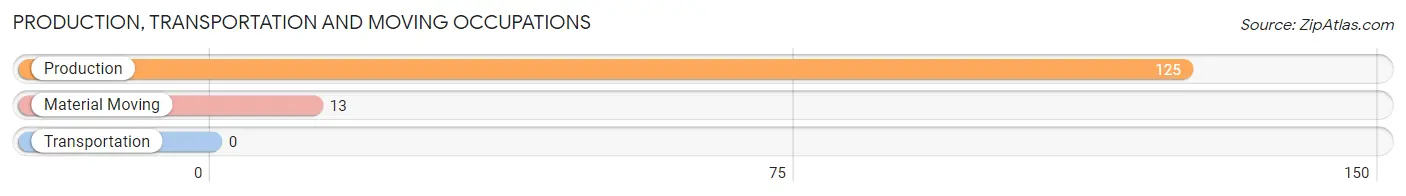
Production, Transportation and Moving Occupations
The most common Production, Transportation and Moving occupations in Howe are Production (125 | 30.3%), and Material Moving (13 | 3.2%).
Production, Transportation and Moving Occupations by Sex
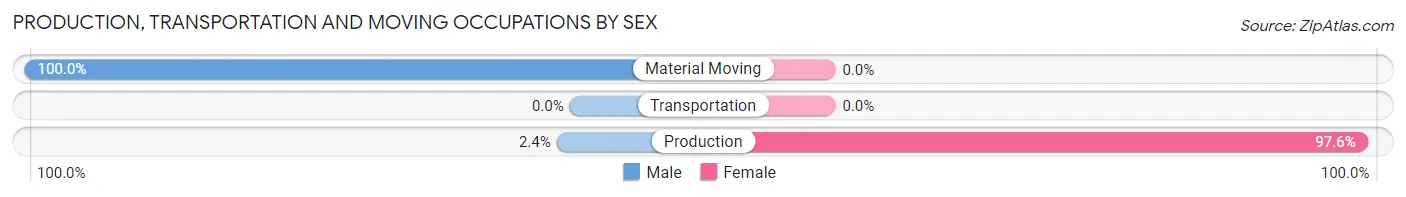
| Occupation | Male | Female |
| Production | 3 (2.4%) | 122 (97.6%) |
| Transportation | 0 (0.0%) | 0 (0.0%) |
| Material Moving | 13 (100.0%) | 0 (0.0%) |
| Total (Category) | 16 (11.6%) | 122 (88.4%) |
| Total (Overall) | 118 (28.6%) | 294 (71.4%) |
Employment Industries by Sex in Howe
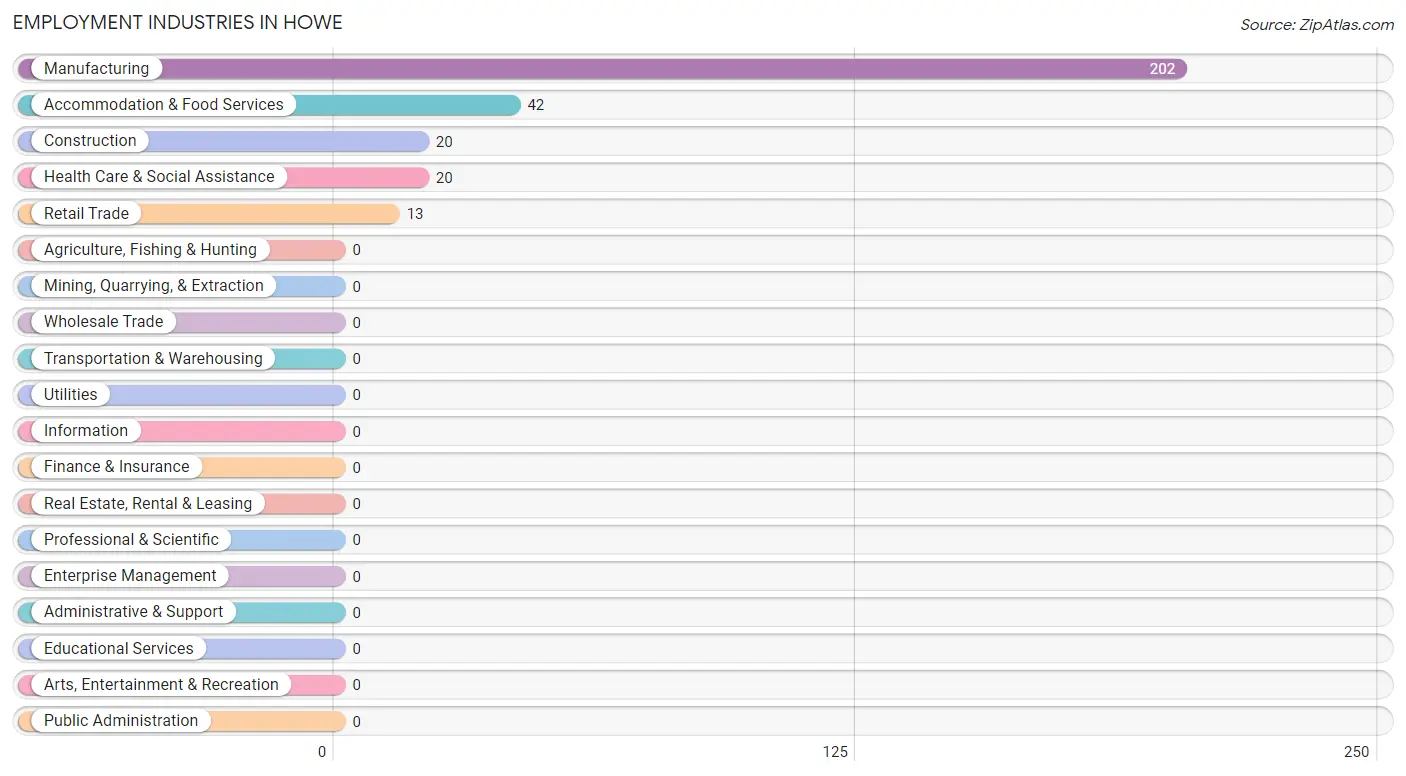
Employment Industries in Howe
The major employment industries in Howe include Manufacturing (202 | 49.0%), Accommodation & Food Services (42 | 10.2%), Construction (20 | 4.9%), Health Care & Social Assistance (20 | 4.9%), and Retail Trade (13 | 3.2%).
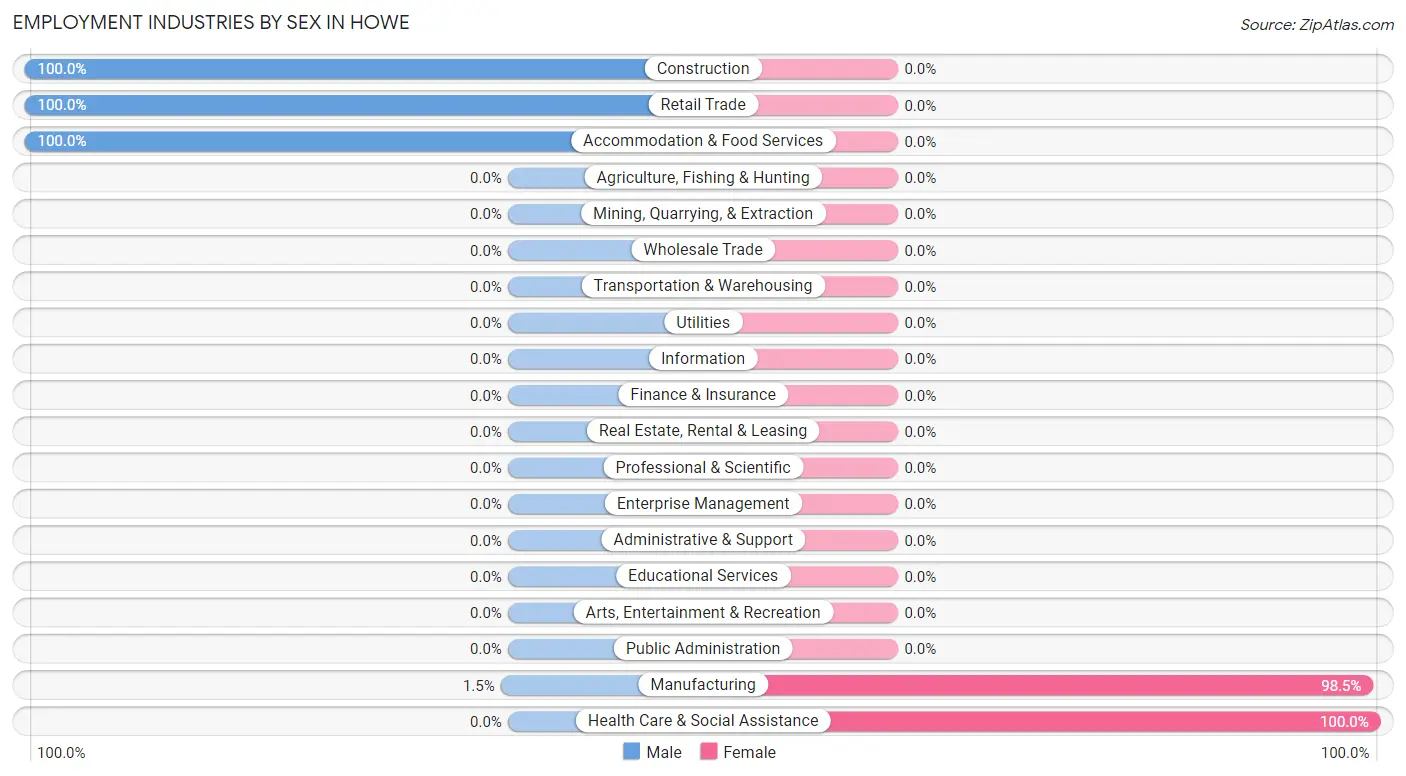
Employment Industries by Sex in Howe
The Howe industries that see more men than women are Construction (100.0%), Retail Trade (100.0%), and Accommodation & Food Services (100.0%), whereas the industries that tend to have a higher number of women are Health Care & Social Assistance (100.0%), and Manufacturing (98.5%).
| Industry | Male | Female |
| Agriculture, Fishing & Hunting | 0 (0.0%) | 0 (0.0%) |
| Mining, Quarrying, & Extraction | 0 (0.0%) | 0 (0.0%) |
| Construction | 20 (100.0%) | 0 (0.0%) |
| Manufacturing | 3 (1.5%) | 199 (98.5%) |
| Wholesale Trade | 0 (0.0%) | 0 (0.0%) |
| Retail Trade | 13 (100.0%) | 0 (0.0%) |
| Transportation & Warehousing | 0 (0.0%) | 0 (0.0%) |
| Utilities | 0 (0.0%) | 0 (0.0%) |
| Information | 0 (0.0%) | 0 (0.0%) |
| Finance & Insurance | 0 (0.0%) | 0 (0.0%) |
| Real Estate, Rental & Leasing | 0 (0.0%) | 0 (0.0%) |
| Professional & Scientific | 0 (0.0%) | 0 (0.0%) |
| Enterprise Management | 0 (0.0%) | 0 (0.0%) |
| Administrative & Support | 0 (0.0%) | 0 (0.0%) |
| Educational Services | 0 (0.0%) | 0 (0.0%) |
| Health Care & Social Assistance | 0 (0.0%) | 20 (100.0%) |
| Arts, Entertainment & Recreation | 0 (0.0%) | 0 (0.0%) |
| Accommodation & Food Services | 42 (100.0%) | 0 (0.0%) |
| Public Administration | 0 (0.0%) | 0 (0.0%) |
| Total | 118 (28.6%) | 294 (71.4%) |
Education in Howe
School Enrollment in Howe
The most common levels of schooling among the 114 students in Howe are college / undergraduate (100 | 87.7%), elementary school (13 | 11.4%), and nursery / preschool (1 | 0.9%).
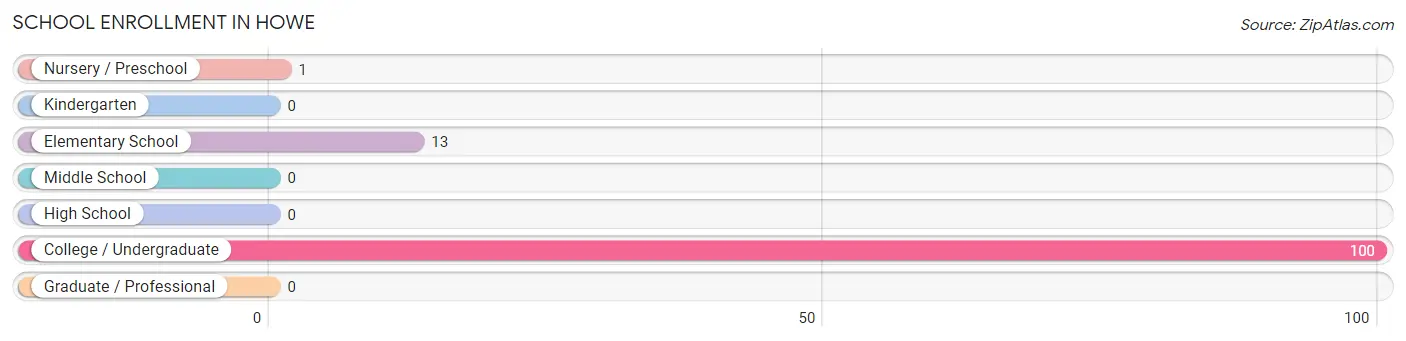
| School Level | # Students | % Students |
| Nursery / Preschool | 1 | 0.9% |
| Kindergarten | 0 | 0.0% |
| Elementary School | 13 | 11.4% |
| Middle School | 0 | 0.0% |
| High School | 0 | 0.0% |
| College / Undergraduate | 100 | 87.7% |
| Graduate / Professional | 0 | 0.0% |
| Total | 114 | 100.0% |
School Enrollment by Age by Funding Source in Howe
Out of a total of 114 students who are enrolled in schools in Howe, 65 (57.0%) attend a private institution, while the remaining 49 (43.0%) are enrolled in public schools. The age group of 15 to 17 year olds has the highest likelihood of being enrolled in private schools, with 16 (100.0% in the age bracket) enrolled. Conversely, the age group of 25 to 34 year olds has the lowest likelihood of being enrolled in a private school, with 5 (100.0% in the age bracket) attending a public institution.
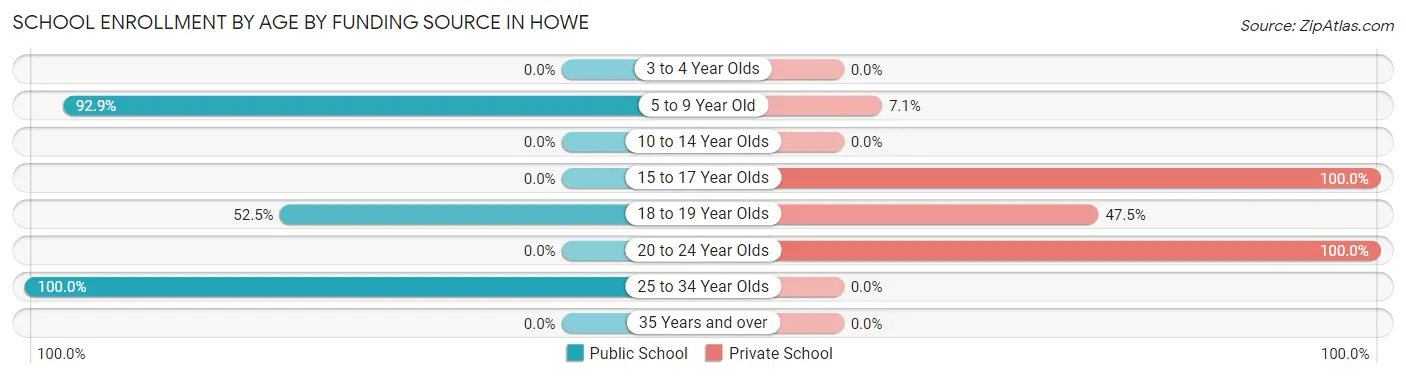
| Age Bracket | Public School | Private School |
| 3 to 4 Year Olds | 0 (0.0%) | 0 (0.0%) |
| 5 to 9 Year Old | 13 (92.9%) | 1 (7.1%) |
| 10 to 14 Year Olds | 0 (0.0%) | 0 (0.0%) |
| 15 to 17 Year Olds | 0 (0.0%) | 16 (100.0%) |
| 18 to 19 Year Olds | 31 (52.5%) | 28 (47.5%) |
| 20 to 24 Year Olds | 0 (0.0%) | 20 (100.0%) |
| 25 to 34 Year Olds | 5 (100.0%) | 0 (0.0%) |
| 35 Years and over | 0 (0.0%) | 0 (0.0%) |
| Total | 49 (43.0%) | 65 (57.0%) |
Educational Attainment by Field of Study in Howe
, and education (125 | 100.0%) are the most common fields of study among 125 individuals in Howe who have obtained a bachelor's degree or higher.
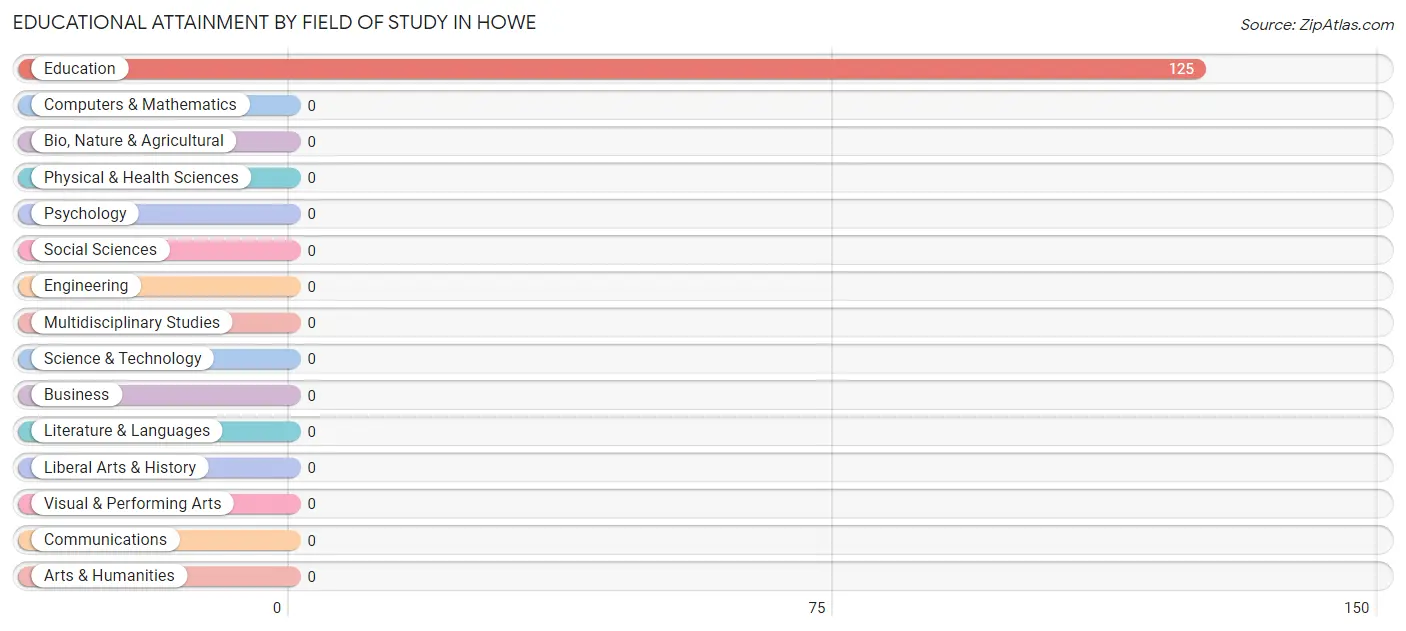
| Field of Study | # Graduates | % Graduates |
| Computers & Mathematics | 0 | 0.0% |
| Bio, Nature & Agricultural | 0 | 0.0% |
| Physical & Health Sciences | 0 | 0.0% |
| Psychology | 0 | 0.0% |
| Social Sciences | 0 | 0.0% |
| Engineering | 0 | 0.0% |
| Multidisciplinary Studies | 0 | 0.0% |
| Science & Technology | 0 | 0.0% |
| Business | 0 | 0.0% |
| Education | 125 | 100.0% |
| Literature & Languages | 0 | 0.0% |
| Liberal Arts & History | 0 | 0.0% |
| Visual & Performing Arts | 0 | 0.0% |
| Communications | 0 | 0.0% |
| Arts & Humanities | 0 | 0.0% |
| Total | 125 | 100.0% |
Transportation & Commute in Howe
Vehicle Availability by Sex in Howe
The most prevalent vehicle ownership categories in Howe are males with 2 vehicles (56, accounting for 88.9%) and females with 2 vehicles (92, making up 19.1%).
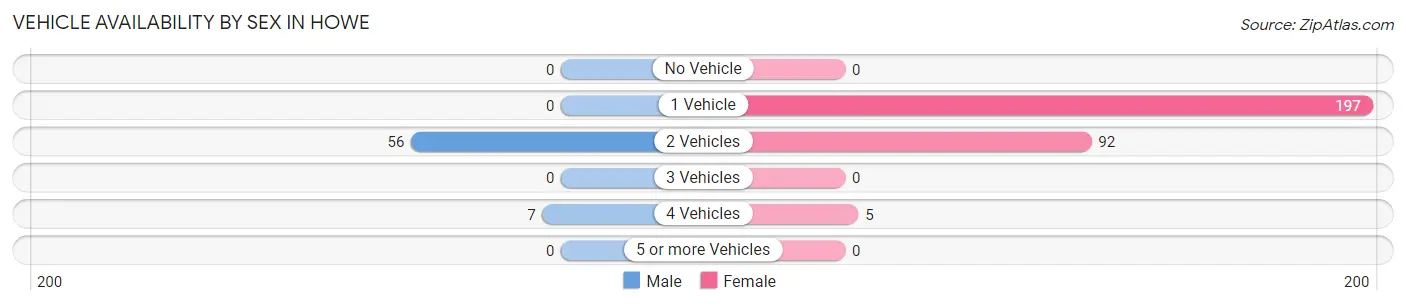
| Vehicles Available | Male | Female |
| No Vehicle | 0 (0.0%) | 0 (0.0%) |
| 1 Vehicle | 0 (0.0%) | 197 (67.0%) |
| 2 Vehicles | 56 (88.9%) | 92 (31.3%) |
| 3 Vehicles | 0 (0.0%) | 0 (0.0%) |
| 4 Vehicles | 7 (11.1%) | 5 (1.7%) |
| 5 or more Vehicles | 0 (0.0%) | 0 (0.0%) |
| Total | 63 (100.0%) | 294 (100.0%) |
Commute Time in Howe
The most frequently occuring commute durations in Howe are 20 to 24 minutes (88 commuters, 26.1%), 40 to 44 minutes (77 commuters, 22.9%), and 25 to 29 minutes (58 commuters, 17.2%).
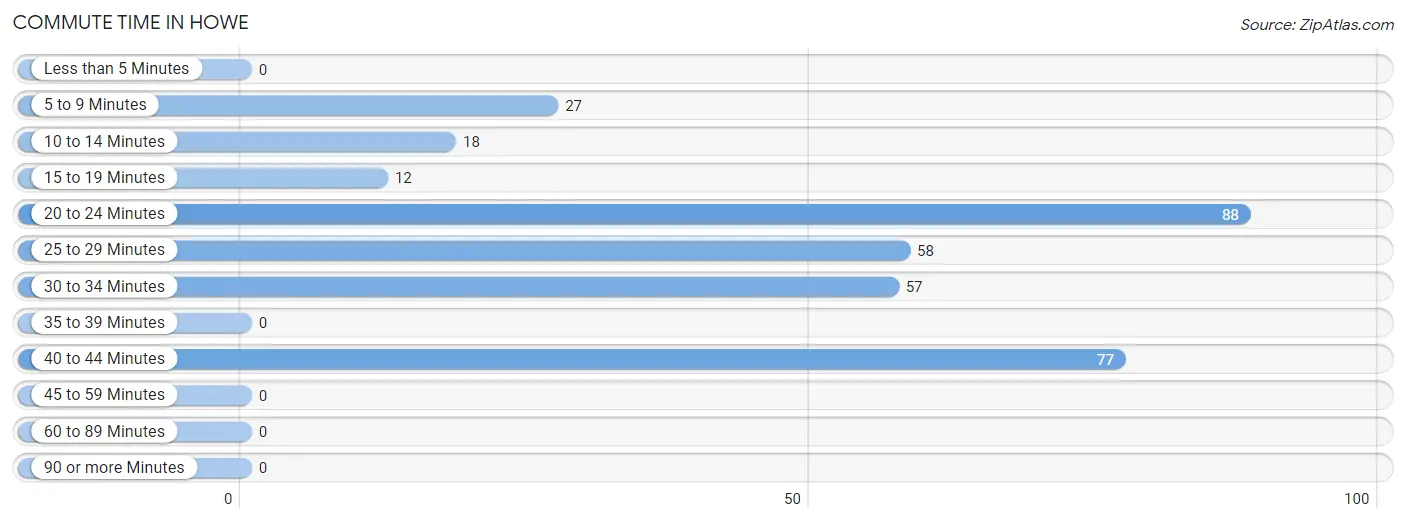
| Commute Time | # Commuters | % Commuters |
| Less than 5 Minutes | 0 | 0.0% |
| 5 to 9 Minutes | 27 | 8.0% |
| 10 to 14 Minutes | 18 | 5.3% |
| 15 to 19 Minutes | 12 | 3.6% |
| 20 to 24 Minutes | 88 | 26.1% |
| 25 to 29 Minutes | 58 | 17.2% |
| 30 to 34 Minutes | 57 | 16.9% |
| 35 to 39 Minutes | 0 | 0.0% |
| 40 to 44 Minutes | 77 | 22.9% |
| 45 to 59 Minutes | 0 | 0.0% |
| 60 to 89 Minutes | 0 | 0.0% |
| 90 or more Minutes | 0 | 0.0% |
Commute Time by Sex in Howe
The most common commute times in Howe are 30 to 34 minutes (40 commuters, 33.9%) for males and 20 to 24 minutes (88 commuters, 40.2%) for females.
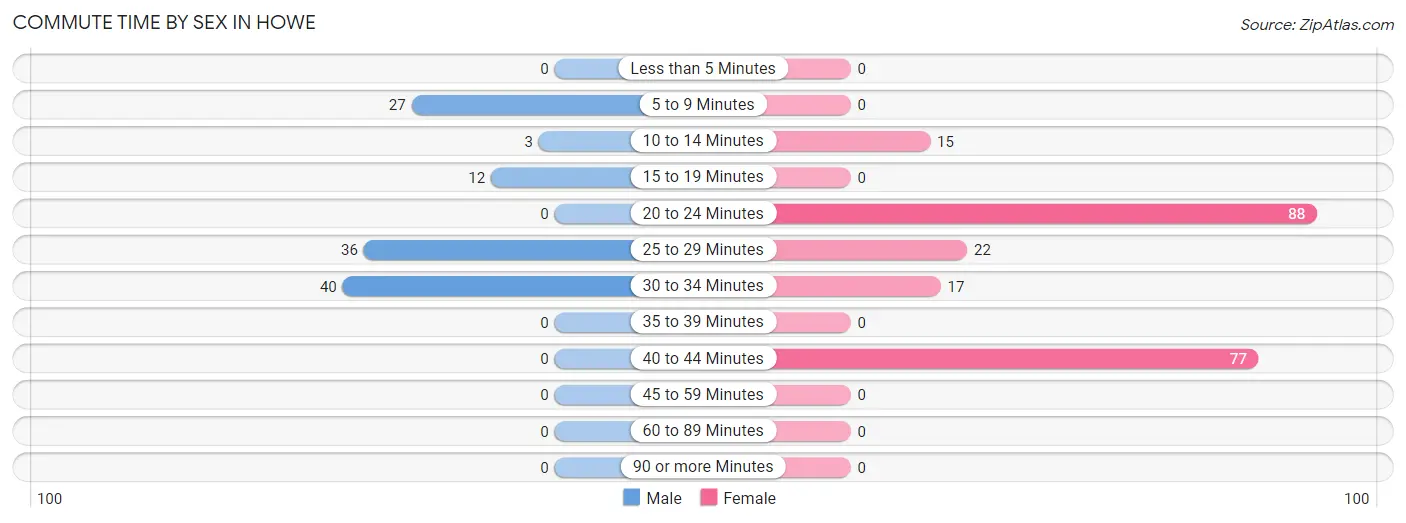
| Commute Time | Male | Female |
| Less than 5 Minutes | 0 (0.0%) | 0 (0.0%) |
| 5 to 9 Minutes | 27 (22.9%) | 0 (0.0%) |
| 10 to 14 Minutes | 3 (2.5%) | 15 (6.9%) |
| 15 to 19 Minutes | 12 (10.2%) | 0 (0.0%) |
| 20 to 24 Minutes | 0 (0.0%) | 88 (40.2%) |
| 25 to 29 Minutes | 36 (30.5%) | 22 (10.1%) |
| 30 to 34 Minutes | 40 (33.9%) | 17 (7.8%) |
| 35 to 39 Minutes | 0 (0.0%) | 0 (0.0%) |
| 40 to 44 Minutes | 0 (0.0%) | 77 (35.2%) |
| 45 to 59 Minutes | 0 (0.0%) | 0 (0.0%) |
| 60 to 89 Minutes | 0 (0.0%) | 0 (0.0%) |
| 90 or more Minutes | 0 (0.0%) | 0 (0.0%) |
Time of Departure to Work by Sex in Howe
The most frequent times of departure to work in Howe are 5:00 AM to 5:29 AM (40, 33.9%) for males and 12:00 AM to 4:59 AM (165, 75.3%) for females.
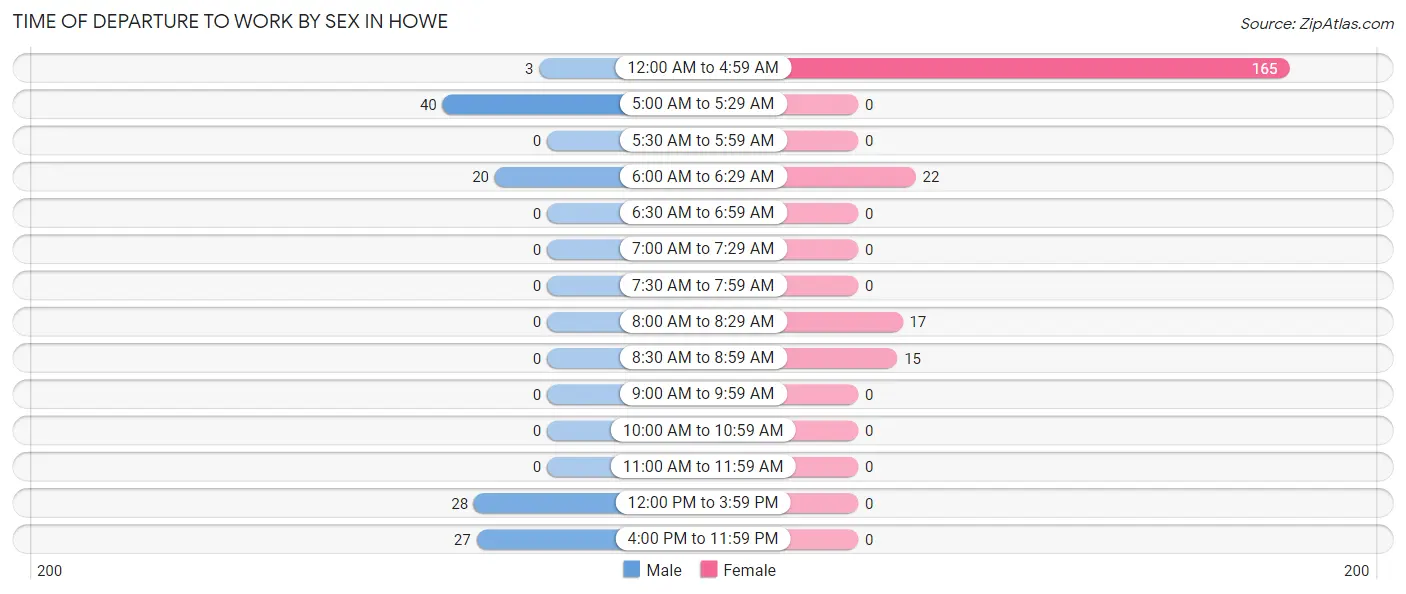
| Time of Departure | Male | Female |
| 12:00 AM to 4:59 AM | 3 (2.5%) | 165 (75.3%) |
| 5:00 AM to 5:29 AM | 40 (33.9%) | 0 (0.0%) |
| 5:30 AM to 5:59 AM | 0 (0.0%) | 0 (0.0%) |
| 6:00 AM to 6:29 AM | 20 (17.0%) | 22 (10.1%) |
| 6:30 AM to 6:59 AM | 0 (0.0%) | 0 (0.0%) |
| 7:00 AM to 7:29 AM | 0 (0.0%) | 0 (0.0%) |
| 7:30 AM to 7:59 AM | 0 (0.0%) | 0 (0.0%) |
| 8:00 AM to 8:29 AM | 0 (0.0%) | 17 (7.8%) |
| 8:30 AM to 8:59 AM | 0 (0.0%) | 15 (6.9%) |
| 9:00 AM to 9:59 AM | 0 (0.0%) | 0 (0.0%) |
| 10:00 AM to 10:59 AM | 0 (0.0%) | 0 (0.0%) |
| 11:00 AM to 11:59 AM | 0 (0.0%) | 0 (0.0%) |
| 12:00 PM to 3:59 PM | 28 (23.7%) | 0 (0.0%) |
| 4:00 PM to 11:59 PM | 27 (22.9%) | 0 (0.0%) |
| Total | 118 (100.0%) | 219 (100.0%) |
Housing Occupancy in Howe
Occupancy by Ownership in Howe
Of the total 297 dwellings in Howe, owner-occupied units account for 209 (70.4%), while renter-occupied units make up 88 (29.6%).
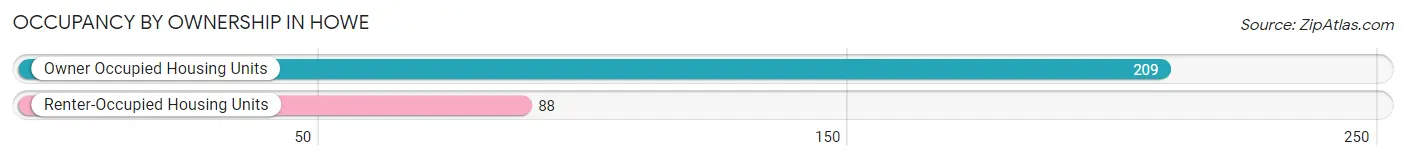
| Occupancy | # Housing Units | % Housing Units |
| Owner Occupied Housing Units | 209 | 70.4% |
| Renter-Occupied Housing Units | 88 | 29.6% |
| Total Occupied Housing Units | 297 | 100.0% |
Occupancy by Household Size in Howe
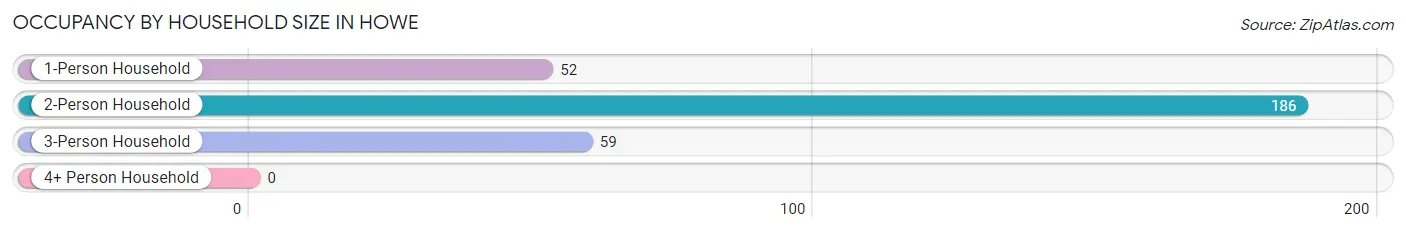
| Household Size | # Housing Units | % Housing Units |
| 1-Person Household | 52 | 17.5% |
| 2-Person Household | 186 | 62.6% |
| 3-Person Household | 59 | 19.9% |
| 4+ Person Household | 0 | 0.0% |
| Total Housing Units | 297 | 100.0% |
Occupancy by Ownership by Household Size in Howe
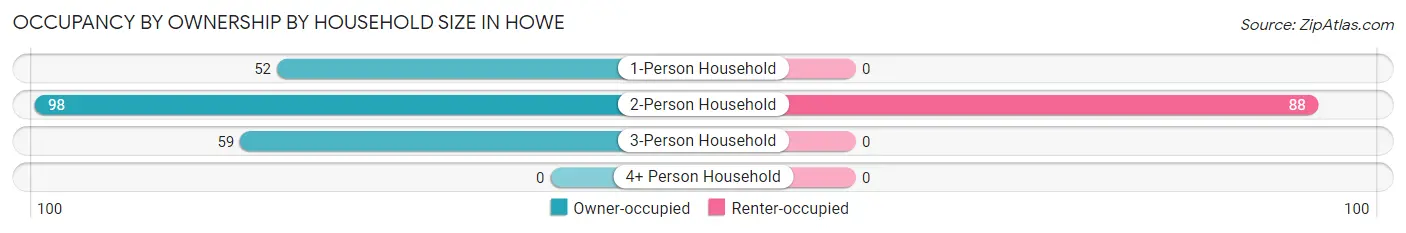
| Household Size | Owner-occupied | Renter-occupied |
| 1-Person Household | 52 (100.0%) | 0 (0.0%) |
| 2-Person Household | 98 (52.7%) | 88 (47.3%) |
| 3-Person Household | 59 (100.0%) | 0 (0.0%) |
| 4+ Person Household | 0 (0.0%) | 0 (0.0%) |
| Total Housing Units | 209 (70.4%) | 88 (29.6%) |
Occupancy by Educational Attainment in Howe
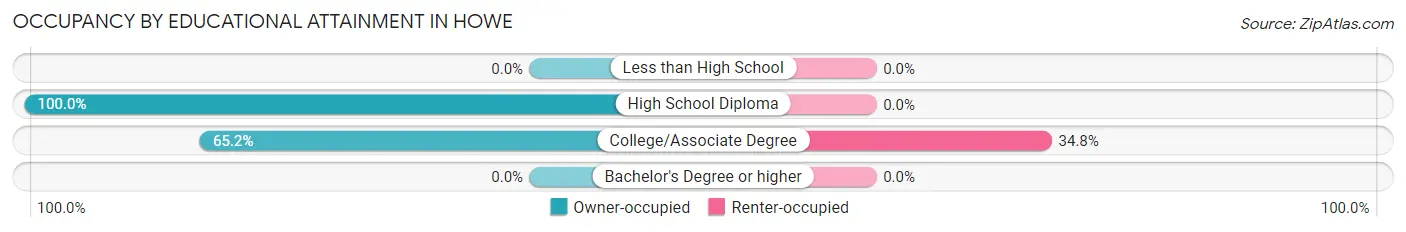
| Household Size | Owner-occupied | Renter-occupied |
| Less than High School | 0 (0.0%) | 0 (0.0%) |
| High School Diploma | 44 (100.0%) | 0 (0.0%) |
| College/Associate Degree | 165 (65.2%) | 88 (34.8%) |
| Bachelor's Degree or higher | 0 (0.0%) | 0 (0.0%) |
Occupancy by Age of Householder in Howe
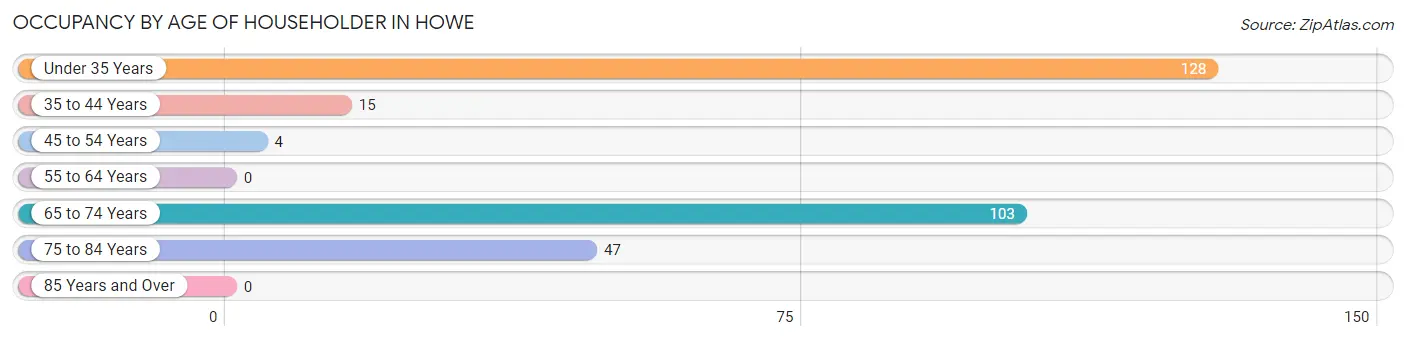
| Age Bracket | # Households | % Households |
| Under 35 Years | 128 | 43.1% |
| 35 to 44 Years | 15 | 5.1% |
| 45 to 54 Years | 4 | 1.3% |
| 55 to 64 Years | 0 | 0.0% |
| 65 to 74 Years | 103 | 34.7% |
| 75 to 84 Years | 47 | 15.8% |
| 85 Years and Over | 0 | 0.0% |
| Total | 297 | 100.0% |
Housing Finances in Howe
Median Income by Occupancy in Howe
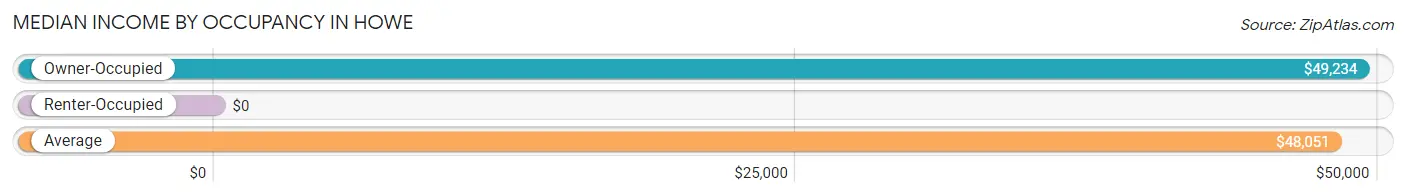
| Occupancy Type | # Households | Median Income |
| Owner-Occupied | 209 (70.4%) | $49,234 |
| Renter-Occupied | 88 (29.6%) | $0 |
| Average | 297 (100.0%) | $48,051 |
Occupancy by Householder Income Bracket in Howe
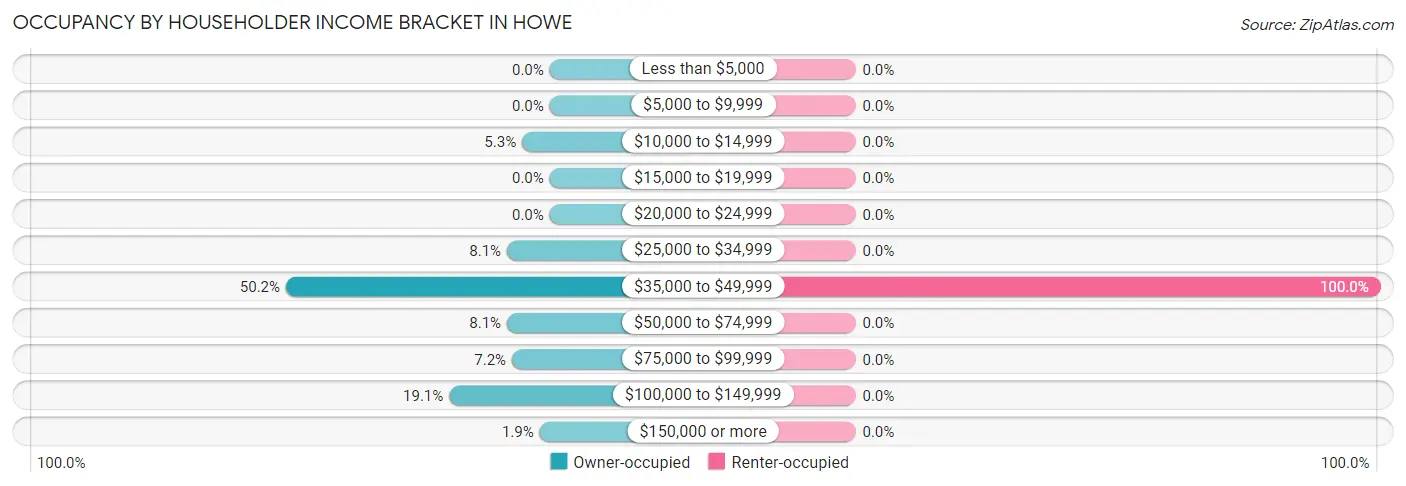
| Income Bracket | Owner-occupied | Renter-occupied |
| Less than $5,000 | 0 (0.0%) | 0 (0.0%) |
| $5,000 to $9,999 | 0 (0.0%) | 0 (0.0%) |
| $10,000 to $14,999 | 11 (5.3%) | 0 (0.0%) |
| $15,000 to $19,999 | 0 (0.0%) | 0 (0.0%) |
| $20,000 to $24,999 | 0 (0.0%) | 0 (0.0%) |
| $25,000 to $34,999 | 17 (8.1%) | 0 (0.0%) |
| $35,000 to $49,999 | 105 (50.2%) | 88 (100.0%) |
| $50,000 to $74,999 | 17 (8.1%) | 0 (0.0%) |
| $75,000 to $99,999 | 15 (7.2%) | 0 (0.0%) |
| $100,000 to $149,999 | 40 (19.1%) | 0 (0.0%) |
| $150,000 or more | 4 (1.9%) | 0 (0.0%) |
| Total | 209 (100.0%) | 88 (100.0%) |
Monthly Housing Cost Tiers in Howe
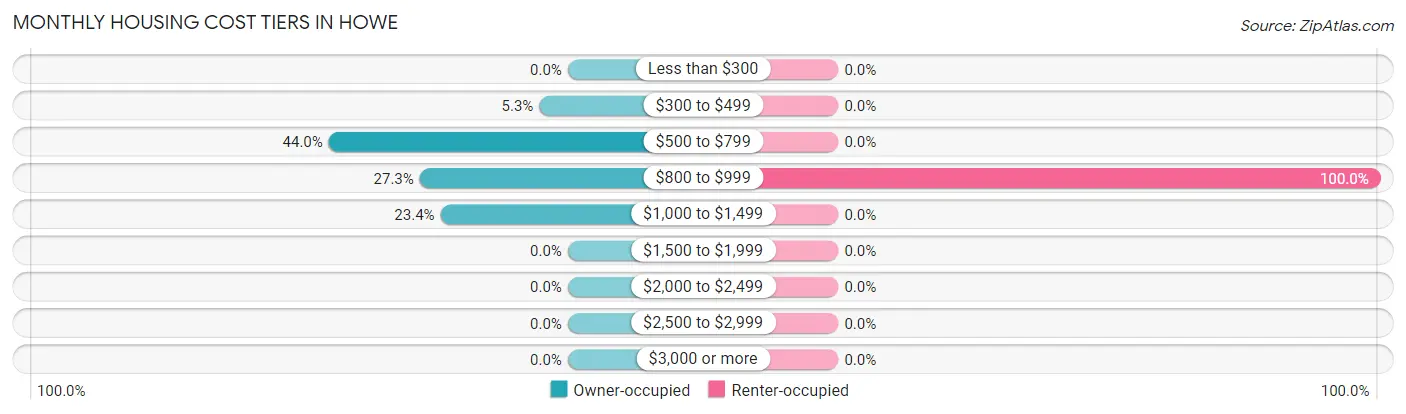
| Monthly Cost | Owner-occupied | Renter-occupied |
| Less than $300 | 0 (0.0%) | 0 (0.0%) |
| $300 to $499 | 11 (5.3%) | 0 (0.0%) |
| $500 to $799 | 92 (44.0%) | 0 (0.0%) |
| $800 to $999 | 57 (27.3%) | 88 (100.0%) |
| $1,000 to $1,499 | 49 (23.4%) | 0 (0.0%) |
| $1,500 to $1,999 | 0 (0.0%) | 0 (0.0%) |
| $2,000 to $2,499 | 0 (0.0%) | 0 (0.0%) |
| $2,500 to $2,999 | 0 (0.0%) | 0 (0.0%) |
| $3,000 or more | 0 (0.0%) | 0 (0.0%) |
| Total | 209 (100.0%) | 88 (100.0%) |
Physical Housing Characteristics in Howe
Housing Structures in Howe
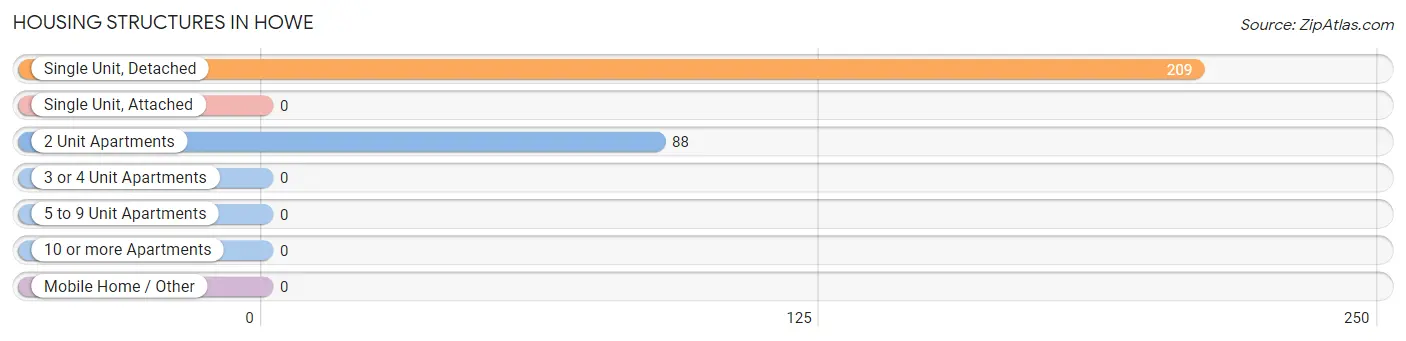
| Structure Type | # Housing Units | % Housing Units |
| Single Unit, Detached | 209 | 70.4% |
| Single Unit, Attached | 0 | 0.0% |
| 2 Unit Apartments | 88 | 29.6% |
| 3 or 4 Unit Apartments | 0 | 0.0% |
| 5 to 9 Unit Apartments | 0 | 0.0% |
| 10 or more Apartments | 0 | 0.0% |
| Mobile Home / Other | 0 | 0.0% |
| Total | 297 | 100.0% |
Housing Structures by Occupancy in Howe
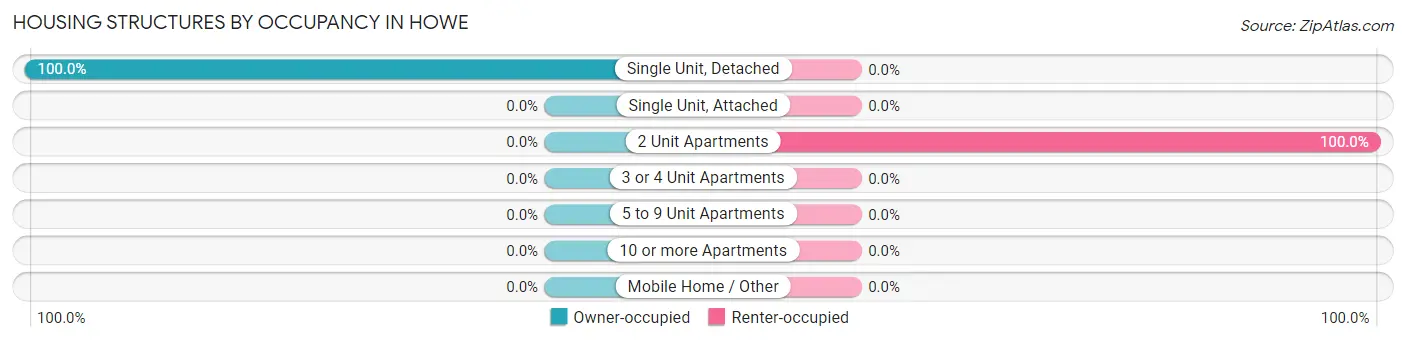
| Structure Type | Owner-occupied | Renter-occupied |
| Single Unit, Detached | 209 (100.0%) | 0 (0.0%) |
| Single Unit, Attached | 0 (0.0%) | 0 (0.0%) |
| 2 Unit Apartments | 0 (0.0%) | 88 (100.0%) |
| 3 or 4 Unit Apartments | 0 (0.0%) | 0 (0.0%) |
| 5 to 9 Unit Apartments | 0 (0.0%) | 0 (0.0%) |
| 10 or more Apartments | 0 (0.0%) | 0 (0.0%) |
| Mobile Home / Other | 0 (0.0%) | 0 (0.0%) |
| Total | 209 (70.4%) | 88 (29.6%) |
Housing Structures by Number of Rooms in Howe
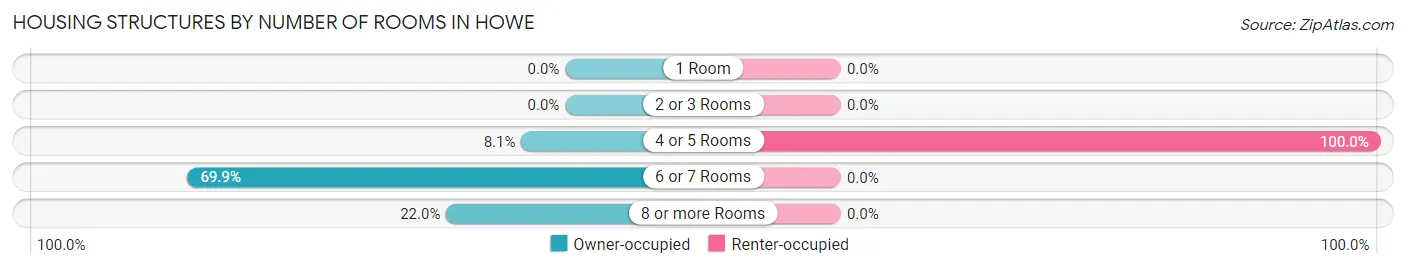
| Number of Rooms | Owner-occupied | Renter-occupied |
| 1 Room | 0 (0.0%) | 0 (0.0%) |
| 2 or 3 Rooms | 0 (0.0%) | 0 (0.0%) |
| 4 or 5 Rooms | 17 (8.1%) | 88 (100.0%) |
| 6 or 7 Rooms | 146 (69.9%) | 0 (0.0%) |
| 8 or more Rooms | 46 (22.0%) | 0 (0.0%) |
| Total | 209 (100.0%) | 88 (100.0%) |
Housing Structure by Heating Type in Howe
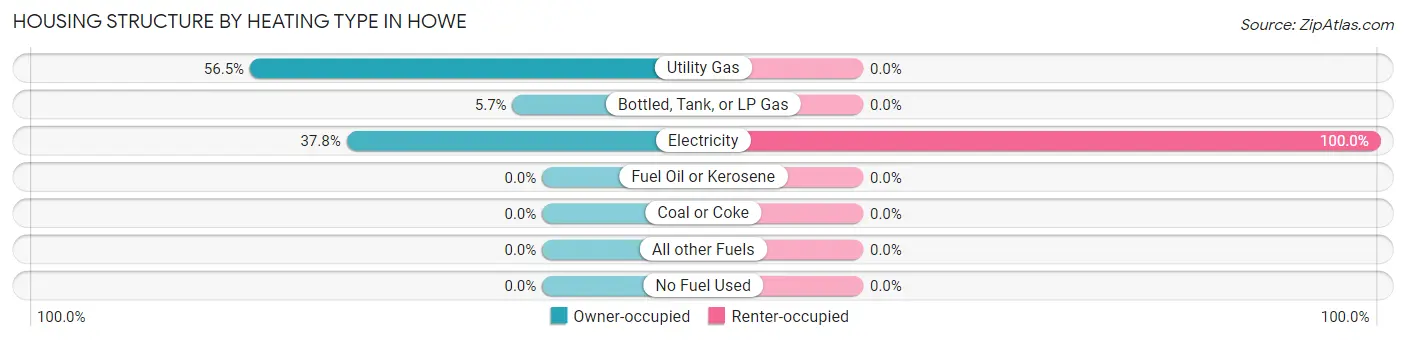
| Heating Type | Owner-occupied | Renter-occupied |
| Utility Gas | 118 (56.5%) | 0 (0.0%) |
| Bottled, Tank, or LP Gas | 12 (5.7%) | 0 (0.0%) |
| Electricity | 79 (37.8%) | 88 (100.0%) |
| Fuel Oil or Kerosene | 0 (0.0%) | 0 (0.0%) |
| Coal or Coke | 0 (0.0%) | 0 (0.0%) |
| All other Fuels | 0 (0.0%) | 0 (0.0%) |
| No Fuel Used | 0 (0.0%) | 0 (0.0%) |
| Total | 209 (100.0%) | 88 (100.0%) |
Household Vehicle Usage in Howe
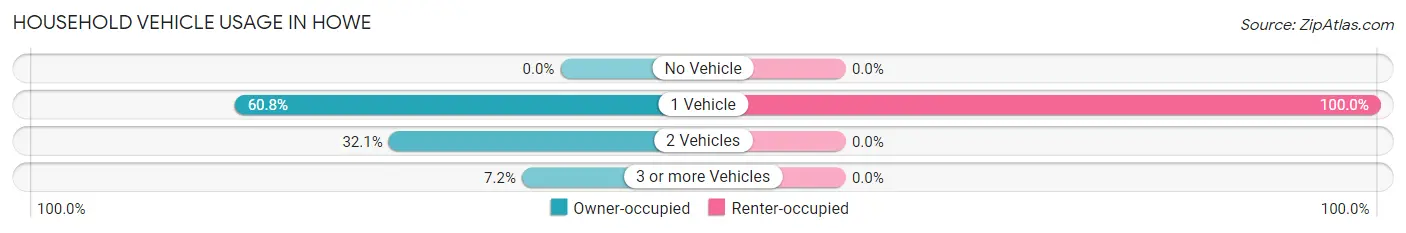
| Vehicles per Household | Owner-occupied | Renter-occupied |
| No Vehicle | 0 (0.0%) | 0 (0.0%) |
| 1 Vehicle | 127 (60.8%) | 88 (100.0%) |
| 2 Vehicles | 67 (32.1%) | 0 (0.0%) |
| 3 or more Vehicles | 15 (7.2%) | 0 (0.0%) |
| Total | 209 (100.0%) | 88 (100.0%) |
Real Estate & Mortgages in Howe
Real Estate and Mortgage Overview in Howe
| Characteristic | Without Mortgage | With Mortgage |
| Housing Units | 11 | 198 |
| Median Property Value | - | - |
| Median Household Income | - | - |
| Monthly Housing Costs | - | - |
| Real Estate Taxes | - | - |
Property Value by Mortgage Status in Howe
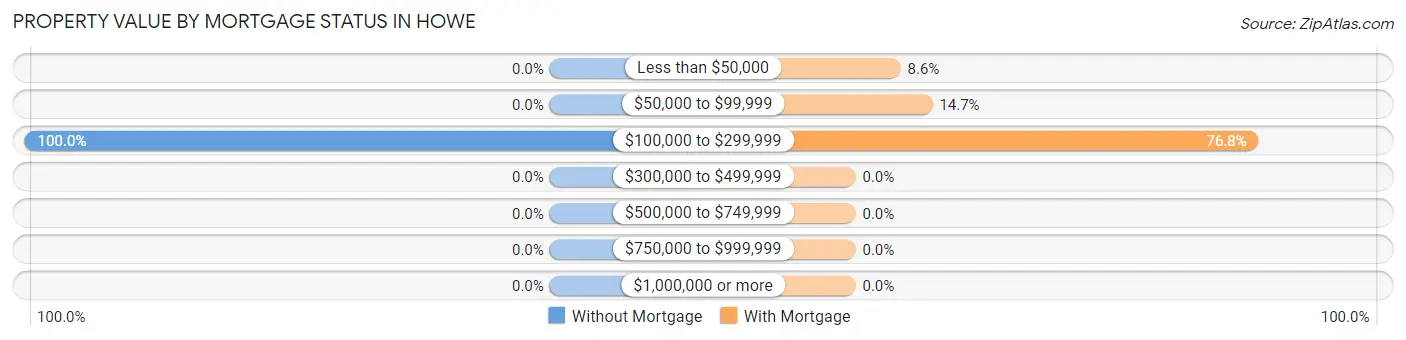
| Property Value | Without Mortgage | With Mortgage |
| Less than $50,000 | 0 (0.0%) | 17 (8.6%) |
| $50,000 to $99,999 | 0 (0.0%) | 29 (14.6%) |
| $100,000 to $299,999 | 11 (100.0%) | 152 (76.8%) |
| $300,000 to $499,999 | 0 (0.0%) | 0 (0.0%) |
| $500,000 to $749,999 | 0 (0.0%) | 0 (0.0%) |
| $750,000 to $999,999 | 0 (0.0%) | 0 (0.0%) |
| $1,000,000 or more | 0 (0.0%) | 0 (0.0%) |
| Total | 11 (100.0%) | 198 (100.0%) |
Household Income by Mortgage Status in Howe
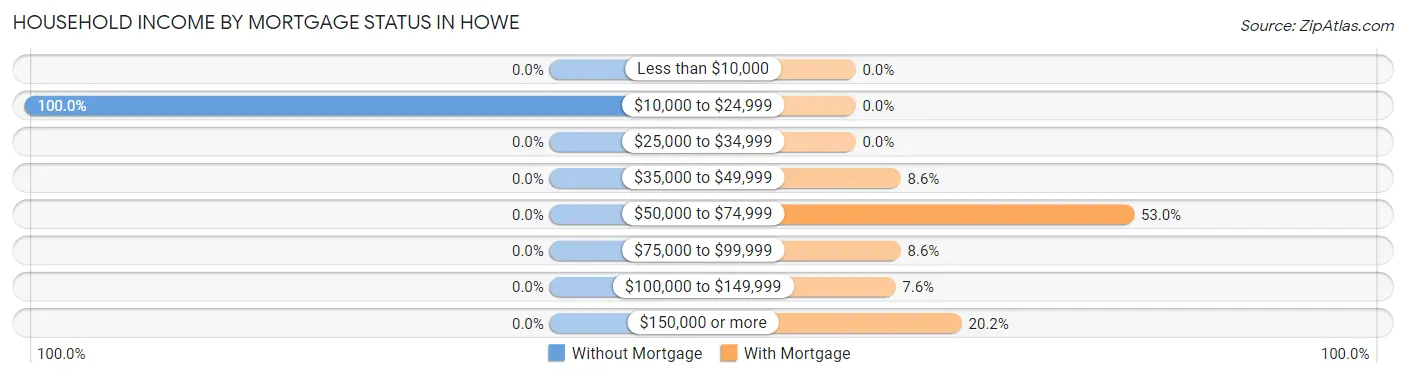
| Household Income | Without Mortgage | With Mortgage |
| Less than $10,000 | 0 (0.0%) | 0 (0.0%) |
| $10,000 to $24,999 | 11 (100.0%) | 0 (0.0%) |
| $25,000 to $34,999 | 0 (0.0%) | 0 (0.0%) |
| $35,000 to $49,999 | 0 (0.0%) | 17 (8.6%) |
| $50,000 to $74,999 | 0 (0.0%) | 105 (53.0%) |
| $75,000 to $99,999 | 0 (0.0%) | 17 (8.6%) |
| $100,000 to $149,999 | 0 (0.0%) | 15 (7.6%) |
| $150,000 or more | 0 (0.0%) | 40 (20.2%) |
| Total | 11 (100.0%) | 198 (100.0%) |
Property Value to Household Income Ratio in Howe
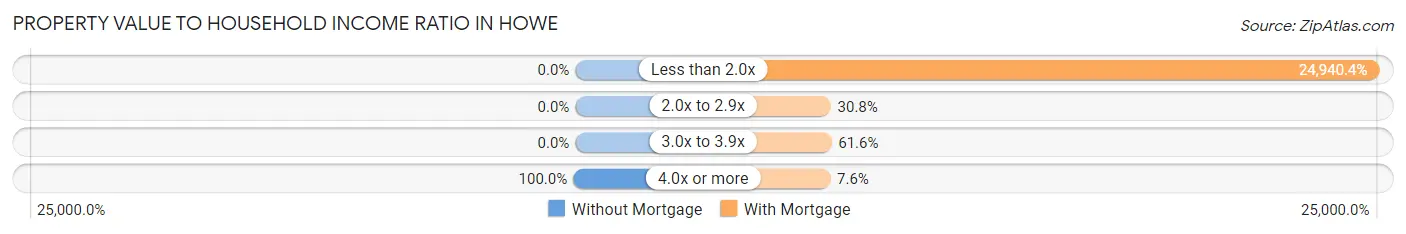
| Value-to-Income Ratio | Without Mortgage | With Mortgage |
| Less than 2.0x | 0 (0.0%) | 49,382 (24,940.4%) |
| 2.0x to 2.9x | 0 (0.0%) | 61 (30.8%) |
| 3.0x to 3.9x | 0 (0.0%) | 122 (61.6%) |
| 4.0x or more | 11 (100.0%) | 15 (7.6%) |
| Total | 11 (100.0%) | 198 (100.0%) |
Real Estate Taxes by Mortgage Status in Howe
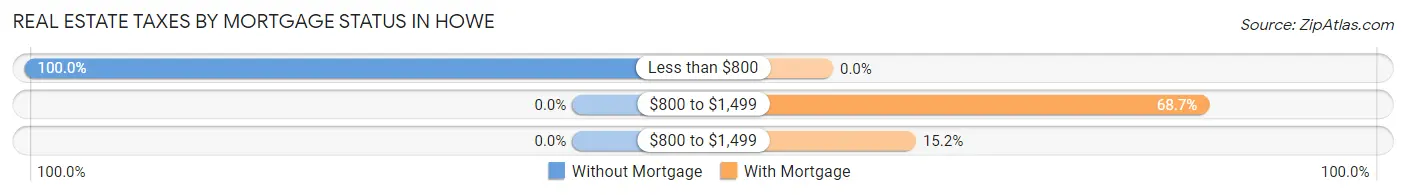
| Property Taxes | Without Mortgage | With Mortgage |
| Less than $800 | 11 (100.0%) | 0 (0.0%) |
| $800 to $1,499 | 0 (0.0%) | 136 (68.7%) |
| $800 to $1,499 | 0 (0.0%) | 30 (15.1%) |
| Total | 11 (100.0%) | 198 (100.0%) |
Health & Disability in Howe
Health Insurance Coverage by Age in Howe
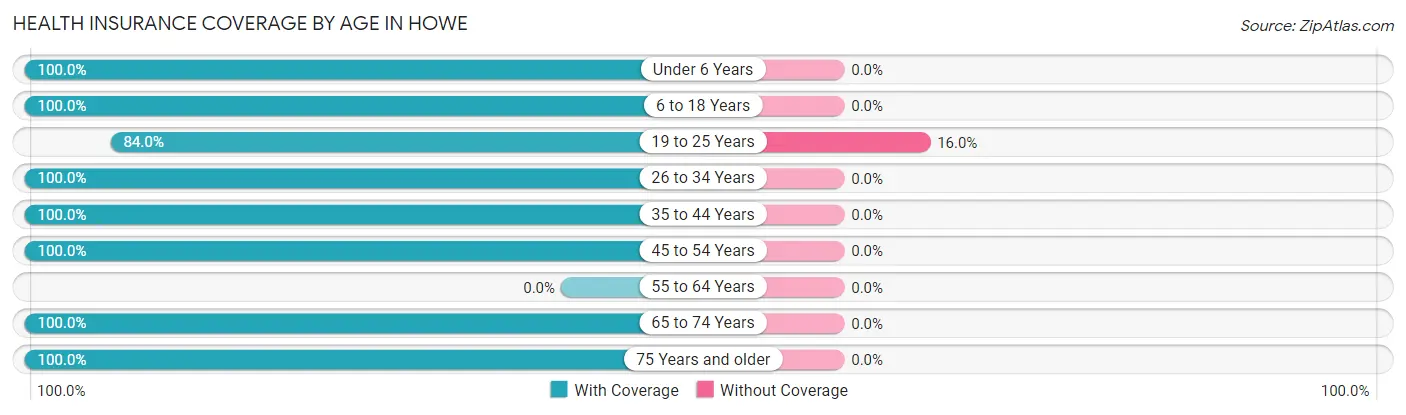
| Age Bracket | With Coverage | Without Coverage |
| Under 6 Years | 143 (100.0%) | 0 (0.0%) |
| 6 to 18 Years | 37 (100.0%) | 0 (0.0%) |
| 19 to 25 Years | 173 (84.0%) | 33 (16.0%) |
| 26 to 34 Years | 93 (100.0%) | 0 (0.0%) |
| 35 to 44 Years | 15 (100.0%) | 0 (0.0%) |
| 45 to 54 Years | 129 (100.0%) | 0 (0.0%) |
| 55 to 64 Years | 0 (0.0%) | 0 (0.0%) |
| 65 to 74 Years | 128 (100.0%) | 0 (0.0%) |
| 75 Years and older | 47 (100.0%) | 0 (0.0%) |
| Total | 765 (95.9%) | 33 (4.1%) |
Health Insurance Coverage by Citizenship Status in Howe
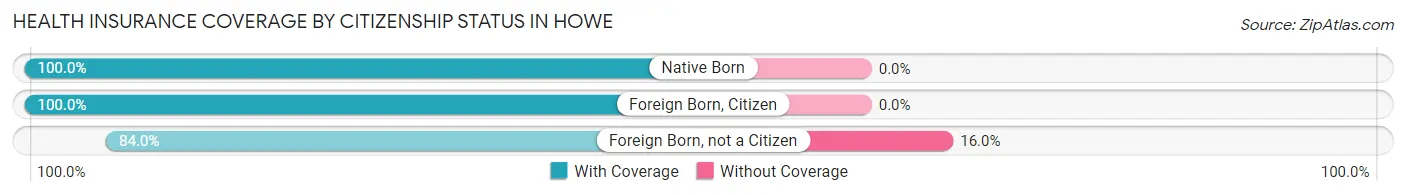
| Citizenship Status | With Coverage | Without Coverage |
| Native Born | 143 (100.0%) | 0 (0.0%) |
| Foreign Born, Citizen | 37 (100.0%) | 0 (0.0%) |
| Foreign Born, not a Citizen | 173 (84.0%) | 33 (16.0%) |
Health Insurance Coverage by Household Income in Howe
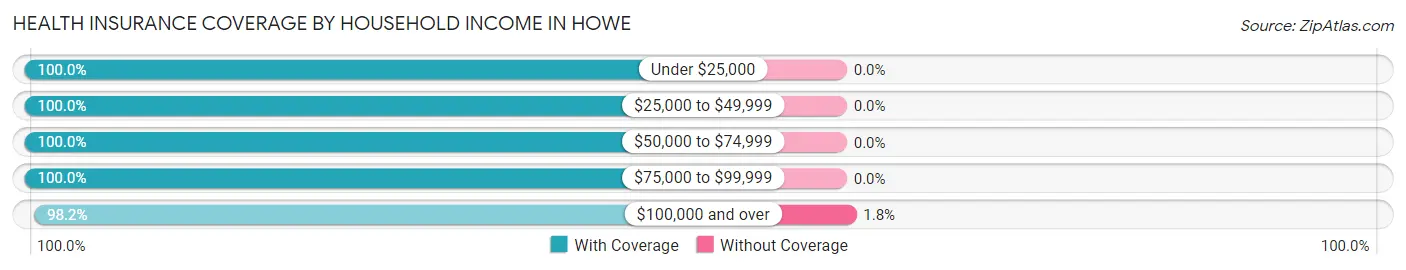
| Household Income | With Coverage | Without Coverage |
| Under $25,000 | 22 (100.0%) | 0 (0.0%) |
| $25,000 to $49,999 | 453 (100.0%) | 0 (0.0%) |
| $50,000 to $74,999 | 17 (100.0%) | 0 (0.0%) |
| $75,000 to $99,999 | 43 (100.0%) | 0 (0.0%) |
| $100,000 and over | 165 (98.2%) | 3 (1.8%) |
Public vs Private Health Insurance Coverage by Age in Howe
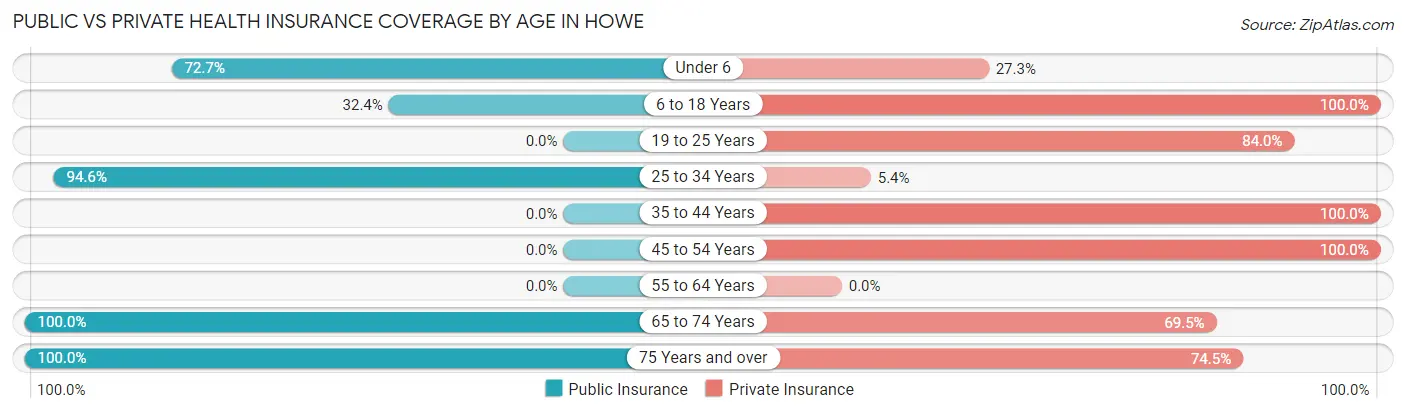
| Age Bracket | Public Insurance | Private Insurance |
| Under 6 | 104 (72.7%) | 39 (27.3%) |
| 6 to 18 Years | 12 (32.4%) | 37 (100.0%) |
| 19 to 25 Years | 0 (0.0%) | 173 (84.0%) |
| 25 to 34 Years | 88 (94.6%) | 5 (5.4%) |
| 35 to 44 Years | 0 (0.0%) | 15 (100.0%) |
| 45 to 54 Years | 0 (0.0%) | 129 (100.0%) |
| 55 to 64 Years | 0 (0.0%) | 0 (0.0%) |
| 65 to 74 Years | 128 (100.0%) | 89 (69.5%) |
| 75 Years and over | 47 (100.0%) | 35 (74.5%) |
| Total | 379 (47.5%) | 522 (65.4%) |
Disability Status by Sex by Age in Howe
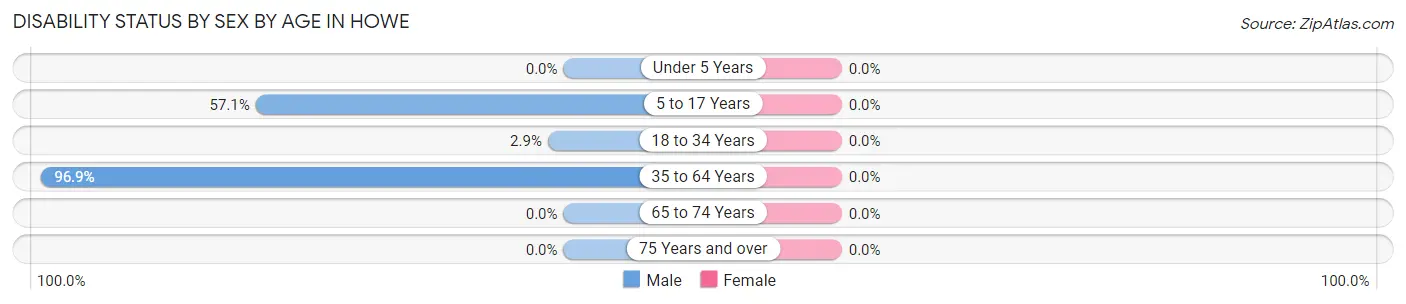
| Age Bracket | Male | Female |
| Under 5 Years | 0 (0.0%) | 0 (0.0%) |
| 5 to 17 Years | 16 (57.1%) | 0 (0.0%) |
| 18 to 34 Years | 4 (2.9%) | 0 (0.0%) |
| 35 to 64 Years | 125 (96.9%) | 0 (0.0%) |
| 65 to 74 Years | 0 (0.0%) | 0 (0.0%) |
| 75 Years and over | 0 (0.0%) | 0 (0.0%) |
Disability Class by Sex by Age in Howe
Disability Class: Hearing Difficulty
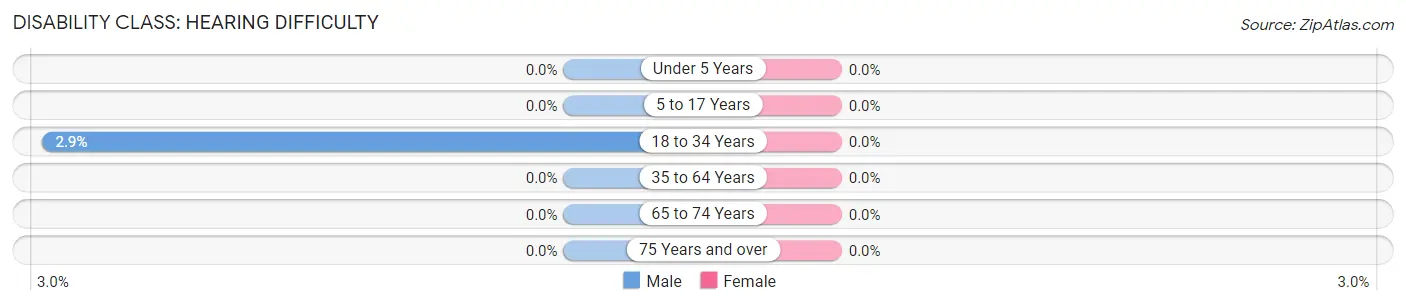
| Age Bracket | Male | Female |
| Under 5 Years | 0 (0.0%) | 0 (0.0%) |
| 5 to 17 Years | 0 (0.0%) | 0 (0.0%) |
| 18 to 34 Years | 4 (2.9%) | 0 (0.0%) |
| 35 to 64 Years | 0 (0.0%) | 0 (0.0%) |
| 65 to 74 Years | 0 (0.0%) | 0 (0.0%) |
| 75 Years and over | 0 (0.0%) | 0 (0.0%) |
Disability Class: Vision Difficulty
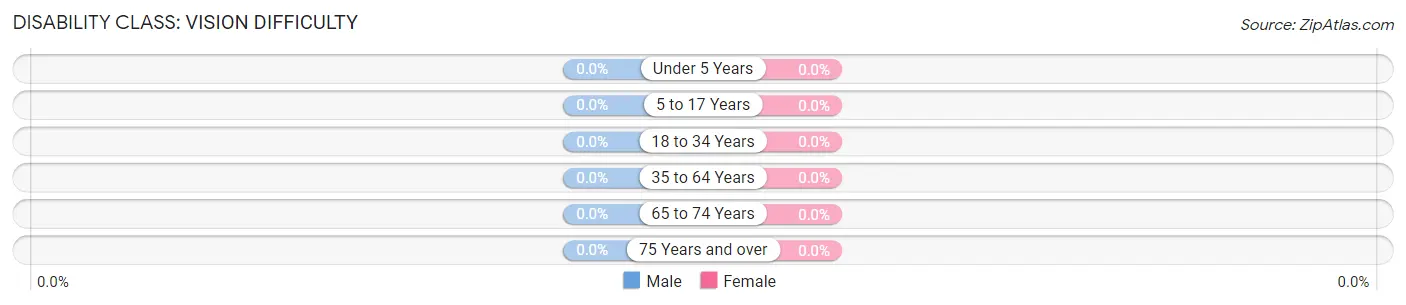
| Age Bracket | Male | Female |
| Under 5 Years | 0 (0.0%) | 0 (0.0%) |
| 5 to 17 Years | 0 (0.0%) | 0 (0.0%) |
| 18 to 34 Years | 0 (0.0%) | 0 (0.0%) |
| 35 to 64 Years | 0 (0.0%) | 0 (0.0%) |
| 65 to 74 Years | 0 (0.0%) | 0 (0.0%) |
| 75 Years and over | 0 (0.0%) | 0 (0.0%) |
Disability Class: Cognitive Difficulty
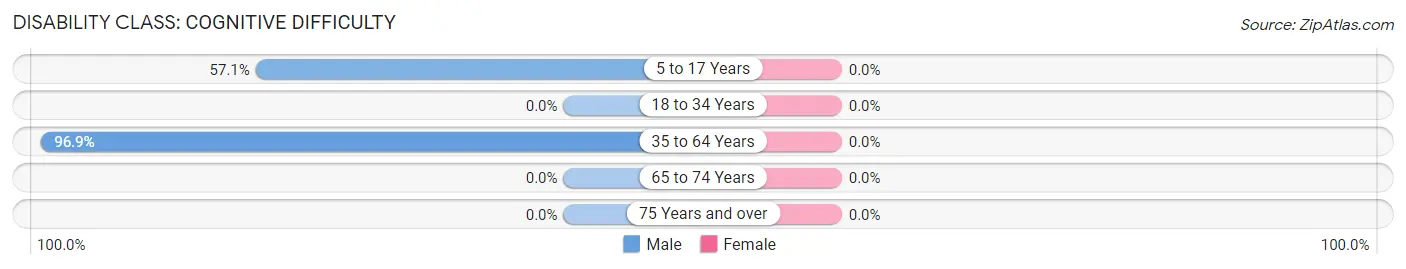
| Age Bracket | Male | Female |
| 5 to 17 Years | 16 (57.1%) | 0 (0.0%) |
| 18 to 34 Years | 0 (0.0%) | 0 (0.0%) |
| 35 to 64 Years | 125 (96.9%) | 0 (0.0%) |
| 65 to 74 Years | 0 (0.0%) | 0 (0.0%) |
| 75 Years and over | 0 (0.0%) | 0 (0.0%) |
Disability Class: Ambulatory Difficulty
| Age Bracket | Male | Female |
| 5 to 17 Years | 0 (0.0%) | 0 (0.0%) |
| 18 to 34 Years | 0 (0.0%) | 0 (0.0%) |
| 35 to 64 Years | 0 (0.0%) | 0 (0.0%) |
| 65 to 74 Years | 0 (0.0%) | 0 (0.0%) |
| 75 Years and over | 0 (0.0%) | 0 (0.0%) |
Disability Class: Self-Care Difficulty
| Age Bracket | Male | Female |
| 5 to 17 Years | 0 (0.0%) | 0 (0.0%) |
| 18 to 34 Years | 0 (0.0%) | 0 (0.0%) |
| 35 to 64 Years | 0 (0.0%) | 0 (0.0%) |
| 65 to 74 Years | 0 (0.0%) | 0 (0.0%) |
| 75 Years and over | 0 (0.0%) | 0 (0.0%) |
Technology Access in Howe
Computing Device Access in Howe
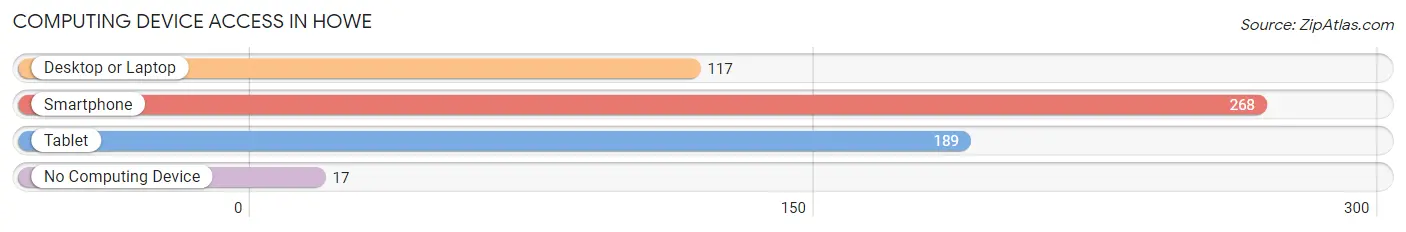
| Device Type | # Households | % Households |
| Desktop or Laptop | 117 | 39.4% |
| Smartphone | 268 | 90.2% |
| Tablet | 189 | 63.6% |
| No Computing Device | 17 | 5.7% |
| Total | 297 | 100.0% |
Internet Access in Howe
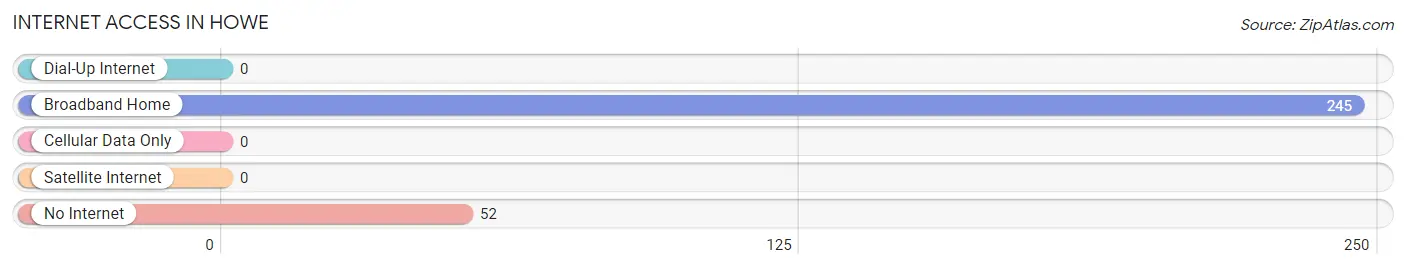
| Internet Type | # Households | % Households |
| Dial-Up Internet | 0 | 0.0% |
| Broadband Home | 245 | 82.5% |
| Cellular Data Only | 0 | 0.0% |
| Satellite Internet | 0 | 0.0% |
| No Internet | 52 | 17.5% |
| Total | 297 | 100.0% |
Howe Summary
Howe, Indiana is a small town located in LaGrange County in the northeastern part of the state. It is situated on the banks of the Little Elkhart River and is part of the Elkhart-Goshen Metropolitan Statistical Area. The town has a population of 1,845 people as of the 2010 census.
History
The area that is now Howe was first settled in 1835 by a group of settlers from New York. The town was originally known as “New York Settlement” and was later renamed “Howe” in honor of Elias Howe, the inventor of the sewing machine. The town was officially incorporated in 1867.
In the late 19th century, Howe was a thriving agricultural community. The town was home to several grain mills, a sawmill, a flour mill, and a cider mill. The town also had a number of stores, a hotel, a bank, and a post office.
In the early 20th century, Howe began to experience a decline in population as many of its residents moved away in search of better economic opportunities. The town’s population dropped from 1,845 in 1910 to 1,619 in 1930.
Geography
Howe is located in LaGrange County in the northeastern part of Indiana. It is situated on the banks of the Little Elkhart River and is part of the Elkhart-Goshen Metropolitan Statistical Area. The town has a total area of 0.9 square miles, all of which is land.
The town is located in a rural area and is surrounded by farmland. The nearest major city is Fort Wayne, which is about 40 miles to the east.
Economy
The economy of Howe is largely based on agriculture. The town is home to several farms that produce corn, soybeans, and wheat. The town also has a number of small businesses, including a grocery store, a hardware store, and a restaurant.
Demographics
As of the 2010 census, Howe had a population of 1,845 people. The racial makeup of the town was 97.3% White, 0.7% African American, 0.2% Native American, 0.2% Asian, 0.2% from other races, and 1.6% from two or more races. Hispanic or Latino of any race were 1.2% of the population.
The median household income in Howe was $45,938 in 2018. The median age of the town’s residents was 43.3 years. The town had a poverty rate of 11.2%.
Conclusion
Howe, Indiana is a small town located in LaGrange County in the northeastern part of the state. It is situated on the banks of the Little Elkhart River and is part of the Elkhart-Goshen Metropolitan Statistical Area. The town has a population of 1,845 people as of the 2010 census. The economy of Howe is largely based on agriculture and the town has a number of small businesses. The median household income in Howe was $45,938 in 2018 and the town had a poverty rate of 11.2%.
Common Questions
What is Per Capita Income in Howe?
Per Capita income in Howe is $24,501.
What is the Median Family Income in Howe?
Median Family Income in Howe is $47,883.
What is the Median Household income in Howe?
Median Household Income in Howe is $48,051.
What is Inequality or Gini Index in Howe?
Inequality or Gini Index in Howe is 0.27.
What is the Total Population of Howe?
Total Population of Howe is 803.
What is the Total Male Population of Howe?
Total Male Population of Howe is 464.
What is the Total Female Population of Howe?
Total Female Population of Howe is 339.
What is the Ratio of Males per 100 Females in Howe?
There are 136.87 Males per 100 Females in Howe.
What is the Ratio of Females per 100 Males in Howe?
There are 73.06 Females per 100 Males in Howe.
What is the Median Population Age in Howe?
Median Population Age in Howe is 33.1 Years.
What is the Average Family Size in Howe
Average Family Size in Howe is 2.7 People.
What is the Average Household Size in Howe
Average Household Size in Howe is 2.4 People.
How Large is the Labor Force in Howe?
There are 412 People in the Labor Forcein in Howe.
What is the Percentage of People in the Labor Force in Howe?
64.1% of People are in the Labor Force in Howe.