Hoagland, IN Map & Demographics
Hoagland Map
Hoagland Overview
$31,303
PER CAPITA INCOME
$83,036
AVG FAMILY INCOME
$65,750
AVG HOUSEHOLD INCOME
20.2%
WAGE / INCOME GAP [ % ]
79.8¢/ $1
WAGE / INCOME GAP [ $ ]
0.43
INEQUALITY / GINI INDEX
878
TOTAL POPULATION
466
MALE POPULATION
412
FEMALE POPULATION
113.11
MALES / 100 FEMALES
88.41
FEMALES / 100 MALES
39.1
MEDIAN AGE
3.3
AVG FAMILY SIZE
2.8
AVG HOUSEHOLD SIZE
440
LABOR FORCE [ PEOPLE ]
69.3%
PERCENT IN LABOR FORCE
3.2%
UNEMPLOYMENT RATE
Hoagland Zip Codes
Hoagland Area Codes
Income in Hoagland
Income Overview in Hoagland
Per Capita Income in Hoagland is $31,303, while median incomes of families and households are $83,036 and $65,750 respectively.
| Characteristic | Number | Measure |
| Per Capita Income | 878 | $31,303 |
| Median Family Income | 243 | $83,036 |
| Mean Family Income | 243 | $99,991 |
| Median Household Income | 309 | $65,750 |
| Mean Household Income | 309 | $88,424 |
| Income Deficit | 243 | $0 |
| Wage / Income Gap (%) | 878 | 20.16% |
| Wage / Income Gap ($) | 878 | 79.84¢ per $1 |
| Gini / Inequality Index | 878 | 0.43 |
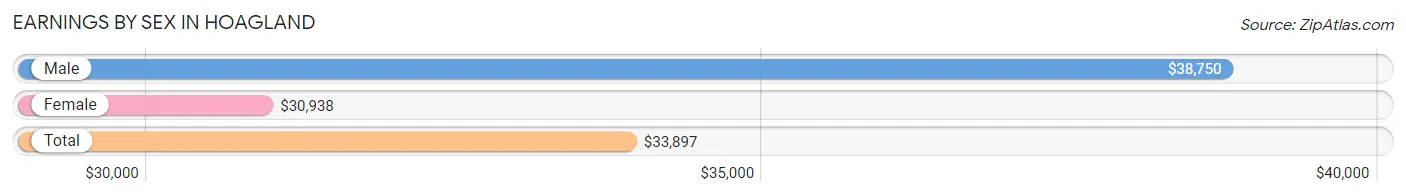
Earnings by Sex in Hoagland
Average Earnings in Hoagland are $33,897, $38,750 for men and $30,938 for women, a difference of 20.2%.
| Sex | Number | Average Earnings |
| Male | 250 (54.2%) | $38,750 |
| Female | 211 (45.8%) | $30,938 |
| Total | 461 (100.0%) | $33,897 |
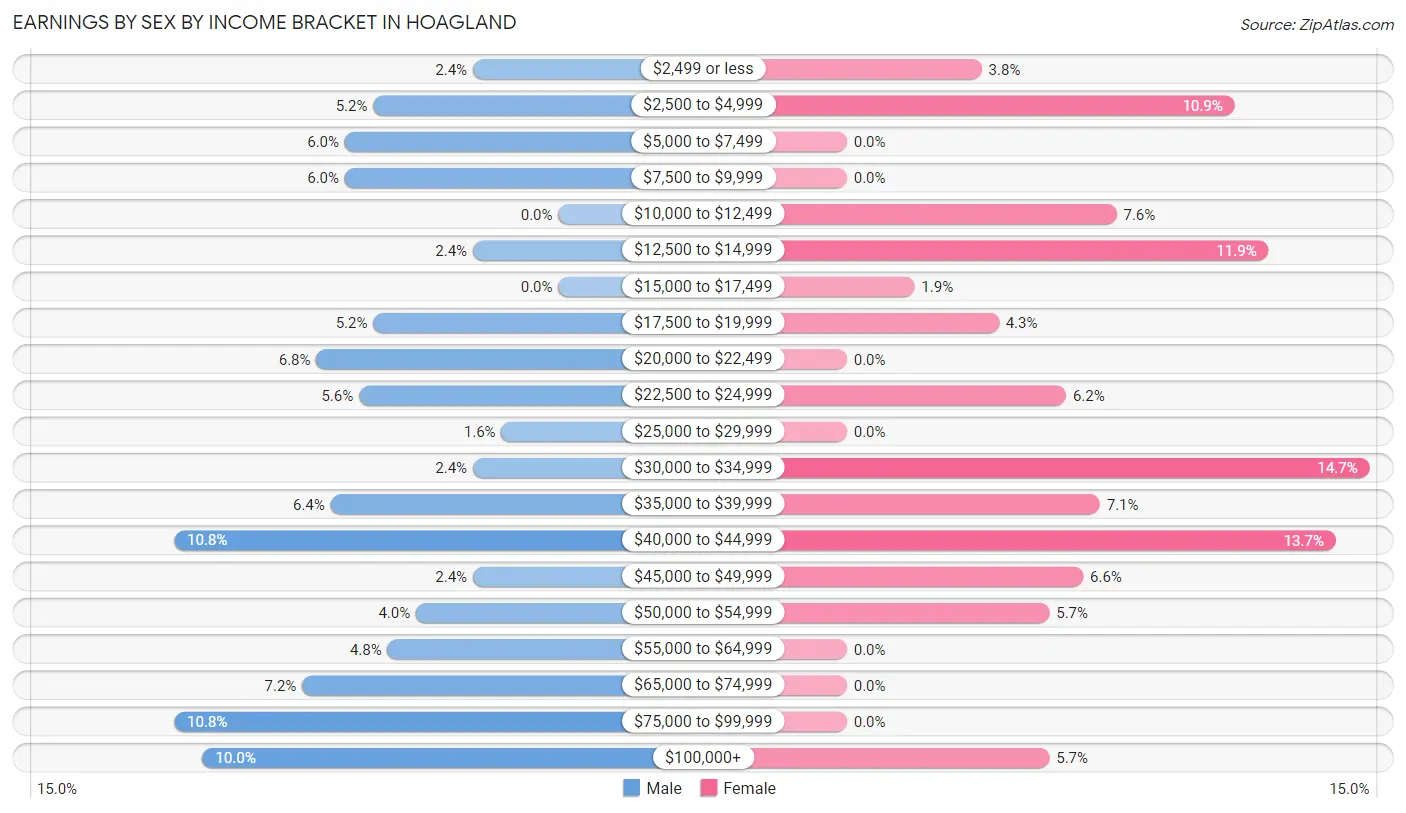
Earnings by Sex by Income Bracket in Hoagland
The most common earnings brackets in Hoagland are $40,000 to $44,999 for men (27 | 10.8%) and $30,000 to $34,999 for women (31 | 14.7%).
| Income | Male | Female |
| $2,499 or less | 6 (2.4%) | 8 (3.8%) |
| $2,500 to $4,999 | 13 (5.2%) | 23 (10.9%) |
| $5,000 to $7,499 | 15 (6.0%) | 0 (0.0%) |
| $7,500 to $9,999 | 15 (6.0%) | 0 (0.0%) |
| $10,000 to $12,499 | 0 (0.0%) | 16 (7.6%) |
| $12,500 to $14,999 | 6 (2.4%) | 25 (11.8%) |
| $15,000 to $17,499 | 0 (0.0%) | 4 (1.9%) |
| $17,500 to $19,999 | 13 (5.2%) | 9 (4.3%) |
| $20,000 to $22,499 | 17 (6.8%) | 0 (0.0%) |
| $22,500 to $24,999 | 14 (5.6%) | 13 (6.2%) |
| $25,000 to $29,999 | 4 (1.6%) | 0 (0.0%) |
| $30,000 to $34,999 | 6 (2.4%) | 31 (14.7%) |
| $35,000 to $39,999 | 16 (6.4%) | 15 (7.1%) |
| $40,000 to $44,999 | 27 (10.8%) | 29 (13.7%) |
| $45,000 to $49,999 | 6 (2.4%) | 14 (6.6%) |
| $50,000 to $54,999 | 10 (4.0%) | 12 (5.7%) |
| $55,000 to $64,999 | 12 (4.8%) | 0 (0.0%) |
| $65,000 to $74,999 | 18 (7.2%) | 0 (0.0%) |
| $75,000 to $99,999 | 27 (10.8%) | 0 (0.0%) |
| $100,000+ | 25 (10.0%) | 12 (5.7%) |
| Total | 250 (100.0%) | 211 (100.0%) |
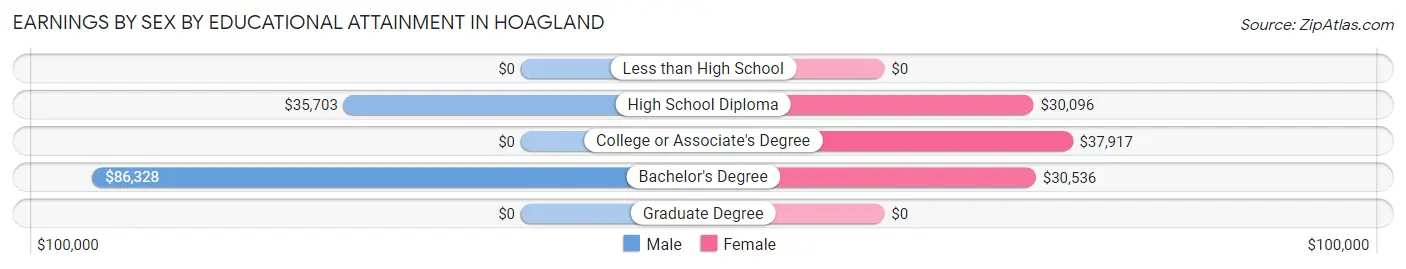
Earnings by Sex by Educational Attainment in Hoagland
Average earnings in Hoagland are $40,341 for men and $31,938 for women, a difference of 20.8%. Men with an educational attainment of bachelor's degree enjoy the highest average annual earnings of $86,328, while those with high school diploma education earn the least with $35,703. Women with an educational attainment of college or associate's degree earn the most with the average annual earnings of $37,917, while those with high school diploma education have the smallest earnings of $30,096.
| Educational Attainment | Male Income | Female Income |
| Less than High School | - | - |
| High School Diploma | $35,703 | $30,096 |
| College or Associate's Degree | - | - |
| Bachelor's Degree | $86,328 | $30,536 |
| Graduate Degree | - | - |
| Total | $40,341 | $31,938 |
Family Income in Hoagland
Family Income Brackets in Hoagland
According to the Hoagland family income data, there are 66 families falling into the $100,000 to $149,999 income range, which is the most common income bracket and makes up 27.2% of all families.
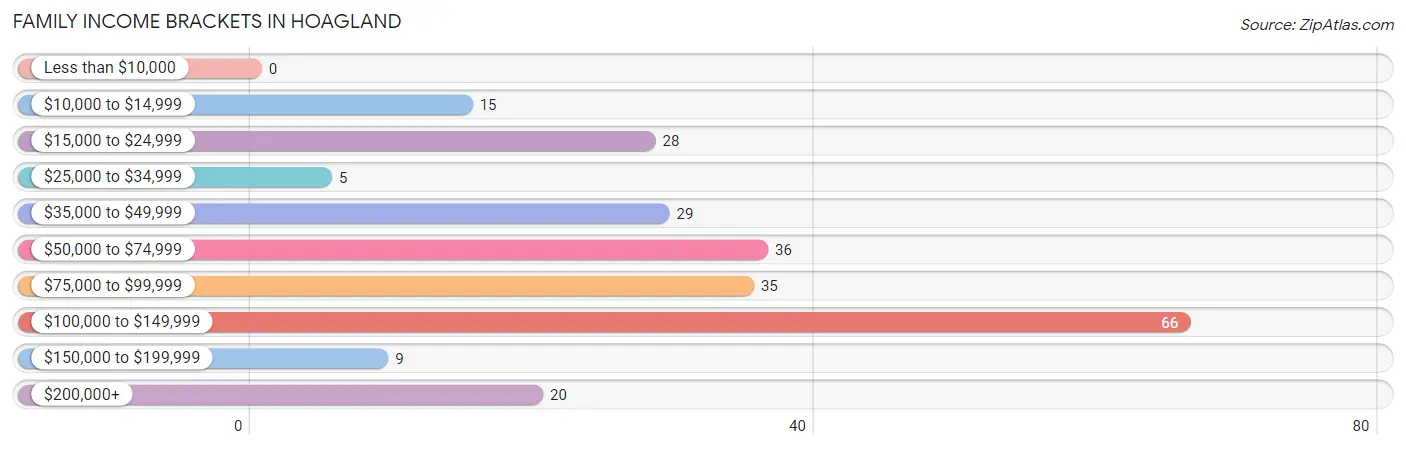
| Income Bracket | # Families | % Families |
| Less than $10,000 | 0 | 0.0% |
| $10,000 to $14,999 | 15 | 6.2% |
| $15,000 to $24,999 | 28 | 11.5% |
| $25,000 to $34,999 | 5 | 2.1% |
| $35,000 to $49,999 | 29 | 11.9% |
| $50,000 to $74,999 | 36 | 14.8% |
| $75,000 to $99,999 | 35 | 14.4% |
| $100,000 to $149,999 | 66 | 27.2% |
| $150,000 to $199,999 | 9 | 3.7% |
| $200,000+ | 20 | 8.2% |
Family Income by Famaliy Size in Hoagland
3-person families (43 | 17.7%) account for the highest median family income in Hoagland with $121,705 per family, while 3-person families (43 | 17.7%) have the highest median income of $40,568 per family member.
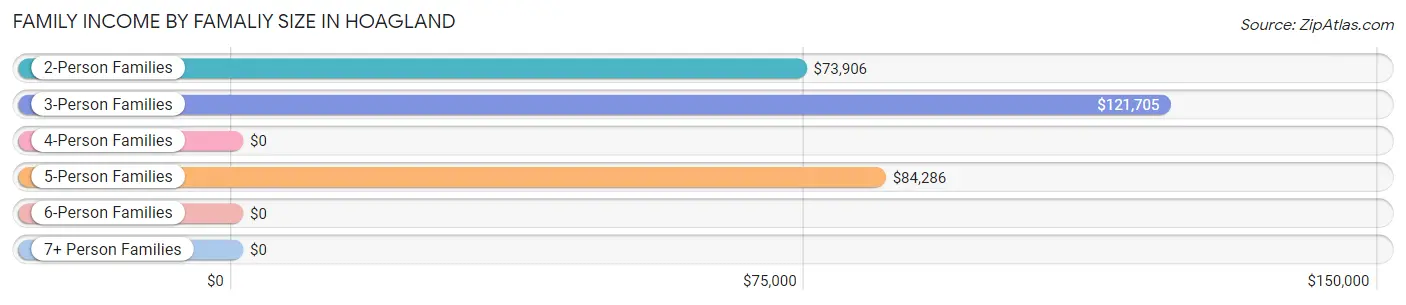
| Income Bracket | # Families | Median Income |
| 2-Person Families | 101 (41.6%) | $73,906 |
| 3-Person Families | 43 (17.7%) | $121,705 |
| 4-Person Families | 62 (25.5%) | $0 |
| 5-Person Families | 24 (9.9%) | $84,286 |
| 6-Person Families | 5 (2.1%) | $0 |
| 7+ Person Families | 8 (3.3%) | $0 |
| Total | 243 (100.0%) | $83,036 |
Family Income by Number of Earners in Hoagland
The median family income in Hoagland is $83,036, with families comprising 2 earners (134) having the highest median family income of $106,750, while families with 1 earner (62) have the lowest median family income of $38,333, accounting for 55.1% and 25.5% of families, respectively.
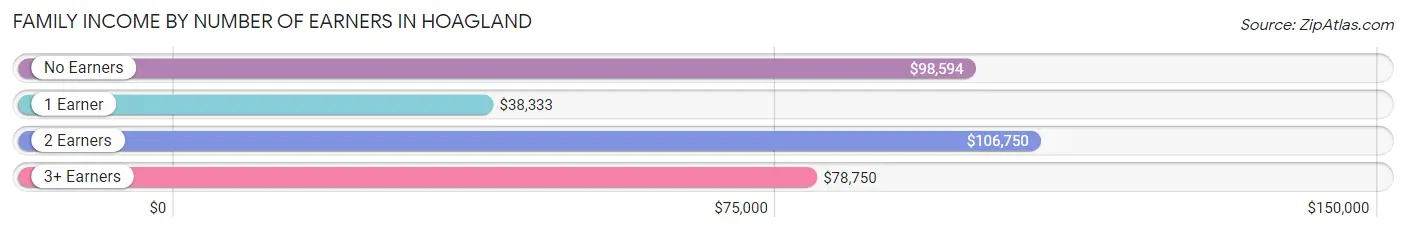
| Number of Earners | # Families | Median Income |
| No Earners | 21 (8.6%) | $98,594 |
| 1 Earner | 62 (25.5%) | $38,333 |
| 2 Earners | 134 (55.1%) | $106,750 |
| 3+ Earners | 26 (10.7%) | $78,750 |
| Total | 243 (100.0%) | $83,036 |
Household Income in Hoagland
Household Income Brackets in Hoagland
With 66 households falling in the category, the $100,000 to $149,999 income range is the most frequent in Hoagland, accounting for 21.4% of all households.
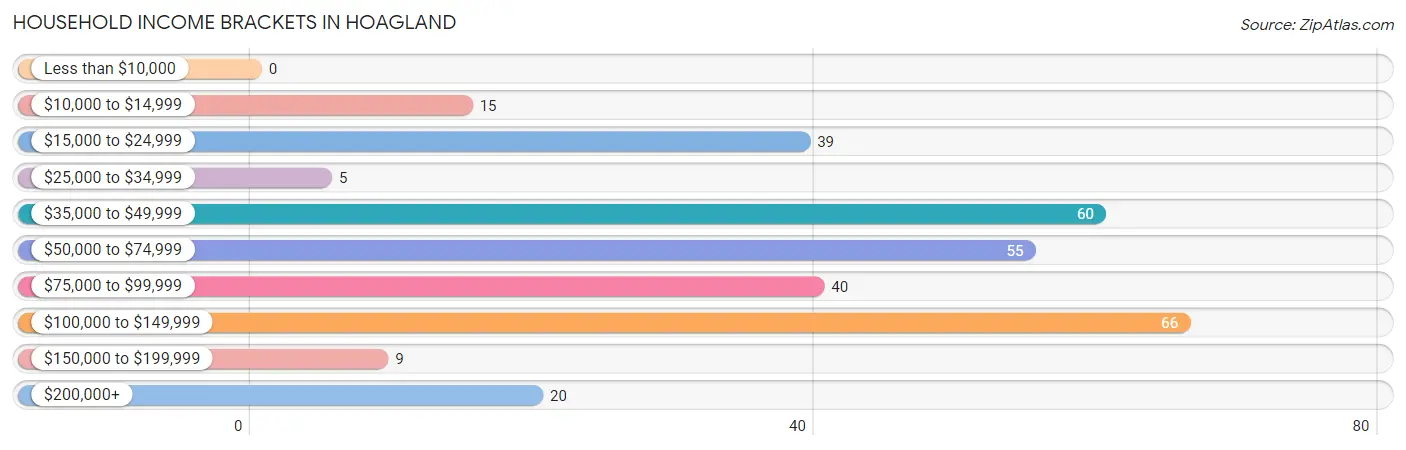
| Income Bracket | # Households | % Households |
| Less than $10,000 | 0 | 0.0% |
| $10,000 to $14,999 | 15 | 4.9% |
| $15,000 to $24,999 | 39 | 12.6% |
| $25,000 to $34,999 | 5 | 1.6% |
| $35,000 to $49,999 | 60 | 19.4% |
| $50,000 to $74,999 | 55 | 17.8% |
| $75,000 to $99,999 | 40 | 12.9% |
| $100,000 to $149,999 | 66 | 21.4% |
| $150,000 to $199,999 | 9 | 2.9% |
| $200,000+ | 20 | 6.5% |
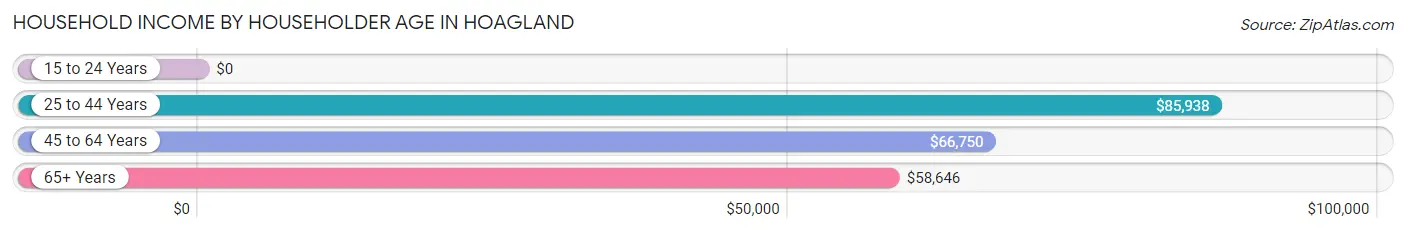
Household Income by Householder Age in Hoagland
The median household income in Hoagland is $65,750, with the highest median household income of $85,938 found in the 25 to 44 years age bracket for the primary householder. A total of 78 households (25.2%) fall into this category. Meanwhile, the 15 to 24 years age bracket for the primary householder has the lowest median household income of $0, with 11 households (3.6%) in this group.
| Income Bracket | # Households | Median Income |
| 15 to 24 Years | 11 (3.6%) | $0 |
| 25 to 44 Years | 78 (25.2%) | $85,938 |
| 45 to 64 Years | 137 (44.3%) | $66,750 |
| 65+ Years | 83 (26.9%) | $58,646 |
| Total | 309 (100.0%) | $65,750 |
Poverty in Hoagland
Income Below Poverty by Sex and Age in Hoagland
With 10.3% poverty level for males and 16.0% for females among the residents of Hoagland, 12 to 14 year old males and 16 and 17 year old females are the most vulnerable to poverty, with 8 males (40.0%) and 14 females (100.0%) in their respective age groups living below the poverty level.
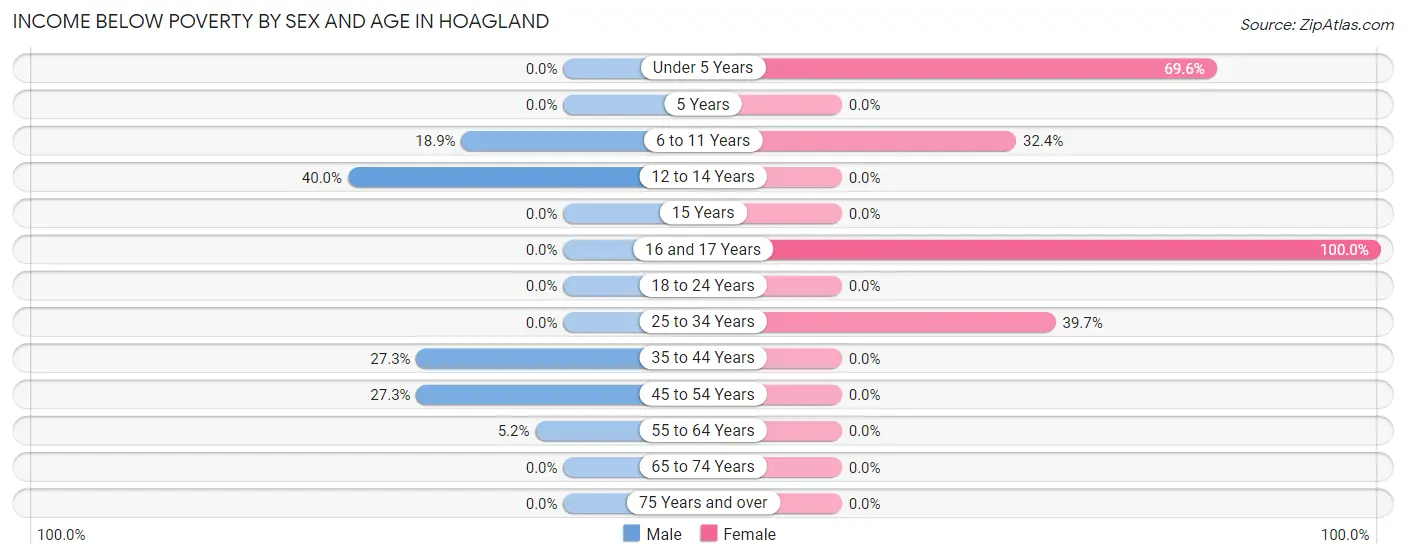
| Age Bracket | Male | Female |
| Under 5 Years | 0 (0.0%) | 16 (69.6%) |
| 5 Years | 0 (0.0%) | 0 (0.0%) |
| 6 to 11 Years | 14 (18.9%) | 11 (32.4%) |
| 12 to 14 Years | 8 (40.0%) | 0 (0.0%) |
| 15 Years | 0 (0.0%) | 0 (0.0%) |
| 16 and 17 Years | 0 (0.0%) | 14 (100.0%) |
| 18 to 24 Years | 0 (0.0%) | 0 (0.0%) |
| 25 to 34 Years | 0 (0.0%) | 25 (39.7%) |
| 35 to 44 Years | 6 (27.3%) | 0 (0.0%) |
| 45 to 54 Years | 15 (27.3%) | 0 (0.0%) |
| 55 to 64 Years | 5 (5.2%) | 0 (0.0%) |
| 65 to 74 Years | 0 (0.0%) | 0 (0.0%) |
| 75 Years and over | 0 (0.0%) | 0 (0.0%) |
| Total | 48 (10.3%) | 66 (16.0%) |
Income Above Poverty by Sex and Age in Hoagland
According to the poverty statistics in Hoagland, males aged under 5 years and females aged 12 to 14 years are the age groups that are most secure financially, with 100.0% of males and 100.0% of females in these age groups living above the poverty line.
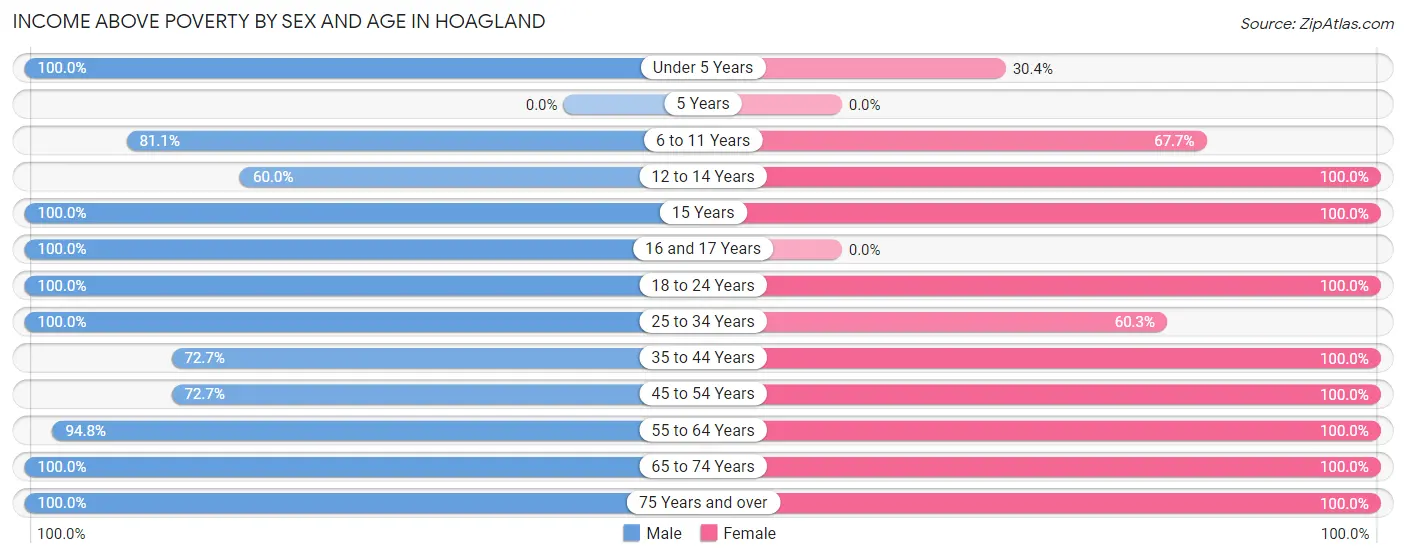
| Age Bracket | Male | Female |
| Under 5 Years | 37 (100.0%) | 7 (30.4%) |
| 5 Years | 0 (0.0%) | 0 (0.0%) |
| 6 to 11 Years | 60 (81.1%) | 23 (67.6%) |
| 12 to 14 Years | 12 (60.0%) | 19 (100.0%) |
| 15 Years | 23 (100.0%) | 13 (100.0%) |
| 16 and 17 Years | 9 (100.0%) | 0 (0.0%) |
| 18 to 24 Years | 37 (100.0%) | 21 (100.0%) |
| 25 to 34 Years | 34 (100.0%) | 38 (60.3%) |
| 35 to 44 Years | 16 (72.7%) | 57 (100.0%) |
| 45 to 54 Years | 40 (72.7%) | 45 (100.0%) |
| 55 to 64 Years | 91 (94.8%) | 39 (100.0%) |
| 65 to 74 Years | 28 (100.0%) | 22 (100.0%) |
| 75 Years and over | 31 (100.0%) | 62 (100.0%) |
| Total | 418 (89.7%) | 346 (84.0%) |
Income Below Poverty Among Married-Couple Families in Hoagland
The poverty statistics for married-couple families in Hoagland show that 9.0% or 15 of the total 167 families live below the poverty line. Families with 1 or 2 children have the highest poverty rate of 22.1%, comprising of 15 families. On the other hand, families with no children have the lowest poverty rate of 0.0%, which includes 0 families.
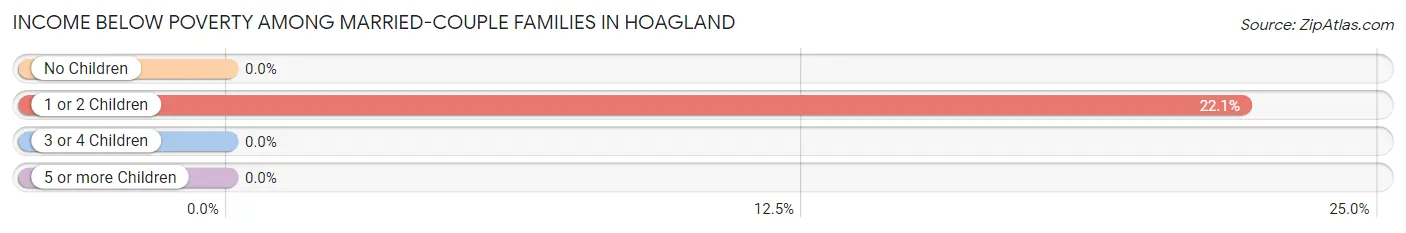
| Children | Above Poverty | Below Poverty |
| No Children | 92 (100.0%) | 0 (0.0%) |
| 1 or 2 Children | 53 (77.9%) | 15 (22.1%) |
| 3 or 4 Children | 7 (100.0%) | 0 (0.0%) |
| 5 or more Children | 0 (0.0%) | 0 (0.0%) |
| Total | 152 (91.0%) | 15 (9.0%) |
Income Below Poverty Among Single-Parent Households in Hoagland
According to the poverty data in Hoagland, 23.1% or 6 single-father households and 18.0% or 9 single-mother households are living below the poverty line. Among single-father households, those with 1 or 2 children have the highest poverty rate, with 6 households (40.0%) experiencing poverty. Likewise, among single-mother households, those with 3 or 4 children have the highest poverty rate, with 9 households (100.0%) falling below the poverty line.
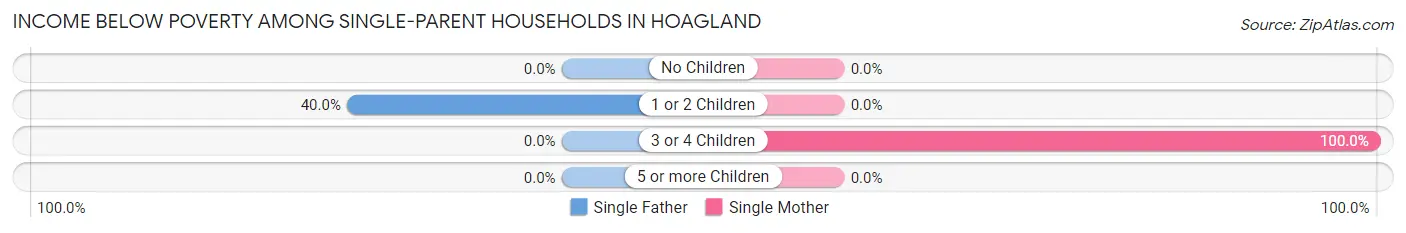
| Children | Single Father | Single Mother |
| No Children | 0 (0.0%) | 0 (0.0%) |
| 1 or 2 Children | 6 (40.0%) | 0 (0.0%) |
| 3 or 4 Children | 0 (0.0%) | 9 (100.0%) |
| 5 or more Children | 0 (0.0%) | 0 (0.0%) |
| Total | 6 (23.1%) | 9 (18.0%) |
Income Below Poverty Among Married-Couple vs Single-Parent Households in Hoagland
The poverty data for Hoagland shows that 15 of the married-couple family households (9.0%) and 15 of the single-parent households (19.7%) are living below the poverty level. Within the married-couple family households, those with 1 or 2 children have the highest poverty rate, with 15 households (22.1%) falling below the poverty line. Among the single-parent households, those with 3 or 4 children have the highest poverty rate, with 9 household (100.0%) living below poverty.
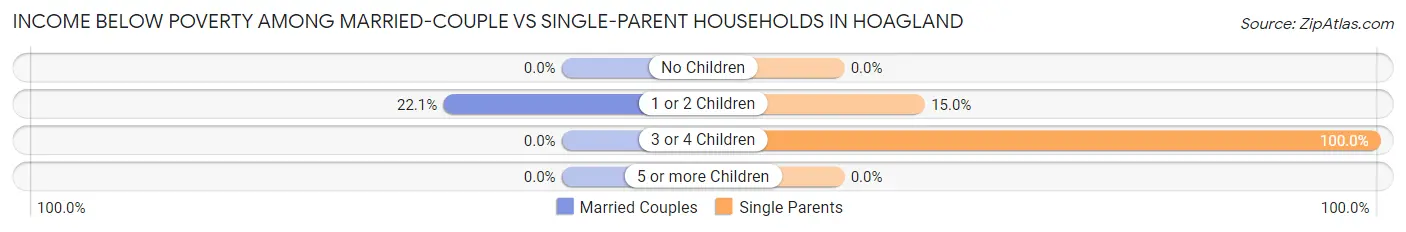
| Children | Married-Couple Families | Single-Parent Households |
| No Children | 0 (0.0%) | 0 (0.0%) |
| 1 or 2 Children | 15 (22.1%) | 6 (15.0%) |
| 3 or 4 Children | 0 (0.0%) | 9 (100.0%) |
| 5 or more Children | 0 (0.0%) | 0 (0.0%) |
| Total | 15 (9.0%) | 15 (19.7%) |
Race in Hoagland
The most populous races in Hoagland are White / Caucasian (870 | 99.1%), Hispanic or Latino (8 | 0.9%), and Two or more Races (8 | 0.9%).
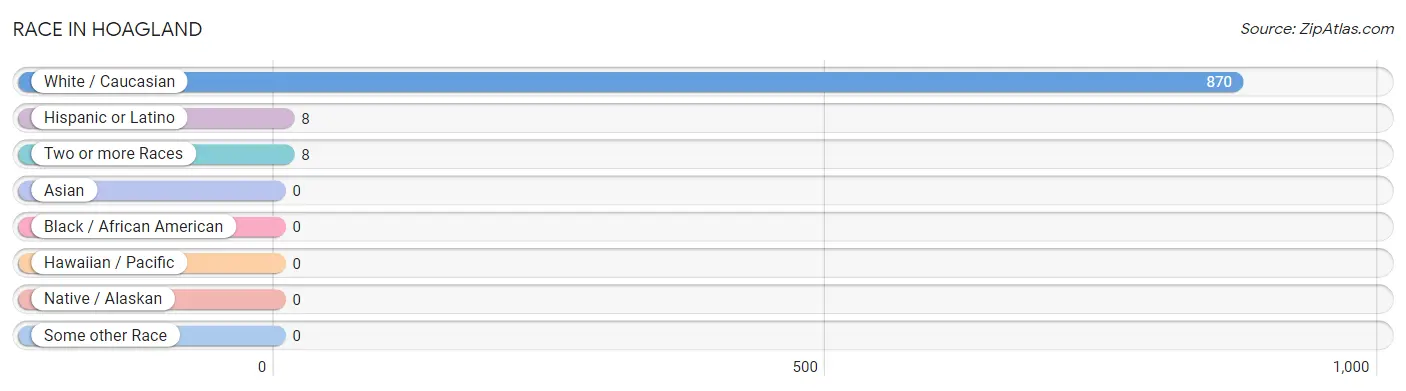
| Race | # Population | % Population |
| Asian | 0 | 0.0% |
| Black / African American | 0 | 0.0% |
| Hawaiian / Pacific | 0 | 0.0% |
| Hispanic or Latino | 8 | 0.9% |
| Native / Alaskan | 0 | 0.0% |
| White / Caucasian | 870 | 99.1% |
| Two or more Races | 8 | 0.9% |
| Some other Race | 0 | 0.0% |
| Total | 878 | 100.0% |
Ancestry in Hoagland
The most populous ancestries reported in Hoagland are German (421 | 47.9%), American (81 | 9.2%), Irish (67 | 7.6%), English (48 | 5.5%), and Italian (38 | 4.3%), together accounting for 74.6% of all Hoagland residents.
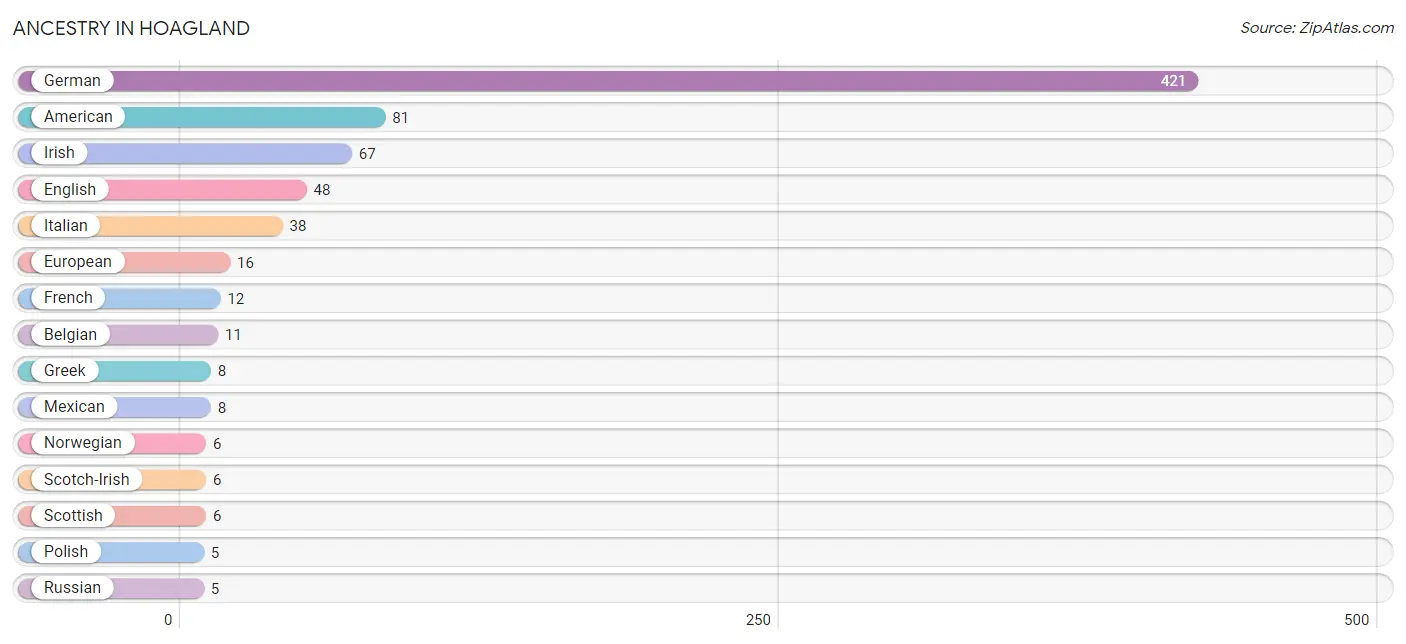
| Ancestry | # Population | % Population |
| American | 81 | 9.2% |
| Belgian | 11 | 1.3% |
| English | 48 | 5.5% |
| European | 16 | 1.8% |
| French | 12 | 1.4% |
| German | 421 | 47.9% |
| Greek | 8 | 0.9% |
| Irish | 67 | 7.6% |
| Italian | 38 | 4.3% |
| Mexican | 8 | 0.9% |
| Norwegian | 6 | 0.7% |
| Polish | 5 | 0.6% |
| Russian | 5 | 0.6% |
| Scotch-Irish | 6 | 0.7% |
| Scottish | 6 | 0.7% | View All 15 Rows |
Immigrants in Hoagland

| Immigration Origin | # Population | % Population | View All 0 Rows |
Sex and Age in Hoagland
Sex and Age in Hoagland
The most populous age groups in Hoagland are 60 to 64 Years (67 | 14.4%) for men and 30 to 34 Years (33 | 8.0%) for women.
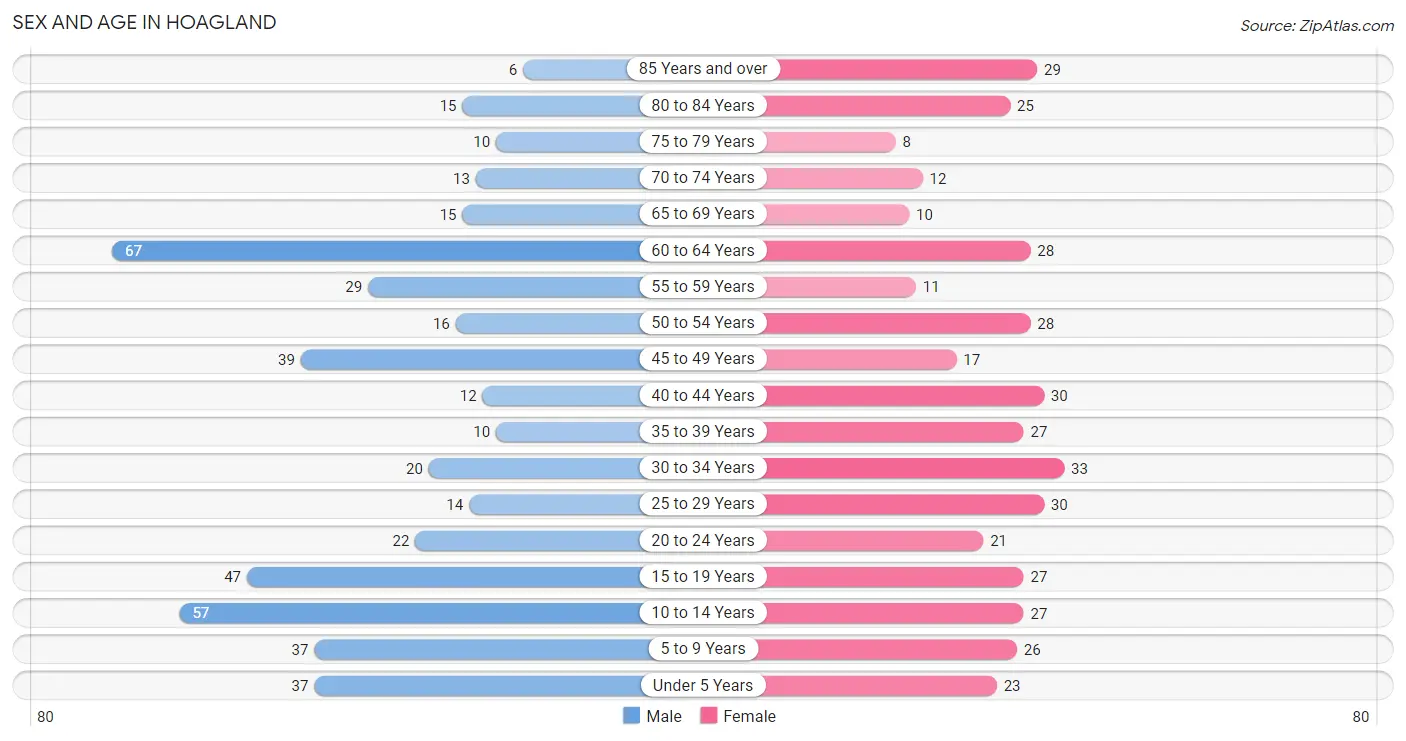
| Age Bracket | Male | Female |
| Under 5 Years | 37 (7.9%) | 23 (5.6%) |
| 5 to 9 Years | 37 (7.9%) | 26 (6.3%) |
| 10 to 14 Years | 57 (12.2%) | 27 (6.6%) |
| 15 to 19 Years | 47 (10.1%) | 27 (6.6%) |
| 20 to 24 Years | 22 (4.7%) | 21 (5.1%) |
| 25 to 29 Years | 14 (3.0%) | 30 (7.3%) |
| 30 to 34 Years | 20 (4.3%) | 33 (8.0%) |
| 35 to 39 Years | 10 (2.1%) | 27 (6.6%) |
| 40 to 44 Years | 12 (2.6%) | 30 (7.3%) |
| 45 to 49 Years | 39 (8.4%) | 17 (4.1%) |
| 50 to 54 Years | 16 (3.4%) | 28 (6.8%) |
| 55 to 59 Years | 29 (6.2%) | 11 (2.7%) |
| 60 to 64 Years | 67 (14.4%) | 28 (6.8%) |
| 65 to 69 Years | 15 (3.2%) | 10 (2.4%) |
| 70 to 74 Years | 13 (2.8%) | 12 (2.9%) |
| 75 to 79 Years | 10 (2.1%) | 8 (1.9%) |
| 80 to 84 Years | 15 (3.2%) | 25 (6.1%) |
| 85 Years and over | 6 (1.3%) | 29 (7.0%) |
| Total | 466 (100.0%) | 412 (100.0%) |
Families and Households in Hoagland
Median Family Size in Hoagland
The median family size in Hoagland is 3.32 persons per family, with single male/father families (26 | 10.7%) accounting for the largest median family size of 4.5 persons per family. On the other hand, single female/mother families (50 | 20.6%) represent the smallest median family size with 2.90 persons per family.
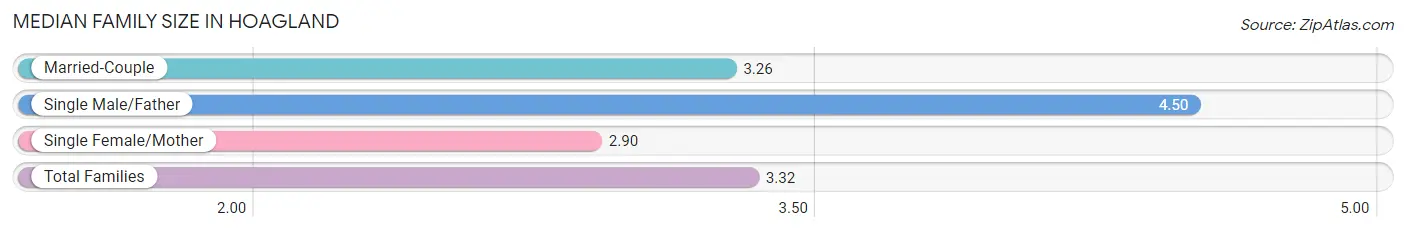
| Family Type | # Families | Family Size |
| Married-Couple | 167 (68.7%) | 3.26 |
| Single Male/Father | 26 (10.7%) | 4.50 |
| Single Female/Mother | 50 (20.6%) | 2.90 |
| Total Families | 243 (100.0%) | 3.32 |
Median Household Size in Hoagland
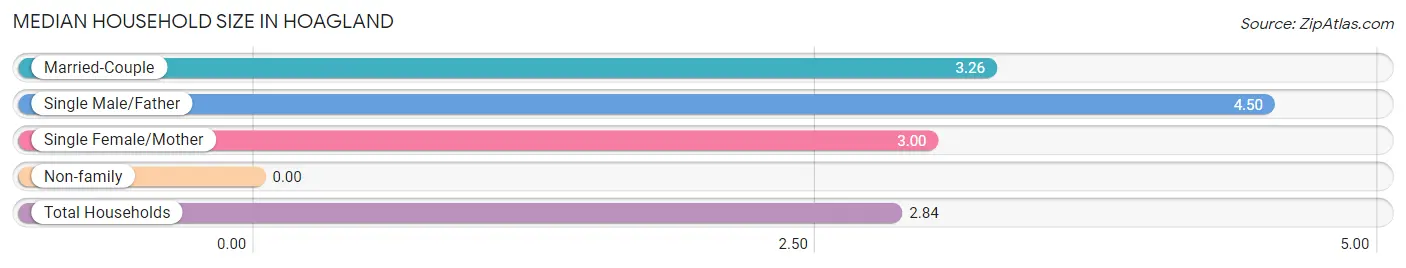
| Household Type | # Households | Household Size |
| Married-Couple | 167 (54.0%) | 3.26 |
| Single Male/Father | 26 (8.4%) | 4.50 |
| Single Female/Mother | 50 (16.2%) | 3.00 |
| Non-family | 66 (21.4%) | - |
| Total Households | 309 (100.0%) | 2.84 |
Household Size by Marriage Status in Hoagland
Out of a total of 309 households in Hoagland, 243 (78.6%) are family households, while 66 (21.4%) are nonfamily households. The most numerous type of family households are 2-person households, comprising 101, and the most common type of nonfamily households are 1-person households, comprising 66.
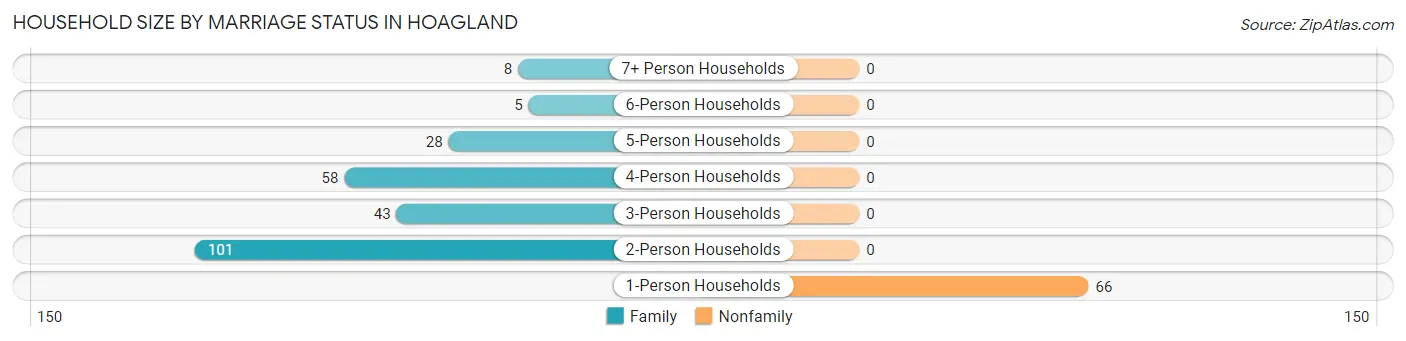
| Household Size | Family Households | Nonfamily Households |
| 1-Person Households | - | 66 (21.4%) |
| 2-Person Households | 101 (32.7%) | 0 (0.0%) |
| 3-Person Households | 43 (13.9%) | 0 (0.0%) |
| 4-Person Households | 58 (18.8%) | 0 (0.0%) |
| 5-Person Households | 28 (9.1%) | 0 (0.0%) |
| 6-Person Households | 5 (1.6%) | 0 (0.0%) |
| 7+ Person Households | 8 (2.6%) | 0 (0.0%) |
| Total | 243 (78.6%) | 66 (21.4%) |
Female Fertility in Hoagland
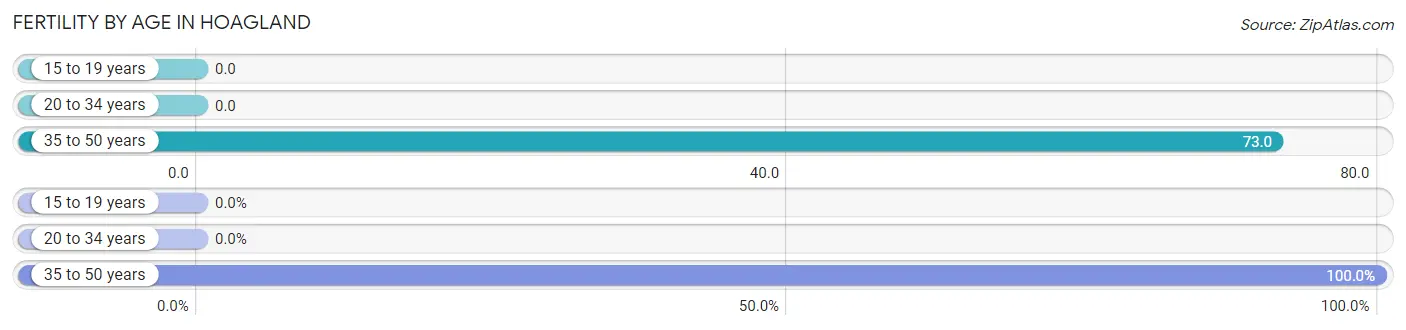
Fertility by Age in Hoagland
Average fertility rate in Hoagland is 31.0 births per 1,000 women. Women in the age bracket of 35 to 50 years have the highest fertility rate with 73.0 births per 1,000 women. Women in the age bracket of 35 to 50 years acount for 100.0% of all women with births.
| Age Bracket | Women with Births | Births / 1,000 Women |
| 15 to 19 years | 0 (0.0%) | 0.0 |
| 20 to 34 years | 0 (0.0%) | 0.0 |
| 35 to 50 years | 6 (100.0%) | 73.0 |
| Total | 6 (100.0%) | 31.0 |
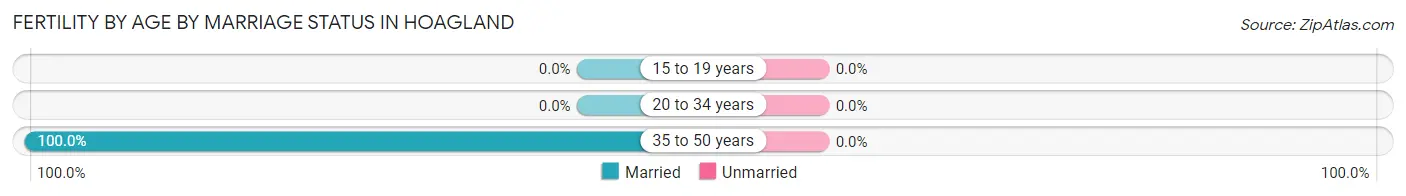
Fertility by Age by Marriage Status in Hoagland
| Age Bracket | Married | Unmarried |
| 15 to 19 years | 0 (0.0%) | 0 (0.0%) |
| 20 to 34 years | 0 (0.0%) | 0 (0.0%) |
| 35 to 50 years | 6 (100.0%) | 0 (0.0%) |
| Total | 6 (100.0%) | 0 (0.0%) |
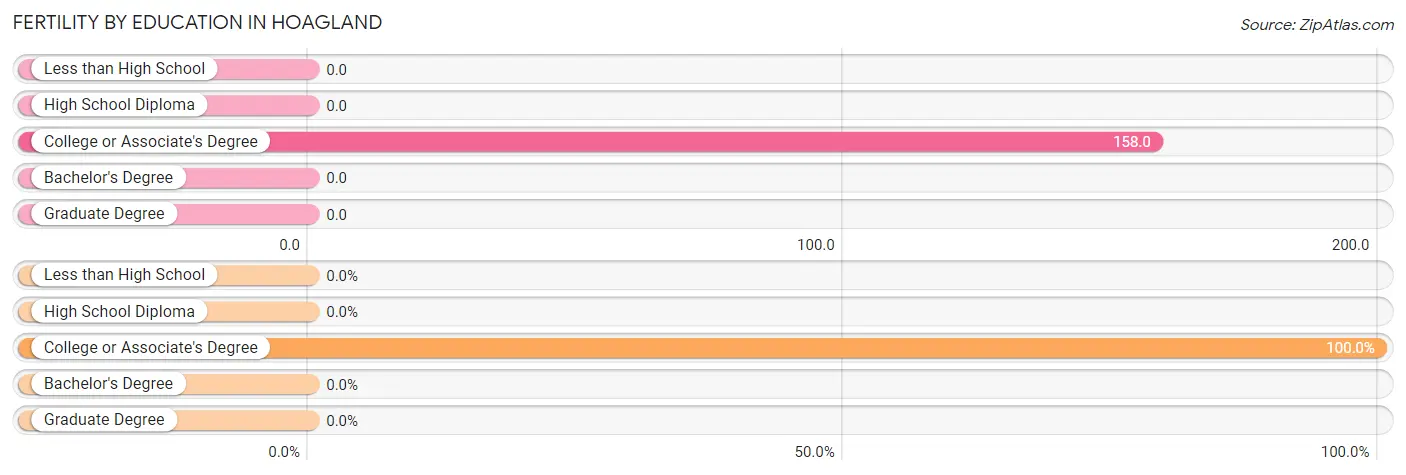
Fertility by Education in Hoagland
| Educational Attainment | Women with Births | Births / 1,000 Women |
| Less than High School | 0 (0.0%) | 0.0 |
| High School Diploma | 0 (0.0%) | 0.0 |
| College or Associate's Degree | 6 (100.0%) | 158.0 |
| Bachelor's Degree | 0 (0.0%) | 0.0 |
| Graduate Degree | 0 (0.0%) | 0.0 |
| Total | 6 (100.0%) | 31.0 |
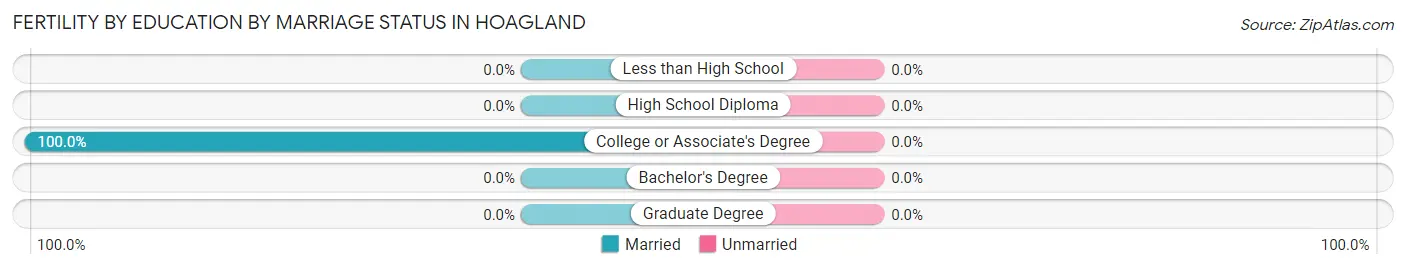
Fertility by Education by Marriage Status in Hoagland
| Educational Attainment | Married | Unmarried |
| Less than High School | 0 (0.0%) | 0 (0.0%) |
| High School Diploma | 0 (0.0%) | 0 (0.0%) |
| College or Associate's Degree | 6 (100.0%) | 0 (0.0%) |
| Bachelor's Degree | 0 (0.0%) | 0 (0.0%) |
| Graduate Degree | 0 (0.0%) | 0 (0.0%) |
| Total | 6 (100.0%) | 0 (0.0%) |
Employment Characteristics in Hoagland
Employment by Class of Employer in Hoagland
Among the 417 employed individuals in Hoagland, private company employees (254 | 60.9%), not-for-profit organizations (55 | 13.2%), and self-employed (not incorporated) (43 | 10.3%) make up the most common classes of employment.
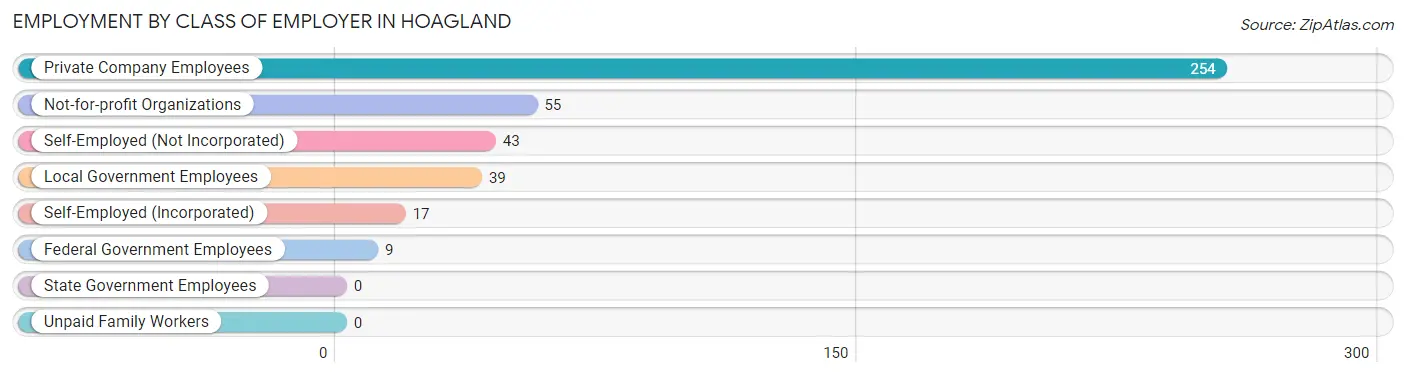
| Employer Class | # Employees | % Employees |
| Private Company Employees | 254 | 60.9% |
| Self-Employed (Incorporated) | 17 | 4.1% |
| Self-Employed (Not Incorporated) | 43 | 10.3% |
| Not-for-profit Organizations | 55 | 13.2% |
| Local Government Employees | 39 | 9.3% |
| State Government Employees | 0 | 0.0% |
| Federal Government Employees | 9 | 2.2% |
| Unpaid Family Workers | 0 | 0.0% |
| Total | 417 | 100.0% |
Employment Status by Age in Hoagland
According to the labor force statistics for Hoagland, out of the total population over 16 years of age (635), 69.3% or 440 individuals are in the labor force, with 3.2% or 14 of them unemployed. The age group with the highest labor force participation rate is 25 to 29 years, with 100.0% or 44 individuals in the labor force. Within the labor force, the 16 to 19 years age range has the highest percentage of unemployed individuals, with 63.6% or 14 of them being unemployed.
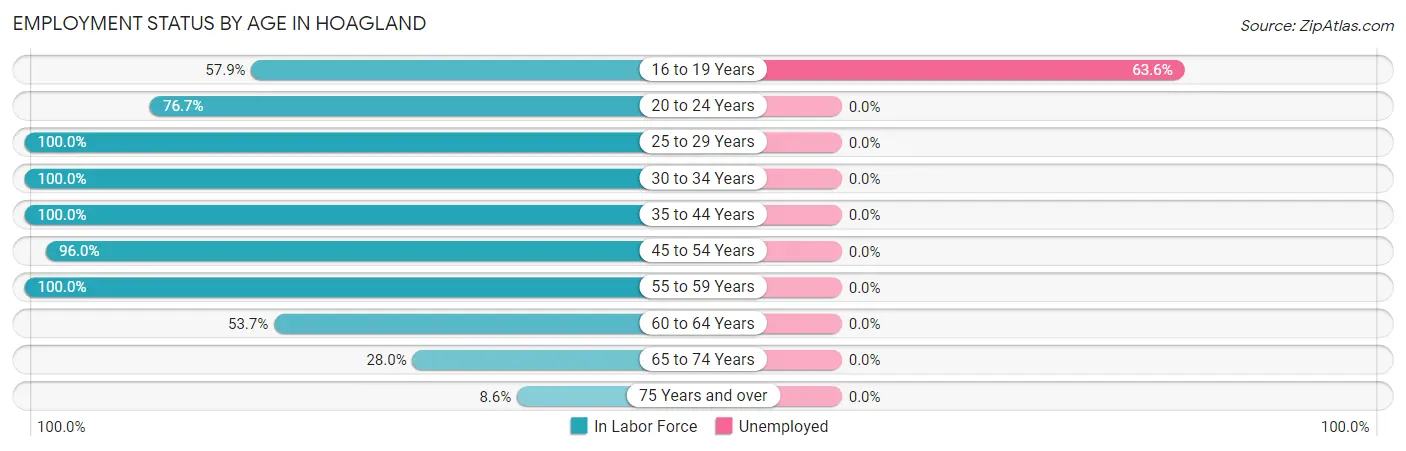
| Age Bracket | In Labor Force | Unemployed |
| 16 to 19 Years | 22 (57.9%) | 14 (63.6%) |
| 20 to 24 Years | 33 (76.7%) | 0 (0.0%) |
| 25 to 29 Years | 44 (100.0%) | 0 (0.0%) |
| 30 to 34 Years | 53 (100.0%) | 0 (0.0%) |
| 35 to 44 Years | 79 (100.0%) | 0 (0.0%) |
| 45 to 54 Years | 96 (96.0%) | 0 (0.0%) |
| 55 to 59 Years | 40 (100.0%) | 0 (0.0%) |
| 60 to 64 Years | 51 (53.7%) | 0 (0.0%) |
| 65 to 74 Years | 14 (28.0%) | 0 (0.0%) |
| 75 Years and over | 8 (8.6%) | 0 (0.0%) |
| Total | 440 (69.3%) | 14 (3.2%) |
Employment Status by Educational Attainment in Hoagland
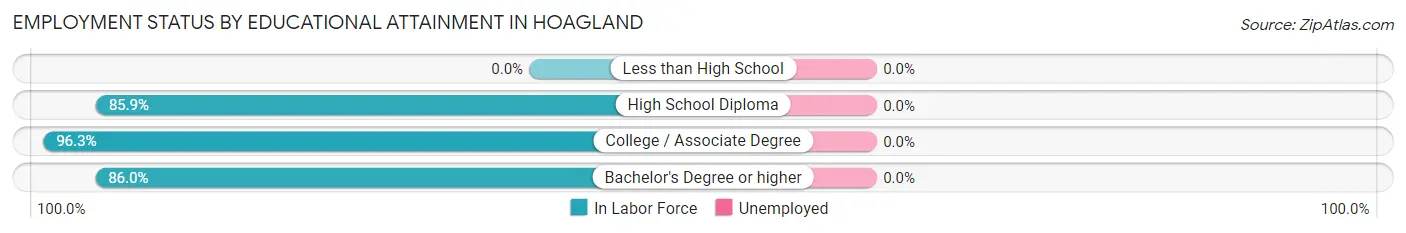
| Educational Attainment | In Labor Force | Unemployed |
| Less than High School | 0 (0.0%) | 0 (0.0%) |
| High School Diploma | 146 (85.9%) | 0 (0.0%) |
| College / Associate Degree | 131 (96.3%) | 0 (0.0%) |
| Bachelor's Degree or higher | 86 (86.0%) | 0 (0.0%) |
| Total | 363 (88.3%) | 0 (0.0%) |
Employment Occupations by Sex in Hoagland
Management, Business, Science and Arts Occupations
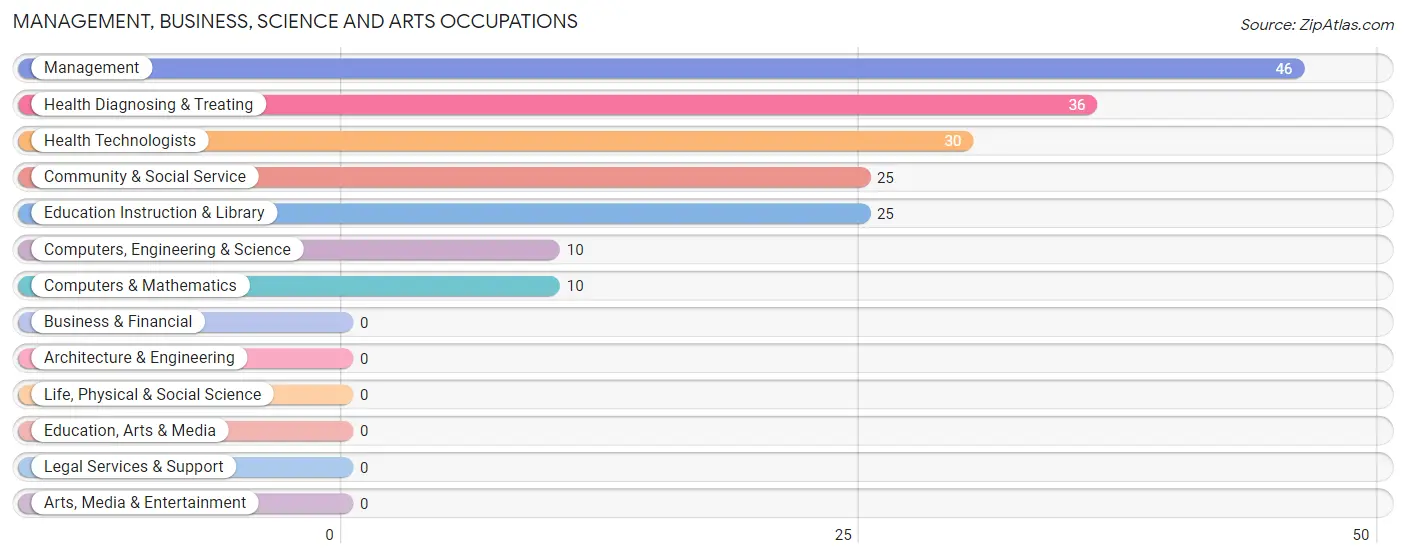
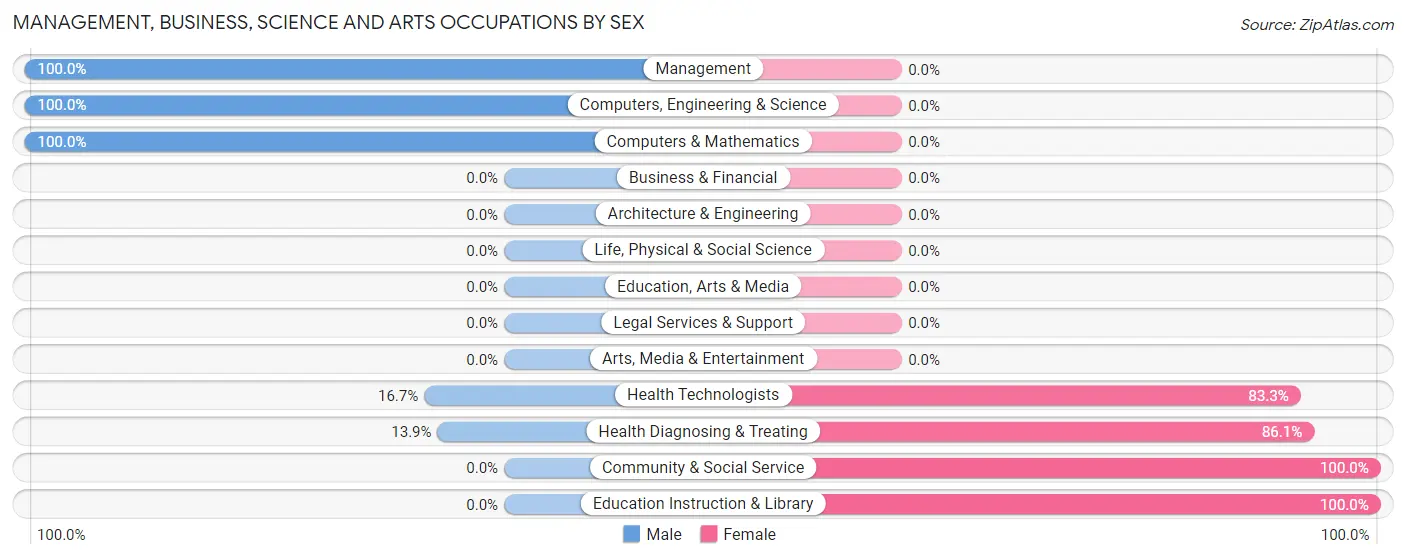
The most common Management, Business, Science and Arts occupations in Hoagland are Management (46 | 10.8%), Health Diagnosing & Treating (36 | 8.5%), Health Technologists (30 | 7.0%), Community & Social Service (25 | 5.9%), and Education Instruction & Library (25 | 5.9%).
Management, Business, Science and Arts Occupations by Sex
Within the Management, Business, Science and Arts occupations in Hoagland, the most male-oriented occupations are Management (100.0%), Computers, Engineering & Science (100.0%), and Computers & Mathematics (100.0%), while the most female-oriented occupations are Community & Social Service (100.0%), Education Instruction & Library (100.0%), and Health Diagnosing & Treating (86.1%).
| Occupation | Male | Female |
| Management | 46 (100.0%) | 0 (0.0%) |
| Business & Financial | 0 (0.0%) | 0 (0.0%) |
| Computers, Engineering & Science | 10 (100.0%) | 0 (0.0%) |
| Computers & Mathematics | 10 (100.0%) | 0 (0.0%) |
| Architecture & Engineering | 0 (0.0%) | 0 (0.0%) |
| Life, Physical & Social Science | 0 (0.0%) | 0 (0.0%) |
| Community & Social Service | 0 (0.0%) | 25 (100.0%) |
| Education, Arts & Media | 0 (0.0%) | 0 (0.0%) |
| Legal Services & Support | 0 (0.0%) | 0 (0.0%) |
| Education Instruction & Library | 0 (0.0%) | 25 (100.0%) |
| Arts, Media & Entertainment | 0 (0.0%) | 0 (0.0%) |
| Health Diagnosing & Treating | 5 (13.9%) | 31 (86.1%) |
| Health Technologists | 5 (16.7%) | 25 (83.3%) |
| Total (Category) | 61 (52.1%) | 56 (47.9%) |
| Total (Overall) | 219 (51.4%) | 207 (48.6%) |
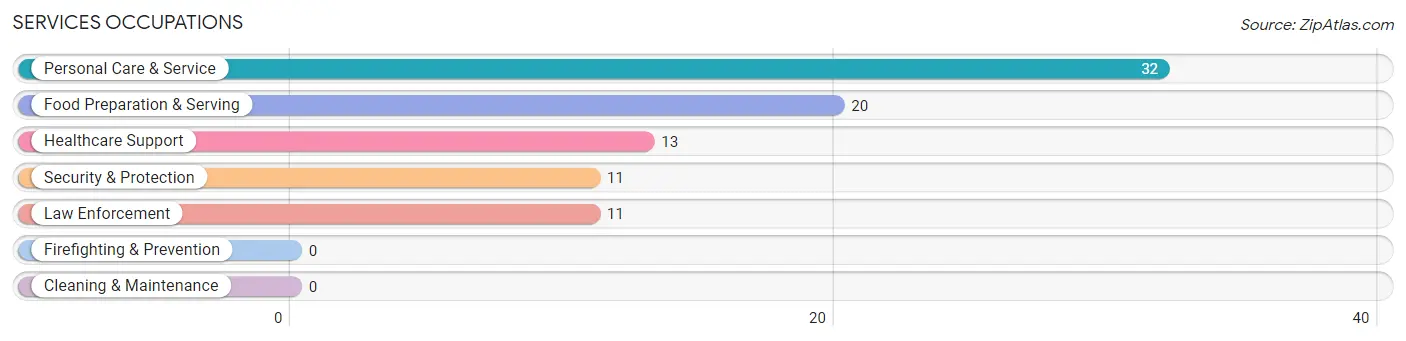
Services Occupations
The most common Services occupations in Hoagland are Personal Care & Service (32 | 7.5%), Food Preparation & Serving (20 | 4.7%), Healthcare Support (13 | 3.0%), Security & Protection (11 | 2.6%), and Law Enforcement (11 | 2.6%).
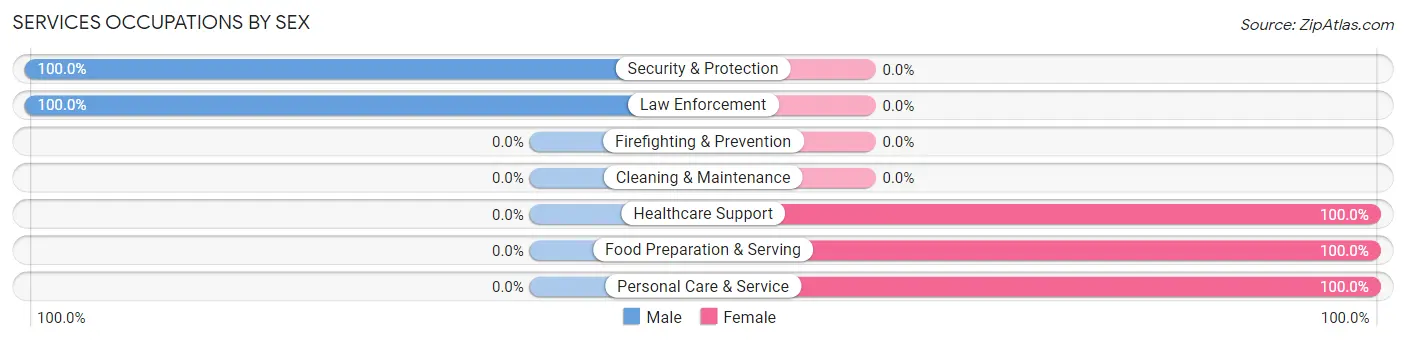
Services Occupations by Sex
Within the Services occupations in Hoagland, the most male-oriented occupations are Security & Protection (100.0%), and Law Enforcement (100.0%), while the most female-oriented occupations are Healthcare Support (100.0%), Food Preparation & Serving (100.0%), and Personal Care & Service (100.0%).
| Occupation | Male | Female |
| Healthcare Support | 0 (0.0%) | 13 (100.0%) |
| Security & Protection | 11 (100.0%) | 0 (0.0%) |
| Firefighting & Prevention | 0 (0.0%) | 0 (0.0%) |
| Law Enforcement | 11 (100.0%) | 0 (0.0%) |
| Food Preparation & Serving | 0 (0.0%) | 20 (100.0%) |
| Cleaning & Maintenance | 0 (0.0%) | 0 (0.0%) |
| Personal Care & Service | 0 (0.0%) | 32 (100.0%) |
| Total (Category) | 11 (14.5%) | 65 (85.5%) |
| Total (Overall) | 219 (51.4%) | 207 (48.6%) |
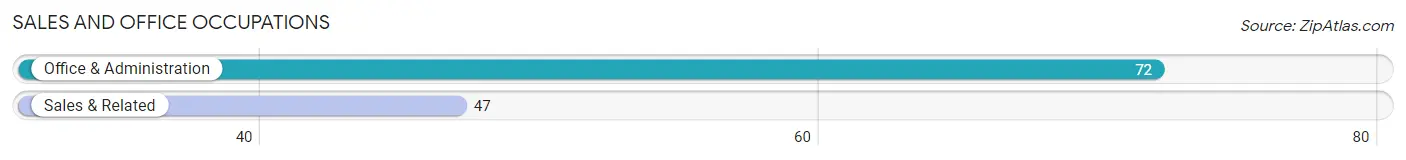
Sales and Office Occupations
The most common Sales and Office occupations in Hoagland are Office & Administration (72 | 16.9%), and Sales & Related (47 | 11.0%).
Sales and Office Occupations by Sex
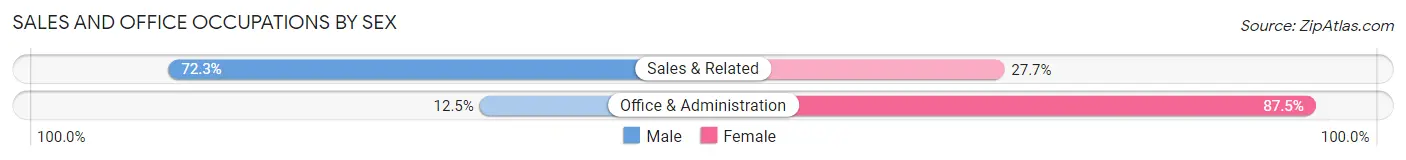
| Occupation | Male | Female |
| Sales & Related | 34 (72.3%) | 13 (27.7%) |
| Office & Administration | 9 (12.5%) | 63 (87.5%) |
| Total (Category) | 43 (36.1%) | 76 (63.9%) |
| Total (Overall) | 219 (51.4%) | 207 (48.6%) |
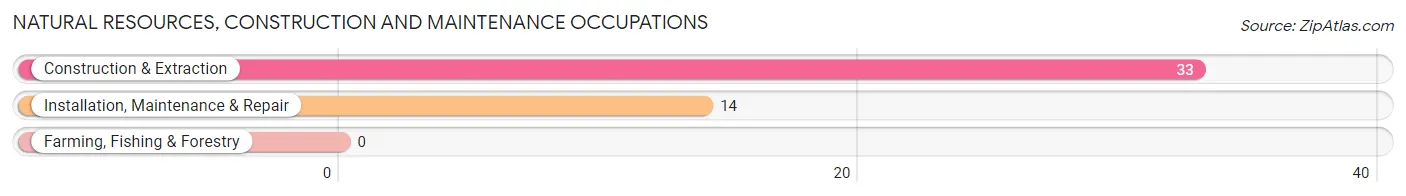
Natural Resources, Construction and Maintenance Occupations
The most common Natural Resources, Construction and Maintenance occupations in Hoagland are Construction & Extraction (33 | 7.7%), and Installation, Maintenance & Repair (14 | 3.3%).
Natural Resources, Construction and Maintenance Occupations by Sex
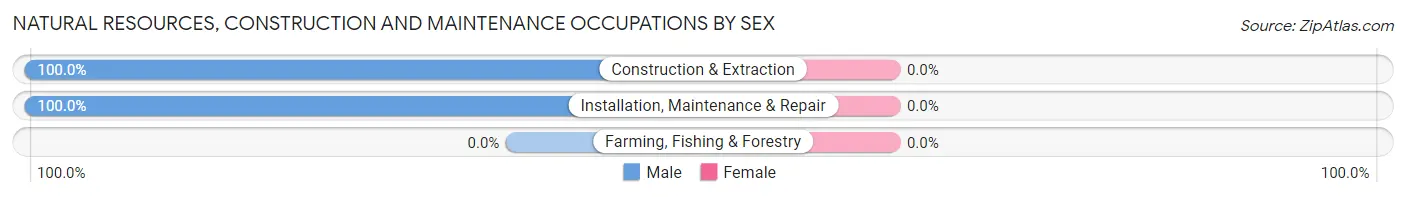
| Occupation | Male | Female |
| Farming, Fishing & Forestry | 0 (0.0%) | 0 (0.0%) |
| Construction & Extraction | 33 (100.0%) | 0 (0.0%) |
| Installation, Maintenance & Repair | 14 (100.0%) | 0 (0.0%) |
| Total (Category) | 47 (100.0%) | 0 (0.0%) |
| Total (Overall) | 219 (51.4%) | 207 (48.6%) |
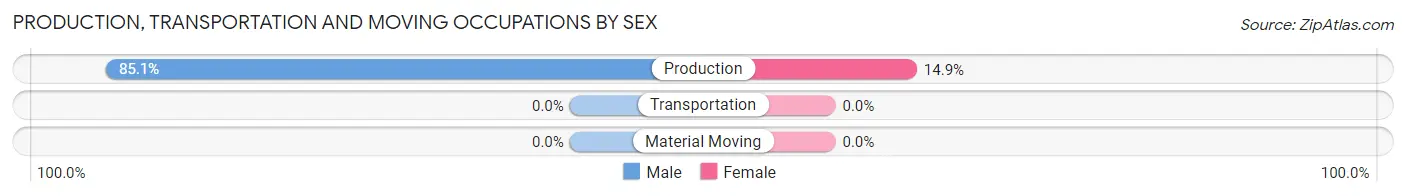
Production, Transportation and Moving Occupations
The most common Production, Transportation and Moving occupations in Hoagland are , and Production (67 | 15.7%).
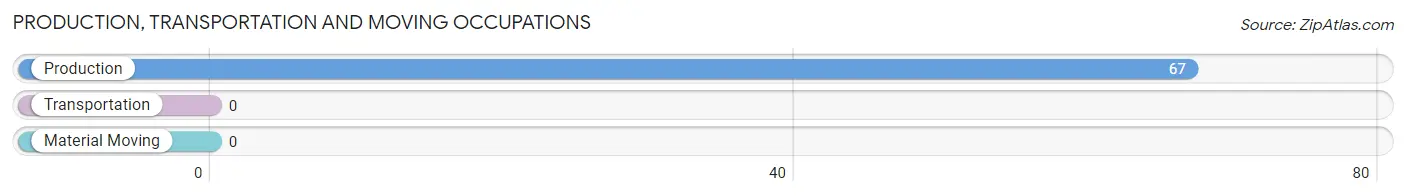
Production, Transportation and Moving Occupations by Sex
| Occupation | Male | Female |
| Production | 57 (85.1%) | 10 (14.9%) |
| Transportation | 0 (0.0%) | 0 (0.0%) |
| Material Moving | 0 (0.0%) | 0 (0.0%) |
| Total (Category) | 57 (85.1%) | 10 (14.9%) |
| Total (Overall) | 219 (51.4%) | 207 (48.6%) |
Employment Industries by Sex in Hoagland
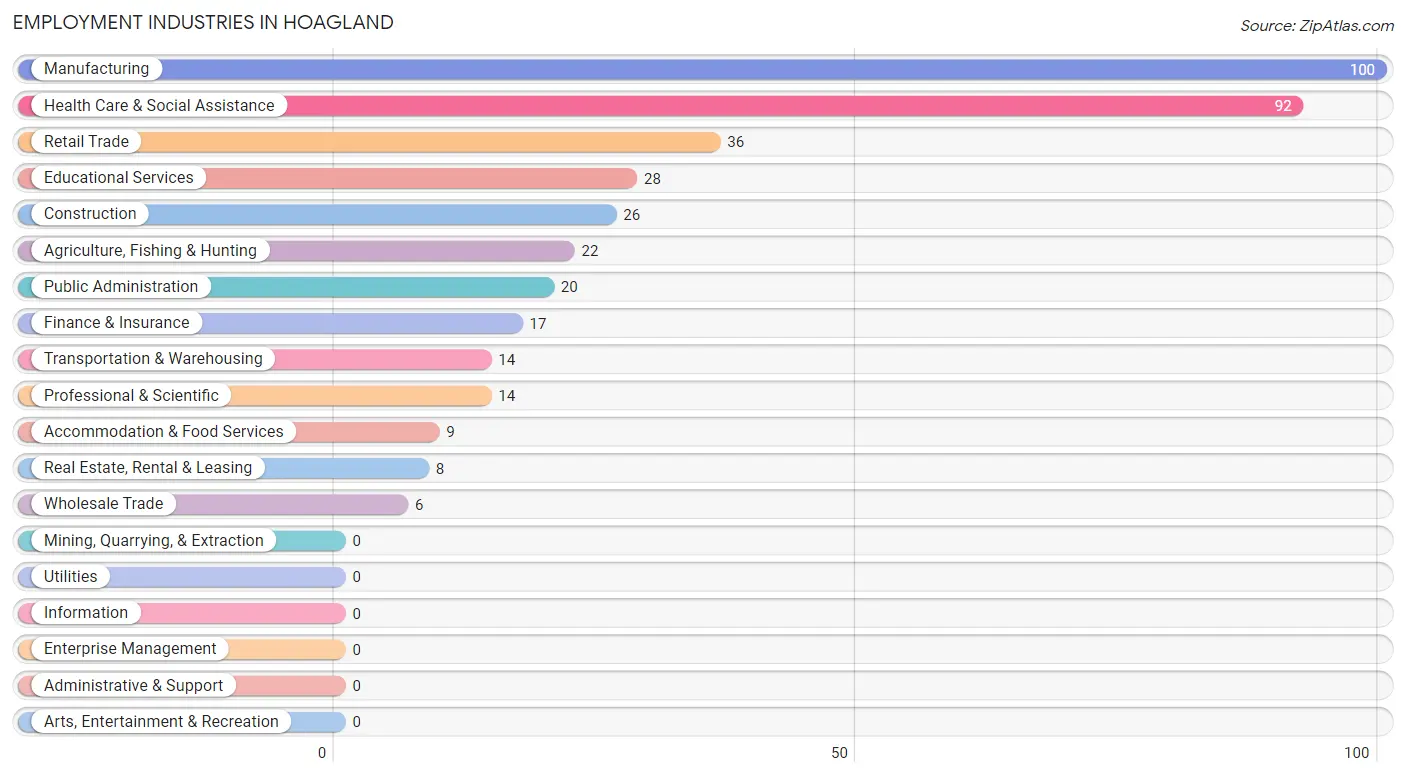
Employment Industries in Hoagland
The major employment industries in Hoagland include Manufacturing (100 | 23.5%), Health Care & Social Assistance (92 | 21.6%), Retail Trade (36 | 8.5%), Educational Services (28 | 6.6%), and Construction (26 | 6.1%).
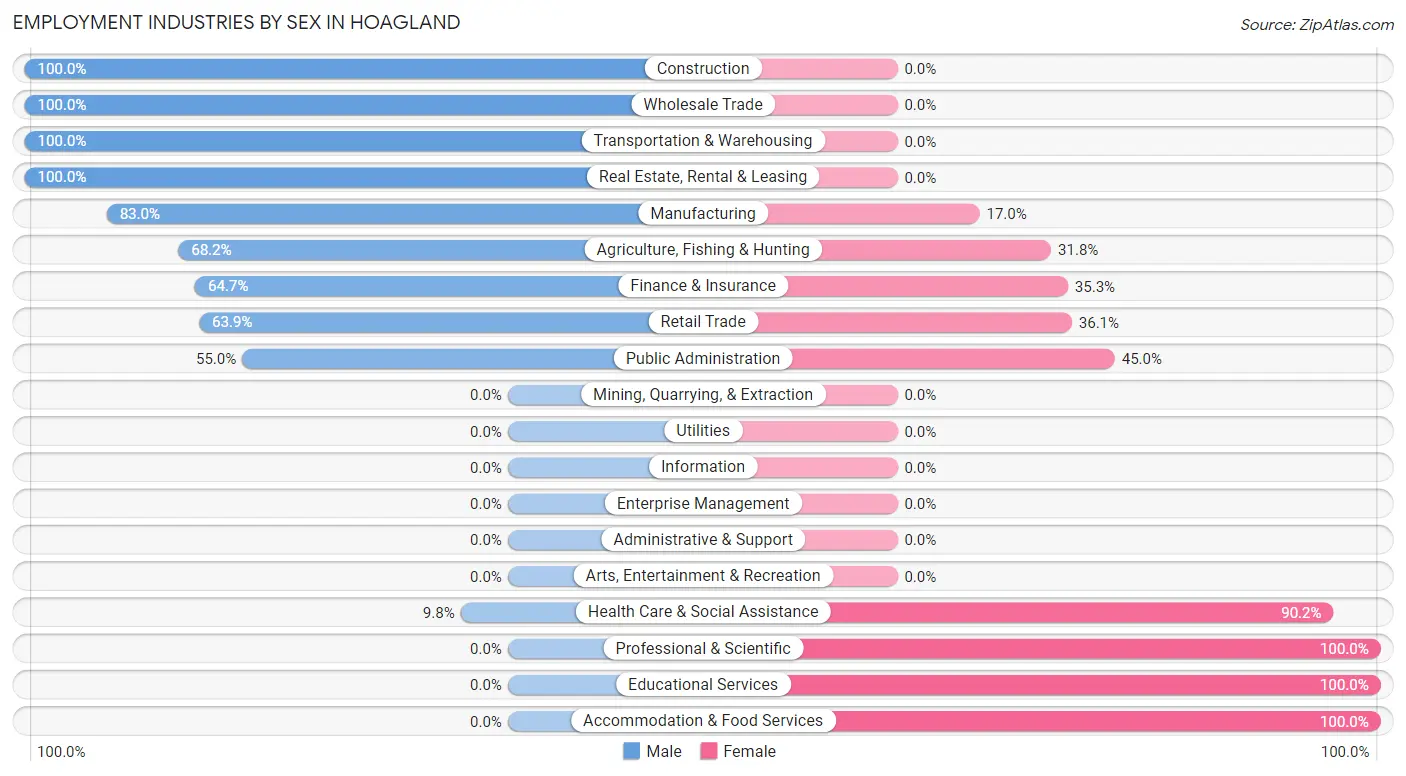
Employment Industries by Sex in Hoagland
The Hoagland industries that see more men than women are Construction (100.0%), Wholesale Trade (100.0%), and Transportation & Warehousing (100.0%), whereas the industries that tend to have a higher number of women are Professional & Scientific (100.0%), Educational Services (100.0%), and Accommodation & Food Services (100.0%).
| Industry | Male | Female |
| Agriculture, Fishing & Hunting | 15 (68.2%) | 7 (31.8%) |
| Mining, Quarrying, & Extraction | 0 (0.0%) | 0 (0.0%) |
| Construction | 26 (100.0%) | 0 (0.0%) |
| Manufacturing | 83 (83.0%) | 17 (17.0%) |
| Wholesale Trade | 6 (100.0%) | 0 (0.0%) |
| Retail Trade | 23 (63.9%) | 13 (36.1%) |
| Transportation & Warehousing | 14 (100.0%) | 0 (0.0%) |
| Utilities | 0 (0.0%) | 0 (0.0%) |
| Information | 0 (0.0%) | 0 (0.0%) |
| Finance & Insurance | 11 (64.7%) | 6 (35.3%) |
| Real Estate, Rental & Leasing | 8 (100.0%) | 0 (0.0%) |
| Professional & Scientific | 0 (0.0%) | 14 (100.0%) |
| Enterprise Management | 0 (0.0%) | 0 (0.0%) |
| Administrative & Support | 0 (0.0%) | 0 (0.0%) |
| Educational Services | 0 (0.0%) | 28 (100.0%) |
| Health Care & Social Assistance | 9 (9.8%) | 83 (90.2%) |
| Arts, Entertainment & Recreation | 0 (0.0%) | 0 (0.0%) |
| Accommodation & Food Services | 0 (0.0%) | 9 (100.0%) |
| Public Administration | 11 (55.0%) | 9 (45.0%) |
| Total | 219 (51.4%) | 207 (48.6%) |
Education in Hoagland
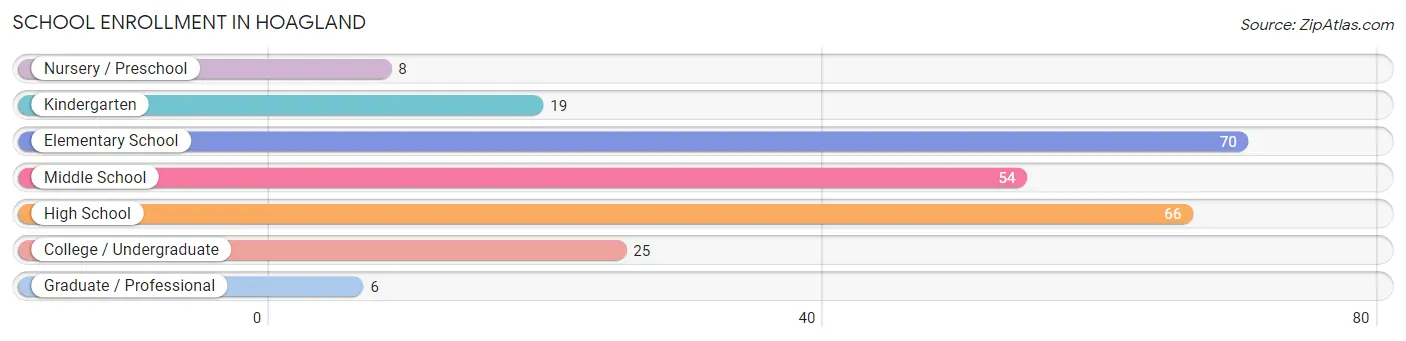
School Enrollment in Hoagland
The most common levels of schooling among the 248 students in Hoagland are elementary school (70 | 28.2%), high school (66 | 26.6%), and middle school (54 | 21.8%).
| School Level | # Students | % Students |
| Nursery / Preschool | 8 | 3.2% |
| Kindergarten | 19 | 7.7% |
| Elementary School | 70 | 28.2% |
| Middle School | 54 | 21.8% |
| High School | 66 | 26.6% |
| College / Undergraduate | 25 | 10.1% |
| Graduate / Professional | 6 | 2.4% |
| Total | 248 | 100.0% |
School Enrollment by Age by Funding Source in Hoagland
Out of a total of 248 students who are enrolled in schools in Hoagland, 76 (30.6%) attend a private institution, while the remaining 172 (69.4%) are enrolled in public schools. The age group of 3 to 4 year olds has the highest likelihood of being enrolled in private schools, with 8 (100.0% in the age bracket) enrolled. Conversely, the age group of 20 to 24 year olds has the lowest likelihood of being enrolled in a private school, with 8 (100.0% in the age bracket) attending a public institution.
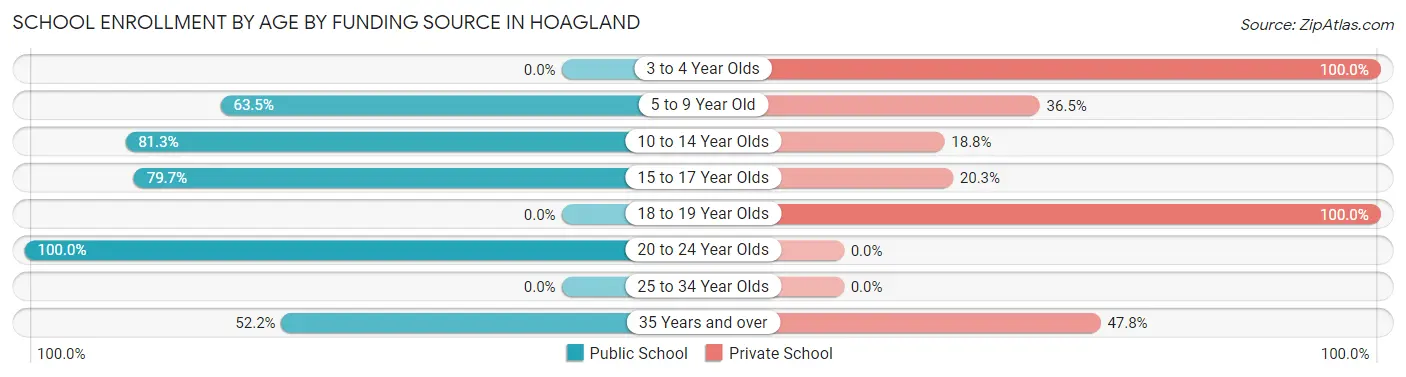
| Age Bracket | Public School | Private School |
| 3 to 4 Year Olds | 0 (0.0%) | 8 (100.0%) |
| 5 to 9 Year Old | 40 (63.5%) | 23 (36.5%) |
| 10 to 14 Year Olds | 65 (81.2%) | 15 (18.8%) |
| 15 to 17 Year Olds | 47 (79.7%) | 12 (20.3%) |
| 18 to 19 Year Olds | 0 (0.0%) | 7 (100.0%) |
| 20 to 24 Year Olds | 8 (100.0%) | 0 (0.0%) |
| 25 to 34 Year Olds | 0 (0.0%) | 0 (0.0%) |
| 35 Years and over | 12 (52.2%) | 11 (47.8%) |
| Total | 172 (69.4%) | 76 (30.6%) |
Educational Attainment by Field of Study in Hoagland
Education (42 | 40.0%), science & technology (24 | 22.9%), business (20 | 19.1%), communications (14 | 13.3%), and arts & humanities (5 | 4.8%) are the most common fields of study among 105 individuals in Hoagland who have obtained a bachelor's degree or higher.
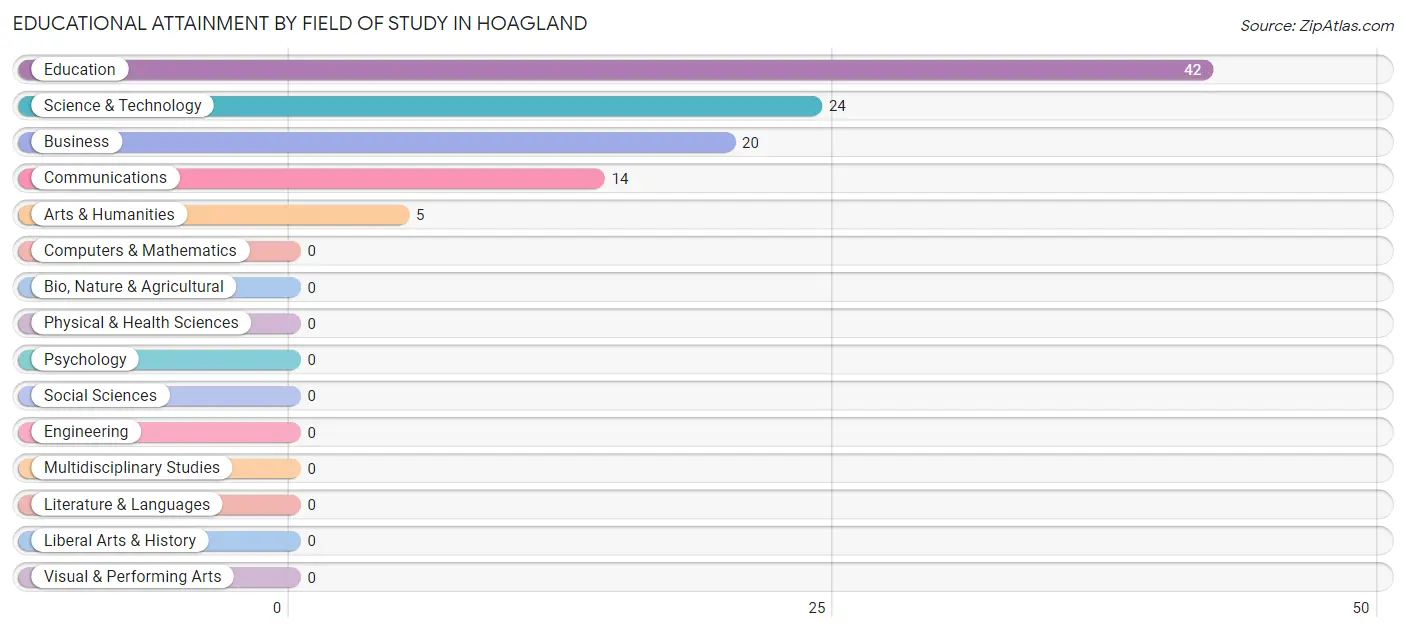
| Field of Study | # Graduates | % Graduates |
| Computers & Mathematics | 0 | 0.0% |
| Bio, Nature & Agricultural | 0 | 0.0% |
| Physical & Health Sciences | 0 | 0.0% |
| Psychology | 0 | 0.0% |
| Social Sciences | 0 | 0.0% |
| Engineering | 0 | 0.0% |
| Multidisciplinary Studies | 0 | 0.0% |
| Science & Technology | 24 | 22.9% |
| Business | 20 | 19.1% |
| Education | 42 | 40.0% |
| Literature & Languages | 0 | 0.0% |
| Liberal Arts & History | 0 | 0.0% |
| Visual & Performing Arts | 0 | 0.0% |
| Communications | 14 | 13.3% |
| Arts & Humanities | 5 | 4.8% |
| Total | 105 | 100.0% |
Transportation & Commute in Hoagland
Vehicle Availability by Sex in Hoagland
The most prevalent vehicle ownership categories in Hoagland are males with 2 vehicles (86, accounting for 39.3%) and females with 2 vehicles (68, making up 43.4%).
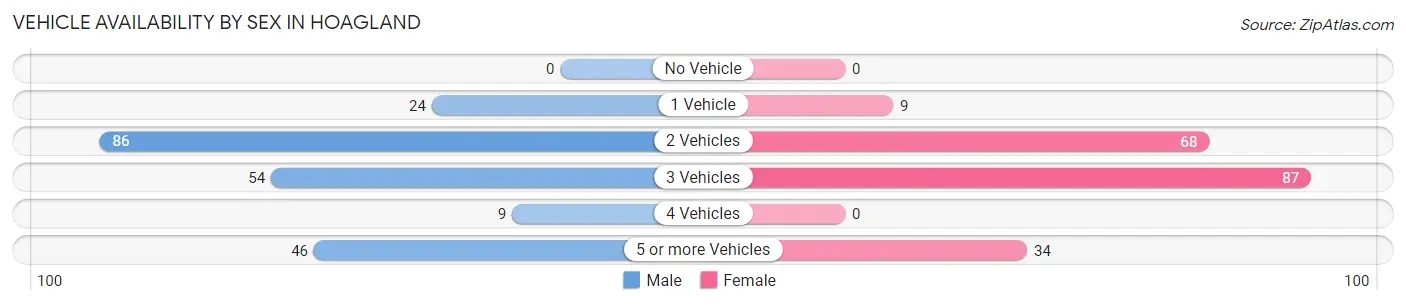
| Vehicles Available | Male | Female |
| No Vehicle | 0 (0.0%) | 0 (0.0%) |
| 1 Vehicle | 24 (11.0%) | 9 (4.5%) |
| 2 Vehicles | 86 (39.3%) | 68 (34.3%) |
| 3 Vehicles | 54 (24.7%) | 87 (43.9%) |
| 4 Vehicles | 9 (4.1%) | 0 (0.0%) |
| 5 or more Vehicles | 46 (21.0%) | 34 (17.2%) |
| Total | 219 (100.0%) | 198 (100.0%) |
Commute Time in Hoagland
The most frequently occuring commute durations in Hoagland are 20 to 24 minutes (105 commuters, 25.6%), 15 to 19 minutes (78 commuters, 19.0%), and 30 to 34 minutes (73 commuters, 17.8%).
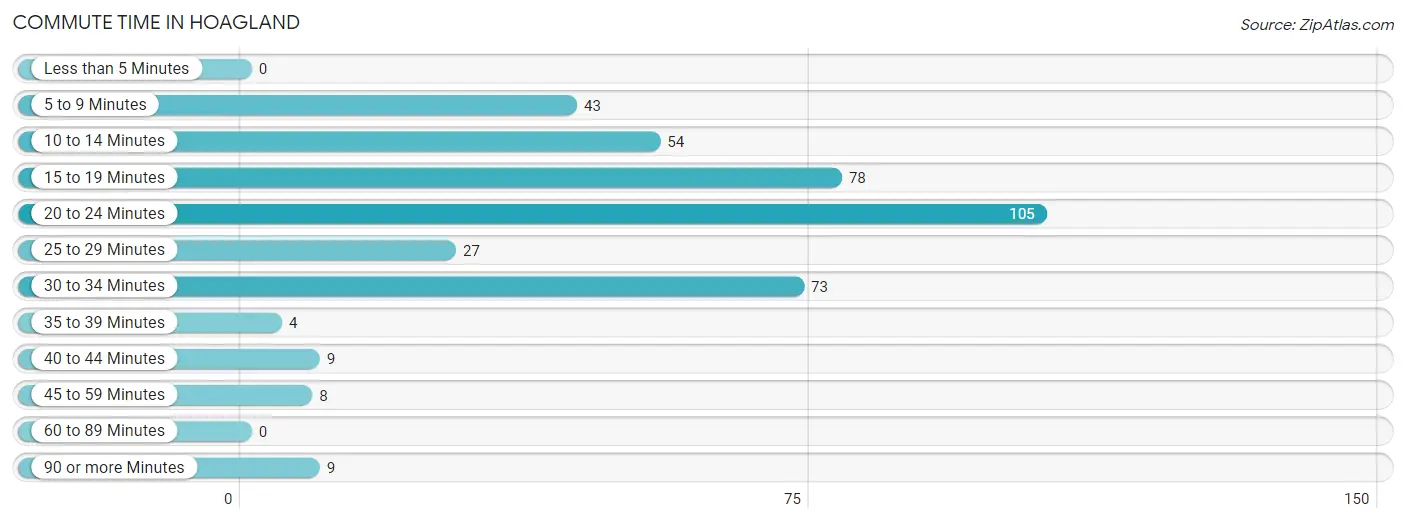
| Commute Time | # Commuters | % Commuters |
| Less than 5 Minutes | 0 | 0.0% |
| 5 to 9 Minutes | 43 | 10.5% |
| 10 to 14 Minutes | 54 | 13.2% |
| 15 to 19 Minutes | 78 | 19.0% |
| 20 to 24 Minutes | 105 | 25.6% |
| 25 to 29 Minutes | 27 | 6.6% |
| 30 to 34 Minutes | 73 | 17.8% |
| 35 to 39 Minutes | 4 | 1.0% |
| 40 to 44 Minutes | 9 | 2.2% |
| 45 to 59 Minutes | 8 | 1.9% |
| 60 to 89 Minutes | 0 | 0.0% |
| 90 or more Minutes | 9 | 2.2% |
Commute Time by Sex in Hoagland
The most common commute times in Hoagland are 20 to 24 minutes (59 commuters, 26.9%) for males and 20 to 24 minutes (46 commuters, 24.1%) for females.
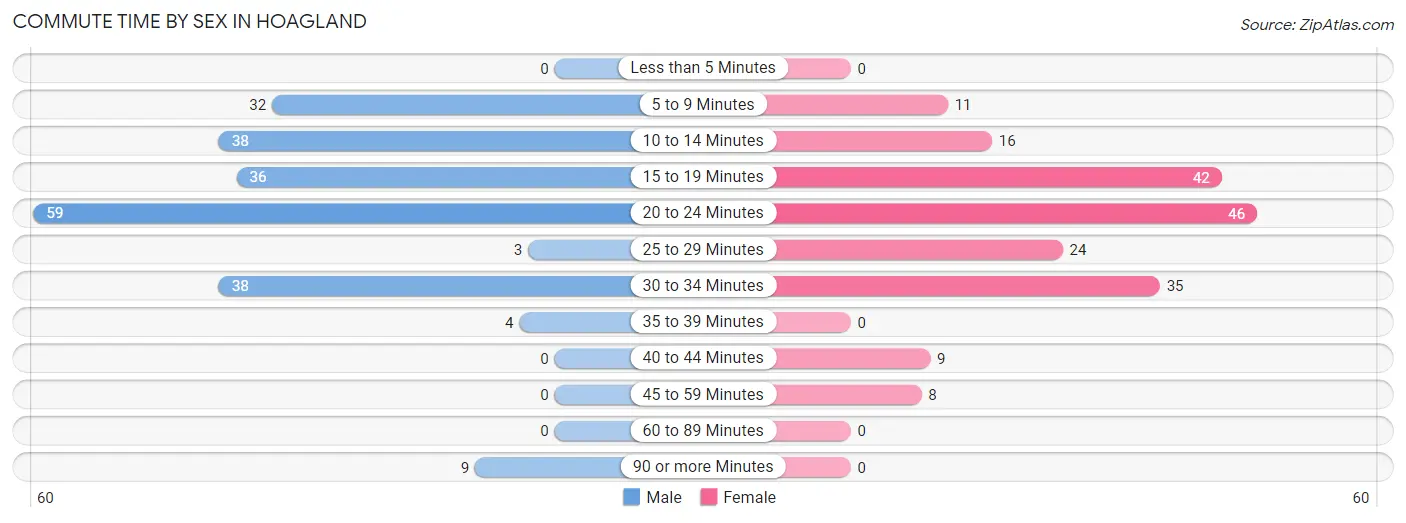
| Commute Time | Male | Female |
| Less than 5 Minutes | 0 (0.0%) | 0 (0.0%) |
| 5 to 9 Minutes | 32 (14.6%) | 11 (5.8%) |
| 10 to 14 Minutes | 38 (17.3%) | 16 (8.4%) |
| 15 to 19 Minutes | 36 (16.4%) | 42 (22.0%) |
| 20 to 24 Minutes | 59 (26.9%) | 46 (24.1%) |
| 25 to 29 Minutes | 3 (1.4%) | 24 (12.6%) |
| 30 to 34 Minutes | 38 (17.3%) | 35 (18.3%) |
| 35 to 39 Minutes | 4 (1.8%) | 0 (0.0%) |
| 40 to 44 Minutes | 0 (0.0%) | 9 (4.7%) |
| 45 to 59 Minutes | 0 (0.0%) | 8 (4.2%) |
| 60 to 89 Minutes | 0 (0.0%) | 0 (0.0%) |
| 90 or more Minutes | 9 (4.1%) | 0 (0.0%) |
Time of Departure to Work by Sex in Hoagland
The most frequent times of departure to work in Hoagland are 7:30 AM to 7:59 AM (40, 18.3%) for males and 6:30 AM to 6:59 AM (35, 18.3%) for females.
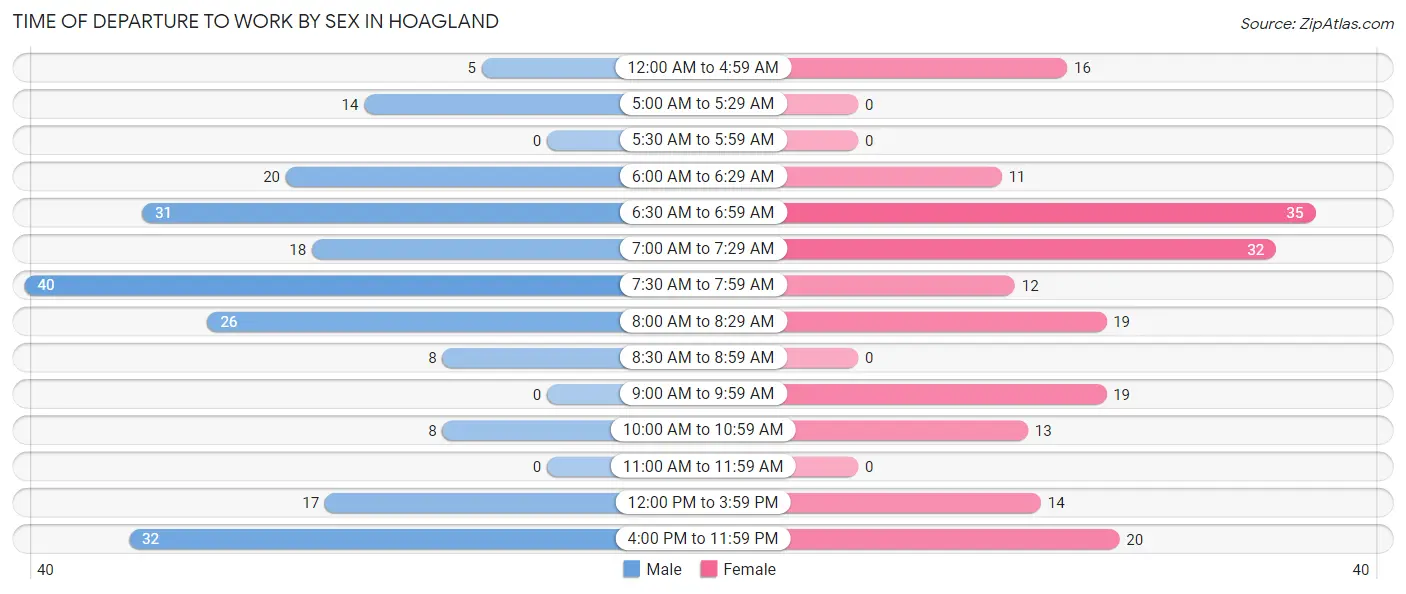
| Time of Departure | Male | Female |
| 12:00 AM to 4:59 AM | 5 (2.3%) | 16 (8.4%) |
| 5:00 AM to 5:29 AM | 14 (6.4%) | 0 (0.0%) |
| 5:30 AM to 5:59 AM | 0 (0.0%) | 0 (0.0%) |
| 6:00 AM to 6:29 AM | 20 (9.1%) | 11 (5.8%) |
| 6:30 AM to 6:59 AM | 31 (14.2%) | 35 (18.3%) |
| 7:00 AM to 7:29 AM | 18 (8.2%) | 32 (16.8%) |
| 7:30 AM to 7:59 AM | 40 (18.3%) | 12 (6.3%) |
| 8:00 AM to 8:29 AM | 26 (11.9%) | 19 (10.0%) |
| 8:30 AM to 8:59 AM | 8 (3.6%) | 0 (0.0%) |
| 9:00 AM to 9:59 AM | 0 (0.0%) | 19 (10.0%) |
| 10:00 AM to 10:59 AM | 8 (3.6%) | 13 (6.8%) |
| 11:00 AM to 11:59 AM | 0 (0.0%) | 0 (0.0%) |
| 12:00 PM to 3:59 PM | 17 (7.8%) | 14 (7.3%) |
| 4:00 PM to 11:59 PM | 32 (14.6%) | 20 (10.5%) |
| Total | 219 (100.0%) | 191 (100.0%) |
Housing Occupancy in Hoagland
Occupancy by Ownership in Hoagland
Of the total 309 dwellings in Hoagland, owner-occupied units account for 291 (94.2%), while renter-occupied units make up 18 (5.8%).
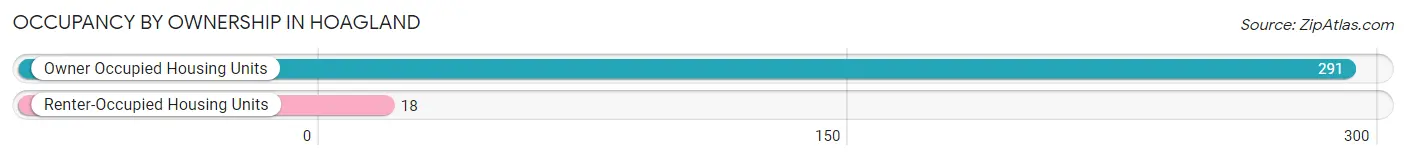
| Occupancy | # Housing Units | % Housing Units |
| Owner Occupied Housing Units | 291 | 94.2% |
| Renter-Occupied Housing Units | 18 | 5.8% |
| Total Occupied Housing Units | 309 | 100.0% |
Occupancy by Household Size in Hoagland
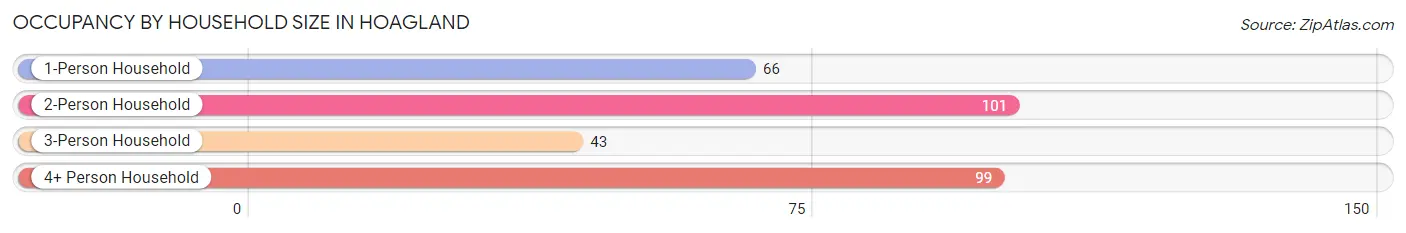
| Household Size | # Housing Units | % Housing Units |
| 1-Person Household | 66 | 21.4% |
| 2-Person Household | 101 | 32.7% |
| 3-Person Household | 43 | 13.9% |
| 4+ Person Household | 99 | 32.0% |
| Total Housing Units | 309 | 100.0% |
Occupancy by Ownership by Household Size in Hoagland
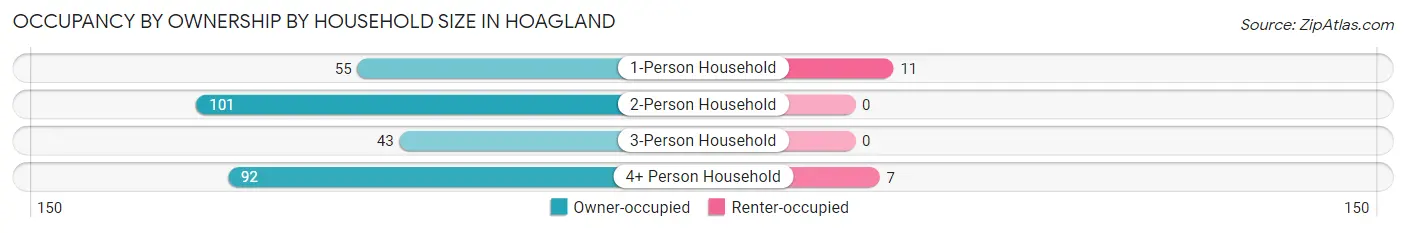
| Household Size | Owner-occupied | Renter-occupied |
| 1-Person Household | 55 (83.3%) | 11 (16.7%) |
| 2-Person Household | 101 (100.0%) | 0 (0.0%) |
| 3-Person Household | 43 (100.0%) | 0 (0.0%) |
| 4+ Person Household | 92 (92.9%) | 7 (7.1%) |
| Total Housing Units | 291 (94.2%) | 18 (5.8%) |
Occupancy by Educational Attainment in Hoagland
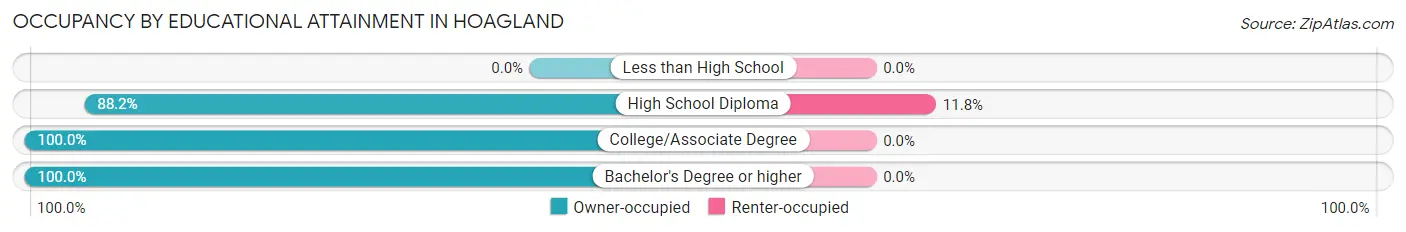
| Household Size | Owner-occupied | Renter-occupied |
| Less than High School | 0 (0.0%) | 0 (0.0%) |
| High School Diploma | 134 (88.2%) | 18 (11.8%) |
| College/Associate Degree | 110 (100.0%) | 0 (0.0%) |
| Bachelor's Degree or higher | 47 (100.0%) | 0 (0.0%) |
Occupancy by Age of Householder in Hoagland
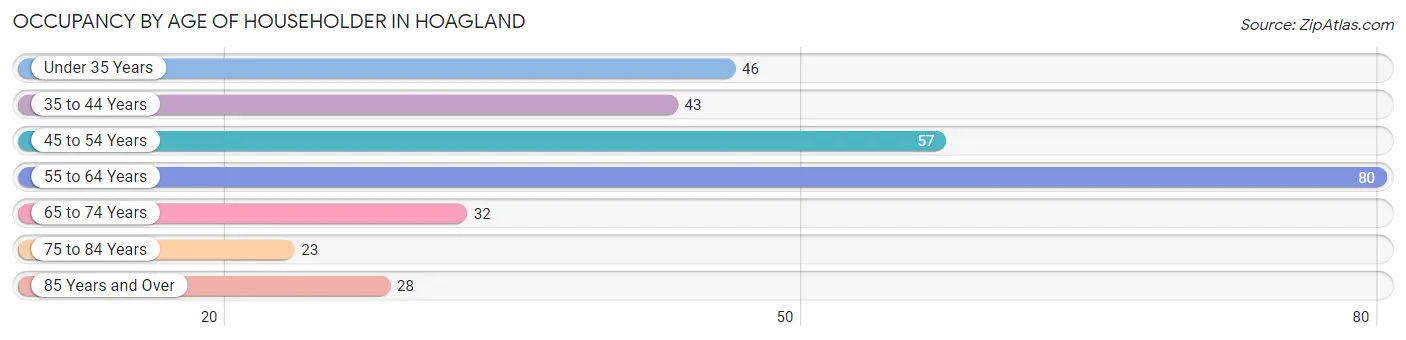
| Age Bracket | # Households | % Households |
| Under 35 Years | 46 | 14.9% |
| 35 to 44 Years | 43 | 13.9% |
| 45 to 54 Years | 57 | 18.4% |
| 55 to 64 Years | 80 | 25.9% |
| 65 to 74 Years | 32 | 10.4% |
| 75 to 84 Years | 23 | 7.4% |
| 85 Years and Over | 28 | 9.1% |
| Total | 309 | 100.0% |
Housing Finances in Hoagland
Median Income by Occupancy in Hoagland
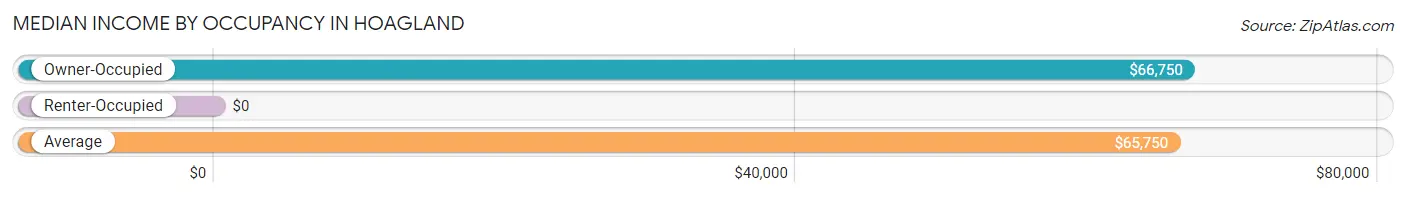
| Occupancy Type | # Households | Median Income |
| Owner-Occupied | 291 (94.2%) | $66,750 |
| Renter-Occupied | 18 (5.8%) | $0 |
| Average | 309 (100.0%) | $65,750 |
Occupancy by Householder Income Bracket in Hoagland
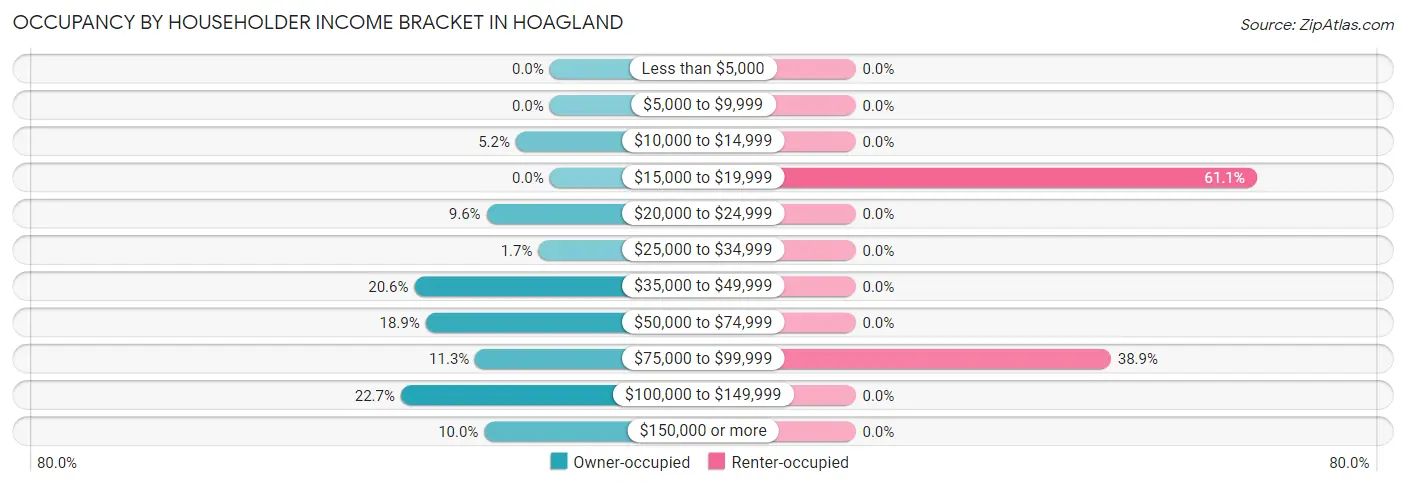
| Income Bracket | Owner-occupied | Renter-occupied |
| Less than $5,000 | 0 (0.0%) | 0 (0.0%) |
| $5,000 to $9,999 | 0 (0.0%) | 0 (0.0%) |
| $10,000 to $14,999 | 15 (5.1%) | 0 (0.0%) |
| $15,000 to $19,999 | 0 (0.0%) | 11 (61.1%) |
| $20,000 to $24,999 | 28 (9.6%) | 0 (0.0%) |
| $25,000 to $34,999 | 5 (1.7%) | 0 (0.0%) |
| $35,000 to $49,999 | 60 (20.6%) | 0 (0.0%) |
| $50,000 to $74,999 | 55 (18.9%) | 0 (0.0%) |
| $75,000 to $99,999 | 33 (11.3%) | 7 (38.9%) |
| $100,000 to $149,999 | 66 (22.7%) | 0 (0.0%) |
| $150,000 or more | 29 (10.0%) | 0 (0.0%) |
| Total | 291 (100.0%) | 18 (100.0%) |
Monthly Housing Cost Tiers in Hoagland
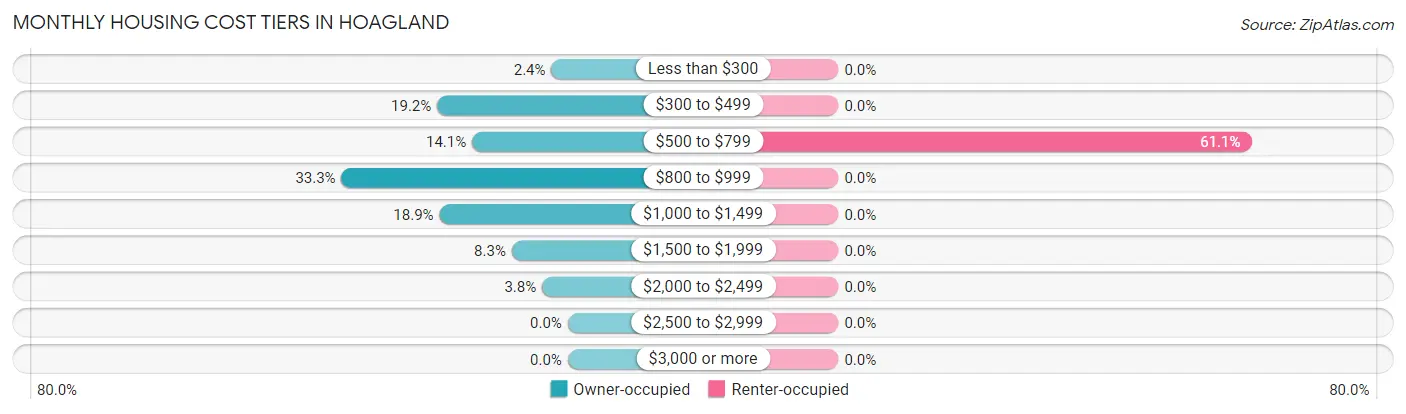
| Monthly Cost | Owner-occupied | Renter-occupied |
| Less than $300 | 7 (2.4%) | 0 (0.0%) |
| $300 to $499 | 56 (19.2%) | 0 (0.0%) |
| $500 to $799 | 41 (14.1%) | 11 (61.1%) |
| $800 to $999 | 97 (33.3%) | 0 (0.0%) |
| $1,000 to $1,499 | 55 (18.9%) | 0 (0.0%) |
| $1,500 to $1,999 | 24 (8.3%) | 0 (0.0%) |
| $2,000 to $2,499 | 11 (3.8%) | 0 (0.0%) |
| $2,500 to $2,999 | 0 (0.0%) | 0 (0.0%) |
| $3,000 or more | 0 (0.0%) | 0 (0.0%) |
| Total | 291 (100.0%) | 18 (100.0%) |
Physical Housing Characteristics in Hoagland
Housing Structures in Hoagland
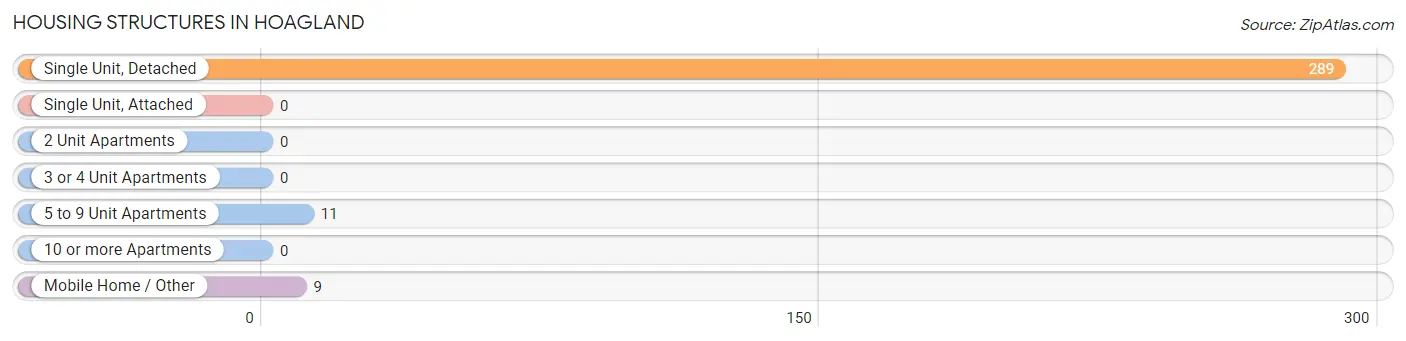
| Structure Type | # Housing Units | % Housing Units |
| Single Unit, Detached | 289 | 93.5% |
| Single Unit, Attached | 0 | 0.0% |
| 2 Unit Apartments | 0 | 0.0% |
| 3 or 4 Unit Apartments | 0 | 0.0% |
| 5 to 9 Unit Apartments | 11 | 3.6% |
| 10 or more Apartments | 0 | 0.0% |
| Mobile Home / Other | 9 | 2.9% |
| Total | 309 | 100.0% |
Housing Structures by Occupancy in Hoagland
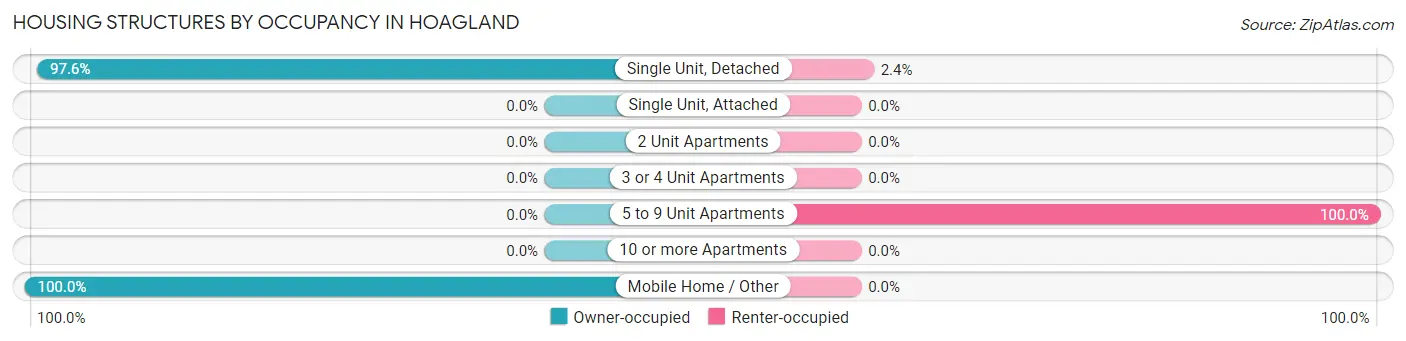
| Structure Type | Owner-occupied | Renter-occupied |
| Single Unit, Detached | 282 (97.6%) | 7 (2.4%) |
| Single Unit, Attached | 0 (0.0%) | 0 (0.0%) |
| 2 Unit Apartments | 0 (0.0%) | 0 (0.0%) |
| 3 or 4 Unit Apartments | 0 (0.0%) | 0 (0.0%) |
| 5 to 9 Unit Apartments | 0 (0.0%) | 11 (100.0%) |
| 10 or more Apartments | 0 (0.0%) | 0 (0.0%) |
| Mobile Home / Other | 9 (100.0%) | 0 (0.0%) |
| Total | 291 (94.2%) | 18 (5.8%) |
Housing Structures by Number of Rooms in Hoagland
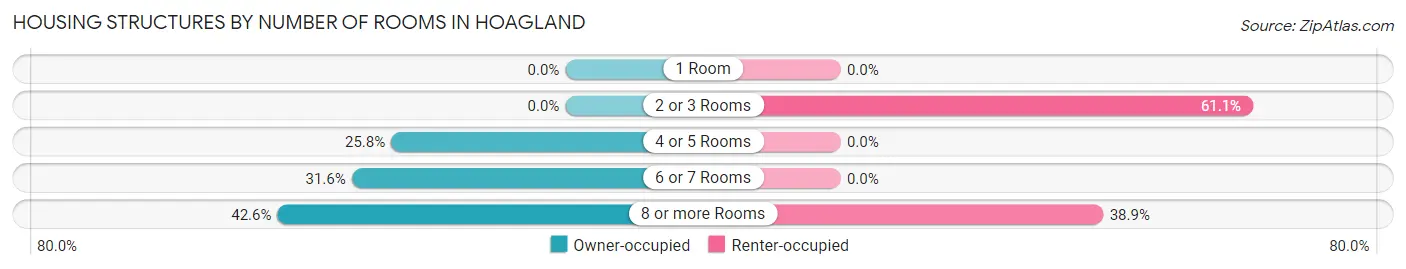
| Number of Rooms | Owner-occupied | Renter-occupied |
| 1 Room | 0 (0.0%) | 0 (0.0%) |
| 2 or 3 Rooms | 0 (0.0%) | 11 (61.1%) |
| 4 or 5 Rooms | 75 (25.8%) | 0 (0.0%) |
| 6 or 7 Rooms | 92 (31.6%) | 0 (0.0%) |
| 8 or more Rooms | 124 (42.6%) | 7 (38.9%) |
| Total | 291 (100.0%) | 18 (100.0%) |
Housing Structure by Heating Type in Hoagland
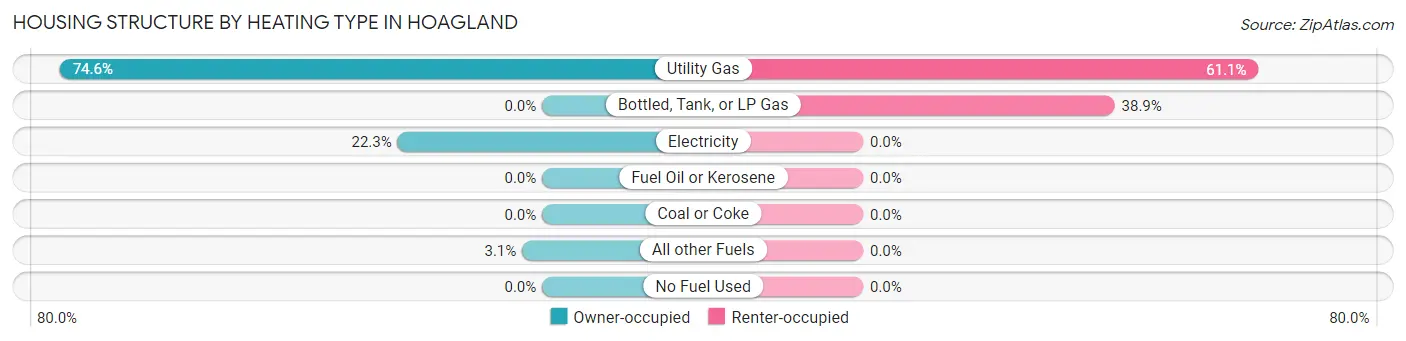
| Heating Type | Owner-occupied | Renter-occupied |
| Utility Gas | 217 (74.6%) | 11 (61.1%) |
| Bottled, Tank, or LP Gas | 0 (0.0%) | 7 (38.9%) |
| Electricity | 65 (22.3%) | 0 (0.0%) |
| Fuel Oil or Kerosene | 0 (0.0%) | 0 (0.0%) |
| Coal or Coke | 0 (0.0%) | 0 (0.0%) |
| All other Fuels | 9 (3.1%) | 0 (0.0%) |
| No Fuel Used | 0 (0.0%) | 0 (0.0%) |
| Total | 291 (100.0%) | 18 (100.0%) |
Household Vehicle Usage in Hoagland
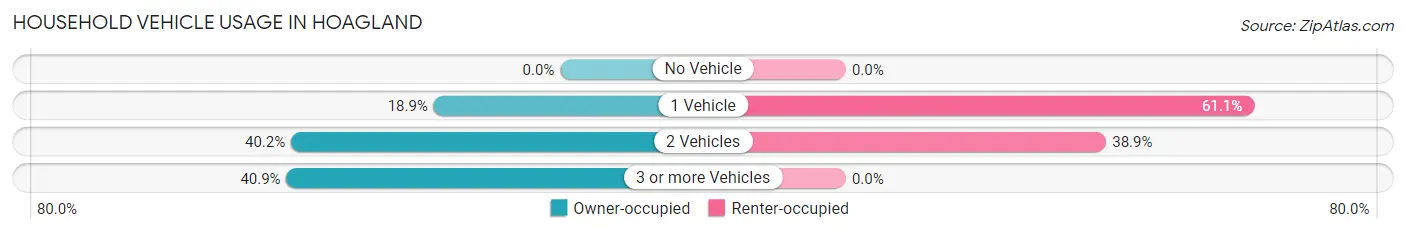
| Vehicles per Household | Owner-occupied | Renter-occupied |
| No Vehicle | 0 (0.0%) | 0 (0.0%) |
| 1 Vehicle | 55 (18.9%) | 11 (61.1%) |
| 2 Vehicles | 117 (40.2%) | 7 (38.9%) |
| 3 or more Vehicles | 119 (40.9%) | 0 (0.0%) |
| Total | 291 (100.0%) | 18 (100.0%) |
Real Estate & Mortgages in Hoagland
Real Estate and Mortgage Overview in Hoagland
| Characteristic | Without Mortgage | With Mortgage |
| Housing Units | 124 | 167 |
| Median Property Value | $167,900 | $140,600 |
| Median Household Income | $57,917 | $6 |
| Monthly Housing Costs | $495 | $0 |
| Real Estate Taxes | $1,250 | $0 |
Property Value by Mortgage Status in Hoagland
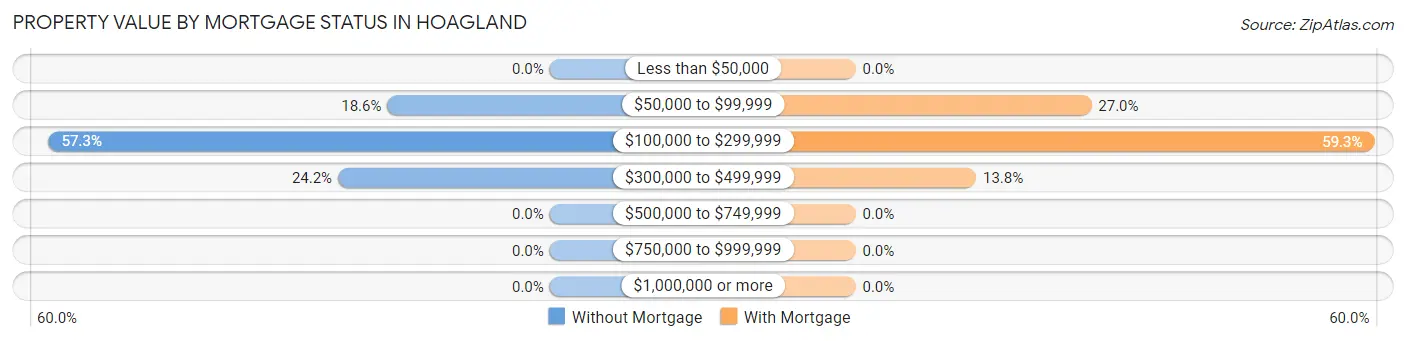
| Property Value | Without Mortgage | With Mortgage |
| Less than $50,000 | 0 (0.0%) | 0 (0.0%) |
| $50,000 to $99,999 | 23 (18.5%) | 45 (27.0%) |
| $100,000 to $299,999 | 71 (57.3%) | 99 (59.3%) |
| $300,000 to $499,999 | 30 (24.2%) | 23 (13.8%) |
| $500,000 to $749,999 | 0 (0.0%) | 0 (0.0%) |
| $750,000 to $999,999 | 0 (0.0%) | 0 (0.0%) |
| $1,000,000 or more | 0 (0.0%) | 0 (0.0%) |
| Total | 124 (100.0%) | 167 (100.0%) |
Household Income by Mortgage Status in Hoagland
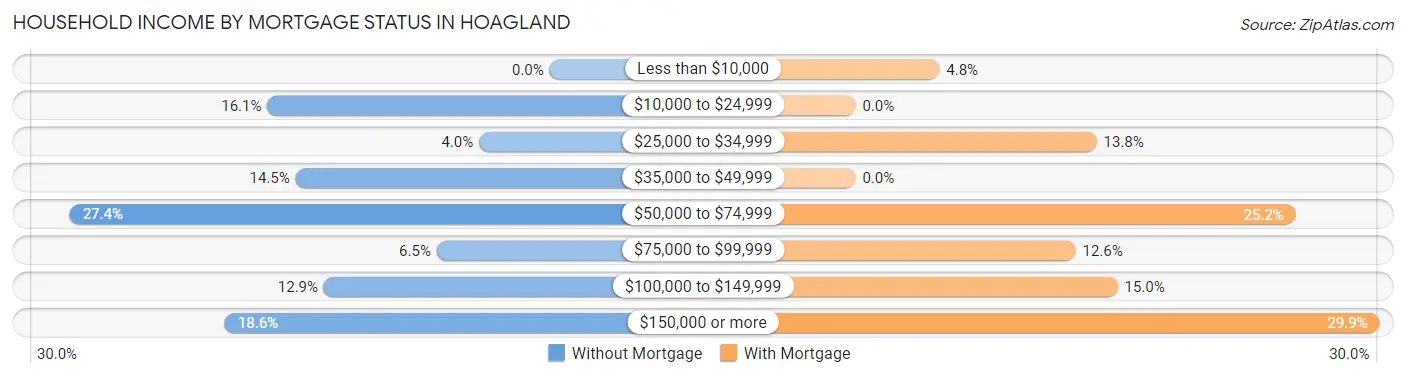
| Household Income | Without Mortgage | With Mortgage |
| Less than $10,000 | 0 (0.0%) | 8 (4.8%) |
| $10,000 to $24,999 | 20 (16.1%) | 0 (0.0%) |
| $25,000 to $34,999 | 5 (4.0%) | 23 (13.8%) |
| $35,000 to $49,999 | 18 (14.5%) | 0 (0.0%) |
| $50,000 to $74,999 | 34 (27.4%) | 42 (25.2%) |
| $75,000 to $99,999 | 8 (6.5%) | 21 (12.6%) |
| $100,000 to $149,999 | 16 (12.9%) | 25 (15.0%) |
| $150,000 or more | 23 (18.5%) | 50 (29.9%) |
| Total | 124 (100.0%) | 167 (100.0%) |
Property Value to Household Income Ratio in Hoagland
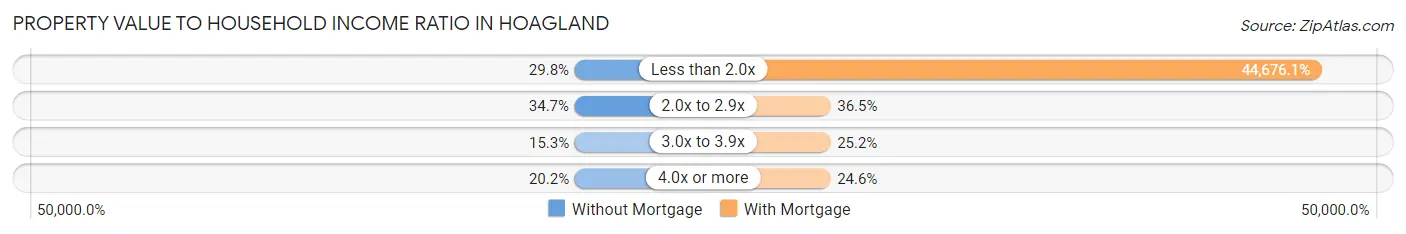
| Value-to-Income Ratio | Without Mortgage | With Mortgage |
| Less than 2.0x | 37 (29.8%) | 74,609 (44,676.0%) |
| 2.0x to 2.9x | 43 (34.7%) | 61 (36.5%) |
| 3.0x to 3.9x | 19 (15.3%) | 42 (25.2%) |
| 4.0x or more | 25 (20.2%) | 41 (24.5%) |
| Total | 124 (100.0%) | 167 (100.0%) |
Real Estate Taxes by Mortgage Status in Hoagland
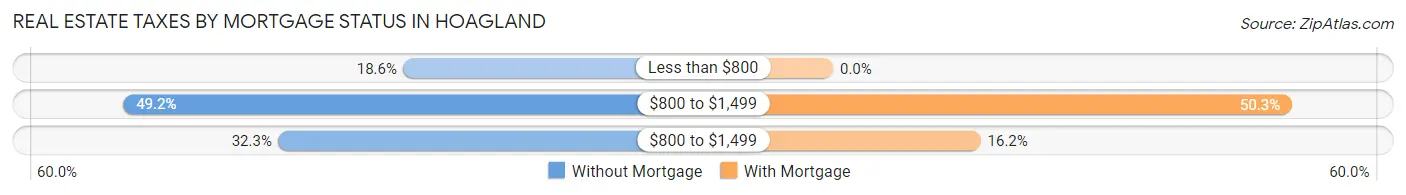
| Property Taxes | Without Mortgage | With Mortgage |
| Less than $800 | 23 (18.5%) | 0 (0.0%) |
| $800 to $1,499 | 61 (49.2%) | 84 (50.3%) |
| $800 to $1,499 | 40 (32.3%) | 27 (16.2%) |
| Total | 124 (100.0%) | 167 (100.0%) |
Health & Disability in Hoagland
Health Insurance Coverage by Age in Hoagland
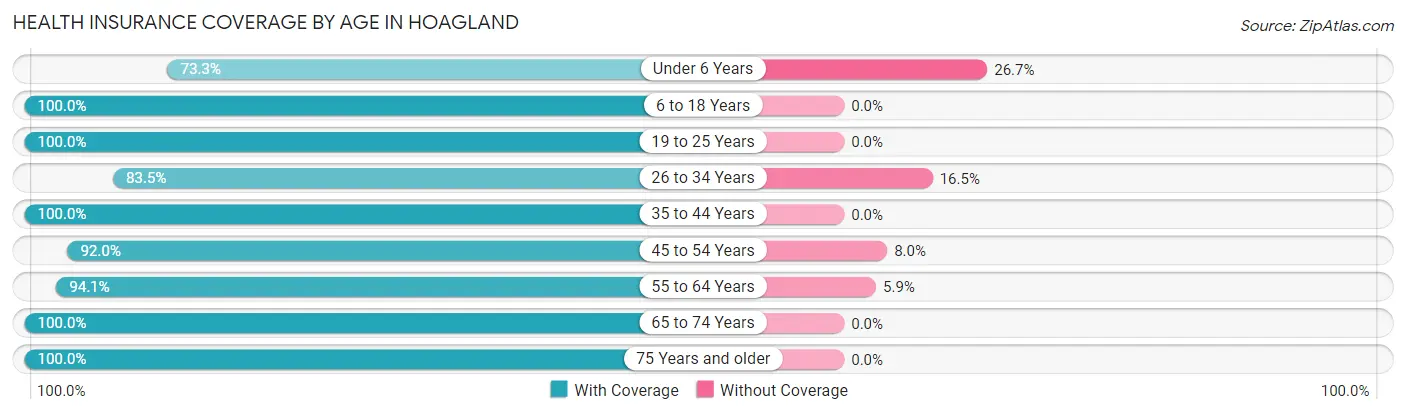
| Age Bracket | With Coverage | Without Coverage |
| Under 6 Years | 44 (73.3%) | 16 (26.7%) |
| 6 to 18 Years | 221 (100.0%) | 0 (0.0%) |
| 19 to 25 Years | 43 (100.0%) | 0 (0.0%) |
| 26 to 34 Years | 81 (83.5%) | 16 (16.5%) |
| 35 to 44 Years | 79 (100.0%) | 0 (0.0%) |
| 45 to 54 Years | 92 (92.0%) | 8 (8.0%) |
| 55 to 64 Years | 127 (94.1%) | 8 (5.9%) |
| 65 to 74 Years | 50 (100.0%) | 0 (0.0%) |
| 75 Years and older | 93 (100.0%) | 0 (0.0%) |
| Total | 830 (94.5%) | 48 (5.5%) |
Health Insurance Coverage by Citizenship Status in Hoagland
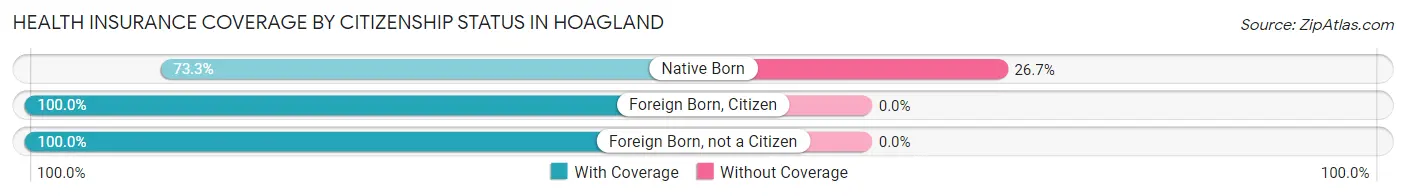
| Citizenship Status | With Coverage | Without Coverage |
| Native Born | 44 (73.3%) | 16 (26.7%) |
| Foreign Born, Citizen | 221 (100.0%) | 0 (0.0%) |
| Foreign Born, not a Citizen | 43 (100.0%) | 0 (0.0%) |
Health Insurance Coverage by Household Income in Hoagland
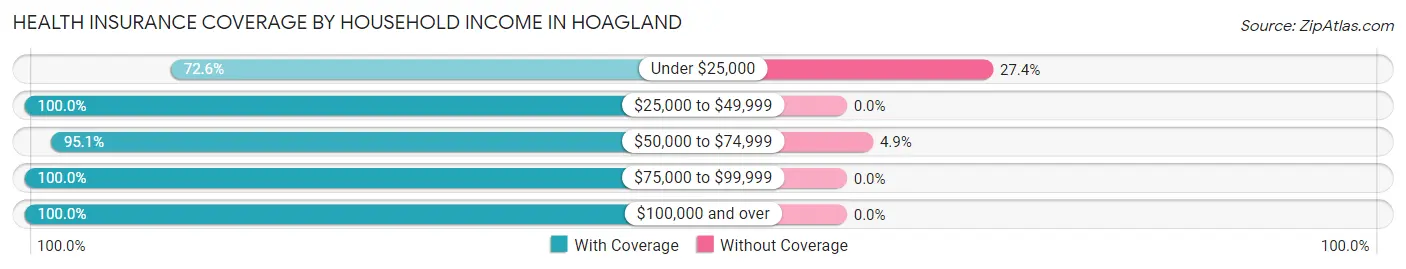
| Household Income | With Coverage | Without Coverage |
| Under $25,000 | 106 (72.6%) | 40 (27.4%) |
| $25,000 to $49,999 | 122 (100.0%) | 0 (0.0%) |
| $50,000 to $74,999 | 155 (95.1%) | 8 (4.9%) |
| $75,000 to $99,999 | 156 (100.0%) | 0 (0.0%) |
| $100,000 and over | 291 (100.0%) | 0 (0.0%) |
Public vs Private Health Insurance Coverage by Age in Hoagland
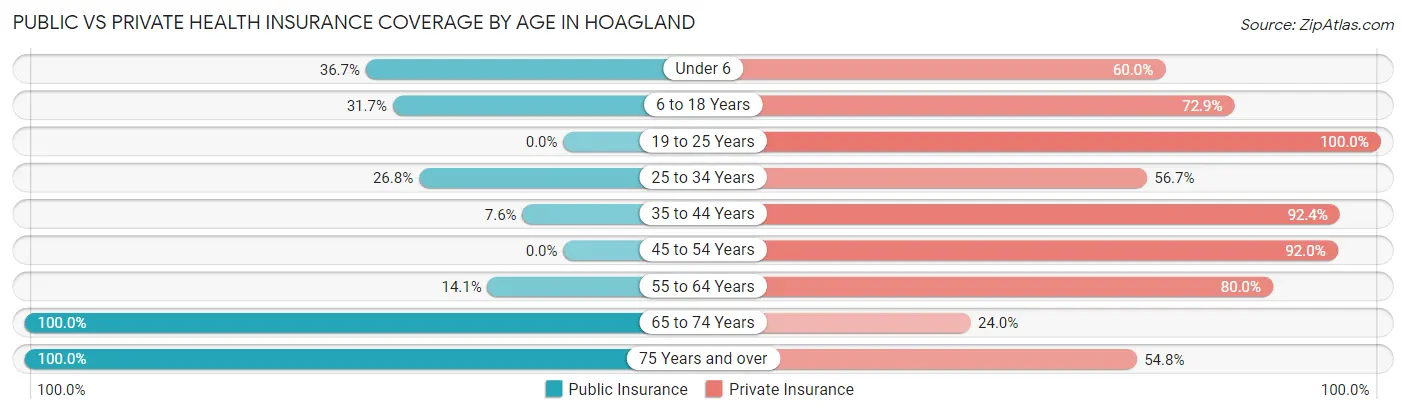
| Age Bracket | Public Insurance | Private Insurance |
| Under 6 | 22 (36.7%) | 36 (60.0%) |
| 6 to 18 Years | 70 (31.7%) | 161 (72.9%) |
| 19 to 25 Years | 0 (0.0%) | 43 (100.0%) |
| 25 to 34 Years | 26 (26.8%) | 55 (56.7%) |
| 35 to 44 Years | 6 (7.6%) | 73 (92.4%) |
| 45 to 54 Years | 0 (0.0%) | 92 (92.0%) |
| 55 to 64 Years | 19 (14.1%) | 108 (80.0%) |
| 65 to 74 Years | 50 (100.0%) | 12 (24.0%) |
| 75 Years and over | 93 (100.0%) | 51 (54.8%) |
| Total | 286 (32.6%) | 631 (71.9%) |
Disability Status by Sex by Age in Hoagland
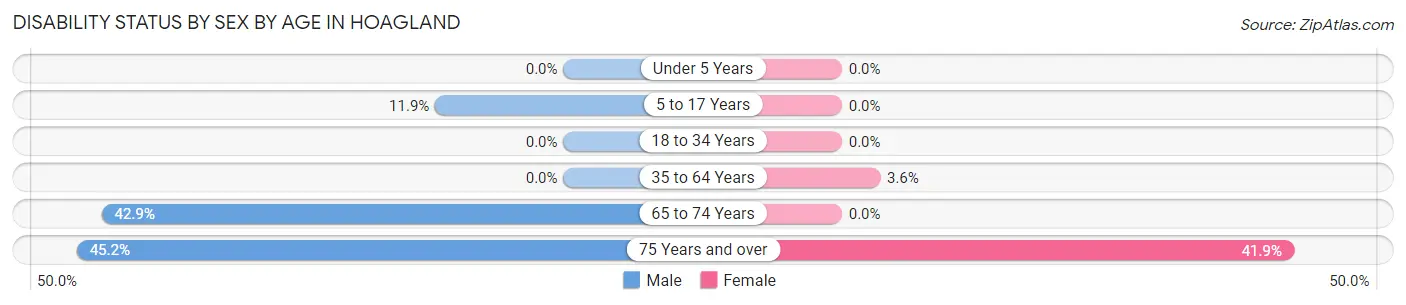
| Age Bracket | Male | Female |
| Under 5 Years | 0 (0.0%) | 0 (0.0%) |
| 5 to 17 Years | 15 (11.9%) | 0 (0.0%) |
| 18 to 34 Years | 0 (0.0%) | 0 (0.0%) |
| 35 to 64 Years | 0 (0.0%) | 5 (3.5%) |
| 65 to 74 Years | 12 (42.9%) | 0 (0.0%) |
| 75 Years and over | 14 (45.2%) | 26 (41.9%) |
Disability Class by Sex by Age in Hoagland
Disability Class: Hearing Difficulty
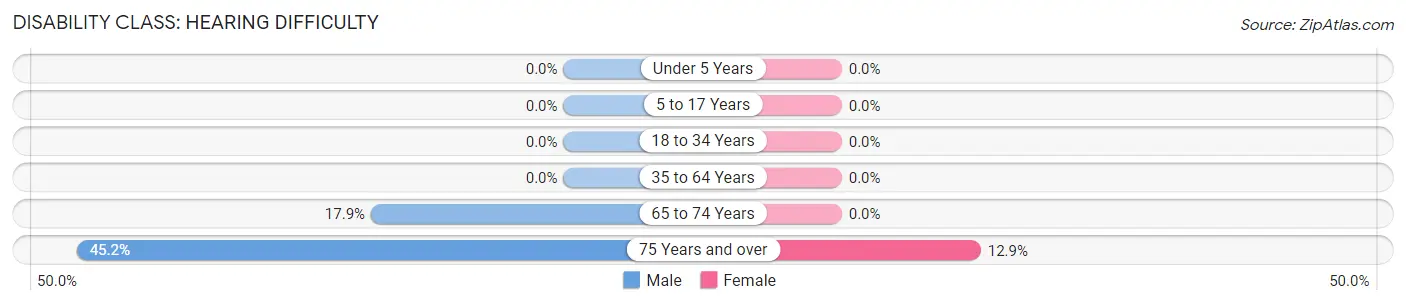
| Age Bracket | Male | Female |
| Under 5 Years | 0 (0.0%) | 0 (0.0%) |
| 5 to 17 Years | 0 (0.0%) | 0 (0.0%) |
| 18 to 34 Years | 0 (0.0%) | 0 (0.0%) |
| 35 to 64 Years | 0 (0.0%) | 0 (0.0%) |
| 65 to 74 Years | 5 (17.9%) | 0 (0.0%) |
| 75 Years and over | 14 (45.2%) | 8 (12.9%) |
Disability Class: Vision Difficulty
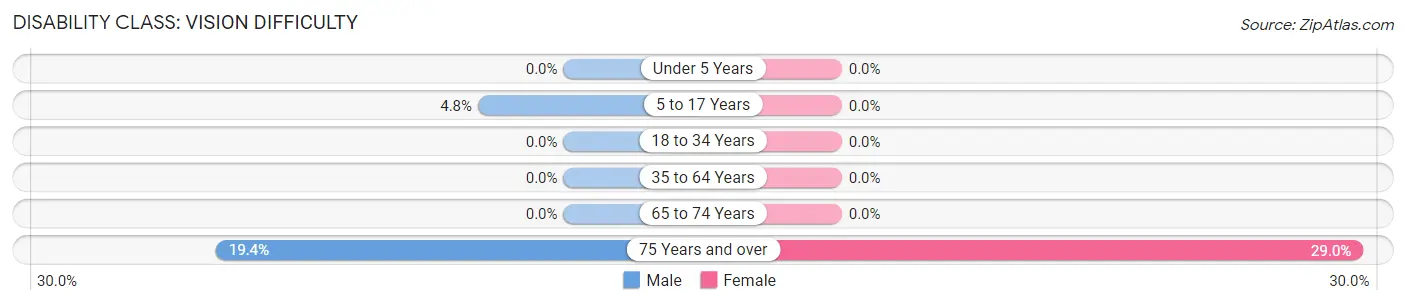
| Age Bracket | Male | Female |
| Under 5 Years | 0 (0.0%) | 0 (0.0%) |
| 5 to 17 Years | 6 (4.8%) | 0 (0.0%) |
| 18 to 34 Years | 0 (0.0%) | 0 (0.0%) |
| 35 to 64 Years | 0 (0.0%) | 0 (0.0%) |
| 65 to 74 Years | 0 (0.0%) | 0 (0.0%) |
| 75 Years and over | 6 (19.4%) | 18 (29.0%) |
Disability Class: Cognitive Difficulty
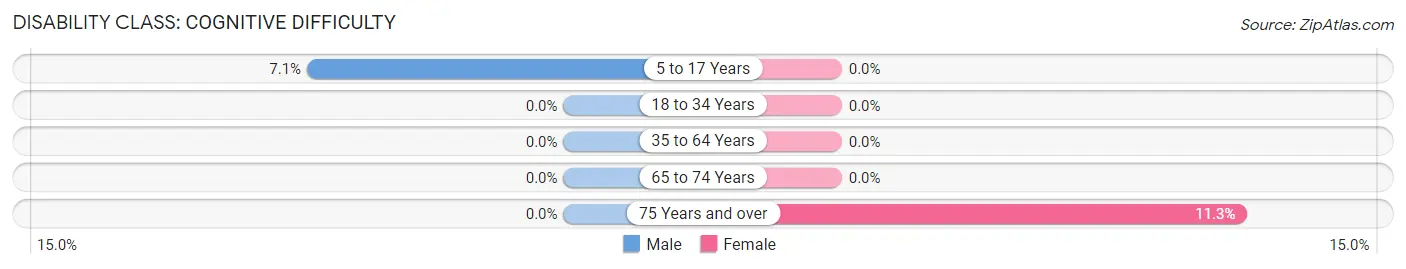
| Age Bracket | Male | Female |
| 5 to 17 Years | 9 (7.1%) | 0 (0.0%) |
| 18 to 34 Years | 0 (0.0%) | 0 (0.0%) |
| 35 to 64 Years | 0 (0.0%) | 0 (0.0%) |
| 65 to 74 Years | 0 (0.0%) | 0 (0.0%) |
| 75 Years and over | 0 (0.0%) | 7 (11.3%) |
Disability Class: Ambulatory Difficulty
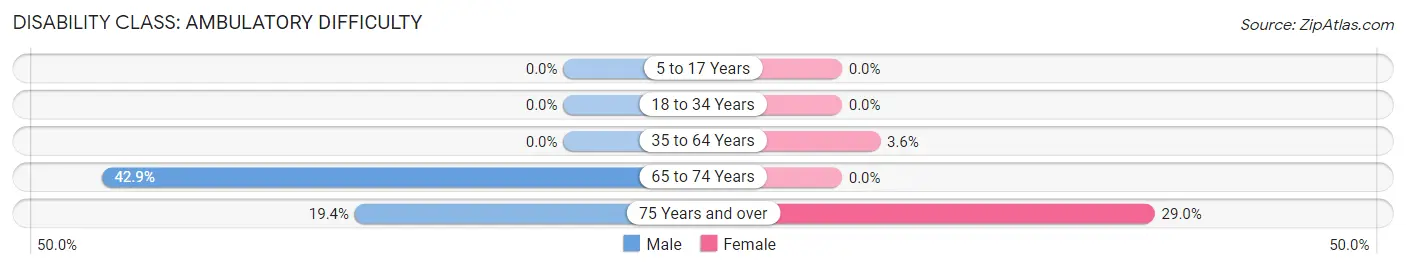
| Age Bracket | Male | Female |
| 5 to 17 Years | 0 (0.0%) | 0 (0.0%) |
| 18 to 34 Years | 0 (0.0%) | 0 (0.0%) |
| 35 to 64 Years | 0 (0.0%) | 5 (3.5%) |
| 65 to 74 Years | 12 (42.9%) | 0 (0.0%) |
| 75 Years and over | 6 (19.4%) | 18 (29.0%) |
Disability Class: Self-Care Difficulty
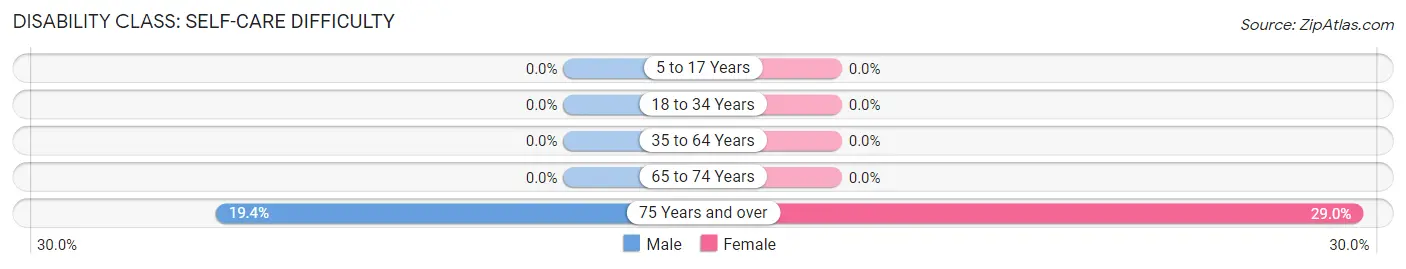
| Age Bracket | Male | Female |
| 5 to 17 Years | 0 (0.0%) | 0 (0.0%) |
| 18 to 34 Years | 0 (0.0%) | 0 (0.0%) |
| 35 to 64 Years | 0 (0.0%) | 0 (0.0%) |
| 65 to 74 Years | 0 (0.0%) | 0 (0.0%) |
| 75 Years and over | 6 (19.4%) | 18 (29.0%) |
Technology Access in Hoagland
Computing Device Access in Hoagland
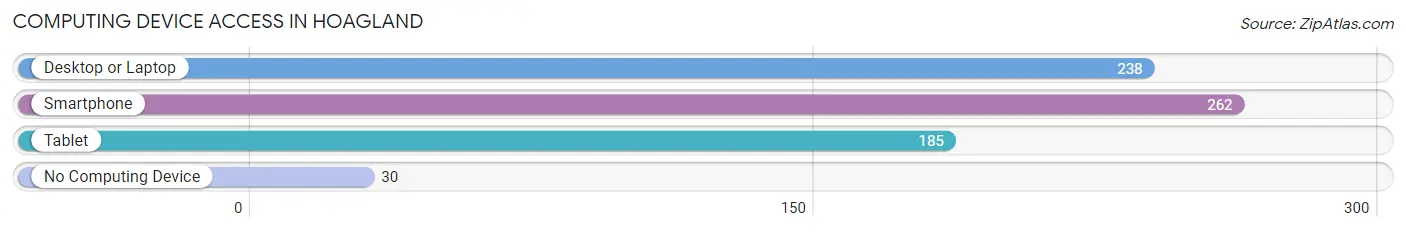
| Device Type | # Households | % Households |
| Desktop or Laptop | 238 | 77.0% |
| Smartphone | 262 | 84.8% |
| Tablet | 185 | 59.9% |
| No Computing Device | 30 | 9.7% |
| Total | 309 | 100.0% |
Internet Access in Hoagland
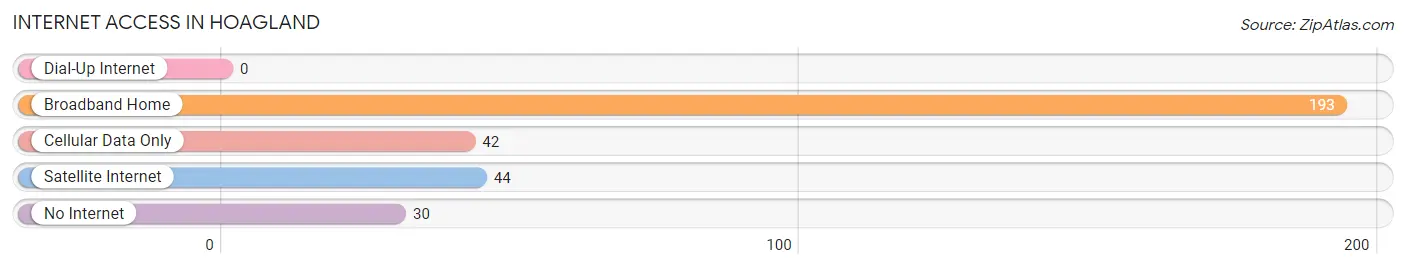
| Internet Type | # Households | % Households |
| Dial-Up Internet | 0 | 0.0% |
| Broadband Home | 193 | 62.5% |
| Cellular Data Only | 42 | 13.6% |
| Satellite Internet | 44 | 14.2% |
| No Internet | 30 | 9.7% |
| Total | 309 | 100.0% |
Hoagland Summary
Hoagland is a small town located in Allen County, Indiana. It is situated in the northeastern part of the state, about 10 miles south of Fort Wayne. The town was founded in 1837 and was named after the Hoagland family, who were among the first settlers in the area. The population of Hoagland was 1,845 at the 2010 census.
History
Hoagland was founded in 1837 by the Hoagland family, who were among the first settlers in the area. The town was originally known as Hoagland's Station, and was a stop on the Wabash and Erie Canal. The canal was an important transportation route in the 19th century, and Hoagland was a popular stop for travelers. The town was officially incorporated in 1867.
In the late 19th century, Hoagland was a thriving agricultural community. The town was home to several grain mills, a sawmill, and a brickyard. The town also had a number of stores, including a general store, a drug store, and a hardware store.
In the early 20th century, Hoagland began to decline. The Wabash and Erie Canal was abandoned in the late 19th century, and the town's economy shifted away from agriculture. The Great Depression also had a negative impact on the town, and many businesses closed.
Geography
Hoagland is located in northeastern Indiana, about 10 miles south of Fort Wayne. The town is situated in Allen County, and is bordered by the towns of Monroeville to the north, New Haven to the east, and Woodburn to the south. Hoagland is located on the banks of the Maumee River, which flows through the town.
The town has a total area of 1.2 square miles, all of which is land. The terrain is mostly flat, with some rolling hills in the northern part of town. The climate is humid continental, with hot summers and cold winters.
Economy
Hoagland's economy is largely based on agriculture. The town is home to several farms, which produce a variety of crops, including corn, soybeans, and wheat. The town also has a number of small businesses, including a hardware store, a grocery store, and a restaurant.
Demographics
As of the 2010 census, Hoagland had a population of 1,845. The racial makeup of the town was 97.3% White, 0.7% African American, 0.2% Native American, 0.3% Asian, and 1.5% from other races. The median household income was $45,938, and the median family income was $51,250. The per capita income was $20,945.
Hoagland is a small, rural town with a close-knit community. The town is home to a number of churches, and there are several community events throughout the year, including a Fourth of July parade and a Christmas tree lighting ceremony. The town also has a number of parks and recreational facilities, including a public swimming pool and a skate park.
Common Questions
What is Per Capita Income in Hoagland?
Per Capita income in Hoagland is $31,303.
What is the Median Family Income in Hoagland?
Median Family Income in Hoagland is $83,036.
What is the Median Household income in Hoagland?
Median Household Income in Hoagland is $65,750.
What is Income or Wage Gap in Hoagland?
Income or Wage Gap in Hoagland is 20.2%.
Women in Hoagland earn 79.8 cents for every dollar earned by a man.
What is Inequality or Gini Index in Hoagland?
Inequality or Gini Index in Hoagland is 0.43.
What is the Total Population of Hoagland?
Total Population of Hoagland is 878.
What is the Total Male Population of Hoagland?
Total Male Population of Hoagland is 466.
What is the Total Female Population of Hoagland?
Total Female Population of Hoagland is 412.
What is the Ratio of Males per 100 Females in Hoagland?
There are 113.11 Males per 100 Females in Hoagland.
What is the Ratio of Females per 100 Males in Hoagland?
There are 88.41 Females per 100 Males in Hoagland.
What is the Median Population Age in Hoagland?
Median Population Age in Hoagland is 39.1 Years.
What is the Average Family Size in Hoagland
Average Family Size in Hoagland is 3.3 People.
What is the Average Household Size in Hoagland
Average Household Size in Hoagland is 2.8 People.
How Large is the Labor Force in Hoagland?
There are 440 People in the Labor Forcein in Hoagland.
What is the Percentage of People in the Labor Force in Hoagland?
69.3% of People are in the Labor Force in Hoagland.
What is the Unemployment Rate in Hoagland?
Unemployment Rate in Hoagland is 3.2%.