Harlan, IN Map & Demographics
Harlan Map
Harlan Overview
$37,321
PER CAPITA INCOME
$82,723
AVG FAMILY INCOME
$76,750
AVG HOUSEHOLD INCOME
16.6%
WAGE / INCOME GAP [ % ]
83.4¢/ $1
WAGE / INCOME GAP [ $ ]
0.31
INEQUALITY / GINI INDEX
1,613
TOTAL POPULATION
948
MALE POPULATION
665
FEMALE POPULATION
142.56
MALES / 100 FEMALES
70.15
FEMALES / 100 MALES
46.4
MEDIAN AGE
2.8
AVG FAMILY SIZE
2.4
AVG HOUSEHOLD SIZE
967
LABOR FORCE [ PEOPLE ]
70.5%
PERCENT IN LABOR FORCE
7.9%
UNEMPLOYMENT RATE
Harlan Zip Codes
Harlan Area Codes
Income in Harlan
Income Overview in Harlan
Per Capita Income in Harlan is $37,321, while median incomes of families and households are $82,723 and $76,750 respectively.
| Characteristic | Number | Measure |
| Per Capita Income | 1,613 | $37,321 |
| Median Family Income | 485 | $82,723 |
| Mean Family Income | 485 | $96,759 |
| Median Household Income | 662 | $76,750 |
| Mean Household Income | 662 | $85,778 |
| Income Deficit | 485 | $0 |
| Wage / Income Gap (%) | 1,613 | 16.55% |
| Wage / Income Gap ($) | 1,613 | 83.45¢ per $1 |
| Gini / Inequality Index | 1,613 | 0.31 |
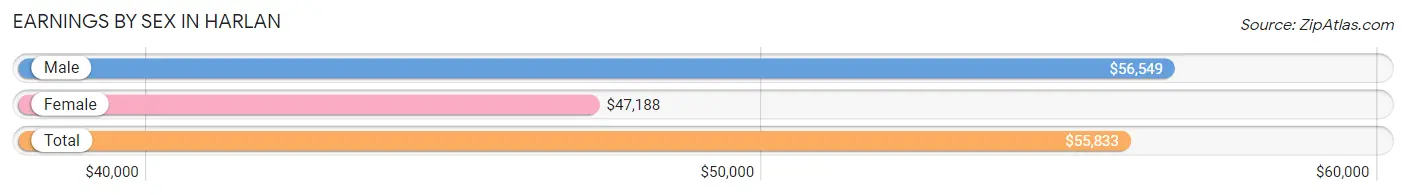
Earnings by Sex in Harlan
Average Earnings in Harlan are $55,833, $56,549 for men and $47,188 for women, a difference of 16.6%.
| Sex | Number | Average Earnings |
| Male | 574 (58.3%) | $56,549 |
| Female | 410 (41.7%) | $47,188 |
| Total | 984 (100.0%) | $55,833 |
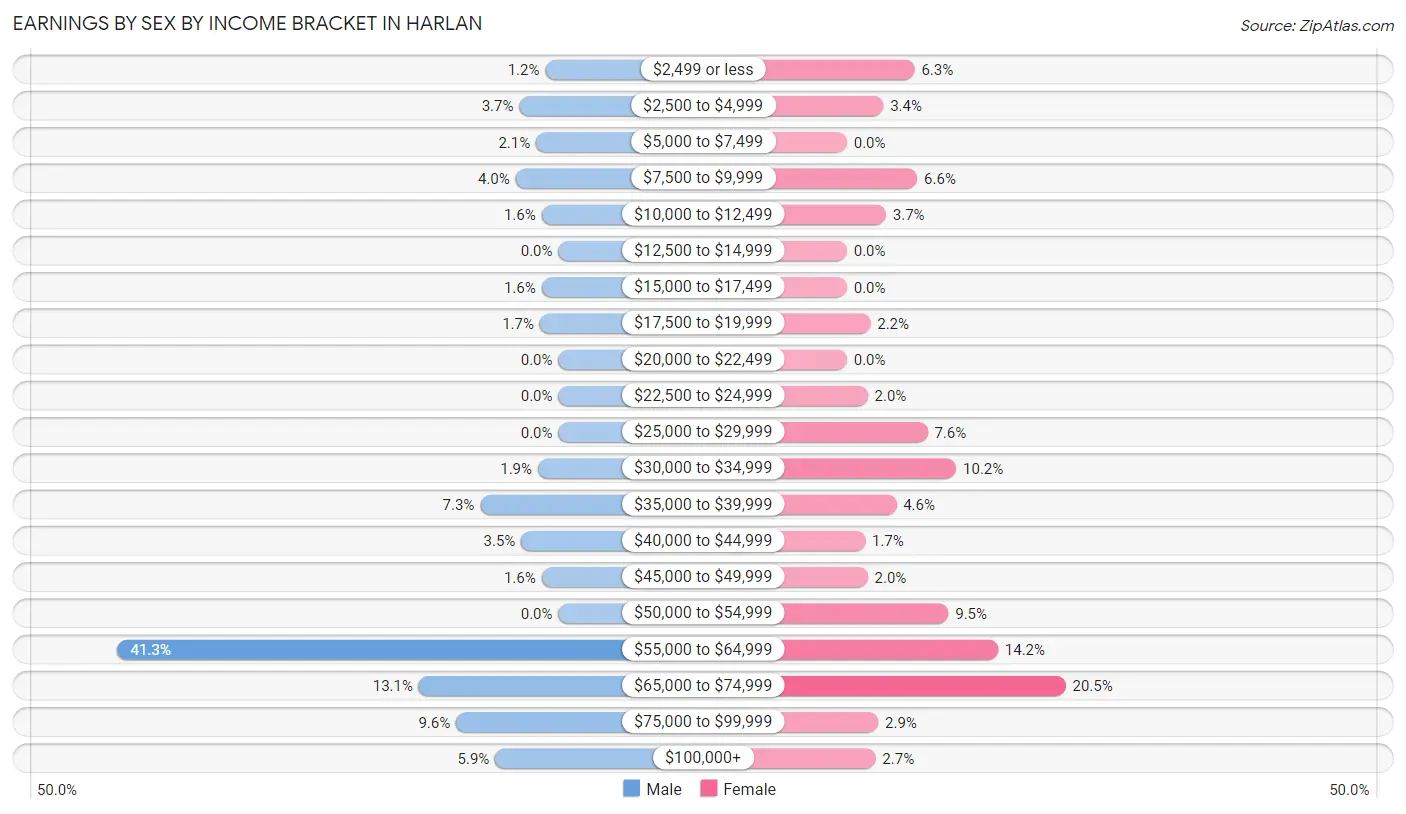
Earnings by Sex by Income Bracket in Harlan
The most common earnings brackets in Harlan are $55,000 to $64,999 for men (237 | 41.3%) and $65,000 to $74,999 for women (84 | 20.5%).
| Income | Male | Female |
| $2,499 or less | 7 (1.2%) | 26 (6.3%) |
| $2,500 to $4,999 | 21 (3.7%) | 14 (3.4%) |
| $5,000 to $7,499 | 12 (2.1%) | 0 (0.0%) |
| $7,500 to $9,999 | 23 (4.0%) | 27 (6.6%) |
| $10,000 to $12,499 | 9 (1.6%) | 15 (3.7%) |
| $12,500 to $14,999 | 0 (0.0%) | 0 (0.0%) |
| $15,000 to $17,499 | 9 (1.6%) | 0 (0.0%) |
| $17,500 to $19,999 | 10 (1.7%) | 9 (2.2%) |
| $20,000 to $22,499 | 0 (0.0%) | 0 (0.0%) |
| $22,500 to $24,999 | 0 (0.0%) | 8 (1.9%) |
| $25,000 to $29,999 | 0 (0.0%) | 31 (7.6%) |
| $30,000 to $34,999 | 11 (1.9%) | 42 (10.2%) |
| $35,000 to $39,999 | 42 (7.3%) | 19 (4.6%) |
| $40,000 to $44,999 | 20 (3.5%) | 7 (1.7%) |
| $45,000 to $49,999 | 9 (1.6%) | 8 (1.9%) |
| $50,000 to $54,999 | 0 (0.0%) | 39 (9.5%) |
| $55,000 to $64,999 | 237 (41.3%) | 58 (14.1%) |
| $65,000 to $74,999 | 75 (13.1%) | 84 (20.5%) |
| $75,000 to $99,999 | 55 (9.6%) | 12 (2.9%) |
| $100,000+ | 34 (5.9%) | 11 (2.7%) |
| Total | 574 (100.0%) | 410 (100.0%) |
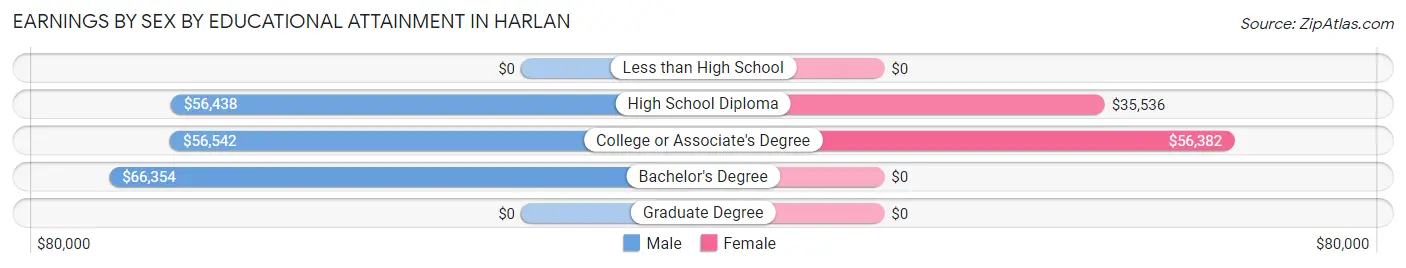
Earnings by Sex by Educational Attainment in Harlan
Average earnings in Harlan are $56,705 for men and $54,359 for women, a difference of 4.1%. Men with an educational attainment of bachelor's degree enjoy the highest average annual earnings of $66,354, while those with high school diploma education earn the least with $56,438. Women with an educational attainment of college or associate's degree earn the most with the average annual earnings of $56,382, while those with high school diploma education have the smallest earnings of $35,536.
| Educational Attainment | Male Income | Female Income |
| Less than High School | - | - |
| High School Diploma | $56,438 | $35,536 |
| College or Associate's Degree | $56,542 | $56,382 |
| Bachelor's Degree | $66,354 | $0 |
| Graduate Degree | - | - |
| Total | $56,705 | $54,359 |
Family Income in Harlan
Family Income Brackets in Harlan
According to the Harlan family income data, there are 113 families falling into the $75,000 to $99,999 income range, which is the most common income bracket and makes up 23.3% of all families.
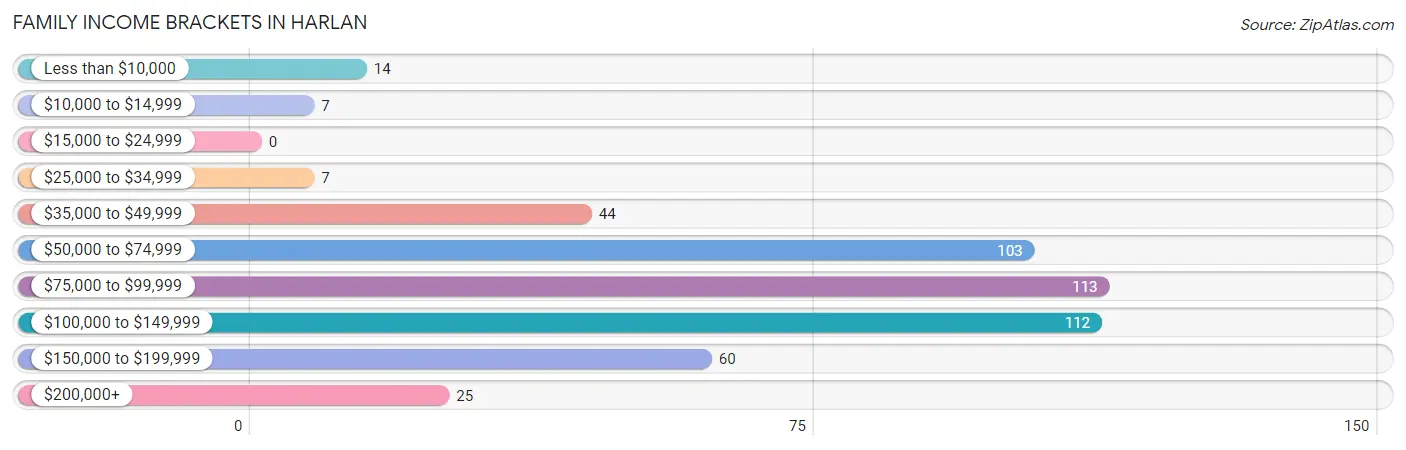
| Income Bracket | # Families | % Families |
| Less than $10,000 | 14 | 2.9% |
| $10,000 to $14,999 | 7 | 1.4% |
| $15,000 to $24,999 | 0 | 0.0% |
| $25,000 to $34,999 | 7 | 1.4% |
| $35,000 to $49,999 | 44 | 9.1% |
| $50,000 to $74,999 | 103 | 21.2% |
| $75,000 to $99,999 | 113 | 23.3% |
| $100,000 to $149,999 | 112 | 23.1% |
| $150,000 to $199,999 | 60 | 12.4% |
| $200,000+ | 25 | 5.2% |
Family Income by Famaliy Size in Harlan
3-person families (188 | 38.8%) account for the highest median family income in Harlan with $141,892 per family, while 3-person families (188 | 38.8%) have the highest median income of $47,297 per family member.
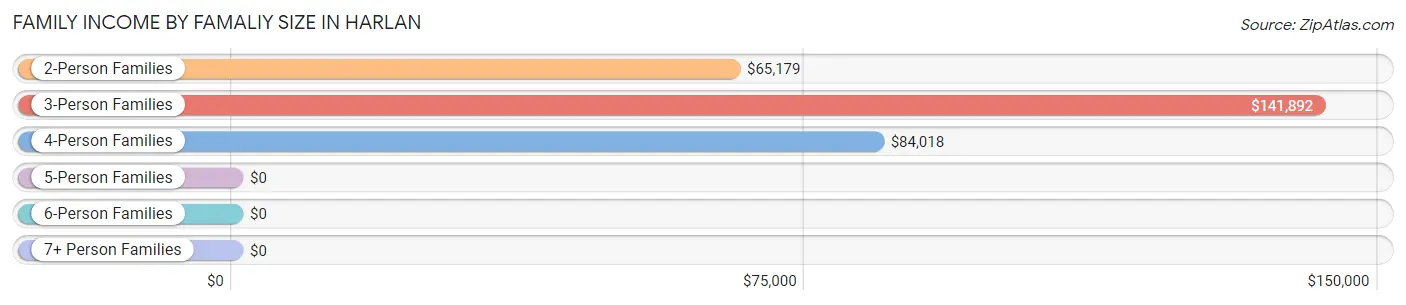
| Income Bracket | # Families | Median Income |
| 2-Person Families | 227 (46.8%) | $65,179 |
| 3-Person Families | 188 (38.8%) | $141,892 |
| 4-Person Families | 50 (10.3%) | $84,018 |
| 5-Person Families | 20 (4.1%) | $0 |
| 6-Person Families | 0 (0.0%) | $0 |
| 7+ Person Families | 0 (0.0%) | $0 |
| Total | 485 (100.0%) | $82,723 |
Family Income by Number of Earners in Harlan
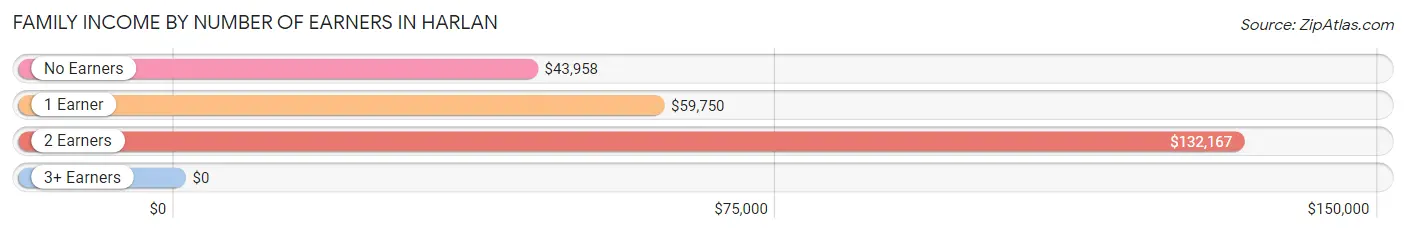
| Number of Earners | # Families | Median Income |
| No Earners | 35 (7.2%) | $43,958 |
| 1 Earner | 160 (33.0%) | $59,750 |
| 2 Earners | 262 (54.0%) | $132,167 |
| 3+ Earners | 28 (5.8%) | $0 |
| Total | 485 (100.0%) | $82,723 |
Household Income in Harlan
Household Income Brackets in Harlan
With 179 households falling in the category, the $50,000 to $74,999 income range is the most frequent in Harlan, accounting for 27.0% of all households.
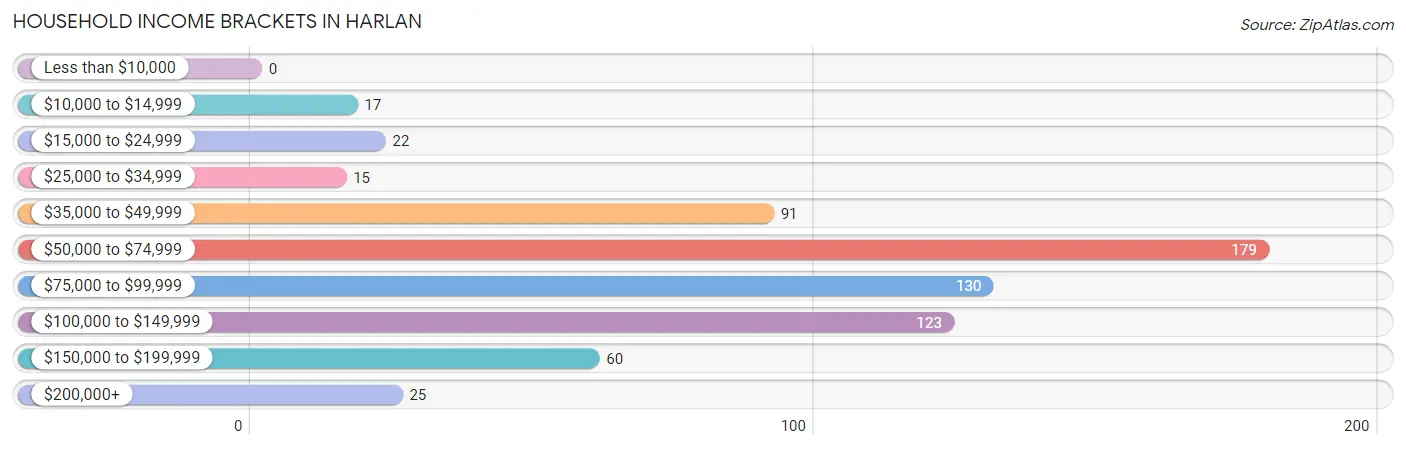
| Income Bracket | # Households | % Households |
| Less than $10,000 | 0 | 0.0% |
| $10,000 to $14,999 | 17 | 2.6% |
| $15,000 to $24,999 | 22 | 3.3% |
| $25,000 to $34,999 | 15 | 2.3% |
| $35,000 to $49,999 | 91 | 13.7% |
| $50,000 to $74,999 | 179 | 27.0% |
| $75,000 to $99,999 | 130 | 19.6% |
| $100,000 to $149,999 | 123 | 18.6% |
| $150,000 to $199,999 | 60 | 9.1% |
| $200,000+ | 25 | 3.8% |
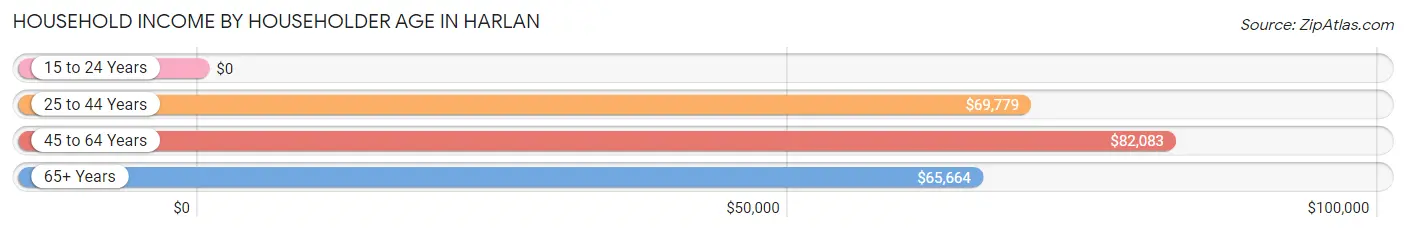
Household Income by Householder Age in Harlan
The median household income in Harlan is $76,750, with the highest median household income of $82,083 found in the 45 to 64 years age bracket for the primary householder. A total of 214 households (32.3%) fall into this category. Meanwhile, the 15 to 24 years age bracket for the primary householder has the lowest median household income of $0, with 22 households (3.3%) in this group.
| Income Bracket | # Households | Median Income |
| 15 to 24 Years | 22 (3.3%) | $0 |
| 25 to 44 Years | 155 (23.4%) | $69,779 |
| 45 to 64 Years | 214 (32.3%) | $82,083 |
| 65+ Years | 271 (40.9%) | $65,664 |
| Total | 662 (100.0%) | $76,750 |
Poverty in Harlan
Income Below Poverty by Sex and Age in Harlan
With 5.0% poverty level for males and 7.8% for females among the residents of Harlan, 25 to 34 year old males and 12 to 14 year old females are the most vulnerable to poverty, with 26 males (38.2%) and 14 females (33.3%) in their respective age groups living below the poverty level.
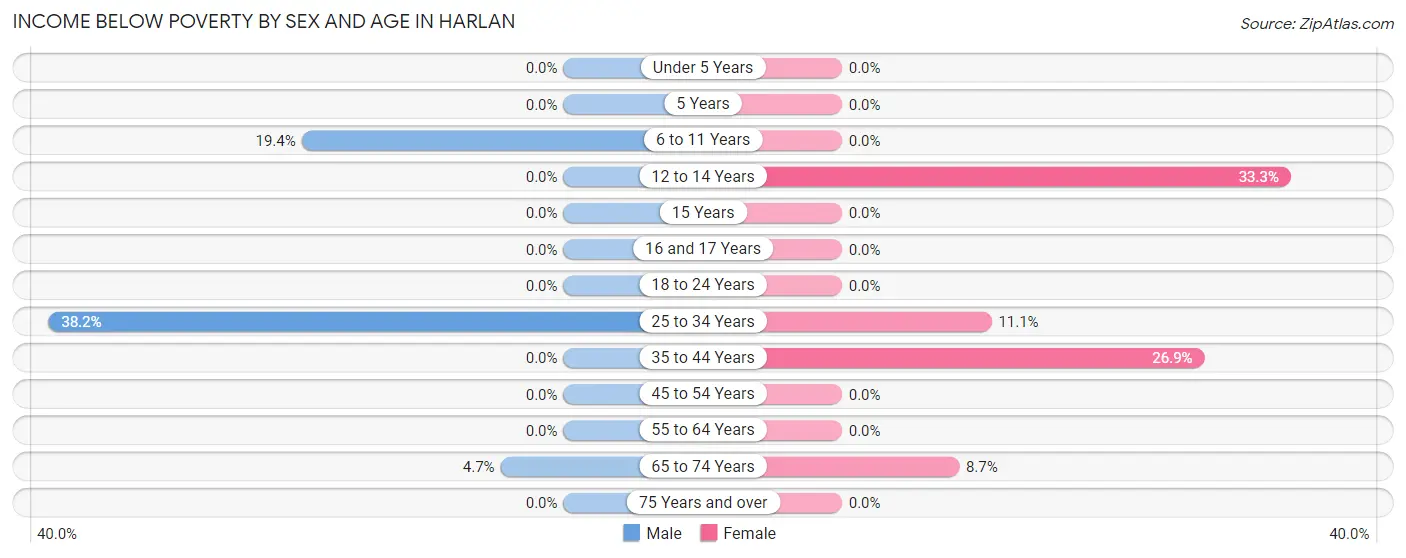
| Age Bracket | Male | Female |
| Under 5 Years | 0 (0.0%) | 0 (0.0%) |
| 5 Years | 0 (0.0%) | 0 (0.0%) |
| 6 to 11 Years | 14 (19.4%) | 0 (0.0%) |
| 12 to 14 Years | 0 (0.0%) | 14 (33.3%) |
| 15 Years | 0 (0.0%) | 0 (0.0%) |
| 16 and 17 Years | 0 (0.0%) | 0 (0.0%) |
| 18 to 24 Years | 0 (0.0%) | 0 (0.0%) |
| 25 to 34 Years | 26 (38.2%) | 10 (11.1%) |
| 35 to 44 Years | 0 (0.0%) | 14 (26.9%) |
| 45 to 54 Years | 0 (0.0%) | 0 (0.0%) |
| 55 to 64 Years | 0 (0.0%) | 0 (0.0%) |
| 65 to 74 Years | 7 (4.7%) | 14 (8.7%) |
| 75 Years and over | 0 (0.0%) | 0 (0.0%) |
| Total | 47 (5.0%) | 52 (7.8%) |
Income Above Poverty by Sex and Age in Harlan
According to the poverty statistics in Harlan, males aged under 5 years and females aged 6 to 11 years are the age groups that are most secure financially, with 100.0% of males and 100.0% of females in these age groups living above the poverty line.
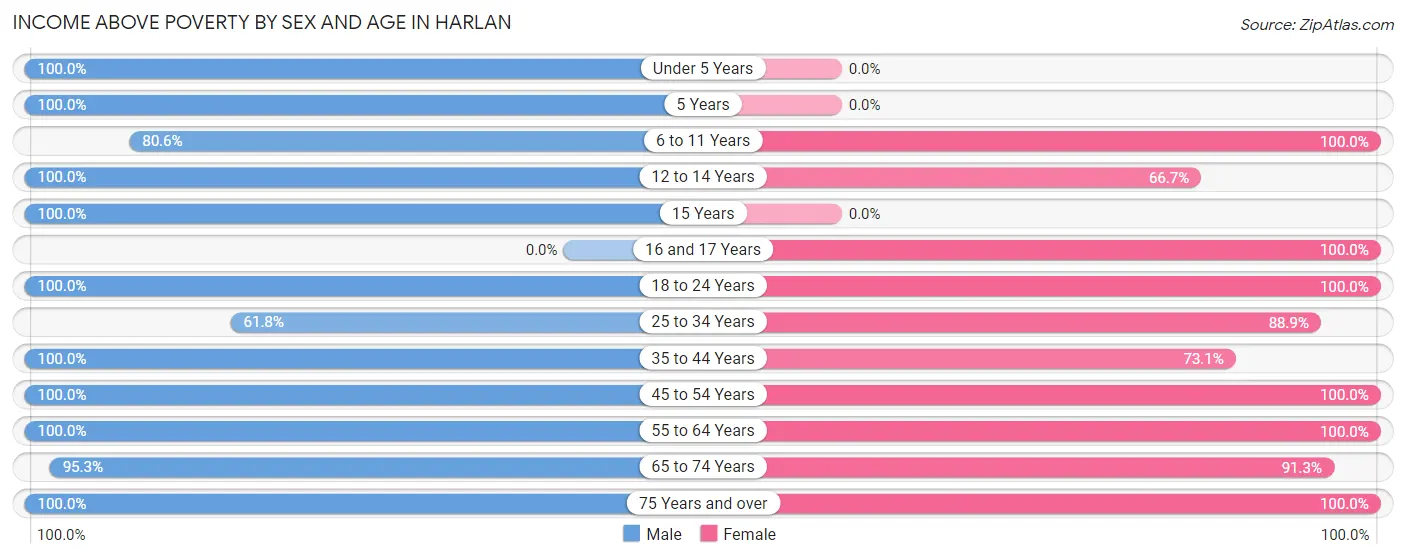
| Age Bracket | Male | Female |
| Under 5 Years | 38 (100.0%) | 0 (0.0%) |
| 5 Years | 37 (100.0%) | 0 (0.0%) |
| 6 to 11 Years | 58 (80.6%) | 11 (100.0%) |
| 12 to 14 Years | 30 (100.0%) | 28 (66.7%) |
| 15 Years | 12 (100.0%) | 0 (0.0%) |
| 16 and 17 Years | 0 (0.0%) | 24 (100.0%) |
| 18 to 24 Years | 54 (100.0%) | 47 (100.0%) |
| 25 to 34 Years | 42 (61.8%) | 80 (88.9%) |
| 35 to 44 Years | 222 (100.0%) | 38 (73.1%) |
| 45 to 54 Years | 78 (100.0%) | 60 (100.0%) |
| 55 to 64 Years | 126 (100.0%) | 121 (100.0%) |
| 65 to 74 Years | 143 (95.3%) | 147 (91.3%) |
| 75 Years and over | 61 (100.0%) | 57 (100.0%) |
| Total | 901 (95.0%) | 613 (92.2%) |
Income Below Poverty Among Married-Couple Families in Harlan
The poverty statistics for married-couple families in Harlan show that 1.8% or 7 of the total 384 families live below the poverty line. Families with no children have the highest poverty rate of 2.7%, comprising of 7 families. On the other hand, families with 1 or 2 children have the lowest poverty rate of 0.0%, which includes 0 families.
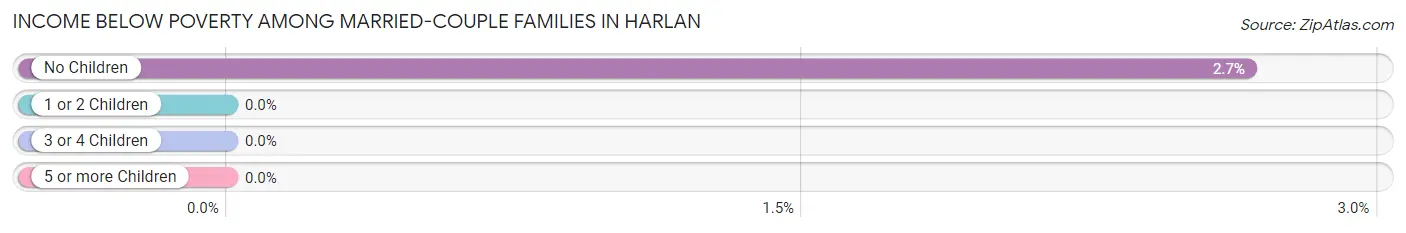
| Children | Above Poverty | Below Poverty |
| No Children | 256 (97.3%) | 7 (2.7%) |
| 1 or 2 Children | 112 (100.0%) | 0 (0.0%) |
| 3 or 4 Children | 9 (100.0%) | 0 (0.0%) |
| 5 or more Children | 0 (0.0%) | 0 (0.0%) |
| Total | 377 (98.2%) | 7 (1.8%) |
Income Below Poverty Among Single-Parent Households in Harlan
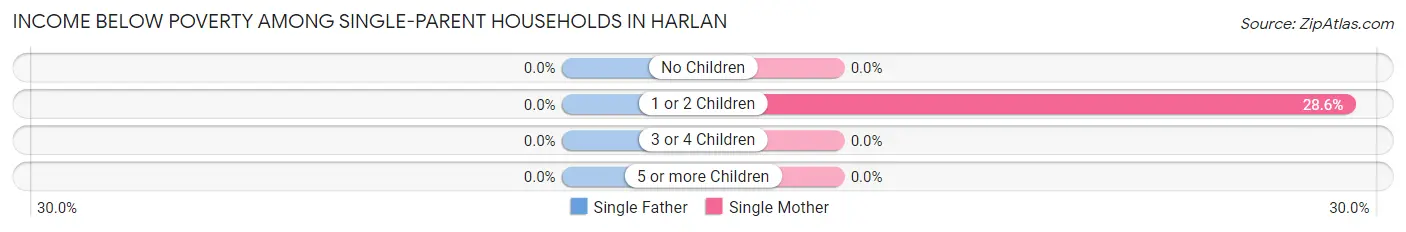
| Children | Single Father | Single Mother |
| No Children | 0 (0.0%) | 0 (0.0%) |
| 1 or 2 Children | 0 (0.0%) | 14 (28.6%) |
| 3 or 4 Children | 0 (0.0%) | 0 (0.0%) |
| 5 or more Children | 0 (0.0%) | 0 (0.0%) |
| Total | 0 (0.0%) | 14 (24.1%) |
Income Below Poverty Among Married-Couple vs Single-Parent Households in Harlan
The poverty data for Harlan shows that 7 of the married-couple family households (1.8%) and 14 of the single-parent households (13.9%) are living below the poverty level. Within the married-couple family households, those with no children have the highest poverty rate, with 7 households (2.7%) falling below the poverty line. Among the single-parent households, those with 1 or 2 children have the highest poverty rate, with 14 household (20.0%) living below poverty.
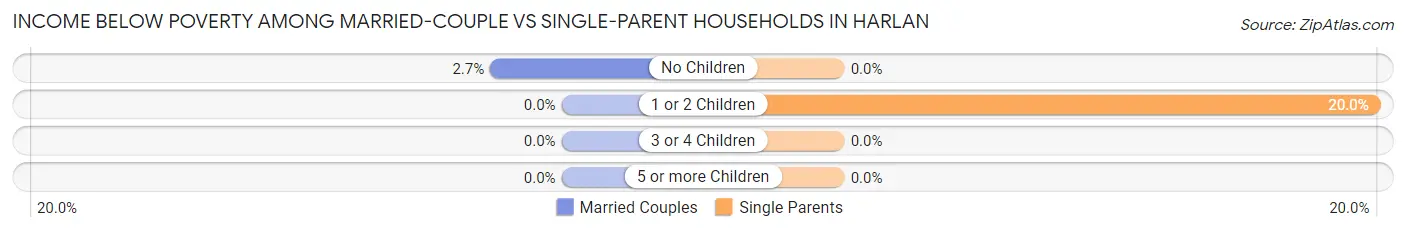
| Children | Married-Couple Families | Single-Parent Households |
| No Children | 7 (2.7%) | 0 (0.0%) |
| 1 or 2 Children | 0 (0.0%) | 14 (20.0%) |
| 3 or 4 Children | 0 (0.0%) | 0 (0.0%) |
| 5 or more Children | 0 (0.0%) | 0 (0.0%) |
| Total | 7 (1.8%) | 14 (13.9%) |
Race in Harlan
The most populous races in Harlan are White / Caucasian (1,579 | 97.9%), Hispanic or Latino (18 | 1.1%), and Two or more Races (17 | 1.1%).
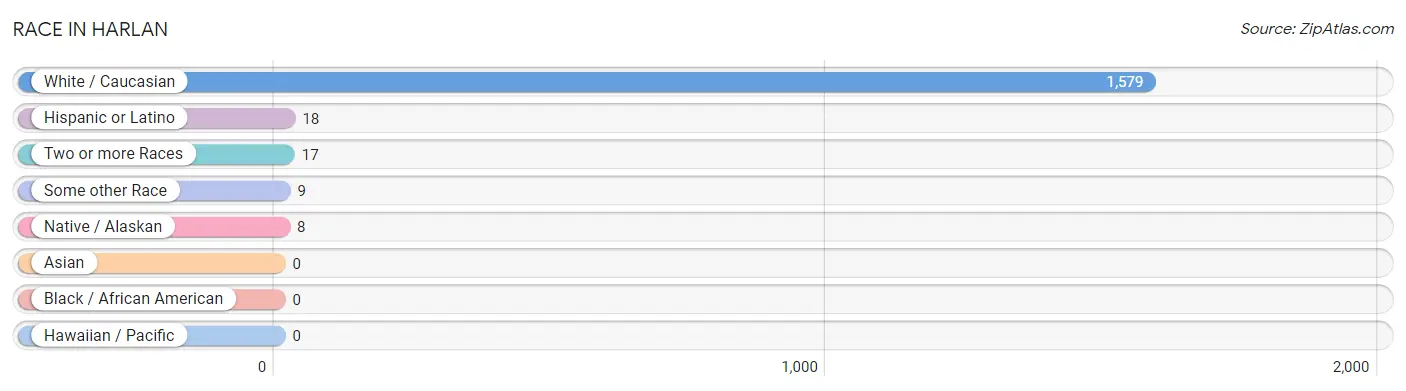
| Race | # Population | % Population |
| Asian | 0 | 0.0% |
| Black / African American | 0 | 0.0% |
| Hawaiian / Pacific | 0 | 0.0% |
| Hispanic or Latino | 18 | 1.1% |
| Native / Alaskan | 8 | 0.5% |
| White / Caucasian | 1,579 | 97.9% |
| Two or more Races | 17 | 1.1% |
| Some other Race | 9 | 0.6% |
| Total | 1,613 | 100.0% |
Ancestry in Harlan
The most populous ancestries reported in Harlan are German (530 | 32.9%), Irish (327 | 20.3%), American (267 | 16.6%), English (68 | 4.2%), and French (52 | 3.2%), together accounting for 77.1% of all Harlan residents.
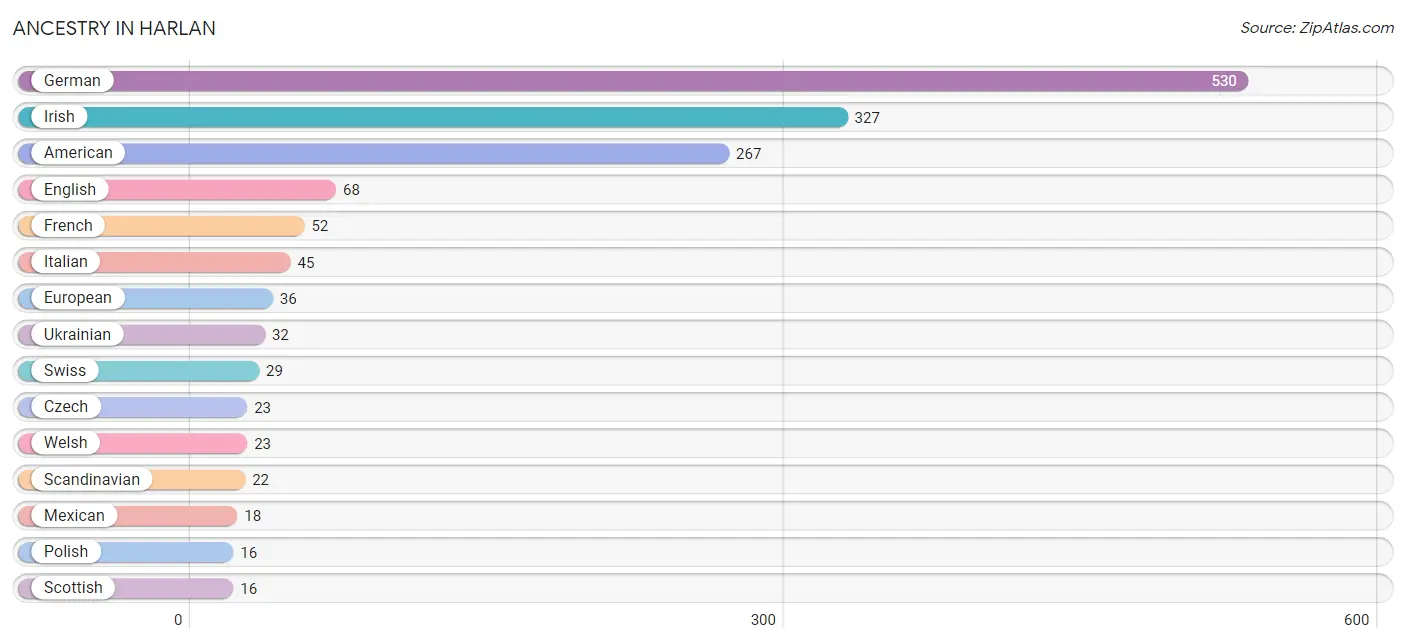
| Ancestry | # Population | % Population |
| American | 267 | 16.6% |
| Czech | 23 | 1.4% |
| English | 68 | 4.2% |
| European | 36 | 2.2% |
| French | 52 | 3.2% |
| German | 530 | 32.9% |
| Greek | 9 | 0.6% |
| Icelander | 9 | 0.6% |
| Irish | 327 | 20.3% |
| Italian | 45 | 2.8% |
| Mexican | 18 | 1.1% |
| Navajo | 8 | 0.5% |
| Polish | 16 | 1.0% |
| Scandinavian | 22 | 1.4% |
| Scottish | 16 | 1.0% |
| South African | 15 | 0.9% |
| Subsaharan African | 15 | 0.9% |
| Swiss | 29 | 1.8% |
| Ukrainian | 32 | 2.0% |
| Welsh | 23 | 1.4% | View All 20 Rows |
Immigrants in Harlan
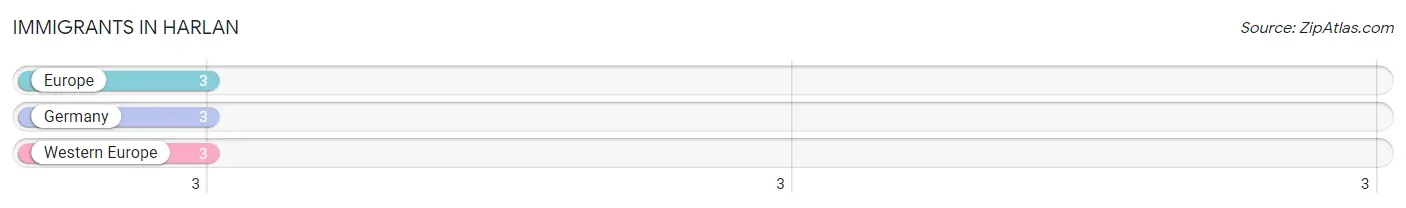
The most numerous immigrant groups reported in Harlan came from Europe (3 | 0.2%), Germany (3 | 0.2%), and Western Europe (3 | 0.2%), together accounting for 0.6% of all Harlan residents.
| Immigration Origin | # Population | % Population |
| Europe | 3 | 0.2% |
| Germany | 3 | 0.2% |
| Western Europe | 3 | 0.2% | View All 3 Rows |
Sex and Age in Harlan
Sex and Age in Harlan
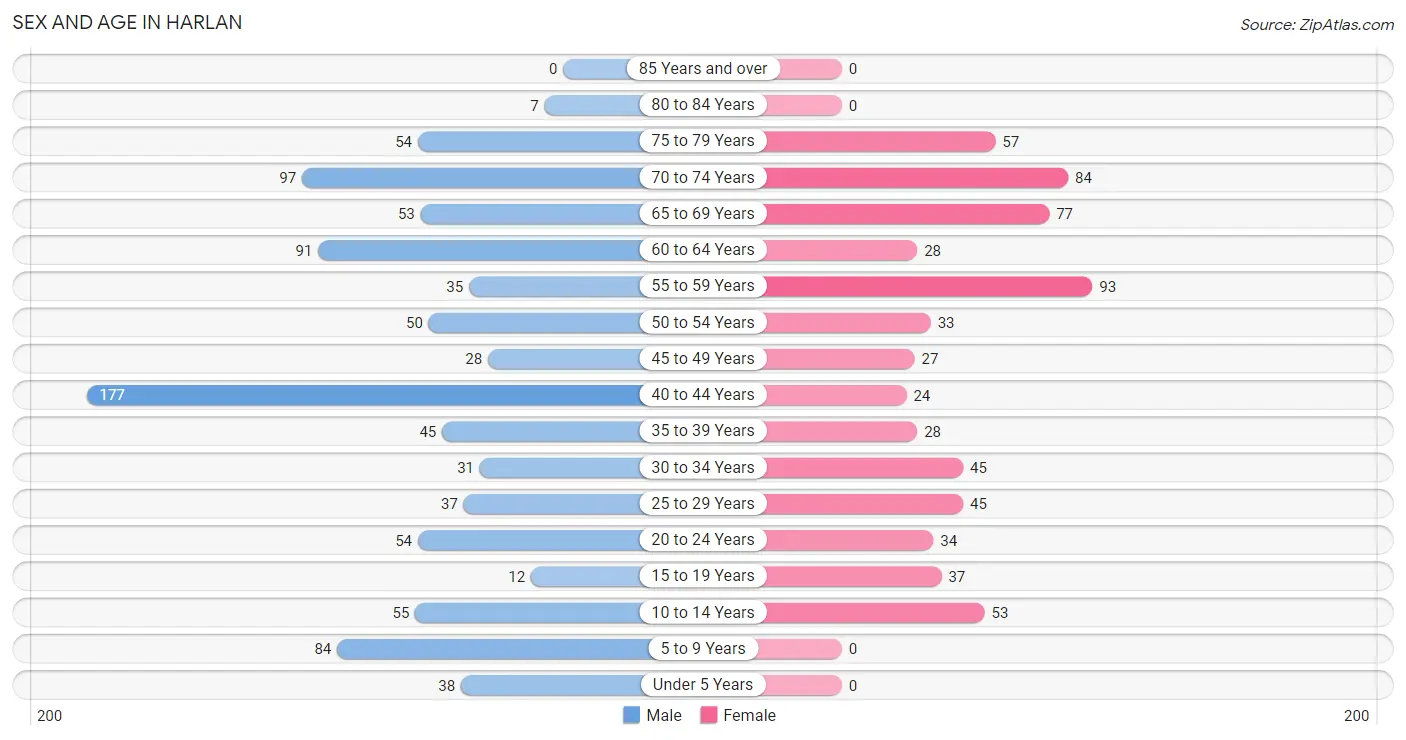
The most populous age groups in Harlan are 40 to 44 Years (177 | 18.7%) for men and 55 to 59 Years (93 | 14.0%) for women.
| Age Bracket | Male | Female |
| Under 5 Years | 38 (4.0%) | 0 (0.0%) |
| 5 to 9 Years | 84 (8.9%) | 0 (0.0%) |
| 10 to 14 Years | 55 (5.8%) | 53 (8.0%) |
| 15 to 19 Years | 12 (1.3%) | 37 (5.6%) |
| 20 to 24 Years | 54 (5.7%) | 34 (5.1%) |
| 25 to 29 Years | 37 (3.9%) | 45 (6.8%) |
| 30 to 34 Years | 31 (3.3%) | 45 (6.8%) |
| 35 to 39 Years | 45 (4.8%) | 28 (4.2%) |
| 40 to 44 Years | 177 (18.7%) | 24 (3.6%) |
| 45 to 49 Years | 28 (2.9%) | 27 (4.1%) |
| 50 to 54 Years | 50 (5.3%) | 33 (5.0%) |
| 55 to 59 Years | 35 (3.7%) | 93 (14.0%) |
| 60 to 64 Years | 91 (9.6%) | 28 (4.2%) |
| 65 to 69 Years | 53 (5.6%) | 77 (11.6%) |
| 70 to 74 Years | 97 (10.2%) | 84 (12.6%) |
| 75 to 79 Years | 54 (5.7%) | 57 (8.6%) |
| 80 to 84 Years | 7 (0.7%) | 0 (0.0%) |
| 85 Years and over | 0 (0.0%) | 0 (0.0%) |
| Total | 948 (100.0%) | 665 (100.0%) |
Families and Households in Harlan
Median Family Size in Harlan
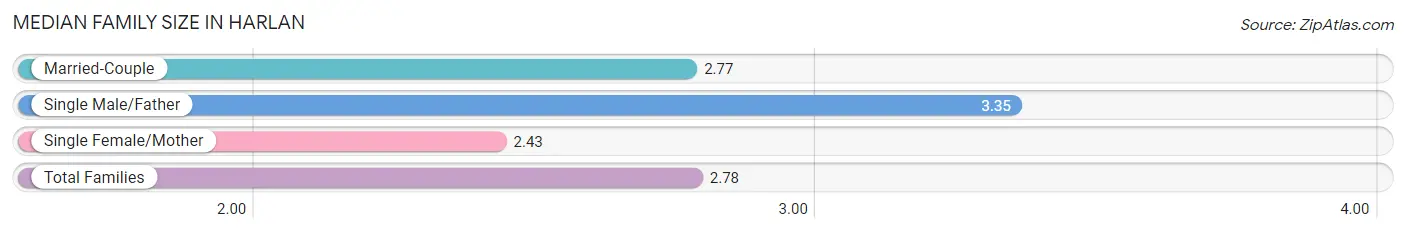
The median family size in Harlan is 2.78 persons per family, with single male/father families (43 | 8.9%) accounting for the largest median family size of 3.35 persons per family. On the other hand, single female/mother families (58 | 12.0%) represent the smallest median family size with 2.43 persons per family.
| Family Type | # Families | Family Size |
| Married-Couple | 384 (79.2%) | 2.77 |
| Single Male/Father | 43 (8.9%) | 3.35 |
| Single Female/Mother | 58 (12.0%) | 2.43 |
| Total Families | 485 (100.0%) | 2.78 |
Median Household Size in Harlan
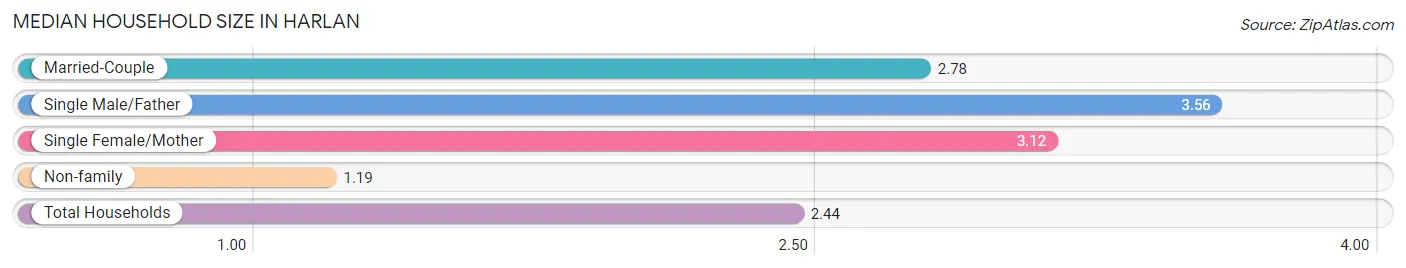
The median household size in Harlan is 2.44 persons per household, with single male/father households (43 | 6.5%) accounting for the largest median household size of 3.56 persons per household. non-family households (177 | 26.7%) represent the smallest median household size with 1.19 persons per household.
| Household Type | # Households | Household Size |
| Married-Couple | 384 (58.0%) | 2.78 |
| Single Male/Father | 43 (6.5%) | 3.56 |
| Single Female/Mother | 58 (8.8%) | 3.12 |
| Non-family | 177 (26.7%) | 1.19 |
| Total Households | 662 (100.0%) | 2.44 |
Household Size by Marriage Status in Harlan
Out of a total of 662 households in Harlan, 485 (73.3%) are family households, while 177 (26.7%) are nonfamily households. The most numerous type of family households are 3-person households, comprising 218, and the most common type of nonfamily households are 1-person households, comprising 146.
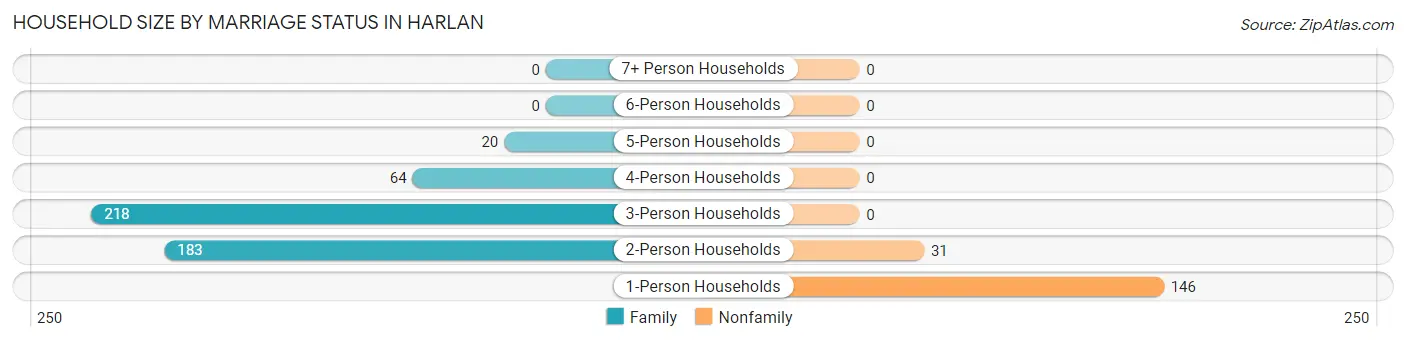
| Household Size | Family Households | Nonfamily Households |
| 1-Person Households | - | 146 (22.1%) |
| 2-Person Households | 183 (27.6%) | 31 (4.7%) |
| 3-Person Households | 218 (32.9%) | 0 (0.0%) |
| 4-Person Households | 64 (9.7%) | 0 (0.0%) |
| 5-Person Households | 20 (3.0%) | 0 (0.0%) |
| 6-Person Households | 0 (0.0%) | 0 (0.0%) |
| 7+ Person Households | 0 (0.0%) | 0 (0.0%) |
| Total | 485 (73.3%) | 177 (26.7%) |
Female Fertility in Harlan
Fertility by Age in Harlan
Average fertility rate in Harlan is 68.0 births per 1,000 women. Women in the age bracket of 20 to 34 years have the highest fertility rate with 137.0 births per 1,000 women. Women in the age bracket of 20 to 34 years acount for 100.0% of all women with births.
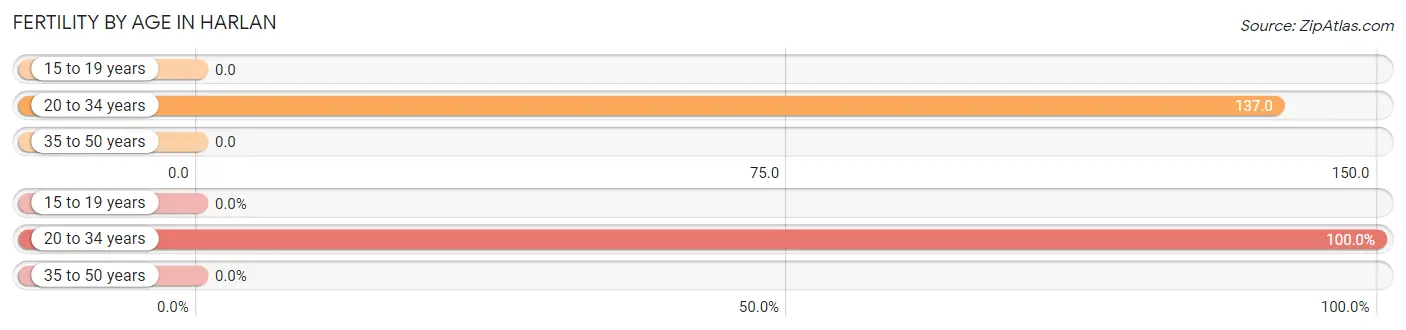
| Age Bracket | Women with Births | Births / 1,000 Women |
| 15 to 19 years | 0 (0.0%) | 0.0 |
| 20 to 34 years | 17 (100.0%) | 137.0 |
| 35 to 50 years | 0 (0.0%) | 0.0 |
| Total | 17 (100.0%) | 68.0 |
Fertility by Age by Marriage Status in Harlan
47.1% of women with births (17) in Harlan are married. The highest percentage of unmarried women with births falls into 20 to 34 years age bracket with 52.9% of them unmarried at the time of birth, while the lowest percentage of unmarried women with births belong to 20 to 34 years age bracket with 52.9% of them unmarried.
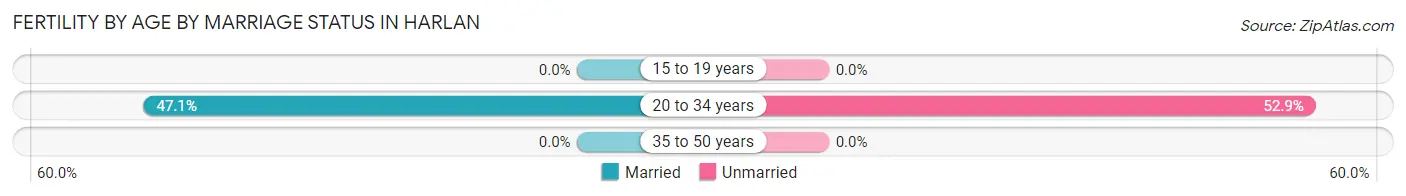
| Age Bracket | Married | Unmarried |
| 15 to 19 years | 0 (0.0%) | 0 (0.0%) |
| 20 to 34 years | 8 (47.1%) | 9 (52.9%) |
| 35 to 50 years | 0 (0.0%) | 0 (0.0%) |
| Total | 8 (47.1%) | 9 (52.9%) |
Fertility by Education in Harlan
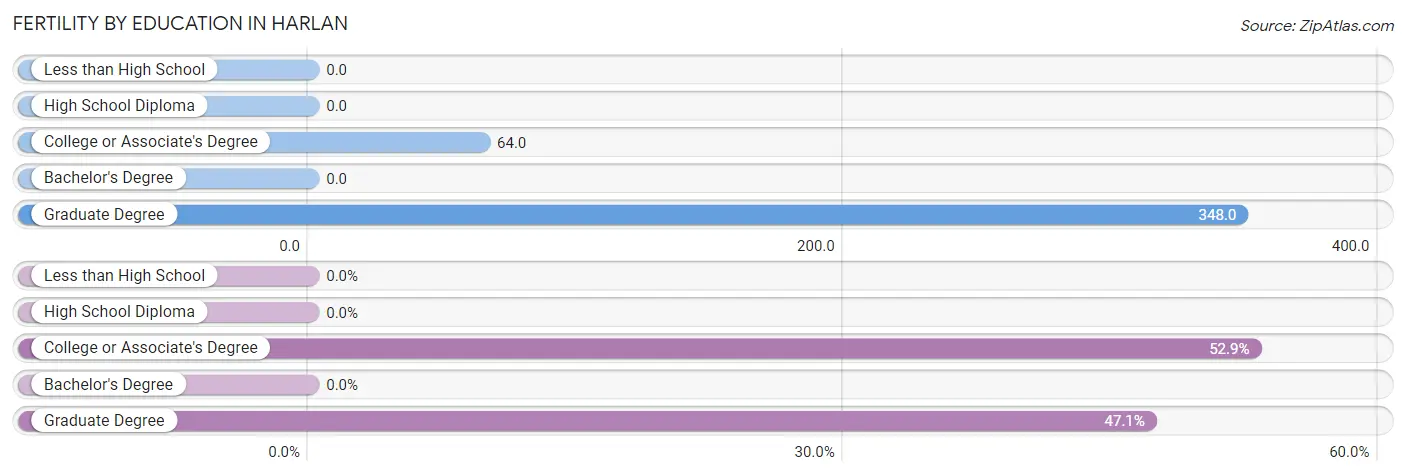
| Educational Attainment | Women with Births | Births / 1,000 Women |
| Less than High School | 0 (0.0%) | 0.0 |
| High School Diploma | 0 (0.0%) | 0.0 |
| College or Associate's Degree | 9 (52.9%) | 64.0 |
| Bachelor's Degree | 0 (0.0%) | 0.0 |
| Graduate Degree | 8 (47.1%) | 348.0 |
| Total | 17 (100.0%) | 68.0 |
Fertility by Education by Marriage Status in Harlan
52.9% of women with births in Harlan are unmarried. Women with the educational attainment of graduate degree are most likely to be married with 100.0% of them married at childbirth, while women with the educational attainment of college or associate's degree are least likely to be married with 100.0% of them unmarried at childbirth.
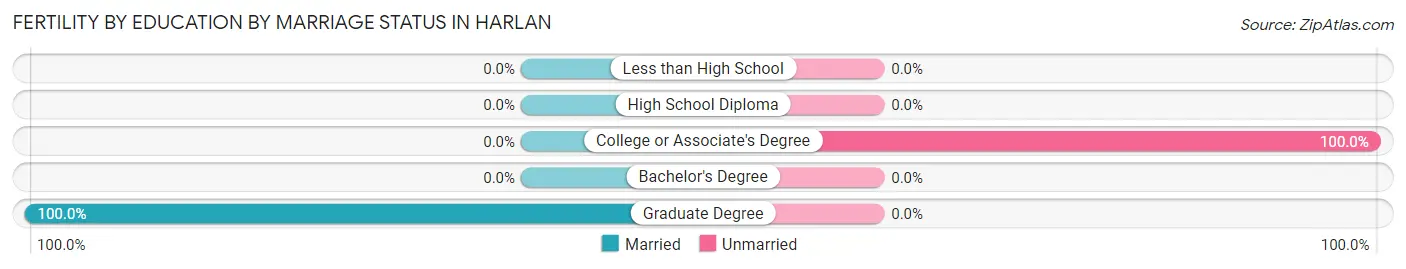
| Educational Attainment | Married | Unmarried |
| Less than High School | 0 (0.0%) | 0 (0.0%) |
| High School Diploma | 0 (0.0%) | 0 (0.0%) |
| College or Associate's Degree | 0 (0.0%) | 9 (100.0%) |
| Bachelor's Degree | 0 (0.0%) | 0 (0.0%) |
| Graduate Degree | 8 (100.0%) | 0 (0.0%) |
| Total | 8 (47.1%) | 9 (52.9%) |
Employment Characteristics in Harlan
Employment by Class of Employer in Harlan
Among the 891 employed individuals in Harlan, private company employees (679 | 76.2%), not-for-profit organizations (117 | 13.1%), and local government employees (58 | 6.5%) make up the most common classes of employment.
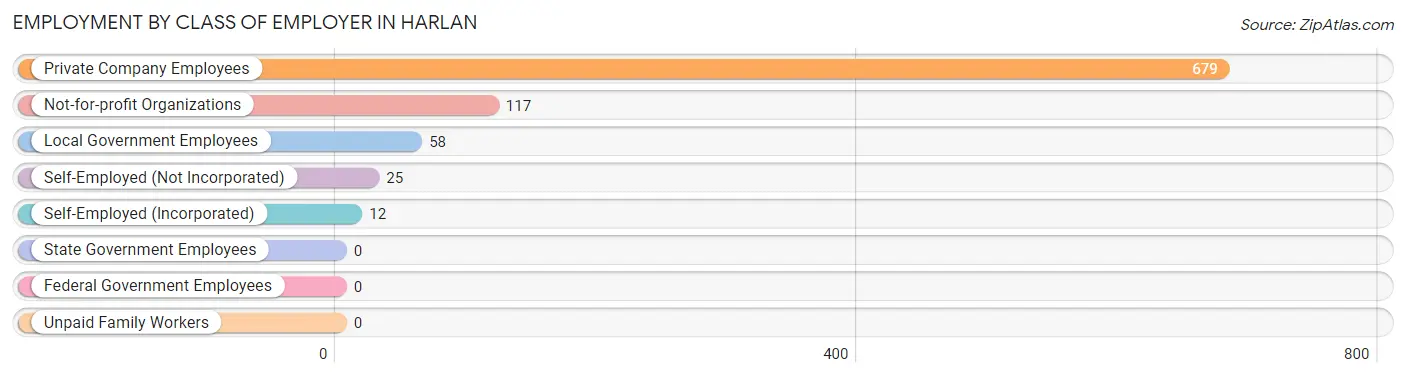
| Employer Class | # Employees | % Employees |
| Private Company Employees | 679 | 76.2% |
| Self-Employed (Incorporated) | 12 | 1.3% |
| Self-Employed (Not Incorporated) | 25 | 2.8% |
| Not-for-profit Organizations | 117 | 13.1% |
| Local Government Employees | 58 | 6.5% |
| State Government Employees | 0 | 0.0% |
| Federal Government Employees | 0 | 0.0% |
| Unpaid Family Workers | 0 | 0.0% |
| Total | 891 | 100.0% |
Employment Status by Age in Harlan
According to the labor force statistics for Harlan, out of the total population over 16 years of age (1,371), 70.5% or 967 individuals are in the labor force, with 7.9% or 76 of them unemployed. The age group with the highest labor force participation rate is 30 to 34 years, with 100.0% or 76 individuals in the labor force. Within the labor force, the 25 to 29 years age range has the highest percentage of unemployed individuals, with 40.6% or 26 of them being unemployed.
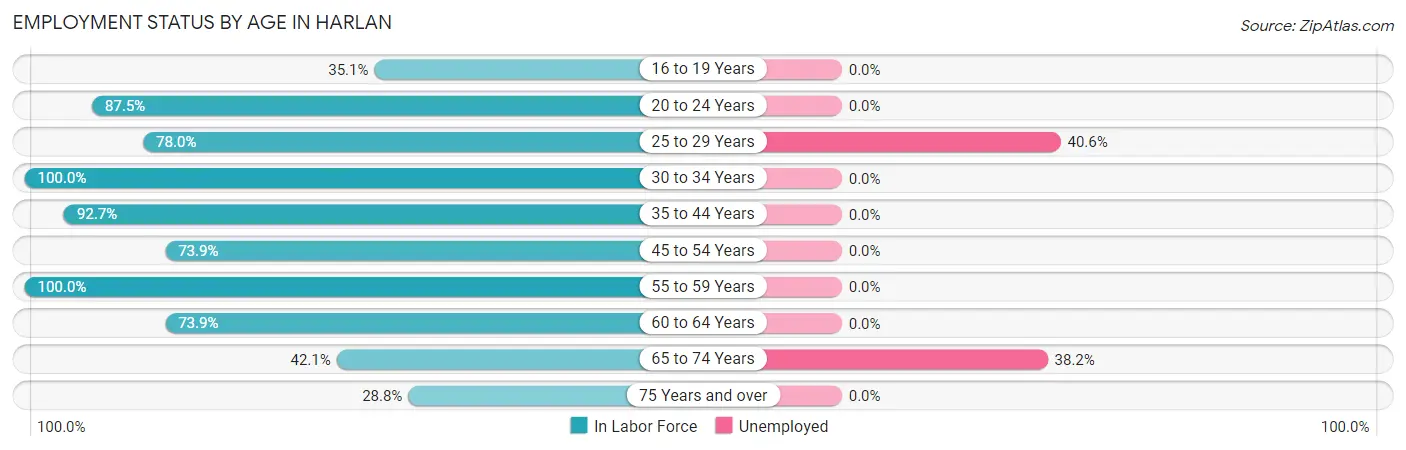
| Age Bracket | In Labor Force | Unemployed |
| 16 to 19 Years | 13 (35.1%) | 0 (0.0%) |
| 20 to 24 Years | 77 (87.5%) | 0 (0.0%) |
| 25 to 29 Years | 64 (78.0%) | 26 (40.6%) |
| 30 to 34 Years | 76 (100.0%) | 0 (0.0%) |
| 35 to 44 Years | 254 (92.7%) | 0 (0.0%) |
| 45 to 54 Years | 102 (73.9%) | 0 (0.0%) |
| 55 to 59 Years | 128 (100.0%) | 0 (0.0%) |
| 60 to 64 Years | 88 (73.9%) | 0 (0.0%) |
| 65 to 74 Years | 131 (42.1%) | 50 (38.2%) |
| 75 Years and over | 34 (28.8%) | 0 (0.0%) |
| Total | 967 (70.5%) | 76 (7.9%) |
Employment Status by Educational Attainment in Harlan
According to labor force statistics for Harlan, 87.1% of individuals (712) out of the total population between 25 and 64 years of age (817) are in the labor force, with 3.7% or 26 of them being unemployed. The group with the highest labor force participation rate are those with the educational attainment of college / associate degree, with 94.9% or 447 individuals in the labor force. Within the labor force, individuals with high school diploma education have the highest percentage of unemployment, with 17.9% or 26 of them being unemployed.
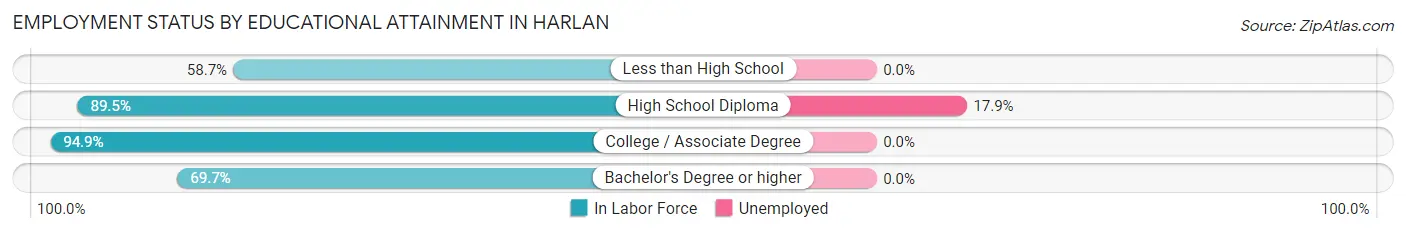
| Educational Attainment | In Labor Force | Unemployed |
| Less than High School | 44 (58.7%) | 0 (0.0%) |
| High School Diploma | 145 (89.5%) | 29 (17.9%) |
| College / Associate Degree | 447 (94.9%) | 0 (0.0%) |
| Bachelor's Degree or higher | 76 (69.7%) | 0 (0.0%) |
| Total | 712 (87.1%) | 30 (3.7%) |
Employment Occupations by Sex in Harlan
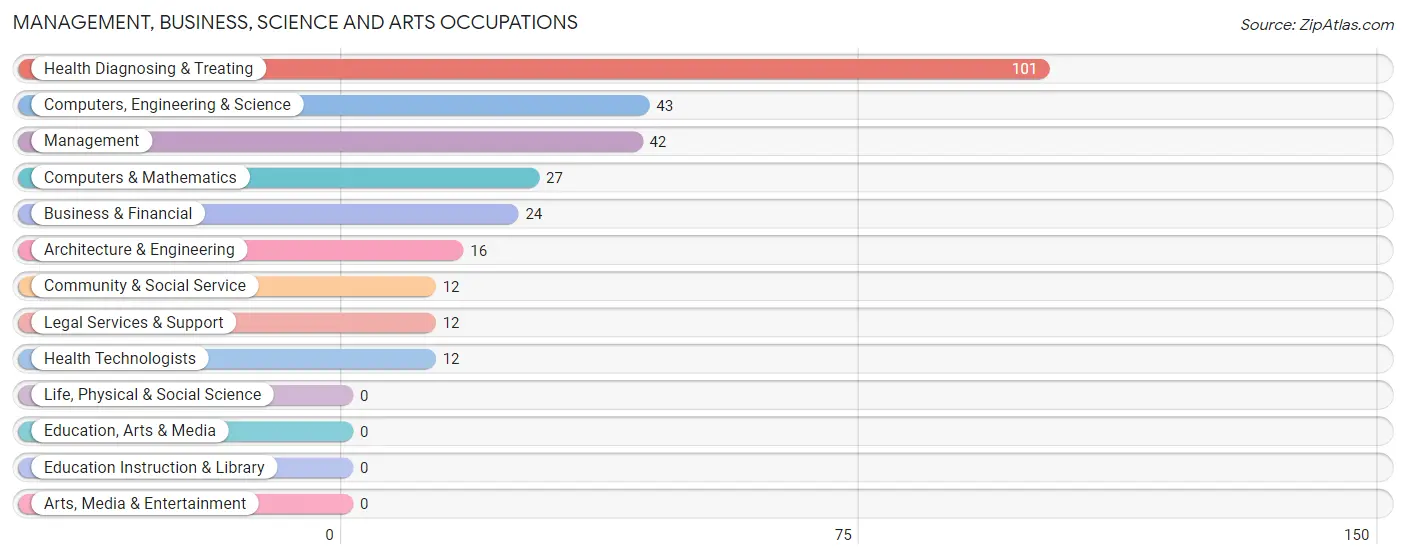
Management, Business, Science and Arts Occupations
The most common Management, Business, Science and Arts occupations in Harlan are Health Diagnosing & Treating (101 | 11.3%), Computers, Engineering & Science (43 | 4.8%), Management (42 | 4.7%), Computers & Mathematics (27 | 3.0%), and Business & Financial (24 | 2.7%).
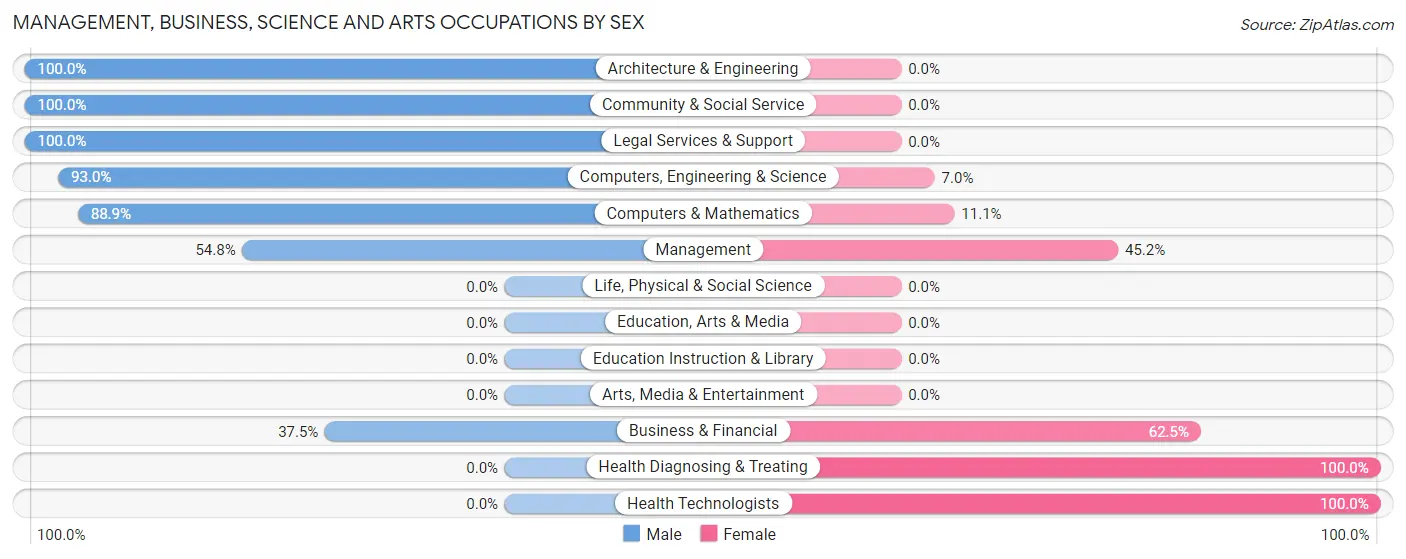
Management, Business, Science and Arts Occupations by Sex
Within the Management, Business, Science and Arts occupations in Harlan, the most male-oriented occupations are Architecture & Engineering (100.0%), Community & Social Service (100.0%), and Legal Services & Support (100.0%), while the most female-oriented occupations are Health Diagnosing & Treating (100.0%), Health Technologists (100.0%), and Business & Financial (62.5%).
| Occupation | Male | Female |
| Management | 23 (54.8%) | 19 (45.2%) |
| Business & Financial | 9 (37.5%) | 15 (62.5%) |
| Computers, Engineering & Science | 40 (93.0%) | 3 (7.0%) |
| Computers & Mathematics | 24 (88.9%) | 3 (11.1%) |
| Architecture & Engineering | 16 (100.0%) | 0 (0.0%) |
| Life, Physical & Social Science | 0 (0.0%) | 0 (0.0%) |
| Community & Social Service | 12 (100.0%) | 0 (0.0%) |
| Education, Arts & Media | 0 (0.0%) | 0 (0.0%) |
| Legal Services & Support | 12 (100.0%) | 0 (0.0%) |
| Education Instruction & Library | 0 (0.0%) | 0 (0.0%) |
| Arts, Media & Entertainment | 0 (0.0%) | 0 (0.0%) |
| Health Diagnosing & Treating | 0 (0.0%) | 101 (100.0%) |
| Health Technologists | 0 (0.0%) | 12 (100.0%) |
| Total (Category) | 84 (37.8%) | 138 (62.2%) |
| Total (Overall) | 544 (61.1%) | 347 (39.0%) |
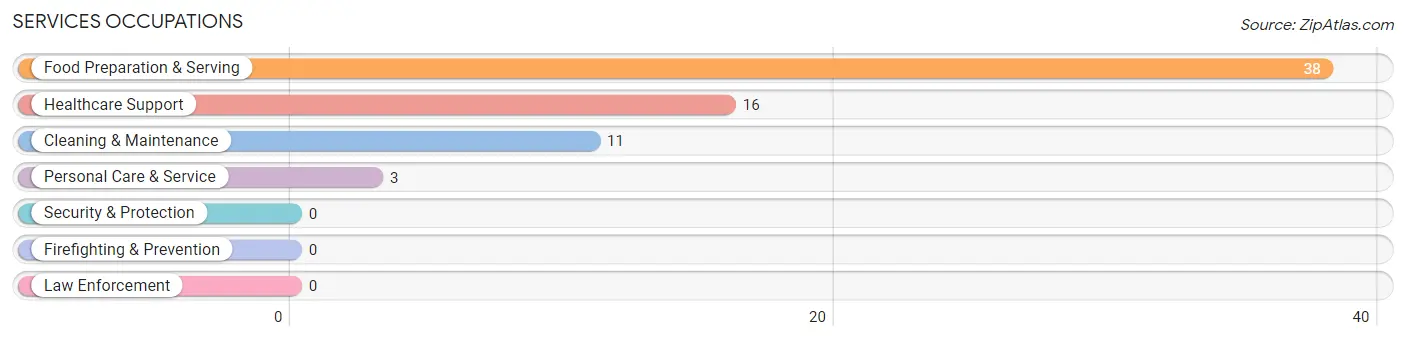
Services Occupations
The most common Services occupations in Harlan are Food Preparation & Serving (38 | 4.3%), Healthcare Support (16 | 1.8%), Cleaning & Maintenance (11 | 1.2%), and Personal Care & Service (3 | 0.3%).
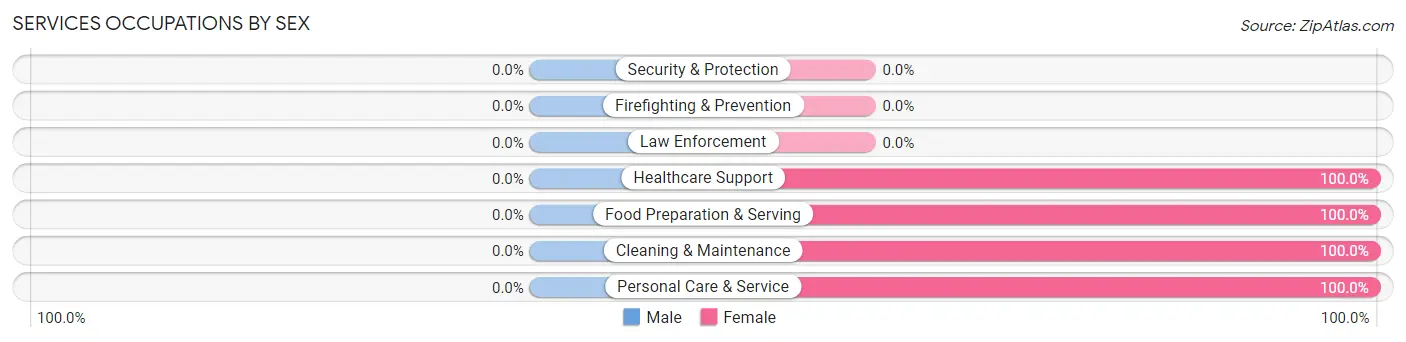
Services Occupations by Sex
| Occupation | Male | Female |
| Healthcare Support | 0 (0.0%) | 16 (100.0%) |
| Security & Protection | 0 (0.0%) | 0 (0.0%) |
| Firefighting & Prevention | 0 (0.0%) | 0 (0.0%) |
| Law Enforcement | 0 (0.0%) | 0 (0.0%) |
| Food Preparation & Serving | 0 (0.0%) | 38 (100.0%) |
| Cleaning & Maintenance | 0 (0.0%) | 11 (100.0%) |
| Personal Care & Service | 0 (0.0%) | 3 (100.0%) |
| Total (Category) | 0 (0.0%) | 68 (100.0%) |
| Total (Overall) | 544 (61.1%) | 347 (39.0%) |
Sales and Office Occupations
The most common Sales and Office occupations in Harlan are Office & Administration (133 | 14.9%), and Sales & Related (20 | 2.2%).
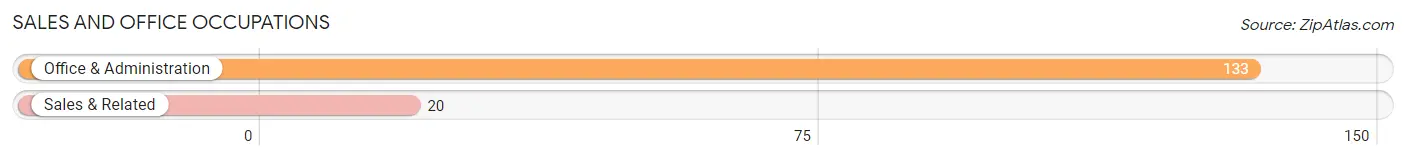
Sales and Office Occupations by Sex
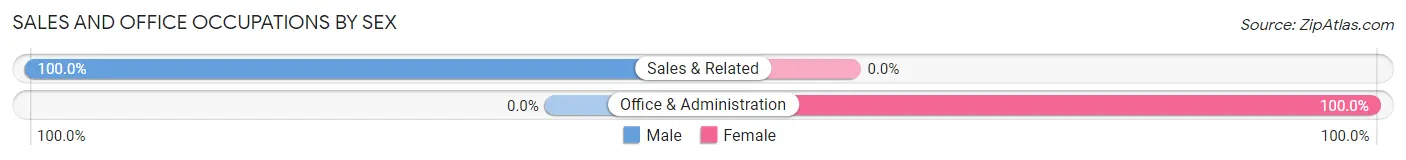
| Occupation | Male | Female |
| Sales & Related | 20 (100.0%) | 0 (0.0%) |
| Office & Administration | 0 (0.0%) | 133 (100.0%) |
| Total (Category) | 20 (13.1%) | 133 (86.9%) |
| Total (Overall) | 544 (61.1%) | 347 (39.0%) |
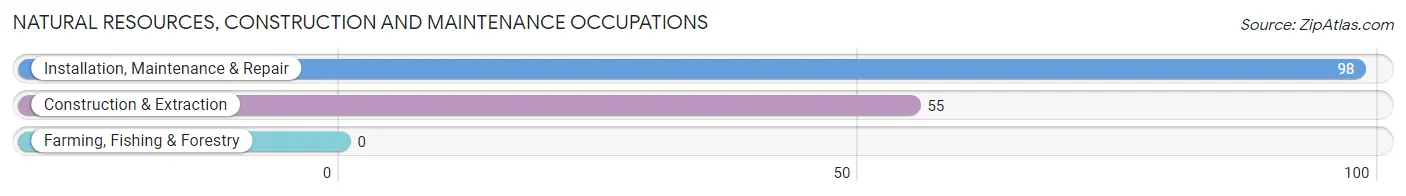
Natural Resources, Construction and Maintenance Occupations
The most common Natural Resources, Construction and Maintenance occupations in Harlan are Installation, Maintenance & Repair (98 | 11.0%), and Construction & Extraction (55 | 6.2%).
Natural Resources, Construction and Maintenance Occupations by Sex
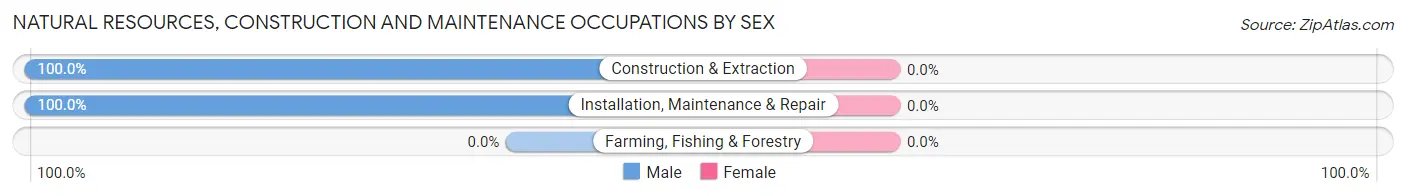
| Occupation | Male | Female |
| Farming, Fishing & Forestry | 0 (0.0%) | 0 (0.0%) |
| Construction & Extraction | 55 (100.0%) | 0 (0.0%) |
| Installation, Maintenance & Repair | 98 (100.0%) | 0 (0.0%) |
| Total (Category) | 153 (100.0%) | 0 (0.0%) |
| Total (Overall) | 544 (61.1%) | 347 (39.0%) |
Production, Transportation and Moving Occupations
The most common Production, Transportation and Moving occupations in Harlan are Transportation (134 | 15.0%), Production (121 | 13.6%), and Material Moving (40 | 4.5%).
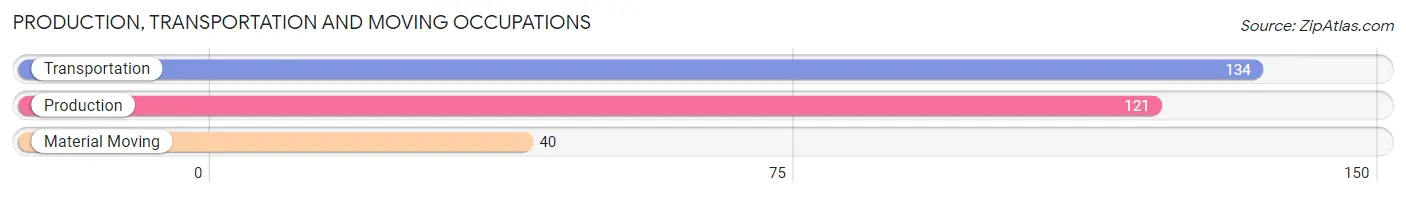
Production, Transportation and Moving Occupations by Sex
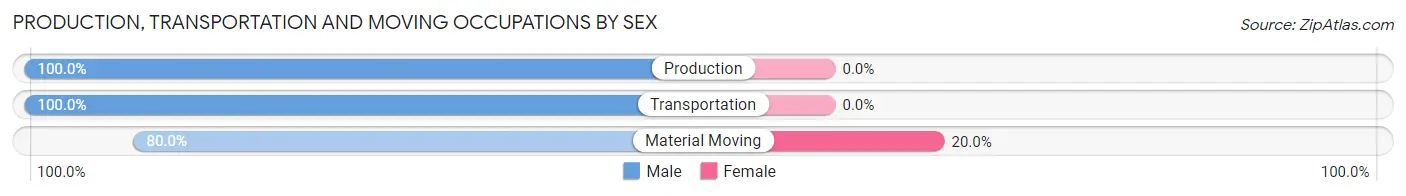
| Occupation | Male | Female |
| Production | 121 (100.0%) | 0 (0.0%) |
| Transportation | 134 (100.0%) | 0 (0.0%) |
| Material Moving | 32 (80.0%) | 8 (20.0%) |
| Total (Category) | 287 (97.3%) | 8 (2.7%) |
| Total (Overall) | 544 (61.1%) | 347 (39.0%) |
Employment Industries by Sex in Harlan
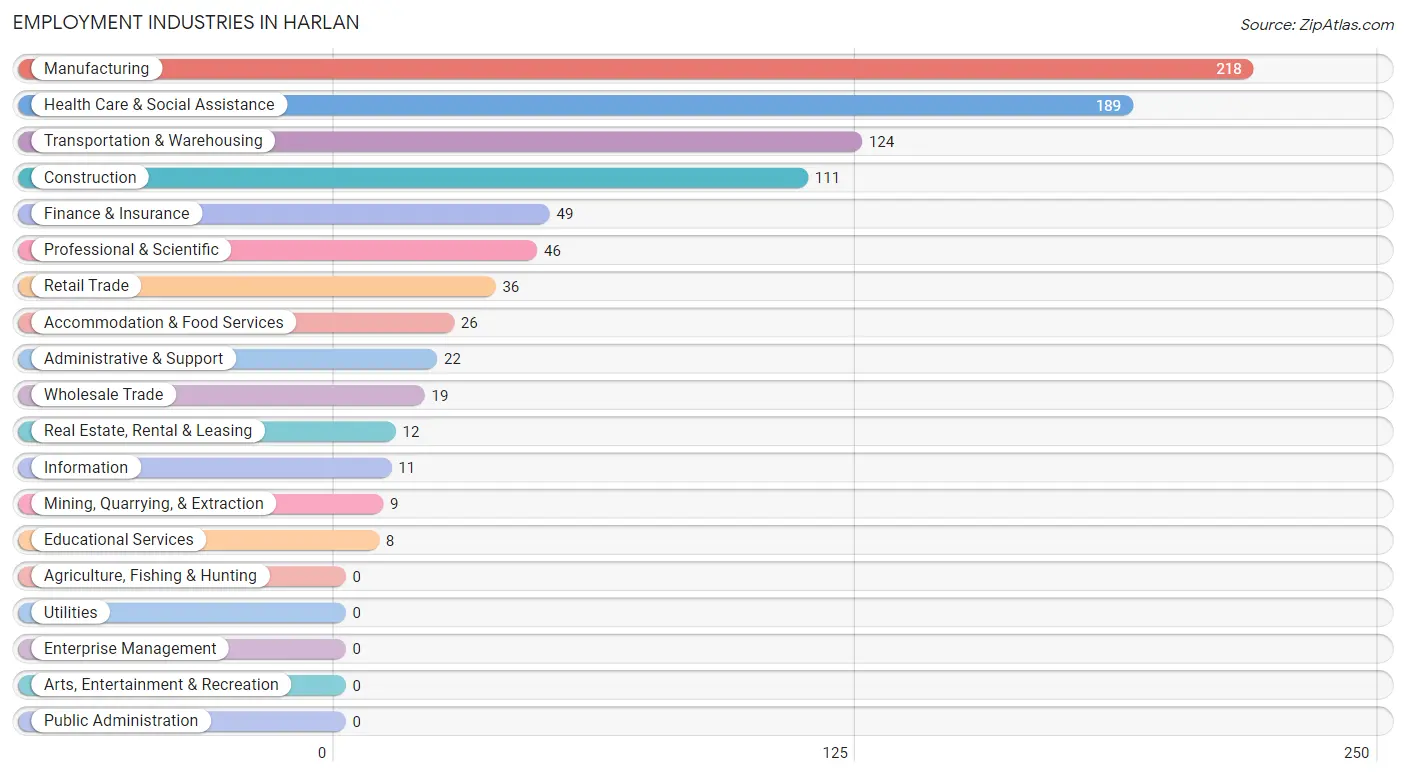
Employment Industries in Harlan
The major employment industries in Harlan include Manufacturing (218 | 24.5%), Health Care & Social Assistance (189 | 21.2%), Transportation & Warehousing (124 | 13.9%), Construction (111 | 12.5%), and Finance & Insurance (49 | 5.5%).
Employment Industries by Sex in Harlan
The Harlan industries that see more men than women are Mining, Quarrying, & Extraction (100.0%), Wholesale Trade (100.0%), and Transportation & Warehousing (100.0%), whereas the industries that tend to have a higher number of women are Information (100.0%), Educational Services (100.0%), and Health Care & Social Assistance (100.0%).
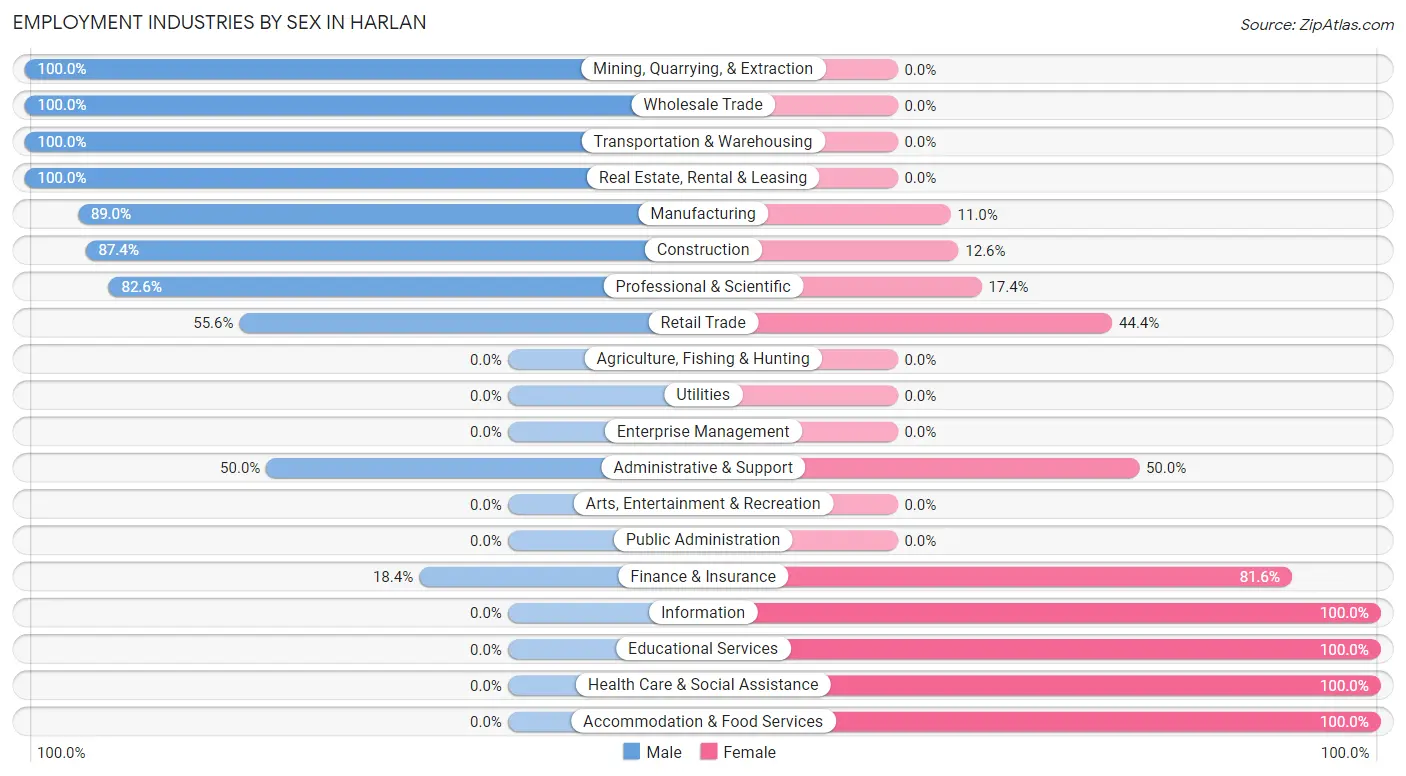
| Industry | Male | Female |
| Agriculture, Fishing & Hunting | 0 (0.0%) | 0 (0.0%) |
| Mining, Quarrying, & Extraction | 9 (100.0%) | 0 (0.0%) |
| Construction | 97 (87.4%) | 14 (12.6%) |
| Manufacturing | 194 (89.0%) | 24 (11.0%) |
| Wholesale Trade | 19 (100.0%) | 0 (0.0%) |
| Retail Trade | 20 (55.6%) | 16 (44.4%) |
| Transportation & Warehousing | 124 (100.0%) | 0 (0.0%) |
| Utilities | 0 (0.0%) | 0 (0.0%) |
| Information | 0 (0.0%) | 11 (100.0%) |
| Finance & Insurance | 9 (18.4%) | 40 (81.6%) |
| Real Estate, Rental & Leasing | 12 (100.0%) | 0 (0.0%) |
| Professional & Scientific | 38 (82.6%) | 8 (17.4%) |
| Enterprise Management | 0 (0.0%) | 0 (0.0%) |
| Administrative & Support | 11 (50.0%) | 11 (50.0%) |
| Educational Services | 0 (0.0%) | 8 (100.0%) |
| Health Care & Social Assistance | 0 (0.0%) | 189 (100.0%) |
| Arts, Entertainment & Recreation | 0 (0.0%) | 0 (0.0%) |
| Accommodation & Food Services | 0 (0.0%) | 26 (100.0%) |
| Public Administration | 0 (0.0%) | 0 (0.0%) |
| Total | 544 (61.1%) | 347 (39.0%) |
Education in Harlan
School Enrollment in Harlan
The most common levels of schooling among the 257 students in Harlan are high school (61 | 23.7%), elementary school (56 | 21.8%), and middle school (56 | 21.8%).
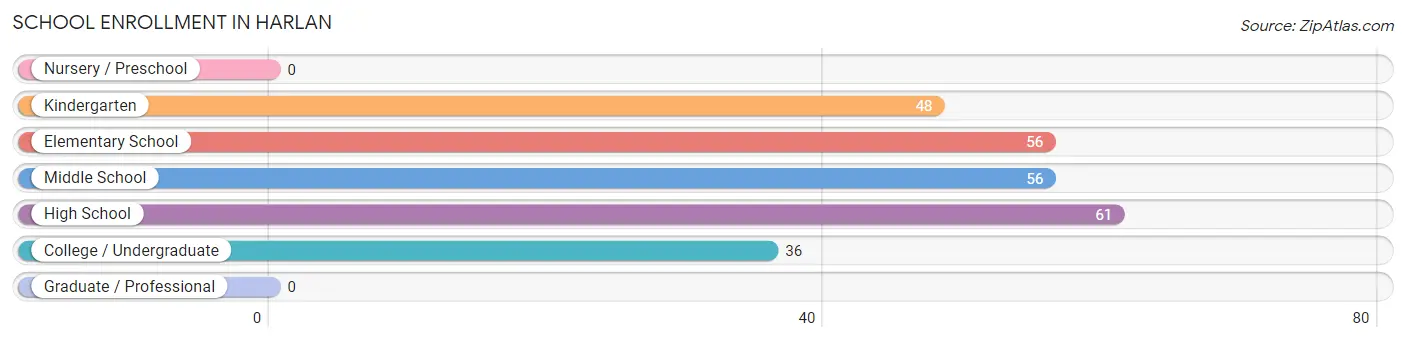
| School Level | # Students | % Students |
| Nursery / Preschool | 0 | 0.0% |
| Kindergarten | 48 | 18.7% |
| Elementary School | 56 | 21.8% |
| Middle School | 56 | 21.8% |
| High School | 61 | 23.7% |
| College / Undergraduate | 36 | 14.0% |
| Graduate / Professional | 0 | 0.0% |
| Total | 257 | 100.0% |
School Enrollment by Age by Funding Source in Harlan
Out of a total of 257 students who are enrolled in schools in Harlan, 40 (15.6%) attend a private institution, while the remaining 217 (84.4%) are enrolled in public schools. The age group of 35 years and over has the highest likelihood of being enrolled in private schools, with 12 (100.0% in the age bracket) enrolled. Conversely, the age group of 5 to 9 year old has the lowest likelihood of being enrolled in a private school, with 82 (100.0% in the age bracket) attending a public institution.
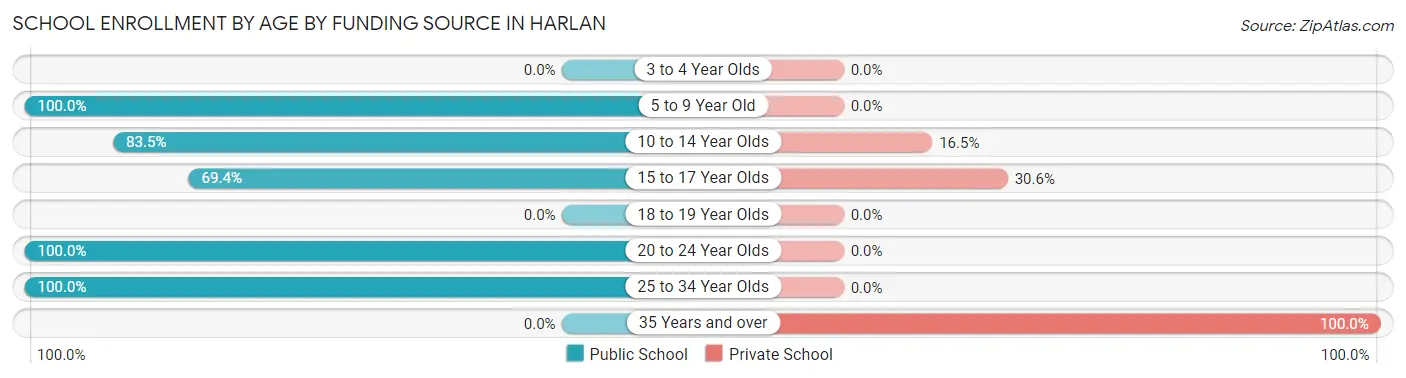
| Age Bracket | Public School | Private School |
| 3 to 4 Year Olds | 0 (0.0%) | 0 (0.0%) |
| 5 to 9 Year Old | 82 (100.0%) | 0 (0.0%) |
| 10 to 14 Year Olds | 86 (83.5%) | 17 (16.5%) |
| 15 to 17 Year Olds | 25 (69.4%) | 11 (30.6%) |
| 18 to 19 Year Olds | 0 (0.0%) | 0 (0.0%) |
| 20 to 24 Year Olds | 13 (100.0%) | 0 (0.0%) |
| 25 to 34 Year Olds | 11 (100.0%) | 0 (0.0%) |
| 35 Years and over | 0 (0.0%) | 12 (100.0%) |
| Total | 217 (84.4%) | 40 (15.6%) |
Educational Attainment by Field of Study in Harlan
Education (45 | 27.6%), business (30 | 18.4%), liberal arts & history (20 | 12.3%), science & technology (19 | 11.7%), and social sciences (16 | 9.8%) are the most common fields of study among 163 individuals in Harlan who have obtained a bachelor's degree or higher.
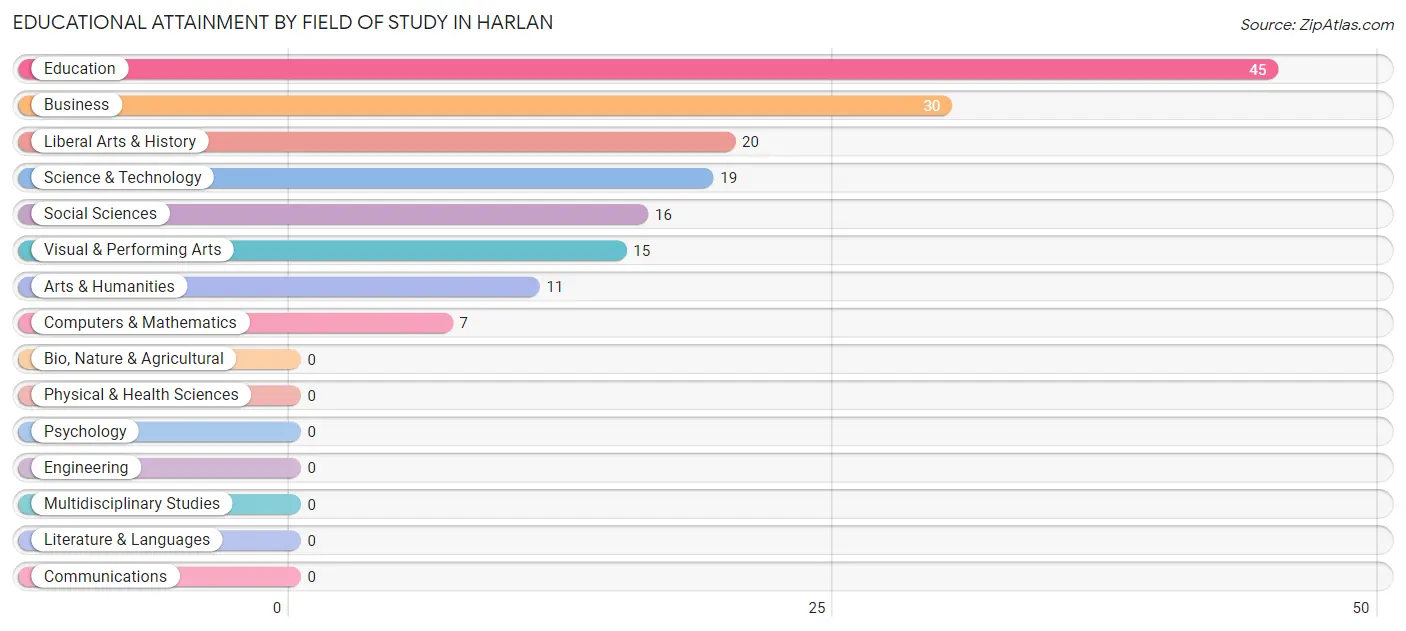
| Field of Study | # Graduates | % Graduates |
| Computers & Mathematics | 7 | 4.3% |
| Bio, Nature & Agricultural | 0 | 0.0% |
| Physical & Health Sciences | 0 | 0.0% |
| Psychology | 0 | 0.0% |
| Social Sciences | 16 | 9.8% |
| Engineering | 0 | 0.0% |
| Multidisciplinary Studies | 0 | 0.0% |
| Science & Technology | 19 | 11.7% |
| Business | 30 | 18.4% |
| Education | 45 | 27.6% |
| Literature & Languages | 0 | 0.0% |
| Liberal Arts & History | 20 | 12.3% |
| Visual & Performing Arts | 15 | 9.2% |
| Communications | 0 | 0.0% |
| Arts & Humanities | 11 | 6.8% |
| Total | 163 | 100.0% |
Transportation & Commute in Harlan
Vehicle Availability by Sex in Harlan
The most prevalent vehicle ownership categories in Harlan are males with 3 vehicles (231, accounting for 42.5%) and females with 3 vehicles (80, making up 66.6%).
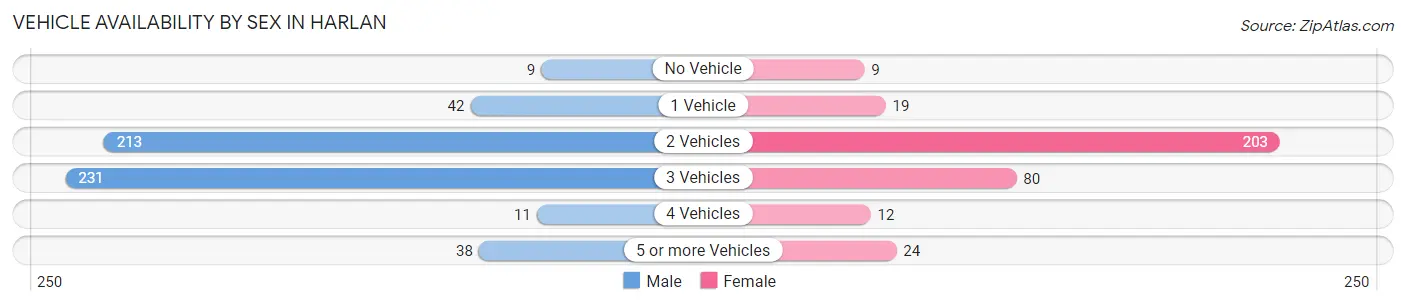
| Vehicles Available | Male | Female |
| No Vehicle | 9 (1.7%) | 9 (2.6%) |
| 1 Vehicle | 42 (7.7%) | 19 (5.5%) |
| 2 Vehicles | 213 (39.2%) | 203 (58.5%) |
| 3 Vehicles | 231 (42.5%) | 80 (23.1%) |
| 4 Vehicles | 11 (2.0%) | 12 (3.5%) |
| 5 or more Vehicles | 38 (7.0%) | 24 (6.9%) |
| Total | 544 (100.0%) | 347 (100.0%) |
Commute Time in Harlan
The most frequently occuring commute durations in Harlan are 30 to 34 minutes (152 commuters, 19.8%), 40 to 44 minutes (141 commuters, 18.3%), and 15 to 19 minutes (104 commuters, 13.5%).
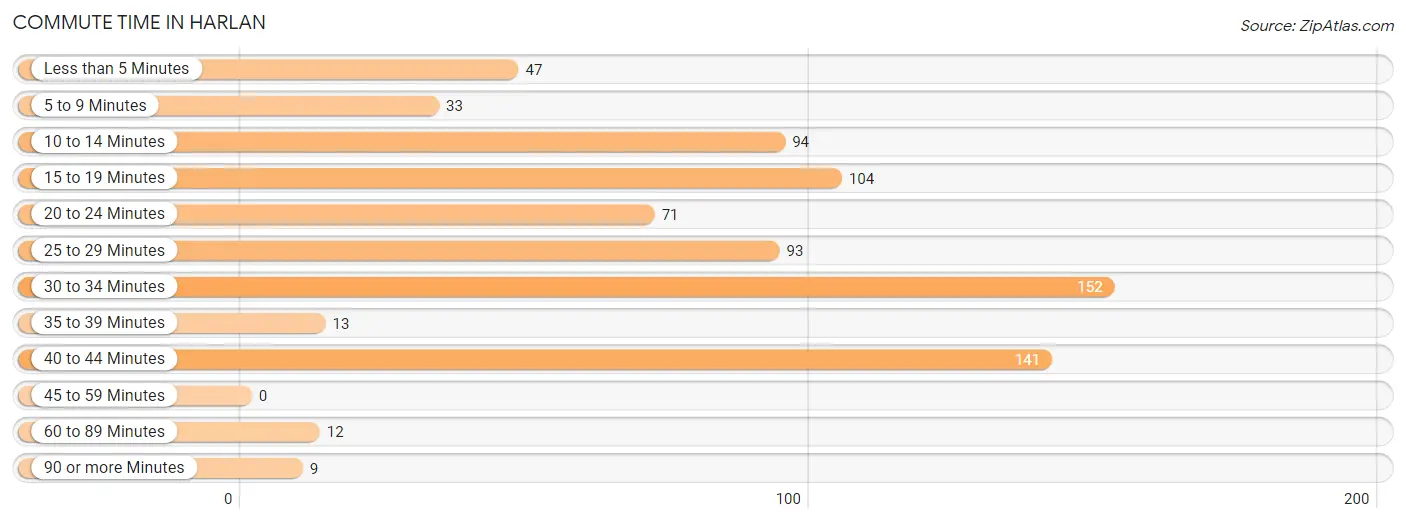
| Commute Time | # Commuters | % Commuters |
| Less than 5 Minutes | 47 | 6.1% |
| 5 to 9 Minutes | 33 | 4.3% |
| 10 to 14 Minutes | 94 | 12.2% |
| 15 to 19 Minutes | 104 | 13.5% |
| 20 to 24 Minutes | 71 | 9.2% |
| 25 to 29 Minutes | 93 | 12.1% |
| 30 to 34 Minutes | 152 | 19.8% |
| 35 to 39 Minutes | 13 | 1.7% |
| 40 to 44 Minutes | 141 | 18.3% |
| 45 to 59 Minutes | 0 | 0.0% |
| 60 to 89 Minutes | 12 | 1.6% |
| 90 or more Minutes | 9 | 1.2% |
Commute Time by Sex in Harlan
The most common commute times in Harlan are 40 to 44 minutes (141 commuters, 30.6%) for males and 30 to 34 minutes (90 commuters, 29.2%) for females.
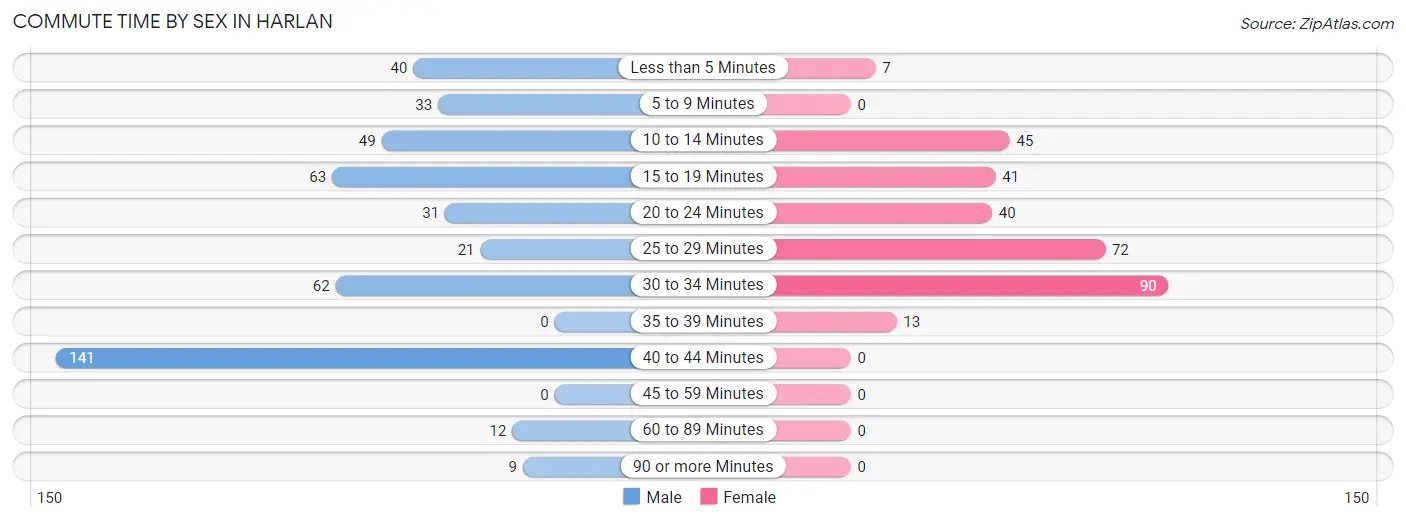
| Commute Time | Male | Female |
| Less than 5 Minutes | 40 (8.7%) | 7 (2.3%) |
| 5 to 9 Minutes | 33 (7.2%) | 0 (0.0%) |
| 10 to 14 Minutes | 49 (10.6%) | 45 (14.6%) |
| 15 to 19 Minutes | 63 (13.7%) | 41 (13.3%) |
| 20 to 24 Minutes | 31 (6.7%) | 40 (13.0%) |
| 25 to 29 Minutes | 21 (4.6%) | 72 (23.4%) |
| 30 to 34 Minutes | 62 (13.5%) | 90 (29.2%) |
| 35 to 39 Minutes | 0 (0.0%) | 13 (4.2%) |
| 40 to 44 Minutes | 141 (30.6%) | 0 (0.0%) |
| 45 to 59 Minutes | 0 (0.0%) | 0 (0.0%) |
| 60 to 89 Minutes | 12 (2.6%) | 0 (0.0%) |
| 90 or more Minutes | 9 (1.9%) | 0 (0.0%) |
Time of Departure to Work by Sex in Harlan
The most frequent times of departure to work in Harlan are 6:30 AM to 6:59 AM (172, 37.3%) for males and 6:30 AM to 6:59 AM (80, 26.0%) for females.
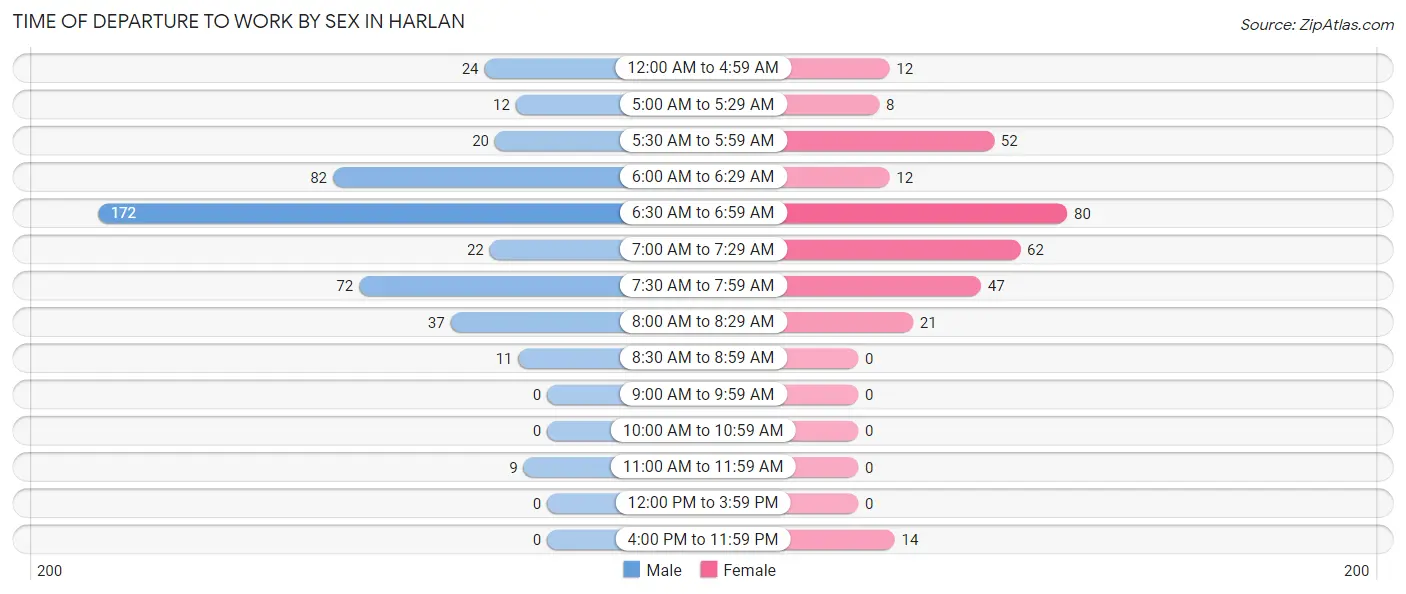
| Time of Departure | Male | Female |
| 12:00 AM to 4:59 AM | 24 (5.2%) | 12 (3.9%) |
| 5:00 AM to 5:29 AM | 12 (2.6%) | 8 (2.6%) |
| 5:30 AM to 5:59 AM | 20 (4.3%) | 52 (16.9%) |
| 6:00 AM to 6:29 AM | 82 (17.8%) | 12 (3.9%) |
| 6:30 AM to 6:59 AM | 172 (37.3%) | 80 (26.0%) |
| 7:00 AM to 7:29 AM | 22 (4.8%) | 62 (20.1%) |
| 7:30 AM to 7:59 AM | 72 (15.6%) | 47 (15.3%) |
| 8:00 AM to 8:29 AM | 37 (8.0%) | 21 (6.8%) |
| 8:30 AM to 8:59 AM | 11 (2.4%) | 0 (0.0%) |
| 9:00 AM to 9:59 AM | 0 (0.0%) | 0 (0.0%) |
| 10:00 AM to 10:59 AM | 0 (0.0%) | 0 (0.0%) |
| 11:00 AM to 11:59 AM | 9 (1.9%) | 0 (0.0%) |
| 12:00 PM to 3:59 PM | 0 (0.0%) | 0 (0.0%) |
| 4:00 PM to 11:59 PM | 0 (0.0%) | 14 (4.5%) |
| Total | 461 (100.0%) | 308 (100.0%) |
Housing Occupancy in Harlan
Occupancy by Ownership in Harlan
Of the total 662 dwellings in Harlan, owner-occupied units account for 553 (83.5%), while renter-occupied units make up 109 (16.5%).
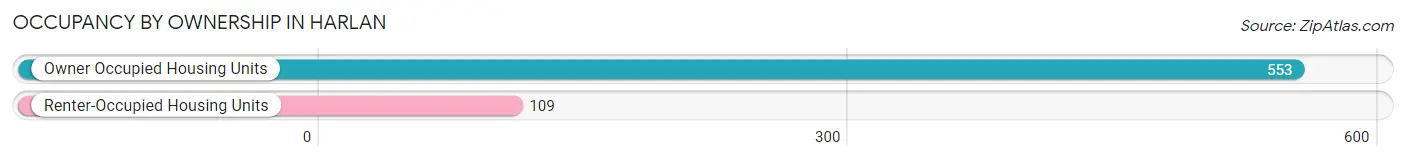
| Occupancy | # Housing Units | % Housing Units |
| Owner Occupied Housing Units | 553 | 83.5% |
| Renter-Occupied Housing Units | 109 | 16.5% |
| Total Occupied Housing Units | 662 | 100.0% |
Occupancy by Household Size in Harlan
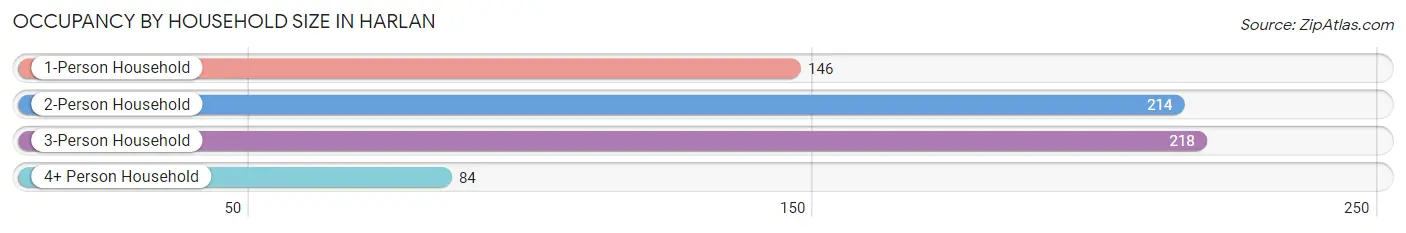
| Household Size | # Housing Units | % Housing Units |
| 1-Person Household | 146 | 22.1% |
| 2-Person Household | 214 | 32.3% |
| 3-Person Household | 218 | 32.9% |
| 4+ Person Household | 84 | 12.7% |
| Total Housing Units | 662 | 100.0% |
Occupancy by Ownership by Household Size in Harlan
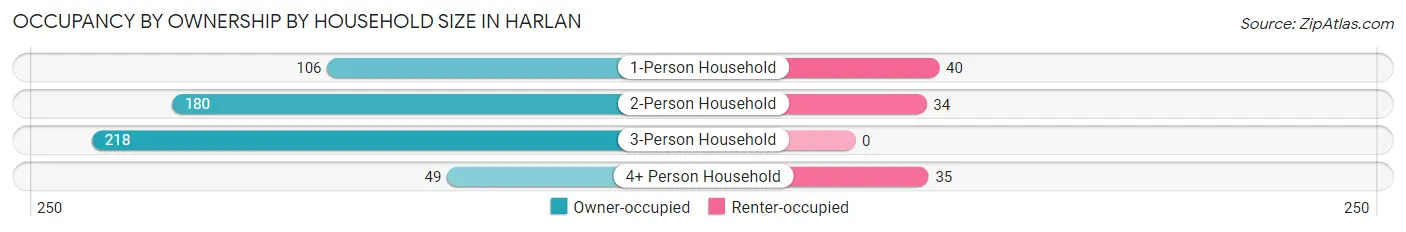
| Household Size | Owner-occupied | Renter-occupied |
| 1-Person Household | 106 (72.6%) | 40 (27.4%) |
| 2-Person Household | 180 (84.1%) | 34 (15.9%) |
| 3-Person Household | 218 (100.0%) | 0 (0.0%) |
| 4+ Person Household | 49 (58.3%) | 35 (41.7%) |
| Total Housing Units | 553 (83.5%) | 109 (16.5%) |
Occupancy by Educational Attainment in Harlan
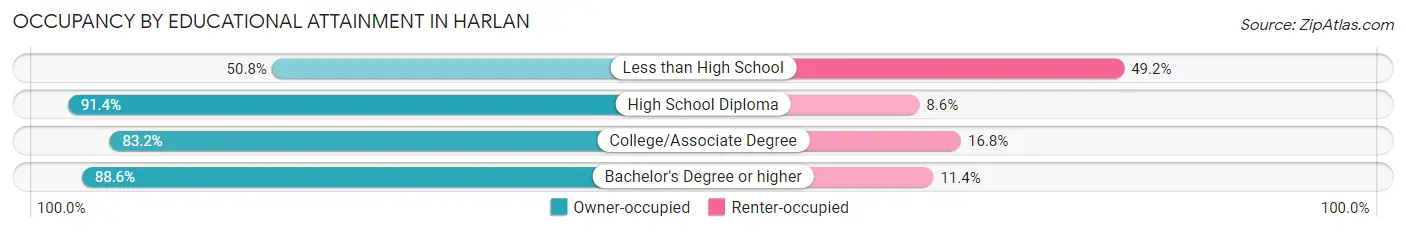
| Household Size | Owner-occupied | Renter-occupied |
| Less than High School | 31 (50.8%) | 30 (49.2%) |
| High School Diploma | 192 (91.4%) | 18 (8.6%) |
| College/Associate Degree | 252 (83.2%) | 51 (16.8%) |
| Bachelor's Degree or higher | 78 (88.6%) | 10 (11.4%) |
Occupancy by Age of Householder in Harlan
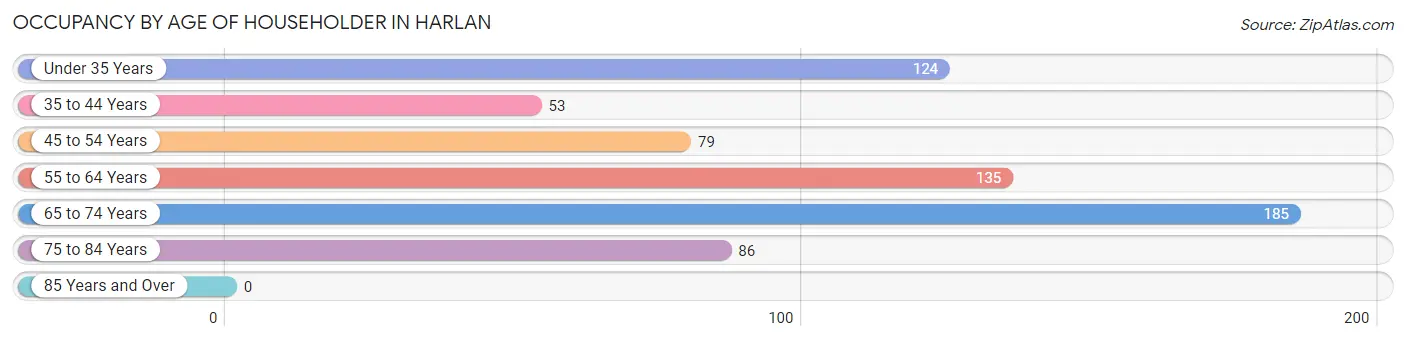
| Age Bracket | # Households | % Households |
| Under 35 Years | 124 | 18.7% |
| 35 to 44 Years | 53 | 8.0% |
| 45 to 54 Years | 79 | 11.9% |
| 55 to 64 Years | 135 | 20.4% |
| 65 to 74 Years | 185 | 28.0% |
| 75 to 84 Years | 86 | 13.0% |
| 85 Years and Over | 0 | 0.0% |
| Total | 662 | 100.0% |
Housing Finances in Harlan
Median Income by Occupancy in Harlan
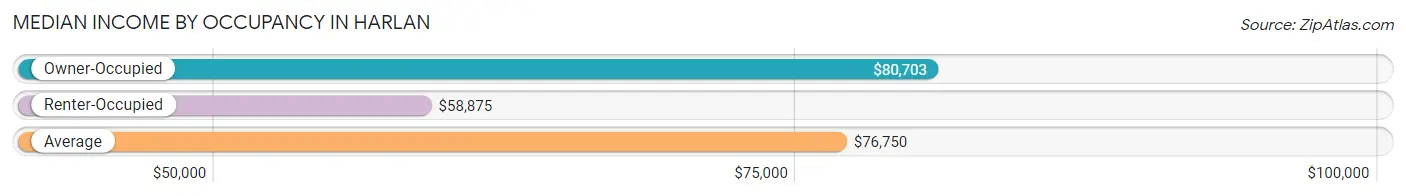
| Occupancy Type | # Households | Median Income |
| Owner-Occupied | 553 (83.5%) | $80,703 |
| Renter-Occupied | 109 (16.5%) | $58,875 |
| Average | 662 (100.0%) | $76,750 |
Occupancy by Householder Income Bracket in Harlan
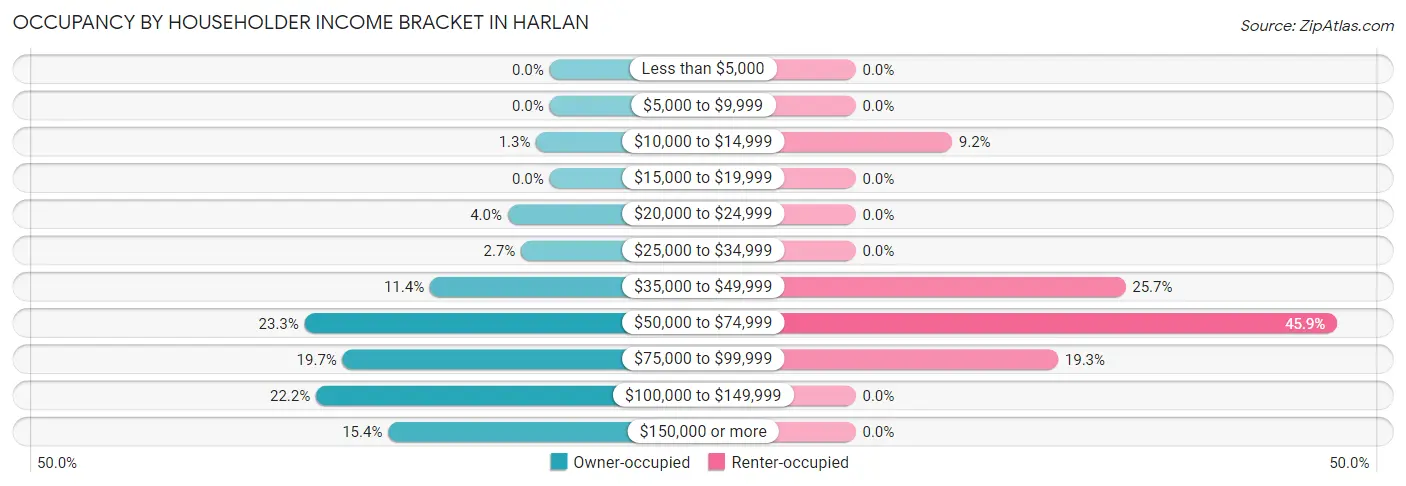
| Income Bracket | Owner-occupied | Renter-occupied |
| Less than $5,000 | 0 (0.0%) | 0 (0.0%) |
| $5,000 to $9,999 | 0 (0.0%) | 0 (0.0%) |
| $10,000 to $14,999 | 7 (1.3%) | 10 (9.2%) |
| $15,000 to $19,999 | 0 (0.0%) | 0 (0.0%) |
| $20,000 to $24,999 | 22 (4.0%) | 0 (0.0%) |
| $25,000 to $34,999 | 15 (2.7%) | 0 (0.0%) |
| $35,000 to $49,999 | 63 (11.4%) | 28 (25.7%) |
| $50,000 to $74,999 | 129 (23.3%) | 50 (45.9%) |
| $75,000 to $99,999 | 109 (19.7%) | 21 (19.3%) |
| $100,000 to $149,999 | 123 (22.2%) | 0 (0.0%) |
| $150,000 or more | 85 (15.4%) | 0 (0.0%) |
| Total | 553 (100.0%) | 109 (100.0%) |
Monthly Housing Cost Tiers in Harlan
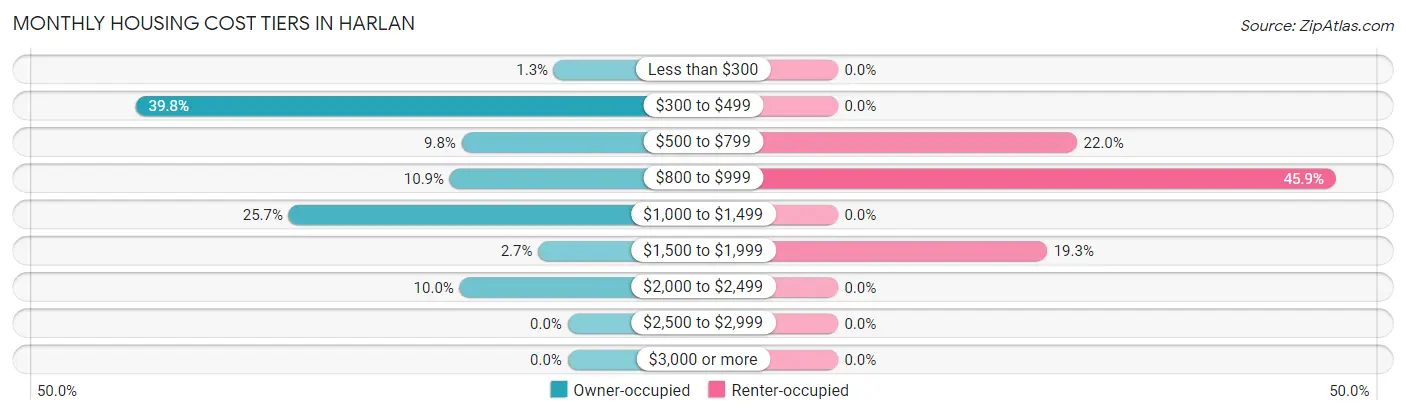
| Monthly Cost | Owner-occupied | Renter-occupied |
| Less than $300 | 7 (1.3%) | 0 (0.0%) |
| $300 to $499 | 220 (39.8%) | 0 (0.0%) |
| $500 to $799 | 54 (9.8%) | 24 (22.0%) |
| $800 to $999 | 60 (10.8%) | 50 (45.9%) |
| $1,000 to $1,499 | 142 (25.7%) | 0 (0.0%) |
| $1,500 to $1,999 | 15 (2.7%) | 21 (19.3%) |
| $2,000 to $2,499 | 55 (10.0%) | 0 (0.0%) |
| $2,500 to $2,999 | 0 (0.0%) | 0 (0.0%) |
| $3,000 or more | 0 (0.0%) | 0 (0.0%) |
| Total | 553 (100.0%) | 109 (100.0%) |
Physical Housing Characteristics in Harlan
Housing Structures in Harlan
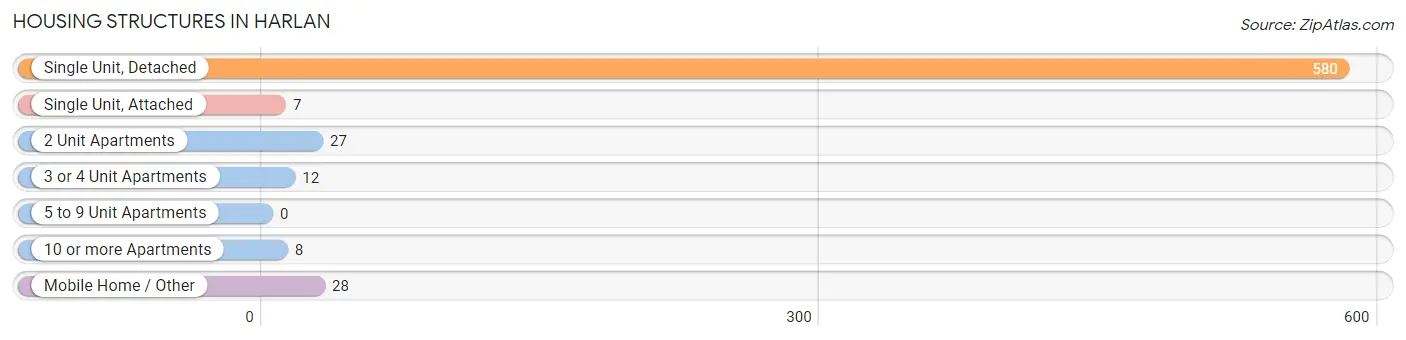
| Structure Type | # Housing Units | % Housing Units |
| Single Unit, Detached | 580 | 87.6% |
| Single Unit, Attached | 7 | 1.1% |
| 2 Unit Apartments | 27 | 4.1% |
| 3 or 4 Unit Apartments | 12 | 1.8% |
| 5 to 9 Unit Apartments | 0 | 0.0% |
| 10 or more Apartments | 8 | 1.2% |
| Mobile Home / Other | 28 | 4.2% |
| Total | 662 | 100.0% |
Housing Structures by Occupancy in Harlan
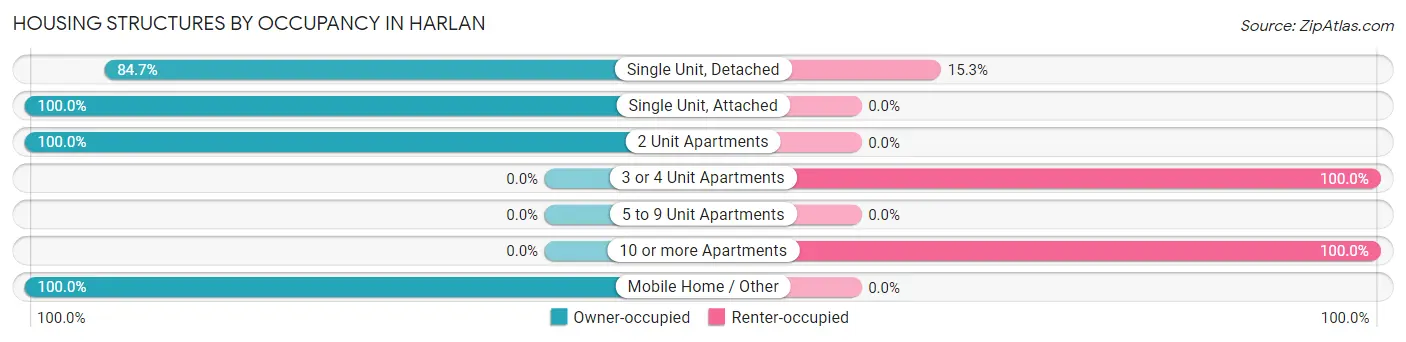
| Structure Type | Owner-occupied | Renter-occupied |
| Single Unit, Detached | 491 (84.7%) | 89 (15.3%) |
| Single Unit, Attached | 7 (100.0%) | 0 (0.0%) |
| 2 Unit Apartments | 27 (100.0%) | 0 (0.0%) |
| 3 or 4 Unit Apartments | 0 (0.0%) | 12 (100.0%) |
| 5 to 9 Unit Apartments | 0 (0.0%) | 0 (0.0%) |
| 10 or more Apartments | 0 (0.0%) | 8 (100.0%) |
| Mobile Home / Other | 28 (100.0%) | 0 (0.0%) |
| Total | 553 (83.5%) | 109 (16.5%) |
Housing Structures by Number of Rooms in Harlan
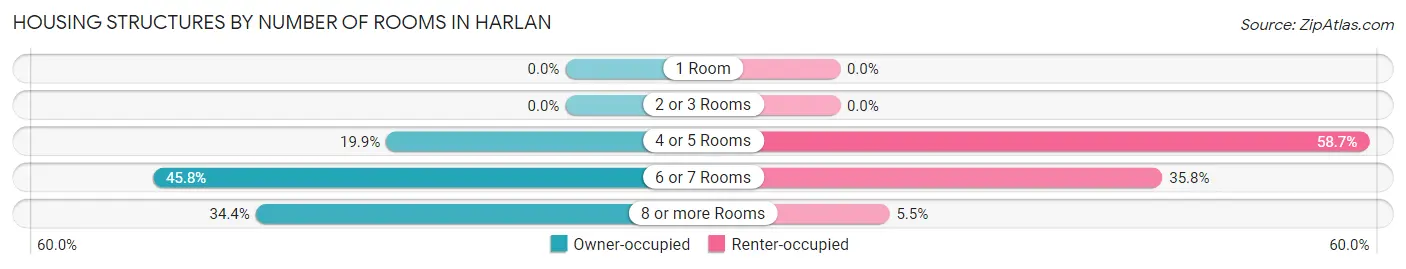
| Number of Rooms | Owner-occupied | Renter-occupied |
| 1 Room | 0 (0.0%) | 0 (0.0%) |
| 2 or 3 Rooms | 0 (0.0%) | 0 (0.0%) |
| 4 or 5 Rooms | 110 (19.9%) | 64 (58.7%) |
| 6 or 7 Rooms | 253 (45.8%) | 39 (35.8%) |
| 8 or more Rooms | 190 (34.4%) | 6 (5.5%) |
| Total | 553 (100.0%) | 109 (100.0%) |
Housing Structure by Heating Type in Harlan
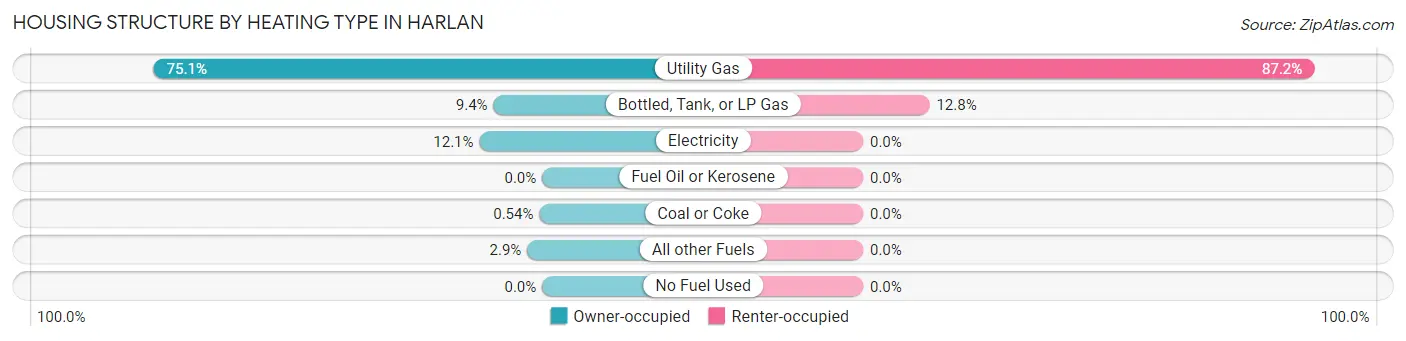
| Heating Type | Owner-occupied | Renter-occupied |
| Utility Gas | 415 (75.0%) | 95 (87.2%) |
| Bottled, Tank, or LP Gas | 52 (9.4%) | 14 (12.8%) |
| Electricity | 67 (12.1%) | 0 (0.0%) |
| Fuel Oil or Kerosene | 0 (0.0%) | 0 (0.0%) |
| Coal or Coke | 3 (0.5%) | 0 (0.0%) |
| All other Fuels | 16 (2.9%) | 0 (0.0%) |
| No Fuel Used | 0 (0.0%) | 0 (0.0%) |
| Total | 553 (100.0%) | 109 (100.0%) |
Household Vehicle Usage in Harlan
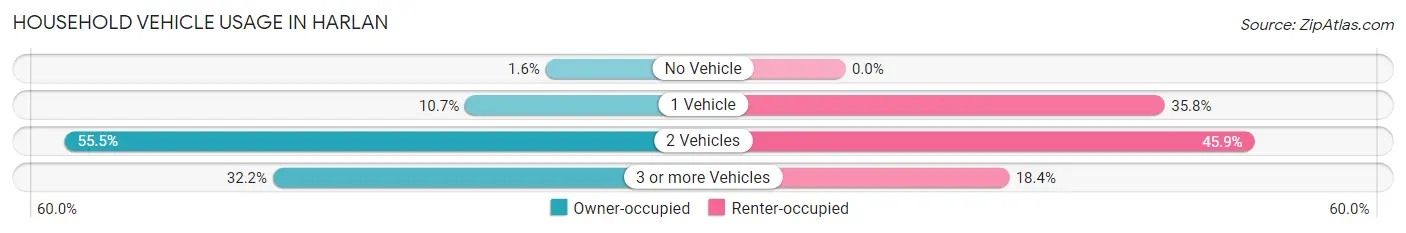
| Vehicles per Household | Owner-occupied | Renter-occupied |
| No Vehicle | 9 (1.6%) | 0 (0.0%) |
| 1 Vehicle | 59 (10.7%) | 39 (35.8%) |
| 2 Vehicles | 307 (55.5%) | 50 (45.9%) |
| 3 or more Vehicles | 178 (32.2%) | 20 (18.3%) |
| Total | 553 (100.0%) | 109 (100.0%) |
Real Estate & Mortgages in Harlan
Real Estate and Mortgage Overview in Harlan
| Characteristic | Without Mortgage | With Mortgage |
| Housing Units | 270 | 283 |
| Median Property Value | $164,700 | $158,600 |
| Median Household Income | $81,218 | $12 |
| Monthly Housing Costs | $377 | $0 |
| Real Estate Taxes | - | - |
Property Value by Mortgage Status in Harlan
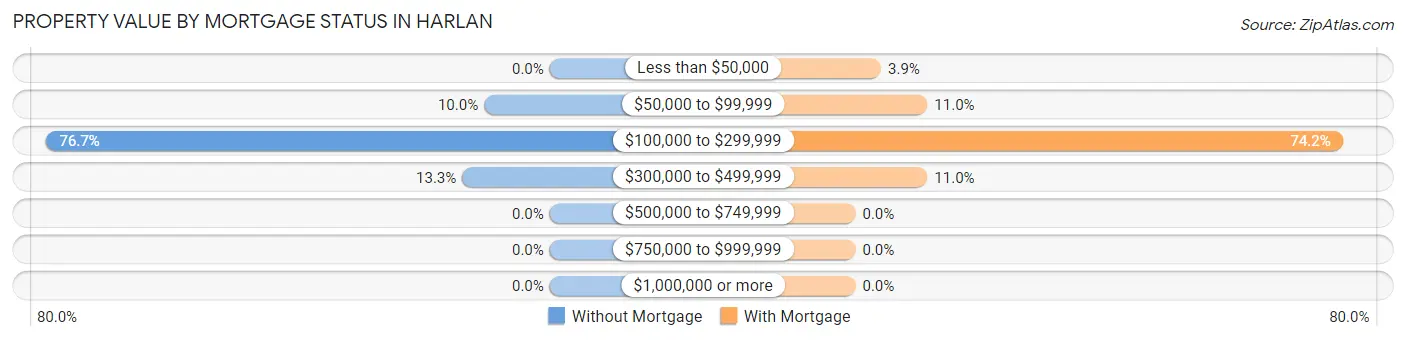
| Property Value | Without Mortgage | With Mortgage |
| Less than $50,000 | 0 (0.0%) | 11 (3.9%) |
| $50,000 to $99,999 | 27 (10.0%) | 31 (11.0%) |
| $100,000 to $299,999 | 207 (76.7%) | 210 (74.2%) |
| $300,000 to $499,999 | 36 (13.3%) | 31 (11.0%) |
| $500,000 to $749,999 | 0 (0.0%) | 0 (0.0%) |
| $750,000 to $999,999 | 0 (0.0%) | 0 (0.0%) |
| $1,000,000 or more | 0 (0.0%) | 0 (0.0%) |
| Total | 270 (100.0%) | 283 (100.0%) |
Household Income by Mortgage Status in Harlan
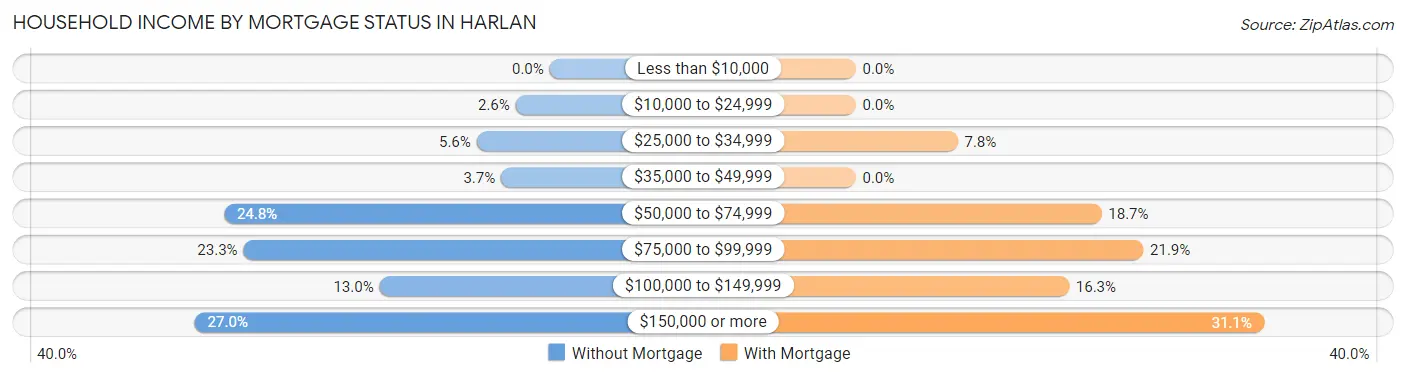
| Household Income | Without Mortgage | With Mortgage |
| Less than $10,000 | 0 (0.0%) | 0 (0.0%) |
| $10,000 to $24,999 | 7 (2.6%) | 0 (0.0%) |
| $25,000 to $34,999 | 15 (5.6%) | 22 (7.8%) |
| $35,000 to $49,999 | 10 (3.7%) | 0 (0.0%) |
| $50,000 to $74,999 | 67 (24.8%) | 53 (18.7%) |
| $75,000 to $99,999 | 63 (23.3%) | 62 (21.9%) |
| $100,000 to $149,999 | 35 (13.0%) | 46 (16.3%) |
| $150,000 or more | 73 (27.0%) | 88 (31.1%) |
| Total | 270 (100.0%) | 283 (100.0%) |
Property Value to Household Income Ratio in Harlan
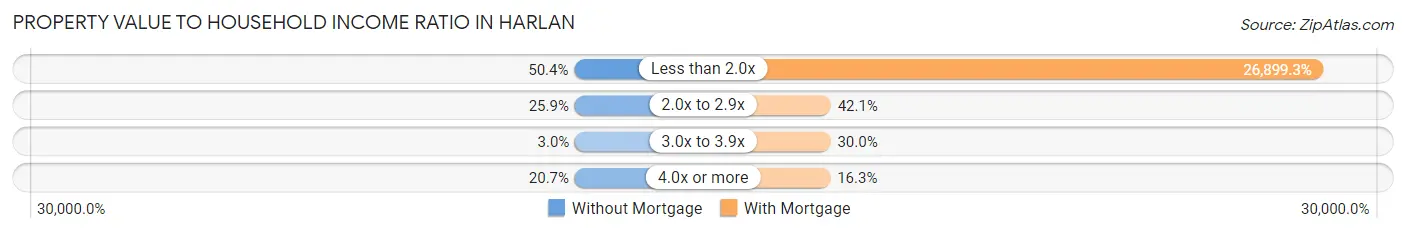
| Value-to-Income Ratio | Without Mortgage | With Mortgage |
| Less than 2.0x | 136 (50.4%) | 76,125 (26,899.3%) |
| 2.0x to 2.9x | 70 (25.9%) | 119 (42.0%) |
| 3.0x to 3.9x | 8 (3.0%) | 85 (30.0%) |
| 4.0x or more | 56 (20.7%) | 46 (16.3%) |
| Total | 270 (100.0%) | 283 (100.0%) |
Real Estate Taxes by Mortgage Status in Harlan
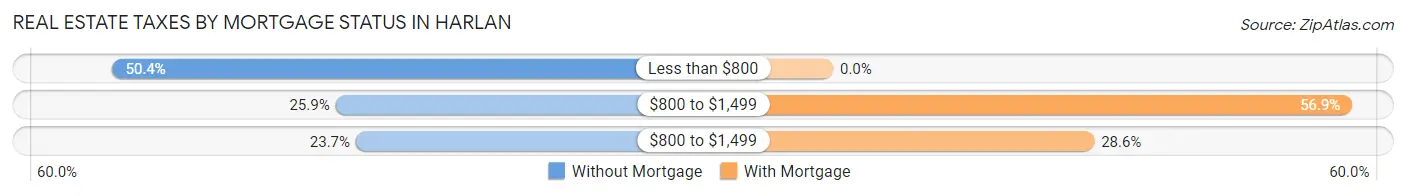
| Property Taxes | Without Mortgage | With Mortgage |
| Less than $800 | 136 (50.4%) | 0 (0.0%) |
| $800 to $1,499 | 70 (25.9%) | 161 (56.9%) |
| $800 to $1,499 | 64 (23.7%) | 81 (28.6%) |
| Total | 270 (100.0%) | 283 (100.0%) |
Health & Disability in Harlan
Health Insurance Coverage by Age in Harlan
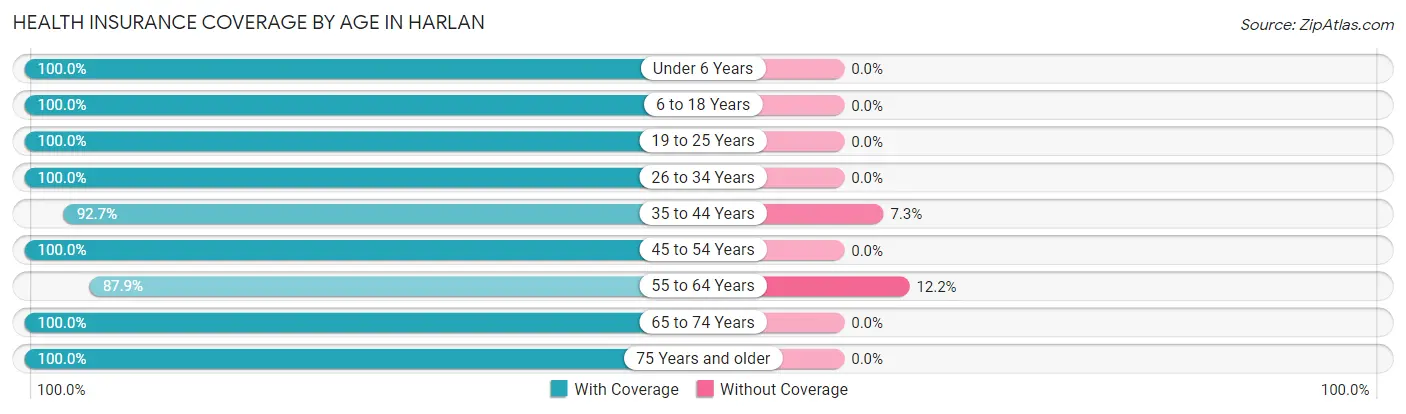
| Age Bracket | With Coverage | Without Coverage |
| Under 6 Years | 75 (100.0%) | 0 (0.0%) |
| 6 to 18 Years | 204 (100.0%) | 0 (0.0%) |
| 19 to 25 Years | 99 (100.0%) | 0 (0.0%) |
| 26 to 34 Years | 147 (100.0%) | 0 (0.0%) |
| 35 to 44 Years | 254 (92.7%) | 20 (7.3%) |
| 45 to 54 Years | 138 (100.0%) | 0 (0.0%) |
| 55 to 64 Years | 217 (87.8%) | 30 (12.1%) |
| 65 to 74 Years | 311 (100.0%) | 0 (0.0%) |
| 75 Years and older | 118 (100.0%) | 0 (0.0%) |
| Total | 1,563 (96.9%) | 50 (3.1%) |
Health Insurance Coverage by Citizenship Status in Harlan
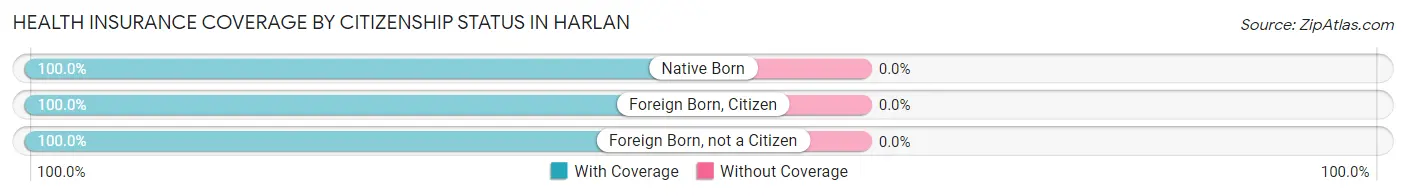
| Citizenship Status | With Coverage | Without Coverage |
| Native Born | 75 (100.0%) | 0 (0.0%) |
| Foreign Born, Citizen | 204 (100.0%) | 0 (0.0%) |
| Foreign Born, not a Citizen | 99 (100.0%) | 0 (0.0%) |
Health Insurance Coverage by Household Income in Harlan
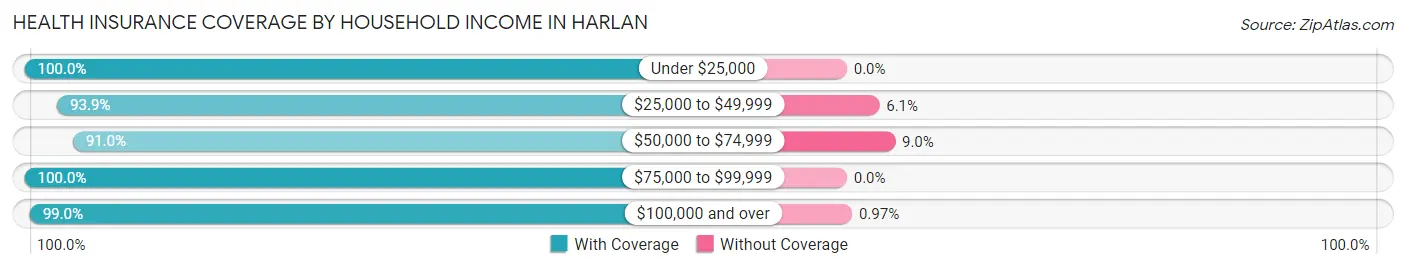
| Household Income | With Coverage | Without Coverage |
| Under $25,000 | 45 (100.0%) | 0 (0.0%) |
| $25,000 to $49,999 | 216 (93.9%) | 14 (6.1%) |
| $50,000 to $74,999 | 302 (91.0%) | 30 (9.0%) |
| $75,000 to $99,999 | 387 (100.0%) | 0 (0.0%) |
| $100,000 and over | 613 (99.0%) | 6 (1.0%) |
Public vs Private Health Insurance Coverage by Age in Harlan
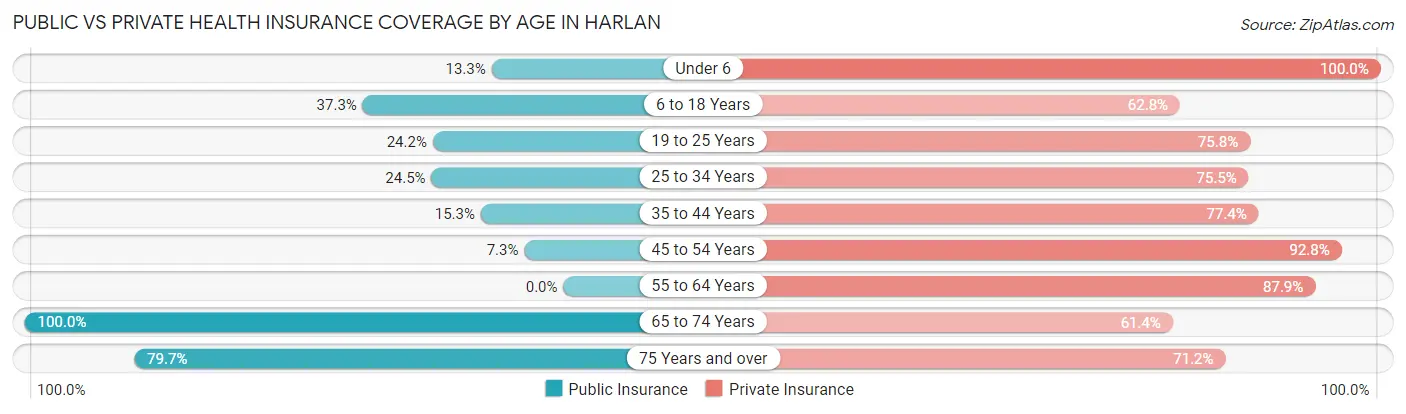
| Age Bracket | Public Insurance | Private Insurance |
| Under 6 | 10 (13.3%) | 75 (100.0%) |
| 6 to 18 Years | 76 (37.2%) | 128 (62.7%) |
| 19 to 25 Years | 24 (24.2%) | 75 (75.8%) |
| 25 to 34 Years | 36 (24.5%) | 111 (75.5%) |
| 35 to 44 Years | 42 (15.3%) | 212 (77.4%) |
| 45 to 54 Years | 10 (7.2%) | 128 (92.7%) |
| 55 to 64 Years | 0 (0.0%) | 217 (87.8%) |
| 65 to 74 Years | 311 (100.0%) | 191 (61.4%) |
| 75 Years and over | 94 (79.7%) | 84 (71.2%) |
| Total | 603 (37.4%) | 1,221 (75.7%) |
Disability Status by Sex by Age in Harlan
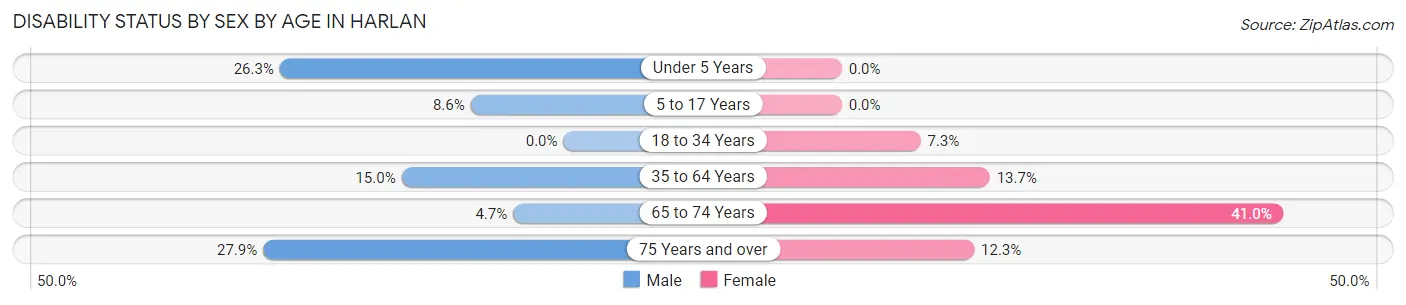
| Age Bracket | Male | Female |
| Under 5 Years | 10 (26.3%) | 0 (0.0%) |
| 5 to 17 Years | 13 (8.6%) | 0 (0.0%) |
| 18 to 34 Years | 0 (0.0%) | 10 (7.3%) |
| 35 to 64 Years | 64 (15.0%) | 32 (13.7%) |
| 65 to 74 Years | 7 (4.7%) | 66 (41.0%) |
| 75 Years and over | 17 (27.9%) | 7 (12.3%) |
Disability Class by Sex by Age in Harlan
Disability Class: Hearing Difficulty
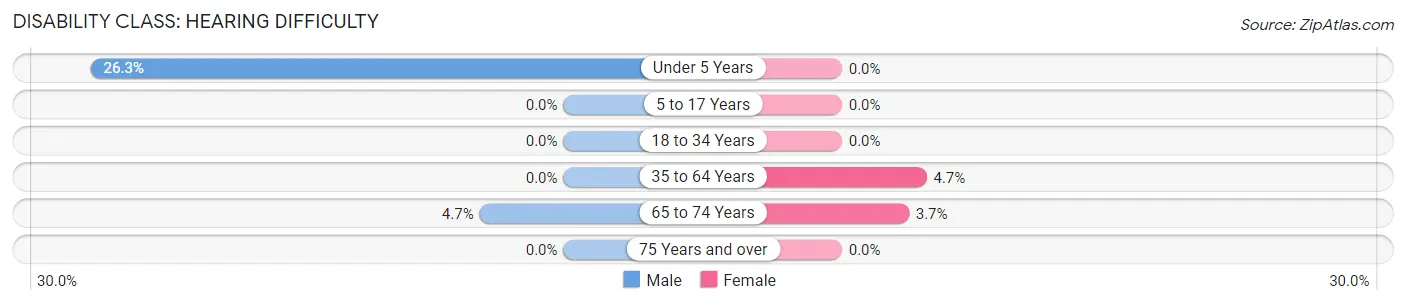
| Age Bracket | Male | Female |
| Under 5 Years | 10 (26.3%) | 0 (0.0%) |
| 5 to 17 Years | 0 (0.0%) | 0 (0.0%) |
| 18 to 34 Years | 0 (0.0%) | 0 (0.0%) |
| 35 to 64 Years | 0 (0.0%) | 11 (4.7%) |
| 65 to 74 Years | 7 (4.7%) | 6 (3.7%) |
| 75 Years and over | 0 (0.0%) | 0 (0.0%) |
Disability Class: Vision Difficulty
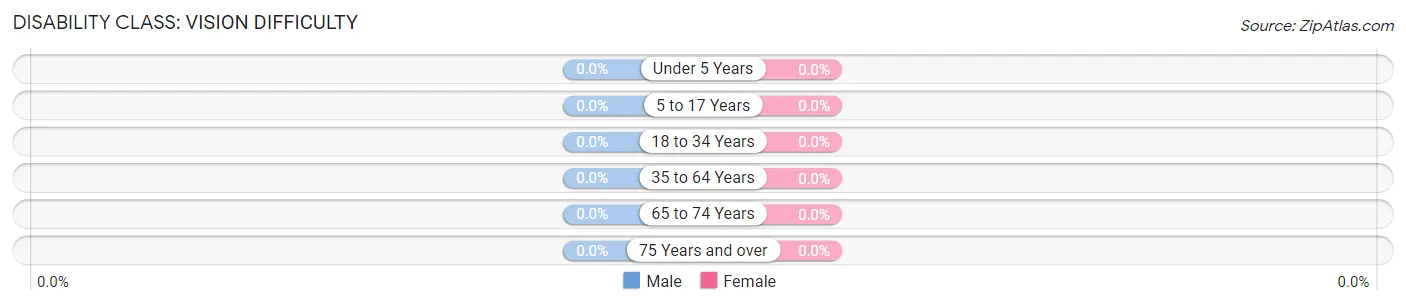
| Age Bracket | Male | Female |
| Under 5 Years | 0 (0.0%) | 0 (0.0%) |
| 5 to 17 Years | 0 (0.0%) | 0 (0.0%) |
| 18 to 34 Years | 0 (0.0%) | 0 (0.0%) |
| 35 to 64 Years | 0 (0.0%) | 0 (0.0%) |
| 65 to 74 Years | 0 (0.0%) | 0 (0.0%) |
| 75 Years and over | 0 (0.0%) | 0 (0.0%) |
Disability Class: Cognitive Difficulty
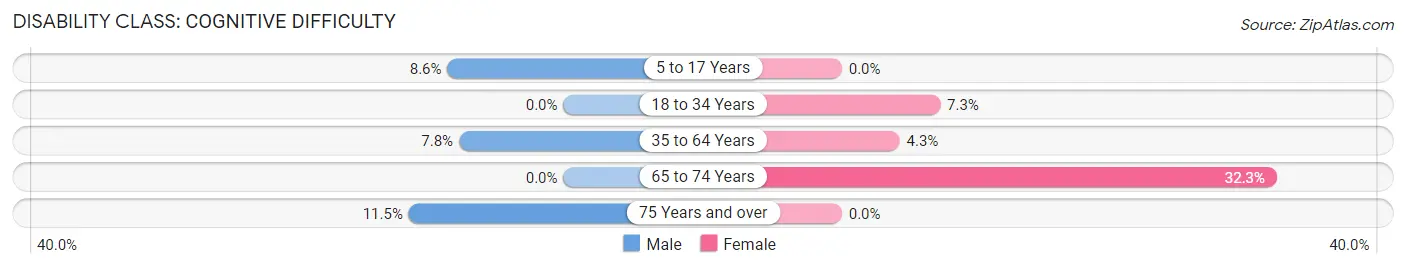
| Age Bracket | Male | Female |
| 5 to 17 Years | 13 (8.6%) | 0 (0.0%) |
| 18 to 34 Years | 0 (0.0%) | 10 (7.3%) |
| 35 to 64 Years | 33 (7.7%) | 10 (4.3%) |
| 65 to 74 Years | 0 (0.0%) | 52 (32.3%) |
| 75 Years and over | 7 (11.5%) | 0 (0.0%) |
Disability Class: Ambulatory Difficulty
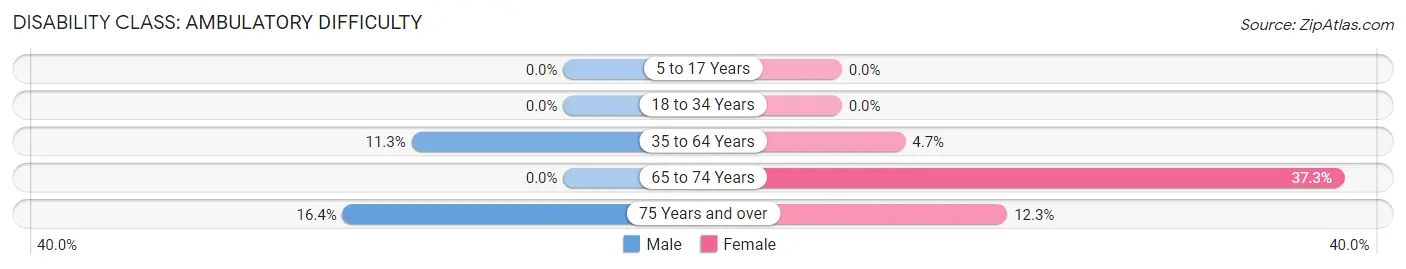
| Age Bracket | Male | Female |
| 5 to 17 Years | 0 (0.0%) | 0 (0.0%) |
| 18 to 34 Years | 0 (0.0%) | 0 (0.0%) |
| 35 to 64 Years | 48 (11.3%) | 11 (4.7%) |
| 65 to 74 Years | 0 (0.0%) | 60 (37.3%) |
| 75 Years and over | 10 (16.4%) | 7 (12.3%) |
Disability Class: Self-Care Difficulty
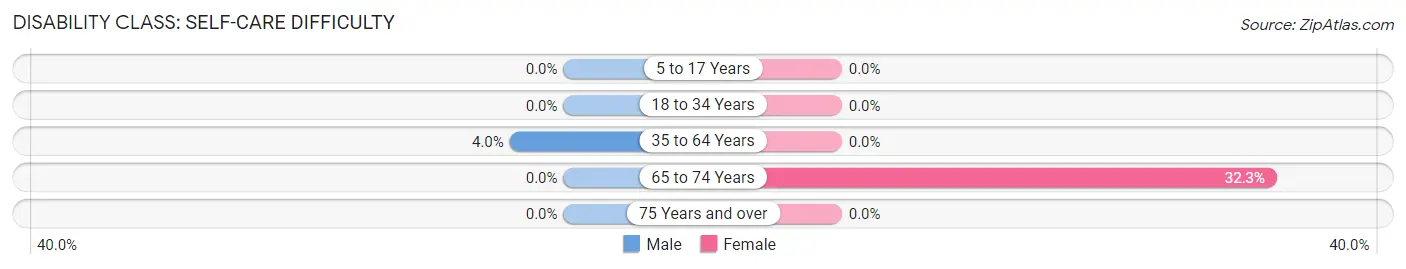
| Age Bracket | Male | Female |
| 5 to 17 Years | 0 (0.0%) | 0 (0.0%) |
| 18 to 34 Years | 0 (0.0%) | 0 (0.0%) |
| 35 to 64 Years | 17 (4.0%) | 0 (0.0%) |
| 65 to 74 Years | 0 (0.0%) | 52 (32.3%) |
| 75 Years and over | 0 (0.0%) | 0 (0.0%) |
Technology Access in Harlan
Computing Device Access in Harlan
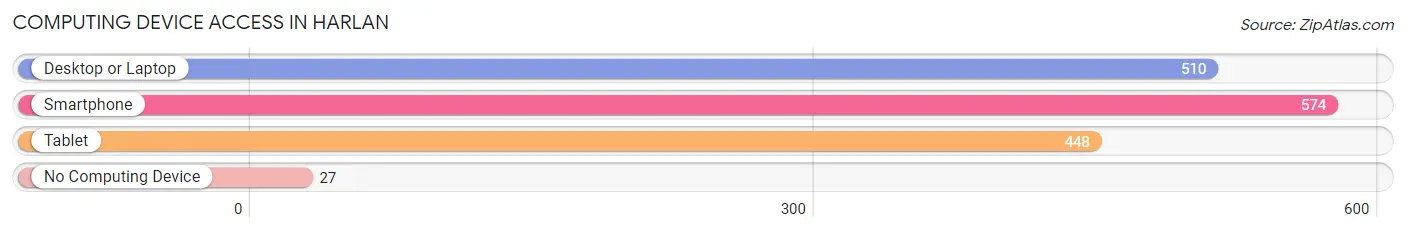
| Device Type | # Households | % Households |
| Desktop or Laptop | 510 | 77.0% |
| Smartphone | 574 | 86.7% |
| Tablet | 448 | 67.7% |
| No Computing Device | 27 | 4.1% |
| Total | 662 | 100.0% |
Internet Access in Harlan
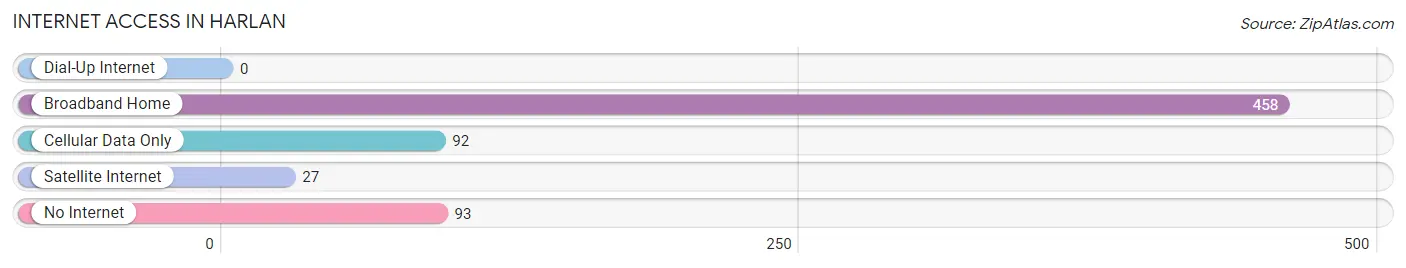
| Internet Type | # Households | % Households |
| Dial-Up Internet | 0 | 0.0% |
| Broadband Home | 458 | 69.2% |
| Cellular Data Only | 92 | 13.9% |
| Satellite Internet | 27 | 4.1% |
| No Internet | 93 | 14.1% |
| Total | 662 | 100.0% |
Harlan Summary
Harlan, Indiana is a small town located in the northeast corner of the state, in DeKalb County. It is situated on the banks of the St. Joseph River, and is surrounded by rolling hills and farmland. The town was founded in 1837, and has a population of approximately 1,500 people.
Geography
Harlan is located in the northeast corner of Indiana, in DeKalb County. It is situated on the banks of the St. Joseph River, and is surrounded by rolling hills and farmland. The town is located approximately 40 miles from Fort Wayne, and is about an hour and a half drive from Chicago. The town is also close to the Indiana-Michigan border, and is within a few hours drive of Detroit and Toledo.
The town is situated on a flat plain, with the St. Joseph River running through the center. The town is surrounded by farmland, and is home to a variety of wildlife, including deer, foxes, and other small animals. The town is also home to a variety of birds, including bald eagles, hawks, and owls.
Economy
Harlan’s economy is largely based on agriculture. The town is home to a variety of farms, including dairy, beef, and poultry farms. The town is also home to a variety of small businesses, including restaurants, retail stores, and service providers. The town is also home to a variety of manufacturing companies, including a plastics factory and a metal fabrication plant.
The town is also home to a variety of recreational activities, including fishing, hunting, and camping. The town is also home to a variety of parks, including a state park and a county park. The town is also home to a variety of festivals and events, including the annual Harlan County Fair.
Demographics
Harlan is a predominantly white town, with a population of approximately 1,500 people. The town is home to a variety of ethnicities, including African American, Hispanic, and Asian. The town is also home to a variety of religions, including Christianity, Judaism, and Islam.
The town has a median household income of approximately $45,000, and the median home value is approximately $90,000. The town has a poverty rate of approximately 15%, and the unemployment rate is approximately 5%.
Conclusion
Harlan, Indiana is a small town located in the northeast corner of the state, in DeKalb County. It is situated on the banks of the St. Joseph River, and is surrounded by rolling hills and farmland. The town was founded in 1837, and has a population of approximately 1,500 people. The town’s economy is largely based on agriculture, and it is home to a variety of small businesses, manufacturing companies, and recreational activities. The town is predominantly white, with a variety of ethnicities and religions represented. The town has a median household income of approximately $45,000, and the median home value is approximately $90,000. The town has a poverty rate of approximately 15%, and the unemployment rate is approximately 5%.
Common Questions
What is Per Capita Income in Harlan?
Per Capita income in Harlan is $37,321.
What is the Median Family Income in Harlan?
Median Family Income in Harlan is $82,723.
What is the Median Household income in Harlan?
Median Household Income in Harlan is $76,750.
What is Income or Wage Gap in Harlan?
Income or Wage Gap in Harlan is 16.6%.
Women in Harlan earn 83.4 cents for every dollar earned by a man.
What is Inequality or Gini Index in Harlan?
Inequality or Gini Index in Harlan is 0.31.
What is the Total Population of Harlan?
Total Population of Harlan is 1,613.
What is the Total Male Population of Harlan?
Total Male Population of Harlan is 948.
What is the Total Female Population of Harlan?
Total Female Population of Harlan is 665.
What is the Ratio of Males per 100 Females in Harlan?
There are 142.56 Males per 100 Females in Harlan.
What is the Ratio of Females per 100 Males in Harlan?
There are 70.15 Females per 100 Males in Harlan.
What is the Median Population Age in Harlan?
Median Population Age in Harlan is 46.4 Years.
What is the Average Family Size in Harlan
Average Family Size in Harlan is 2.8 People.
What is the Average Household Size in Harlan
Average Household Size in Harlan is 2.4 People.
How Large is the Labor Force in Harlan?
There are 967 People in the Labor Forcein in Harlan.
What is the Percentage of People in the Labor Force in Harlan?
70.5% of People are in the Labor Force in Harlan.
What is the Unemployment Rate in Harlan?
Unemployment Rate in Harlan is 7.9%.