Greentown, IN Map & Demographics
Greentown Map
Greentown Overview
$29,964
PER CAPITA INCOME
$72,250
AVG FAMILY INCOME
$57,083
AVG HOUSEHOLD INCOME
35.8%
WAGE / INCOME GAP [ % ]
64.2¢/ $1
WAGE / INCOME GAP [ $ ]
0.38
INEQUALITY / GINI INDEX
2,035
TOTAL POPULATION
990
MALE POPULATION
1,045
FEMALE POPULATION
94.74
MALES / 100 FEMALES
105.56
FEMALES / 100 MALES
44.0
MEDIAN AGE
2.8
AVG FAMILY SIZE
2.4
AVG HOUSEHOLD SIZE
998
LABOR FORCE [ PEOPLE ]
63.3%
PERCENT IN LABOR FORCE
1.9%
UNEMPLOYMENT RATE
Greentown Zip Codes
Greentown Area Codes
Income in Greentown
Income Overview in Greentown
Per Capita Income in Greentown is $29,964, while median incomes of families and households are $72,250 and $57,083 respectively.
| Characteristic | Number | Measure |
| Per Capita Income | 2,035 | $29,964 |
| Median Family Income | 512 | $72,250 |
| Mean Family Income | 512 | $82,459 |
| Median Household Income | 825 | $57,083 |
| Mean Household Income | 825 | $71,876 |
| Income Deficit | 512 | $0 |
| Wage / Income Gap (%) | 2,035 | 35.76% |
| Wage / Income Gap ($) | 2,035 | 64.24¢ per $1 |
| Gini / Inequality Index | 2,035 | 0.38 |
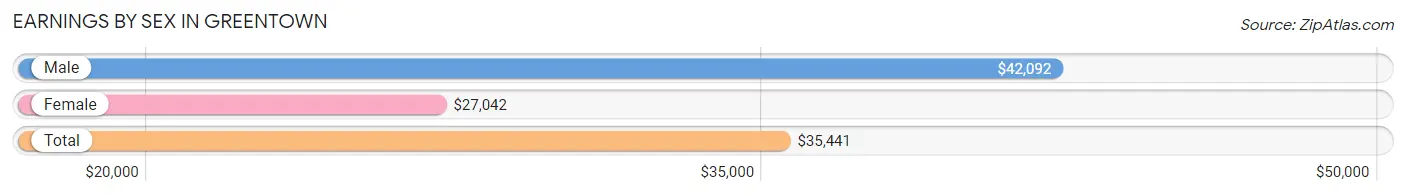
Earnings by Sex in Greentown
Average Earnings in Greentown are $35,441, $42,092 for men and $27,042 for women, a difference of 35.8%.
| Sex | Number | Average Earnings |
| Male | 531 (50.8%) | $42,092 |
| Female | 515 (49.2%) | $27,042 |
| Total | 1,046 (100.0%) | $35,441 |
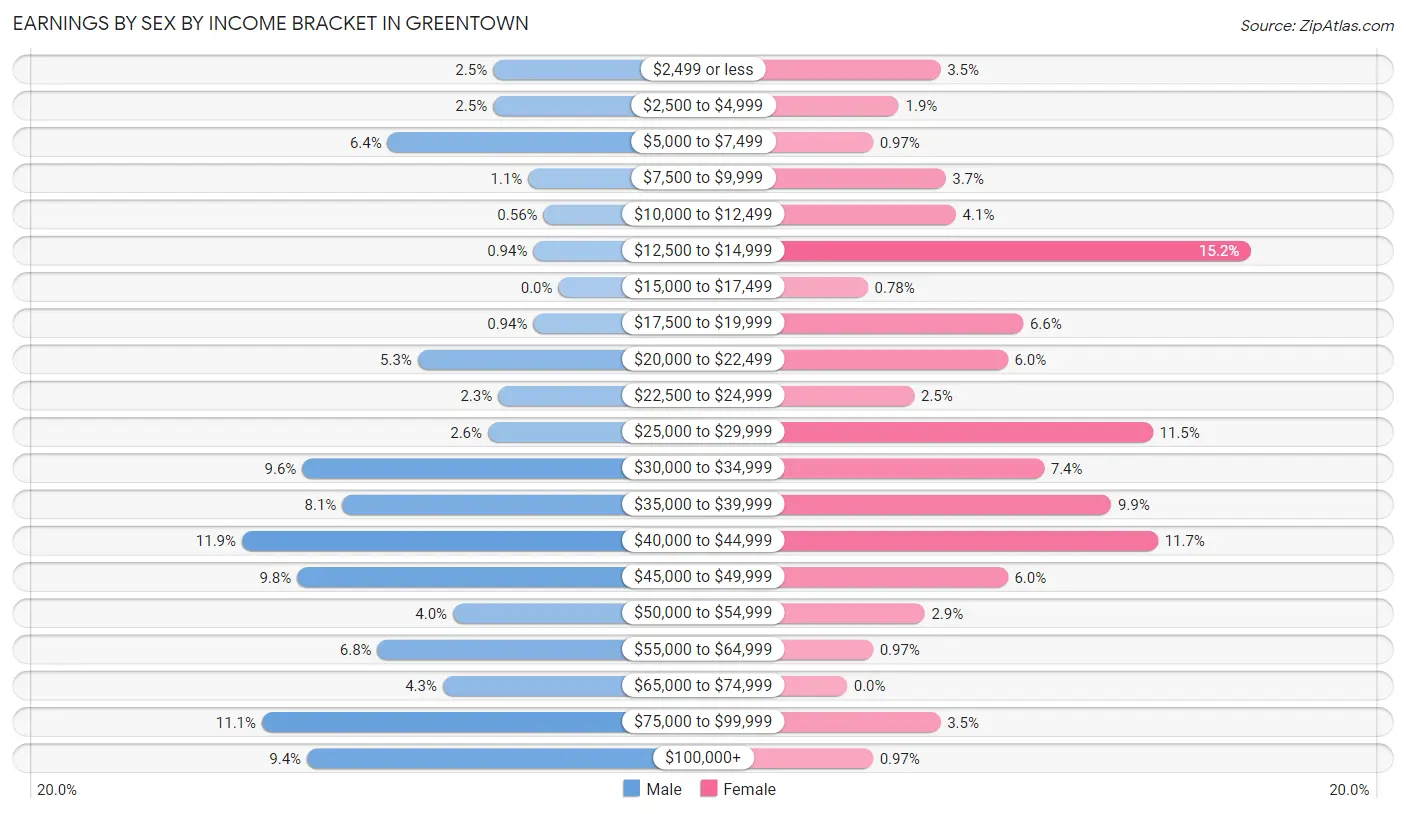
Earnings by Sex by Income Bracket in Greentown
The most common earnings brackets in Greentown are $40,000 to $44,999 for men (63 | 11.9%) and $12,500 to $14,999 for women (78 | 15.1%).
| Income | Male | Female |
| $2,499 or less | 13 (2.5%) | 18 (3.5%) |
| $2,500 to $4,999 | 13 (2.5%) | 10 (1.9%) |
| $5,000 to $7,499 | 34 (6.4%) | 5 (1.0%) |
| $7,500 to $9,999 | 6 (1.1%) | 19 (3.7%) |
| $10,000 to $12,499 | 3 (0.6%) | 21 (4.1%) |
| $12,500 to $14,999 | 5 (0.9%) | 78 (15.1%) |
| $15,000 to $17,499 | 0 (0.0%) | 4 (0.8%) |
| $17,500 to $19,999 | 5 (0.9%) | 34 (6.6%) |
| $20,000 to $22,499 | 28 (5.3%) | 31 (6.0%) |
| $22,500 to $24,999 | 12 (2.3%) | 13 (2.5%) |
| $25,000 to $29,999 | 14 (2.6%) | 59 (11.5%) |
| $30,000 to $34,999 | 51 (9.6%) | 38 (7.4%) |
| $35,000 to $39,999 | 43 (8.1%) | 51 (9.9%) |
| $40,000 to $44,999 | 63 (11.9%) | 60 (11.7%) |
| $45,000 to $49,999 | 52 (9.8%) | 31 (6.0%) |
| $50,000 to $54,999 | 21 (4.0%) | 15 (2.9%) |
| $55,000 to $64,999 | 36 (6.8%) | 5 (1.0%) |
| $65,000 to $74,999 | 23 (4.3%) | 0 (0.0%) |
| $75,000 to $99,999 | 59 (11.1%) | 18 (3.5%) |
| $100,000+ | 50 (9.4%) | 5 (1.0%) |
| Total | 531 (100.0%) | 515 (100.0%) |
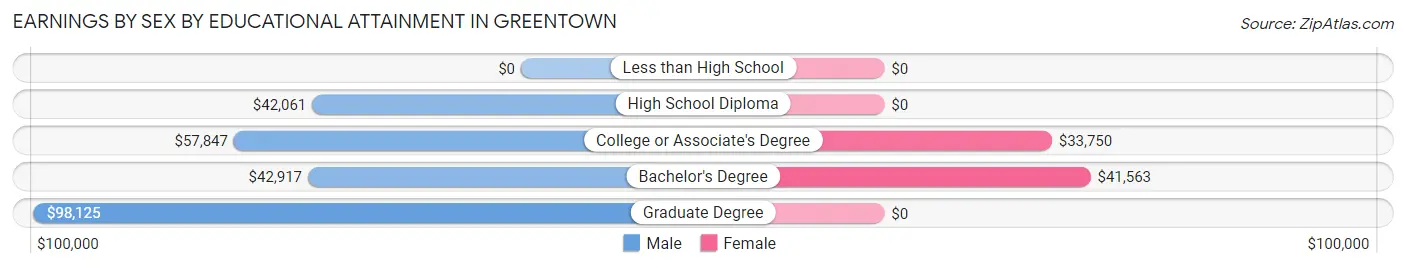
Earnings by Sex by Educational Attainment in Greentown
Average earnings in Greentown are $45,399 for men and $31,250 for women, a difference of 31.2%. Men with an educational attainment of graduate degree enjoy the highest average annual earnings of $98,125, while those with high school diploma education earn the least with $42,061. Women with an educational attainment of bachelor's degree earn the most with the average annual earnings of $41,563, while those with college or associate's degree education have the smallest earnings of $33,750.
| Educational Attainment | Male Income | Female Income |
| Less than High School | - | - |
| High School Diploma | $42,061 | $0 |
| College or Associate's Degree | $57,847 | $33,750 |
| Bachelor's Degree | $42,917 | $41,563 |
| Graduate Degree | $98,125 | $0 |
| Total | $45,399 | $31,250 |
Family Income in Greentown
Family Income Brackets in Greentown
According to the Greentown family income data, there are 143 families falling into the $100,000 to $149,999 income range, which is the most common income bracket and makes up 27.9% of all families.
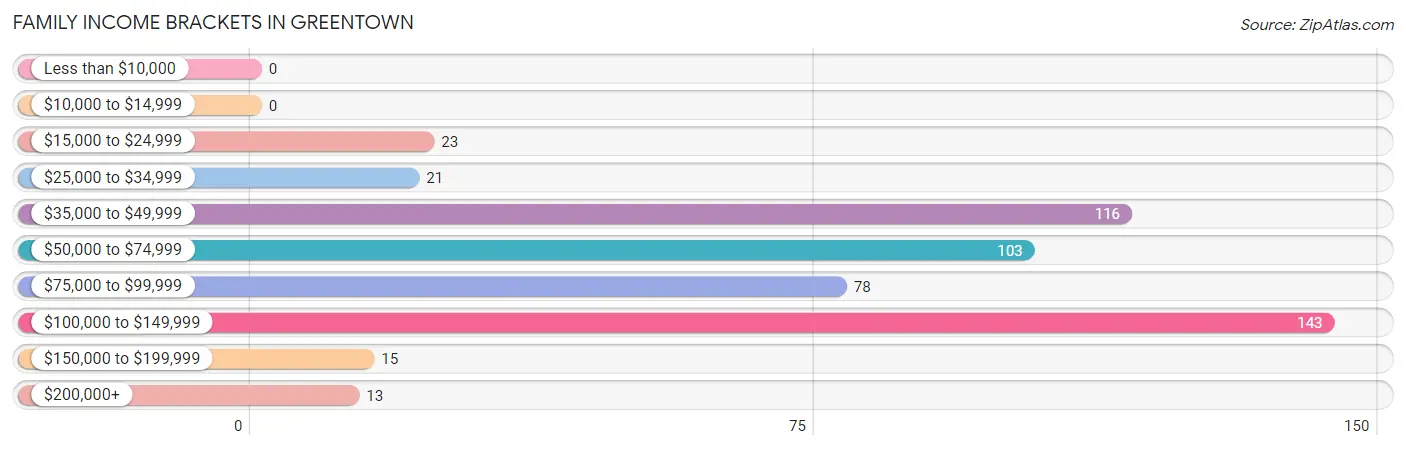
| Income Bracket | # Families | % Families |
| Less than $10,000 | 0 | 0.0% |
| $10,000 to $14,999 | 0 | 0.0% |
| $15,000 to $24,999 | 23 | 4.5% |
| $25,000 to $34,999 | 21 | 4.1% |
| $35,000 to $49,999 | 116 | 22.7% |
| $50,000 to $74,999 | 103 | 20.1% |
| $75,000 to $99,999 | 78 | 15.2% |
| $100,000 to $149,999 | 143 | 27.9% |
| $150,000 to $199,999 | 15 | 2.9% |
| $200,000+ | 13 | 2.5% |
Family Income by Famaliy Size in Greentown
5-person families (51 | 10.0%) account for the highest median family income in Greentown with $103,083 per family, while 2-person families (267 | 52.1%) have the highest median income of $32,978 per family member.
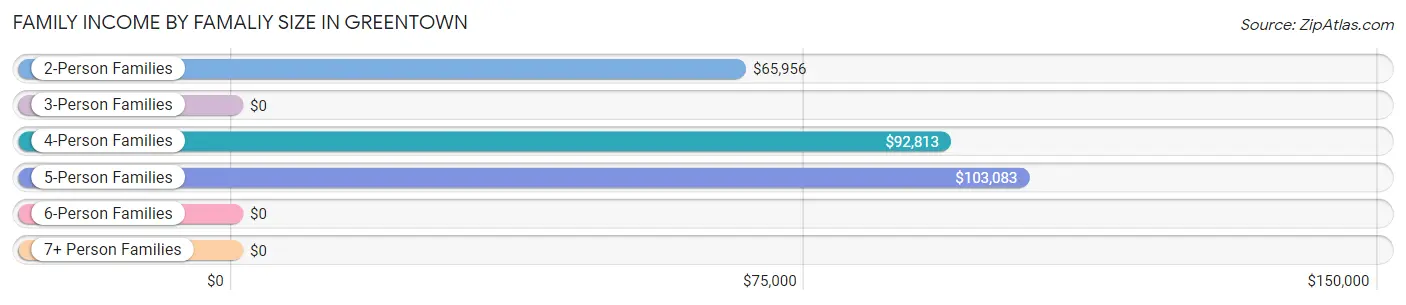
| Income Bracket | # Families | Median Income |
| 2-Person Families | 267 (52.1%) | $65,956 |
| 3-Person Families | 107 (20.9%) | $0 |
| 4-Person Families | 87 (17.0%) | $92,813 |
| 5-Person Families | 51 (10.0%) | $103,083 |
| 6-Person Families | 0 (0.0%) | $0 |
| 7+ Person Families | 0 (0.0%) | $0 |
| Total | 512 (100.0%) | $72,250 |
Family Income by Number of Earners in Greentown
The median family income in Greentown is $72,250, with families comprising 3+ earners (56) having the highest median family income of $103,000, while families with 1 earner (199) have the lowest median family income of $46,615, accounting for 10.9% and 38.9% of families, respectively.
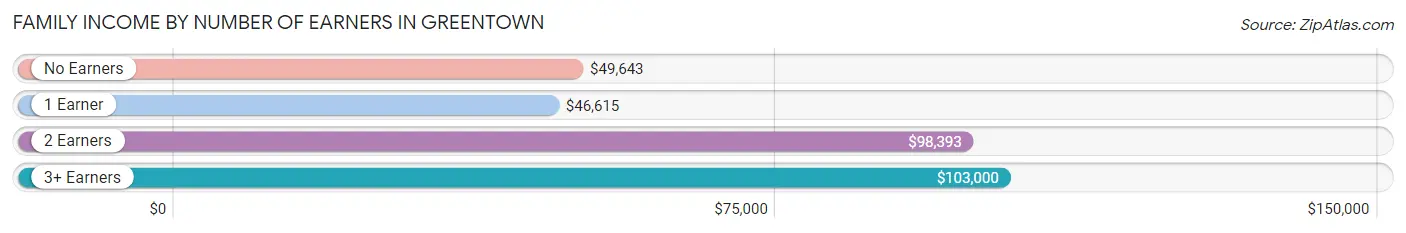
| Number of Earners | # Families | Median Income |
| No Earners | 66 (12.9%) | $49,643 |
| 1 Earner | 199 (38.9%) | $46,615 |
| 2 Earners | 191 (37.3%) | $98,393 |
| 3+ Earners | 56 (10.9%) | $103,000 |
| Total | 512 (100.0%) | $72,250 |
Household Income in Greentown
Household Income Brackets in Greentown
With 151 households falling in the category, the $100,000 to $149,999 income range is the most frequent in Greentown, accounting for 18.3% of all households. In contrast, only 4 households (0.5%) fall into the less than $10,000 income bracket, making it the least populous group.
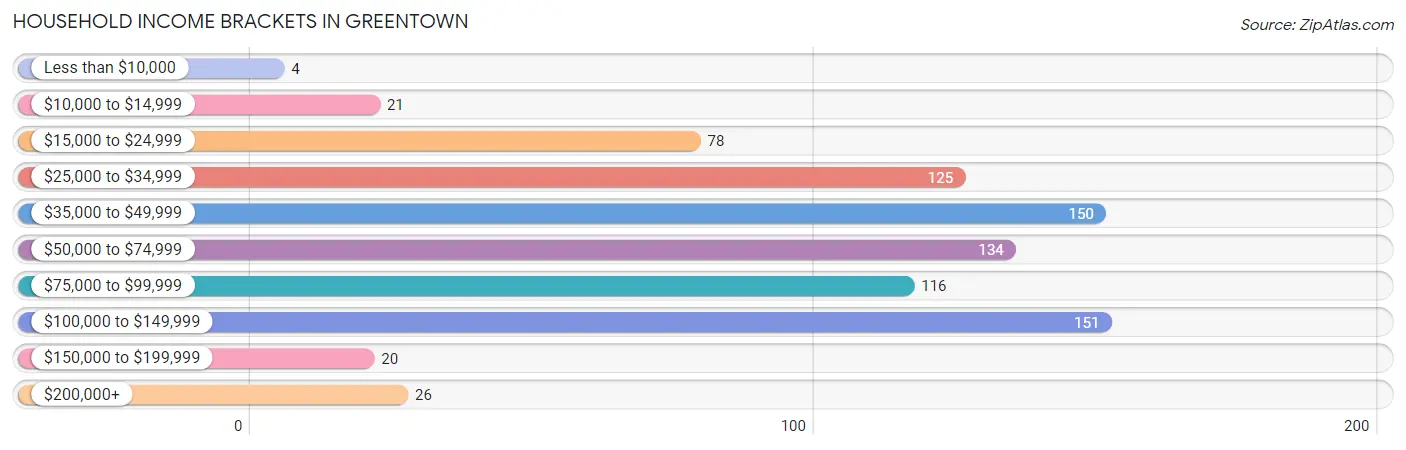
| Income Bracket | # Households | % Households |
| Less than $10,000 | 4 | 0.5% |
| $10,000 to $14,999 | 21 | 2.5% |
| $15,000 to $24,999 | 78 | 9.5% |
| $25,000 to $34,999 | 125 | 15.2% |
| $35,000 to $49,999 | 150 | 18.2% |
| $50,000 to $74,999 | 134 | 16.2% |
| $75,000 to $99,999 | 116 | 14.1% |
| $100,000 to $149,999 | 151 | 18.3% |
| $150,000 to $199,999 | 20 | 2.4% |
| $200,000+ | 26 | 3.2% |
Household Income by Householder Age in Greentown
The median household income in Greentown is $57,083, with the highest median household income of $89,423 found in the 25 to 44 years age bracket for the primary householder. A total of 238 households (28.8%) fall into this category. Meanwhile, the 65+ years age bracket for the primary householder has the lowest median household income of $33,917, with 239 households (29.0%) in this group.
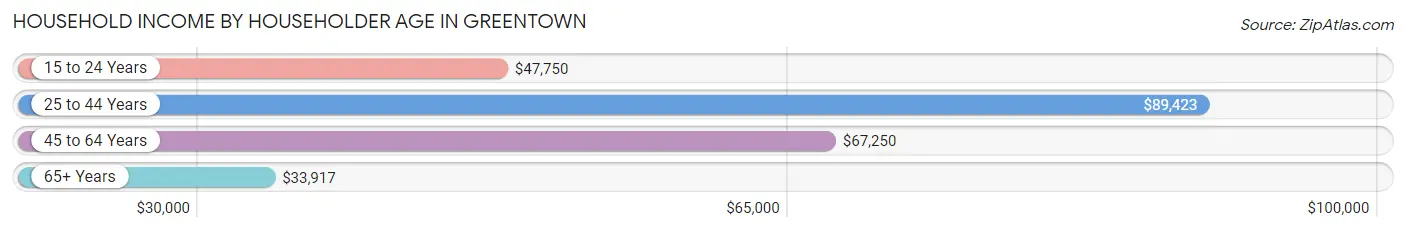
| Income Bracket | # Households | Median Income |
| 15 to 24 Years | 35 (4.2%) | $47,750 |
| 25 to 44 Years | 238 (28.8%) | $89,423 |
| 45 to 64 Years | 313 (37.9%) | $67,250 |
| 65+ Years | 239 (29.0%) | $33,917 |
| Total | 825 (100.0%) | $57,083 |
Poverty in Greentown
Income Below Poverty by Sex and Age in Greentown
With 5.3% poverty level for males and 8.5% for females among the residents of Greentown, 55 to 64 year old males and 12 to 14 year old females are the most vulnerable to poverty, with 33 males (20.3%) and 15 females (31.2%) in their respective age groups living below the poverty level.
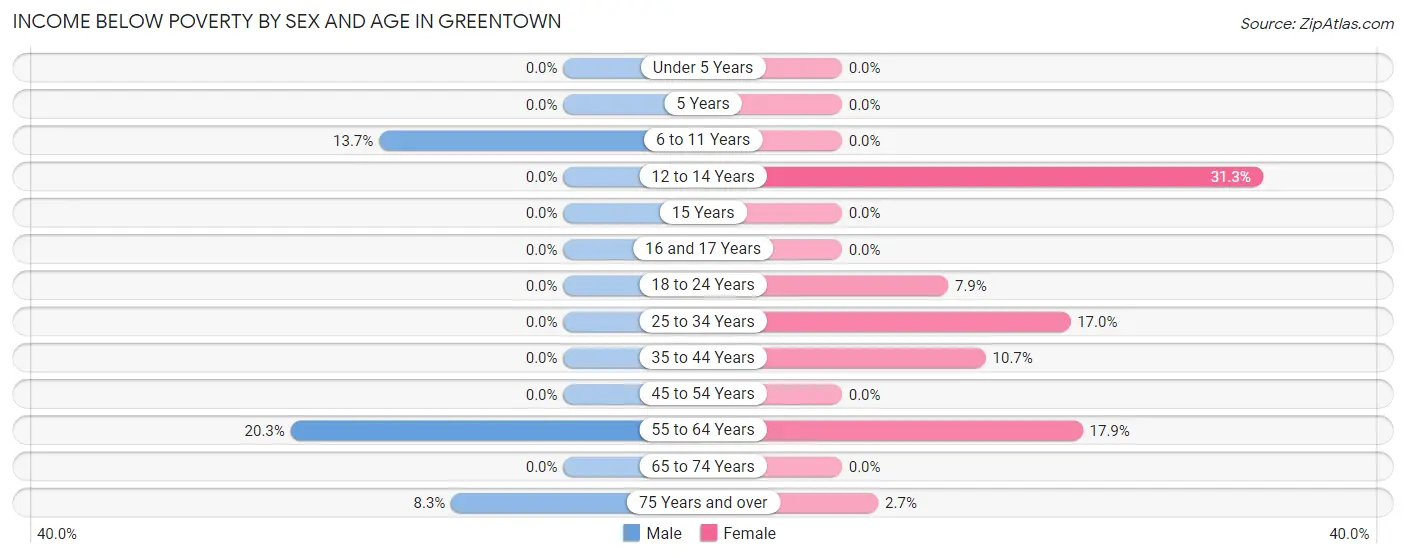
| Age Bracket | Male | Female |
| Under 5 Years | 0 (0.0%) | 0 (0.0%) |
| 5 Years | 0 (0.0%) | 0 (0.0%) |
| 6 to 11 Years | 13 (13.7%) | 0 (0.0%) |
| 12 to 14 Years | 0 (0.0%) | 15 (31.2%) |
| 15 Years | 0 (0.0%) | 0 (0.0%) |
| 16 and 17 Years | 0 (0.0%) | 0 (0.0%) |
| 18 to 24 Years | 0 (0.0%) | 6 (7.9%) |
| 25 to 34 Years | 0 (0.0%) | 19 (17.0%) |
| 35 to 44 Years | 0 (0.0%) | 11 (10.7%) |
| 45 to 54 Years | 0 (0.0%) | 0 (0.0%) |
| 55 to 64 Years | 33 (20.3%) | 27 (17.9%) |
| 65 to 74 Years | 0 (0.0%) | 0 (0.0%) |
| 75 Years and over | 4 (8.3%) | 4 (2.7%) |
| Total | 50 (5.3%) | 82 (8.5%) |
Income Above Poverty by Sex and Age in Greentown
According to the poverty statistics in Greentown, males aged under 5 years and females aged under 5 years are the age groups that are most secure financially, with 100.0% of males and 100.0% of females in these age groups living above the poverty line.
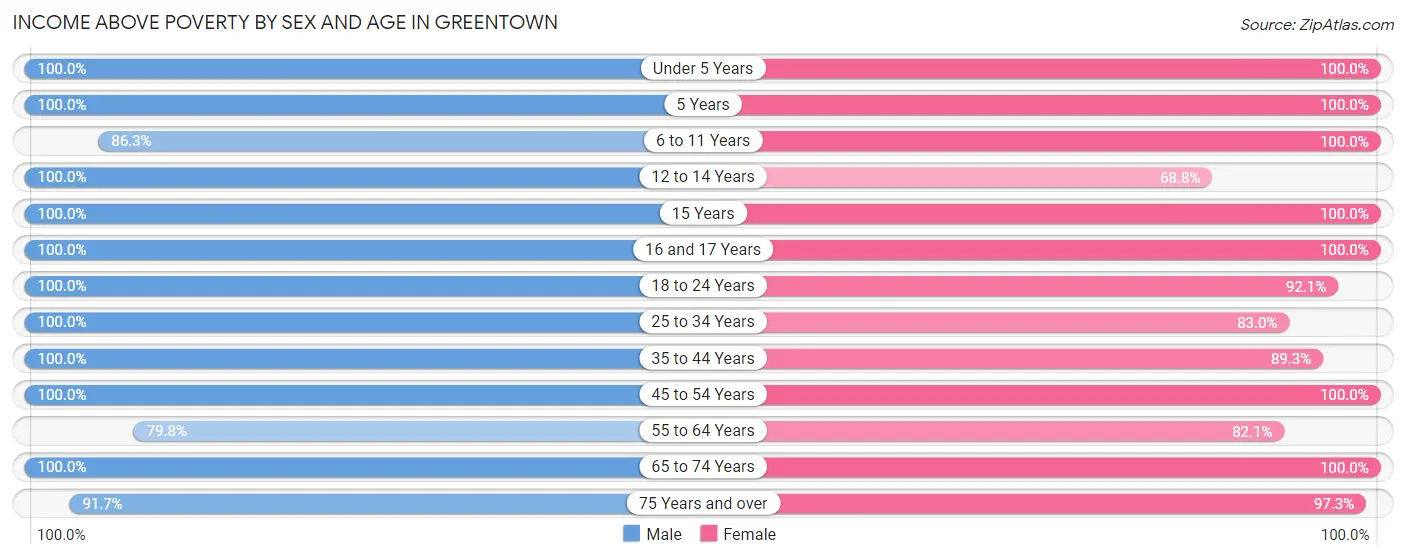
| Age Bracket | Male | Female |
| Under 5 Years | 20 (100.0%) | 30 (100.0%) |
| 5 Years | 6 (100.0%) | 19 (100.0%) |
| 6 to 11 Years | 82 (86.3%) | 89 (100.0%) |
| 12 to 14 Years | 74 (100.0%) | 33 (68.8%) |
| 15 Years | 9 (100.0%) | 15 (100.0%) |
| 16 and 17 Years | 5 (100.0%) | 22 (100.0%) |
| 18 to 24 Years | 81 (100.0%) | 70 (92.1%) |
| 25 to 34 Years | 37 (100.0%) | 93 (83.0%) |
| 35 to 44 Years | 167 (100.0%) | 92 (89.3%) |
| 45 to 54 Years | 134 (100.0%) | 98 (100.0%) |
| 55 to 64 Years | 130 (79.7%) | 124 (82.1%) |
| 65 to 74 Years | 95 (100.0%) | 54 (100.0%) |
| 75 Years and over | 44 (91.7%) | 144 (97.3%) |
| Total | 884 (94.7%) | 883 (91.5%) |
Income Below Poverty Among Married-Couple Families in Greentown
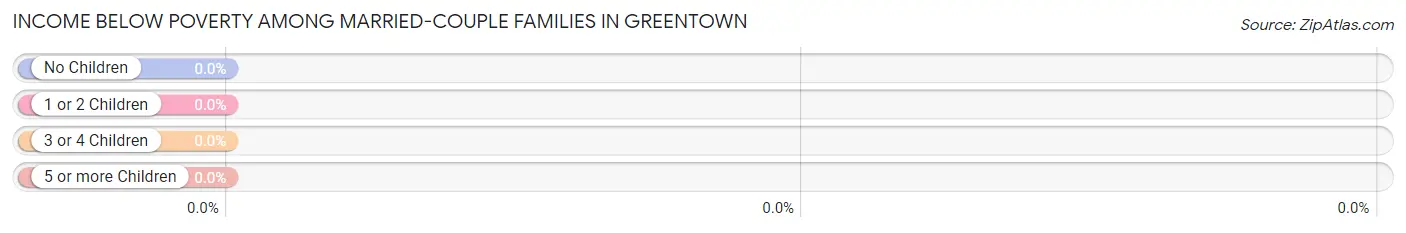
| Children | Above Poverty | Below Poverty |
| No Children | 248 (100.0%) | 0 (0.0%) |
| 1 or 2 Children | 113 (100.0%) | 0 (0.0%) |
| 3 or 4 Children | 14 (100.0%) | 0 (0.0%) |
| 5 or more Children | 0 (0.0%) | 0 (0.0%) |
| Total | 375 (100.0%) | 0 (0.0%) |
Income Below Poverty Among Single-Parent Households in Greentown
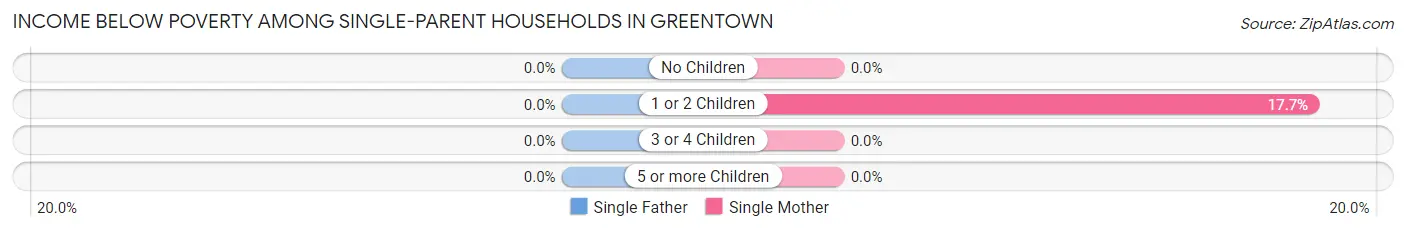
| Children | Single Father | Single Mother |
| No Children | 0 (0.0%) | 0 (0.0%) |
| 1 or 2 Children | 0 (0.0%) | 11 (17.7%) |
| 3 or 4 Children | 0 (0.0%) | 0 (0.0%) |
| 5 or more Children | 0 (0.0%) | 0 (0.0%) |
| Total | 0 (0.0%) | 11 (12.2%) |
Income Below Poverty Among Married-Couple vs Single-Parent Households in Greentown
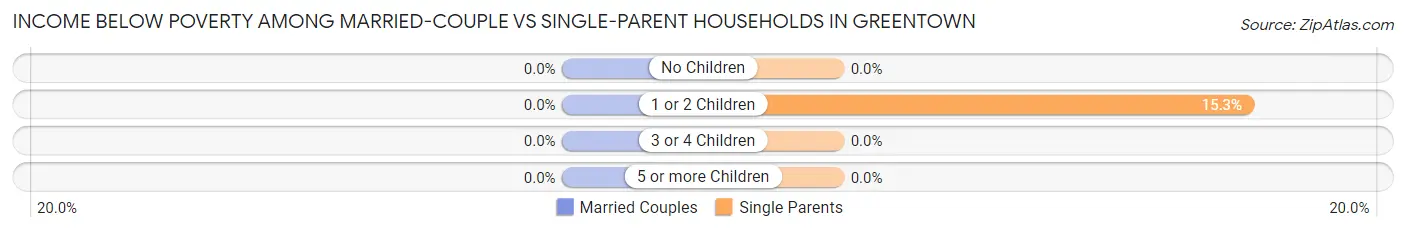
| Children | Married-Couple Families | Single-Parent Households |
| No Children | 0 (0.0%) | 0 (0.0%) |
| 1 or 2 Children | 0 (0.0%) | 11 (15.3%) |
| 3 or 4 Children | 0 (0.0%) | 0 (0.0%) |
| 5 or more Children | 0 (0.0%) | 0 (0.0%) |
| Total | 0 (0.0%) | 11 (8.0%) |
Race in Greentown
The most populous races in Greentown are White / Caucasian (1,946 | 95.6%), Two or more Races (53 | 2.6%), and Black / African American (22 | 1.1%).
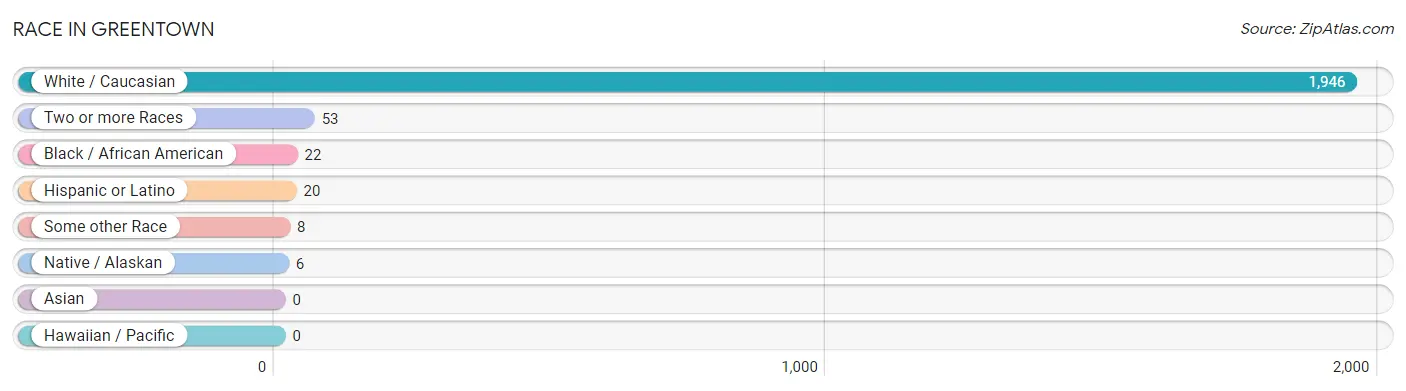
| Race | # Population | % Population |
| Asian | 0 | 0.0% |
| Black / African American | 22 | 1.1% |
| Hawaiian / Pacific | 0 | 0.0% |
| Hispanic or Latino | 20 | 1.0% |
| Native / Alaskan | 6 | 0.3% |
| White / Caucasian | 1,946 | 95.6% |
| Two or more Races | 53 | 2.6% |
| Some other Race | 8 | 0.4% |
| Total | 2,035 | 100.0% |
Ancestry in Greentown
The most populous ancestries reported in Greentown are German (270 | 13.3%), American (223 | 11.0%), English (184 | 9.0%), Irish (165 | 8.1%), and Scandinavian (78 | 3.8%), together accounting for 45.2% of all Greentown residents.
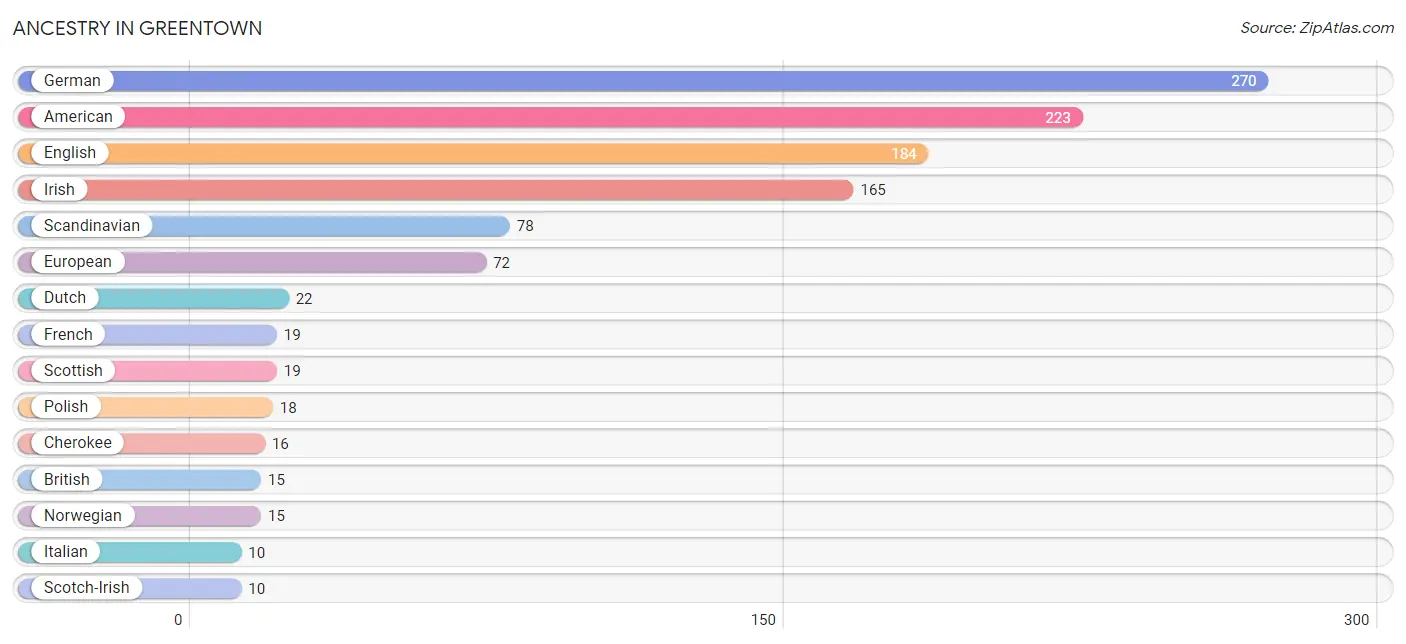
| Ancestry | # Population | % Population |
| American | 223 | 11.0% |
| British | 15 | 0.7% |
| Canadian | 5 | 0.3% |
| Cherokee | 16 | 0.8% |
| Danish | 5 | 0.3% |
| Dutch | 22 | 1.1% |
| English | 184 | 9.0% |
| European | 72 | 3.5% |
| French | 19 | 0.9% |
| French Canadian | 4 | 0.2% |
| German | 270 | 13.3% |
| Irish | 165 | 8.1% |
| Italian | 10 | 0.5% |
| Mexican | 8 | 0.4% |
| Northern European | 5 | 0.3% |
| Norwegian | 15 | 0.7% |
| Polish | 18 | 0.9% |
| Scandinavian | 78 | 3.8% |
| Scotch-Irish | 10 | 0.5% |
| Scottish | 19 | 0.9% |
| Spanish | 5 | 0.3% |
| Sri Lankan | 8 | 0.4% |
| Swiss | 7 | 0.3% |
| Welsh | 9 | 0.4% | View All 24 Rows |
Immigrants in Greentown
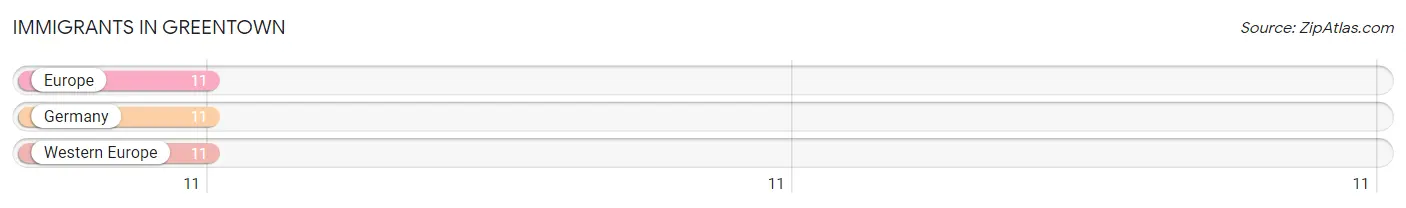
The most numerous immigrant groups reported in Greentown came from Europe (11 | 0.5%), Germany (11 | 0.5%), and Western Europe (11 | 0.5%), together accounting for 1.6% of all Greentown residents.
| Immigration Origin | # Population | % Population |
| Europe | 11 | 0.5% |
| Germany | 11 | 0.5% |
| Western Europe | 11 | 0.5% | View All 3 Rows |
Sex and Age in Greentown
Sex and Age in Greentown
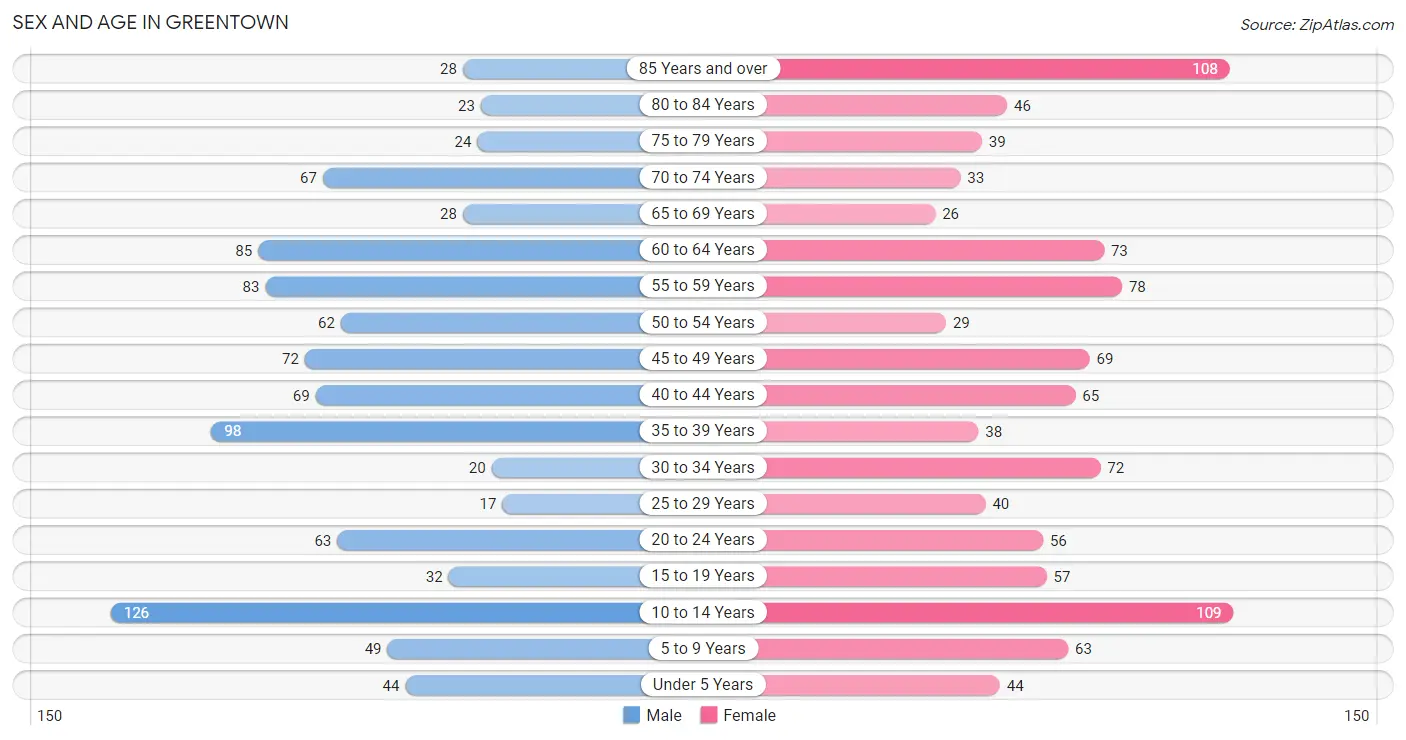
The most populous age groups in Greentown are 10 to 14 Years (126 | 12.7%) for men and 10 to 14 Years (109 | 10.4%) for women.
| Age Bracket | Male | Female |
| Under 5 Years | 44 (4.4%) | 44 (4.2%) |
| 5 to 9 Years | 49 (5.0%) | 63 (6.0%) |
| 10 to 14 Years | 126 (12.7%) | 109 (10.4%) |
| 15 to 19 Years | 32 (3.2%) | 57 (5.4%) |
| 20 to 24 Years | 63 (6.4%) | 56 (5.4%) |
| 25 to 29 Years | 17 (1.7%) | 40 (3.8%) |
| 30 to 34 Years | 20 (2.0%) | 72 (6.9%) |
| 35 to 39 Years | 98 (9.9%) | 38 (3.6%) |
| 40 to 44 Years | 69 (7.0%) | 65 (6.2%) |
| 45 to 49 Years | 72 (7.3%) | 69 (6.6%) |
| 50 to 54 Years | 62 (6.3%) | 29 (2.8%) |
| 55 to 59 Years | 83 (8.4%) | 78 (7.5%) |
| 60 to 64 Years | 85 (8.6%) | 73 (7.0%) |
| 65 to 69 Years | 28 (2.8%) | 26 (2.5%) |
| 70 to 74 Years | 67 (6.8%) | 33 (3.2%) |
| 75 to 79 Years | 24 (2.4%) | 39 (3.7%) |
| 80 to 84 Years | 23 (2.3%) | 46 (4.4%) |
| 85 Years and over | 28 (2.8%) | 108 (10.3%) |
| Total | 990 (100.0%) | 1,045 (100.0%) |
Families and Households in Greentown
Median Family Size in Greentown
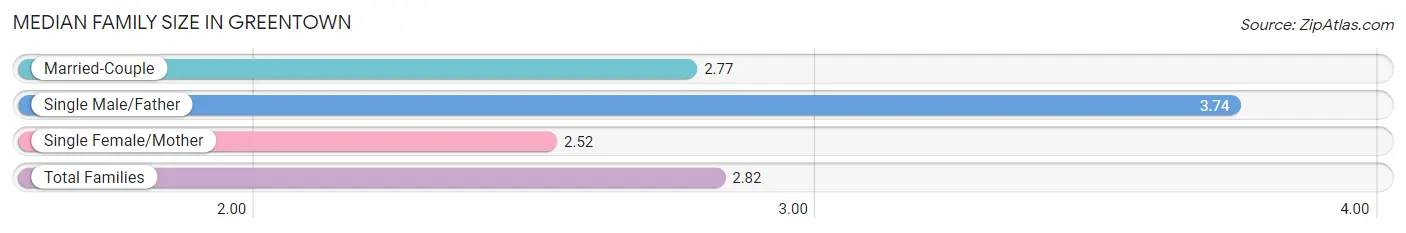
The median family size in Greentown is 2.82 persons per family, with single male/father families (47 | 9.2%) accounting for the largest median family size of 3.74 persons per family. On the other hand, single female/mother families (90 | 17.6%) represent the smallest median family size with 2.52 persons per family.
| Family Type | # Families | Family Size |
| Married-Couple | 375 (73.2%) | 2.77 |
| Single Male/Father | 47 (9.2%) | 3.74 |
| Single Female/Mother | 90 (17.6%) | 2.52 |
| Total Families | 512 (100.0%) | 2.82 |
Median Household Size in Greentown
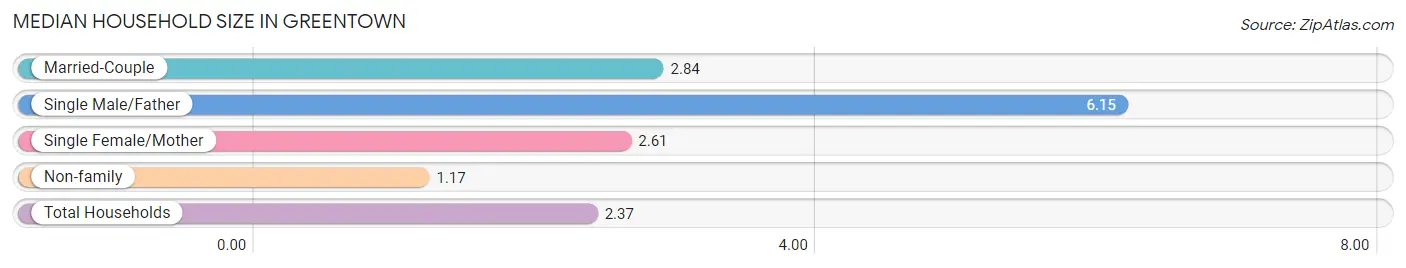
The median household size in Greentown is 2.37 persons per household, with single male/father households (47 | 5.7%) accounting for the largest median household size of 6.15 persons per household. non-family households (313 | 37.9%) represent the smallest median household size with 1.17 persons per household.
| Household Type | # Households | Household Size |
| Married-Couple | 375 (45.5%) | 2.84 |
| Single Male/Father | 47 (5.7%) | 6.15 |
| Single Female/Mother | 90 (10.9%) | 2.61 |
| Non-family | 313 (37.9%) | 1.17 |
| Total Households | 825 (100.0%) | 2.37 |
Household Size by Marriage Status in Greentown
Out of a total of 825 households in Greentown, 512 (62.1%) are family households, while 313 (37.9%) are nonfamily households. The most numerous type of family households are 2-person households, comprising 253, and the most common type of nonfamily households are 1-person households, comprising 269.
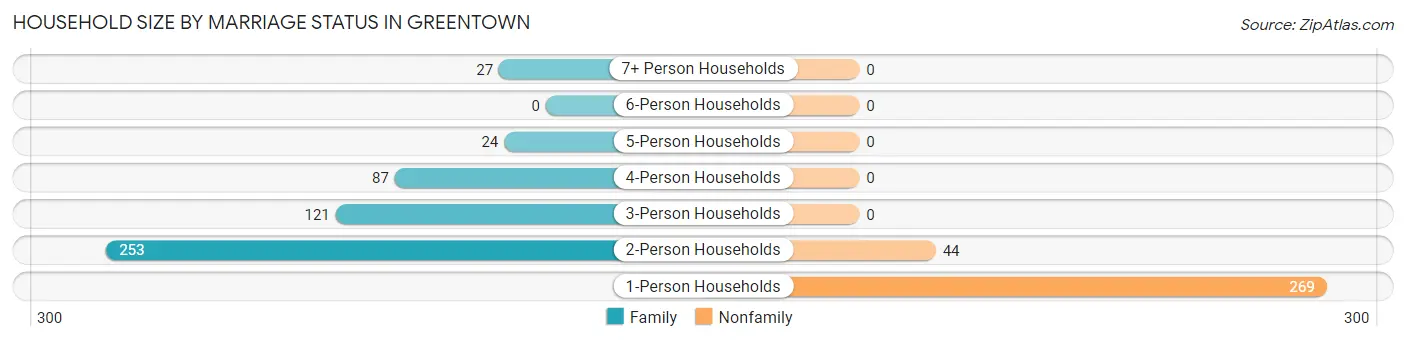
| Household Size | Family Households | Nonfamily Households |
| 1-Person Households | - | 269 (32.6%) |
| 2-Person Households | 253 (30.7%) | 44 (5.3%) |
| 3-Person Households | 121 (14.7%) | 0 (0.0%) |
| 4-Person Households | 87 (10.5%) | 0 (0.0%) |
| 5-Person Households | 24 (2.9%) | 0 (0.0%) |
| 6-Person Households | 0 (0.0%) | 0 (0.0%) |
| 7+ Person Households | 27 (3.3%) | 0 (0.0%) |
| Total | 512 (62.1%) | 313 (37.9%) |
Female Fertility in Greentown
Fertility by Age in Greentown
Average fertility rate in Greentown is 25.0 births per 1,000 women. Women in the age bracket of 15 to 19 years have the highest fertility rate with 175.0 births per 1,000 women. Women in the age bracket of 15 to 19 years acount for 100.0% of all women with births.
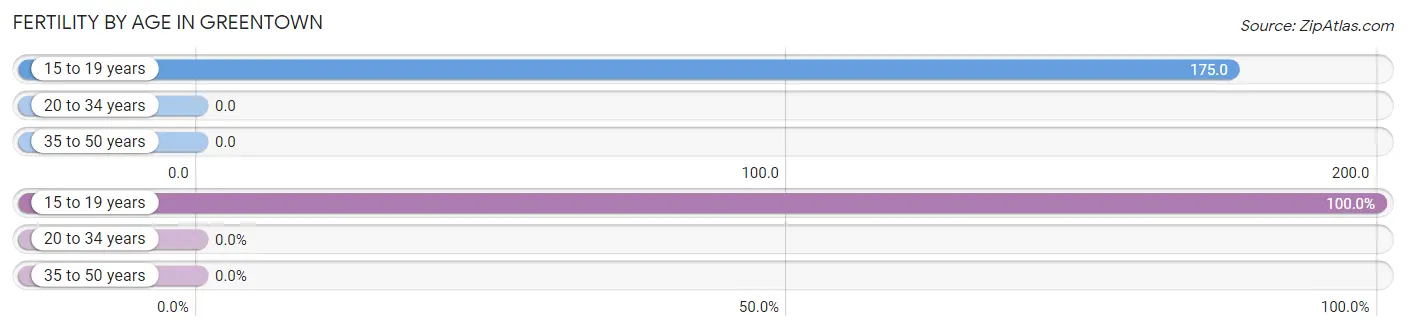
| Age Bracket | Women with Births | Births / 1,000 Women |
| 15 to 19 years | 10 (100.0%) | 175.0 |
| 20 to 34 years | 0 (0.0%) | 0.0 |
| 35 to 50 years | 0 (0.0%) | 0.0 |
| Total | 10 (100.0%) | 25.0 |
Fertility by Age by Marriage Status in Greentown
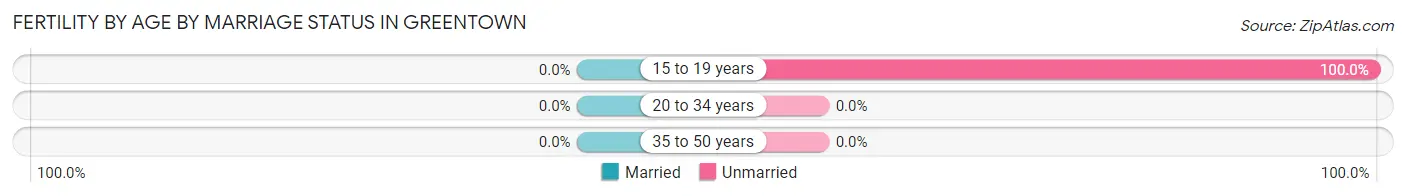
| Age Bracket | Married | Unmarried |
| 15 to 19 years | 0 (0.0%) | 10 (100.0%) |
| 20 to 34 years | 0 (0.0%) | 0 (0.0%) |
| 35 to 50 years | 0 (0.0%) | 0 (0.0%) |
| Total | 0 (0.0%) | 10 (100.0%) |
Fertility by Education in Greentown
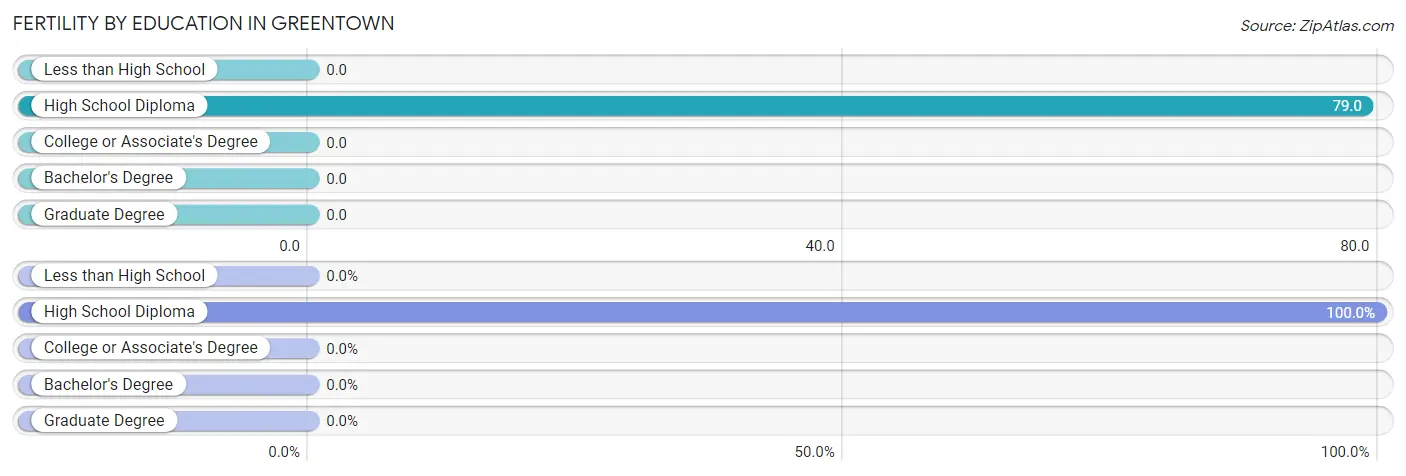
| Educational Attainment | Women with Births | Births / 1,000 Women |
| Less than High School | 0 (0.0%) | 0.0 |
| High School Diploma | 10 (100.0%) | 79.0 |
| College or Associate's Degree | 0 (0.0%) | 0.0 |
| Bachelor's Degree | 0 (0.0%) | 0.0 |
| Graduate Degree | 0 (0.0%) | 0.0 |
| Total | 10 (100.0%) | 25.0 |
Fertility by Education by Marriage Status in Greentown
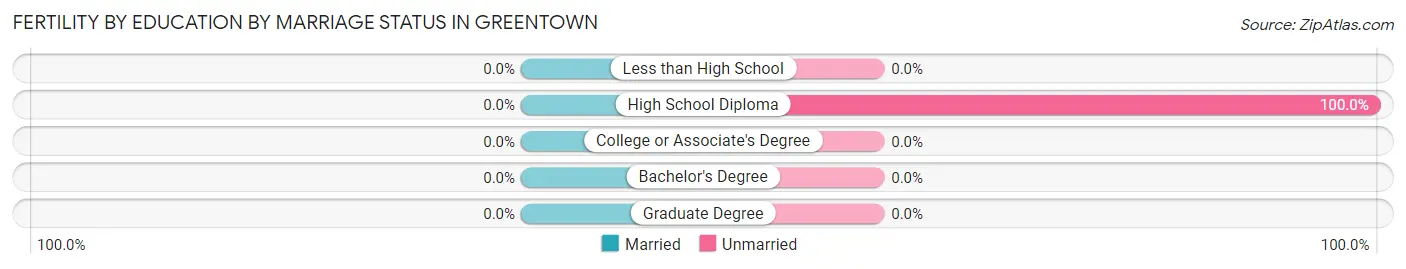
| Educational Attainment | Married | Unmarried |
| Less than High School | 0 (0.0%) | 0 (0.0%) |
| High School Diploma | 0 (0.0%) | 10 (100.0%) |
| College or Associate's Degree | 0 (0.0%) | 0 (0.0%) |
| Bachelor's Degree | 0 (0.0%) | 0 (0.0%) |
| Graduate Degree | 0 (0.0%) | 0 (0.0%) |
| Total | 0 (0.0%) | 10 (100.0%) |
Employment Characteristics in Greentown
Employment by Class of Employer in Greentown
Among the 974 employed individuals in Greentown, private company employees (696 | 71.5%), not-for-profit organizations (121 | 12.4%), and local government employees (74 | 7.6%) make up the most common classes of employment.
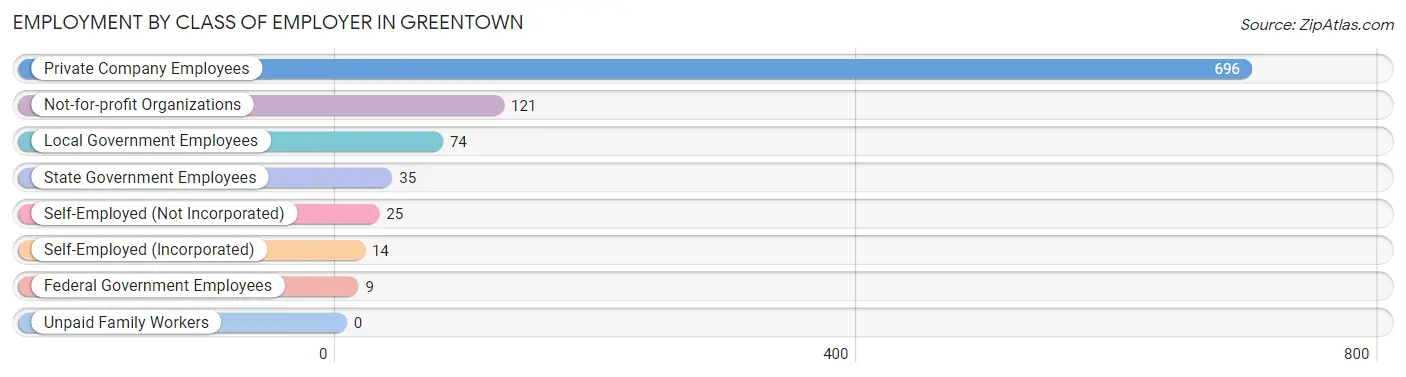
| Employer Class | # Employees | % Employees |
| Private Company Employees | 696 | 71.5% |
| Self-Employed (Incorporated) | 14 | 1.4% |
| Self-Employed (Not Incorporated) | 25 | 2.6% |
| Not-for-profit Organizations | 121 | 12.4% |
| Local Government Employees | 74 | 7.6% |
| State Government Employees | 35 | 3.6% |
| Federal Government Employees | 9 | 0.9% |
| Unpaid Family Workers | 0 | 0.0% |
| Total | 974 | 100.0% |
Employment Status by Age in Greentown
According to the labor force statistics for Greentown, out of the total population over 16 years of age (1,576), 63.3% or 998 individuals are in the labor force, with 1.9% or 19 of them unemployed. The age group with the highest labor force participation rate is 20 to 24 years, with 89.1% or 106 individuals in the labor force. Within the labor force, the 55 to 59 years age range has the highest percentage of unemployed individuals, with 8.8% or 10 of them being unemployed.
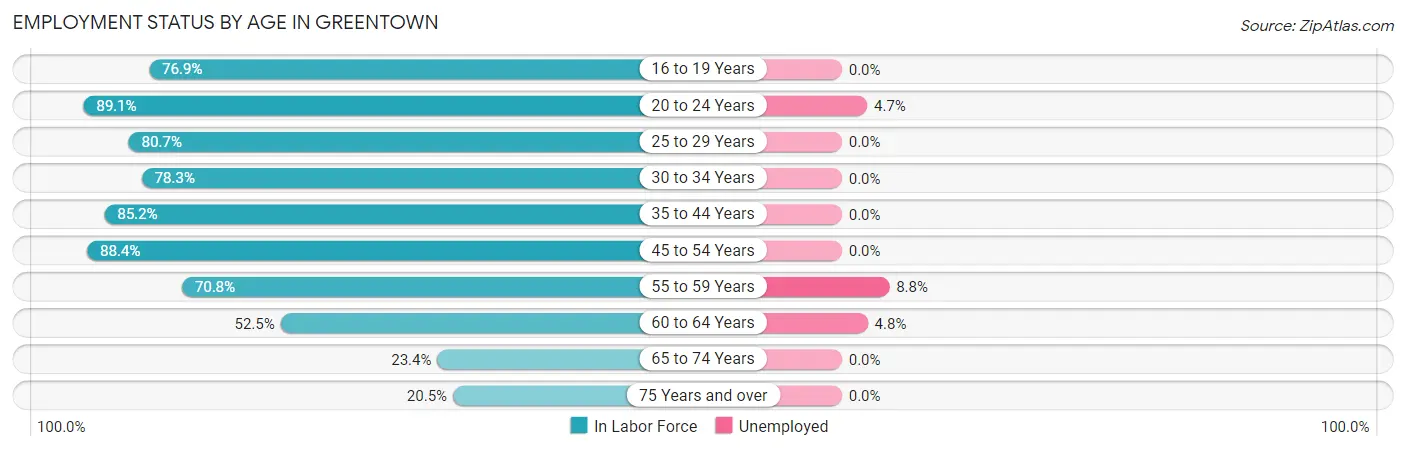
| Age Bracket | In Labor Force | Unemployed |
| 16 to 19 Years | 50 (76.9%) | 0 (0.0%) |
| 20 to 24 Years | 106 (89.1%) | 5 (4.7%) |
| 25 to 29 Years | 46 (80.7%) | 0 (0.0%) |
| 30 to 34 Years | 72 (78.3%) | 0 (0.0%) |
| 35 to 44 Years | 230 (85.2%) | 0 (0.0%) |
| 45 to 54 Years | 205 (88.4%) | 0 (0.0%) |
| 55 to 59 Years | 114 (70.8%) | 10 (8.8%) |
| 60 to 64 Years | 83 (52.5%) | 4 (4.8%) |
| 65 to 74 Years | 36 (23.4%) | 0 (0.0%) |
| 75 Years and over | 55 (20.5%) | 0 (0.0%) |
| Total | 998 (63.3%) | 19 (1.9%) |
Employment Status by Educational Attainment in Greentown
According to labor force statistics for Greentown, 77.3% of individuals (750) out of the total population between 25 and 64 years of age (970) are in the labor force, with 1.9% or 14 of them being unemployed. The group with the highest labor force participation rate are those with the educational attainment of bachelor's degree or higher, with 88.7% or 110 individuals in the labor force. Within the labor force, individuals with high school diploma education have the highest percentage of unemployment, with 3.0% or 9 of them being unemployed.
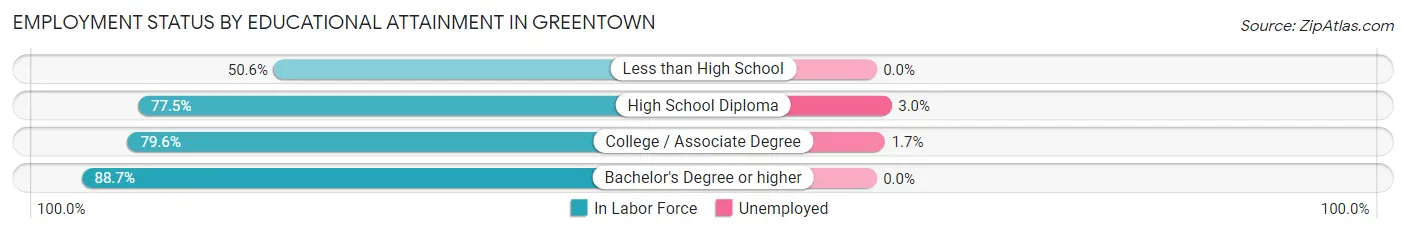
| Educational Attainment | In Labor Force | Unemployed |
| Less than High School | 44 (50.6%) | 0 (0.0%) |
| High School Diploma | 303 (77.5%) | 12 (3.0%) |
| College / Associate Degree | 293 (79.6%) | 6 (1.7%) |
| Bachelor's Degree or higher | 110 (88.7%) | 0 (0.0%) |
| Total | 750 (77.3%) | 18 (1.9%) |
Employment Occupations by Sex in Greentown
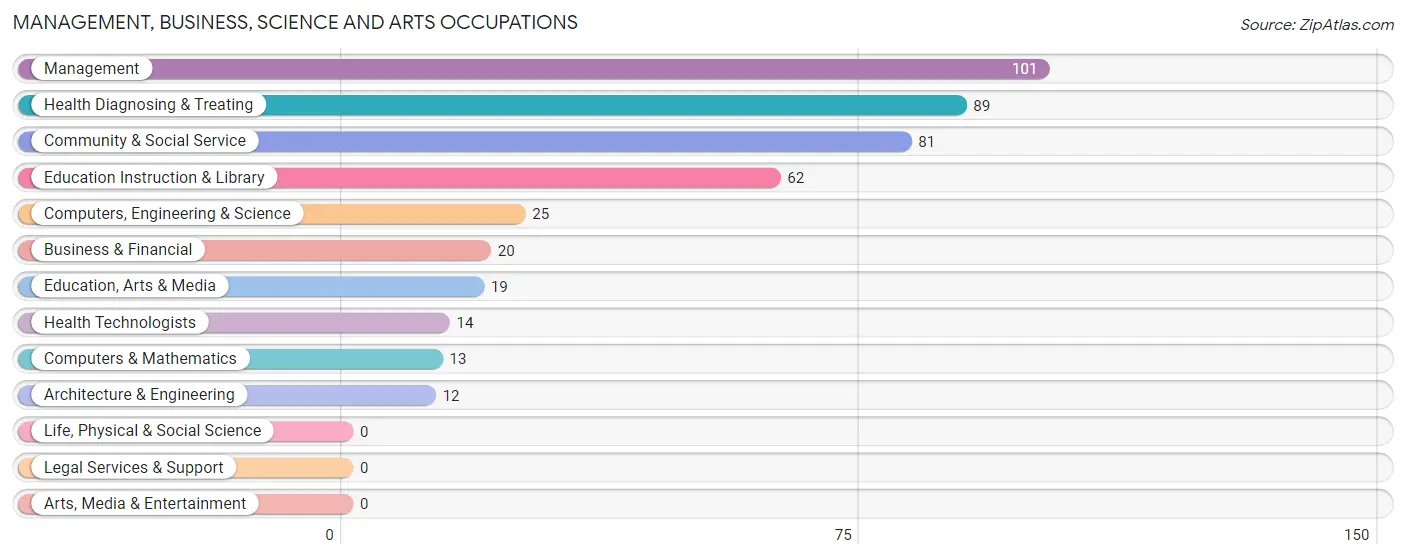
Management, Business, Science and Arts Occupations
The most common Management, Business, Science and Arts occupations in Greentown are Management (101 | 10.4%), Health Diagnosing & Treating (89 | 9.1%), Community & Social Service (81 | 8.3%), Education Instruction & Library (62 | 6.4%), and Computers, Engineering & Science (25 | 2.6%).
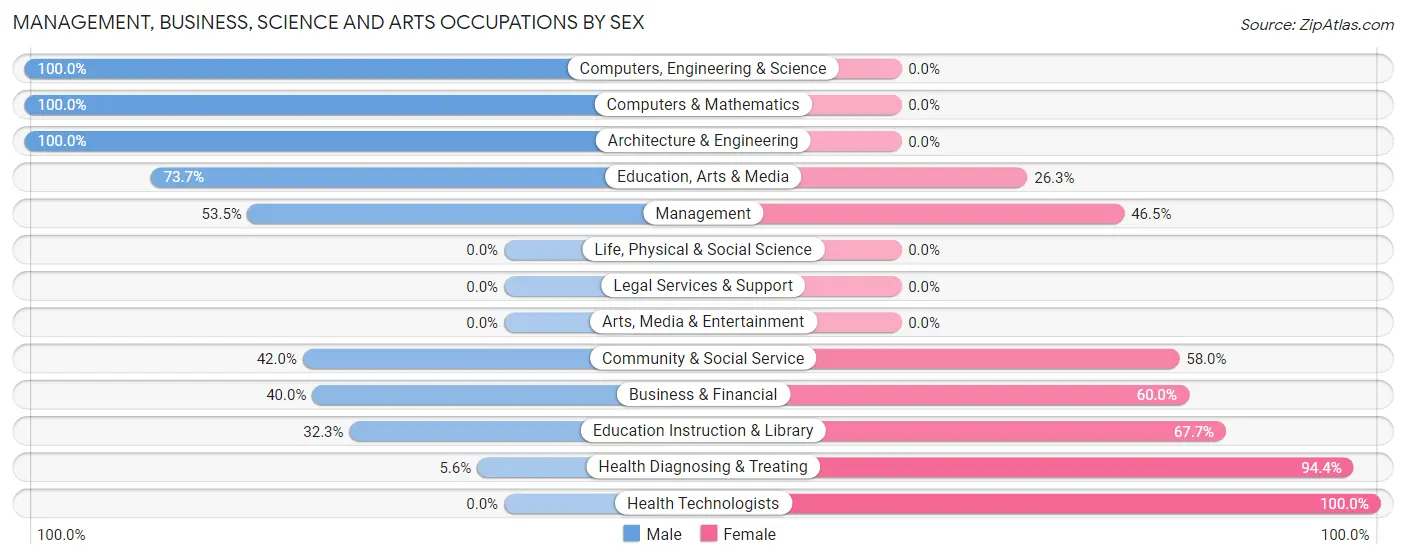
Management, Business, Science and Arts Occupations by Sex
Within the Management, Business, Science and Arts occupations in Greentown, the most male-oriented occupations are Computers, Engineering & Science (100.0%), Computers & Mathematics (100.0%), and Architecture & Engineering (100.0%), while the most female-oriented occupations are Health Technologists (100.0%), Health Diagnosing & Treating (94.4%), and Education Instruction & Library (67.7%).
| Occupation | Male | Female |
| Management | 54 (53.5%) | 47 (46.5%) |
| Business & Financial | 8 (40.0%) | 12 (60.0%) |
| Computers, Engineering & Science | 25 (100.0%) | 0 (0.0%) |
| Computers & Mathematics | 13 (100.0%) | 0 (0.0%) |
| Architecture & Engineering | 12 (100.0%) | 0 (0.0%) |
| Life, Physical & Social Science | 0 (0.0%) | 0 (0.0%) |
| Community & Social Service | 34 (42.0%) | 47 (58.0%) |
| Education, Arts & Media | 14 (73.7%) | 5 (26.3%) |
| Legal Services & Support | 0 (0.0%) | 0 (0.0%) |
| Education Instruction & Library | 20 (32.3%) | 42 (67.7%) |
| Arts, Media & Entertainment | 0 (0.0%) | 0 (0.0%) |
| Health Diagnosing & Treating | 5 (5.6%) | 84 (94.4%) |
| Health Technologists | 0 (0.0%) | 14 (100.0%) |
| Total (Category) | 126 (39.9%) | 190 (60.1%) |
| Total (Overall) | 478 (49.1%) | 495 (50.9%) |
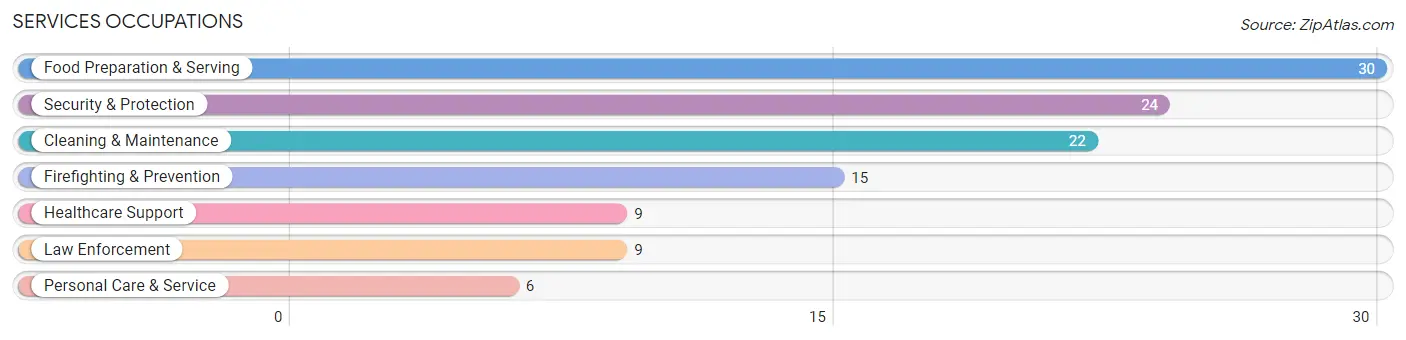
Services Occupations
The most common Services occupations in Greentown are Food Preparation & Serving (30 | 3.1%), Security & Protection (24 | 2.5%), Cleaning & Maintenance (22 | 2.3%), Firefighting & Prevention (15 | 1.5%), and Healthcare Support (9 | 0.9%).
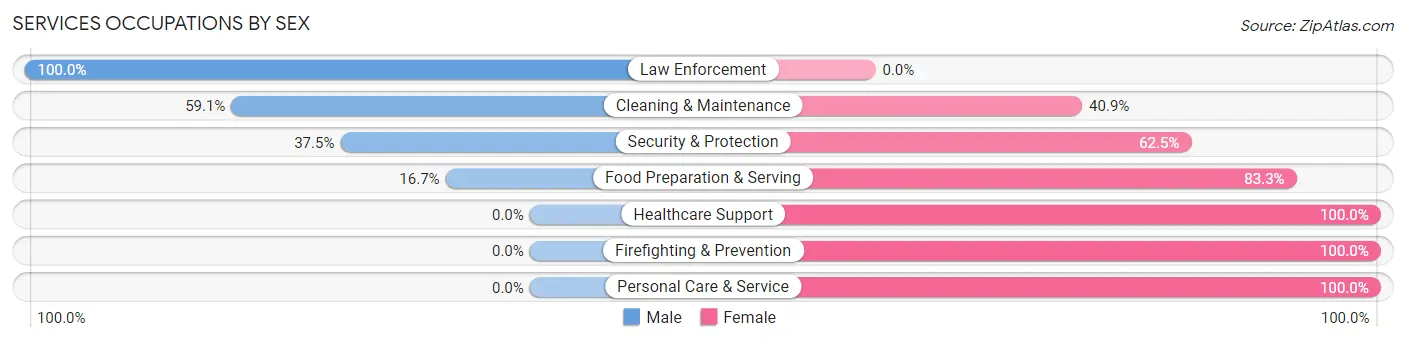
Services Occupations by Sex
Within the Services occupations in Greentown, the most male-oriented occupations are Law Enforcement (100.0%), Cleaning & Maintenance (59.1%), and Security & Protection (37.5%), while the most female-oriented occupations are Healthcare Support (100.0%), Firefighting & Prevention (100.0%), and Personal Care & Service (100.0%).
| Occupation | Male | Female |
| Healthcare Support | 0 (0.0%) | 9 (100.0%) |
| Security & Protection | 9 (37.5%) | 15 (62.5%) |
| Firefighting & Prevention | 0 (0.0%) | 15 (100.0%) |
| Law Enforcement | 9 (100.0%) | 0 (0.0%) |
| Food Preparation & Serving | 5 (16.7%) | 25 (83.3%) |
| Cleaning & Maintenance | 13 (59.1%) | 9 (40.9%) |
| Personal Care & Service | 0 (0.0%) | 6 (100.0%) |
| Total (Category) | 27 (29.7%) | 64 (70.3%) |
| Total (Overall) | 478 (49.1%) | 495 (50.9%) |
Sales and Office Occupations
The most common Sales and Office occupations in Greentown are Office & Administration (105 | 10.8%), and Sales & Related (95 | 9.8%).
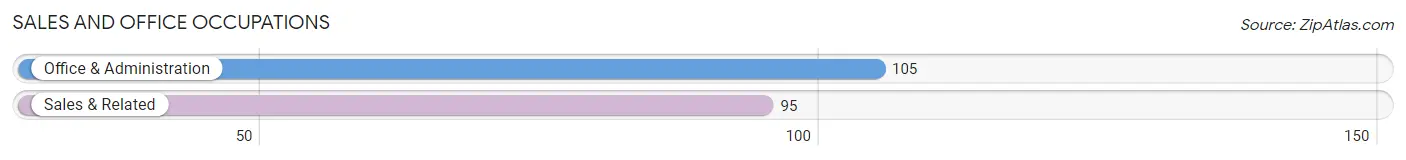
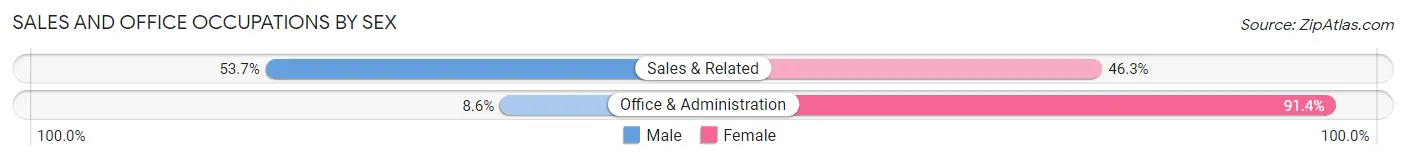
Sales and Office Occupations by Sex
| Occupation | Male | Female |
| Sales & Related | 51 (53.7%) | 44 (46.3%) |
| Office & Administration | 9 (8.6%) | 96 (91.4%) |
| Total (Category) | 60 (30.0%) | 140 (70.0%) |
| Total (Overall) | 478 (49.1%) | 495 (50.9%) |
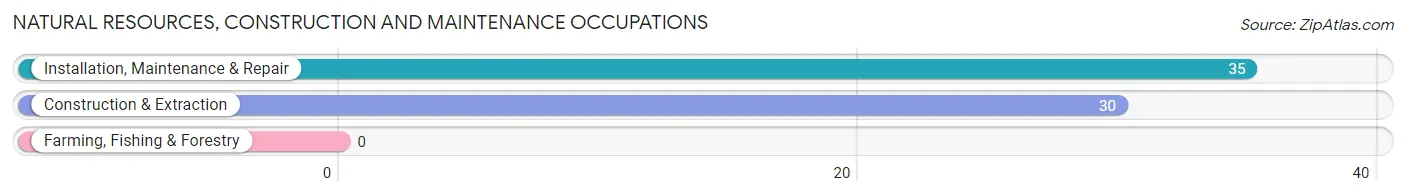
Natural Resources, Construction and Maintenance Occupations
The most common Natural Resources, Construction and Maintenance occupations in Greentown are Installation, Maintenance & Repair (35 | 3.6%), and Construction & Extraction (30 | 3.1%).
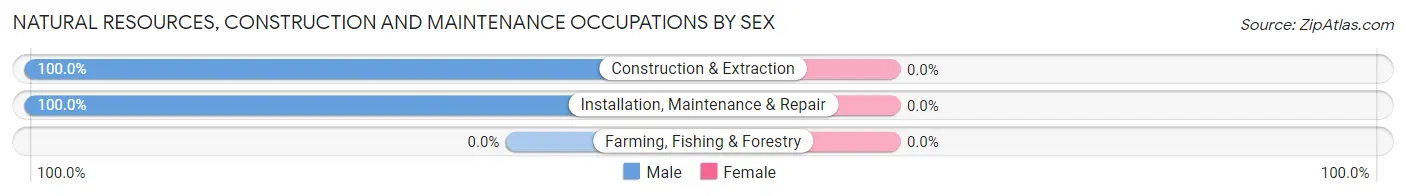
Natural Resources, Construction and Maintenance Occupations by Sex
| Occupation | Male | Female |
| Farming, Fishing & Forestry | 0 (0.0%) | 0 (0.0%) |
| Construction & Extraction | 30 (100.0%) | 0 (0.0%) |
| Installation, Maintenance & Repair | 35 (100.0%) | 0 (0.0%) |
| Total (Category) | 65 (100.0%) | 0 (0.0%) |
| Total (Overall) | 478 (49.1%) | 495 (50.9%) |
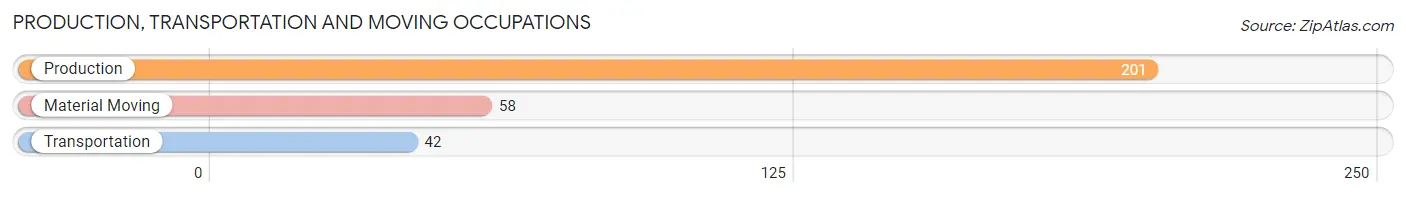
Production, Transportation and Moving Occupations
The most common Production, Transportation and Moving occupations in Greentown are Production (201 | 20.7%), Material Moving (58 | 6.0%), and Transportation (42 | 4.3%).
Production, Transportation and Moving Occupations by Sex
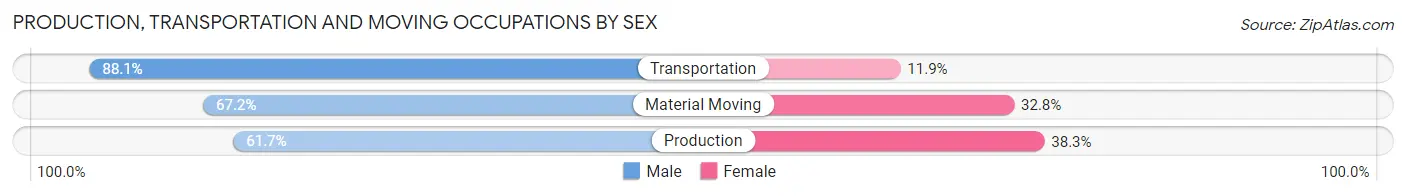
| Occupation | Male | Female |
| Production | 124 (61.7%) | 77 (38.3%) |
| Transportation | 37 (88.1%) | 5 (11.9%) |
| Material Moving | 39 (67.2%) | 19 (32.8%) |
| Total (Category) | 200 (66.4%) | 101 (33.6%) |
| Total (Overall) | 478 (49.1%) | 495 (50.9%) |
Employment Industries by Sex in Greentown
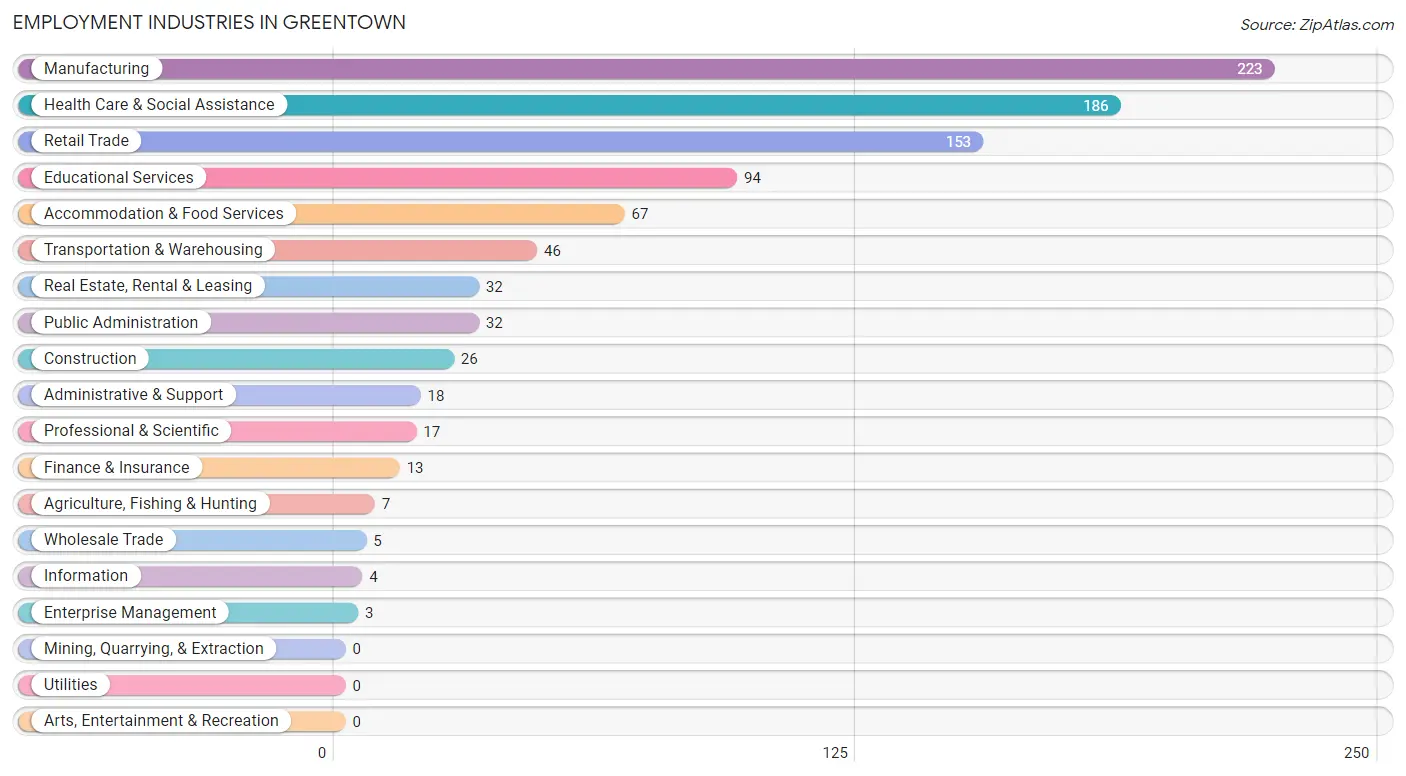
Employment Industries in Greentown
The major employment industries in Greentown include Manufacturing (223 | 22.9%), Health Care & Social Assistance (186 | 19.1%), Retail Trade (153 | 15.7%), Educational Services (94 | 9.7%), and Accommodation & Food Services (67 | 6.9%).
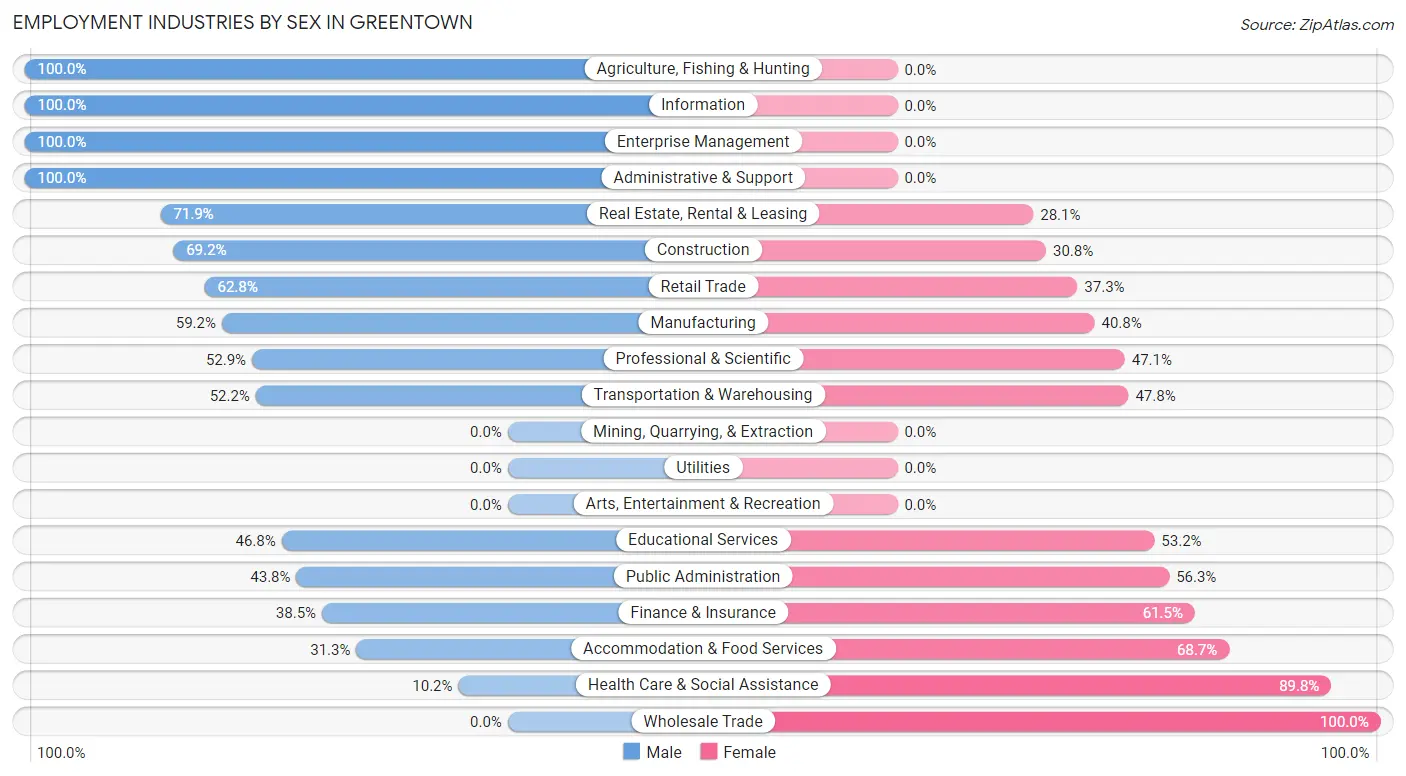
Employment Industries by Sex in Greentown
The Greentown industries that see more men than women are Agriculture, Fishing & Hunting (100.0%), Information (100.0%), and Enterprise Management (100.0%), whereas the industries that tend to have a higher number of women are Wholesale Trade (100.0%), Health Care & Social Assistance (89.8%), and Accommodation & Food Services (68.7%).
| Industry | Male | Female |
| Agriculture, Fishing & Hunting | 7 (100.0%) | 0 (0.0%) |
| Mining, Quarrying, & Extraction | 0 (0.0%) | 0 (0.0%) |
| Construction | 18 (69.2%) | 8 (30.8%) |
| Manufacturing | 132 (59.2%) | 91 (40.8%) |
| Wholesale Trade | 0 (0.0%) | 5 (100.0%) |
| Retail Trade | 96 (62.7%) | 57 (37.2%) |
| Transportation & Warehousing | 24 (52.2%) | 22 (47.8%) |
| Utilities | 0 (0.0%) | 0 (0.0%) |
| Information | 4 (100.0%) | 0 (0.0%) |
| Finance & Insurance | 5 (38.5%) | 8 (61.5%) |
| Real Estate, Rental & Leasing | 23 (71.9%) | 9 (28.1%) |
| Professional & Scientific | 9 (52.9%) | 8 (47.1%) |
| Enterprise Management | 3 (100.0%) | 0 (0.0%) |
| Administrative & Support | 18 (100.0%) | 0 (0.0%) |
| Educational Services | 44 (46.8%) | 50 (53.2%) |
| Health Care & Social Assistance | 19 (10.2%) | 167 (89.8%) |
| Arts, Entertainment & Recreation | 0 (0.0%) | 0 (0.0%) |
| Accommodation & Food Services | 21 (31.3%) | 46 (68.7%) |
| Public Administration | 14 (43.8%) | 18 (56.2%) |
| Total | 478 (49.1%) | 495 (50.9%) |
Education in Greentown
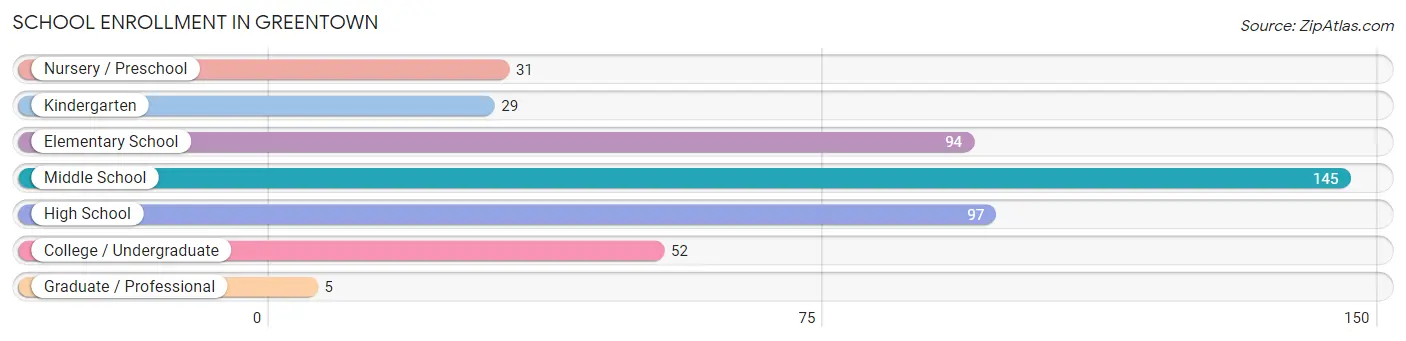
School Enrollment in Greentown
The most common levels of schooling among the 453 students in Greentown are middle school (145 | 32.0%), high school (97 | 21.4%), and elementary school (94 | 20.7%).
| School Level | # Students | % Students |
| Nursery / Preschool | 31 | 6.8% |
| Kindergarten | 29 | 6.4% |
| Elementary School | 94 | 20.7% |
| Middle School | 145 | 32.0% |
| High School | 97 | 21.4% |
| College / Undergraduate | 52 | 11.5% |
| Graduate / Professional | 5 | 1.1% |
| Total | 453 | 100.0% |
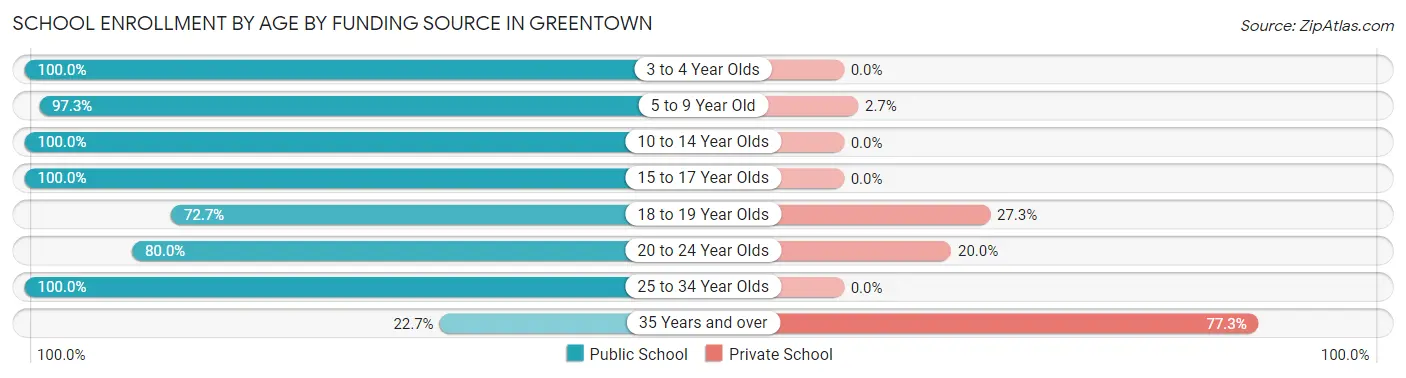
School Enrollment by Age by Funding Source in Greentown
Out of a total of 453 students who are enrolled in schools in Greentown, 27 (6.0%) attend a private institution, while the remaining 426 (94.0%) are enrolled in public schools. The age group of 35 years and over has the highest likelihood of being enrolled in private schools, with 17 (77.3% in the age bracket) enrolled. Conversely, the age group of 3 to 4 year olds has the lowest likelihood of being enrolled in a private school, with 22 (100.0% in the age bracket) attending a public institution.
| Age Bracket | Public School | Private School |
| 3 to 4 Year Olds | 22 (100.0%) | 0 (0.0%) |
| 5 to 9 Year Old | 109 (97.3%) | 3 (2.7%) |
| 10 to 14 Year Olds | 211 (100.0%) | 0 (0.0%) |
| 15 to 17 Year Olds | 46 (100.0%) | 0 (0.0%) |
| 18 to 19 Year Olds | 8 (72.7%) | 3 (27.3%) |
| 20 to 24 Year Olds | 16 (80.0%) | 4 (20.0%) |
| 25 to 34 Year Olds | 9 (100.0%) | 0 (0.0%) |
| 35 Years and over | 5 (22.7%) | 17 (77.3%) |
| Total | 426 (94.0%) | 27 (6.0%) |
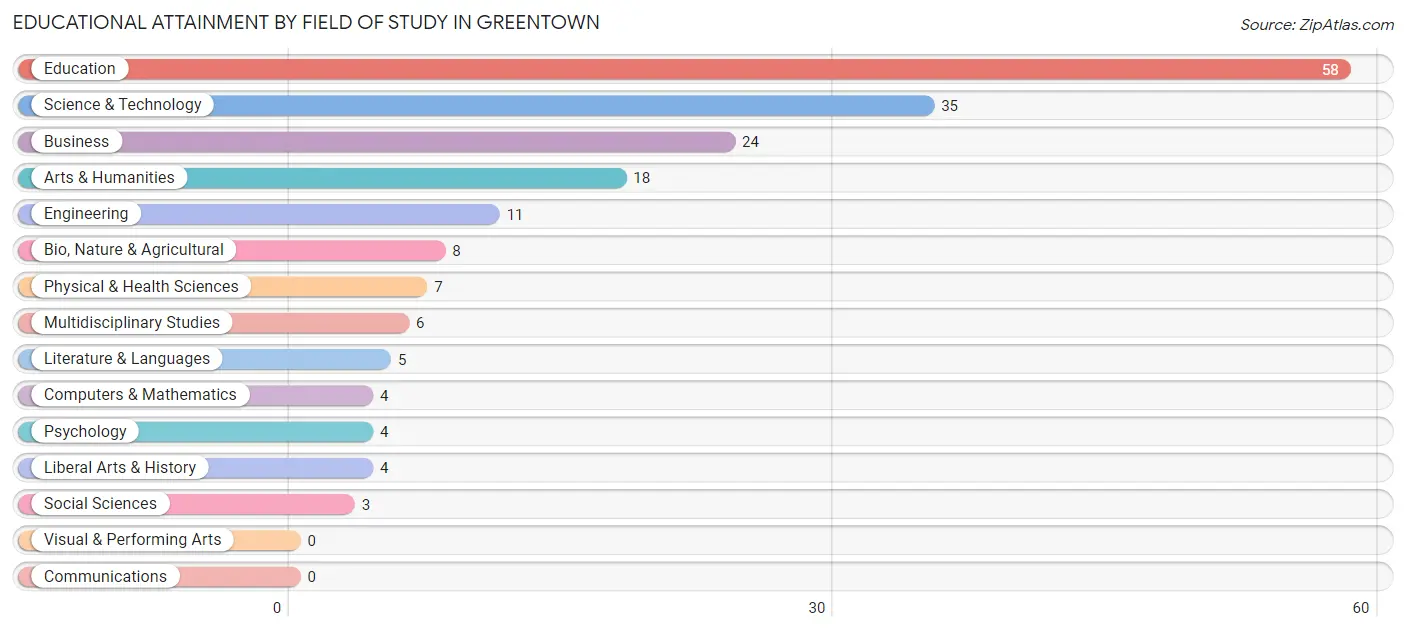
Educational Attainment by Field of Study in Greentown
Education (58 | 31.0%), science & technology (35 | 18.7%), business (24 | 12.8%), arts & humanities (18 | 9.6%), and engineering (11 | 5.9%) are the most common fields of study among 187 individuals in Greentown who have obtained a bachelor's degree or higher.
| Field of Study | # Graduates | % Graduates |
| Computers & Mathematics | 4 | 2.1% |
| Bio, Nature & Agricultural | 8 | 4.3% |
| Physical & Health Sciences | 7 | 3.7% |
| Psychology | 4 | 2.1% |
| Social Sciences | 3 | 1.6% |
| Engineering | 11 | 5.9% |
| Multidisciplinary Studies | 6 | 3.2% |
| Science & Technology | 35 | 18.7% |
| Business | 24 | 12.8% |
| Education | 58 | 31.0% |
| Literature & Languages | 5 | 2.7% |
| Liberal Arts & History | 4 | 2.1% |
| Visual & Performing Arts | 0 | 0.0% |
| Communications | 0 | 0.0% |
| Arts & Humanities | 18 | 9.6% |
| Total | 187 | 100.0% |
Transportation & Commute in Greentown
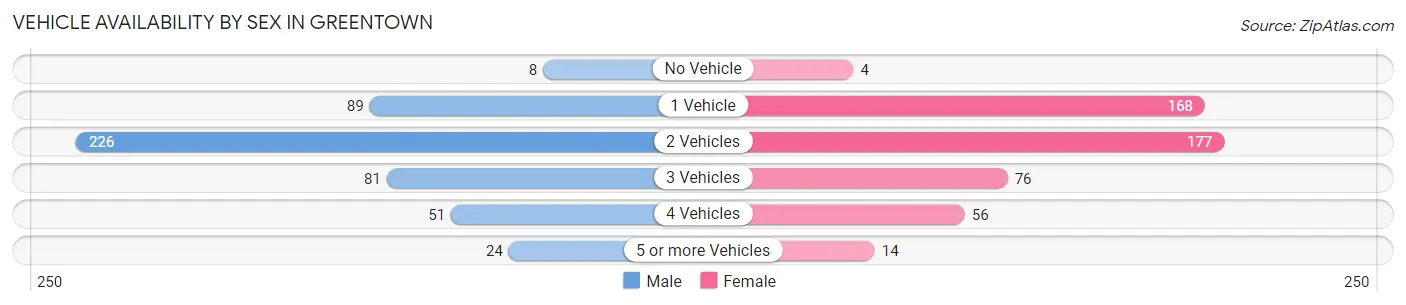
Vehicle Availability by Sex in Greentown
The most prevalent vehicle ownership categories in Greentown are males with 2 vehicles (226, accounting for 47.2%) and females with 2 vehicles (177, making up 45.7%).
| Vehicles Available | Male | Female |
| No Vehicle | 8 (1.7%) | 4 (0.8%) |
| 1 Vehicle | 89 (18.6%) | 168 (33.9%) |
| 2 Vehicles | 226 (47.2%) | 177 (35.8%) |
| 3 Vehicles | 81 (16.9%) | 76 (15.3%) |
| 4 Vehicles | 51 (10.6%) | 56 (11.3%) |
| 5 or more Vehicles | 24 (5.0%) | 14 (2.8%) |
| Total | 479 (100.0%) | 495 (100.0%) |
Commute Time in Greentown
The most frequently occuring commute durations in Greentown are 15 to 19 minutes (244 commuters, 26.4%), 20 to 24 minutes (205 commuters, 22.2%), and 25 to 29 minutes (118 commuters, 12.8%).
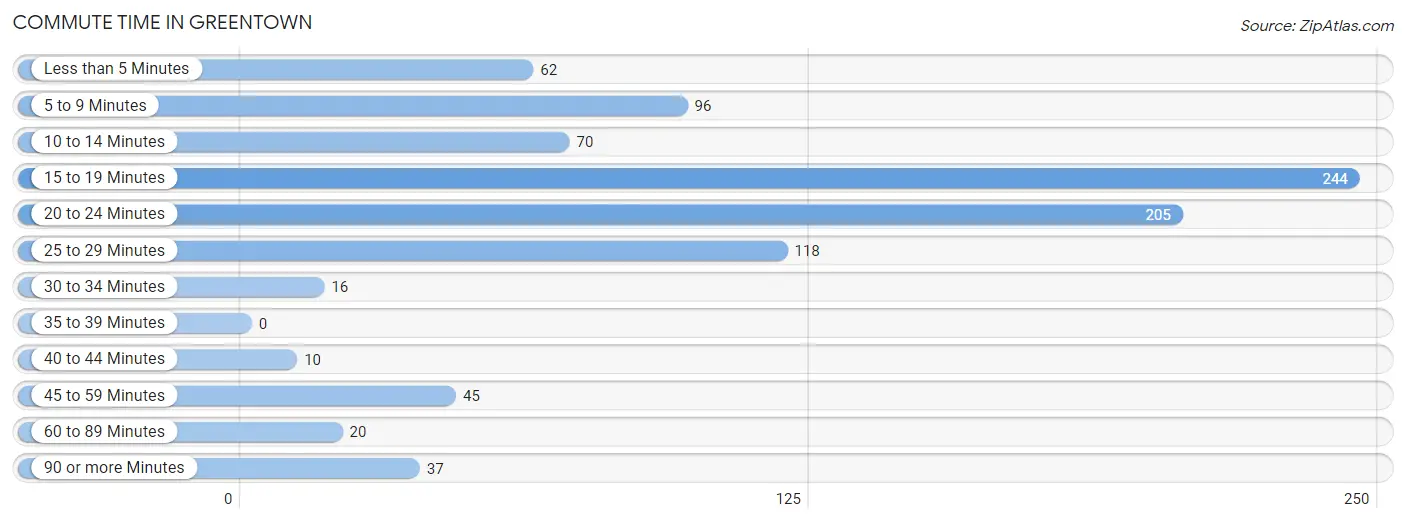
| Commute Time | # Commuters | % Commuters |
| Less than 5 Minutes | 62 | 6.7% |
| 5 to 9 Minutes | 96 | 10.4% |
| 10 to 14 Minutes | 70 | 7.6% |
| 15 to 19 Minutes | 244 | 26.4% |
| 20 to 24 Minutes | 205 | 22.2% |
| 25 to 29 Minutes | 118 | 12.8% |
| 30 to 34 Minutes | 16 | 1.7% |
| 35 to 39 Minutes | 0 | 0.0% |
| 40 to 44 Minutes | 10 | 1.1% |
| 45 to 59 Minutes | 45 | 4.9% |
| 60 to 89 Minutes | 20 | 2.2% |
| 90 or more Minutes | 37 | 4.0% |
Commute Time by Sex in Greentown
The most common commute times in Greentown are 15 to 19 minutes (158 commuters, 34.6%) for males and 20 to 24 minutes (137 commuters, 29.4%) for females.
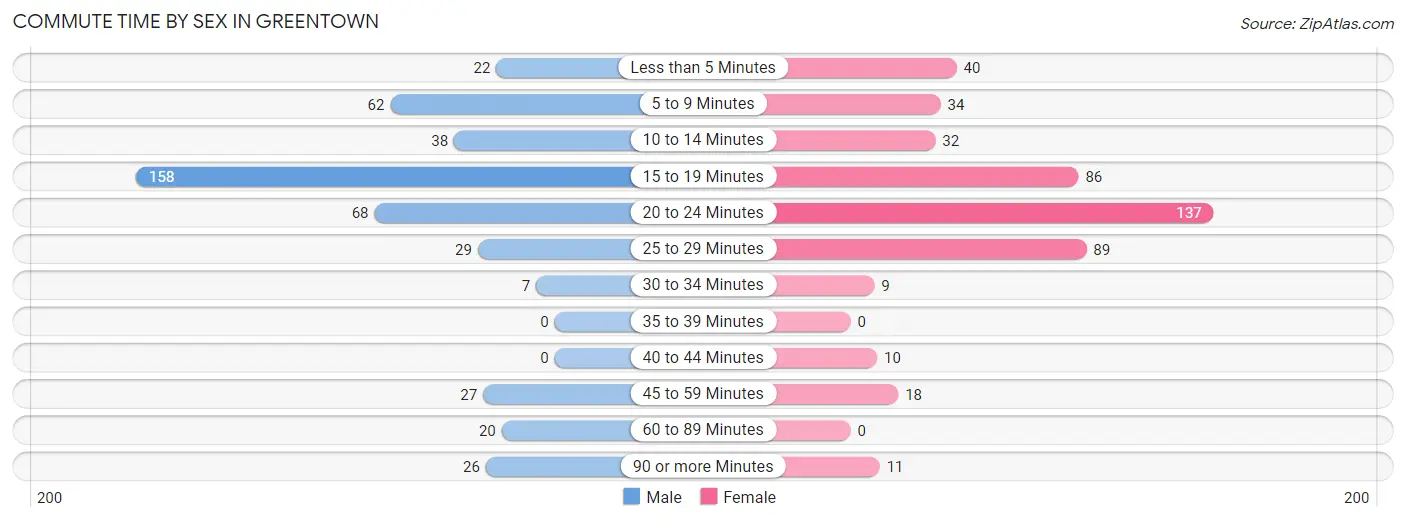
| Commute Time | Male | Female |
| Less than 5 Minutes | 22 (4.8%) | 40 (8.6%) |
| 5 to 9 Minutes | 62 (13.6%) | 34 (7.3%) |
| 10 to 14 Minutes | 38 (8.3%) | 32 (6.9%) |
| 15 to 19 Minutes | 158 (34.6%) | 86 (18.4%) |
| 20 to 24 Minutes | 68 (14.9%) | 137 (29.4%) |
| 25 to 29 Minutes | 29 (6.4%) | 89 (19.1%) |
| 30 to 34 Minutes | 7 (1.5%) | 9 (1.9%) |
| 35 to 39 Minutes | 0 (0.0%) | 0 (0.0%) |
| 40 to 44 Minutes | 0 (0.0%) | 10 (2.1%) |
| 45 to 59 Minutes | 27 (5.9%) | 18 (3.9%) |
| 60 to 89 Minutes | 20 (4.4%) | 0 (0.0%) |
| 90 or more Minutes | 26 (5.7%) | 11 (2.4%) |
Time of Departure to Work by Sex in Greentown
The most frequent times of departure to work in Greentown are 4:00 PM to 11:59 PM (81, 17.7%) for males and 12:00 PM to 3:59 PM (102, 21.9%) for females.
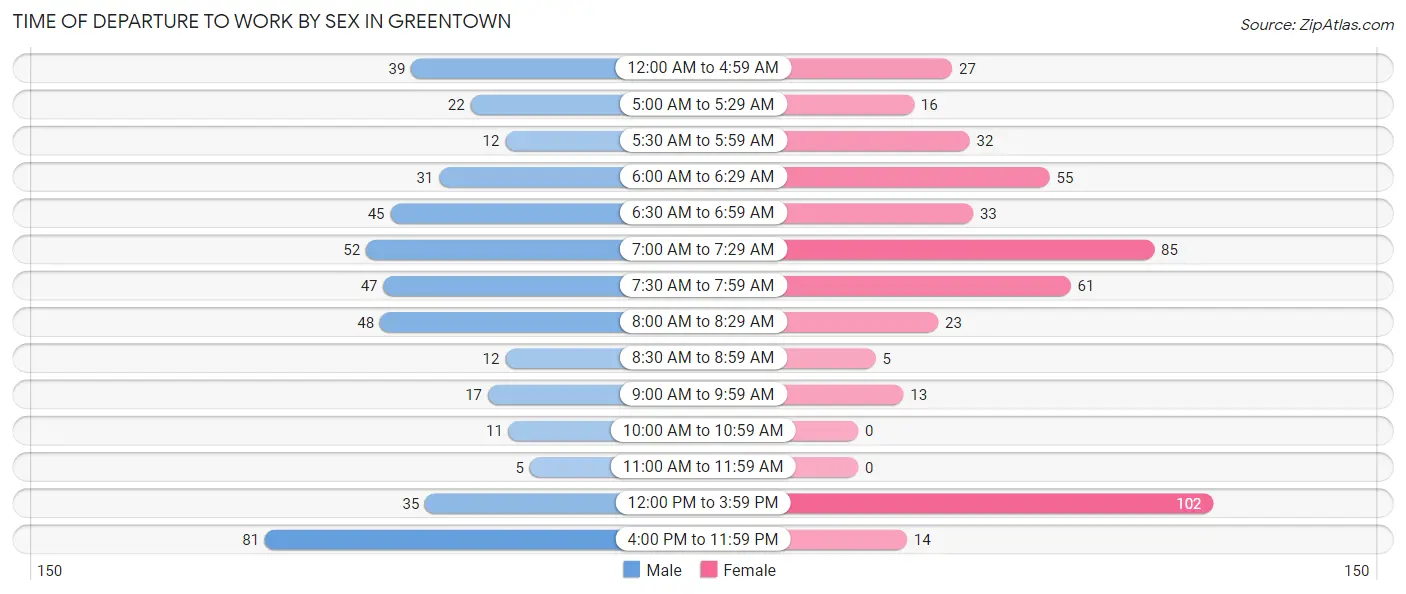
| Time of Departure | Male | Female |
| 12:00 AM to 4:59 AM | 39 (8.5%) | 27 (5.8%) |
| 5:00 AM to 5:29 AM | 22 (4.8%) | 16 (3.4%) |
| 5:30 AM to 5:59 AM | 12 (2.6%) | 32 (6.9%) |
| 6:00 AM to 6:29 AM | 31 (6.8%) | 55 (11.8%) |
| 6:30 AM to 6:59 AM | 45 (9.9%) | 33 (7.1%) |
| 7:00 AM to 7:29 AM | 52 (11.4%) | 85 (18.2%) |
| 7:30 AM to 7:59 AM | 47 (10.3%) | 61 (13.1%) |
| 8:00 AM to 8:29 AM | 48 (10.5%) | 23 (4.9%) |
| 8:30 AM to 8:59 AM | 12 (2.6%) | 5 (1.1%) |
| 9:00 AM to 9:59 AM | 17 (3.7%) | 13 (2.8%) |
| 10:00 AM to 10:59 AM | 11 (2.4%) | 0 (0.0%) |
| 11:00 AM to 11:59 AM | 5 (1.1%) | 0 (0.0%) |
| 12:00 PM to 3:59 PM | 35 (7.7%) | 102 (21.9%) |
| 4:00 PM to 11:59 PM | 81 (17.7%) | 14 (3.0%) |
| Total | 457 (100.0%) | 466 (100.0%) |
Housing Occupancy in Greentown
Occupancy by Ownership in Greentown
Of the total 825 dwellings in Greentown, owner-occupied units account for 644 (78.1%), while renter-occupied units make up 181 (21.9%).
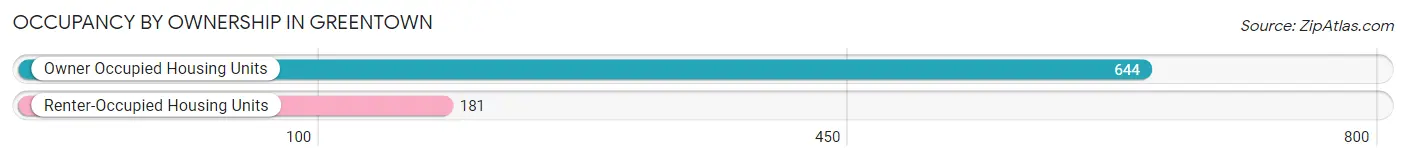
| Occupancy | # Housing Units | % Housing Units |
| Owner Occupied Housing Units | 644 | 78.1% |
| Renter-Occupied Housing Units | 181 | 21.9% |
| Total Occupied Housing Units | 825 | 100.0% |
Occupancy by Household Size in Greentown
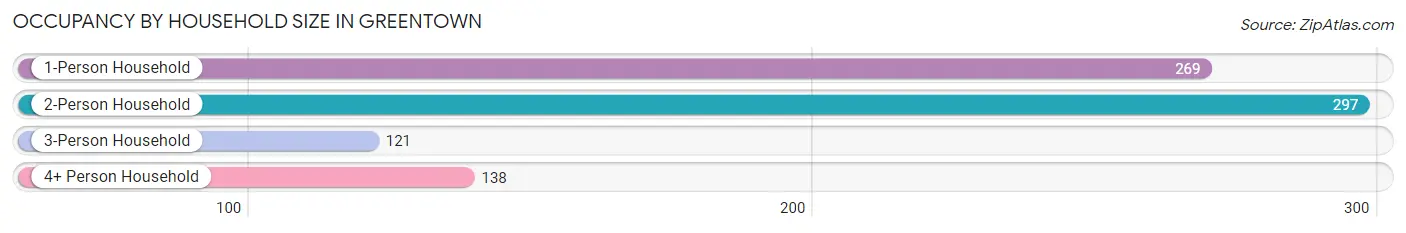
| Household Size | # Housing Units | % Housing Units |
| 1-Person Household | 269 | 32.6% |
| 2-Person Household | 297 | 36.0% |
| 3-Person Household | 121 | 14.7% |
| 4+ Person Household | 138 | 16.7% |
| Total Housing Units | 825 | 100.0% |
Occupancy by Ownership by Household Size in Greentown
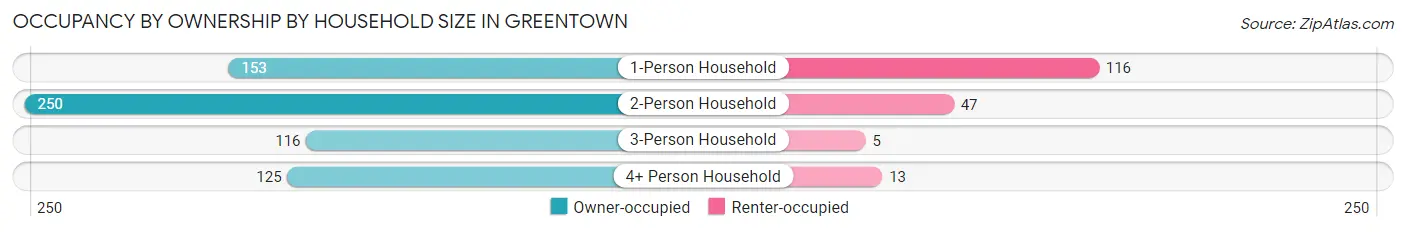
| Household Size | Owner-occupied | Renter-occupied |
| 1-Person Household | 153 (56.9%) | 116 (43.1%) |
| 2-Person Household | 250 (84.2%) | 47 (15.8%) |
| 3-Person Household | 116 (95.9%) | 5 (4.1%) |
| 4+ Person Household | 125 (90.6%) | 13 (9.4%) |
| Total Housing Units | 644 (78.1%) | 181 (21.9%) |
Occupancy by Educational Attainment in Greentown
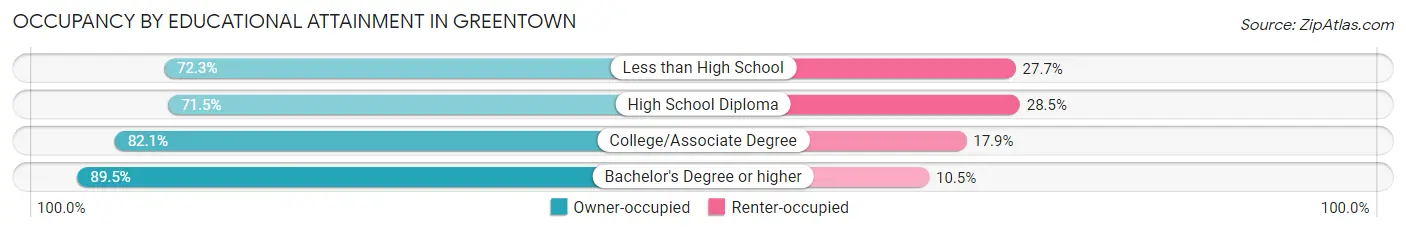
| Household Size | Owner-occupied | Renter-occupied |
| Less than High School | 68 (72.3%) | 26 (27.7%) |
| High School Diploma | 226 (71.5%) | 90 (28.5%) |
| College/Associate Degree | 239 (82.1%) | 52 (17.9%) |
| Bachelor's Degree or higher | 111 (89.5%) | 13 (10.5%) |
Occupancy by Age of Householder in Greentown
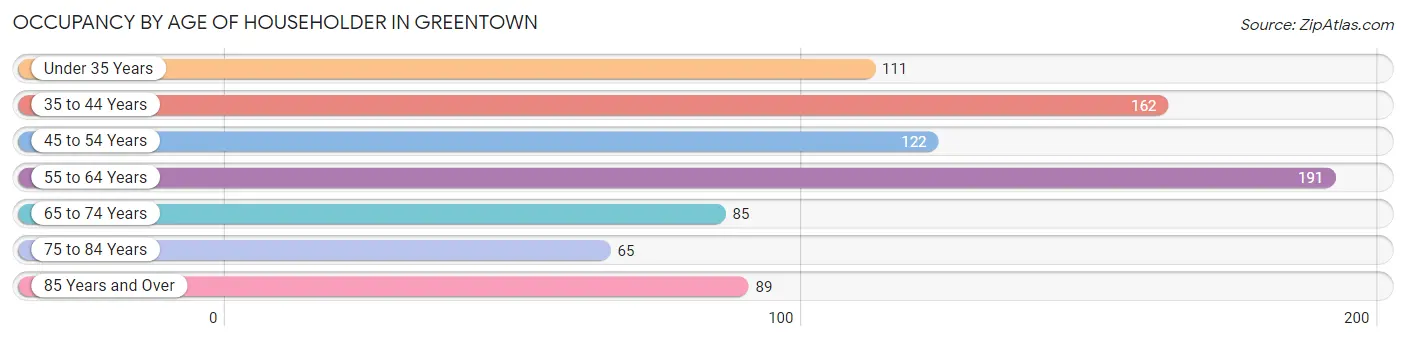
| Age Bracket | # Households | % Households |
| Under 35 Years | 111 | 13.5% |
| 35 to 44 Years | 162 | 19.6% |
| 45 to 54 Years | 122 | 14.8% |
| 55 to 64 Years | 191 | 23.2% |
| 65 to 74 Years | 85 | 10.3% |
| 75 to 84 Years | 65 | 7.9% |
| 85 Years and Over | 89 | 10.8% |
| Total | 825 | 100.0% |
Housing Finances in Greentown
Median Income by Occupancy in Greentown
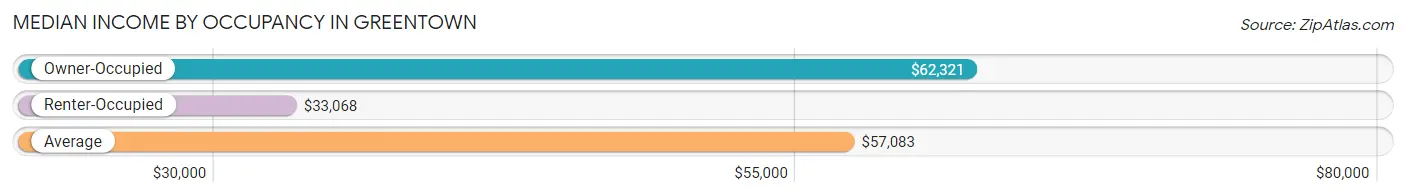
| Occupancy Type | # Households | Median Income |
| Owner-Occupied | 644 (78.1%) | $62,321 |
| Renter-Occupied | 181 (21.9%) | $33,068 |
| Average | 825 (100.0%) | $57,083 |
Occupancy by Householder Income Bracket in Greentown
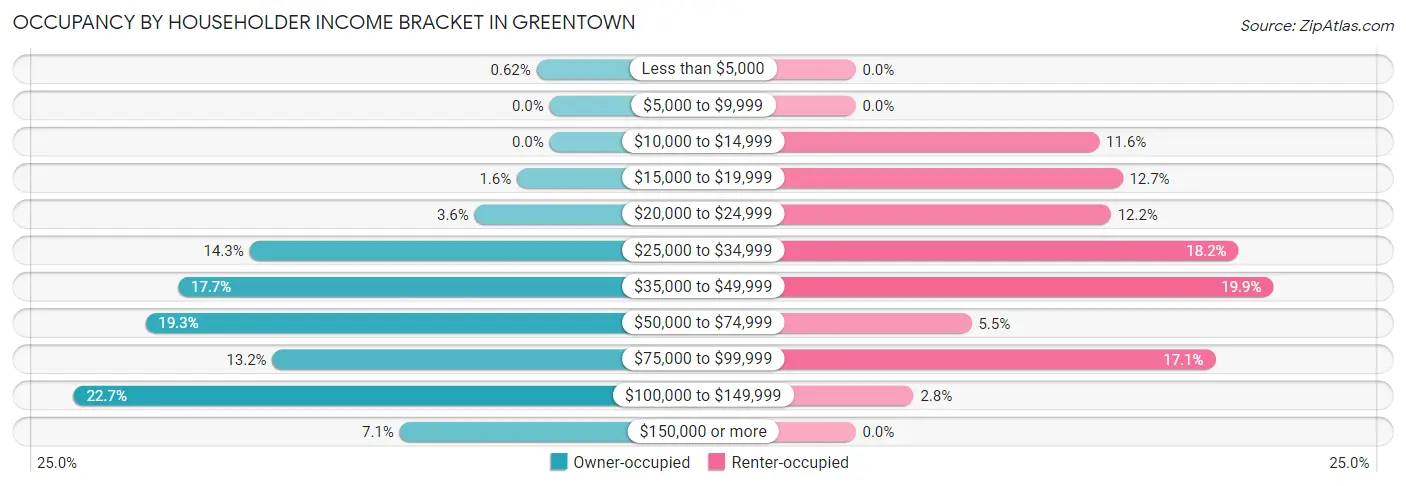
| Income Bracket | Owner-occupied | Renter-occupied |
| Less than $5,000 | 4 (0.6%) | 0 (0.0%) |
| $5,000 to $9,999 | 0 (0.0%) | 0 (0.0%) |
| $10,000 to $14,999 | 0 (0.0%) | 21 (11.6%) |
| $15,000 to $19,999 | 10 (1.5%) | 23 (12.7%) |
| $20,000 to $24,999 | 23 (3.6%) | 22 (12.1%) |
| $25,000 to $34,999 | 92 (14.3%) | 33 (18.2%) |
| $35,000 to $49,999 | 114 (17.7%) | 36 (19.9%) |
| $50,000 to $74,999 | 124 (19.3%) | 10 (5.5%) |
| $75,000 to $99,999 | 85 (13.2%) | 31 (17.1%) |
| $100,000 to $149,999 | 146 (22.7%) | 5 (2.8%) |
| $150,000 or more | 46 (7.1%) | 0 (0.0%) |
| Total | 644 (100.0%) | 181 (100.0%) |
Monthly Housing Cost Tiers in Greentown
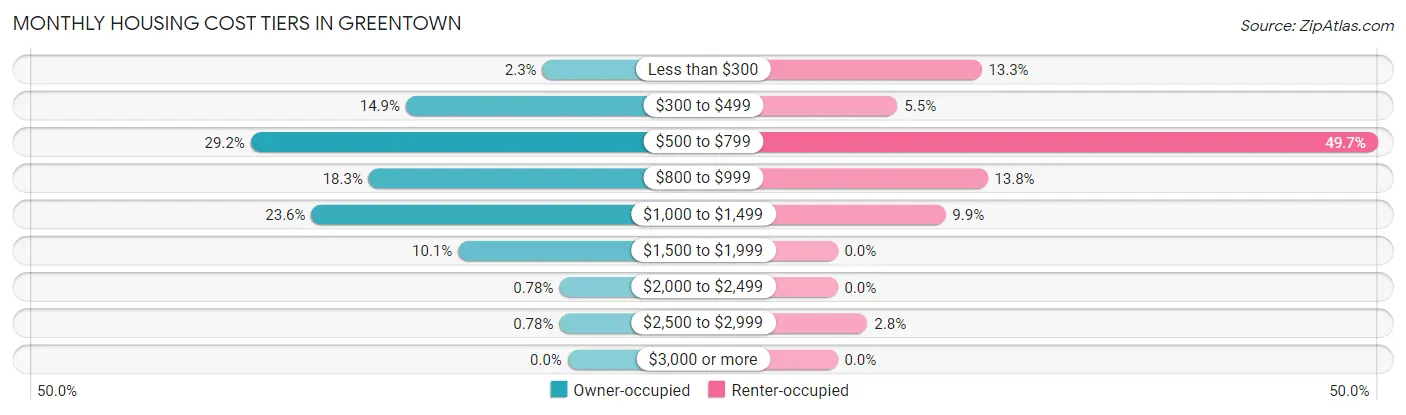
| Monthly Cost | Owner-occupied | Renter-occupied |
| Less than $300 | 15 (2.3%) | 24 (13.3%) |
| $300 to $499 | 96 (14.9%) | 10 (5.5%) |
| $500 to $799 | 188 (29.2%) | 90 (49.7%) |
| $800 to $999 | 118 (18.3%) | 25 (13.8%) |
| $1,000 to $1,499 | 152 (23.6%) | 18 (9.9%) |
| $1,500 to $1,999 | 65 (10.1%) | 0 (0.0%) |
| $2,000 to $2,499 | 5 (0.8%) | 0 (0.0%) |
| $2,500 to $2,999 | 5 (0.8%) | 5 (2.8%) |
| $3,000 or more | 0 (0.0%) | 0 (0.0%) |
| Total | 644 (100.0%) | 181 (100.0%) |
Physical Housing Characteristics in Greentown
Housing Structures in Greentown
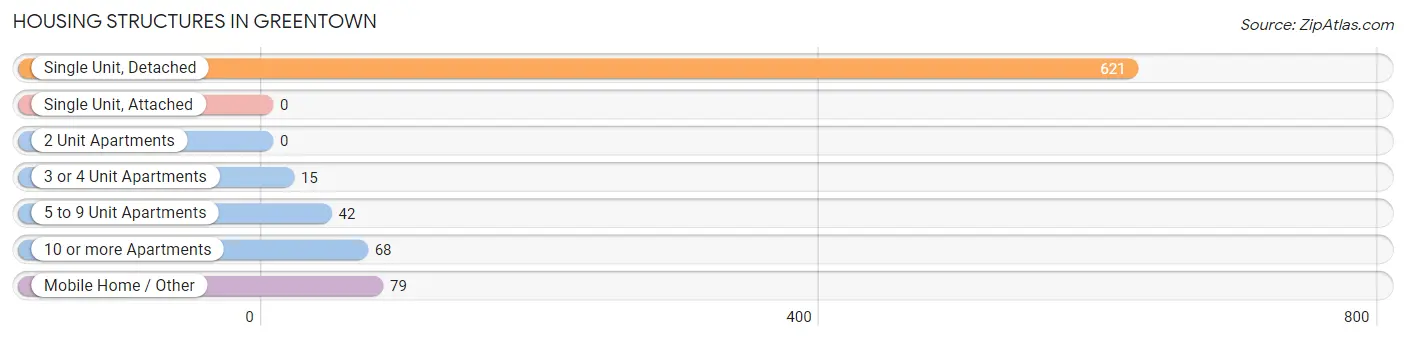
| Structure Type | # Housing Units | % Housing Units |
| Single Unit, Detached | 621 | 75.3% |
| Single Unit, Attached | 0 | 0.0% |
| 2 Unit Apartments | 0 | 0.0% |
| 3 or 4 Unit Apartments | 15 | 1.8% |
| 5 to 9 Unit Apartments | 42 | 5.1% |
| 10 or more Apartments | 68 | 8.2% |
| Mobile Home / Other | 79 | 9.6% |
| Total | 825 | 100.0% |
Housing Structures by Occupancy in Greentown
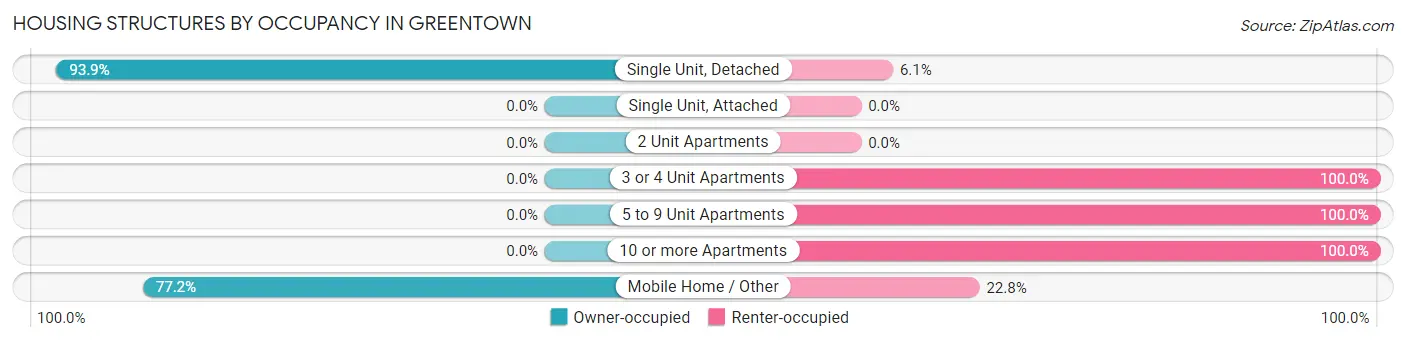
| Structure Type | Owner-occupied | Renter-occupied |
| Single Unit, Detached | 583 (93.9%) | 38 (6.1%) |
| Single Unit, Attached | 0 (0.0%) | 0 (0.0%) |
| 2 Unit Apartments | 0 (0.0%) | 0 (0.0%) |
| 3 or 4 Unit Apartments | 0 (0.0%) | 15 (100.0%) |
| 5 to 9 Unit Apartments | 0 (0.0%) | 42 (100.0%) |
| 10 or more Apartments | 0 (0.0%) | 68 (100.0%) |
| Mobile Home / Other | 61 (77.2%) | 18 (22.8%) |
| Total | 644 (78.1%) | 181 (21.9%) |
Housing Structures by Number of Rooms in Greentown
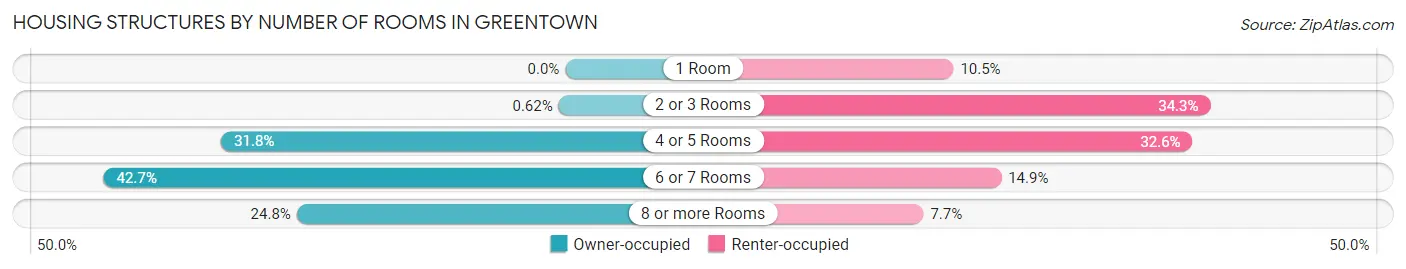
| Number of Rooms | Owner-occupied | Renter-occupied |
| 1 Room | 0 (0.0%) | 19 (10.5%) |
| 2 or 3 Rooms | 4 (0.6%) | 62 (34.3%) |
| 4 or 5 Rooms | 205 (31.8%) | 59 (32.6%) |
| 6 or 7 Rooms | 275 (42.7%) | 27 (14.9%) |
| 8 or more Rooms | 160 (24.8%) | 14 (7.7%) |
| Total | 644 (100.0%) | 181 (100.0%) |
Housing Structure by Heating Type in Greentown
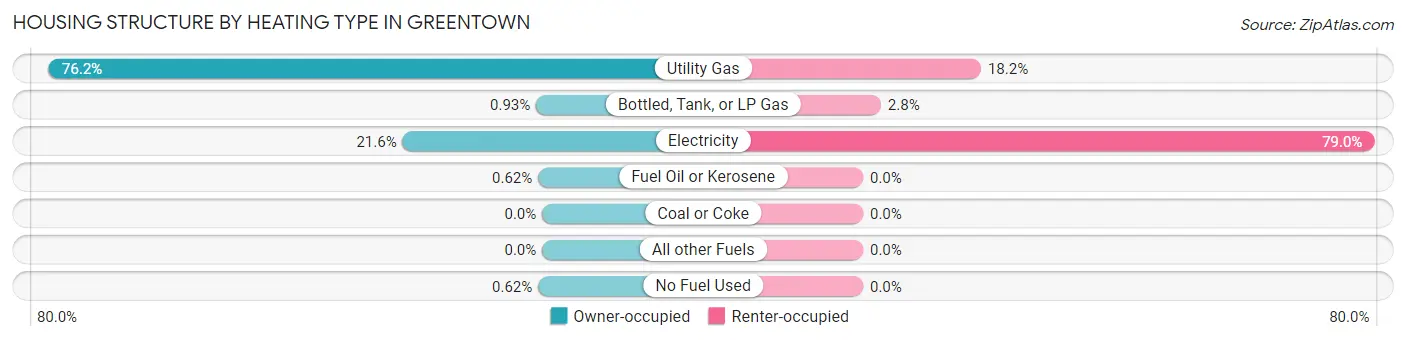
| Heating Type | Owner-occupied | Renter-occupied |
| Utility Gas | 491 (76.2%) | 33 (18.2%) |
| Bottled, Tank, or LP Gas | 6 (0.9%) | 5 (2.8%) |
| Electricity | 139 (21.6%) | 143 (79.0%) |
| Fuel Oil or Kerosene | 4 (0.6%) | 0 (0.0%) |
| Coal or Coke | 0 (0.0%) | 0 (0.0%) |
| All other Fuels | 0 (0.0%) | 0 (0.0%) |
| No Fuel Used | 4 (0.6%) | 0 (0.0%) |
| Total | 644 (100.0%) | 181 (100.0%) |
Household Vehicle Usage in Greentown
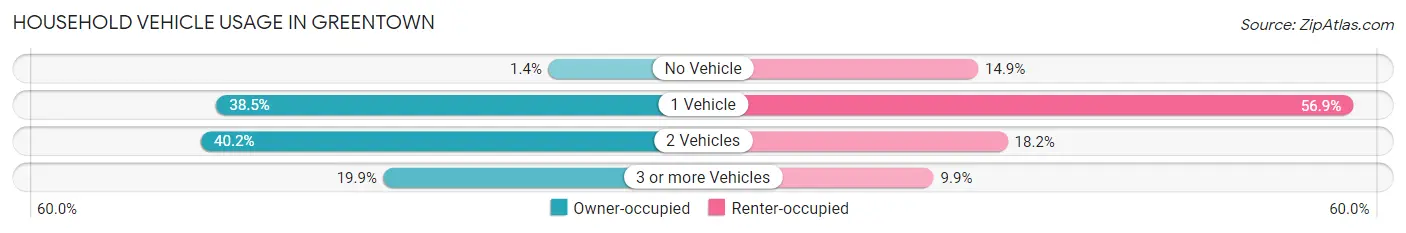
| Vehicles per Household | Owner-occupied | Renter-occupied |
| No Vehicle | 9 (1.4%) | 27 (14.9%) |
| 1 Vehicle | 248 (38.5%) | 103 (56.9%) |
| 2 Vehicles | 259 (40.2%) | 33 (18.2%) |
| 3 or more Vehicles | 128 (19.9%) | 18 (9.9%) |
| Total | 644 (100.0%) | 181 (100.0%) |
Real Estate & Mortgages in Greentown
Real Estate and Mortgage Overview in Greentown
| Characteristic | Without Mortgage | With Mortgage |
| Housing Units | 228 | 416 |
| Median Property Value | $96,200 | $117,900 |
| Median Household Income | $66,000 | $38 |
| Monthly Housing Costs | $507 | $0 |
| Real Estate Taxes | $662 | $5 |
Property Value by Mortgage Status in Greentown
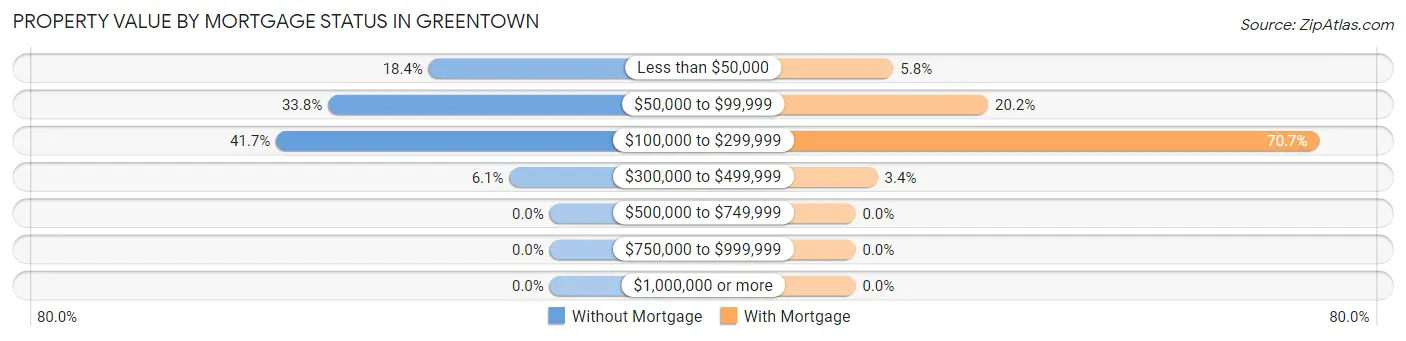
| Property Value | Without Mortgage | With Mortgage |
| Less than $50,000 | 42 (18.4%) | 24 (5.8%) |
| $50,000 to $99,999 | 77 (33.8%) | 84 (20.2%) |
| $100,000 to $299,999 | 95 (41.7%) | 294 (70.7%) |
| $300,000 to $499,999 | 14 (6.1%) | 14 (3.4%) |
| $500,000 to $749,999 | 0 (0.0%) | 0 (0.0%) |
| $750,000 to $999,999 | 0 (0.0%) | 0 (0.0%) |
| $1,000,000 or more | 0 (0.0%) | 0 (0.0%) |
| Total | 228 (100.0%) | 416 (100.0%) |
Household Income by Mortgage Status in Greentown
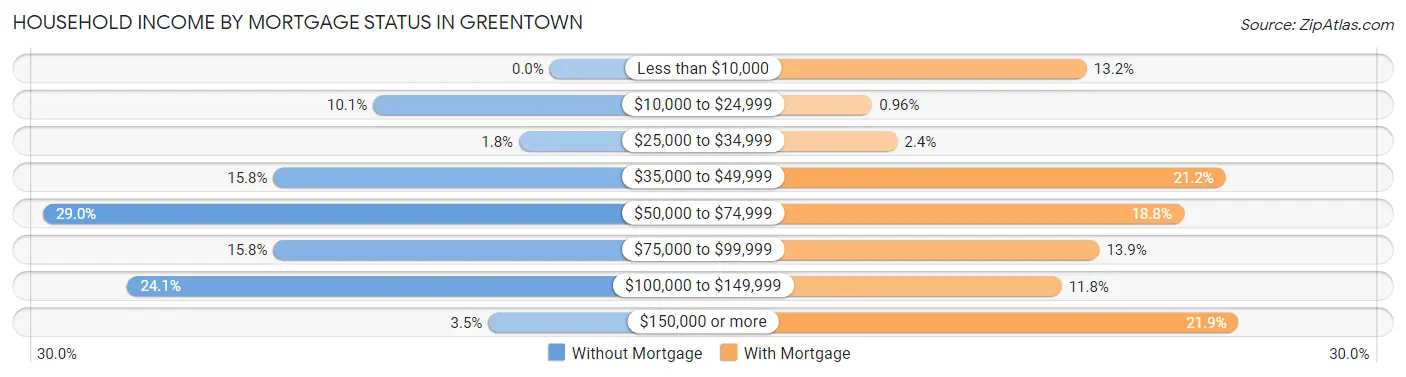
| Household Income | Without Mortgage | With Mortgage |
| Less than $10,000 | 0 (0.0%) | 55 (13.2%) |
| $10,000 to $24,999 | 23 (10.1%) | 4 (1.0%) |
| $25,000 to $34,999 | 4 (1.8%) | 10 (2.4%) |
| $35,000 to $49,999 | 36 (15.8%) | 88 (21.1%) |
| $50,000 to $74,999 | 66 (28.9%) | 78 (18.8%) |
| $75,000 to $99,999 | 36 (15.8%) | 58 (13.9%) |
| $100,000 to $149,999 | 55 (24.1%) | 49 (11.8%) |
| $150,000 or more | 8 (3.5%) | 91 (21.9%) |
| Total | 228 (100.0%) | 416 (100.0%) |
Property Value to Household Income Ratio in Greentown
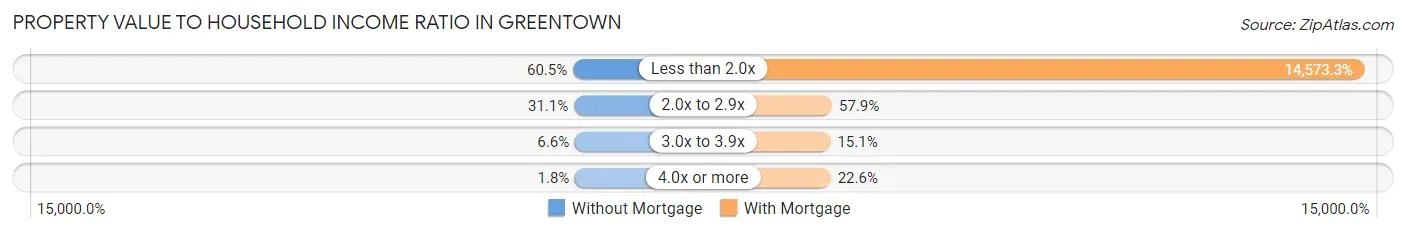
| Value-to-Income Ratio | Without Mortgage | With Mortgage |
| Less than 2.0x | 138 (60.5%) | 60,625 (14,573.3%) |
| 2.0x to 2.9x | 71 (31.1%) | 241 (57.9%) |
| 3.0x to 3.9x | 15 (6.6%) | 63 (15.1%) |
| 4.0x or more | 4 (1.8%) | 94 (22.6%) |
| Total | 228 (100.0%) | 416 (100.0%) |
Real Estate Taxes by Mortgage Status in Greentown
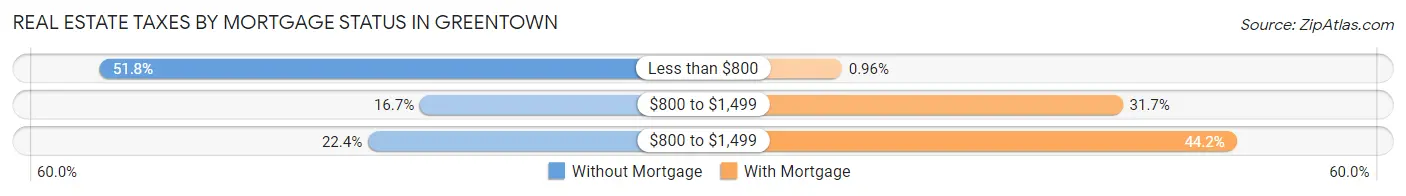
| Property Taxes | Without Mortgage | With Mortgage |
| Less than $800 | 118 (51.7%) | 4 (1.0%) |
| $800 to $1,499 | 38 (16.7%) | 132 (31.7%) |
| $800 to $1,499 | 51 (22.4%) | 184 (44.2%) |
| Total | 228 (100.0%) | 416 (100.0%) |
Health & Disability in Greentown
Health Insurance Coverage by Age in Greentown
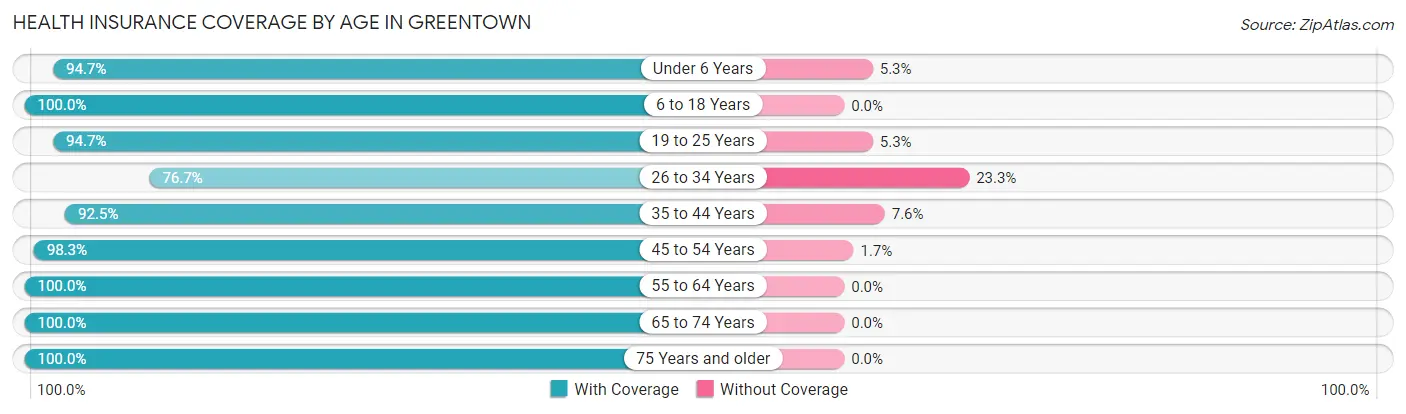
| Age Bracket | With Coverage | Without Coverage |
| Under 6 Years | 107 (94.7%) | 6 (5.3%) |
| 6 to 18 Years | 383 (100.0%) | 0 (0.0%) |
| 19 to 25 Years | 142 (94.7%) | 8 (5.3%) |
| 26 to 34 Years | 112 (76.7%) | 34 (23.3%) |
| 35 to 44 Years | 245 (92.4%) | 20 (7.5%) |
| 45 to 54 Years | 228 (98.3%) | 4 (1.7%) |
| 55 to 64 Years | 314 (100.0%) | 0 (0.0%) |
| 65 to 74 Years | 149 (100.0%) | 0 (0.0%) |
| 75 Years and older | 196 (100.0%) | 0 (0.0%) |
| Total | 1,876 (96.3%) | 72 (3.7%) |
Health Insurance Coverage by Citizenship Status in Greentown
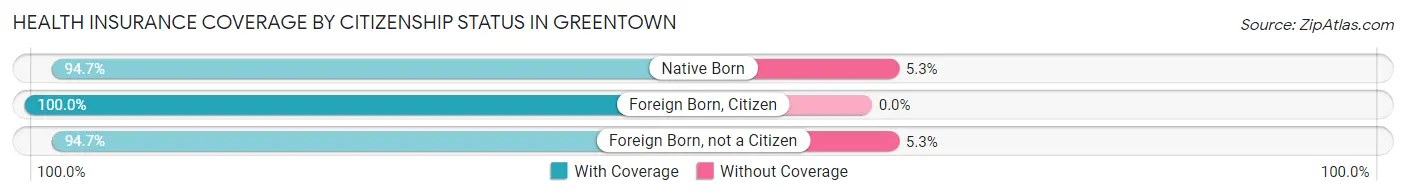
| Citizenship Status | With Coverage | Without Coverage |
| Native Born | 107 (94.7%) | 6 (5.3%) |
| Foreign Born, Citizen | 383 (100.0%) | 0 (0.0%) |
| Foreign Born, not a Citizen | 142 (94.7%) | 8 (5.3%) |
Health Insurance Coverage by Household Income in Greentown
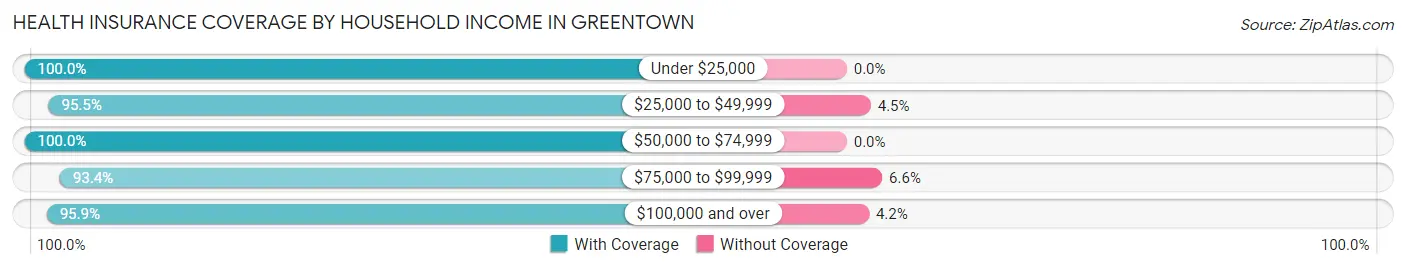
| Household Income | With Coverage | Without Coverage |
| Under $25,000 | 172 (100.0%) | 0 (0.0%) |
| $25,000 to $49,999 | 467 (95.5%) | 22 (4.5%) |
| $50,000 to $74,999 | 262 (100.0%) | 0 (0.0%) |
| $75,000 to $99,999 | 282 (93.4%) | 20 (6.6%) |
| $100,000 and over | 693 (95.9%) | 30 (4.2%) |
Public vs Private Health Insurance Coverage by Age in Greentown
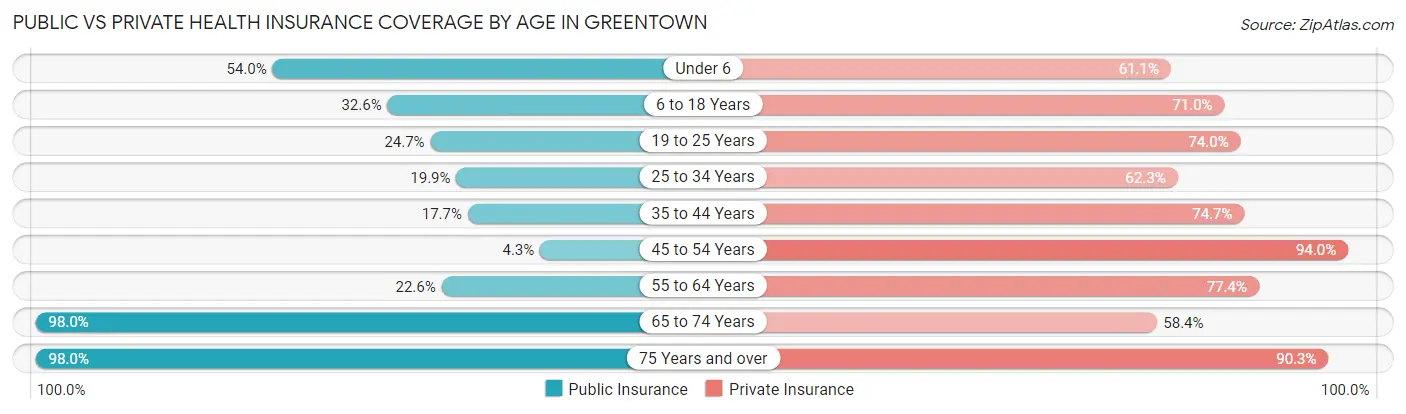
| Age Bracket | Public Insurance | Private Insurance |
| Under 6 | 61 (54.0%) | 69 (61.1%) |
| 6 to 18 Years | 125 (32.6%) | 272 (71.0%) |
| 19 to 25 Years | 37 (24.7%) | 111 (74.0%) |
| 25 to 34 Years | 29 (19.9%) | 91 (62.3%) |
| 35 to 44 Years | 47 (17.7%) | 198 (74.7%) |
| 45 to 54 Years | 10 (4.3%) | 218 (94.0%) |
| 55 to 64 Years | 71 (22.6%) | 243 (77.4%) |
| 65 to 74 Years | 146 (98.0%) | 87 (58.4%) |
| 75 Years and over | 192 (98.0%) | 177 (90.3%) |
| Total | 718 (36.9%) | 1,466 (75.3%) |
Disability Status by Sex by Age in Greentown
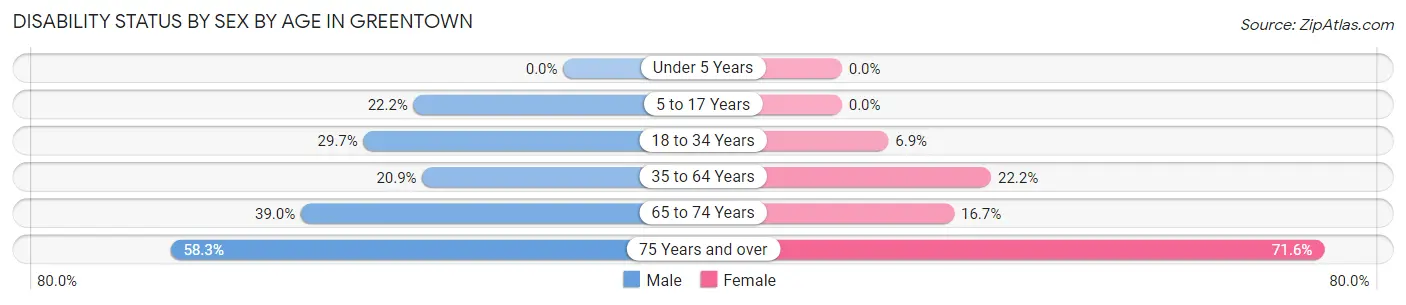
| Age Bracket | Male | Female |
| Under 5 Years | 0 (0.0%) | 0 (0.0%) |
| 5 to 17 Years | 42 (22.2%) | 0 (0.0%) |
| 18 to 34 Years | 35 (29.7%) | 13 (6.9%) |
| 35 to 64 Years | 96 (20.9%) | 78 (22.2%) |
| 65 to 74 Years | 37 (39.0%) | 9 (16.7%) |
| 75 Years and over | 28 (58.3%) | 106 (71.6%) |
Disability Class by Sex by Age in Greentown
Disability Class: Hearing Difficulty
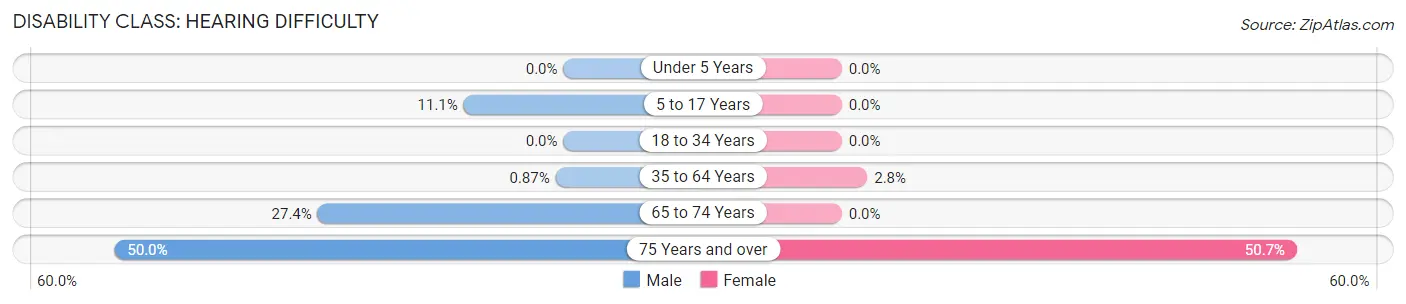
| Age Bracket | Male | Female |
| Under 5 Years | 0 (0.0%) | 0 (0.0%) |
| 5 to 17 Years | 21 (11.1%) | 0 (0.0%) |
| 18 to 34 Years | 0 (0.0%) | 0 (0.0%) |
| 35 to 64 Years | 4 (0.9%) | 10 (2.8%) |
| 65 to 74 Years | 26 (27.4%) | 0 (0.0%) |
| 75 Years and over | 24 (50.0%) | 75 (50.7%) |
Disability Class: Vision Difficulty
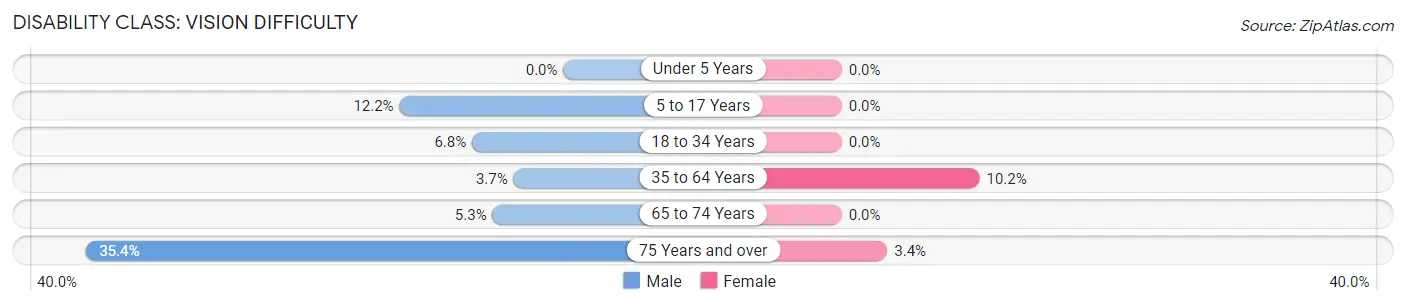
| Age Bracket | Male | Female |
| Under 5 Years | 0 (0.0%) | 0 (0.0%) |
| 5 to 17 Years | 23 (12.2%) | 0 (0.0%) |
| 18 to 34 Years | 8 (6.8%) | 0 (0.0%) |
| 35 to 64 Years | 17 (3.7%) | 36 (10.2%) |
| 65 to 74 Years | 5 (5.3%) | 0 (0.0%) |
| 75 Years and over | 17 (35.4%) | 5 (3.4%) |
Disability Class: Cognitive Difficulty
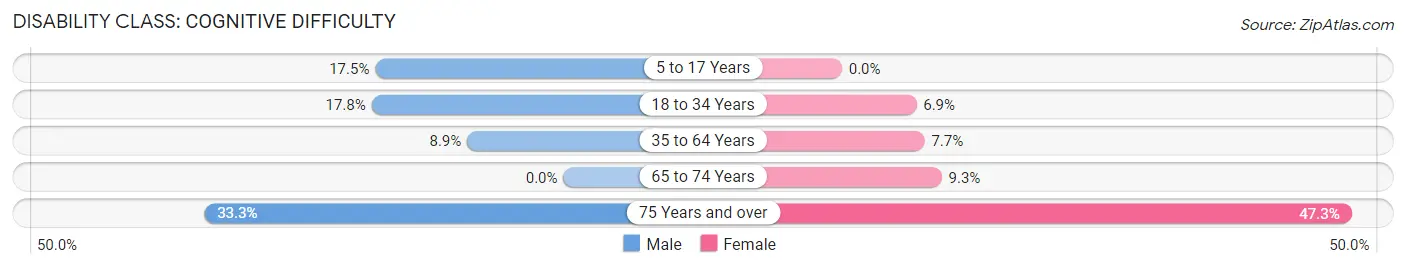
| Age Bracket | Male | Female |
| 5 to 17 Years | 33 (17.5%) | 0 (0.0%) |
| 18 to 34 Years | 21 (17.8%) | 13 (6.9%) |
| 35 to 64 Years | 41 (8.9%) | 27 (7.7%) |
| 65 to 74 Years | 0 (0.0%) | 5 (9.3%) |
| 75 Years and over | 16 (33.3%) | 70 (47.3%) |
Disability Class: Ambulatory Difficulty
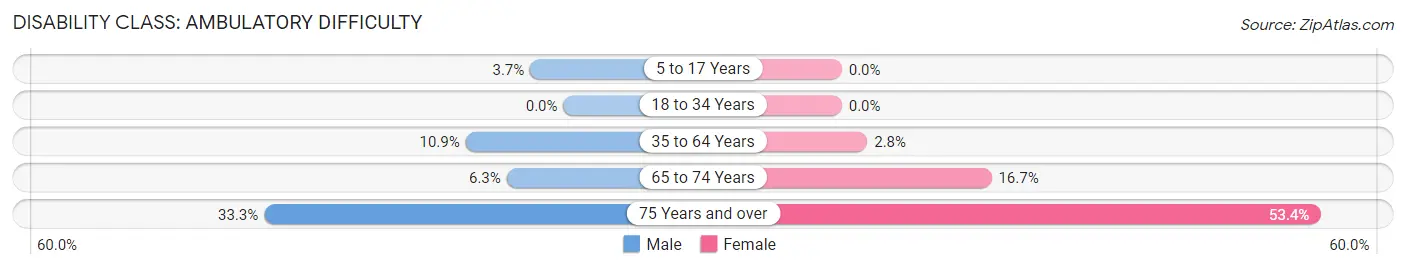
| Age Bracket | Male | Female |
| 5 to 17 Years | 7 (3.7%) | 0 (0.0%) |
| 18 to 34 Years | 0 (0.0%) | 0 (0.0%) |
| 35 to 64 Years | 50 (10.9%) | 10 (2.8%) |
| 65 to 74 Years | 6 (6.3%) | 9 (16.7%) |
| 75 Years and over | 16 (33.3%) | 79 (53.4%) |
Disability Class: Self-Care Difficulty
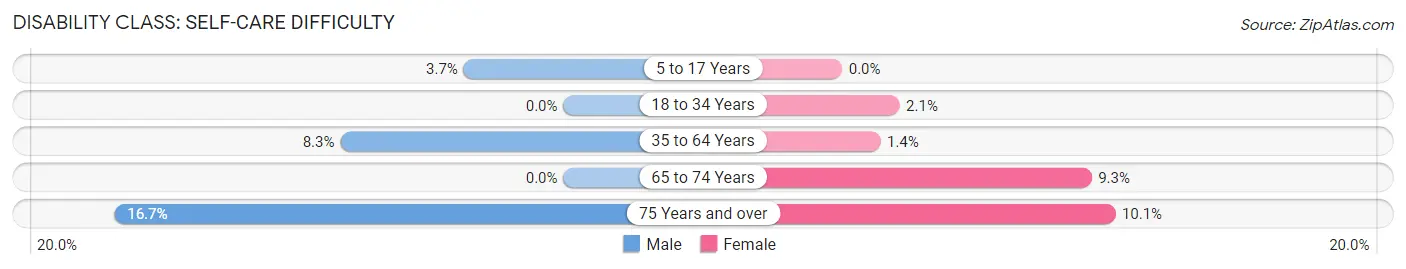
| Age Bracket | Male | Female |
| 5 to 17 Years | 7 (3.7%) | 0 (0.0%) |
| 18 to 34 Years | 0 (0.0%) | 4 (2.1%) |
| 35 to 64 Years | 38 (8.3%) | 5 (1.4%) |
| 65 to 74 Years | 0 (0.0%) | 5 (9.3%) |
| 75 Years and over | 8 (16.7%) | 15 (10.1%) |
Technology Access in Greentown
Computing Device Access in Greentown
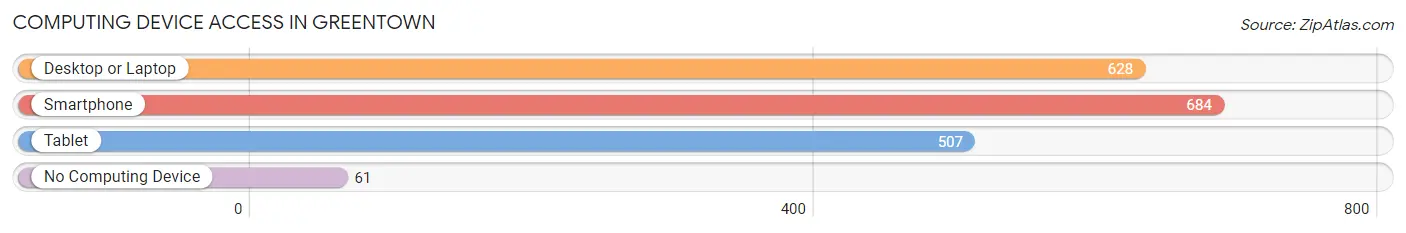
| Device Type | # Households | % Households |
| Desktop or Laptop | 628 | 76.1% |
| Smartphone | 684 | 82.9% |
| Tablet | 507 | 61.5% |
| No Computing Device | 61 | 7.4% |
| Total | 825 | 100.0% |
Internet Access in Greentown
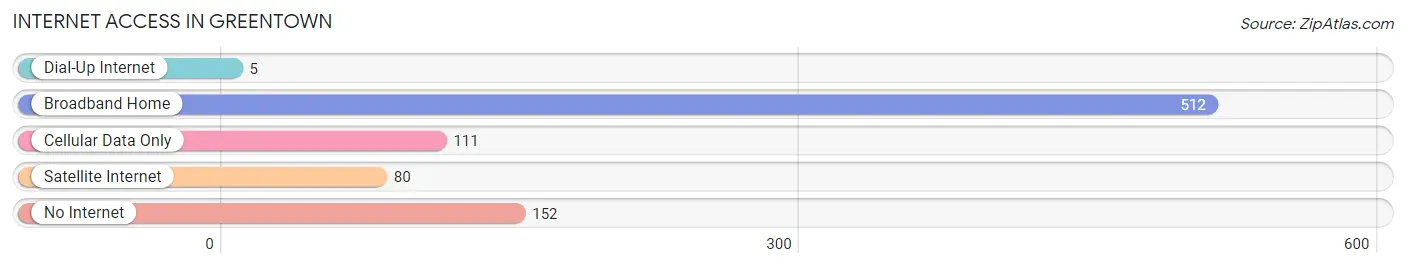
| Internet Type | # Households | % Households |
| Dial-Up Internet | 5 | 0.6% |
| Broadband Home | 512 | 62.1% |
| Cellular Data Only | 111 | 13.5% |
| Satellite Internet | 80 | 9.7% |
| No Internet | 152 | 18.4% |
| Total | 825 | 100.0% |
Greentown Summary
GreenTown, Indiana is a small town located in the northern part of the state, about an hour and a half from Indianapolis. It is a rural community with a population of just over 1,000 people. The town is situated in a rural area surrounded by farmland and rolling hills. The town is home to a variety of businesses, including a grocery store, a hardware store, a bank, a post office, and a few restaurants.
Geography
GreenTown is located in the northern part of Indiana, about an hour and a half from Indianapolis. It is situated in a rural area surrounded by farmland and rolling hills. The town is located in the Tippecanoe County, and is bordered by the towns of Lafayette, West Lafayette, and Battle Ground. The town is situated on the banks of the Wabash River, and is home to a variety of parks and recreational areas.
History
GreenTown was founded in 1820 by a group of settlers from Ohio. The town was originally called “Greenfield”, but the name was changed to GreenTown in 1837. The town was a popular stop for travelers on the Wabash and Erie Canal, and the town grew rapidly in the late 19th century. The town was home to a variety of businesses, including a grocery store, a hardware store, a bank, a post office, and a few restaurants.
Economy
GreenTown’s economy is largely based on agriculture. The town is home to a variety of farms, including dairy farms, beef farms, and vegetable farms. The town is also home to a variety of small businesses, including a grocery store, a hardware store, a bank, a post office, and a few restaurants. The town is also home to a variety of manufacturing companies, including a furniture factory and a plastics factory.
Demographics
As of the 2010 census, GreenTown had a population of 1,072 people. The town is predominantly white, with 92.3% of the population identifying as white. The town is also home to a variety of other ethnicities, including African American (3.2%), Hispanic (2.2%), and Asian (1.3%). The median household income in GreenTown is $41,250, and the median home value is $117,400.
Conclusion
GreenTown, Indiana is a small rural town located in the northern part of the state. The town is home to a variety of businesses, including a grocery store, a hardware store, a bank, a post office, and a few restaurants. The town’s economy is largely based on agriculture, and the town is home to a variety of small businesses and manufacturing companies. The town is predominantly white, with 92.3% of the population identifying as white. The median household income in GreenTown is $41,250, and the median home value is $117,400.
Common Questions
What is Per Capita Income in Greentown?
Per Capita income in Greentown is $29,964.
What is the Median Family Income in Greentown?
Median Family Income in Greentown is $72,250.
What is the Median Household income in Greentown?
Median Household Income in Greentown is $57,083.
What is Income or Wage Gap in Greentown?
Income or Wage Gap in Greentown is 35.8%.
Women in Greentown earn 64.2 cents for every dollar earned by a man.
What is Inequality or Gini Index in Greentown?
Inequality or Gini Index in Greentown is 0.38.
What is the Total Population of Greentown?
Total Population of Greentown is 2,035.
What is the Total Male Population of Greentown?
Total Male Population of Greentown is 990.
What is the Total Female Population of Greentown?
Total Female Population of Greentown is 1,045.
What is the Ratio of Males per 100 Females in Greentown?
There are 94.74 Males per 100 Females in Greentown.
What is the Ratio of Females per 100 Males in Greentown?
There are 105.56 Females per 100 Males in Greentown.
What is the Median Population Age in Greentown?
Median Population Age in Greentown is 44.0 Years.
What is the Average Family Size in Greentown
Average Family Size in Greentown is 2.8 People.
What is the Average Household Size in Greentown
Average Household Size in Greentown is 2.4 People.
How Large is the Labor Force in Greentown?
There are 998 People in the Labor Forcein in Greentown.
What is the Percentage of People in the Labor Force in Greentown?
63.3% of People are in the Labor Force in Greentown.
What is the Unemployment Rate in Greentown?
Unemployment Rate in Greentown is 1.9%.