Greencastle, IN Map & Demographics
Greencastle Map
Greencastle Overview
$24,637
PER CAPITA INCOME
$68,211
AVG FAMILY INCOME
$51,836
AVG HOUSEHOLD INCOME
70.4%
WAGE / INCOME GAP [ % ]
29.6¢/ $1
WAGE / INCOME GAP [ $ ]
$9,969
FAMILY INCOME DEFICIT
0.39
INEQUALITY / GINI INDEX
9,865
TOTAL POPULATION
4,977
MALE POPULATION
4,888
FEMALE POPULATION
101.82
MALES / 100 FEMALES
98.21
FEMALES / 100 MALES
27.4
MEDIAN AGE
2.8
AVG FAMILY SIZE
2.1
AVG HOUSEHOLD SIZE
4,530
LABOR FORCE [ PEOPLE ]
53.9%
PERCENT IN LABOR FORCE
1.1%
UNEMPLOYMENT RATE
Greencastle Zip Codes
Greencastle Area Codes
Income in Greencastle
Income Overview in Greencastle
Per Capita Income in Greencastle is $24,637, while median incomes of families and households are $68,211 and $51,836 respectively.
| Characteristic | Number | Measure |
| Per Capita Income | 9,865 | $24,637 |
| Median Family Income | 1,885 | $68,211 |
| Mean Family Income | 1,885 | $80,612 |
| Median Household Income | 3,453 | $51,836 |
| Mean Household Income | 3,453 | $67,093 |
| Income Deficit | 1,885 | $9,969 |
| Wage / Income Gap (%) | 9,865 | 70.35% |
| Wage / Income Gap ($) | 9,865 | 29.65¢ per $1 |
| Gini / Inequality Index | 9,865 | 0.39 |
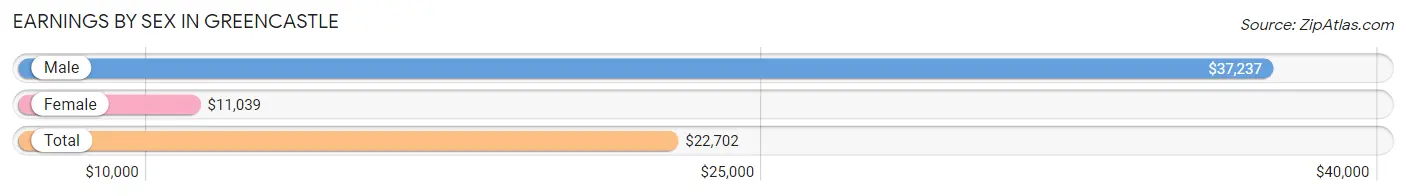
Earnings by Sex in Greencastle
Average Earnings in Greencastle are $22,702, $37,237 for men and $11,039 for women, a difference of 70.4%.
| Sex | Number | Average Earnings |
| Male | 2,712 (46.9%) | $37,237 |
| Female | 3,073 (53.1%) | $11,039 |
| Total | 5,785 (100.0%) | $22,702 |
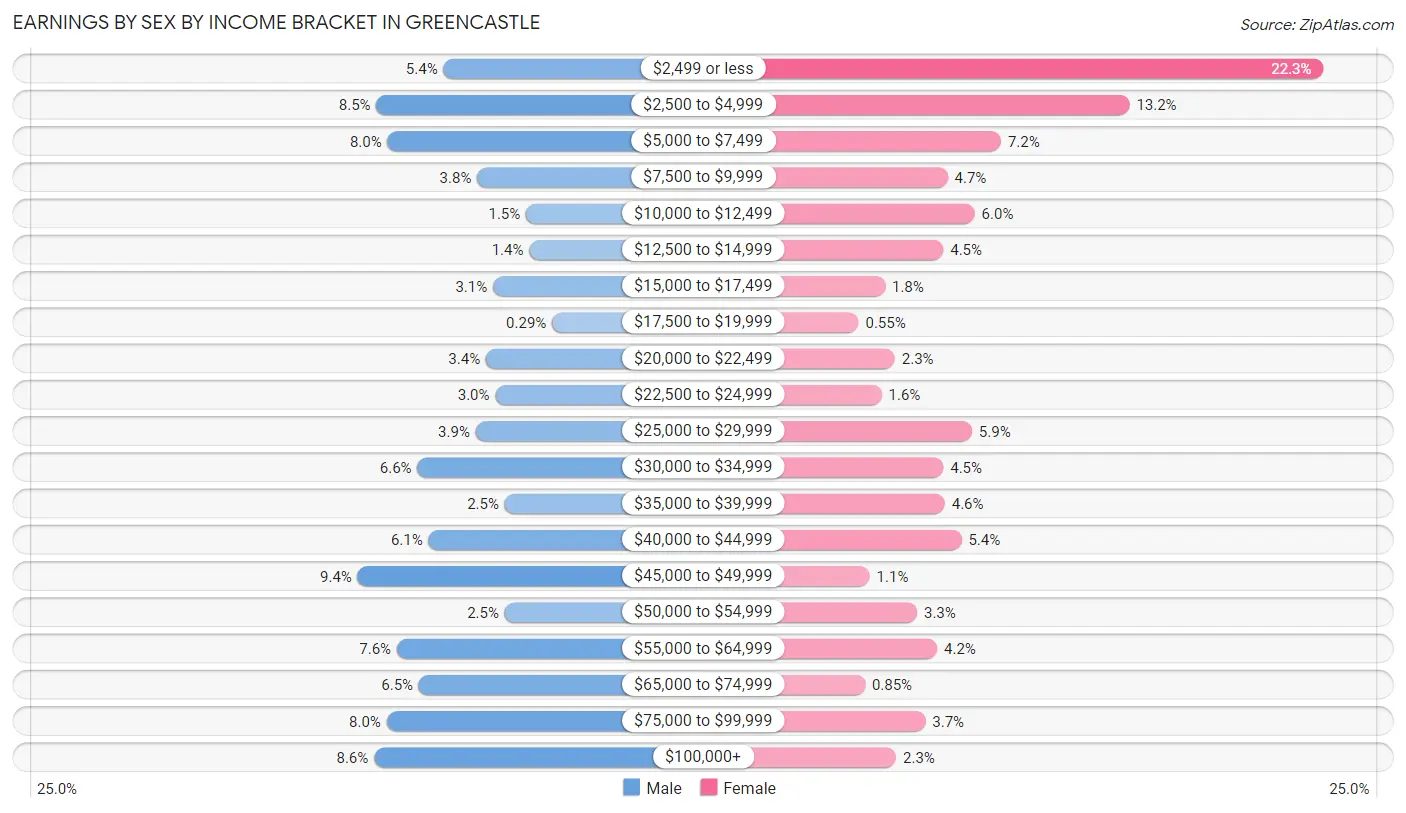
Earnings by Sex by Income Bracket in Greencastle
The most common earnings brackets in Greencastle are $45,000 to $49,999 for men (255 | 9.4%) and $2,499 or less for women (686 | 22.3%).
| Income | Male | Female |
| $2,499 or less | 146 (5.4%) | 686 (22.3%) |
| $2,500 to $4,999 | 231 (8.5%) | 407 (13.2%) |
| $5,000 to $7,499 | 217 (8.0%) | 222 (7.2%) |
| $7,500 to $9,999 | 103 (3.8%) | 145 (4.7%) |
| $10,000 to $12,499 | 41 (1.5%) | 184 (6.0%) |
| $12,500 to $14,999 | 37 (1.4%) | 139 (4.5%) |
| $15,000 to $17,499 | 83 (3.1%) | 55 (1.8%) |
| $17,500 to $19,999 | 8 (0.3%) | 17 (0.5%) |
| $20,000 to $22,499 | 92 (3.4%) | 69 (2.2%) |
| $22,500 to $24,999 | 80 (2.9%) | 50 (1.6%) |
| $25,000 to $29,999 | 105 (3.9%) | 180 (5.9%) |
| $30,000 to $34,999 | 179 (6.6%) | 139 (4.5%) |
| $35,000 to $39,999 | 68 (2.5%) | 141 (4.6%) |
| $40,000 to $44,999 | 165 (6.1%) | 165 (5.4%) |
| $45,000 to $49,999 | 255 (9.4%) | 33 (1.1%) |
| $50,000 to $54,999 | 68 (2.5%) | 101 (3.3%) |
| $55,000 to $64,999 | 205 (7.6%) | 130 (4.2%) |
| $65,000 to $74,999 | 177 (6.5%) | 26 (0.9%) |
| $75,000 to $99,999 | 218 (8.0%) | 113 (3.7%) |
| $100,000+ | 234 (8.6%) | 71 (2.3%) |
| Total | 2,712 (100.0%) | 3,073 (100.0%) |
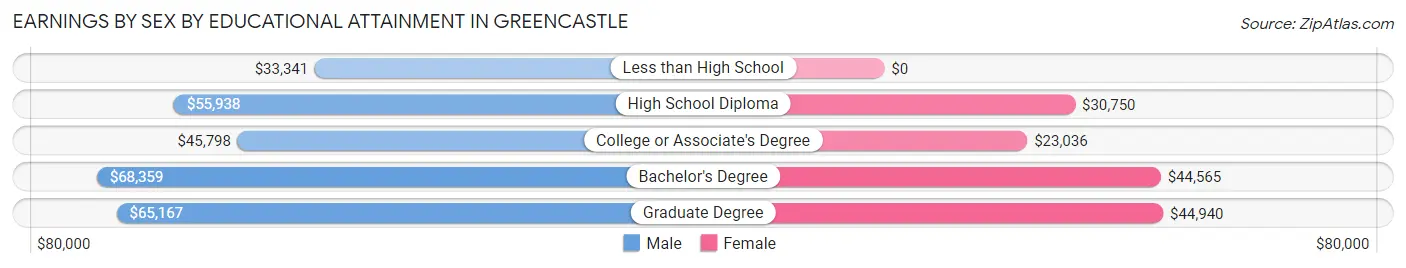
Earnings by Sex by Educational Attainment in Greencastle
Average earnings in Greencastle are $49,588 for men and $31,279 for women, a difference of 36.9%. Men with an educational attainment of bachelor's degree enjoy the highest average annual earnings of $68,359, while those with less than high school education earn the least with $33,341. Women with an educational attainment of graduate degree earn the most with the average annual earnings of $44,940, while those with college or associate's degree education have the smallest earnings of $23,036.
| Educational Attainment | Male Income | Female Income |
| Less than High School | $33,341 | $0 |
| High School Diploma | $55,938 | $30,750 |
| College or Associate's Degree | $45,798 | $23,036 |
| Bachelor's Degree | $68,359 | $44,565 |
| Graduate Degree | $65,167 | $44,940 |
| Total | $49,588 | $31,279 |
Family Income in Greencastle
Family Income Brackets in Greencastle
According to the Greencastle family income data, there are 366 families falling into the $50,000 to $74,999 income range, which is the most common income bracket and makes up 19.4% of all families. Conversely, the $15,000 to $24,999 income bracket is the least frequent group with only 36 families (1.9%) belonging to this category.
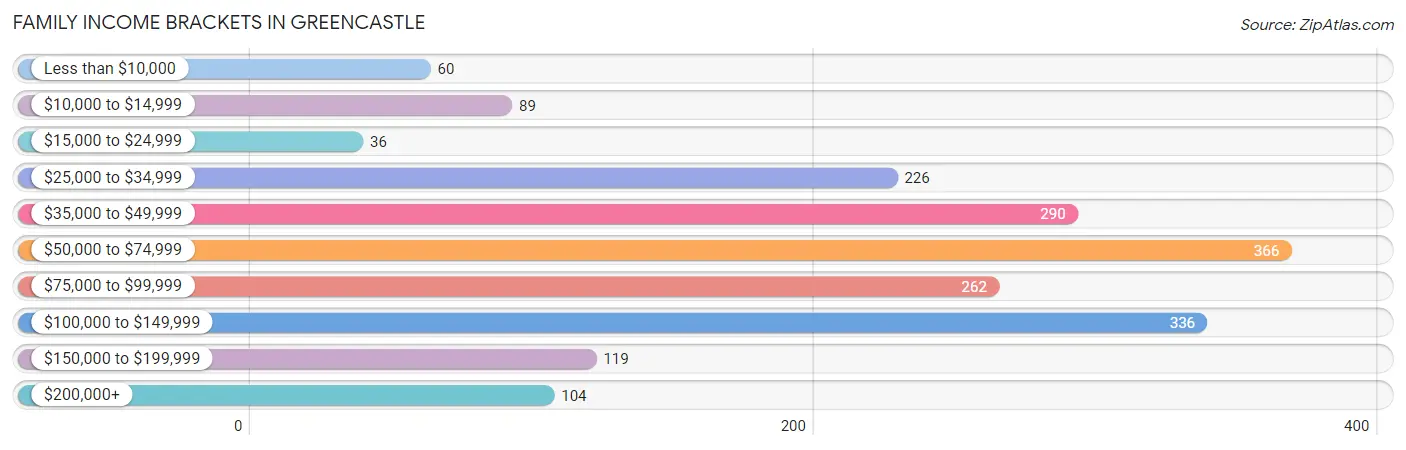
| Income Bracket | # Families | % Families |
| Less than $10,000 | 60 | 3.2% |
| $10,000 to $14,999 | 89 | 4.7% |
| $15,000 to $24,999 | 36 | 1.9% |
| $25,000 to $34,999 | 226 | 12.0% |
| $35,000 to $49,999 | 290 | 15.4% |
| $50,000 to $74,999 | 366 | 19.4% |
| $75,000 to $99,999 | 262 | 13.9% |
| $100,000 to $149,999 | 336 | 17.8% |
| $150,000 to $199,999 | 119 | 6.3% |
| $200,000+ | 104 | 5.5% |
Family Income by Famaliy Size in Greencastle
4-person families (340 | 18.0%) account for the highest median family income in Greencastle with $115,208 per family, while 4-person families (340 | 18.0%) have the highest median income of $28,802 per family member.
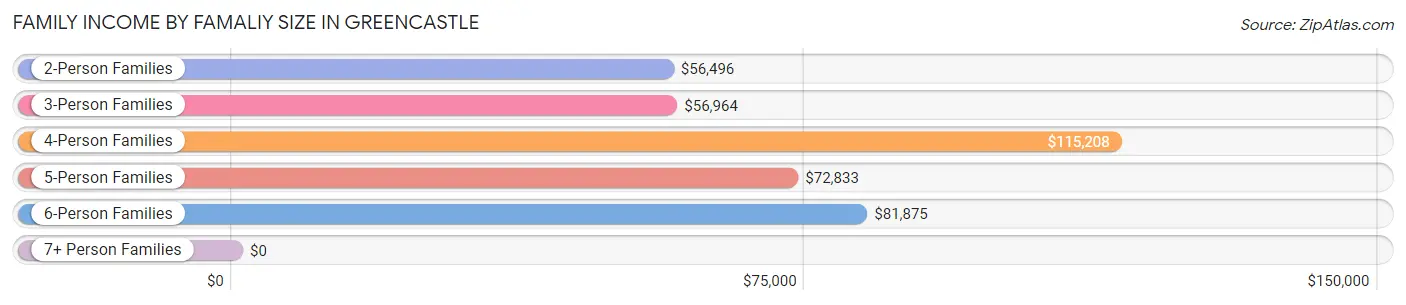
| Income Bracket | # Families | Median Income |
| 2-Person Families | 981 (52.0%) | $56,496 |
| 3-Person Families | 408 (21.6%) | $56,964 |
| 4-Person Families | 340 (18.0%) | $115,208 |
| 5-Person Families | 78 (4.1%) | $72,833 |
| 6-Person Families | 78 (4.1%) | $81,875 |
| 7+ Person Families | 0 (0.0%) | $0 |
| Total | 1,885 (100.0%) | $68,211 |
Family Income by Number of Earners in Greencastle
The median family income in Greencastle is $68,211, with families comprising 2 earners (595) having the highest median family income of $94,476, while families with no earners (307) have the lowest median family income of $44,188, accounting for 31.6% and 16.3% of families, respectively.
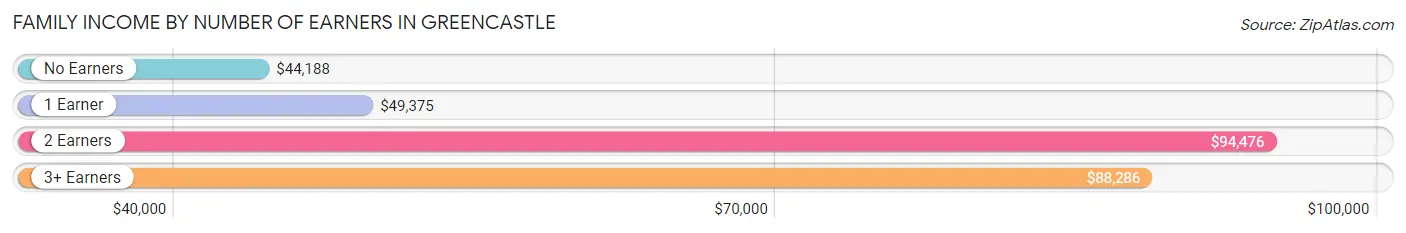
| Number of Earners | # Families | Median Income |
| No Earners | 307 (16.3%) | $44,188 |
| 1 Earner | 837 (44.4%) | $49,375 |
| 2 Earners | 595 (31.6%) | $94,476 |
| 3+ Earners | 146 (7.7%) | $88,286 |
| Total | 1,885 (100.0%) | $68,211 |
Household Income in Greencastle
Household Income Brackets in Greencastle
With 677 households falling in the category, the $50,000 to $74,999 income range is the most frequent in Greencastle, accounting for 19.6% of all households. In contrast, only 104 households (3.0%) fall into the $200,000+ income bracket, making it the least populous group.
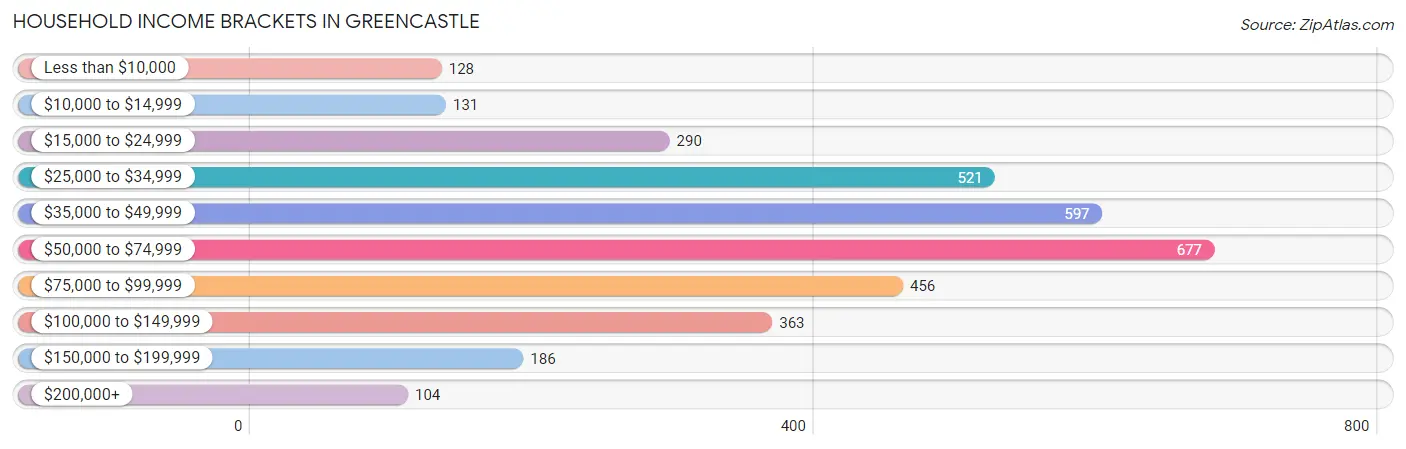
| Income Bracket | # Households | % Households |
| Less than $10,000 | 128 | 3.7% |
| $10,000 to $14,999 | 131 | 3.8% |
| $15,000 to $24,999 | 290 | 8.4% |
| $25,000 to $34,999 | 521 | 15.1% |
| $35,000 to $49,999 | 597 | 17.3% |
| $50,000 to $74,999 | 677 | 19.6% |
| $75,000 to $99,999 | 456 | 13.2% |
| $100,000 to $149,999 | 363 | 10.5% |
| $150,000 to $199,999 | 186 | 5.4% |
| $200,000+ | 104 | 3.0% |
Household Income by Householder Age in Greencastle
The median household income in Greencastle is $51,836, with the highest median household income of $68,053 found in the 25 to 44 years age bracket for the primary householder. A total of 1,274 households (36.9%) fall into this category. Meanwhile, the 15 to 24 years age bracket for the primary householder has the lowest median household income of $33,333, with 266 households (7.7%) in this group.
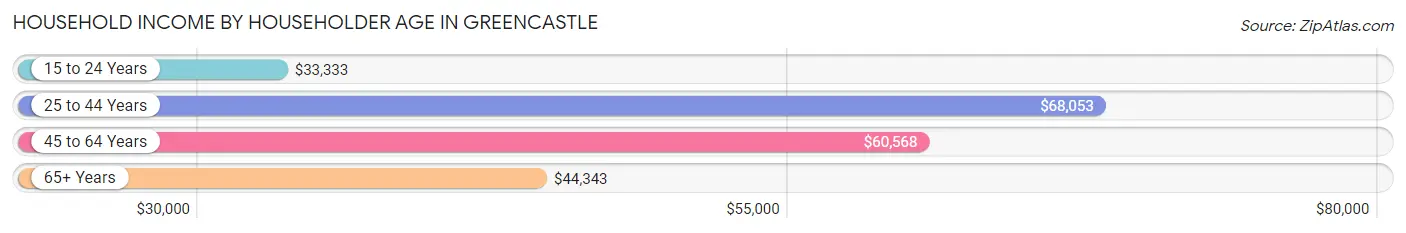
| Income Bracket | # Households | Median Income |
| 15 to 24 Years | 266 (7.7%) | $33,333 |
| 25 to 44 Years | 1,274 (36.9%) | $68,053 |
| 45 to 64 Years | 854 (24.7%) | $60,568 |
| 65+ Years | 1,059 (30.7%) | $44,343 |
| Total | 3,453 (100.0%) | $51,836 |
Poverty in Greencastle
Income Below Poverty by Sex and Age in Greencastle
With 5.8% poverty level for males and 13.6% for females among the residents of Greencastle, 12 to 14 year old males and 16 and 17 year old females are the most vulnerable to poverty, with 31 males (13.8%) and 21 females (65.6%) in their respective age groups living below the poverty level.
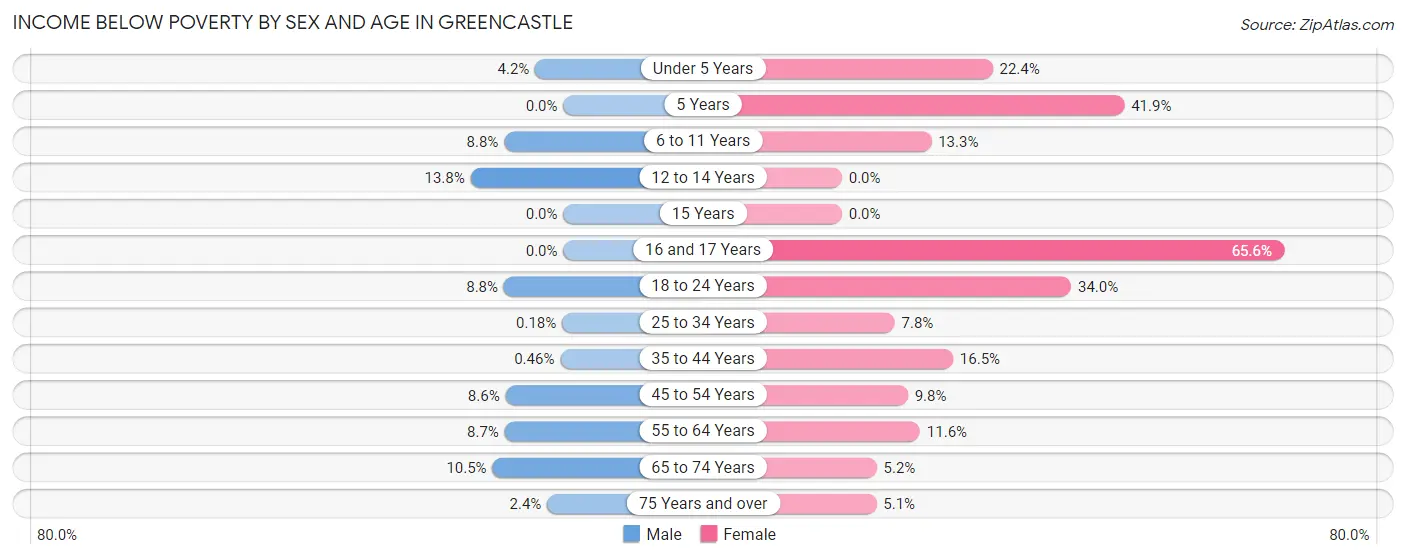
| Age Bracket | Male | Female |
| Under 5 Years | 12 (4.2%) | 32 (22.4%) |
| 5 Years | 0 (0.0%) | 13 (41.9%) |
| 6 to 11 Years | 32 (8.8%) | 17 (13.3%) |
| 12 to 14 Years | 31 (13.8%) | 0 (0.0%) |
| 15 Years | 0 (0.0%) | 0 (0.0%) |
| 16 and 17 Years | 0 (0.0%) | 21 (65.6%) |
| 18 to 24 Years | 37 (8.8%) | 128 (34.0%) |
| 25 to 34 Years | 1 (0.2%) | 44 (7.8%) |
| 35 to 44 Years | 2 (0.5%) | 81 (16.5%) |
| 45 to 54 Years | 36 (8.6%) | 28 (9.8%) |
| 55 to 64 Years | 31 (8.7%) | 50 (11.6%) |
| 65 to 74 Years | 34 (10.5%) | 18 (5.2%) |
| 75 Years and over | 8 (2.4%) | 21 (5.1%) |
| Total | 224 (5.8%) | 453 (13.6%) |
Income Above Poverty by Sex and Age in Greencastle
According to the poverty statistics in Greencastle, males aged 5 years and females aged 12 to 14 years are the age groups that are most secure financially, with 100.0% of males and 100.0% of females in these age groups living above the poverty line.
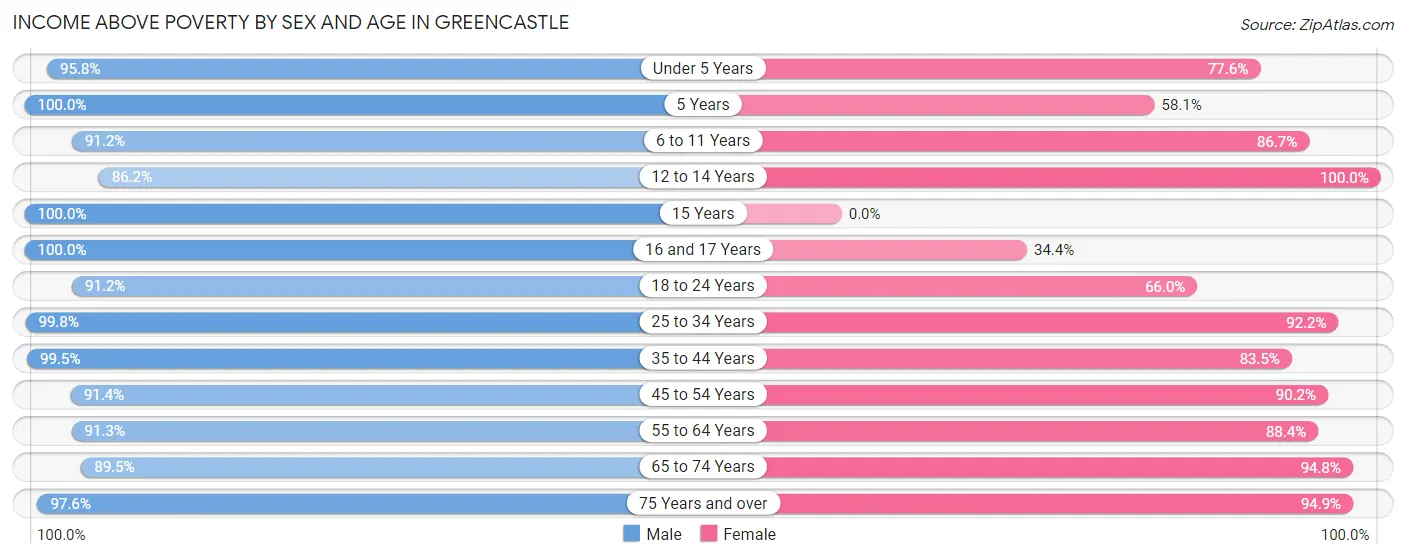
| Age Bracket | Male | Female |
| Under 5 Years | 275 (95.8%) | 111 (77.6%) |
| 5 Years | 94 (100.0%) | 18 (58.1%) |
| 6 to 11 Years | 332 (91.2%) | 111 (86.7%) |
| 12 to 14 Years | 194 (86.2%) | 102 (100.0%) |
| 15 Years | 4 (100.0%) | 0 (0.0%) |
| 16 and 17 Years | 88 (100.0%) | 11 (34.4%) |
| 18 to 24 Years | 382 (91.2%) | 248 (66.0%) |
| 25 to 34 Years | 547 (99.8%) | 517 (92.2%) |
| 35 to 44 Years | 435 (99.5%) | 410 (83.5%) |
| 45 to 54 Years | 383 (91.4%) | 258 (90.2%) |
| 55 to 64 Years | 325 (91.3%) | 381 (88.4%) |
| 65 to 74 Years | 289 (89.5%) | 330 (94.8%) |
| 75 Years and over | 325 (97.6%) | 388 (94.9%) |
| Total | 3,673 (94.3%) | 2,885 (86.4%) |
Income Below Poverty Among Married-Couple Families in Greencastle
The poverty statistics for married-couple families in Greencastle show that 4.3% or 55 of the total 1,289 families live below the poverty line. Families with no children have the highest poverty rate of 6.8%, comprising of 55 families. On the other hand, families with 1 or 2 children have the lowest poverty rate of 0.0%, which includes 0 families.
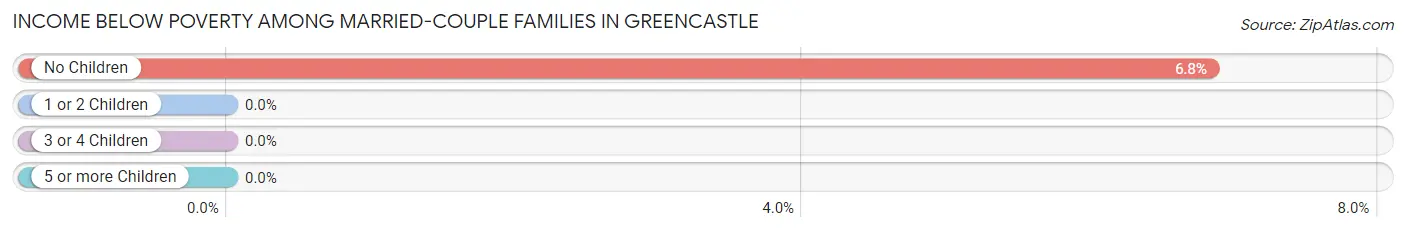
| Children | Above Poverty | Below Poverty |
| No Children | 750 (93.2%) | 55 (6.8%) |
| 1 or 2 Children | 360 (100.0%) | 0 (0.0%) |
| 3 or 4 Children | 124 (100.0%) | 0 (0.0%) |
| 5 or more Children | 0 (0.0%) | 0 (0.0%) |
| Total | 1,234 (95.7%) | 55 (4.3%) |
Income Below Poverty Among Single-Parent Households in Greencastle
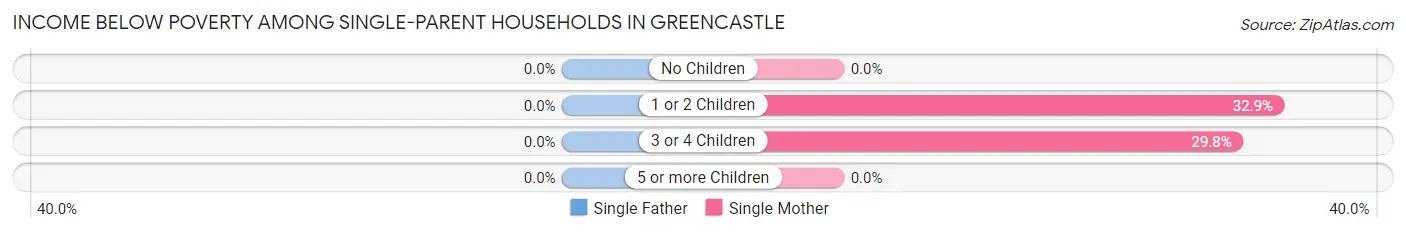
| Children | Single Father | Single Mother |
| No Children | 0 (0.0%) | 0 (0.0%) |
| 1 or 2 Children | 0 (0.0%) | 95 (32.9%) |
| 3 or 4 Children | 0 (0.0%) | 14 (29.8%) |
| 5 or more Children | 0 (0.0%) | 0 (0.0%) |
| Total | 0 (0.0%) | 109 (26.7%) |
Income Below Poverty Among Married-Couple vs Single-Parent Households in Greencastle
The poverty data for Greencastle shows that 55 of the married-couple family households (4.3%) and 109 of the single-parent households (18.3%) are living below the poverty level. Within the married-couple family households, those with no children have the highest poverty rate, with 55 households (6.8%) falling below the poverty line. Among the single-parent households, those with 1 or 2 children have the highest poverty rate, with 95 household (30.7%) living below poverty.
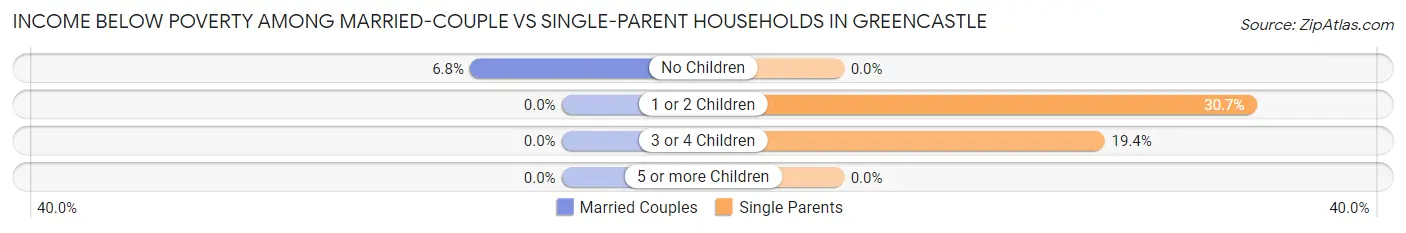
| Children | Married-Couple Families | Single-Parent Households |
| No Children | 55 (6.8%) | 0 (0.0%) |
| 1 or 2 Children | 0 (0.0%) | 95 (30.7%) |
| 3 or 4 Children | 0 (0.0%) | 14 (19.4%) |
| 5 or more Children | 0 (0.0%) | 0 (0.0%) |
| Total | 55 (4.3%) | 109 (18.3%) |
Race in Greencastle
The most populous races in Greencastle are White / Caucasian (8,615 | 87.3%), Asian (560 | 5.7%), and Two or more Races (396 | 4.0%).
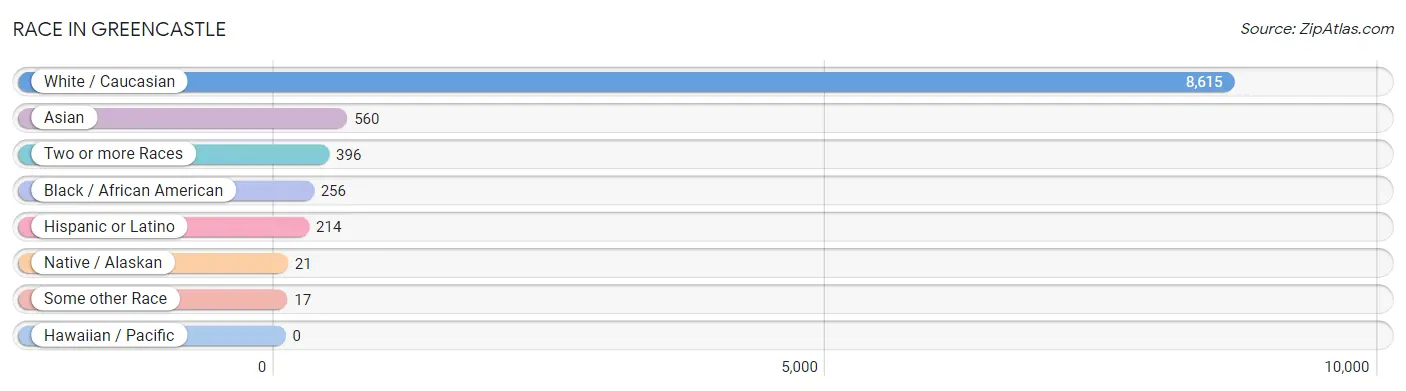
| Race | # Population | % Population |
| Asian | 560 | 5.7% |
| Black / African American | 256 | 2.6% |
| Hawaiian / Pacific | 0 | 0.0% |
| Hispanic or Latino | 214 | 2.2% |
| Native / Alaskan | 21 | 0.2% |
| White / Caucasian | 8,615 | 87.3% |
| Two or more Races | 396 | 4.0% |
| Some other Race | 17 | 0.2% |
| Total | 9,865 | 100.0% |
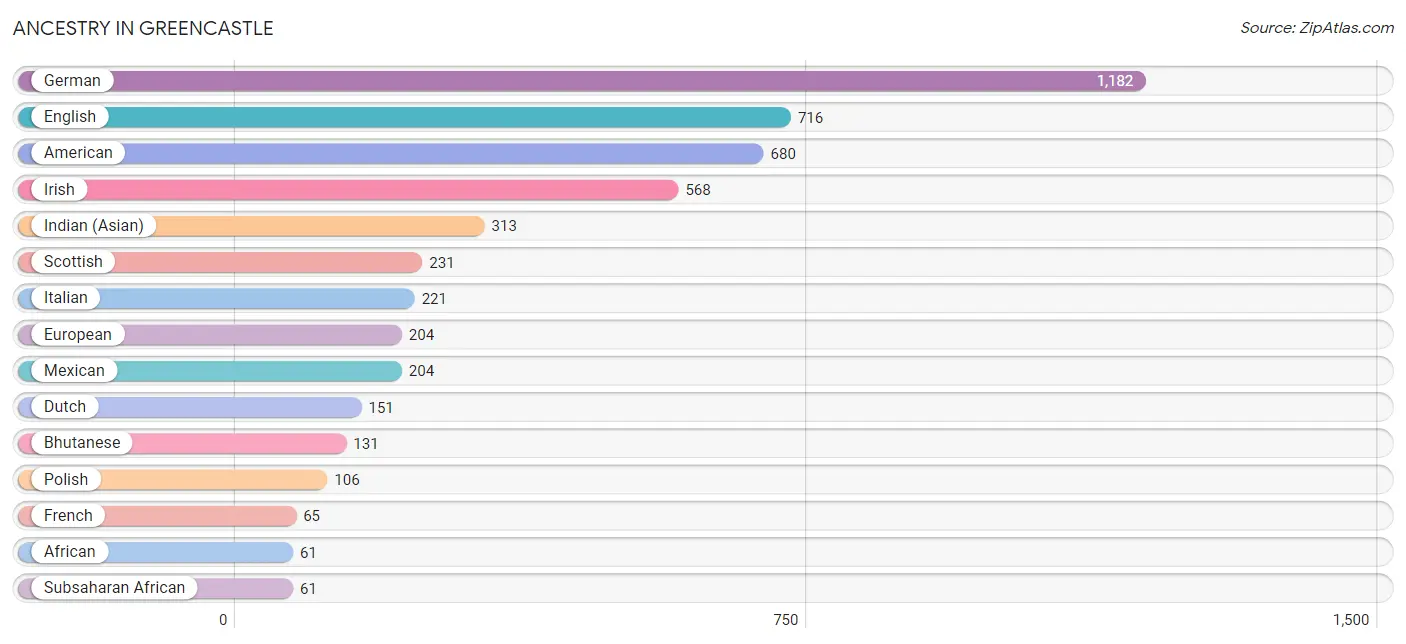
Ancestry in Greencastle
The most populous ancestries reported in Greencastle are German (1,182 | 12.0%), English (716 | 7.3%), American (680 | 6.9%), Irish (568 | 5.8%), and Indian (Asian) (313 | 3.2%), together accounting for 35.1% of all Greencastle residents.
| Ancestry | # Population | % Population |
| African | 61 | 0.6% |
| American | 680 | 6.9% |
| Apache | 15 | 0.2% |
| Bhutanese | 131 | 1.3% |
| Bolivian | 7 | 0.1% |
| Brazilian | 60 | 0.6% |
| British | 51 | 0.5% |
| Canadian | 31 | 0.3% |
| Cherokee | 41 | 0.4% |
| Croatian | 23 | 0.2% |
| Dutch | 151 | 1.5% |
| English | 716 | 7.3% |
| European | 204 | 2.1% |
| Finnish | 8 | 0.1% |
| French | 65 | 0.7% |
| French Canadian | 16 | 0.2% |
| German | 1,182 | 12.0% |
| Greek | 45 | 0.5% |
| Hungarian | 56 | 0.6% |
| Indian (Asian) | 313 | 3.2% |
| Irish | 568 | 5.8% |
| Italian | 221 | 2.2% |
| Korean | 12 | 0.1% |
| Mexican | 204 | 2.1% |
| Northern European | 19 | 0.2% |
| Norwegian | 29 | 0.3% |
| Polish | 106 | 1.1% |
| Scandinavian | 8 | 0.1% |
| Scotch-Irish | 16 | 0.2% |
| Scottish | 231 | 2.3% |
| South American | 7 | 0.1% |
| Sri Lankan | 45 | 0.5% |
| Subsaharan African | 61 | 0.6% |
| Swedish | 18 | 0.2% |
| Swiss | 9 | 0.1% |
| Thai | 5 | 0.1% |
| Welsh | 49 | 0.5% | View All 37 Rows |
Immigrants in Greencastle
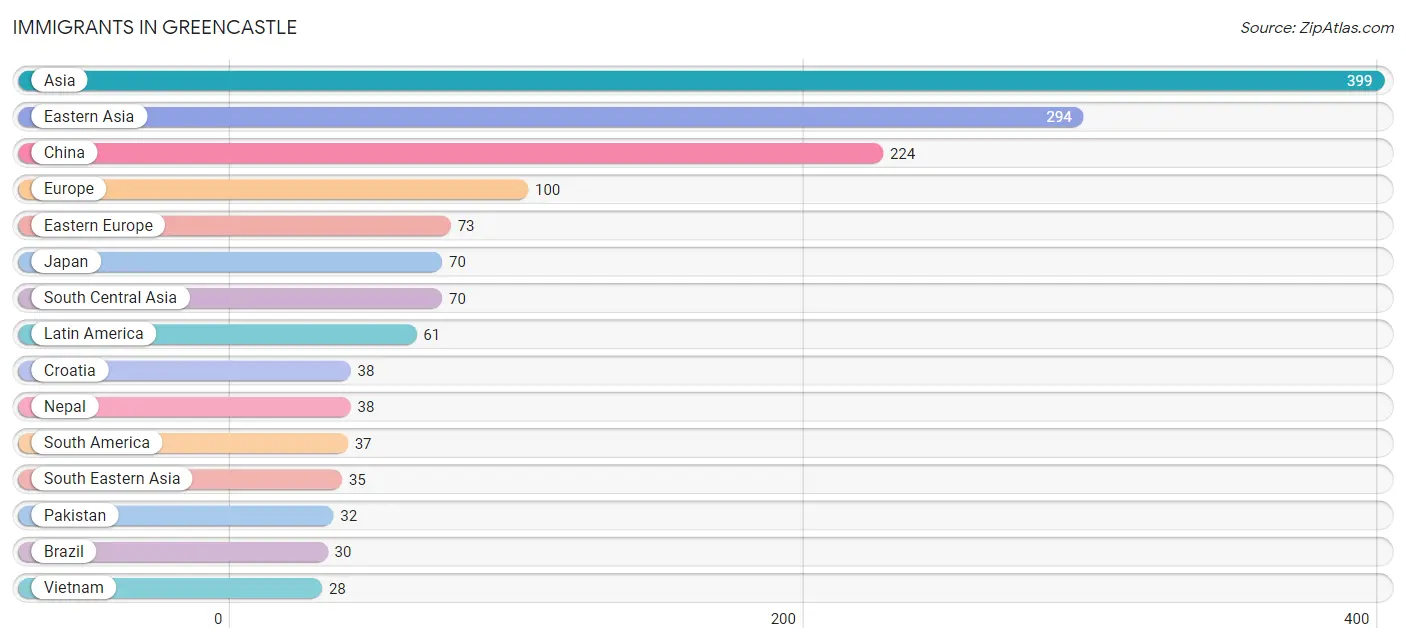
The most numerous immigrant groups reported in Greencastle came from Asia (399 | 4.0%), Eastern Asia (294 | 3.0%), China (224 | 2.3%), Europe (100 | 1.0%), and Eastern Europe (73 | 0.7%), together accounting for 11.0% of all Greencastle residents.
| Immigration Origin | # Population | % Population |
| Asia | 399 | 4.0% |
| Bolivia | 7 | 0.1% |
| Brazil | 30 | 0.3% |
| Canada | 12 | 0.1% |
| Central America | 24 | 0.2% |
| China | 224 | 2.3% |
| Croatia | 38 | 0.4% |
| Czechoslovakia | 8 | 0.1% |
| Eastern Asia | 294 | 3.0% |
| Eastern Europe | 73 | 0.7% |
| Europe | 100 | 1.0% |
| France | 19 | 0.2% |
| Germany | 8 | 0.1% |
| Japan | 70 | 0.7% |
| Latin America | 61 | 0.6% |
| Mexico | 24 | 0.2% |
| Nepal | 38 | 0.4% |
| Pakistan | 32 | 0.3% |
| Philippines | 7 | 0.1% |
| Poland | 27 | 0.3% |
| South America | 37 | 0.4% |
| South Central Asia | 70 | 0.7% |
| South Eastern Asia | 35 | 0.4% |
| Vietnam | 28 | 0.3% |
| Western Europe | 27 | 0.3% | View All 25 Rows |
Sex and Age in Greencastle
Sex and Age in Greencastle
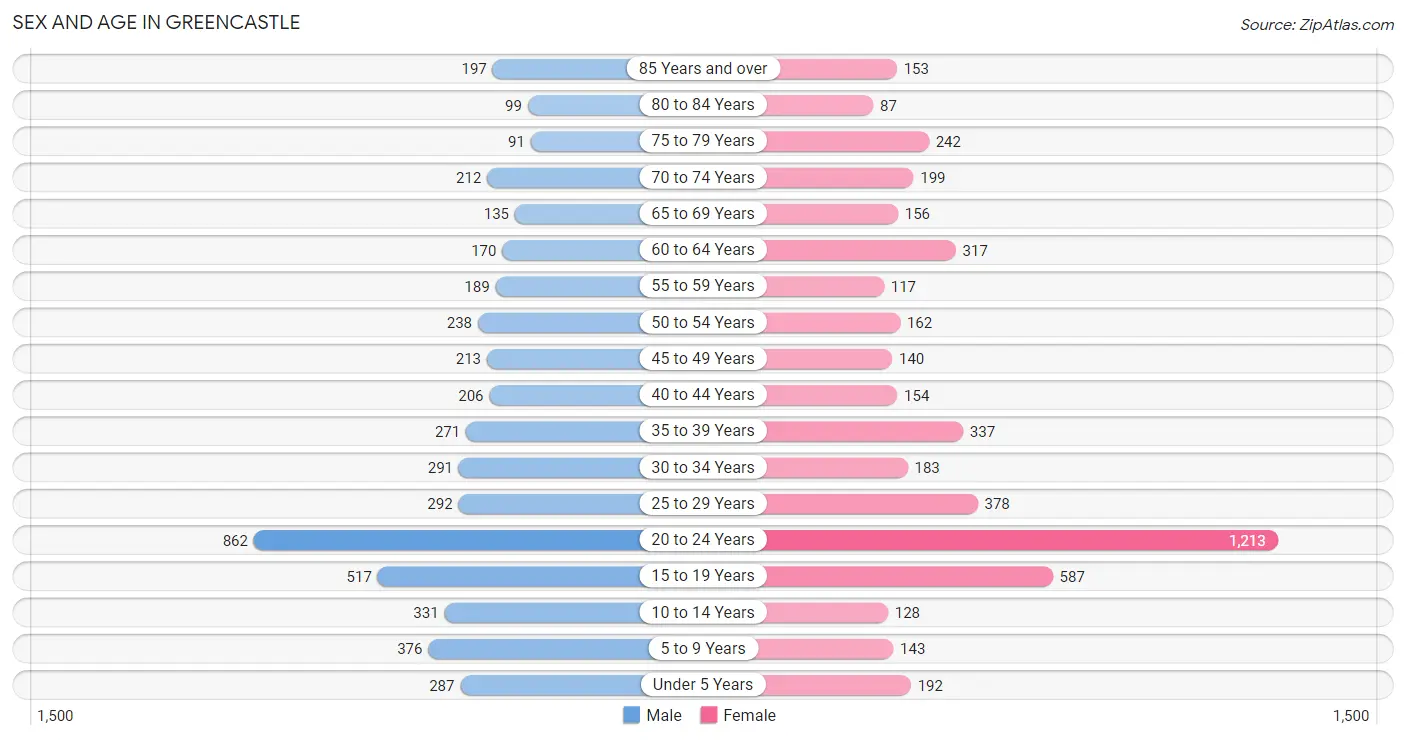
The most populous age groups in Greencastle are 20 to 24 Years (862 | 17.3%) for men and 20 to 24 Years (1,213 | 24.8%) for women.
| Age Bracket | Male | Female |
| Under 5 Years | 287 (5.8%) | 192 (3.9%) |
| 5 to 9 Years | 376 (7.5%) | 143 (2.9%) |
| 10 to 14 Years | 331 (6.7%) | 128 (2.6%) |
| 15 to 19 Years | 517 (10.4%) | 587 (12.0%) |
| 20 to 24 Years | 862 (17.3%) | 1,213 (24.8%) |
| 25 to 29 Years | 292 (5.9%) | 378 (7.7%) |
| 30 to 34 Years | 291 (5.9%) | 183 (3.7%) |
| 35 to 39 Years | 271 (5.4%) | 337 (6.9%) |
| 40 to 44 Years | 206 (4.1%) | 154 (3.2%) |
| 45 to 49 Years | 213 (4.3%) | 140 (2.9%) |
| 50 to 54 Years | 238 (4.8%) | 162 (3.3%) |
| 55 to 59 Years | 189 (3.8%) | 117 (2.4%) |
| 60 to 64 Years | 170 (3.4%) | 317 (6.5%) |
| 65 to 69 Years | 135 (2.7%) | 156 (3.2%) |
| 70 to 74 Years | 212 (4.3%) | 199 (4.1%) |
| 75 to 79 Years | 91 (1.8%) | 242 (5.0%) |
| 80 to 84 Years | 99 (2.0%) | 87 (1.8%) |
| 85 Years and over | 197 (4.0%) | 153 (3.1%) |
| Total | 4,977 (100.0%) | 4,888 (100.0%) |
Families and Households in Greencastle
Median Family Size in Greencastle
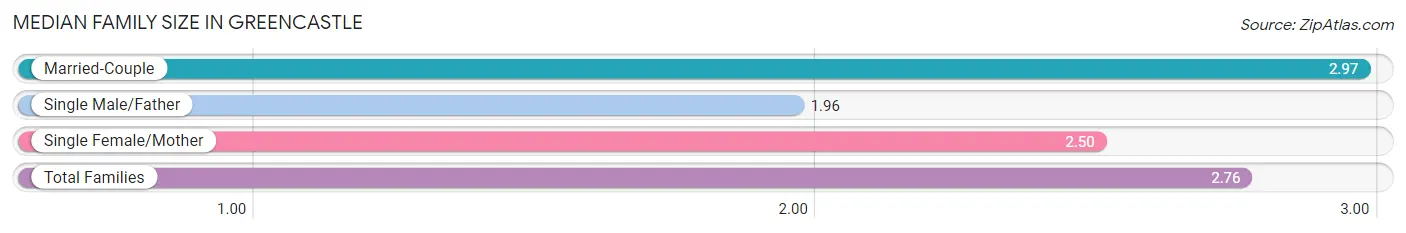
The median family size in Greencastle is 2.76 persons per family, with married-couple families (1,289 | 68.4%) accounting for the largest median family size of 2.97 persons per family. On the other hand, single male/father families (188 | 10.0%) represent the smallest median family size with 1.96 persons per family.
| Family Type | # Families | Family Size |
| Married-Couple | 1,289 (68.4%) | 2.97 |
| Single Male/Father | 188 (10.0%) | 1.96 |
| Single Female/Mother | 408 (21.6%) | 2.50 |
| Total Families | 1,885 (100.0%) | 2.76 |
Median Household Size in Greencastle
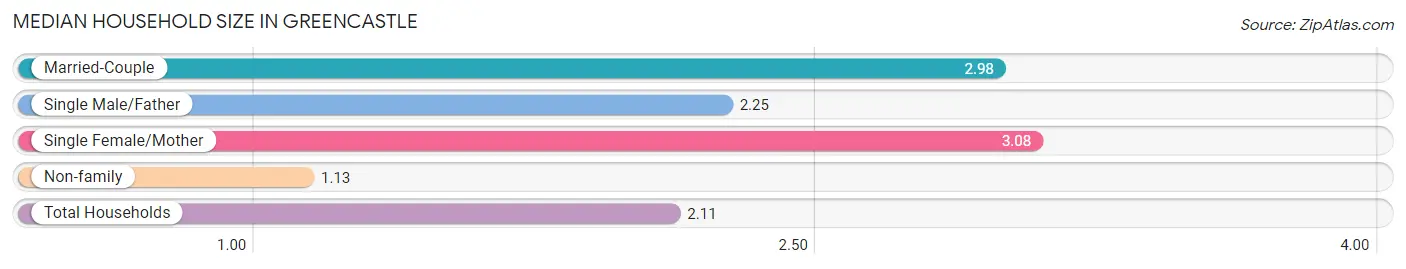
The median household size in Greencastle is 2.11 persons per household, with single female/mother households (408 | 11.8%) accounting for the largest median household size of 3.08 persons per household. non-family households (1,568 | 45.4%) represent the smallest median household size with 1.13 persons per household.
| Household Type | # Households | Household Size |
| Married-Couple | 1,289 (37.3%) | 2.98 |
| Single Male/Father | 188 (5.4%) | 2.25 |
| Single Female/Mother | 408 (11.8%) | 3.08 |
| Non-family | 1,568 (45.4%) | 1.13 |
| Total Households | 3,453 (100.0%) | 2.11 |
Household Size by Marriage Status in Greencastle
Out of a total of 3,453 households in Greencastle, 1,885 (54.6%) are family households, while 1,568 (45.4%) are nonfamily households. The most numerous type of family households are 2-person households, comprising 890, and the most common type of nonfamily households are 1-person households, comprising 1,345.
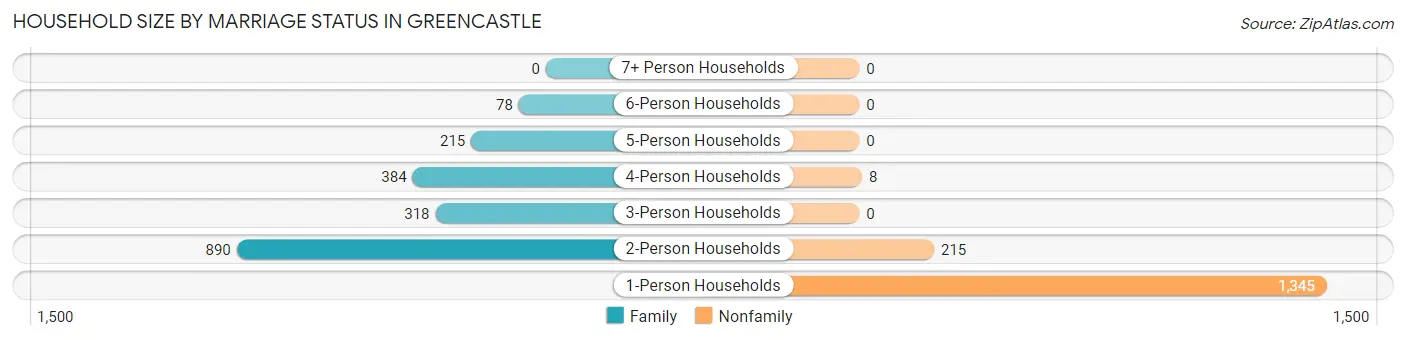
| Household Size | Family Households | Nonfamily Households |
| 1-Person Households | - | 1,345 (39.0%) |
| 2-Person Households | 890 (25.8%) | 215 (6.2%) |
| 3-Person Households | 318 (9.2%) | 0 (0.0%) |
| 4-Person Households | 384 (11.1%) | 8 (0.2%) |
| 5-Person Households | 215 (6.2%) | 0 (0.0%) |
| 6-Person Households | 78 (2.3%) | 0 (0.0%) |
| 7+ Person Households | 0 (0.0%) | 0 (0.0%) |
| Total | 1,885 (54.6%) | 1,568 (45.4%) |
Female Fertility in Greencastle
Fertility by Age in Greencastle
Average fertility rate in Greencastle is 28.0 births per 1,000 women. Women in the age bracket of 20 to 34 years have the highest fertility rate with 39.0 births per 1,000 women. Women in the age bracket of 20 to 34 years acount for 83.3% of all women with births.
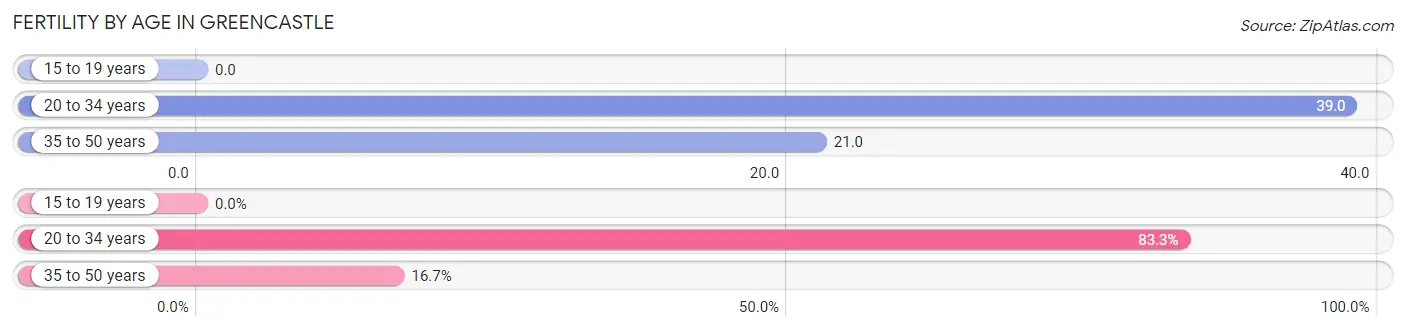
| Age Bracket | Women with Births | Births / 1,000 Women |
| 15 to 19 years | 0 (0.0%) | 0.0 |
| 20 to 34 years | 70 (83.3%) | 39.0 |
| 35 to 50 years | 14 (16.7%) | 21.0 |
| Total | 84 (100.0%) | 28.0 |
Fertility by Age by Marriage Status in Greencastle
16.7% of women with births (84) in Greencastle are married. The highest percentage of unmarried women with births falls into 20 to 34 years age bracket with 100.0% of them unmarried at the time of birth, while the lowest percentage of unmarried women with births belong to 35 to 50 years age bracket with 0.0% of them unmarried.
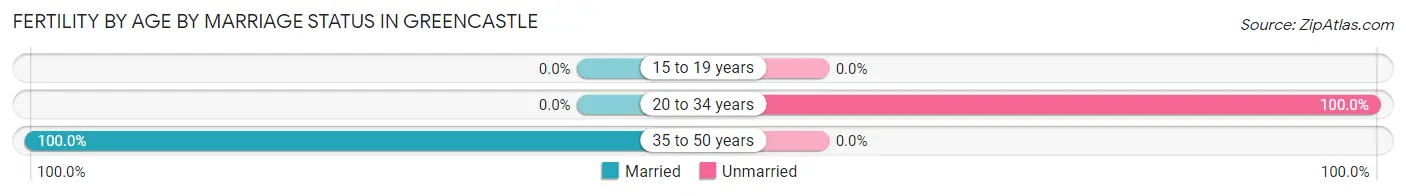
| Age Bracket | Married | Unmarried |
| 15 to 19 years | 0 (0.0%) | 0 (0.0%) |
| 20 to 34 years | 0 (0.0%) | 70 (100.0%) |
| 35 to 50 years | 14 (100.0%) | 0 (0.0%) |
| Total | 14 (16.7%) | 70 (83.3%) |
Fertility by Education in Greencastle
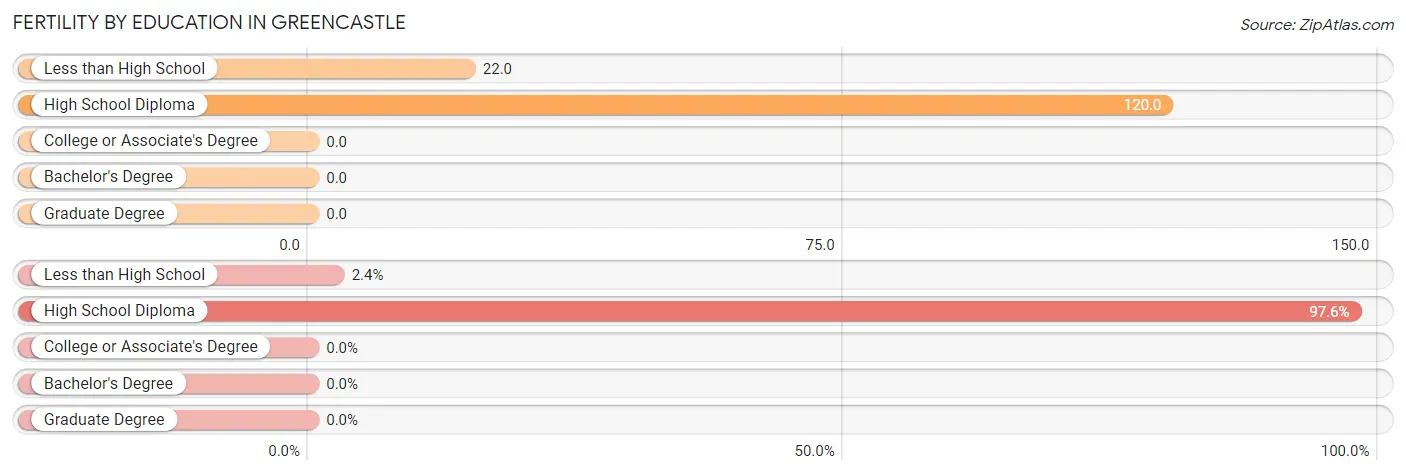
| Educational Attainment | Women with Births | Births / 1,000 Women |
| Less than High School | 2 (2.4%) | 22.0 |
| High School Diploma | 82 (97.6%) | 120.0 |
| College or Associate's Degree | 0 (0.0%) | 0.0 |
| Bachelor's Degree | 0 (0.0%) | 0.0 |
| Graduate Degree | 0 (0.0%) | 0.0 |
| Total | 84 (100.0%) | 28.0 |
Fertility by Education by Marriage Status in Greencastle
83.3% of women with births in Greencastle are unmarried. Women with the educational attainment of less than high school are most likely to be married with 100.0% of them married at childbirth, while women with the educational attainment of high school diploma are least likely to be married with 85.4% of them unmarried at childbirth.
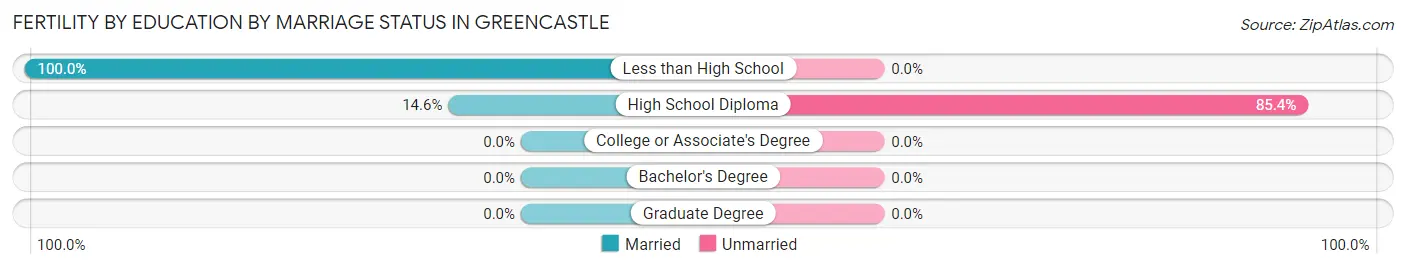
| Educational Attainment | Married | Unmarried |
| Less than High School | 2 (100.0%) | 0 (0.0%) |
| High School Diploma | 12 (14.6%) | 70 (85.4%) |
| College or Associate's Degree | 0 (0.0%) | 0 (0.0%) |
| Bachelor's Degree | 0 (0.0%) | 0 (0.0%) |
| Graduate Degree | 0 (0.0%) | 0 (0.0%) |
| Total | 14 (16.7%) | 70 (83.3%) |
Employment Characteristics in Greencastle
Employment by Class of Employer in Greencastle
Among the 4,297 employed individuals in Greencastle, private company employees (3,124 | 72.7%), not-for-profit organizations (524 | 12.2%), and local government employees (367 | 8.5%) make up the most common classes of employment.
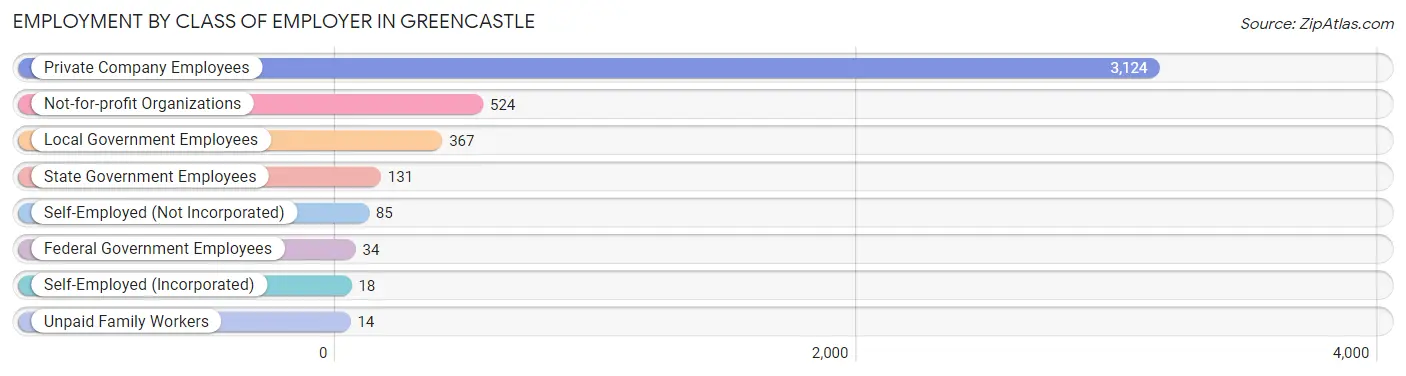
| Employer Class | # Employees | % Employees |
| Private Company Employees | 3,124 | 72.7% |
| Self-Employed (Incorporated) | 18 | 0.4% |
| Self-Employed (Not Incorporated) | 85 | 2.0% |
| Not-for-profit Organizations | 524 | 12.2% |
| Local Government Employees | 367 | 8.5% |
| State Government Employees | 131 | 3.0% |
| Federal Government Employees | 34 | 0.8% |
| Unpaid Family Workers | 14 | 0.3% |
| Total | 4,297 | 100.0% |
Employment Status by Age in Greencastle
According to the labor force statistics for Greencastle, out of the total population over 16 years of age (8,404), 53.9% or 4,530 individuals are in the labor force, with 1.1% or 50 of them unemployed. The age group with the highest labor force participation rate is 30 to 34 years, with 93.9% or 445 individuals in the labor force. Within the labor force, the 45 to 54 years age range has the highest percentage of unemployed individuals, with 4.6% or 26 of them being unemployed.
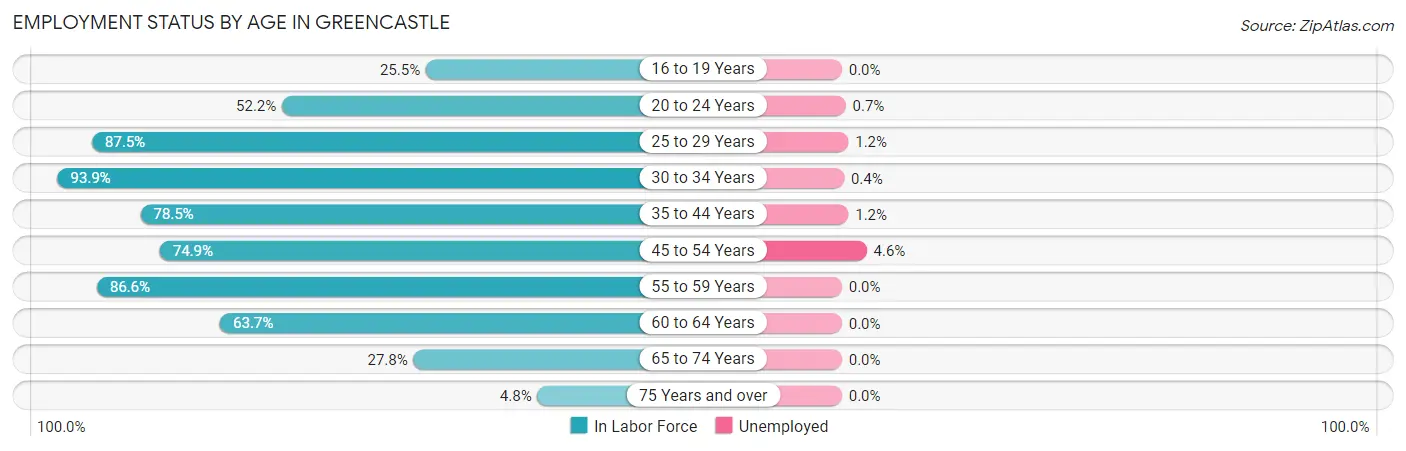
| Age Bracket | In Labor Force | Unemployed |
| 16 to 19 Years | 280 (25.5%) | 0 (0.0%) |
| 20 to 24 Years | 1,083 (52.2%) | 8 (0.7%) |
| 25 to 29 Years | 586 (87.5%) | 7 (1.2%) |
| 30 to 34 Years | 445 (93.9%) | 2 (0.4%) |
| 35 to 44 Years | 760 (78.5%) | 9 (1.2%) |
| 45 to 54 Years | 564 (74.9%) | 26 (4.6%) |
| 55 to 59 Years | 265 (86.6%) | 0 (0.0%) |
| 60 to 64 Years | 310 (63.7%) | 0 (0.0%) |
| 65 to 74 Years | 195 (27.8%) | 0 (0.0%) |
| 75 Years and over | 42 (4.8%) | 0 (0.0%) |
| Total | 4,530 (53.9%) | 50 (1.1%) |
Employment Status by Educational Attainment in Greencastle
According to labor force statistics for Greencastle, 80.1% of individuals (2,930) out of the total population between 25 and 64 years of age (3,658) are in the labor force, with 1.5% or 44 of them being unemployed. The group with the highest labor force participation rate are those with the educational attainment of college / associate degree, with 86.2% or 1,063 individuals in the labor force. Within the labor force, individuals with college / associate degree education have the highest percentage of unemployment, with 2.4% or 26 of them being unemployed.
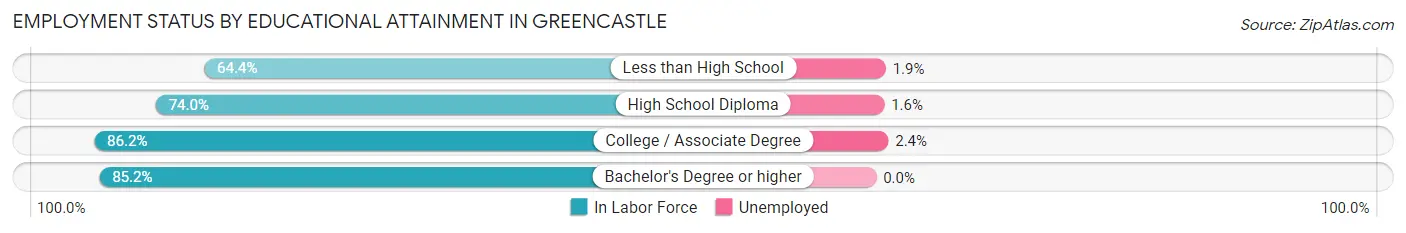
| Educational Attainment | In Labor Force | Unemployed |
| Less than High School | 212 (64.4%) | 6 (1.9%) |
| High School Diploma | 870 (74.0%) | 19 (1.6%) |
| College / Associate Degree | 1,063 (86.2%) | 30 (2.4%) |
| Bachelor's Degree or higher | 785 (85.2%) | 0 (0.0%) |
| Total | 2,930 (80.1%) | 55 (1.5%) |
Employment Occupations by Sex in Greencastle
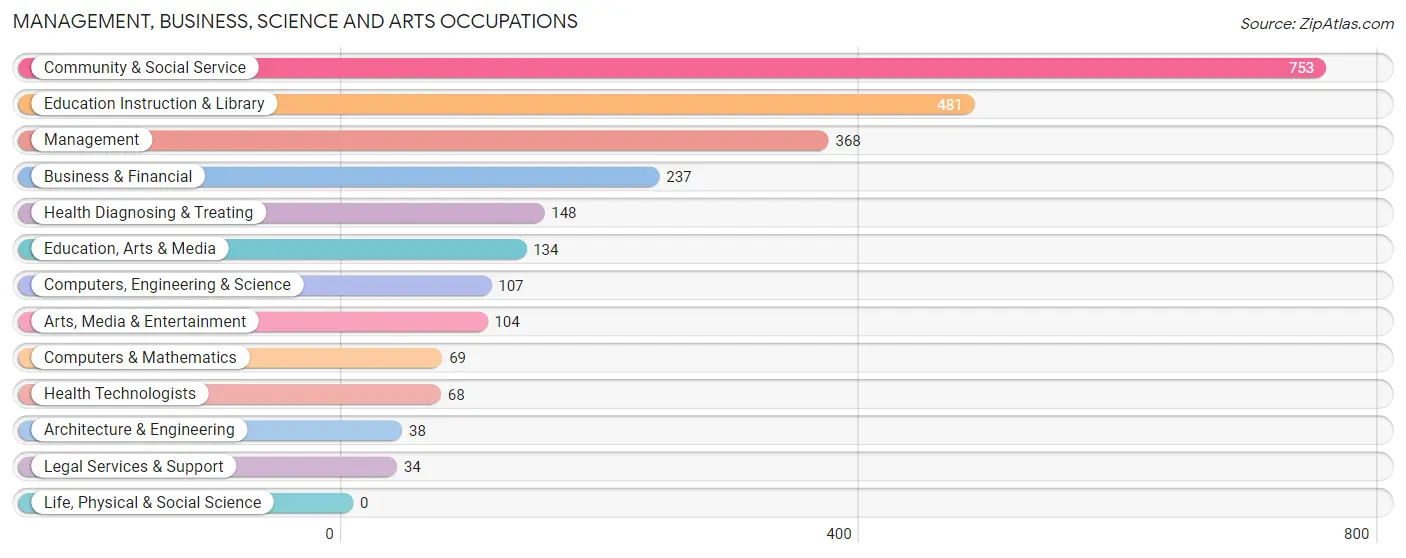
Management, Business, Science and Arts Occupations
The most common Management, Business, Science and Arts occupations in Greencastle are Community & Social Service (753 | 16.9%), Education Instruction & Library (481 | 10.8%), Management (368 | 8.3%), Business & Financial (237 | 5.3%), and Health Diagnosing & Treating (148 | 3.3%).
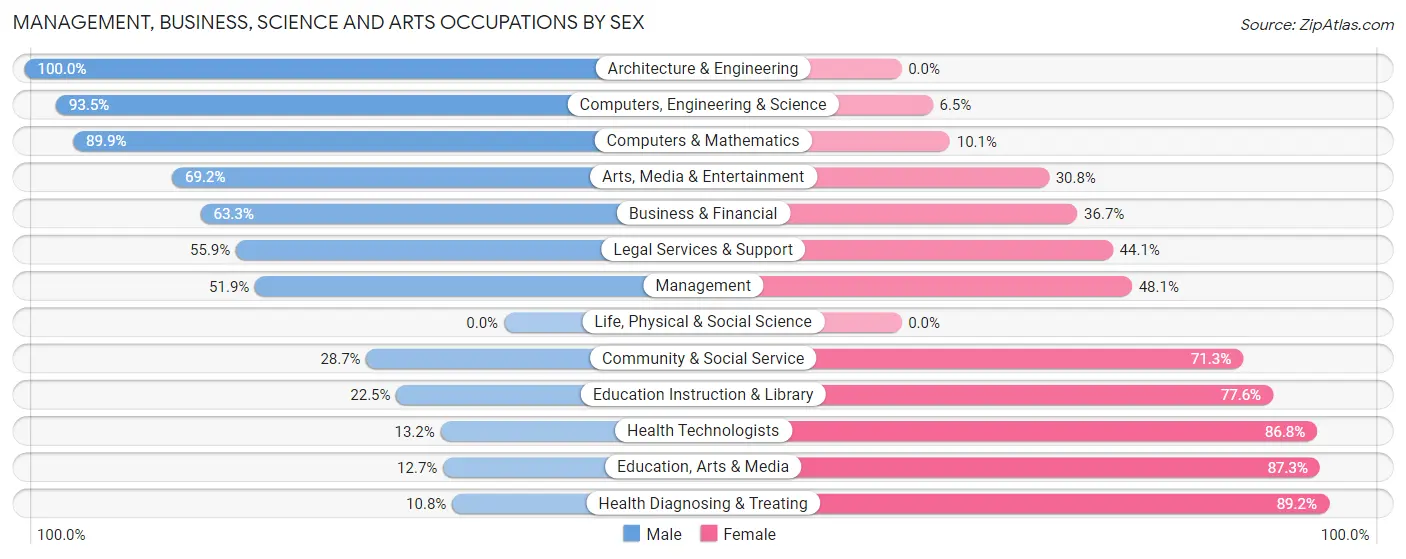
Management, Business, Science and Arts Occupations by Sex
Within the Management, Business, Science and Arts occupations in Greencastle, the most male-oriented occupations are Architecture & Engineering (100.0%), Computers, Engineering & Science (93.5%), and Computers & Mathematics (89.9%), while the most female-oriented occupations are Health Diagnosing & Treating (89.2%), Education, Arts & Media (87.3%), and Health Technologists (86.8%).
| Occupation | Male | Female |
| Management | 191 (51.9%) | 177 (48.1%) |
| Business & Financial | 150 (63.3%) | 87 (36.7%) |
| Computers, Engineering & Science | 100 (93.5%) | 7 (6.5%) |
| Computers & Mathematics | 62 (89.9%) | 7 (10.1%) |
| Architecture & Engineering | 38 (100.0%) | 0 (0.0%) |
| Life, Physical & Social Science | 0 (0.0%) | 0 (0.0%) |
| Community & Social Service | 216 (28.7%) | 537 (71.3%) |
| Education, Arts & Media | 17 (12.7%) | 117 (87.3%) |
| Legal Services & Support | 19 (55.9%) | 15 (44.1%) |
| Education Instruction & Library | 108 (22.5%) | 373 (77.5%) |
| Arts, Media & Entertainment | 72 (69.2%) | 32 (30.8%) |
| Health Diagnosing & Treating | 16 (10.8%) | 132 (89.2%) |
| Health Technologists | 9 (13.2%) | 59 (86.8%) |
| Total (Category) | 673 (41.7%) | 940 (58.3%) |
| Total (Overall) | 2,177 (48.8%) | 2,280 (51.2%) |
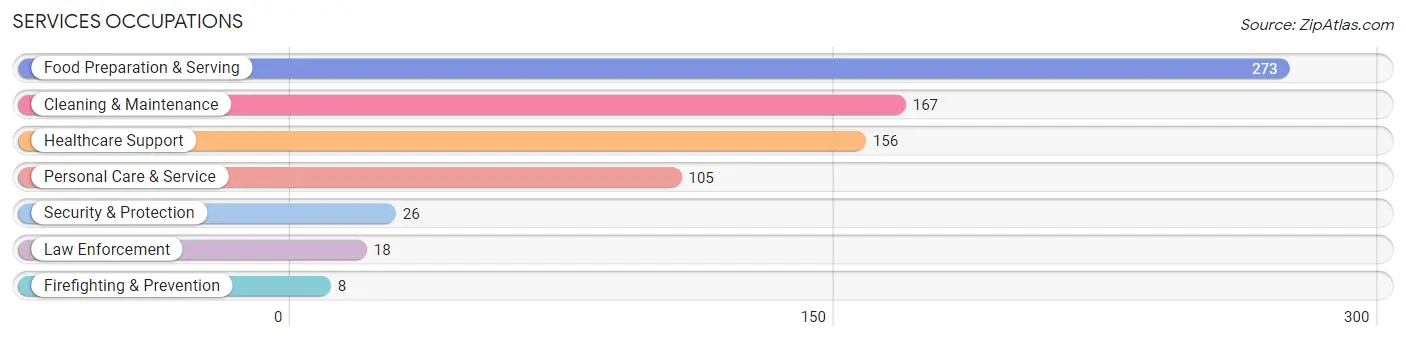
Services Occupations
The most common Services occupations in Greencastle are Food Preparation & Serving (273 | 6.1%), Cleaning & Maintenance (167 | 3.7%), Healthcare Support (156 | 3.5%), Personal Care & Service (105 | 2.4%), and Security & Protection (26 | 0.6%).
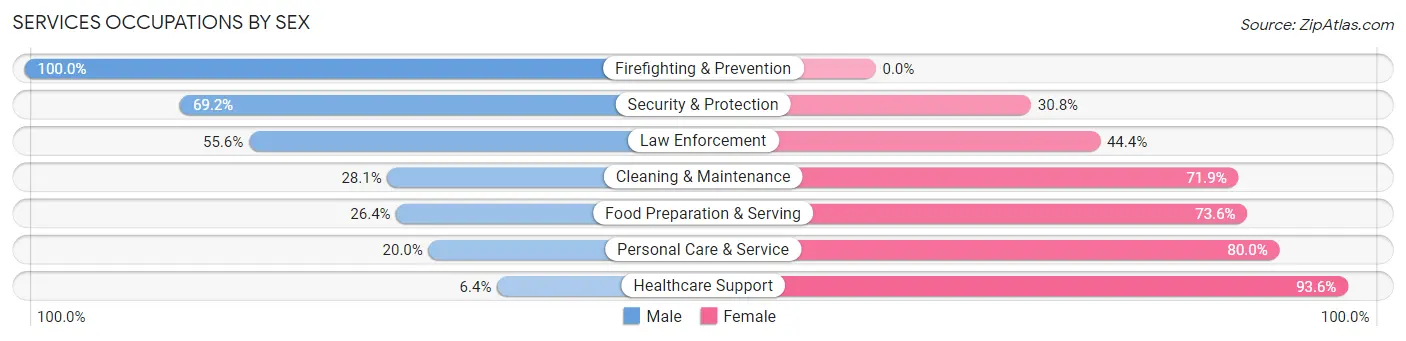
Services Occupations by Sex
Within the Services occupations in Greencastle, the most male-oriented occupations are Firefighting & Prevention (100.0%), Security & Protection (69.2%), and Law Enforcement (55.6%), while the most female-oriented occupations are Healthcare Support (93.6%), Personal Care & Service (80.0%), and Food Preparation & Serving (73.6%).
| Occupation | Male | Female |
| Healthcare Support | 10 (6.4%) | 146 (93.6%) |
| Security & Protection | 18 (69.2%) | 8 (30.8%) |
| Firefighting & Prevention | 8 (100.0%) | 0 (0.0%) |
| Law Enforcement | 10 (55.6%) | 8 (44.4%) |
| Food Preparation & Serving | 72 (26.4%) | 201 (73.6%) |
| Cleaning & Maintenance | 47 (28.1%) | 120 (71.9%) |
| Personal Care & Service | 21 (20.0%) | 84 (80.0%) |
| Total (Category) | 168 (23.1%) | 559 (76.9%) |
| Total (Overall) | 2,177 (48.8%) | 2,280 (51.2%) |
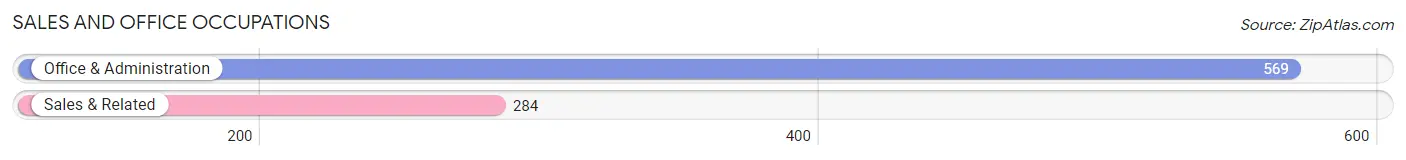
Sales and Office Occupations
The most common Sales and Office occupations in Greencastle are Office & Administration (569 | 12.8%), and Sales & Related (284 | 6.4%).
Sales and Office Occupations by Sex
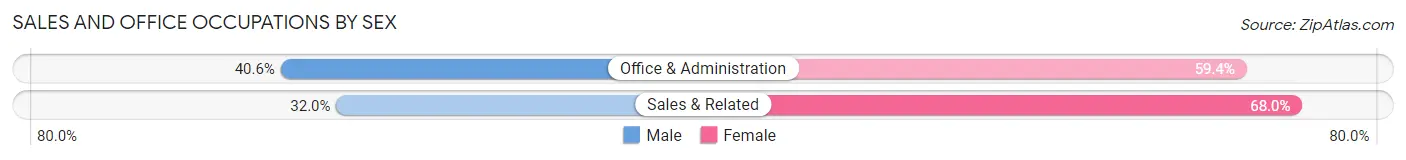
| Occupation | Male | Female |
| Sales & Related | 91 (32.0%) | 193 (68.0%) |
| Office & Administration | 231 (40.6%) | 338 (59.4%) |
| Total (Category) | 322 (37.8%) | 531 (62.3%) |
| Total (Overall) | 2,177 (48.8%) | 2,280 (51.2%) |
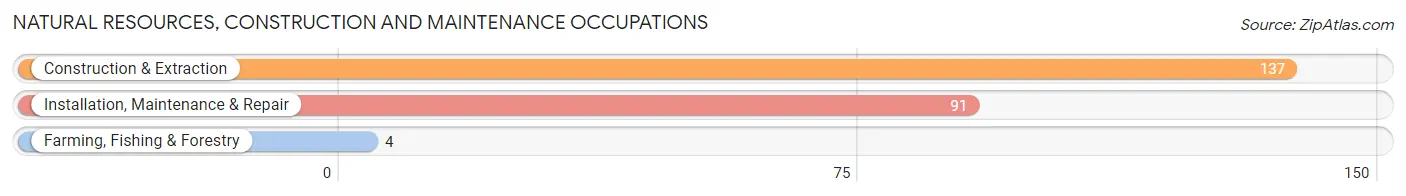
Natural Resources, Construction and Maintenance Occupations
The most common Natural Resources, Construction and Maintenance occupations in Greencastle are Construction & Extraction (137 | 3.1%), Installation, Maintenance & Repair (91 | 2.0%), and Farming, Fishing & Forestry (4 | 0.1%).
Natural Resources, Construction and Maintenance Occupations by Sex
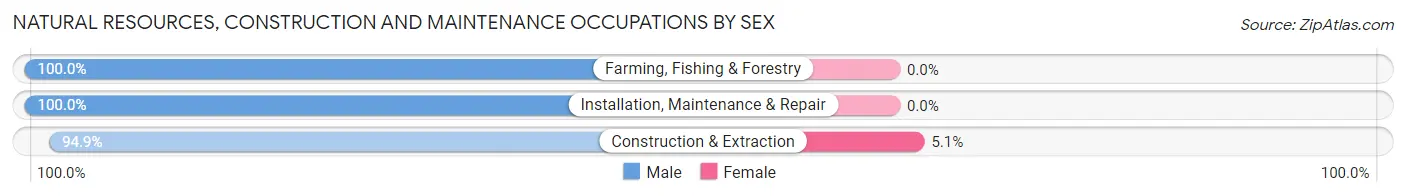
| Occupation | Male | Female |
| Farming, Fishing & Forestry | 4 (100.0%) | 0 (0.0%) |
| Construction & Extraction | 130 (94.9%) | 7 (5.1%) |
| Installation, Maintenance & Repair | 91 (100.0%) | 0 (0.0%) |
| Total (Category) | 225 (97.0%) | 7 (3.0%) |
| Total (Overall) | 2,177 (48.8%) | 2,280 (51.2%) |
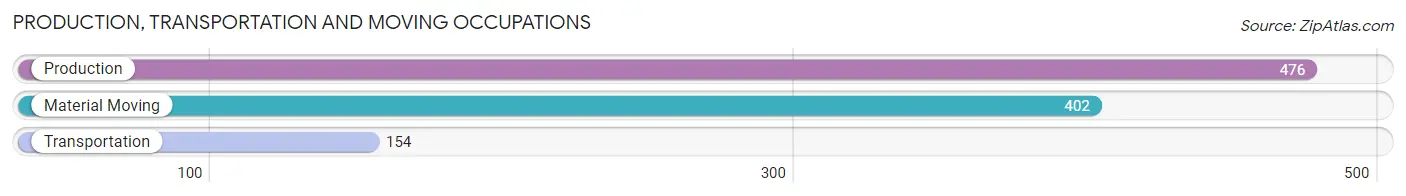
Production, Transportation and Moving Occupations
The most common Production, Transportation and Moving occupations in Greencastle are Production (476 | 10.7%), Material Moving (402 | 9.0%), and Transportation (154 | 3.5%).
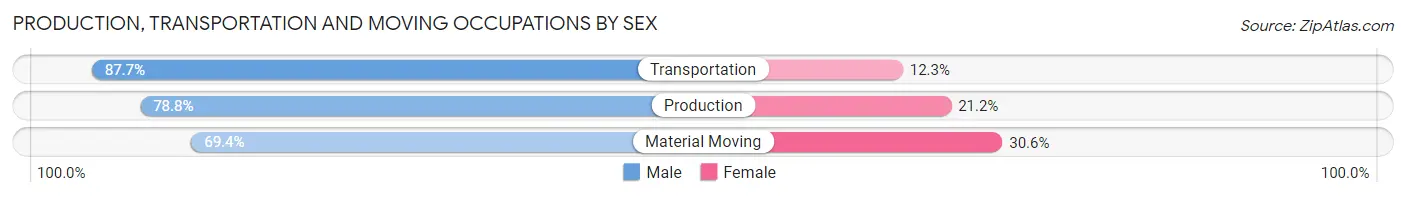
Production, Transportation and Moving Occupations by Sex
| Occupation | Male | Female |
| Production | 375 (78.8%) | 101 (21.2%) |
| Transportation | 135 (87.7%) | 19 (12.3%) |
| Material Moving | 279 (69.4%) | 123 (30.6%) |
| Total (Category) | 789 (76.4%) | 243 (23.5%) |
| Total (Overall) | 2,177 (48.8%) | 2,280 (51.2%) |
Employment Industries by Sex in Greencastle
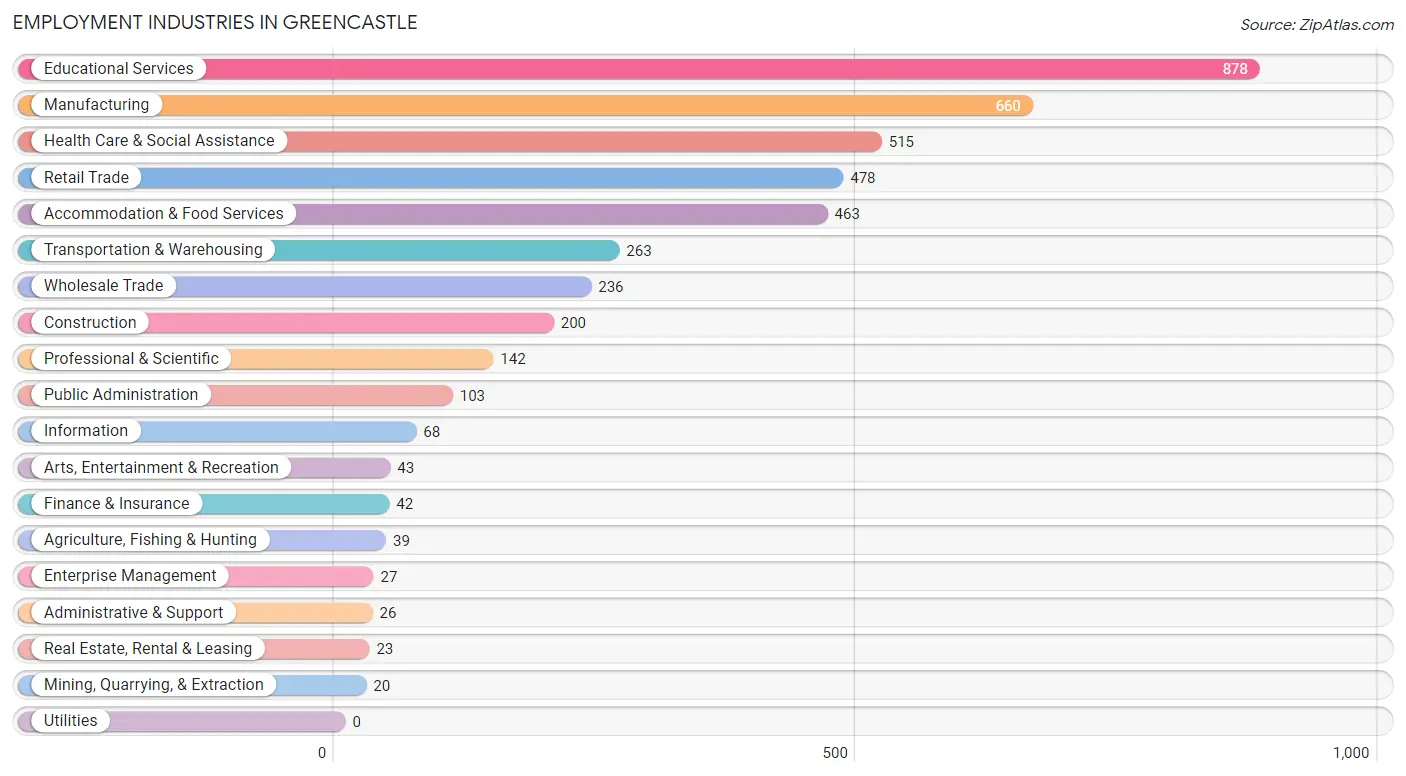
Employment Industries in Greencastle
The major employment industries in Greencastle include Educational Services (878 | 19.7%), Manufacturing (660 | 14.8%), Health Care & Social Assistance (515 | 11.6%), Retail Trade (478 | 10.7%), and Accommodation & Food Services (463 | 10.4%).
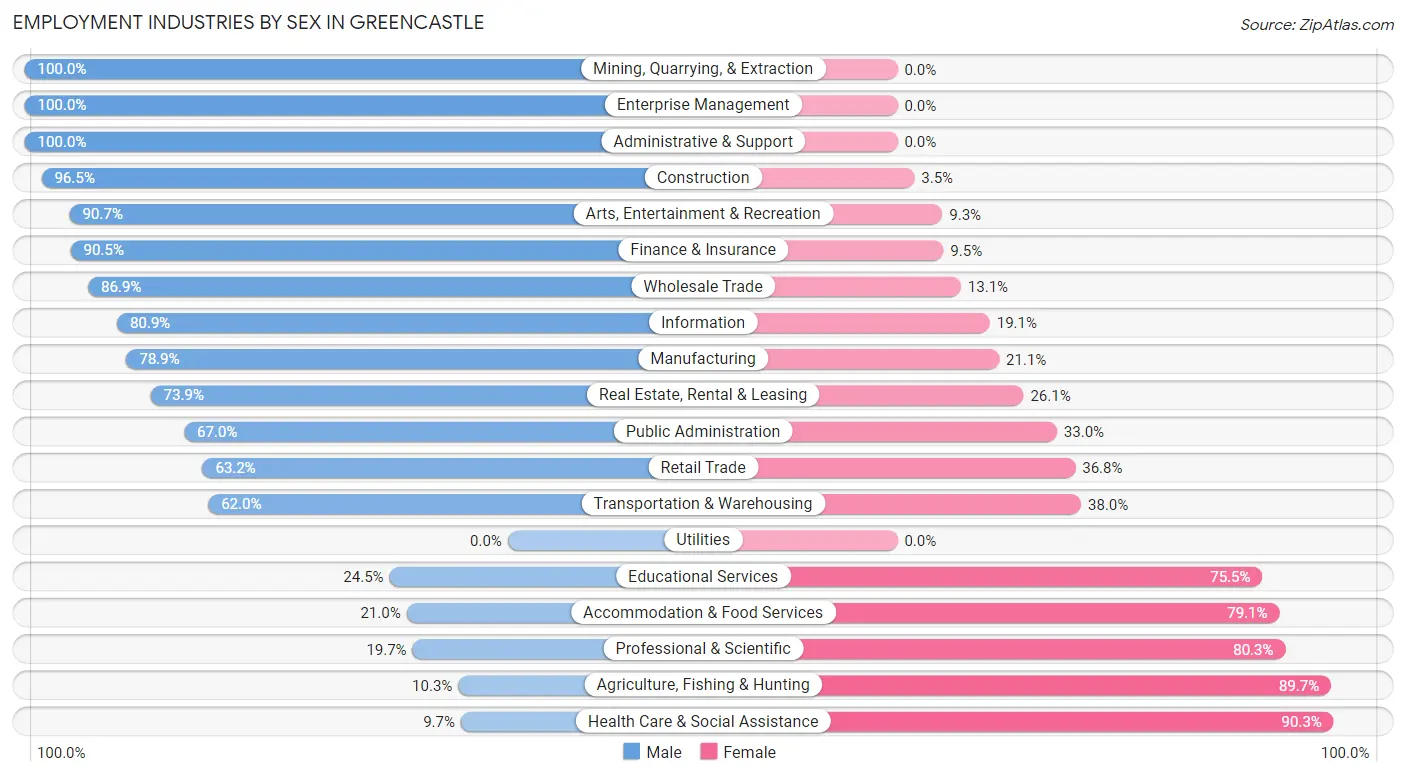
Employment Industries by Sex in Greencastle
The Greencastle industries that see more men than women are Mining, Quarrying, & Extraction (100.0%), Enterprise Management (100.0%), and Administrative & Support (100.0%), whereas the industries that tend to have a higher number of women are Health Care & Social Assistance (90.3%), Agriculture, Fishing & Hunting (89.7%), and Professional & Scientific (80.3%).
| Industry | Male | Female |
| Agriculture, Fishing & Hunting | 4 (10.3%) | 35 (89.7%) |
| Mining, Quarrying, & Extraction | 20 (100.0%) | 0 (0.0%) |
| Construction | 193 (96.5%) | 7 (3.5%) |
| Manufacturing | 521 (78.9%) | 139 (21.1%) |
| Wholesale Trade | 205 (86.9%) | 31 (13.1%) |
| Retail Trade | 302 (63.2%) | 176 (36.8%) |
| Transportation & Warehousing | 163 (62.0%) | 100 (38.0%) |
| Utilities | 0 (0.0%) | 0 (0.0%) |
| Information | 55 (80.9%) | 13 (19.1%) |
| Finance & Insurance | 38 (90.5%) | 4 (9.5%) |
| Real Estate, Rental & Leasing | 17 (73.9%) | 6 (26.1%) |
| Professional & Scientific | 28 (19.7%) | 114 (80.3%) |
| Enterprise Management | 27 (100.0%) | 0 (0.0%) |
| Administrative & Support | 26 (100.0%) | 0 (0.0%) |
| Educational Services | 215 (24.5%) | 663 (75.5%) |
| Health Care & Social Assistance | 50 (9.7%) | 465 (90.3%) |
| Arts, Entertainment & Recreation | 39 (90.7%) | 4 (9.3%) |
| Accommodation & Food Services | 97 (20.9%) | 366 (79.0%) |
| Public Administration | 69 (67.0%) | 34 (33.0%) |
| Total | 2,177 (48.8%) | 2,280 (51.2%) |
Education in Greencastle
School Enrollment in Greencastle
The most common levels of schooling among the 3,711 students in Greencastle are college / undergraduate (2,461 | 66.3%), elementary school (353 | 9.5%), and middle school (341 | 9.2%).
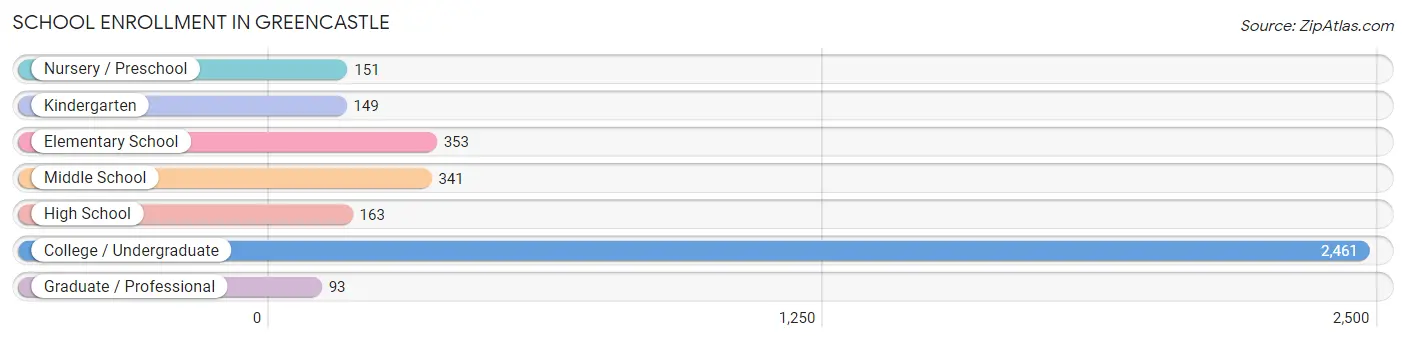
| School Level | # Students | % Students |
| Nursery / Preschool | 151 | 4.1% |
| Kindergarten | 149 | 4.0% |
| Elementary School | 353 | 9.5% |
| Middle School | 341 | 9.2% |
| High School | 163 | 4.4% |
| College / Undergraduate | 2,461 | 66.3% |
| Graduate / Professional | 93 | 2.5% |
| Total | 3,711 | 100.0% |
School Enrollment by Age by Funding Source in Greencastle
Out of a total of 3,711 students who are enrolled in schools in Greencastle, 2,201 (59.3%) attend a private institution, while the remaining 1,510 (40.7%) are enrolled in public schools. The age group of 20 to 24 year olds has the highest likelihood of being enrolled in private schools, with 1,338 (86.9% in the age bracket) enrolled. Conversely, the age group of 5 to 9 year old has the lowest likelihood of being enrolled in a private school, with 490 (96.5% in the age bracket) attending a public institution.
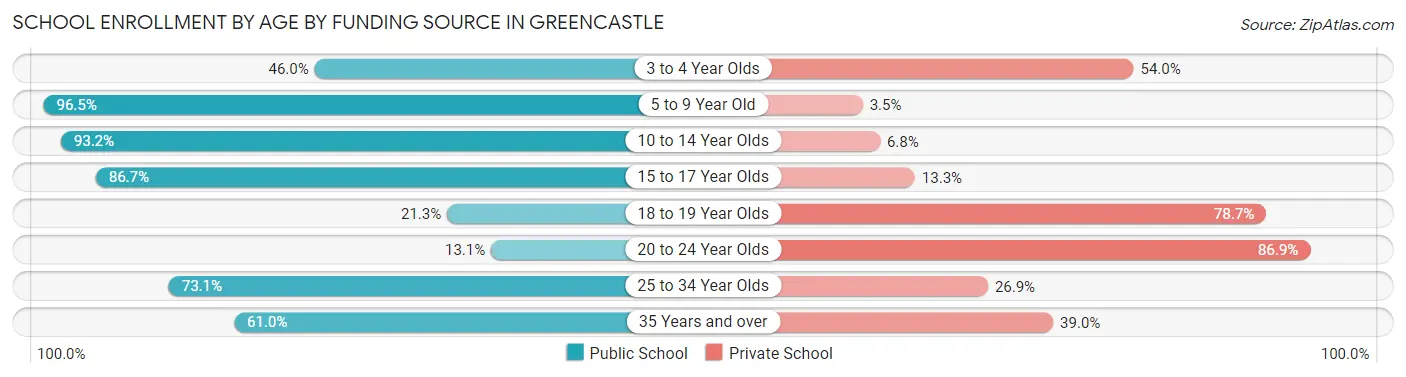
| Age Bracket | Public School | Private School |
| 3 to 4 Year Olds | 46 (46.0%) | 54 (54.0%) |
| 5 to 9 Year Old | 490 (96.5%) | 18 (3.5%) |
| 10 to 14 Year Olds | 386 (93.2%) | 28 (6.8%) |
| 15 to 17 Year Olds | 98 (86.7%) | 15 (13.3%) |
| 18 to 19 Year Olds | 189 (21.3%) | 698 (78.7%) |
| 20 to 24 Year Olds | 202 (13.1%) | 1,338 (86.9%) |
| 25 to 34 Year Olds | 49 (73.1%) | 18 (26.9%) |
| 35 Years and over | 50 (61.0%) | 32 (39.0%) |
| Total | 1,510 (40.7%) | 2,201 (59.3%) |
Educational Attainment by Field of Study in Greencastle
Education (349 | 24.2%), business (180 | 12.5%), science & technology (135 | 9.4%), social sciences (116 | 8.0%), and engineering (112 | 7.8%) are the most common fields of study among 1,443 individuals in Greencastle who have obtained a bachelor's degree or higher.
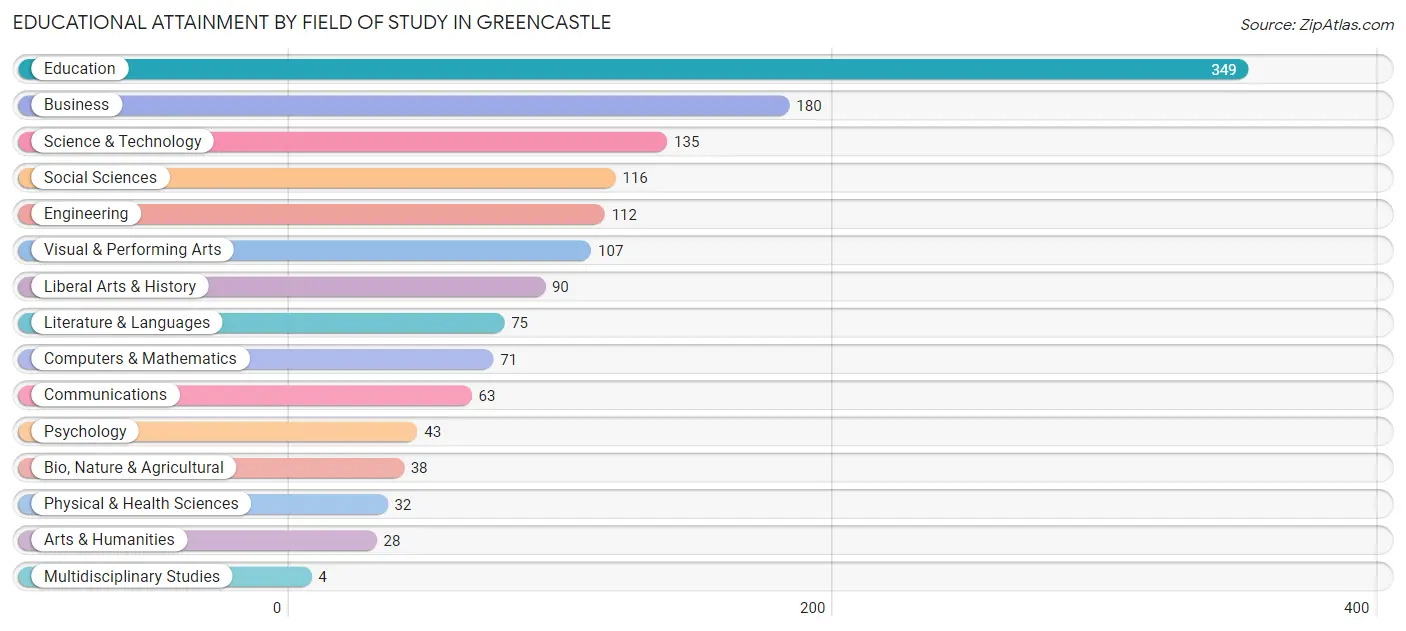
| Field of Study | # Graduates | % Graduates |
| Computers & Mathematics | 71 | 4.9% |
| Bio, Nature & Agricultural | 38 | 2.6% |
| Physical & Health Sciences | 32 | 2.2% |
| Psychology | 43 | 3.0% |
| Social Sciences | 116 | 8.0% |
| Engineering | 112 | 7.8% |
| Multidisciplinary Studies | 4 | 0.3% |
| Science & Technology | 135 | 9.4% |
| Business | 180 | 12.5% |
| Education | 349 | 24.2% |
| Literature & Languages | 75 | 5.2% |
| Liberal Arts & History | 90 | 6.2% |
| Visual & Performing Arts | 107 | 7.4% |
| Communications | 63 | 4.4% |
| Arts & Humanities | 28 | 1.9% |
| Total | 1,443 | 100.0% |
Transportation & Commute in Greencastle
Vehicle Availability by Sex in Greencastle
The most prevalent vehicle ownership categories in Greencastle are males with 2 vehicles (716, accounting for 38.0%) and females with 2 vehicles (619, making up 44.6%).
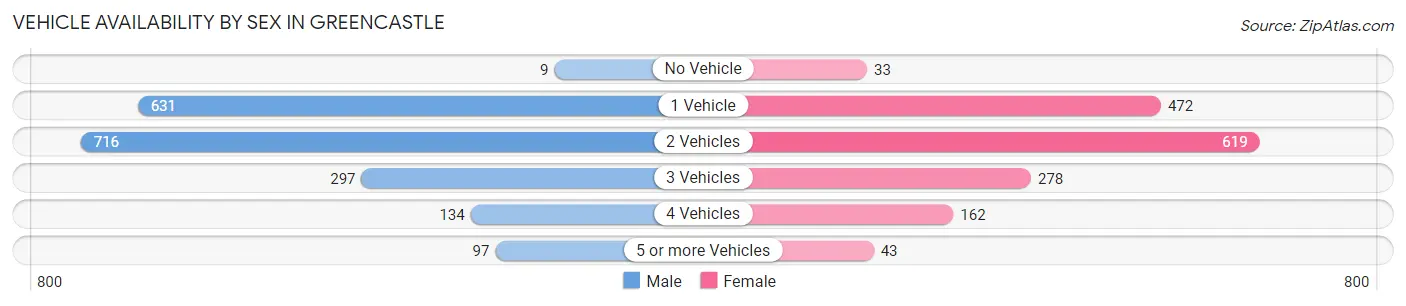
| Vehicles Available | Male | Female |
| No Vehicle | 9 (0.5%) | 33 (2.1%) |
| 1 Vehicle | 631 (33.5%) | 472 (29.4%) |
| 2 Vehicles | 716 (38.0%) | 619 (38.5%) |
| 3 Vehicles | 297 (15.8%) | 278 (17.3%) |
| 4 Vehicles | 134 (7.1%) | 162 (10.1%) |
| 5 or more Vehicles | 97 (5.1%) | 43 (2.7%) |
| Total | 1,884 (100.0%) | 1,607 (100.0%) |
Commute Time in Greencastle
The most frequently occuring commute durations in Greencastle are 5 to 9 minutes (1,202 commuters, 32.0%), 10 to 14 minutes (880 commuters, 23.4%), and 15 to 19 minutes (415 commuters, 11.0%).
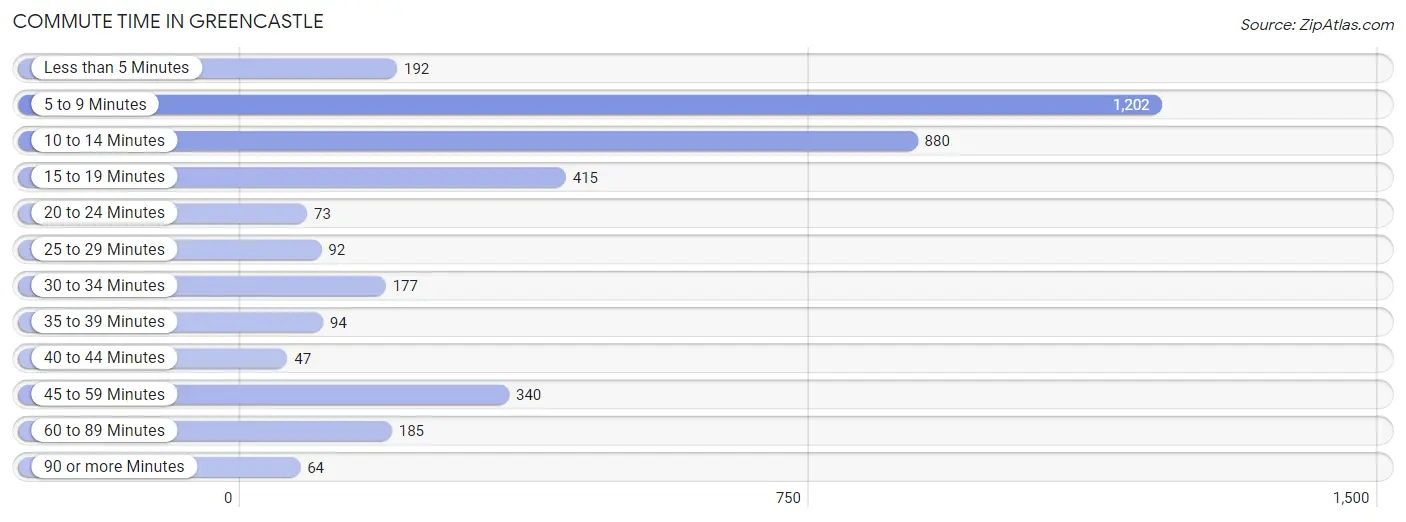
| Commute Time | # Commuters | % Commuters |
| Less than 5 Minutes | 192 | 5.1% |
| 5 to 9 Minutes | 1,202 | 32.0% |
| 10 to 14 Minutes | 880 | 23.4% |
| 15 to 19 Minutes | 415 | 11.0% |
| 20 to 24 Minutes | 73 | 1.9% |
| 25 to 29 Minutes | 92 | 2.5% |
| 30 to 34 Minutes | 177 | 4.7% |
| 35 to 39 Minutes | 94 | 2.5% |
| 40 to 44 Minutes | 47 | 1.3% |
| 45 to 59 Minutes | 340 | 9.0% |
| 60 to 89 Minutes | 185 | 4.9% |
| 90 or more Minutes | 64 | 1.7% |
Commute Time by Sex in Greencastle
The most common commute times in Greencastle are 5 to 9 minutes (552 commuters, 29.2%) for males and 5 to 9 minutes (650 commuters, 34.7%) for females.
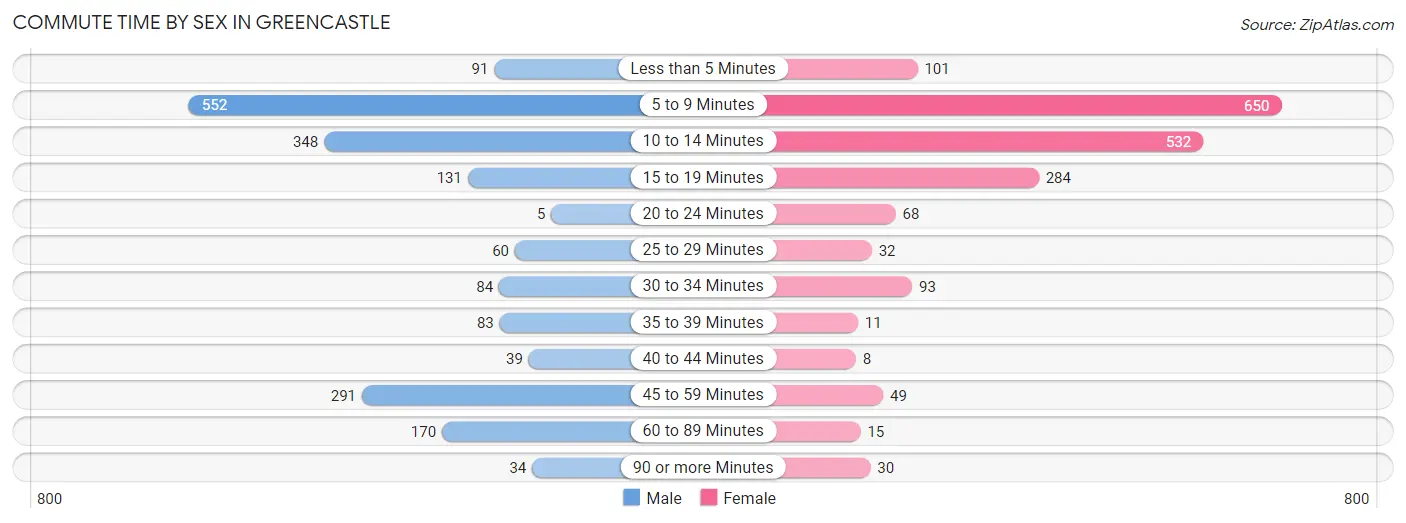
| Commute Time | Male | Female |
| Less than 5 Minutes | 91 (4.8%) | 101 (5.4%) |
| 5 to 9 Minutes | 552 (29.2%) | 650 (34.7%) |
| 10 to 14 Minutes | 348 (18.4%) | 532 (28.4%) |
| 15 to 19 Minutes | 131 (6.9%) | 284 (15.2%) |
| 20 to 24 Minutes | 5 (0.3%) | 68 (3.6%) |
| 25 to 29 Minutes | 60 (3.2%) | 32 (1.7%) |
| 30 to 34 Minutes | 84 (4.4%) | 93 (5.0%) |
| 35 to 39 Minutes | 83 (4.4%) | 11 (0.6%) |
| 40 to 44 Minutes | 39 (2.1%) | 8 (0.4%) |
| 45 to 59 Minutes | 291 (15.4%) | 49 (2.6%) |
| 60 to 89 Minutes | 170 (9.0%) | 15 (0.8%) |
| 90 or more Minutes | 34 (1.8%) | 30 (1.6%) |
Time of Departure to Work by Sex in Greencastle
The most frequent times of departure to work in Greencastle are 7:30 AM to 7:59 AM (224, 11.9%) for males and 7:30 AM to 7:59 AM (343, 18.3%) for females.
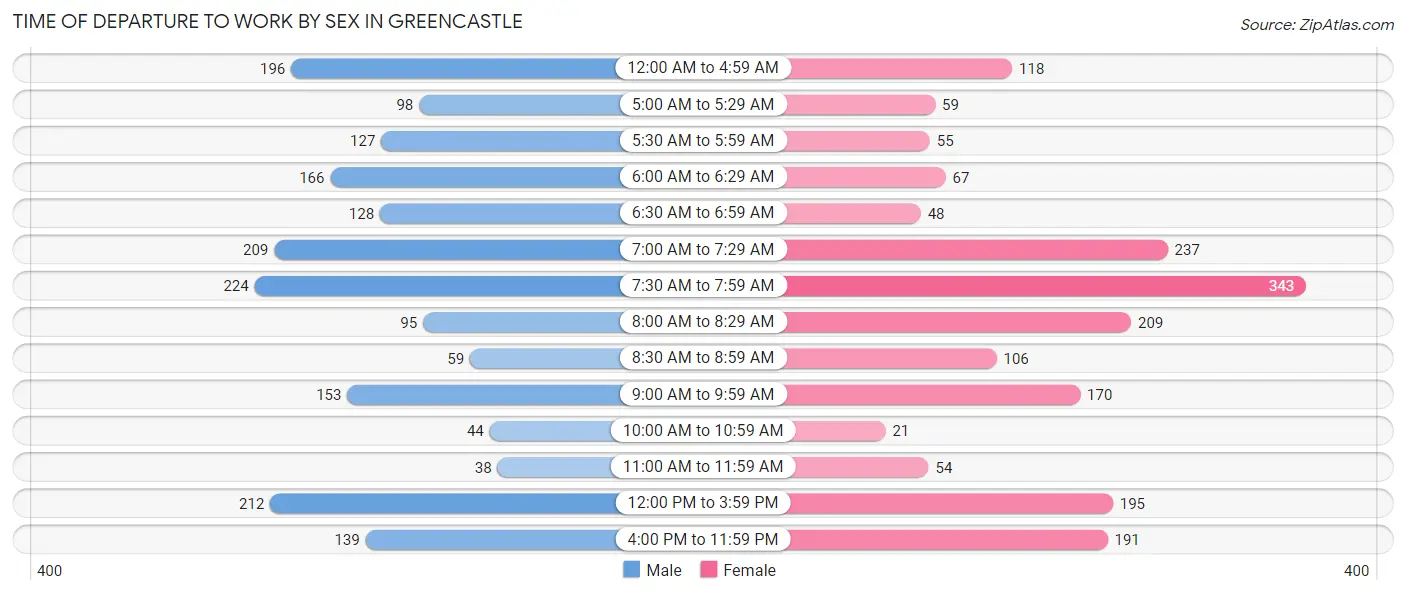
| Time of Departure | Male | Female |
| 12:00 AM to 4:59 AM | 196 (10.4%) | 118 (6.3%) |
| 5:00 AM to 5:29 AM | 98 (5.2%) | 59 (3.2%) |
| 5:30 AM to 5:59 AM | 127 (6.7%) | 55 (2.9%) |
| 6:00 AM to 6:29 AM | 166 (8.8%) | 67 (3.6%) |
| 6:30 AM to 6:59 AM | 128 (6.8%) | 48 (2.6%) |
| 7:00 AM to 7:29 AM | 209 (11.1%) | 237 (12.7%) |
| 7:30 AM to 7:59 AM | 224 (11.9%) | 343 (18.3%) |
| 8:00 AM to 8:29 AM | 95 (5.0%) | 209 (11.2%) |
| 8:30 AM to 8:59 AM | 59 (3.1%) | 106 (5.7%) |
| 9:00 AM to 9:59 AM | 153 (8.1%) | 170 (9.1%) |
| 10:00 AM to 10:59 AM | 44 (2.3%) | 21 (1.1%) |
| 11:00 AM to 11:59 AM | 38 (2.0%) | 54 (2.9%) |
| 12:00 PM to 3:59 PM | 212 (11.2%) | 195 (10.4%) |
| 4:00 PM to 11:59 PM | 139 (7.4%) | 191 (10.2%) |
| Total | 1,888 (100.0%) | 1,873 (100.0%) |
Housing Occupancy in Greencastle
Occupancy by Ownership in Greencastle
Of the total 3,453 dwellings in Greencastle, owner-occupied units account for 1,545 (44.7%), while renter-occupied units make up 1,908 (55.3%).
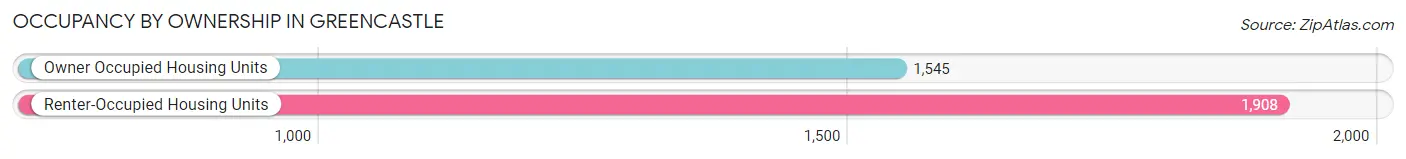
| Occupancy | # Housing Units | % Housing Units |
| Owner Occupied Housing Units | 1,545 | 44.7% |
| Renter-Occupied Housing Units | 1,908 | 55.3% |
| Total Occupied Housing Units | 3,453 | 100.0% |
Occupancy by Household Size in Greencastle
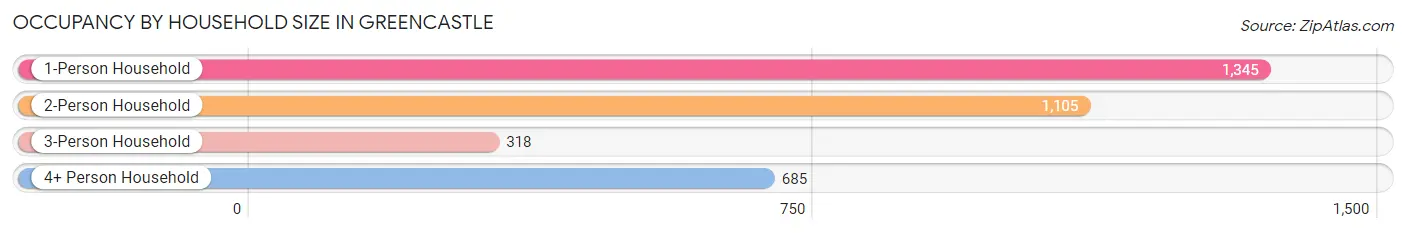
| Household Size | # Housing Units | % Housing Units |
| 1-Person Household | 1,345 | 39.0% |
| 2-Person Household | 1,105 | 32.0% |
| 3-Person Household | 318 | 9.2% |
| 4+ Person Household | 685 | 19.8% |
| Total Housing Units | 3,453 | 100.0% |
Occupancy by Ownership by Household Size in Greencastle
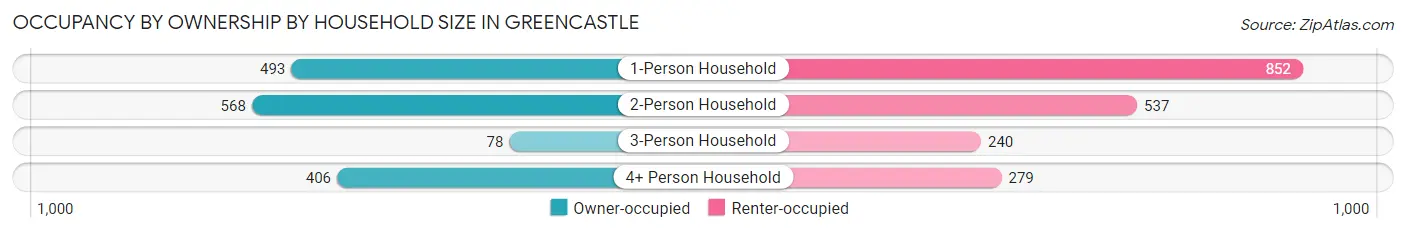
| Household Size | Owner-occupied | Renter-occupied |
| 1-Person Household | 493 (36.6%) | 852 (63.3%) |
| 2-Person Household | 568 (51.4%) | 537 (48.6%) |
| 3-Person Household | 78 (24.5%) | 240 (75.5%) |
| 4+ Person Household | 406 (59.3%) | 279 (40.7%) |
| Total Housing Units | 1,545 (44.7%) | 1,908 (55.3%) |
Occupancy by Educational Attainment in Greencastle
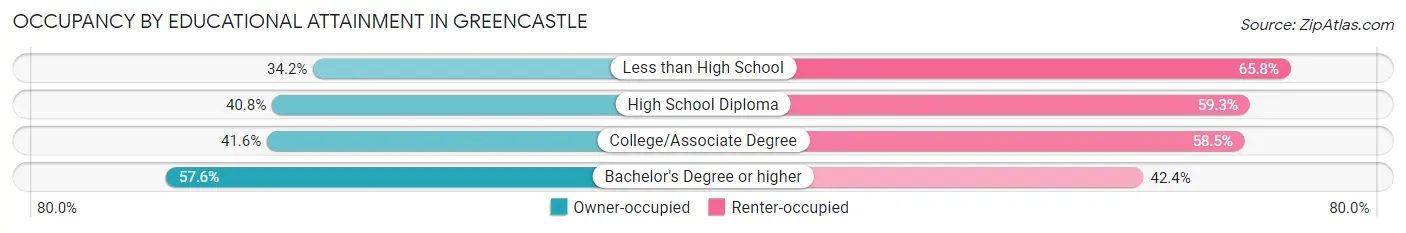
| Household Size | Owner-occupied | Renter-occupied |
| Less than High School | 115 (34.2%) | 221 (65.8%) |
| High School Diploma | 509 (40.7%) | 740 (59.3%) |
| College/Associate Degree | 401 (41.5%) | 564 (58.5%) |
| Bachelor's Degree or higher | 520 (57.6%) | 383 (42.4%) |
Occupancy by Age of Householder in Greencastle
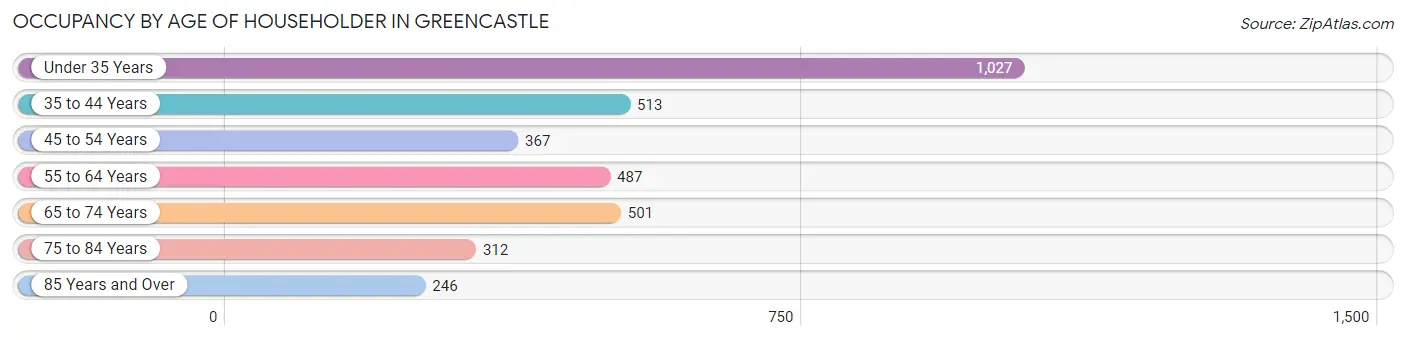
| Age Bracket | # Households | % Households |
| Under 35 Years | 1,027 | 29.7% |
| 35 to 44 Years | 513 | 14.9% |
| 45 to 54 Years | 367 | 10.6% |
| 55 to 64 Years | 487 | 14.1% |
| 65 to 74 Years | 501 | 14.5% |
| 75 to 84 Years | 312 | 9.0% |
| 85 Years and Over | 246 | 7.1% |
| Total | 3,453 | 100.0% |
Housing Finances in Greencastle
Median Income by Occupancy in Greencastle
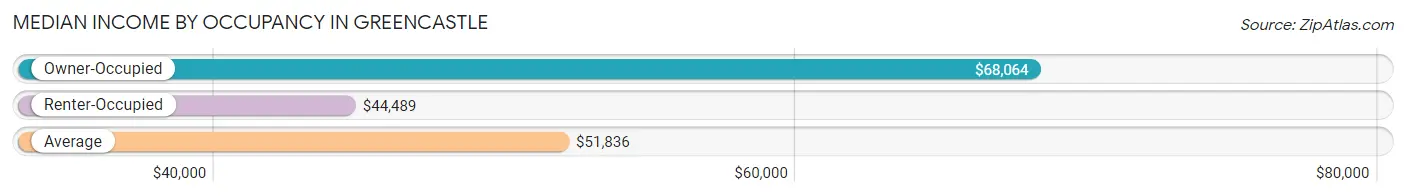
| Occupancy Type | # Households | Median Income |
| Owner-Occupied | 1,545 (44.7%) | $68,064 |
| Renter-Occupied | 1,908 (55.3%) | $44,489 |
| Average | 3,453 (100.0%) | $51,836 |
Occupancy by Householder Income Bracket in Greencastle
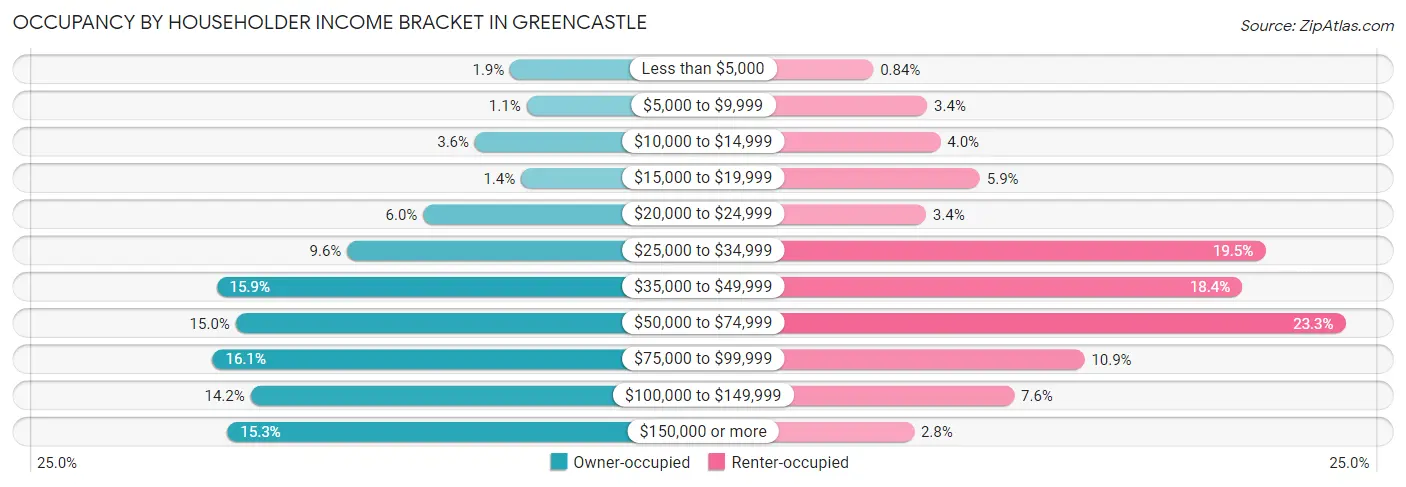
| Income Bracket | Owner-occupied | Renter-occupied |
| Less than $5,000 | 29 (1.9%) | 16 (0.8%) |
| $5,000 to $9,999 | 17 (1.1%) | 65 (3.4%) |
| $10,000 to $14,999 | 55 (3.6%) | 77 (4.0%) |
| $15,000 to $19,999 | 21 (1.4%) | 113 (5.9%) |
| $20,000 to $24,999 | 93 (6.0%) | 64 (3.4%) |
| $25,000 to $34,999 | 149 (9.6%) | 372 (19.5%) |
| $35,000 to $49,999 | 245 (15.9%) | 351 (18.4%) |
| $50,000 to $74,999 | 231 (14.9%) | 445 (23.3%) |
| $75,000 to $99,999 | 248 (16.1%) | 208 (10.9%) |
| $100,000 to $149,999 | 220 (14.2%) | 144 (7.5%) |
| $150,000 or more | 237 (15.3%) | 53 (2.8%) |
| Total | 1,545 (100.0%) | 1,908 (100.0%) |
Monthly Housing Cost Tiers in Greencastle
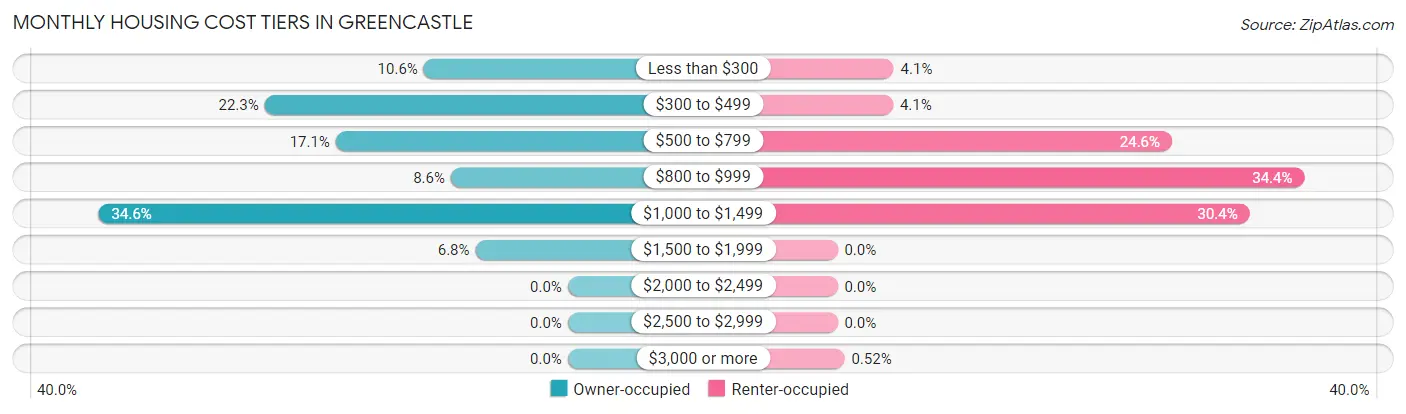
| Monthly Cost | Owner-occupied | Renter-occupied |
| Less than $300 | 164 (10.6%) | 79 (4.1%) |
| $300 to $499 | 345 (22.3%) | 78 (4.1%) |
| $500 to $799 | 264 (17.1%) | 470 (24.6%) |
| $800 to $999 | 133 (8.6%) | 656 (34.4%) |
| $1,000 to $1,499 | 534 (34.6%) | 579 (30.3%) |
| $1,500 to $1,999 | 105 (6.8%) | 0 (0.0%) |
| $2,000 to $2,499 | 0 (0.0%) | 0 (0.0%) |
| $2,500 to $2,999 | 0 (0.0%) | 0 (0.0%) |
| $3,000 or more | 0 (0.0%) | 10 (0.5%) |
| Total | 1,545 (100.0%) | 1,908 (100.0%) |
Physical Housing Characteristics in Greencastle
Housing Structures in Greencastle
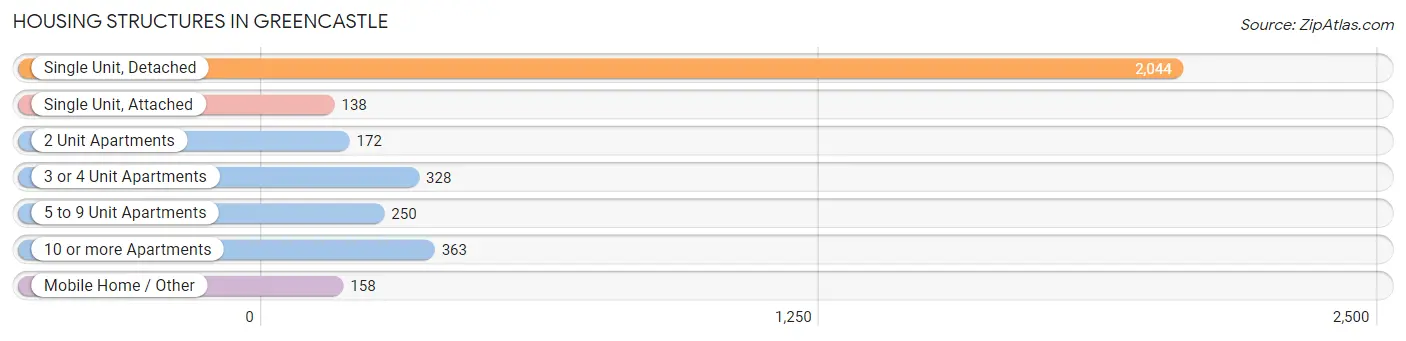
| Structure Type | # Housing Units | % Housing Units |
| Single Unit, Detached | 2,044 | 59.2% |
| Single Unit, Attached | 138 | 4.0% |
| 2 Unit Apartments | 172 | 5.0% |
| 3 or 4 Unit Apartments | 328 | 9.5% |
| 5 to 9 Unit Apartments | 250 | 7.2% |
| 10 or more Apartments | 363 | 10.5% |
| Mobile Home / Other | 158 | 4.6% |
| Total | 3,453 | 100.0% |
Housing Structures by Occupancy in Greencastle
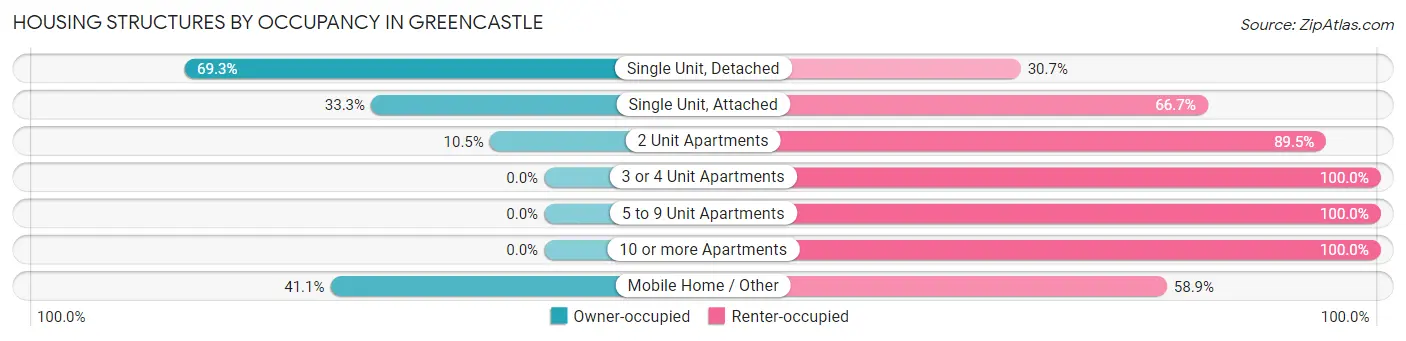
| Structure Type | Owner-occupied | Renter-occupied |
| Single Unit, Detached | 1,416 (69.3%) | 628 (30.7%) |
| Single Unit, Attached | 46 (33.3%) | 92 (66.7%) |
| 2 Unit Apartments | 18 (10.5%) | 154 (89.5%) |
| 3 or 4 Unit Apartments | 0 (0.0%) | 328 (100.0%) |
| 5 to 9 Unit Apartments | 0 (0.0%) | 250 (100.0%) |
| 10 or more Apartments | 0 (0.0%) | 363 (100.0%) |
| Mobile Home / Other | 65 (41.1%) | 93 (58.9%) |
| Total | 1,545 (44.7%) | 1,908 (55.3%) |
Housing Structures by Number of Rooms in Greencastle
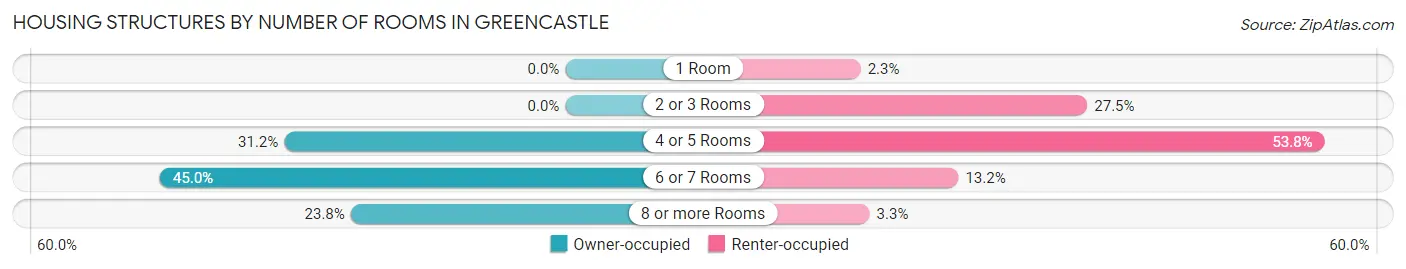
| Number of Rooms | Owner-occupied | Renter-occupied |
| 1 Room | 0 (0.0%) | 44 (2.3%) |
| 2 or 3 Rooms | 0 (0.0%) | 524 (27.5%) |
| 4 or 5 Rooms | 482 (31.2%) | 1,026 (53.8%) |
| 6 or 7 Rooms | 695 (45.0%) | 251 (13.2%) |
| 8 or more Rooms | 368 (23.8%) | 63 (3.3%) |
| Total | 1,545 (100.0%) | 1,908 (100.0%) |
Housing Structure by Heating Type in Greencastle
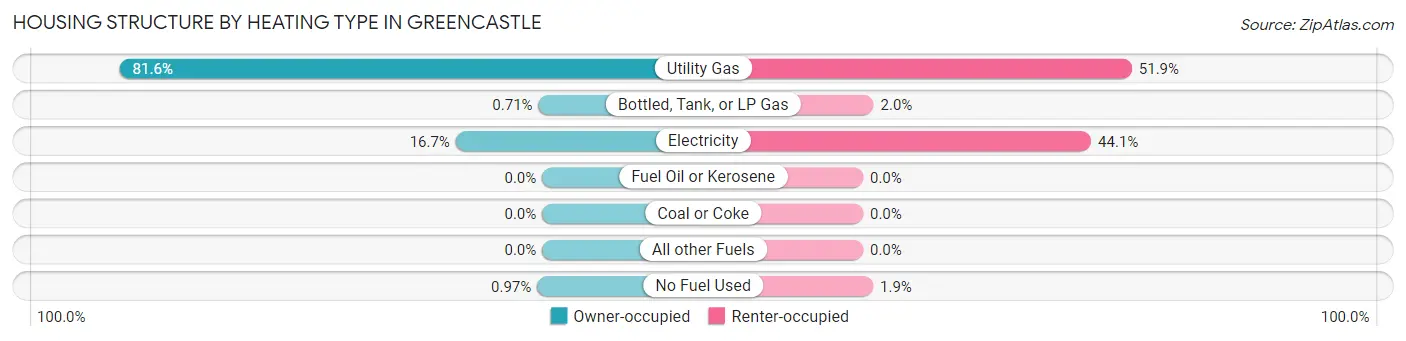
| Heating Type | Owner-occupied | Renter-occupied |
| Utility Gas | 1,261 (81.6%) | 991 (51.9%) |
| Bottled, Tank, or LP Gas | 11 (0.7%) | 39 (2.0%) |
| Electricity | 258 (16.7%) | 841 (44.1%) |
| Fuel Oil or Kerosene | 0 (0.0%) | 0 (0.0%) |
| Coal or Coke | 0 (0.0%) | 0 (0.0%) |
| All other Fuels | 0 (0.0%) | 0 (0.0%) |
| No Fuel Used | 15 (1.0%) | 37 (1.9%) |
| Total | 1,545 (100.0%) | 1,908 (100.0%) |
Household Vehicle Usage in Greencastle
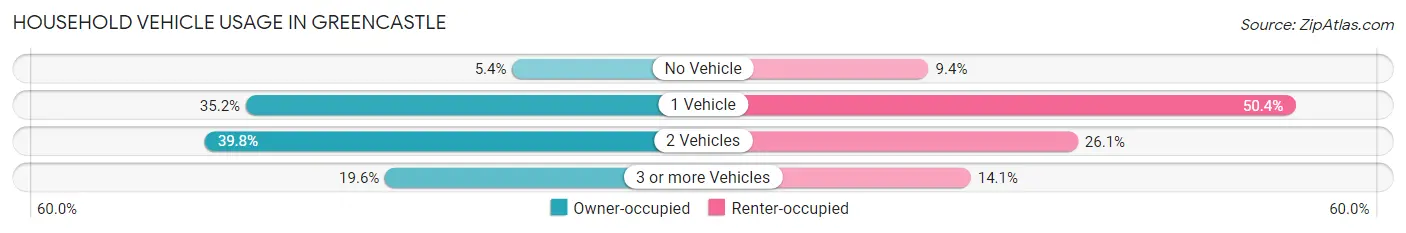
| Vehicles per Household | Owner-occupied | Renter-occupied |
| No Vehicle | 83 (5.4%) | 179 (9.4%) |
| 1 Vehicle | 544 (35.2%) | 962 (50.4%) |
| 2 Vehicles | 615 (39.8%) | 498 (26.1%) |
| 3 or more Vehicles | 303 (19.6%) | 269 (14.1%) |
| Total | 1,545 (100.0%) | 1,908 (100.0%) |
Real Estate & Mortgages in Greencastle
Real Estate and Mortgage Overview in Greencastle
| Characteristic | Without Mortgage | With Mortgage |
| Housing Units | 648 | 897 |
| Median Property Value | $145,600 | $150,300 |
| Median Household Income | $45,795 | $182 |
| Monthly Housing Costs | $348 | $0 |
| Real Estate Taxes | $939 | $0 |
Property Value by Mortgage Status in Greencastle
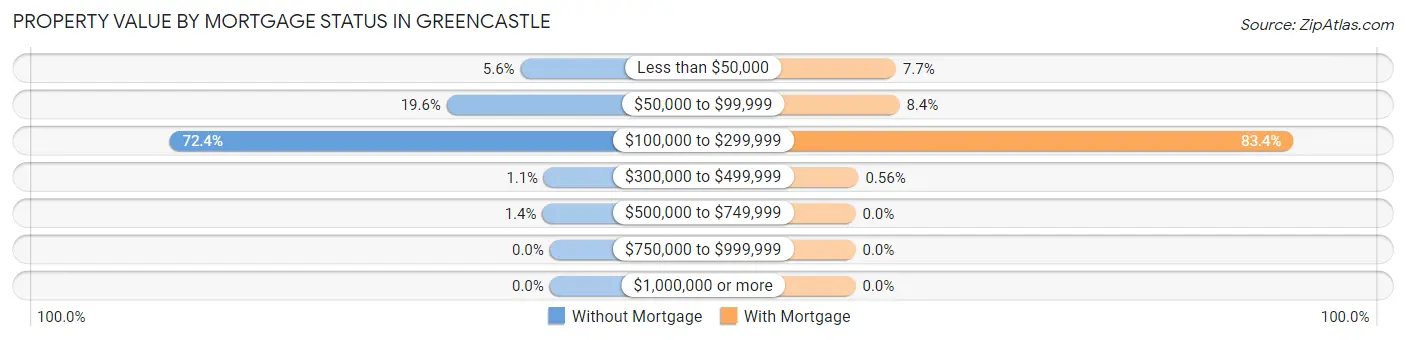
| Property Value | Without Mortgage | With Mortgage |
| Less than $50,000 | 36 (5.6%) | 69 (7.7%) |
| $50,000 to $99,999 | 127 (19.6%) | 75 (8.4%) |
| $100,000 to $299,999 | 469 (72.4%) | 748 (83.4%) |
| $300,000 to $499,999 | 7 (1.1%) | 5 (0.6%) |
| $500,000 to $749,999 | 9 (1.4%) | 0 (0.0%) |
| $750,000 to $999,999 | 0 (0.0%) | 0 (0.0%) |
| $1,000,000 or more | 0 (0.0%) | 0 (0.0%) |
| Total | 648 (100.0%) | 897 (100.0%) |
Household Income by Mortgage Status in Greencastle
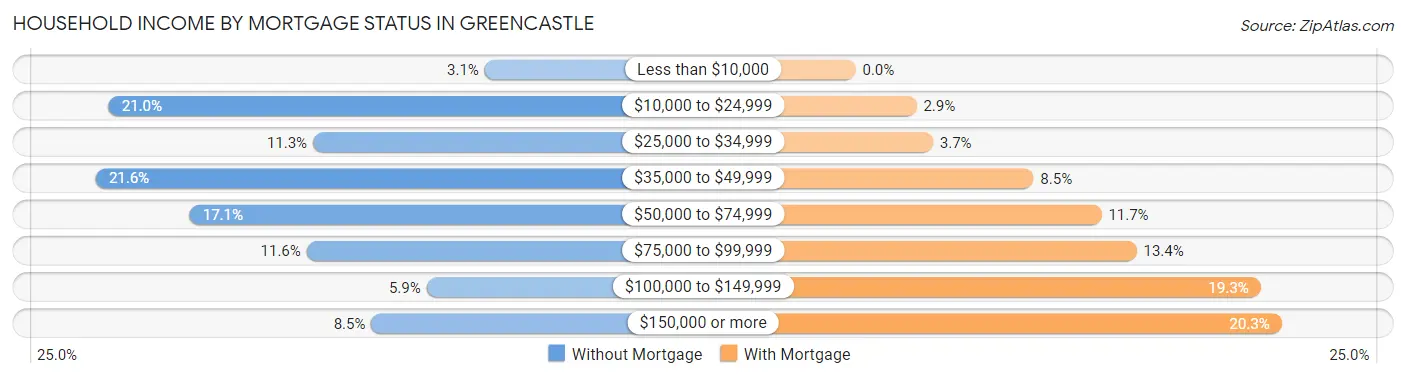
| Household Income | Without Mortgage | With Mortgage |
| Less than $10,000 | 20 (3.1%) | 0 (0.0%) |
| $10,000 to $24,999 | 136 (21.0%) | 26 (2.9%) |
| $25,000 to $34,999 | 73 (11.3%) | 33 (3.7%) |
| $35,000 to $49,999 | 140 (21.6%) | 76 (8.5%) |
| $50,000 to $74,999 | 111 (17.1%) | 105 (11.7%) |
| $75,000 to $99,999 | 75 (11.6%) | 120 (13.4%) |
| $100,000 to $149,999 | 38 (5.9%) | 173 (19.3%) |
| $150,000 or more | 55 (8.5%) | 182 (20.3%) |
| Total | 648 (100.0%) | 897 (100.0%) |
Property Value to Household Income Ratio in Greencastle
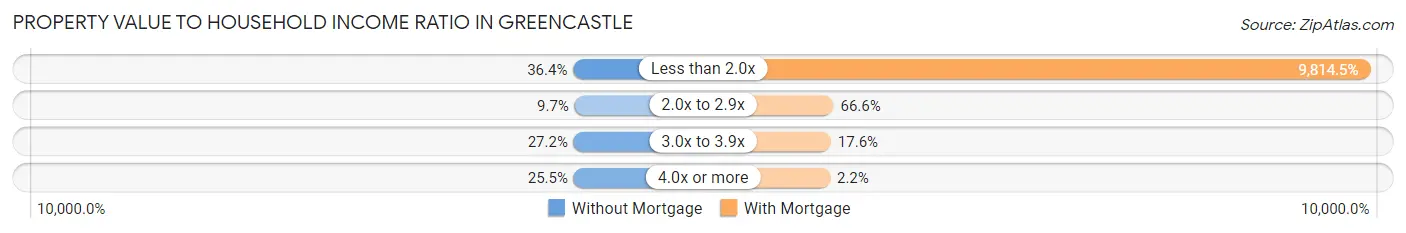
| Value-to-Income Ratio | Without Mortgage | With Mortgage |
| Less than 2.0x | 236 (36.4%) | 88,036 (9,814.5%) |
| 2.0x to 2.9x | 63 (9.7%) | 597 (66.6%) |
| 3.0x to 3.9x | 176 (27.2%) | 158 (17.6%) |
| 4.0x or more | 165 (25.5%) | 20 (2.2%) |
| Total | 648 (100.0%) | 897 (100.0%) |
Real Estate Taxes by Mortgage Status in Greencastle
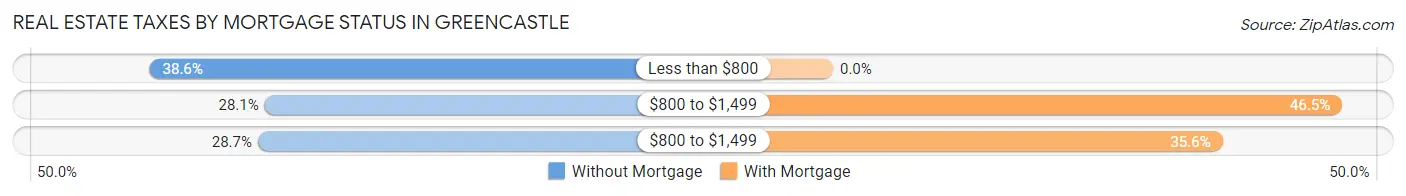
| Property Taxes | Without Mortgage | With Mortgage |
| Less than $800 | 250 (38.6%) | 0 (0.0%) |
| $800 to $1,499 | 182 (28.1%) | 417 (46.5%) |
| $800 to $1,499 | 186 (28.7%) | 319 (35.6%) |
| Total | 648 (100.0%) | 897 (100.0%) |
Health & Disability in Greencastle
Health Insurance Coverage by Age in Greencastle
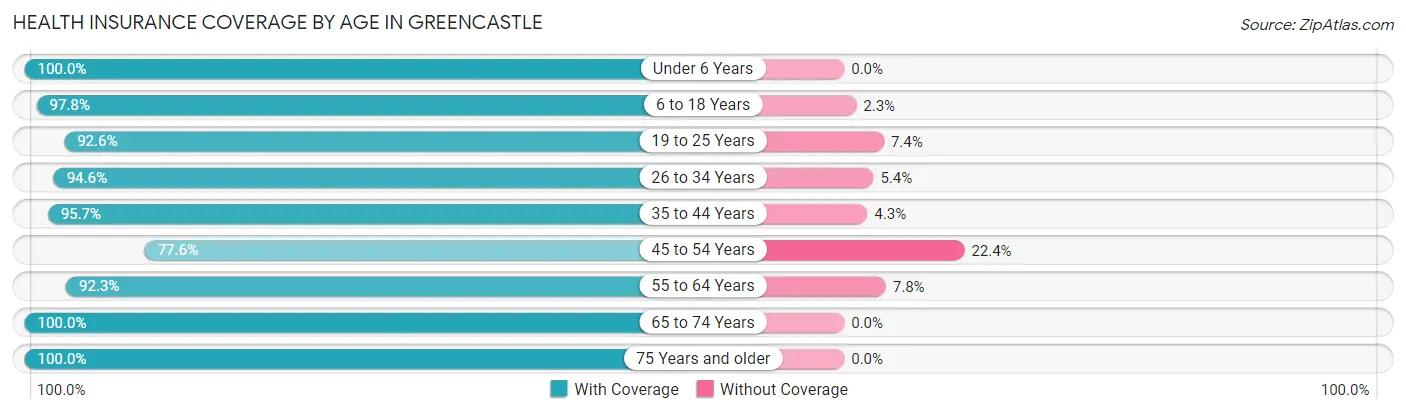
| Age Bracket | With Coverage | Without Coverage |
| Under 6 Years | 604 (100.0%) | 0 (0.0%) |
| 6 to 18 Years | 1,306 (97.8%) | 30 (2.2%) |
| 19 to 25 Years | 2,553 (92.6%) | 204 (7.4%) |
| 26 to 34 Years | 939 (94.6%) | 54 (5.4%) |
| 35 to 44 Years | 888 (95.7%) | 40 (4.3%) |
| 45 to 54 Years | 547 (77.6%) | 158 (22.4%) |
| 55 to 64 Years | 726 (92.2%) | 61 (7.7%) |
| 65 to 74 Years | 671 (100.0%) | 0 (0.0%) |
| 75 Years and older | 742 (100.0%) | 0 (0.0%) |
| Total | 8,976 (94.3%) | 547 (5.7%) |
Health Insurance Coverage by Citizenship Status in Greencastle
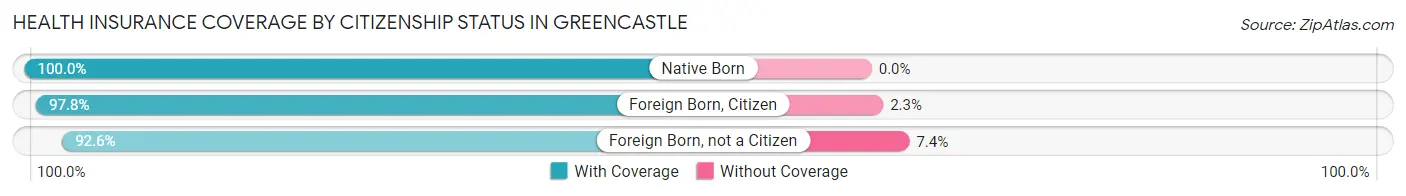
| Citizenship Status | With Coverage | Without Coverage |
| Native Born | 604 (100.0%) | 0 (0.0%) |
| Foreign Born, Citizen | 1,306 (97.8%) | 30 (2.2%) |
| Foreign Born, not a Citizen | 2,553 (92.6%) | 204 (7.4%) |
Health Insurance Coverage by Household Income in Greencastle
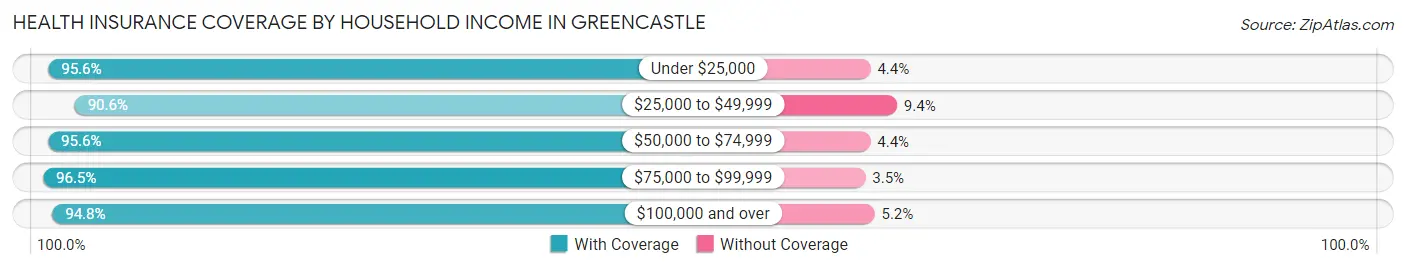
| Household Income | With Coverage | Without Coverage |
| Under $25,000 | 731 (95.6%) | 34 (4.4%) |
| $25,000 to $49,999 | 1,785 (90.6%) | 185 (9.4%) |
| $50,000 to $74,999 | 1,428 (95.6%) | 66 (4.4%) |
| $75,000 to $99,999 | 1,224 (96.5%) | 44 (3.5%) |
| $100,000 and over | 1,678 (94.8%) | 92 (5.2%) |
Public vs Private Health Insurance Coverage by Age in Greencastle
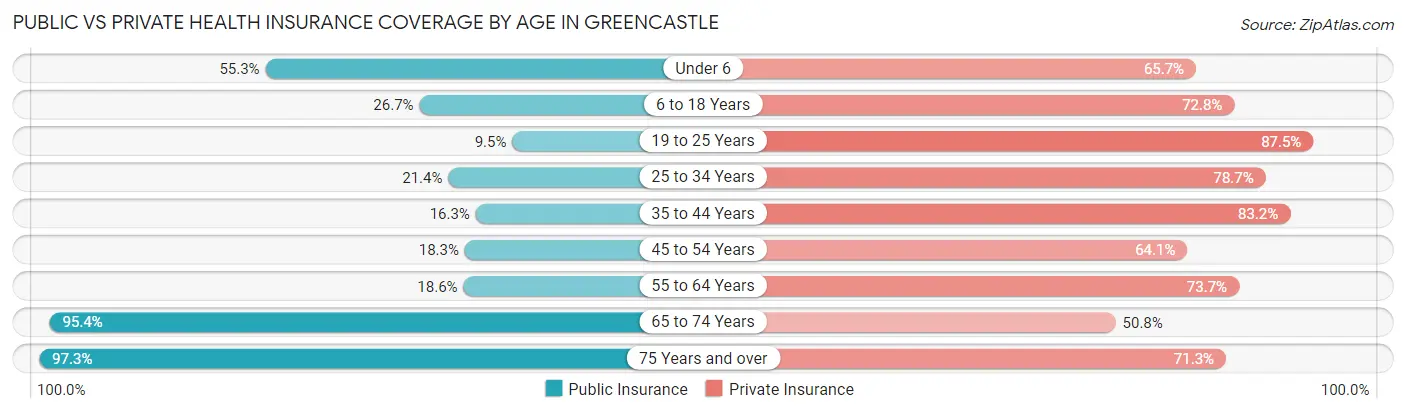
| Age Bracket | Public Insurance | Private Insurance |
| Under 6 | 334 (55.3%) | 397 (65.7%) |
| 6 to 18 Years | 357 (26.7%) | 973 (72.8%) |
| 19 to 25 Years | 261 (9.5%) | 2,412 (87.5%) |
| 25 to 34 Years | 212 (21.3%) | 781 (78.6%) |
| 35 to 44 Years | 151 (16.3%) | 772 (83.2%) |
| 45 to 54 Years | 129 (18.3%) | 452 (64.1%) |
| 55 to 64 Years | 146 (18.5%) | 580 (73.7%) |
| 65 to 74 Years | 640 (95.4%) | 341 (50.8%) |
| 75 Years and over | 722 (97.3%) | 529 (71.3%) |
| Total | 2,952 (31.0%) | 7,237 (76.0%) |
Disability Status by Sex by Age in Greencastle
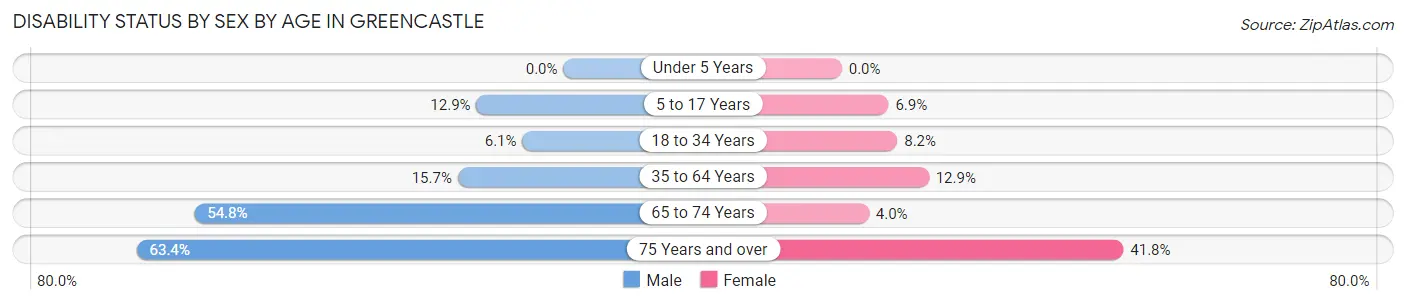
| Age Bracket | Male | Female |
| Under 5 Years | 0 (0.0%) | 0 (0.0%) |
| 5 to 17 Years | 102 (12.9%) | 21 (6.9%) |
| 18 to 34 Years | 109 (6.1%) | 192 (8.2%) |
| 35 to 64 Years | 190 (15.7%) | 156 (12.9%) |
| 65 to 74 Years | 177 (54.8%) | 14 (4.0%) |
| 75 Years and over | 211 (63.4%) | 171 (41.8%) |
Disability Class by Sex by Age in Greencastle
Disability Class: Hearing Difficulty
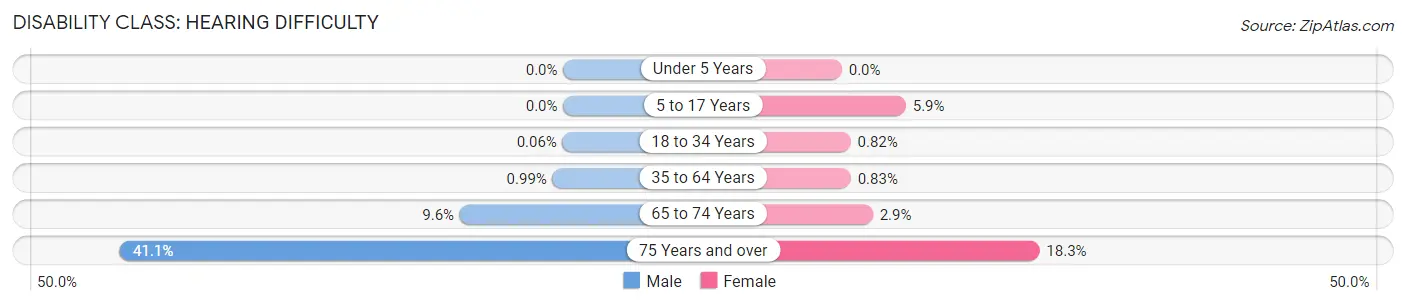
| Age Bracket | Male | Female |
| Under 5 Years | 0 (0.0%) | 0 (0.0%) |
| 5 to 17 Years | 0 (0.0%) | 18 (5.9%) |
| 18 to 34 Years | 1 (0.1%) | 19 (0.8%) |
| 35 to 64 Years | 12 (1.0%) | 10 (0.8%) |
| 65 to 74 Years | 31 (9.6%) | 10 (2.9%) |
| 75 Years and over | 137 (41.1%) | 75 (18.3%) |
Disability Class: Vision Difficulty
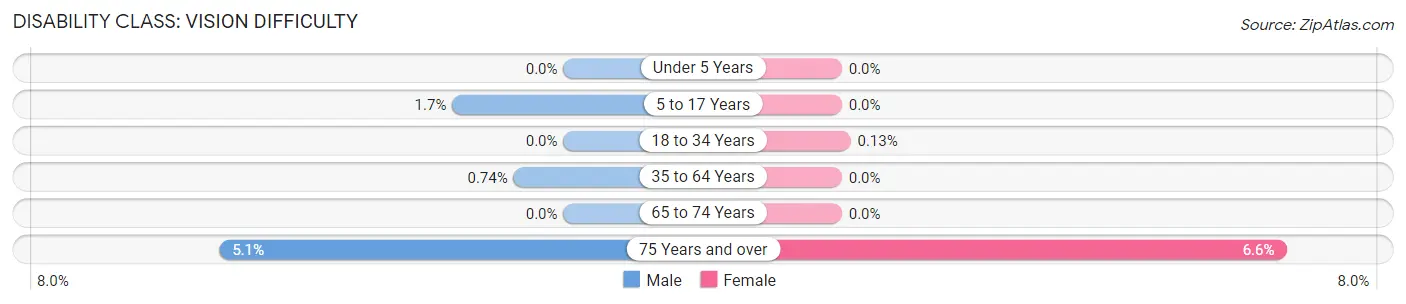
| Age Bracket | Male | Female |
| Under 5 Years | 0 (0.0%) | 0 (0.0%) |
| 5 to 17 Years | 13 (1.7%) | 0 (0.0%) |
| 18 to 34 Years | 0 (0.0%) | 3 (0.1%) |
| 35 to 64 Years | 9 (0.7%) | 0 (0.0%) |
| 65 to 74 Years | 0 (0.0%) | 0 (0.0%) |
| 75 Years and over | 17 (5.1%) | 27 (6.6%) |
Disability Class: Cognitive Difficulty
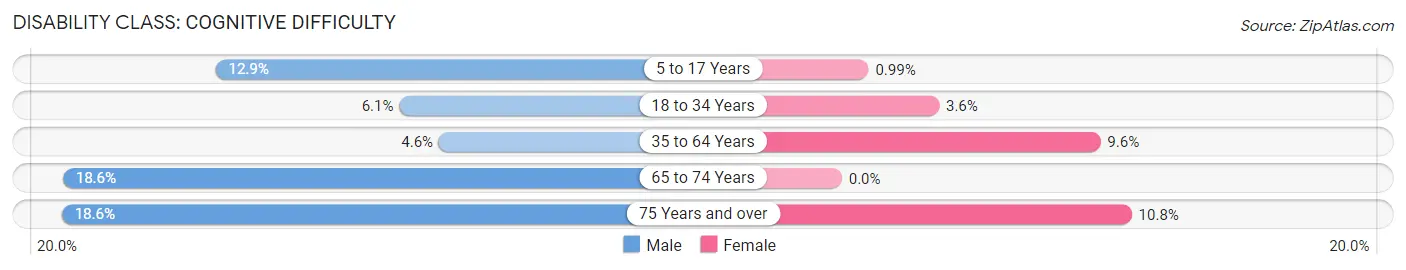
| Age Bracket | Male | Female |
| 5 to 17 Years | 102 (12.9%) | 3 (1.0%) |
| 18 to 34 Years | 109 (6.1%) | 84 (3.6%) |
| 35 to 64 Years | 56 (4.6%) | 116 (9.6%) |
| 65 to 74 Years | 60 (18.6%) | 0 (0.0%) |
| 75 Years and over | 62 (18.6%) | 44 (10.8%) |
Disability Class: Ambulatory Difficulty
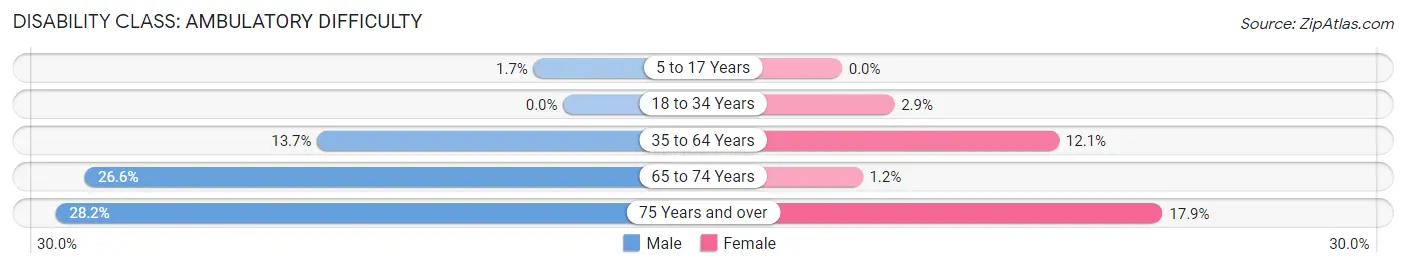
| Age Bracket | Male | Female |
| 5 to 17 Years | 13 (1.7%) | 0 (0.0%) |
| 18 to 34 Years | 0 (0.0%) | 68 (2.9%) |
| 35 to 64 Years | 166 (13.7%) | 146 (12.1%) |
| 65 to 74 Years | 86 (26.6%) | 4 (1.1%) |
| 75 Years and over | 94 (28.2%) | 73 (17.8%) |
Disability Class: Self-Care Difficulty
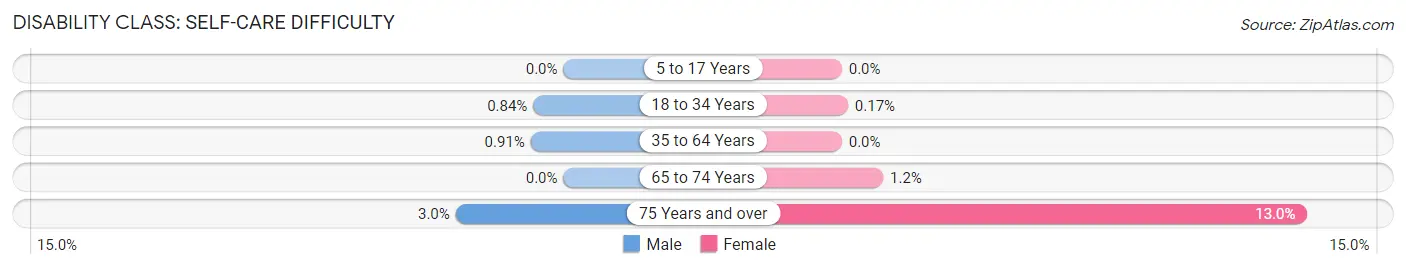
| Age Bracket | Male | Female |
| 5 to 17 Years | 0 (0.0%) | 0 (0.0%) |
| 18 to 34 Years | 15 (0.8%) | 4 (0.2%) |
| 35 to 64 Years | 11 (0.9%) | 0 (0.0%) |
| 65 to 74 Years | 0 (0.0%) | 4 (1.1%) |
| 75 Years and over | 10 (3.0%) | 53 (13.0%) |
Technology Access in Greencastle
Computing Device Access in Greencastle
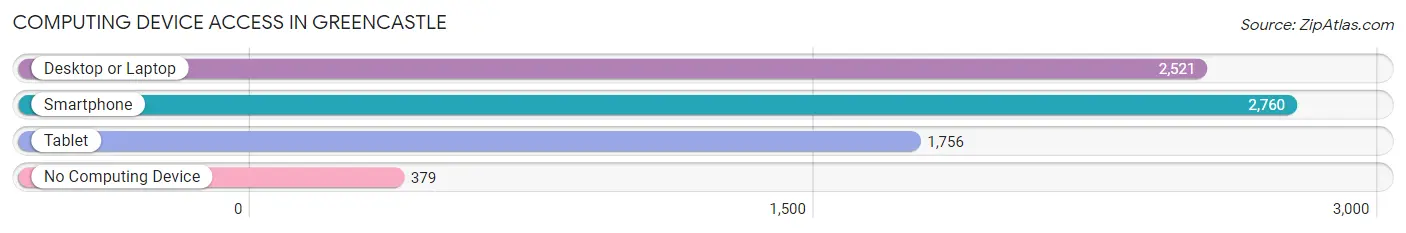
| Device Type | # Households | % Households |
| Desktop or Laptop | 2,521 | 73.0% |
| Smartphone | 2,760 | 79.9% |
| Tablet | 1,756 | 50.8% |
| No Computing Device | 379 | 11.0% |
| Total | 3,453 | 100.0% |
Internet Access in Greencastle
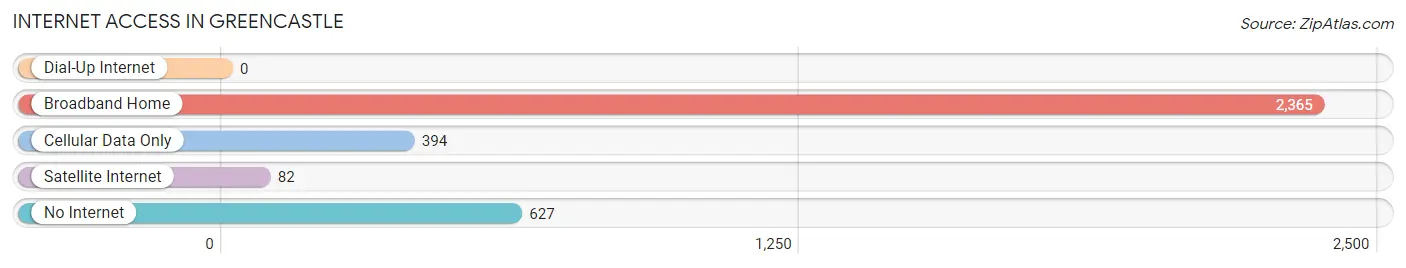
| Internet Type | # Households | % Households |
| Dial-Up Internet | 0 | 0.0% |
| Broadband Home | 2,365 | 68.5% |
| Cellular Data Only | 394 | 11.4% |
| Satellite Internet | 82 | 2.4% |
| No Internet | 627 | 18.2% |
| Total | 3,453 | 100.0% |
Greencastle Summary
Geography
Greencastle is a city located in Putnam County, Indiana, United States. It is the county seat of Putnam County and is located in the western part of the state. The city is situated in the Wabash Valley, approximately 40 miles west of Indianapolis. The city is located at the intersection of U.S. Route 36 and State Road 240. The city has a total area of 5.3 square miles, all of which is land.
History
Greencastle was founded in 1821 by Ephraim Dukes on a land grant from the federal government. The city was named after Greencastle, Pennsylvania, the hometown of Dukes. The city was incorporated in 1836 and became the county seat of Putnam County in 1839.
Greencastle was a major stop on the Underground Railroad during the Civil War. The city was also the site of the Battle of Greencastle in 1862, which was a major victory for the Union forces.
In the late 19th century, Greencastle was a major center for the production of bricks. The city was also home to several manufacturing companies, including the Greencastle Manufacturing Company, which produced agricultural implements.
Economy
Greencastle’s economy is largely based on manufacturing and agriculture. The city is home to several manufacturing companies, including the Greencastle Manufacturing Company, which produces agricultural implements. The city is also home to several agricultural businesses, including the Putnam County Farm Bureau, which is the largest agricultural organization in the county.
The city is also home to several educational institutions, including DePauw University, which is a private liberal arts college. The university is the largest employer in the city and has an annual economic impact of over $200 million.
Demographics
As of the 2010 census, the city had a population of 10,326. The racial makeup of the city was 95.2% White, 1.2% African American, 0.3% Native American, 0.7% Asian, 0.1% Pacific Islander, 1.2% from other races, and 1.3% from two or more races. Hispanic or Latino of any race were 3.2% of the population.
The median income for a household in the city was $41,945, and the median income for a family was $51,945. The per capita income for the city was $20,945. About 8.2% of families and 11.2% of the population were below the poverty line, including 15.2% of those under age 18 and 8.2% of those age 65 or over.
Common Questions
What is Per Capita Income in Greencastle?
Per Capita income in Greencastle is $24,637.
What is the Median Family Income in Greencastle?
Median Family Income in Greencastle is $68,211.
What is the Median Household income in Greencastle?
Median Household Income in Greencastle is $51,836.
What is Income or Wage Gap in Greencastle?
Income or Wage Gap in Greencastle is 70.4%.
Women in Greencastle earn 29.6 cents for every dollar earned by a man.
What is Family Income Deficit in Greencastle?
Family Income Deficit in Greencastle is $9,969.
Families that are below poverty line in Greencastle earn $9,969 less on average than the poverty threshold level.
What is Inequality or Gini Index in Greencastle?
Inequality or Gini Index in Greencastle is 0.39.
What is the Total Population of Greencastle?
Total Population of Greencastle is 9,865.
What is the Total Male Population of Greencastle?
Total Male Population of Greencastle is 4,977.
What is the Total Female Population of Greencastle?
Total Female Population of Greencastle is 4,888.
What is the Ratio of Males per 100 Females in Greencastle?
There are 101.82 Males per 100 Females in Greencastle.
What is the Ratio of Females per 100 Males in Greencastle?
There are 98.21 Females per 100 Males in Greencastle.
What is the Median Population Age in Greencastle?
Median Population Age in Greencastle is 27.4 Years.
What is the Average Family Size in Greencastle
Average Family Size in Greencastle is 2.8 People.
What is the Average Household Size in Greencastle
Average Household Size in Greencastle is 2.1 People.
How Large is the Labor Force in Greencastle?
There are 4,530 People in the Labor Forcein in Greencastle.
What is the Percentage of People in the Labor Force in Greencastle?
53.9% of People are in the Labor Force in Greencastle.
What is the Unemployment Rate in Greencastle?
Unemployment Rate in Greencastle is 1.1%.