Gaston, IN Map & Demographics
Gaston Map
Gaston Overview
$23,056
PER CAPITA INCOME
$61,875
AVG FAMILY INCOME
$49,271
AVG HOUSEHOLD INCOME
15.4%
WAGE / INCOME GAP [ % ]
84.6¢/ $1
WAGE / INCOME GAP [ $ ]
0.33
INEQUALITY / GINI INDEX
705
TOTAL POPULATION
355
MALE POPULATION
350
FEMALE POPULATION
101.43
MALES / 100 FEMALES
98.59
FEMALES / 100 MALES
38.8
MEDIAN AGE
3.1
AVG FAMILY SIZE
2.5
AVG HOUSEHOLD SIZE
357
LABOR FORCE [ PEOPLE ]
62.7%
PERCENT IN LABOR FORCE
8.1%
UNEMPLOYMENT RATE
Gaston Zip Codes
Gaston Area Codes
Income in Gaston
Income Overview in Gaston
Per Capita Income in Gaston is $23,056, while median incomes of families and households are $61,875 and $49,271 respectively.
| Characteristic | Number | Measure |
| Per Capita Income | 705 | $23,056 |
| Median Family Income | 175 | $61,875 |
| Mean Family Income | 175 | $64,825 |
| Median Household Income | 285 | $49,271 |
| Mean Household Income | 285 | $56,044 |
| Income Deficit | 175 | $0 |
| Wage / Income Gap (%) | 705 | 15.44% |
| Wage / Income Gap ($) | 705 | 84.56¢ per $1 |
| Gini / Inequality Index | 705 | 0.33 |
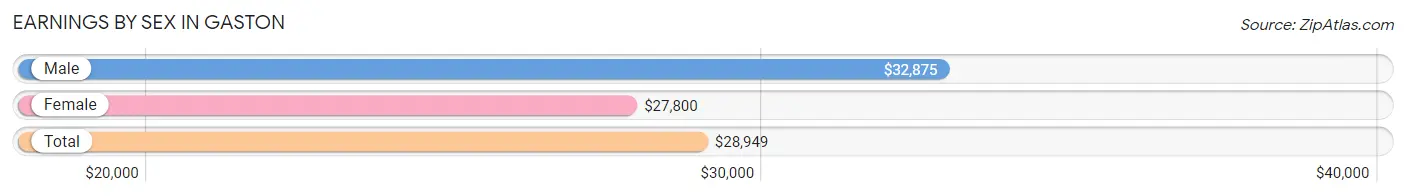
Earnings by Sex in Gaston
Average Earnings in Gaston are $28,949, $32,875 for men and $27,800 for women, a difference of 15.4%.
| Sex | Number | Average Earnings |
| Male | 223 (58.5%) | $32,875 |
| Female | 158 (41.5%) | $27,800 |
| Total | 381 (100.0%) | $28,949 |
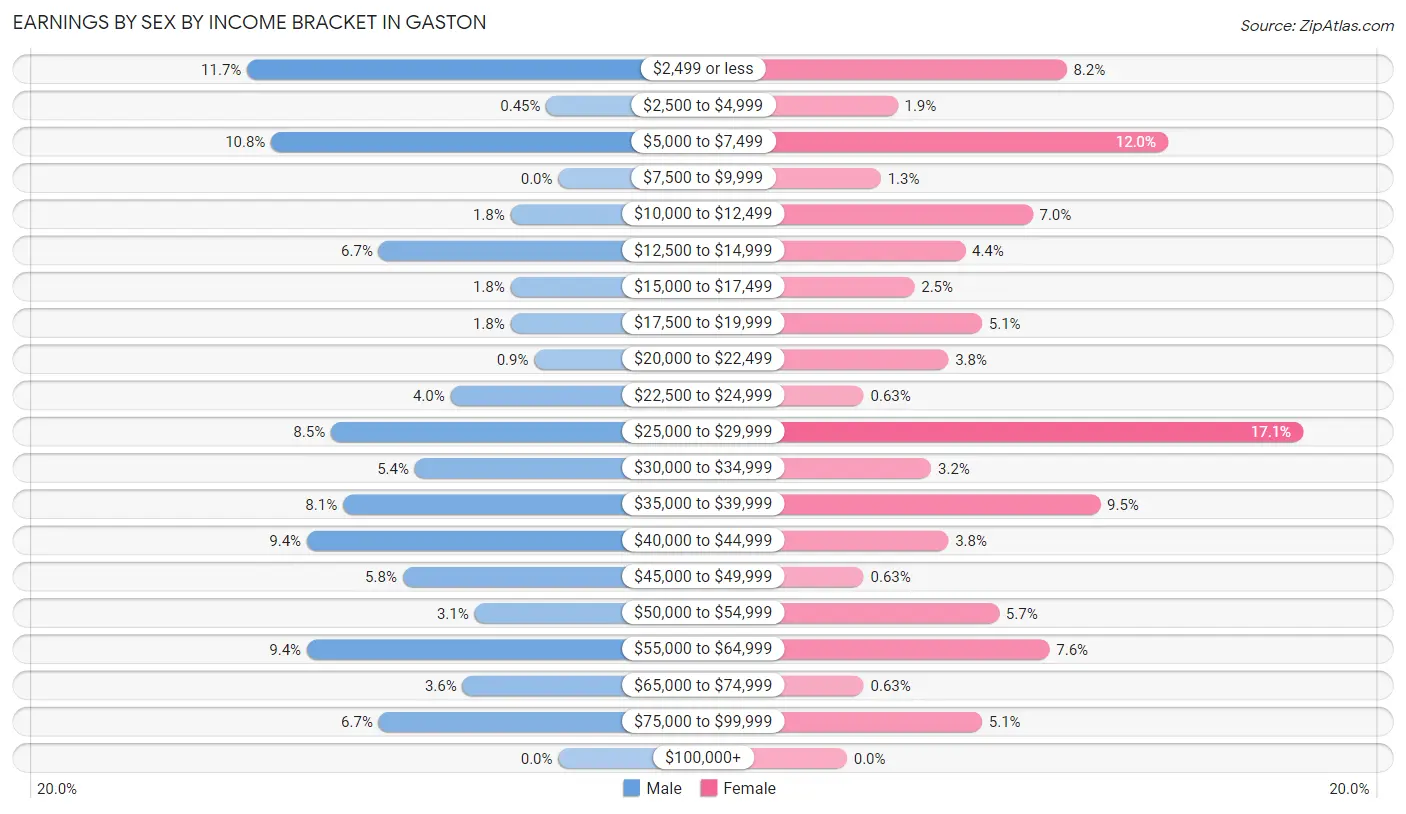
Earnings by Sex by Income Bracket in Gaston
The most common earnings brackets in Gaston are $2,499 or less for men (26 | 11.7%) and $25,000 to $29,999 for women (27 | 17.1%).
| Income | Male | Female |
| $2,499 or less | 26 (11.7%) | 13 (8.2%) |
| $2,500 to $4,999 | 1 (0.4%) | 3 (1.9%) |
| $5,000 to $7,499 | 24 (10.8%) | 19 (12.0%) |
| $7,500 to $9,999 | 0 (0.0%) | 2 (1.3%) |
| $10,000 to $12,499 | 4 (1.8%) | 11 (7.0%) |
| $12,500 to $14,999 | 15 (6.7%) | 7 (4.4%) |
| $15,000 to $17,499 | 4 (1.8%) | 4 (2.5%) |
| $17,500 to $19,999 | 4 (1.8%) | 8 (5.1%) |
| $20,000 to $22,499 | 2 (0.9%) | 6 (3.8%) |
| $22,500 to $24,999 | 9 (4.0%) | 1 (0.6%) |
| $25,000 to $29,999 | 19 (8.5%) | 27 (17.1%) |
| $30,000 to $34,999 | 12 (5.4%) | 5 (3.2%) |
| $35,000 to $39,999 | 18 (8.1%) | 15 (9.5%) |
| $40,000 to $44,999 | 21 (9.4%) | 6 (3.8%) |
| $45,000 to $49,999 | 13 (5.8%) | 1 (0.6%) |
| $50,000 to $54,999 | 7 (3.1%) | 9 (5.7%) |
| $55,000 to $64,999 | 21 (9.4%) | 12 (7.6%) |
| $65,000 to $74,999 | 8 (3.6%) | 1 (0.6%) |
| $75,000 to $99,999 | 15 (6.7%) | 8 (5.1%) |
| $100,000+ | 0 (0.0%) | 0 (0.0%) |
| Total | 223 (100.0%) | 158 (100.0%) |
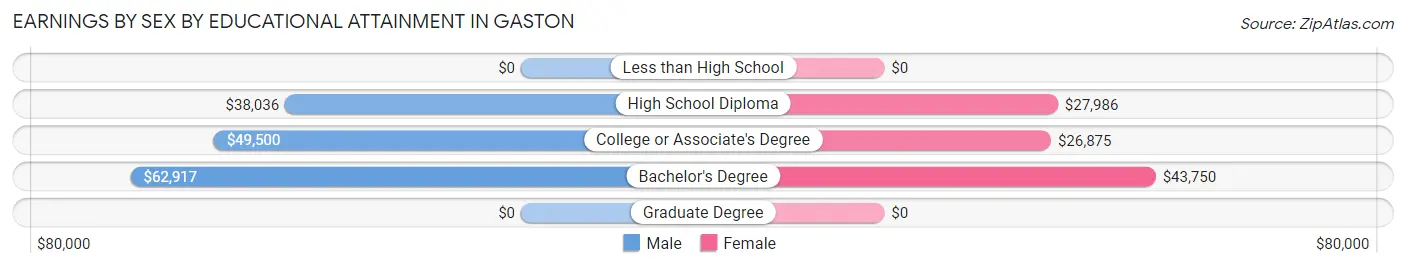
Earnings by Sex by Educational Attainment in Gaston
Average earnings in Gaston are $36,667 for men and $28,750 for women, a difference of 21.6%. Men with an educational attainment of bachelor's degree enjoy the highest average annual earnings of $62,917, while those with high school diploma education earn the least with $38,036. Women with an educational attainment of bachelor's degree earn the most with the average annual earnings of $43,750, while those with college or associate's degree education have the smallest earnings of $26,875.
| Educational Attainment | Male Income | Female Income |
| Less than High School | - | - |
| High School Diploma | $38,036 | $27,986 |
| College or Associate's Degree | $49,500 | $26,875 |
| Bachelor's Degree | $62,917 | $43,750 |
| Graduate Degree | - | - |
| Total | $36,667 | $28,750 |
Family Income in Gaston
Family Income Brackets in Gaston
According to the Gaston family income data, there are 53 families falling into the $35,000 to $49,999 income range, which is the most common income bracket and makes up 30.3% of all families.
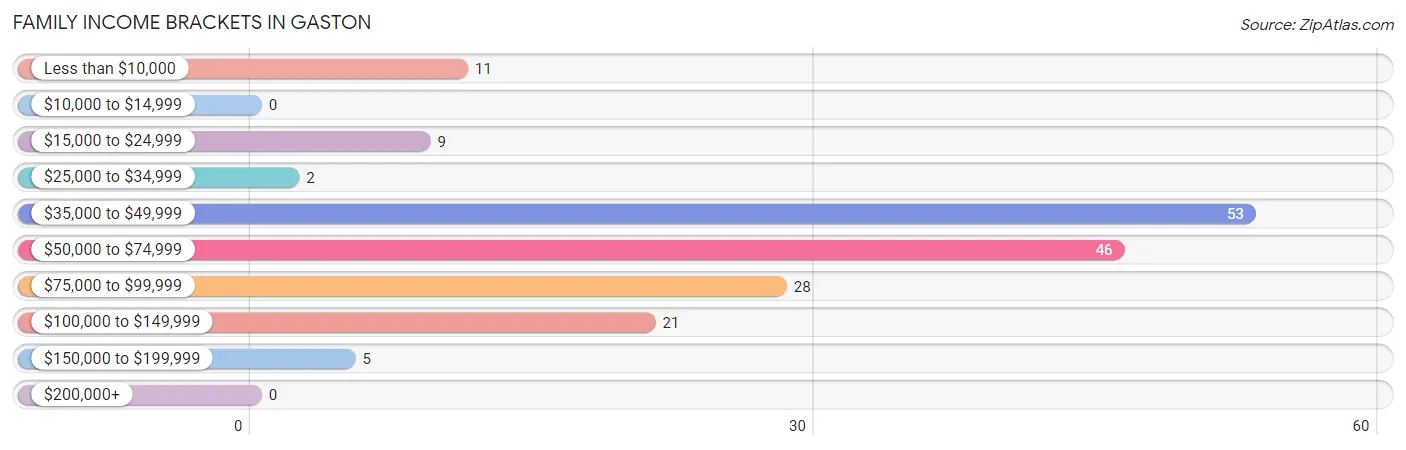
| Income Bracket | # Families | % Families |
| Less than $10,000 | 11 | 6.3% |
| $10,000 to $14,999 | 0 | 0.0% |
| $15,000 to $24,999 | 9 | 5.1% |
| $25,000 to $34,999 | 2 | 1.1% |
| $35,000 to $49,999 | 53 | 30.3% |
| $50,000 to $74,999 | 46 | 26.3% |
| $75,000 to $99,999 | 28 | 16.0% |
| $100,000 to $149,999 | 21 | 12.0% |
| $150,000 to $199,999 | 5 | 2.9% |
| $200,000+ | 0 | 0.0% |
Family Income by Famaliy Size in Gaston
4-person families (29 | 16.6%) account for the highest median family income in Gaston with $72,083 per family, while 2-person families (76 | 43.4%) have the highest median income of $23,500 per family member.
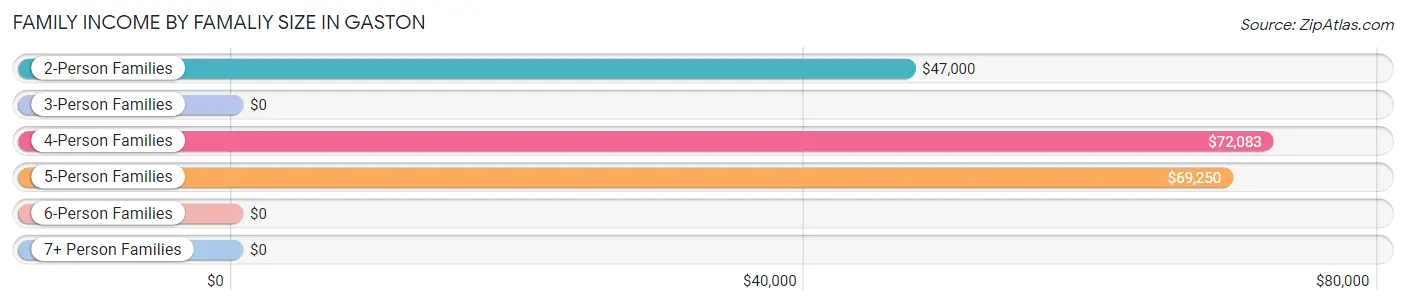
| Income Bracket | # Families | Median Income |
| 2-Person Families | 76 (43.4%) | $47,000 |
| 3-Person Families | 38 (21.7%) | $0 |
| 4-Person Families | 29 (16.6%) | $72,083 |
| 5-Person Families | 30 (17.1%) | $69,250 |
| 6-Person Families | 0 (0.0%) | $0 |
| 7+ Person Families | 2 (1.1%) | $0 |
| Total | 175 (100.0%) | $61,875 |
Family Income by Number of Earners in Gaston
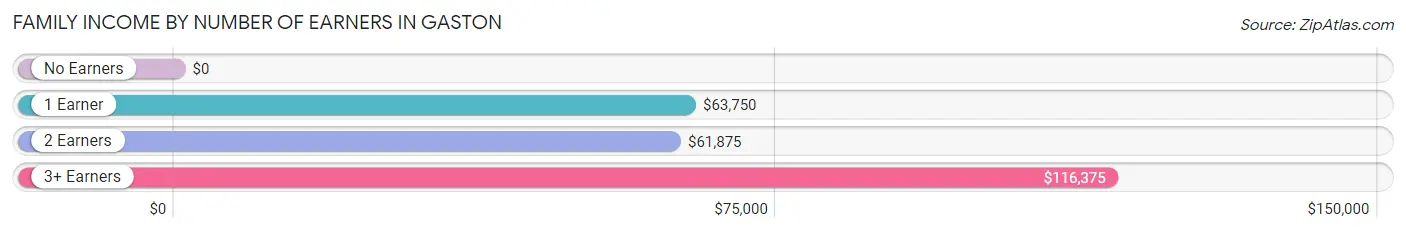
| Number of Earners | # Families | Median Income |
| No Earners | 28 (16.0%) | $0 |
| 1 Earner | 45 (25.7%) | $63,750 |
| 2 Earners | 83 (47.4%) | $61,875 |
| 3+ Earners | 19 (10.9%) | $116,375 |
| Total | 175 (100.0%) | $61,875 |
Household Income in Gaston
Household Income Brackets in Gaston
With 84 households falling in the category, the $50,000 to $74,999 income range is the most frequent in Gaston, accounting for 29.5% of all households.
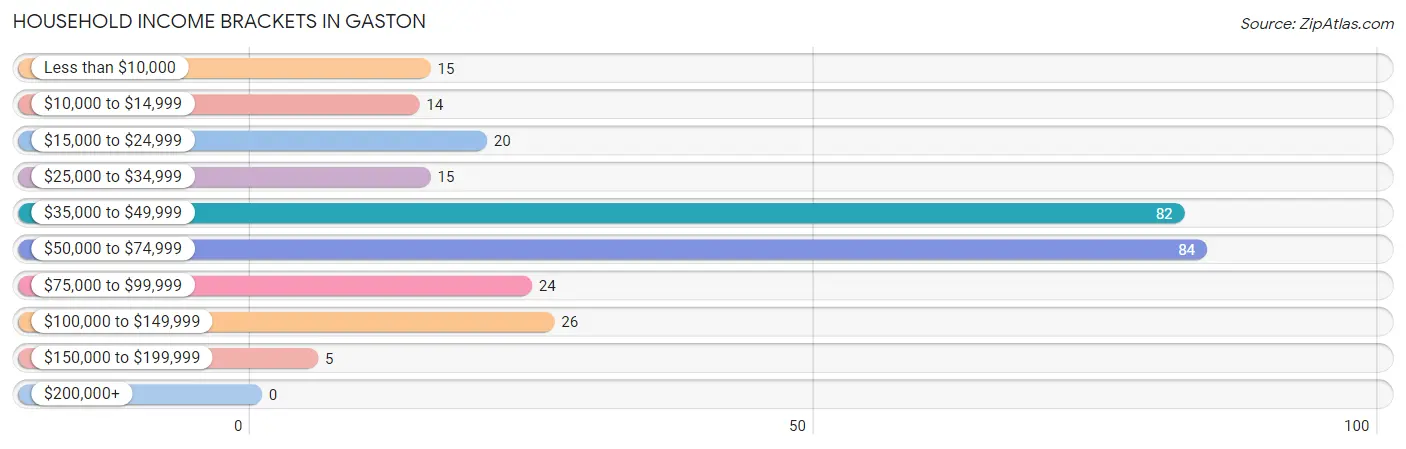
| Income Bracket | # Households | % Households |
| Less than $10,000 | 15 | 5.3% |
| $10,000 to $14,999 | 14 | 4.9% |
| $15,000 to $24,999 | 20 | 7.0% |
| $25,000 to $34,999 | 15 | 5.3% |
| $35,000 to $49,999 | 82 | 28.8% |
| $50,000 to $74,999 | 84 | 29.5% |
| $75,000 to $99,999 | 24 | 8.4% |
| $100,000 to $149,999 | 26 | 9.1% |
| $150,000 to $199,999 | 5 | 1.8% |
| $200,000+ | 0 | 0.0% |
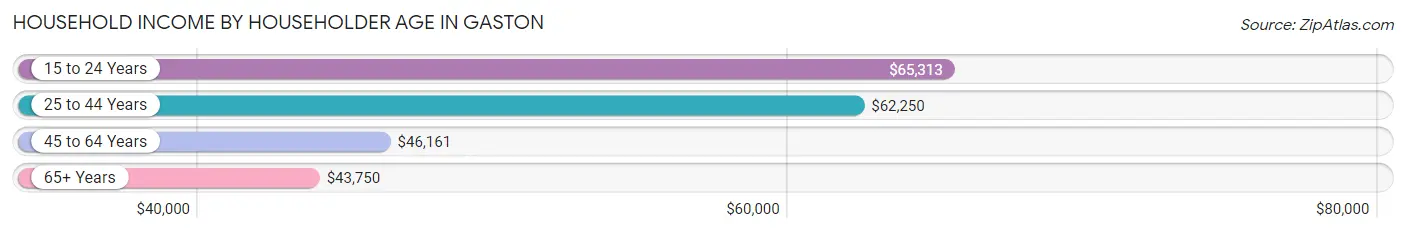
Household Income by Householder Age in Gaston
The median household income in Gaston is $49,271, with the highest median household income of $65,313 found in the 15 to 24 years age bracket for the primary householder. A total of 18 households (6.3%) fall into this category. Meanwhile, the 65+ years age bracket for the primary householder has the lowest median household income of $43,750, with 84 households (29.5%) in this group.
| Income Bracket | # Households | Median Income |
| 15 to 24 Years | 18 (6.3%) | $65,313 |
| 25 to 44 Years | 86 (30.2%) | $62,250 |
| 45 to 64 Years | 97 (34.0%) | $46,161 |
| 65+ Years | 84 (29.5%) | $43,750 |
| Total | 285 (100.0%) | $49,271 |
Poverty in Gaston
Income Below Poverty by Sex and Age in Gaston
With 10.7% poverty level for males and 16.1% for females among the residents of Gaston, 15 year old males and 5 year old females are the most vulnerable to poverty, with 2 males (100.0%) and 3 females (50.0%) in their respective age groups living below the poverty level.
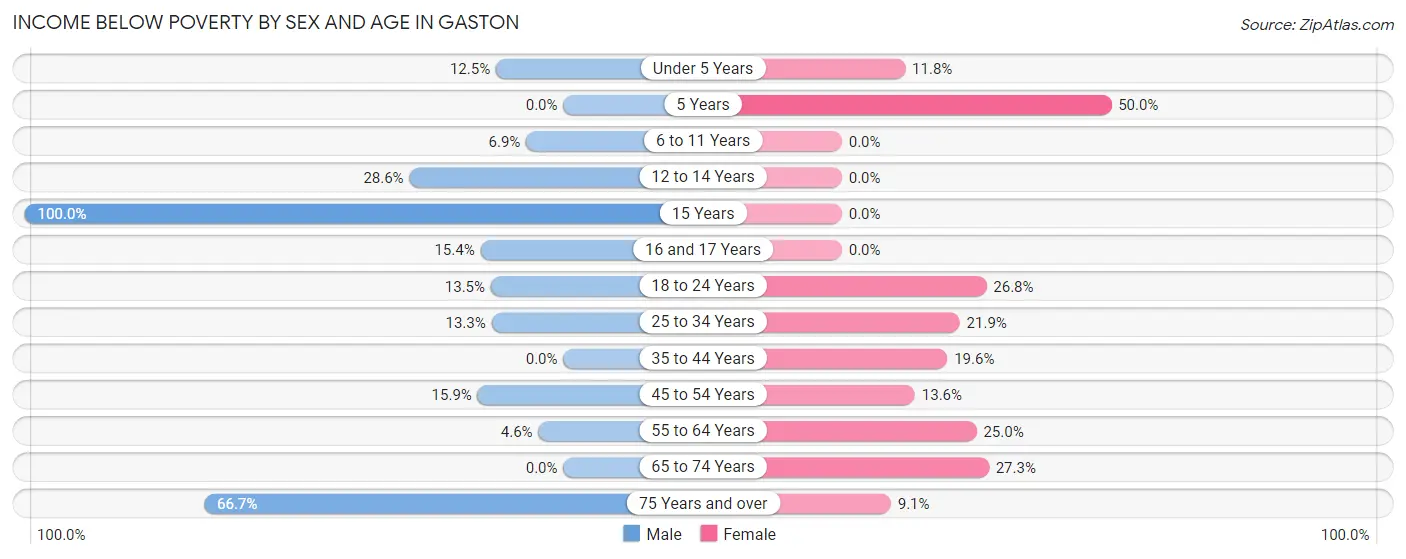
| Age Bracket | Male | Female |
| Under 5 Years | 1 (12.5%) | 2 (11.8%) |
| 5 Years | 0 (0.0%) | 3 (50.0%) |
| 6 to 11 Years | 2 (6.9%) | 0 (0.0%) |
| 12 to 14 Years | 4 (28.6%) | 0 (0.0%) |
| 15 Years | 2 (100.0%) | 0 (0.0%) |
| 16 and 17 Years | 2 (15.4%) | 0 (0.0%) |
| 18 to 24 Years | 7 (13.5%) | 11 (26.8%) |
| 25 to 34 Years | 6 (13.3%) | 7 (21.9%) |
| 35 to 44 Years | 0 (0.0%) | 9 (19.6%) |
| 45 to 54 Years | 7 (15.9%) | 8 (13.6%) |
| 55 to 64 Years | 3 (4.6%) | 3 (25.0%) |
| 65 to 74 Years | 0 (0.0%) | 9 (27.3%) |
| 75 Years and over | 4 (66.7%) | 4 (9.1%) |
| Total | 38 (10.7%) | 56 (16.1%) |
Income Above Poverty by Sex and Age in Gaston
According to the poverty statistics in Gaston, males aged 5 years and females aged 6 to 11 years are the age groups that are most secure financially, with 100.0% of males and 100.0% of females in these age groups living above the poverty line.
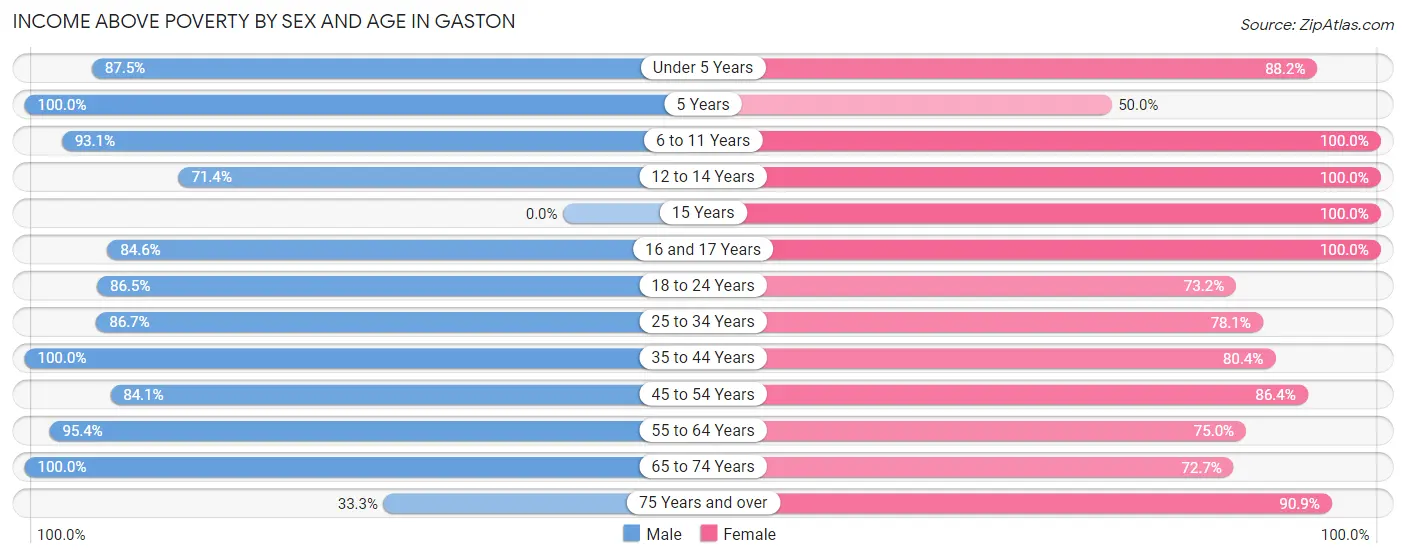
| Age Bracket | Male | Female |
| Under 5 Years | 7 (87.5%) | 15 (88.2%) |
| 5 Years | 3 (100.0%) | 3 (50.0%) |
| 6 to 11 Years | 27 (93.1%) | 29 (100.0%) |
| 12 to 14 Years | 10 (71.4%) | 11 (100.0%) |
| 15 Years | 0 (0.0%) | 15 (100.0%) |
| 16 and 17 Years | 11 (84.6%) | 3 (100.0%) |
| 18 to 24 Years | 45 (86.5%) | 30 (73.2%) |
| 25 to 34 Years | 39 (86.7%) | 25 (78.1%) |
| 35 to 44 Years | 40 (100.0%) | 37 (80.4%) |
| 45 to 54 Years | 37 (84.1%) | 51 (86.4%) |
| 55 to 64 Years | 62 (95.4%) | 9 (75.0%) |
| 65 to 74 Years | 34 (100.0%) | 24 (72.7%) |
| 75 Years and over | 2 (33.3%) | 40 (90.9%) |
| Total | 317 (89.3%) | 292 (83.9%) |
Income Below Poverty Among Married-Couple Families in Gaston
The poverty statistics for married-couple families in Gaston show that 6.7% or 8 of the total 119 families live below the poverty line. Families with no children have the highest poverty rate of 15.4%, comprising of 8 families. On the other hand, families with 1 or 2 children have the lowest poverty rate of 0.0%, which includes 0 families.
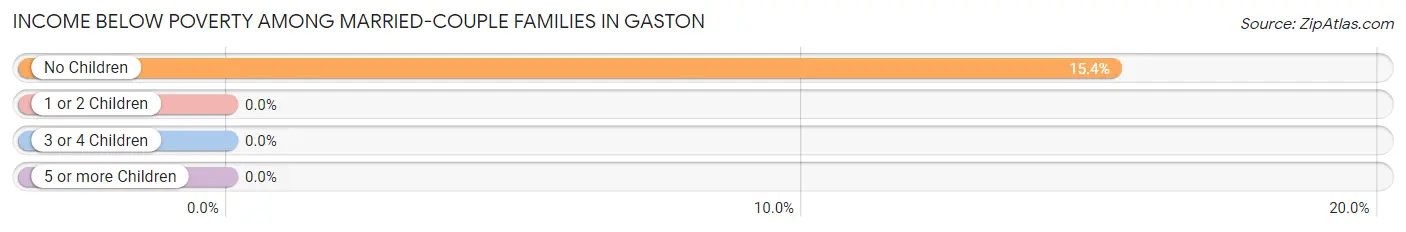
| Children | Above Poverty | Below Poverty |
| No Children | 44 (84.6%) | 8 (15.4%) |
| 1 or 2 Children | 50 (100.0%) | 0 (0.0%) |
| 3 or 4 Children | 17 (100.0%) | 0 (0.0%) |
| 5 or more Children | 0 (0.0%) | 0 (0.0%) |
| Total | 111 (93.3%) | 8 (6.7%) |
Income Below Poverty Among Single-Parent Households in Gaston
According to the poverty data in Gaston, 6.2% or 2 single-father households and 16.7% or 4 single-mother households are living below the poverty line. Among single-father households, those with 1 or 2 children have the highest poverty rate, with 2 households (22.2%) experiencing poverty. Likewise, among single-mother households, those with 3 or 4 children have the highest poverty rate, with 1 households (33.3%) falling below the poverty line.
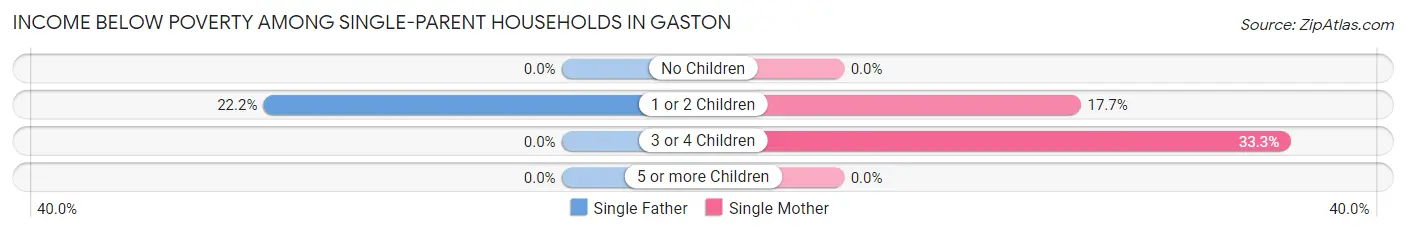
| Children | Single Father | Single Mother |
| No Children | 0 (0.0%) | 0 (0.0%) |
| 1 or 2 Children | 2 (22.2%) | 3 (17.6%) |
| 3 or 4 Children | 0 (0.0%) | 1 (33.3%) |
| 5 or more Children | 0 (0.0%) | 0 (0.0%) |
| Total | 2 (6.2%) | 4 (16.7%) |
Income Below Poverty Among Married-Couple vs Single-Parent Households in Gaston
The poverty data for Gaston shows that 8 of the married-couple family households (6.7%) and 6 of the single-parent households (10.7%) are living below the poverty level. Within the married-couple family households, those with no children have the highest poverty rate, with 8 households (15.4%) falling below the poverty line. Among the single-parent households, those with 3 or 4 children have the highest poverty rate, with 1 household (33.3%) living below poverty.
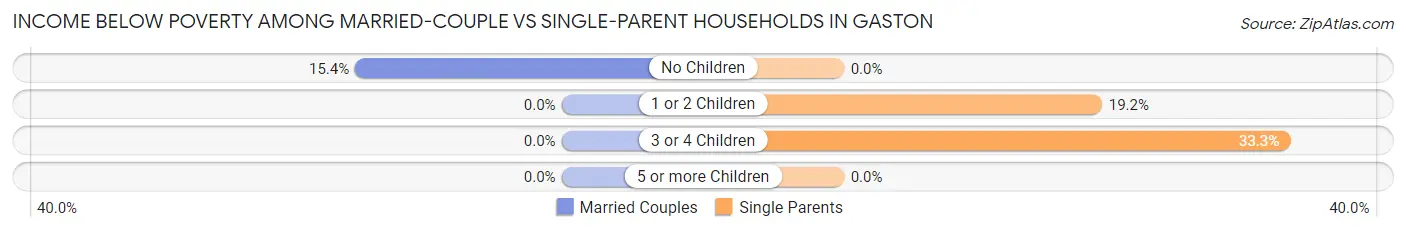
| Children | Married-Couple Families | Single-Parent Households |
| No Children | 8 (15.4%) | 0 (0.0%) |
| 1 or 2 Children | 0 (0.0%) | 5 (19.2%) |
| 3 or 4 Children | 0 (0.0%) | 1 (33.3%) |
| 5 or more Children | 0 (0.0%) | 0 (0.0%) |
| Total | 8 (6.7%) | 6 (10.7%) |
Race in Gaston
The most populous races in Gaston are White / Caucasian (673 | 95.5%), Two or more Races (28 | 4.0%), and Hispanic or Latino (20 | 2.8%).
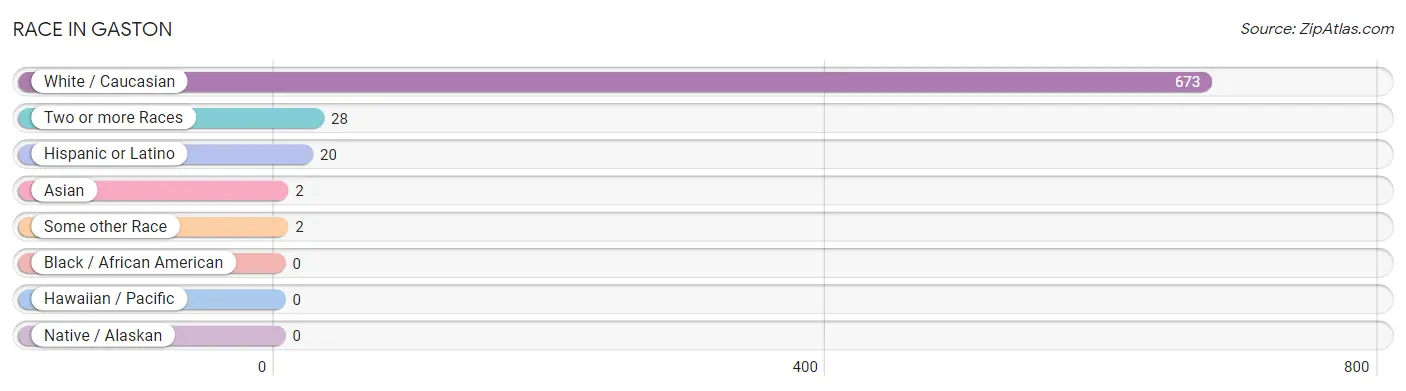
| Race | # Population | % Population |
| Asian | 2 | 0.3% |
| Black / African American | 0 | 0.0% |
| Hawaiian / Pacific | 0 | 0.0% |
| Hispanic or Latino | 20 | 2.8% |
| Native / Alaskan | 0 | 0.0% |
| White / Caucasian | 673 | 95.5% |
| Two or more Races | 28 | 4.0% |
| Some other Race | 2 | 0.3% |
| Total | 705 | 100.0% |
Ancestry in Gaston
The most populous ancestries reported in Gaston are Irish (150 | 21.3%), German (139 | 19.7%), American (81 | 11.5%), English (45 | 6.4%), and Welsh (21 | 3.0%), together accounting for 61.8% of all Gaston residents.
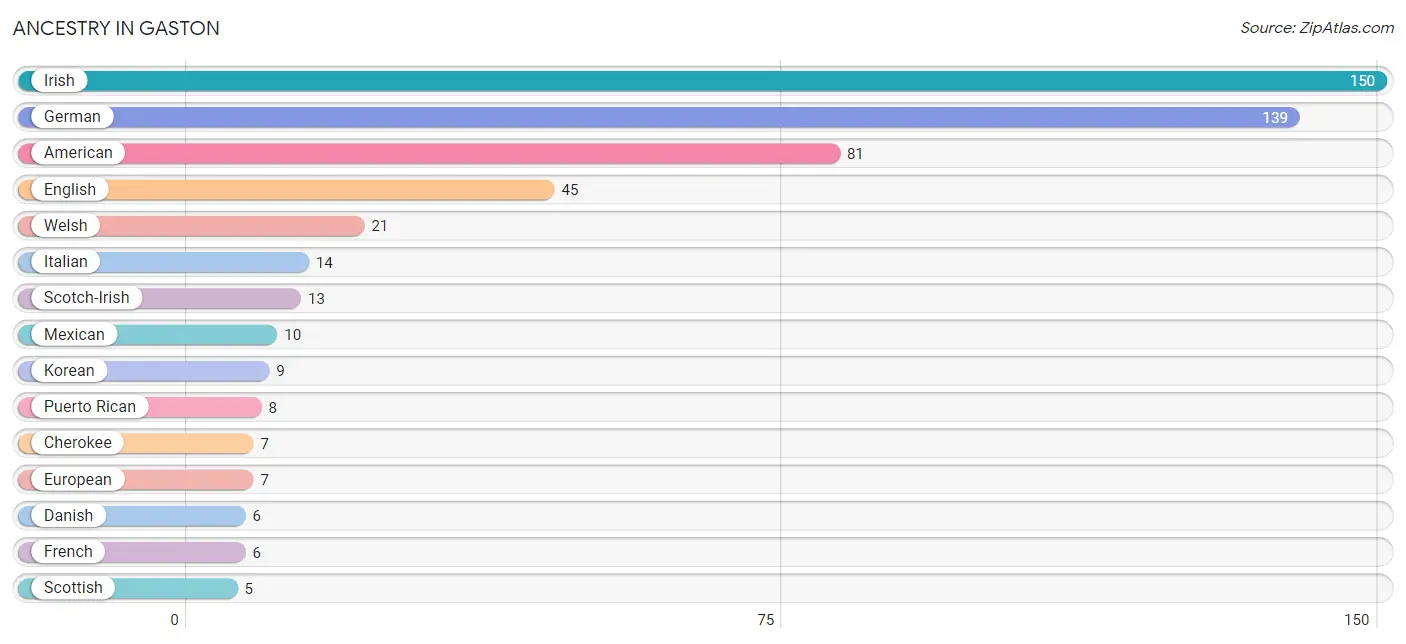
| Ancestry | # Population | % Population |
| American | 81 | 11.5% |
| Belgian | 3 | 0.4% |
| Cherokee | 7 | 1.0% |
| Danish | 6 | 0.9% |
| Dutch | 2 | 0.3% |
| English | 45 | 6.4% |
| European | 7 | 1.0% |
| Finnish | 3 | 0.4% |
| French | 6 | 0.9% |
| German | 139 | 19.7% |
| Irish | 150 | 21.3% |
| Italian | 14 | 2.0% |
| Korean | 9 | 1.3% |
| Mexican | 10 | 1.4% |
| Portuguese | 1 | 0.1% |
| Puerto Rican | 8 | 1.1% |
| Scandinavian | 4 | 0.6% |
| Scotch-Irish | 13 | 1.8% |
| Scottish | 5 | 0.7% |
| Swedish | 3 | 0.4% |
| Welsh | 21 | 3.0% | View All 21 Rows |
Immigrants in Gaston
The most numerous immigrant groups reported in Gaston came from Central America (4 | 0.6%), Latin America (4 | 0.6%), Mexico (4 | 0.6%), Asia (2 | 0.3%), and Philippines (2 | 0.3%), together accounting for 2.3% of all Gaston residents.
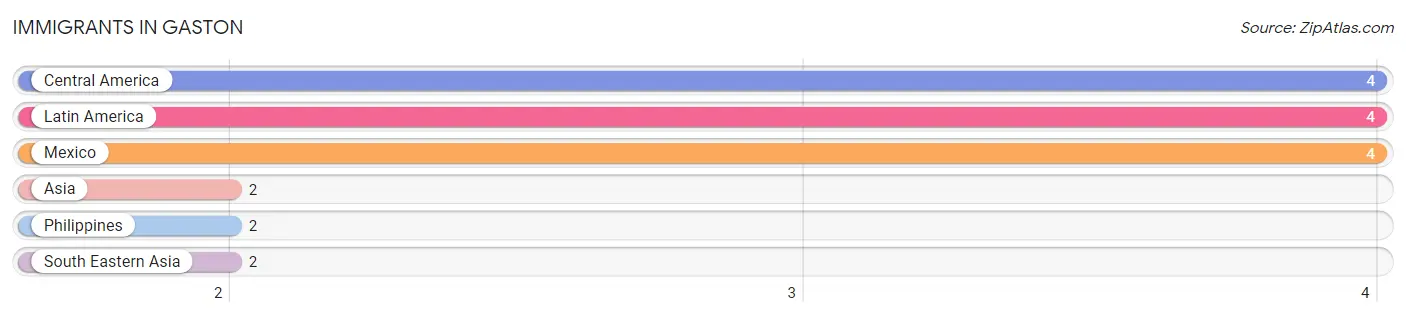
| Immigration Origin | # Population | % Population |
| Asia | 2 | 0.3% |
| Central America | 4 | 0.6% |
| Latin America | 4 | 0.6% |
| Mexico | 4 | 0.6% |
| Philippines | 2 | 0.3% |
| South Eastern Asia | 2 | 0.3% | View All 6 Rows |
Sex and Age in Gaston
Sex and Age in Gaston
The most populous age groups in Gaston are 20 to 24 Years (46 | 13.0%) for men and 45 to 49 Years (38 | 10.9%) for women.
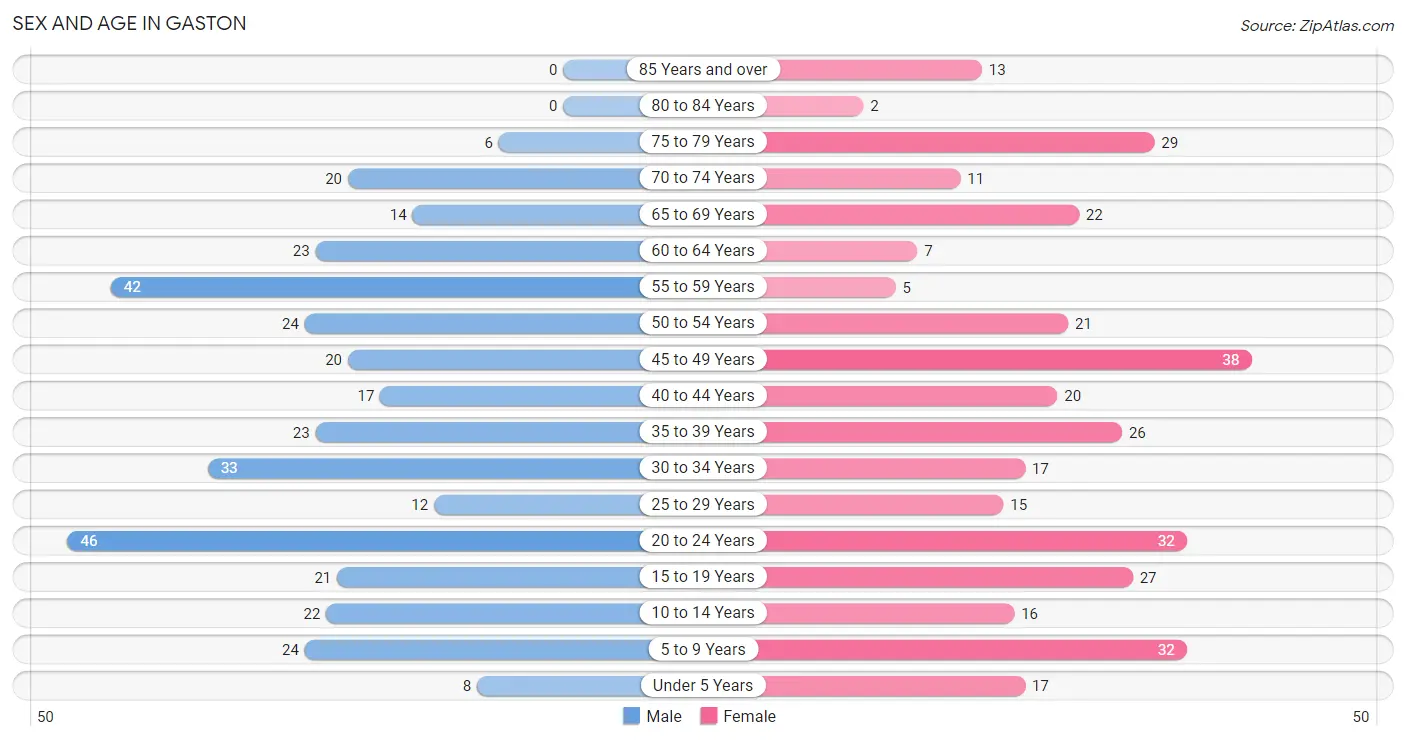
| Age Bracket | Male | Female |
| Under 5 Years | 8 (2.2%) | 17 (4.9%) |
| 5 to 9 Years | 24 (6.8%) | 32 (9.1%) |
| 10 to 14 Years | 22 (6.2%) | 16 (4.6%) |
| 15 to 19 Years | 21 (5.9%) | 27 (7.7%) |
| 20 to 24 Years | 46 (13.0%) | 32 (9.1%) |
| 25 to 29 Years | 12 (3.4%) | 15 (4.3%) |
| 30 to 34 Years | 33 (9.3%) | 17 (4.9%) |
| 35 to 39 Years | 23 (6.5%) | 26 (7.4%) |
| 40 to 44 Years | 17 (4.8%) | 20 (5.7%) |
| 45 to 49 Years | 20 (5.6%) | 38 (10.9%) |
| 50 to 54 Years | 24 (6.8%) | 21 (6.0%) |
| 55 to 59 Years | 42 (11.8%) | 5 (1.4%) |
| 60 to 64 Years | 23 (6.5%) | 7 (2.0%) |
| 65 to 69 Years | 14 (3.9%) | 22 (6.3%) |
| 70 to 74 Years | 20 (5.6%) | 11 (3.1%) |
| 75 to 79 Years | 6 (1.7%) | 29 (8.3%) |
| 80 to 84 Years | 0 (0.0%) | 2 (0.6%) |
| 85 Years and over | 0 (0.0%) | 13 (3.7%) |
| Total | 355 (100.0%) | 350 (100.0%) |
Families and Households in Gaston
Median Family Size in Gaston
The median family size in Gaston is 3.11 persons per family, with single male/father families (32 | 18.3%) accounting for the largest median family size of 3.34 persons per family. On the other hand, single female/mother families (24 | 13.7%) represent the smallest median family size with 2.67 persons per family.
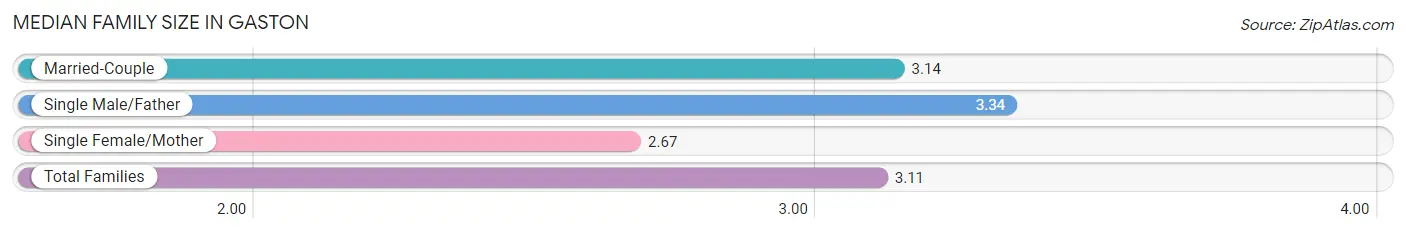
| Family Type | # Families | Family Size |
| Married-Couple | 119 (68.0%) | 3.14 |
| Single Male/Father | 32 (18.3%) | 3.34 |
| Single Female/Mother | 24 (13.7%) | 2.67 |
| Total Families | 175 (100.0%) | 3.11 |
Median Household Size in Gaston
The median household size in Gaston is 2.47 persons per household, with single male/father households (32 | 11.2%) accounting for the largest median household size of 3.53 persons per household. non-family households (110 | 38.6%) represent the smallest median household size with 1.29 persons per household.
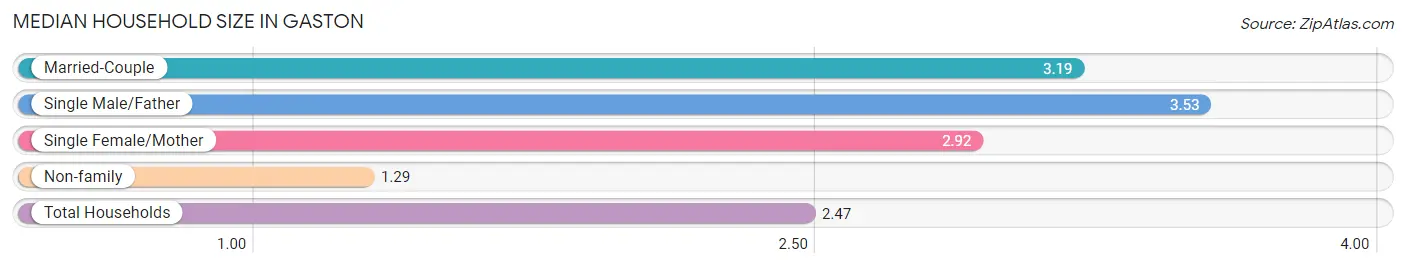
| Household Type | # Households | Household Size |
| Married-Couple | 119 (41.7%) | 3.19 |
| Single Male/Father | 32 (11.2%) | 3.53 |
| Single Female/Mother | 24 (8.4%) | 2.92 |
| Non-family | 110 (38.6%) | 1.29 |
| Total Households | 285 (100.0%) | 2.47 |
Household Size by Marriage Status in Gaston
Out of a total of 285 households in Gaston, 175 (61.4%) are family households, while 110 (38.6%) are nonfamily households. The most numerous type of family households are 2-person households, comprising 71, and the most common type of nonfamily households are 1-person households, comprising 85.
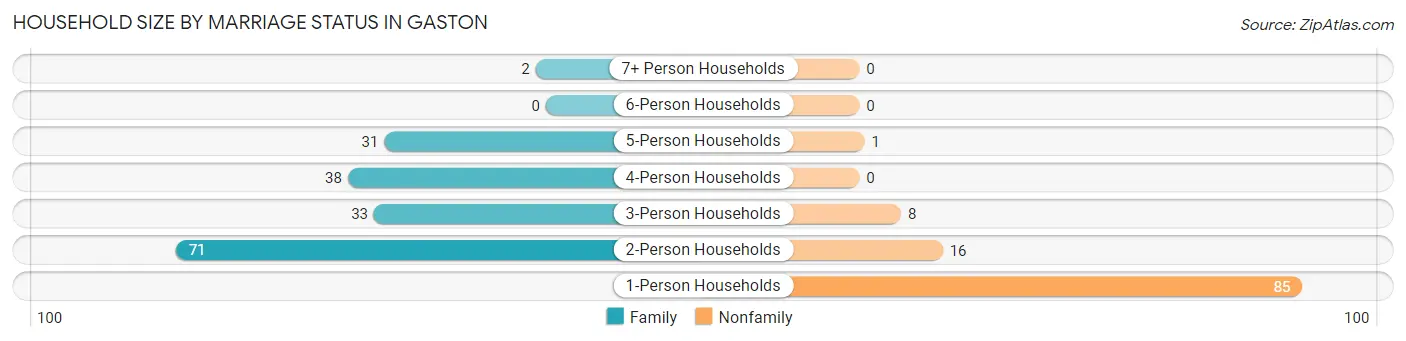
| Household Size | Family Households | Nonfamily Households |
| 1-Person Households | - | 85 (29.8%) |
| 2-Person Households | 71 (24.9%) | 16 (5.6%) |
| 3-Person Households | 33 (11.6%) | 8 (2.8%) |
| 4-Person Households | 38 (13.3%) | 0 (0.0%) |
| 5-Person Households | 31 (10.9%) | 1 (0.4%) |
| 6-Person Households | 0 (0.0%) | 0 (0.0%) |
| 7+ Person Households | 2 (0.7%) | 0 (0.0%) |
| Total | 175 (61.4%) | 110 (38.6%) |
Female Fertility in Gaston
Fertility by Age in Gaston
Average fertility rate in Gaston is 61.0 births per 1,000 women. Women in the age bracket of 20 to 34 years have the highest fertility rate with 125.0 births per 1,000 women. Women in the age bracket of 20 to 34 years acount for 72.7% of all women with births.
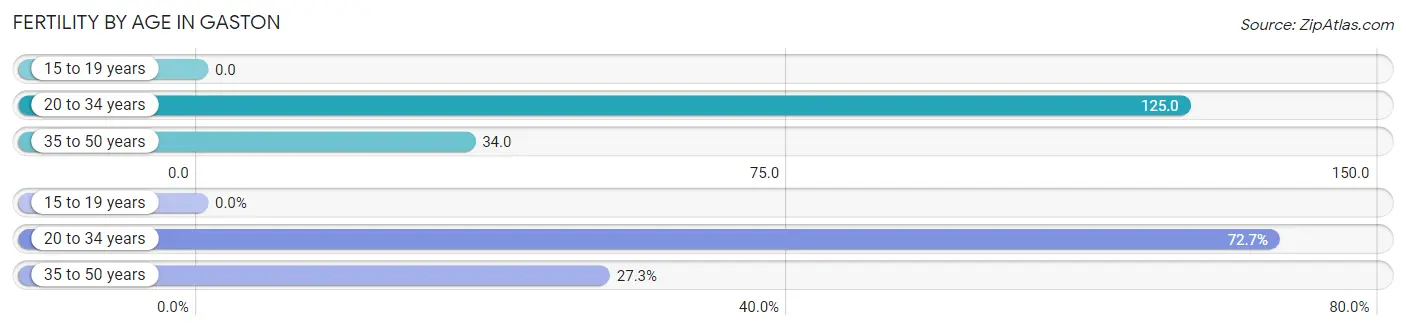
| Age Bracket | Women with Births | Births / 1,000 Women |
| 15 to 19 years | 0 (0.0%) | 0.0 |
| 20 to 34 years | 8 (72.7%) | 125.0 |
| 35 to 50 years | 3 (27.3%) | 34.0 |
| Total | 11 (100.0%) | 61.0 |
Fertility by Age by Marriage Status in Gaston
36.4% of women with births (11) in Gaston are married. The highest percentage of unmarried women with births falls into 20 to 34 years age bracket with 87.5% of them unmarried at the time of birth, while the lowest percentage of unmarried women with births belong to 35 to 50 years age bracket with 0.0% of them unmarried.
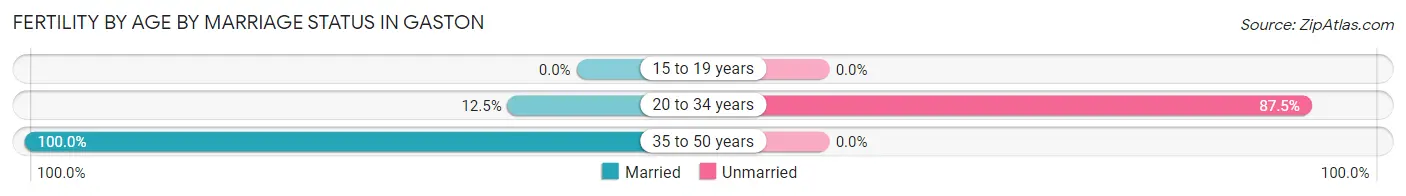
| Age Bracket | Married | Unmarried |
| 15 to 19 years | 0 (0.0%) | 0 (0.0%) |
| 20 to 34 years | 1 (12.5%) | 7 (87.5%) |
| 35 to 50 years | 3 (100.0%) | 0 (0.0%) |
| Total | 4 (36.4%) | 7 (63.6%) |
Fertility by Education in Gaston
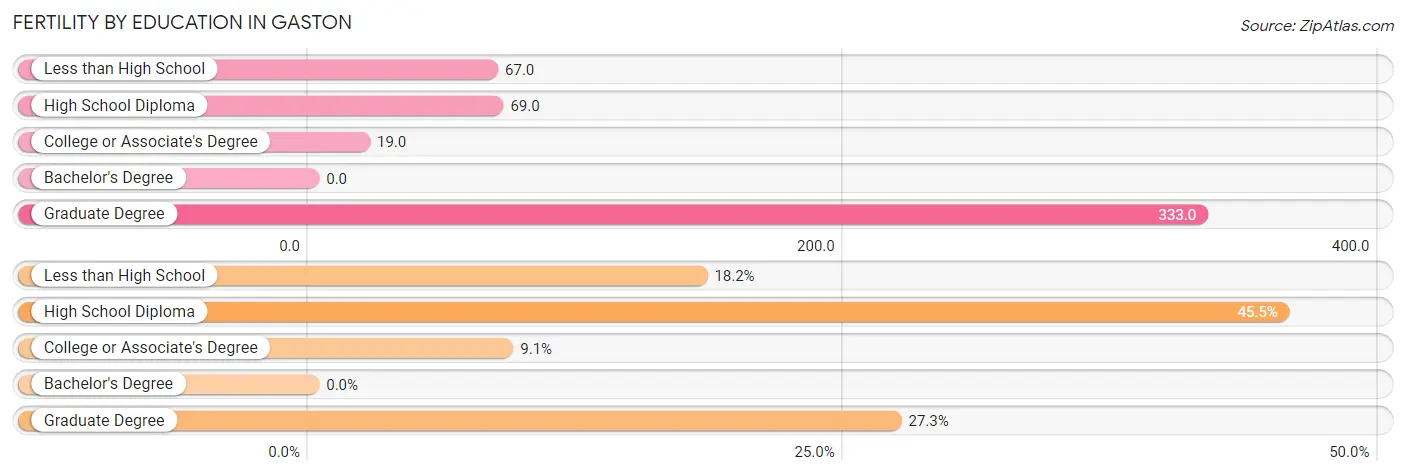
| Educational Attainment | Women with Births | Births / 1,000 Women |
| Less than High School | 2 (18.2%) | 67.0 |
| High School Diploma | 5 (45.5%) | 69.0 |
| College or Associate's Degree | 1 (9.1%) | 19.0 |
| Bachelor's Degree | 0 (0.0%) | 0.0 |
| Graduate Degree | 3 (27.3%) | 333.0 |
| Total | 11 (100.0%) | 61.0 |
Fertility by Education by Marriage Status in Gaston
63.6% of women with births in Gaston are unmarried. Women with the educational attainment of college or associate's degree are most likely to be married with 100.0% of them married at childbirth, while women with the educational attainment of less than high school are least likely to be married with 100.0% of them unmarried at childbirth.
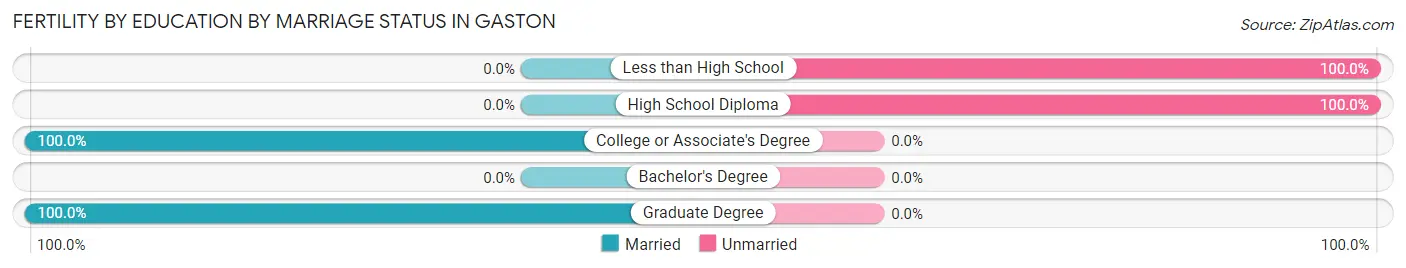
| Educational Attainment | Married | Unmarried |
| Less than High School | 0 (0.0%) | 2 (100.0%) |
| High School Diploma | 0 (0.0%) | 5 (100.0%) |
| College or Associate's Degree | 1 (100.0%) | 0 (0.0%) |
| Bachelor's Degree | 0 (0.0%) | 0 (0.0%) |
| Graduate Degree | 3 (100.0%) | 0 (0.0%) |
| Total | 4 (36.4%) | 7 (63.6%) |
Employment Characteristics in Gaston
Employment by Class of Employer in Gaston
Among the 321 employed individuals in Gaston, private company employees (248 | 77.3%), not-for-profit organizations (31 | 9.7%), and local government employees (19 | 5.9%) make up the most common classes of employment.
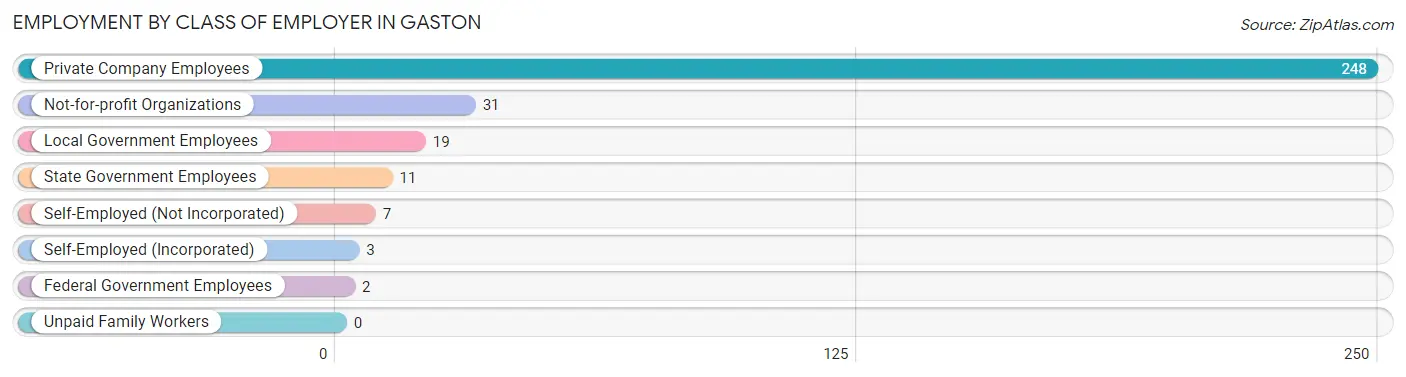
| Employer Class | # Employees | % Employees |
| Private Company Employees | 248 | 77.3% |
| Self-Employed (Incorporated) | 3 | 0.9% |
| Self-Employed (Not Incorporated) | 7 | 2.2% |
| Not-for-profit Organizations | 31 | 9.7% |
| Local Government Employees | 19 | 5.9% |
| State Government Employees | 11 | 3.4% |
| Federal Government Employees | 2 | 0.6% |
| Unpaid Family Workers | 0 | 0.0% |
| Total | 321 | 100.0% |
Employment Status by Age in Gaston
According to the labor force statistics for Gaston, out of the total population over 16 years of age (569), 62.7% or 357 individuals are in the labor force, with 8.1% or 29 of them unemployed. The age group with the highest labor force participation rate is 20 to 24 years, with 94.9% or 74 individuals in the labor force. Within the labor force, the 20 to 24 years age range has the highest percentage of unemployed individuals, with 31.1% or 23 of them being unemployed.
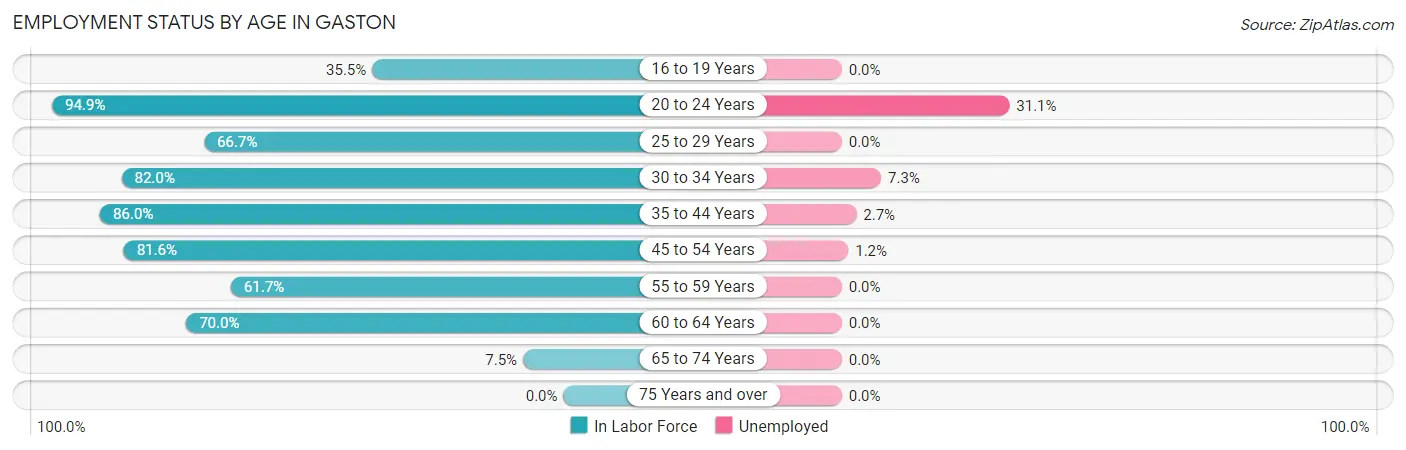
| Age Bracket | In Labor Force | Unemployed |
| 16 to 19 Years | 11 (35.5%) | 0 (0.0%) |
| 20 to 24 Years | 74 (94.9%) | 23 (31.1%) |
| 25 to 29 Years | 18 (66.7%) | 0 (0.0%) |
| 30 to 34 Years | 41 (82.0%) | 3 (7.3%) |
| 35 to 44 Years | 74 (86.0%) | 2 (2.7%) |
| 45 to 54 Years | 84 (81.6%) | 1 (1.2%) |
| 55 to 59 Years | 29 (61.7%) | 0 (0.0%) |
| 60 to 64 Years | 21 (70.0%) | 0 (0.0%) |
| 65 to 74 Years | 5 (7.5%) | 0 (0.0%) |
| 75 Years and over | 0 (0.0%) | 0 (0.0%) |
| Total | 357 (62.7%) | 29 (8.1%) |
Employment Status by Educational Attainment in Gaston
According to labor force statistics for Gaston, 77.8% of individuals (267) out of the total population between 25 and 64 years of age (343) are in the labor force, with 2.2% or 6 of them being unemployed. The group with the highest labor force participation rate are those with the educational attainment of bachelor's degree or higher, with 85.0% or 34 individuals in the labor force. Within the labor force, individuals with less than high school education have the highest percentage of unemployment, with 5.9% or 2 of them being unemployed.
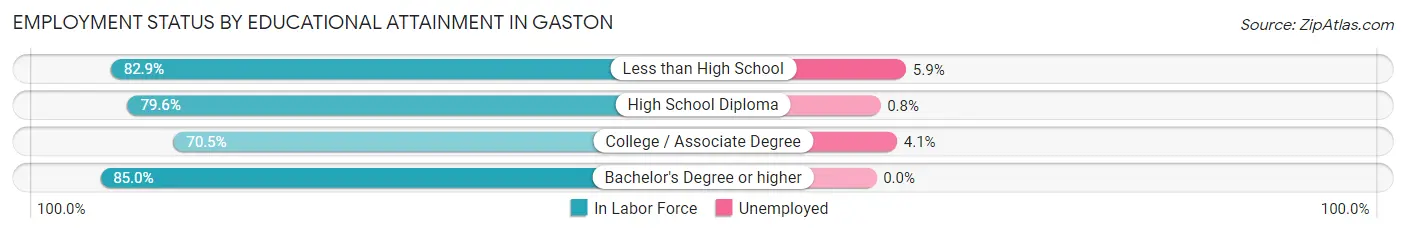
| Educational Attainment | In Labor Force | Unemployed |
| Less than High School | 34 (82.9%) | 2 (5.9%) |
| High School Diploma | 125 (79.6%) | 1 (0.8%) |
| College / Associate Degree | 74 (70.5%) | 4 (4.1%) |
| Bachelor's Degree or higher | 34 (85.0%) | 0 (0.0%) |
| Total | 267 (77.8%) | 8 (2.2%) |
Employment Occupations by Sex in Gaston
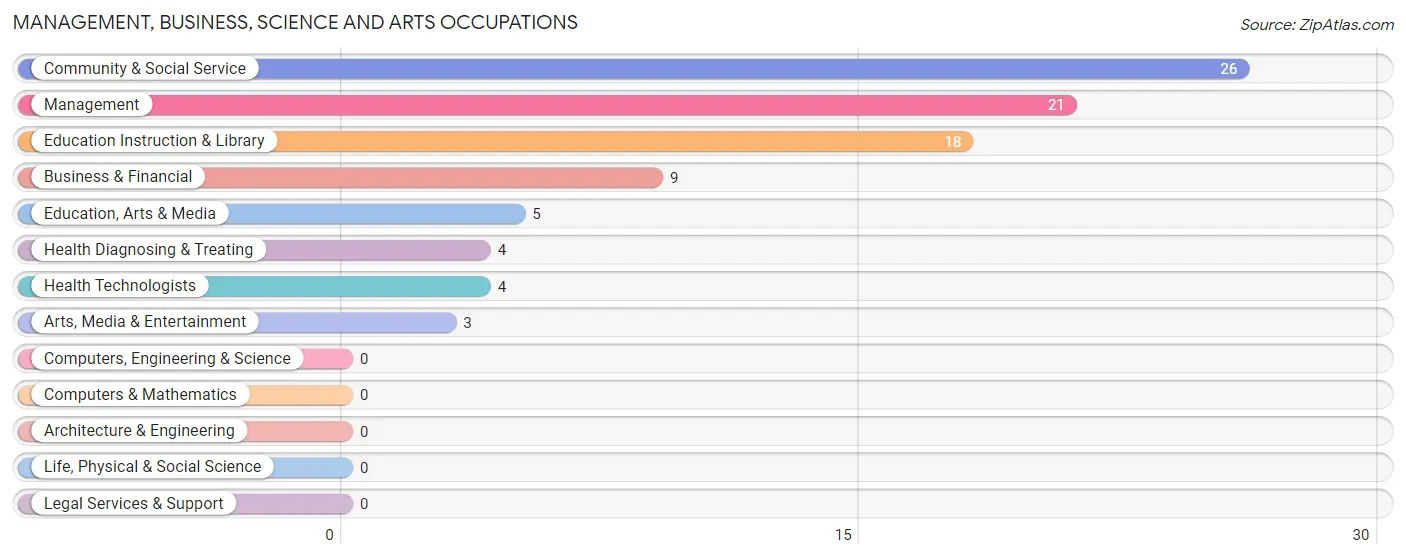
Management, Business, Science and Arts Occupations
The most common Management, Business, Science and Arts occupations in Gaston are Community & Social Service (26 | 7.9%), Management (21 | 6.4%), Education Instruction & Library (18 | 5.5%), Business & Financial (9 | 2.7%), and Education, Arts & Media (5 | 1.5%).
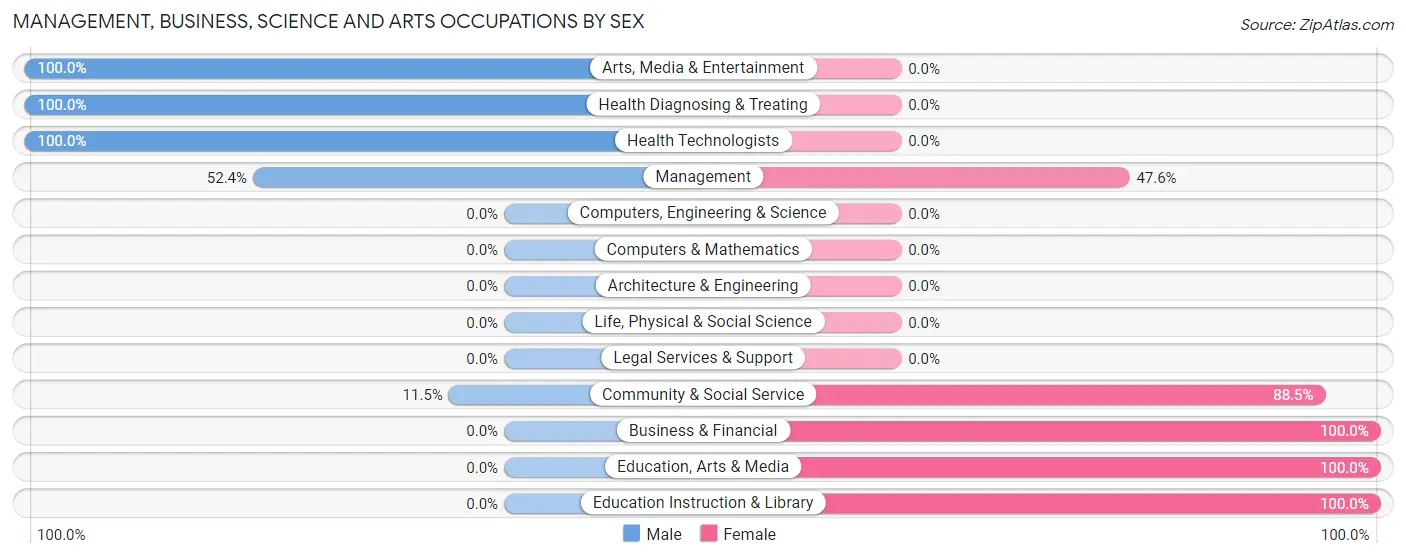
Management, Business, Science and Arts Occupations by Sex
Within the Management, Business, Science and Arts occupations in Gaston, the most male-oriented occupations are Arts, Media & Entertainment (100.0%), Health Diagnosing & Treating (100.0%), and Health Technologists (100.0%), while the most female-oriented occupations are Business & Financial (100.0%), Education, Arts & Media (100.0%), and Education Instruction & Library (100.0%).
| Occupation | Male | Female |
| Management | 11 (52.4%) | 10 (47.6%) |
| Business & Financial | 0 (0.0%) | 9 (100.0%) |
| Computers, Engineering & Science | 0 (0.0%) | 0 (0.0%) |
| Computers & Mathematics | 0 (0.0%) | 0 (0.0%) |
| Architecture & Engineering | 0 (0.0%) | 0 (0.0%) |
| Life, Physical & Social Science | 0 (0.0%) | 0 (0.0%) |
| Community & Social Service | 3 (11.5%) | 23 (88.5%) |
| Education, Arts & Media | 0 (0.0%) | 5 (100.0%) |
| Legal Services & Support | 0 (0.0%) | 0 (0.0%) |
| Education Instruction & Library | 0 (0.0%) | 18 (100.0%) |
| Arts, Media & Entertainment | 3 (100.0%) | 0 (0.0%) |
| Health Diagnosing & Treating | 4 (100.0%) | 0 (0.0%) |
| Health Technologists | 4 (100.0%) | 0 (0.0%) |
| Total (Category) | 18 (30.0%) | 42 (70.0%) |
| Total (Overall) | 191 (58.2%) | 137 (41.8%) |
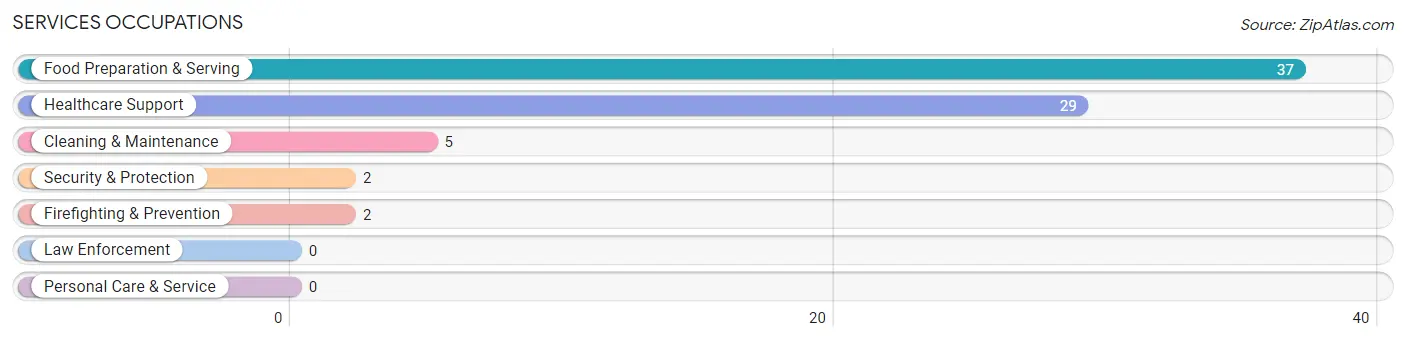
Services Occupations
The most common Services occupations in Gaston are Food Preparation & Serving (37 | 11.3%), Healthcare Support (29 | 8.8%), Cleaning & Maintenance (5 | 1.5%), Security & Protection (2 | 0.6%), and Firefighting & Prevention (2 | 0.6%).
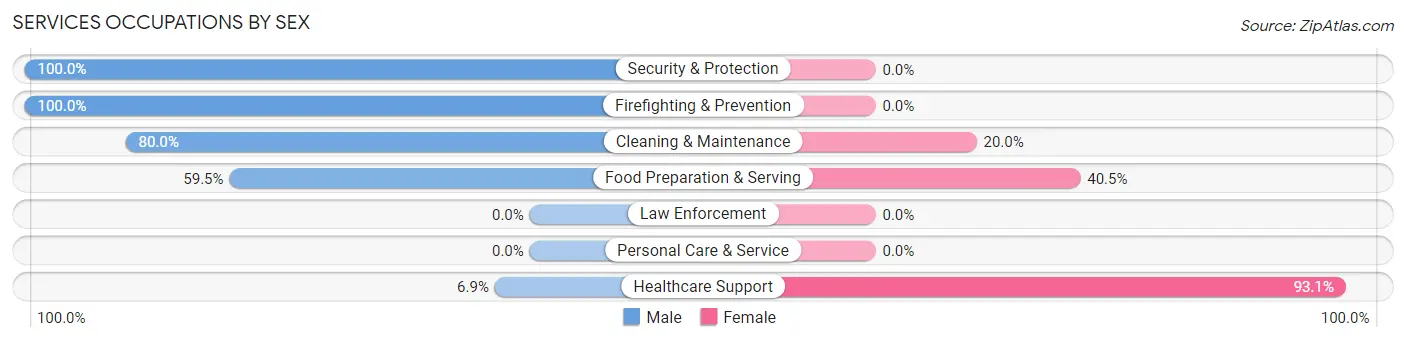
Services Occupations by Sex
Within the Services occupations in Gaston, the most male-oriented occupations are Security & Protection (100.0%), Firefighting & Prevention (100.0%), and Cleaning & Maintenance (80.0%), while the most female-oriented occupations are Healthcare Support (93.1%), Food Preparation & Serving (40.5%), and Cleaning & Maintenance (20.0%).
| Occupation | Male | Female |
| Healthcare Support | 2 (6.9%) | 27 (93.1%) |
| Security & Protection | 2 (100.0%) | 0 (0.0%) |
| Firefighting & Prevention | 2 (100.0%) | 0 (0.0%) |
| Law Enforcement | 0 (0.0%) | 0 (0.0%) |
| Food Preparation & Serving | 22 (59.5%) | 15 (40.5%) |
| Cleaning & Maintenance | 4 (80.0%) | 1 (20.0%) |
| Personal Care & Service | 0 (0.0%) | 0 (0.0%) |
| Total (Category) | 30 (41.1%) | 43 (58.9%) |
| Total (Overall) | 191 (58.2%) | 137 (41.8%) |
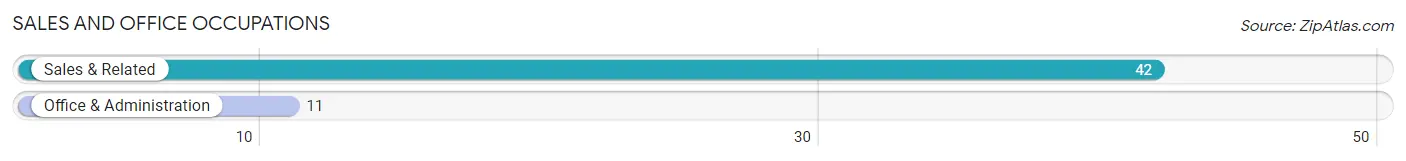
Sales and Office Occupations
The most common Sales and Office occupations in Gaston are Sales & Related (42 | 12.8%), and Office & Administration (11 | 3.4%).
Sales and Office Occupations by Sex
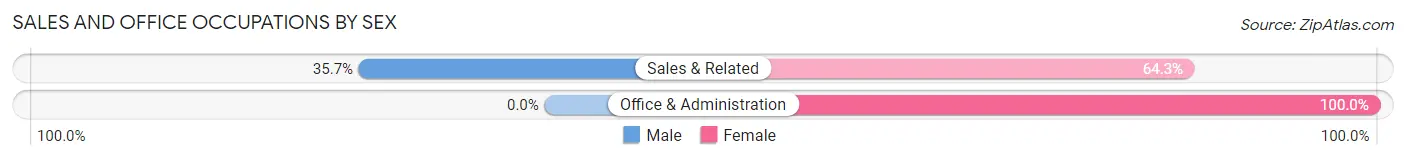
| Occupation | Male | Female |
| Sales & Related | 15 (35.7%) | 27 (64.3%) |
| Office & Administration | 0 (0.0%) | 11 (100.0%) |
| Total (Category) | 15 (28.3%) | 38 (71.7%) |
| Total (Overall) | 191 (58.2%) | 137 (41.8%) |
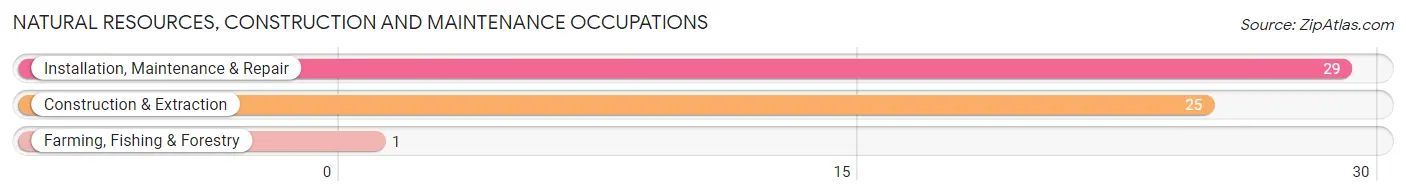
Natural Resources, Construction and Maintenance Occupations
The most common Natural Resources, Construction and Maintenance occupations in Gaston are Installation, Maintenance & Repair (29 | 8.8%), Construction & Extraction (25 | 7.6%), and Farming, Fishing & Forestry (1 | 0.3%).
Natural Resources, Construction and Maintenance Occupations by Sex
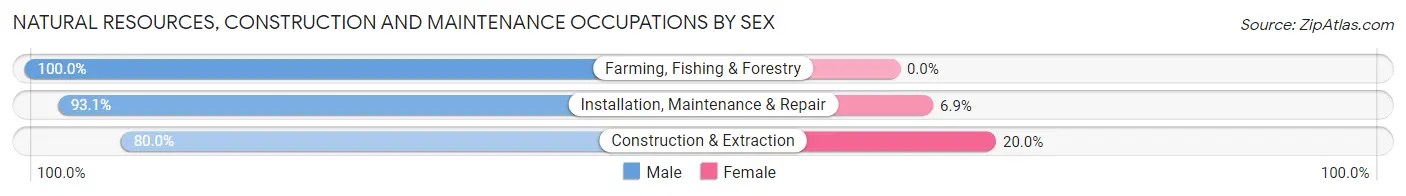
| Occupation | Male | Female |
| Farming, Fishing & Forestry | 1 (100.0%) | 0 (0.0%) |
| Construction & Extraction | 20 (80.0%) | 5 (20.0%) |
| Installation, Maintenance & Repair | 27 (93.1%) | 2 (6.9%) |
| Total (Category) | 48 (87.3%) | 7 (12.7%) |
| Total (Overall) | 191 (58.2%) | 137 (41.8%) |
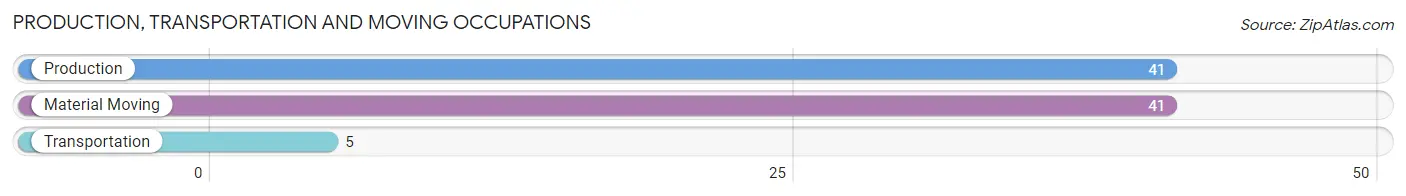
Production, Transportation and Moving Occupations
The most common Production, Transportation and Moving occupations in Gaston are Production (41 | 12.5%), Material Moving (41 | 12.5%), and Transportation (5 | 1.5%).
Production, Transportation and Moving Occupations by Sex
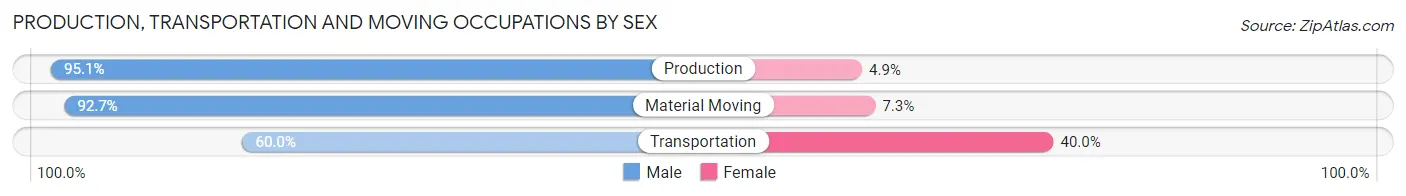
| Occupation | Male | Female |
| Production | 39 (95.1%) | 2 (4.9%) |
| Transportation | 3 (60.0%) | 2 (40.0%) |
| Material Moving | 38 (92.7%) | 3 (7.3%) |
| Total (Category) | 80 (91.9%) | 7 (8.1%) |
| Total (Overall) | 191 (58.2%) | 137 (41.8%) |
Employment Industries by Sex in Gaston
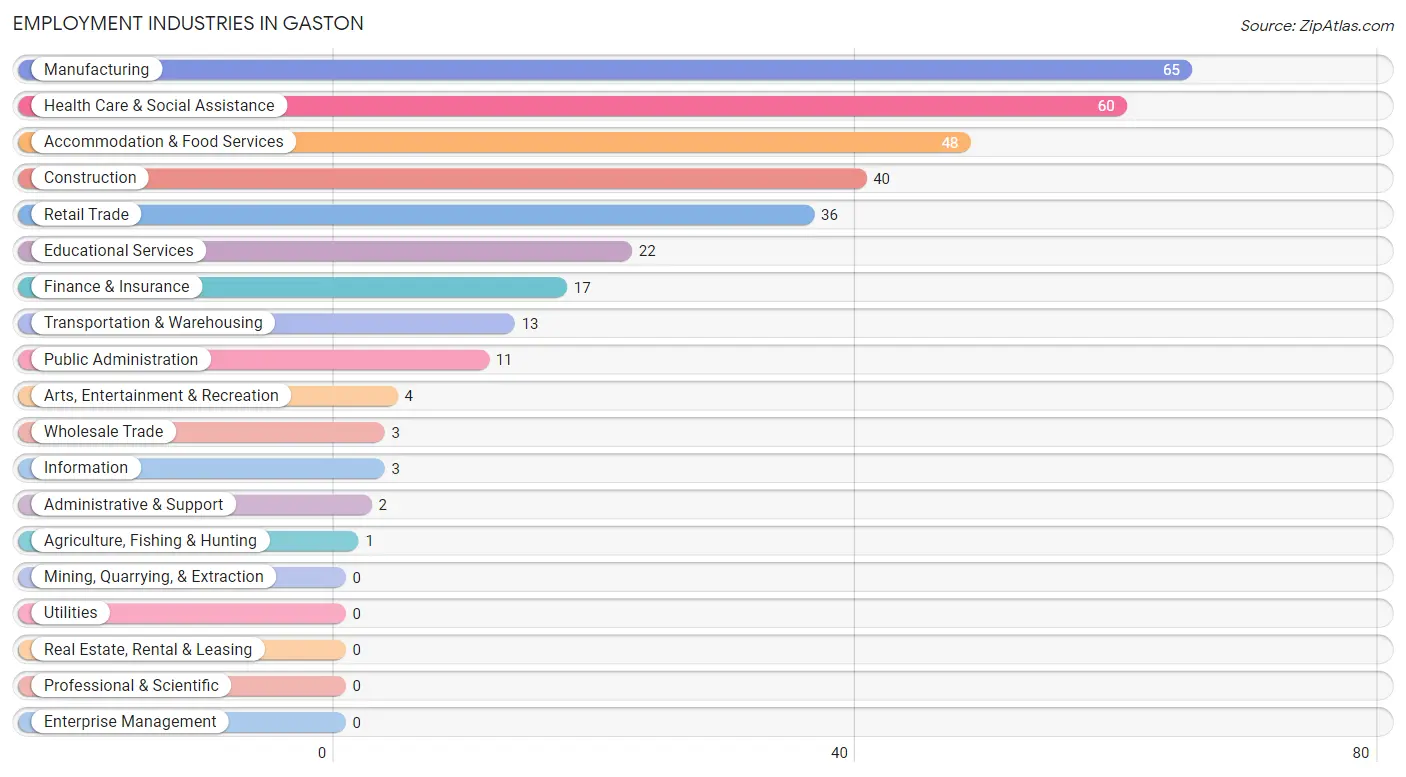
Employment Industries in Gaston
The major employment industries in Gaston include Manufacturing (65 | 19.8%), Health Care & Social Assistance (60 | 18.3%), Accommodation & Food Services (48 | 14.6%), Construction (40 | 12.2%), and Retail Trade (36 | 11.0%).
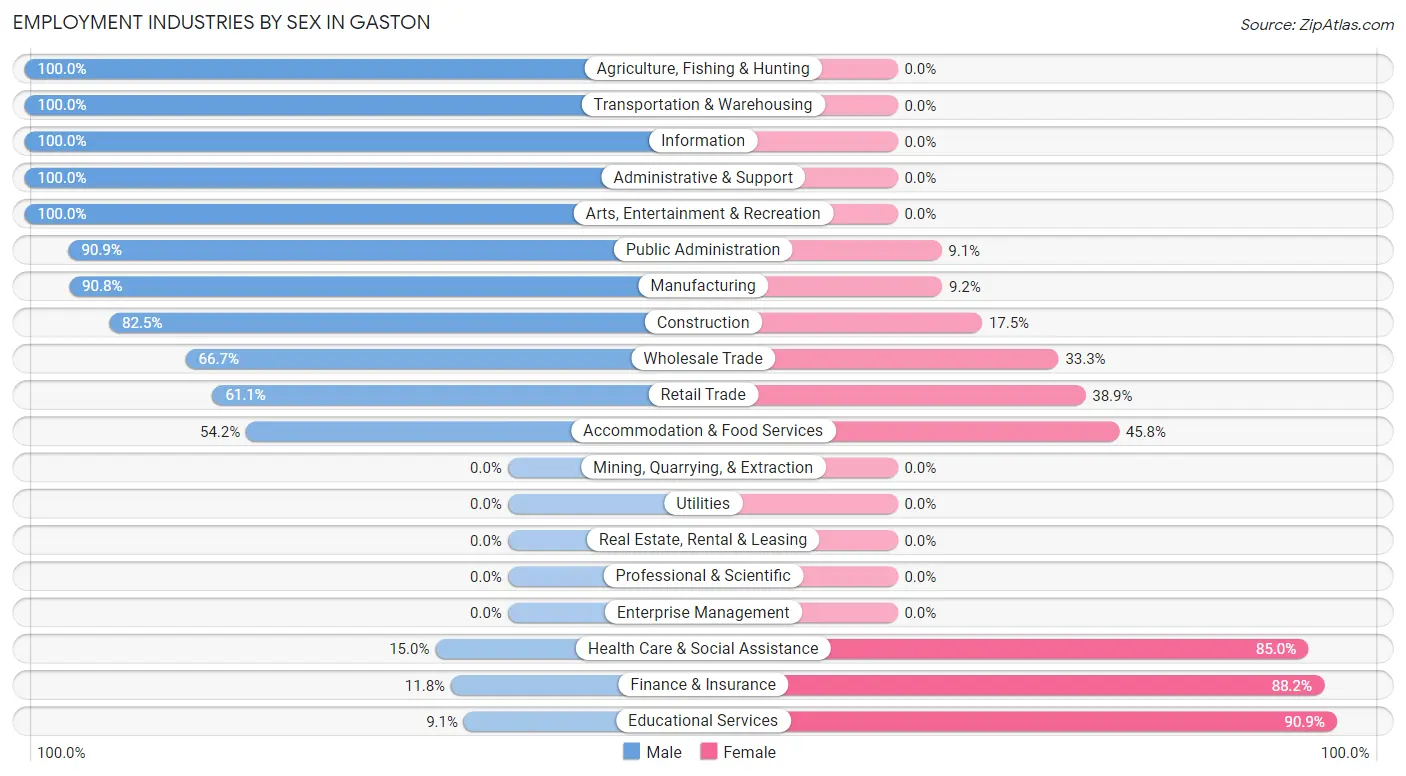
Employment Industries by Sex in Gaston
The Gaston industries that see more men than women are Agriculture, Fishing & Hunting (100.0%), Transportation & Warehousing (100.0%), and Information (100.0%), whereas the industries that tend to have a higher number of women are Educational Services (90.9%), Finance & Insurance (88.2%), and Health Care & Social Assistance (85.0%).
| Industry | Male | Female |
| Agriculture, Fishing & Hunting | 1 (100.0%) | 0 (0.0%) |
| Mining, Quarrying, & Extraction | 0 (0.0%) | 0 (0.0%) |
| Construction | 33 (82.5%) | 7 (17.5%) |
| Manufacturing | 59 (90.8%) | 6 (9.2%) |
| Wholesale Trade | 2 (66.7%) | 1 (33.3%) |
| Retail Trade | 22 (61.1%) | 14 (38.9%) |
| Transportation & Warehousing | 13 (100.0%) | 0 (0.0%) |
| Utilities | 0 (0.0%) | 0 (0.0%) |
| Information | 3 (100.0%) | 0 (0.0%) |
| Finance & Insurance | 2 (11.8%) | 15 (88.2%) |
| Real Estate, Rental & Leasing | 0 (0.0%) | 0 (0.0%) |
| Professional & Scientific | 0 (0.0%) | 0 (0.0%) |
| Enterprise Management | 0 (0.0%) | 0 (0.0%) |
| Administrative & Support | 2 (100.0%) | 0 (0.0%) |
| Educational Services | 2 (9.1%) | 20 (90.9%) |
| Health Care & Social Assistance | 9 (15.0%) | 51 (85.0%) |
| Arts, Entertainment & Recreation | 4 (100.0%) | 0 (0.0%) |
| Accommodation & Food Services | 26 (54.2%) | 22 (45.8%) |
| Public Administration | 10 (90.9%) | 1 (9.1%) |
| Total | 191 (58.2%) | 137 (41.8%) |
Education in Gaston
School Enrollment in Gaston
The most common levels of schooling among the 156 students in Gaston are high school (46 | 29.5%), elementary school (44 | 28.2%), and middle school (33 | 21.1%).
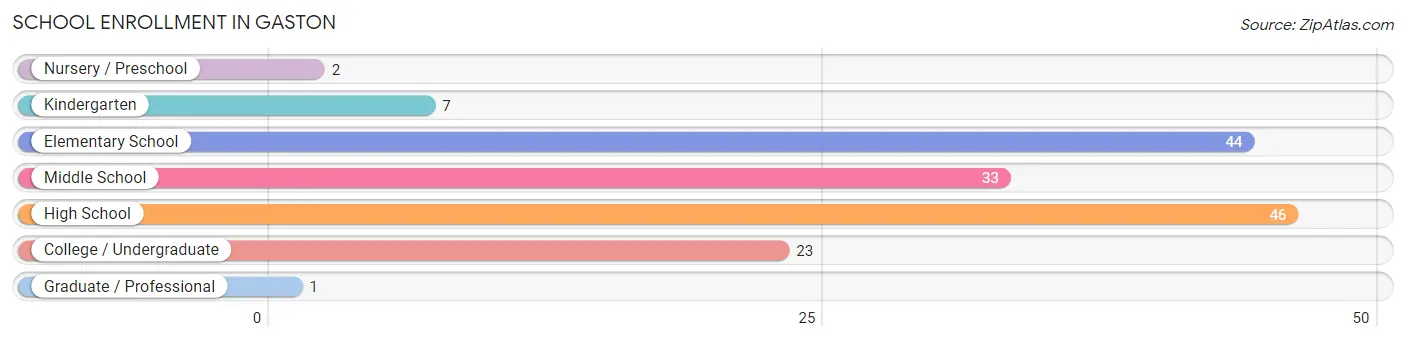
| School Level | # Students | % Students |
| Nursery / Preschool | 2 | 1.3% |
| Kindergarten | 7 | 4.5% |
| Elementary School | 44 | 28.2% |
| Middle School | 33 | 21.1% |
| High School | 46 | 29.5% |
| College / Undergraduate | 23 | 14.7% |
| Graduate / Professional | 1 | 0.6% |
| Total | 156 | 100.0% |
School Enrollment by Age by Funding Source in Gaston
Out of a total of 156 students who are enrolled in schools in Gaston, 13 (8.3%) attend a private institution, while the remaining 143 (91.7%) are enrolled in public schools. The age group of 18 to 19 year olds has the highest likelihood of being enrolled in private schools, with 2 (16.7% in the age bracket) enrolled. Conversely, the age group of 20 to 24 year olds has the lowest likelihood of being enrolled in a private school, with 4 (100.0% in the age bracket) attending a public institution.
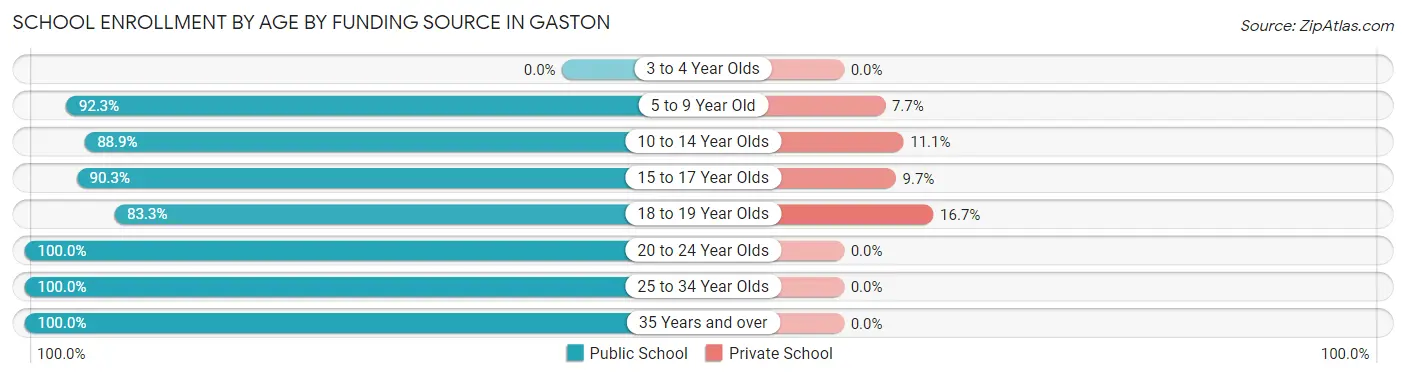
| Age Bracket | Public School | Private School |
| 3 to 4 Year Olds | 0 (0.0%) | 0 (0.0%) |
| 5 to 9 Year Old | 48 (92.3%) | 4 (7.7%) |
| 10 to 14 Year Olds | 32 (88.9%) | 4 (11.1%) |
| 15 to 17 Year Olds | 28 (90.3%) | 3 (9.7%) |
| 18 to 19 Year Olds | 10 (83.3%) | 2 (16.7%) |
| 20 to 24 Year Olds | 4 (100.0%) | 0 (0.0%) |
| 25 to 34 Year Olds | 12 (100.0%) | 0 (0.0%) |
| 35 Years and over | 9 (100.0%) | 0 (0.0%) |
| Total | 143 (91.7%) | 13 (8.3%) |
Educational Attainment by Field of Study in Gaston
Education (29 | 33.0%), business (19 | 21.6%), liberal arts & history (9 | 10.2%), science & technology (8 | 9.1%), and visual & performing arts (5 | 5.7%) are the most common fields of study among 88 individuals in Gaston who have obtained a bachelor's degree or higher.
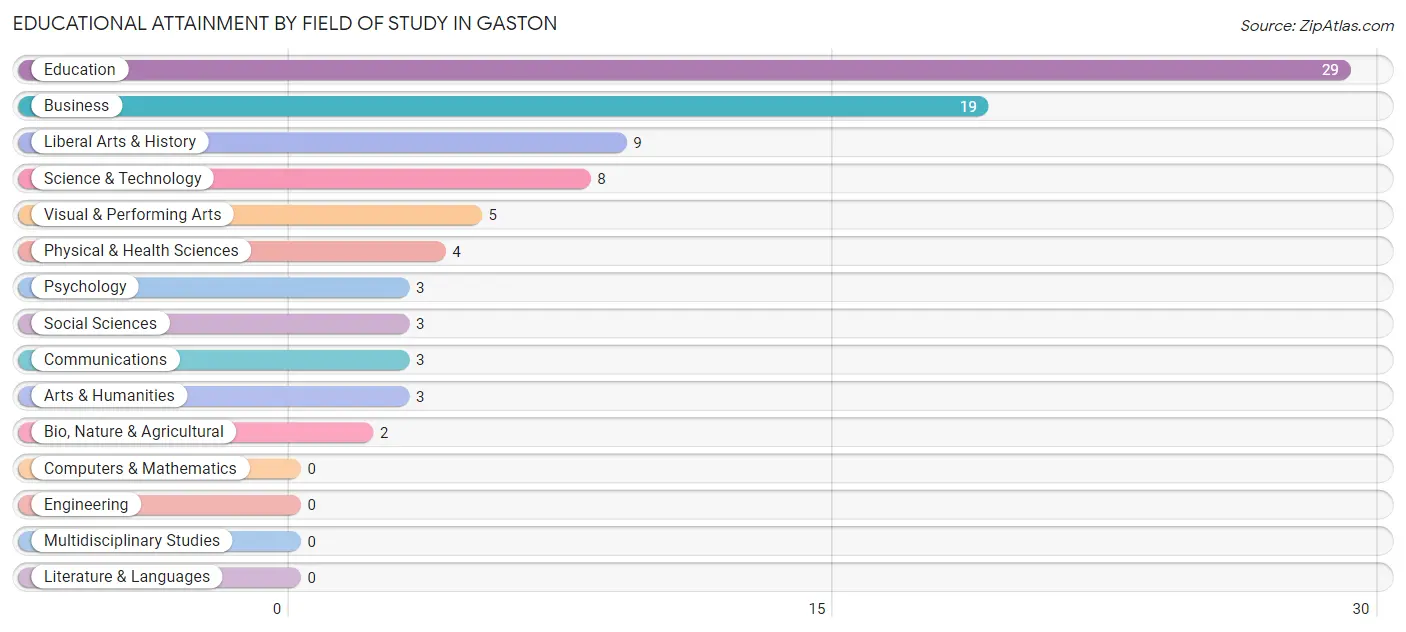
| Field of Study | # Graduates | % Graduates |
| Computers & Mathematics | 0 | 0.0% |
| Bio, Nature & Agricultural | 2 | 2.3% |
| Physical & Health Sciences | 4 | 4.5% |
| Psychology | 3 | 3.4% |
| Social Sciences | 3 | 3.4% |
| Engineering | 0 | 0.0% |
| Multidisciplinary Studies | 0 | 0.0% |
| Science & Technology | 8 | 9.1% |
| Business | 19 | 21.6% |
| Education | 29 | 33.0% |
| Literature & Languages | 0 | 0.0% |
| Liberal Arts & History | 9 | 10.2% |
| Visual & Performing Arts | 5 | 5.7% |
| Communications | 3 | 3.4% |
| Arts & Humanities | 3 | 3.4% |
| Total | 88 | 100.0% |
Transportation & Commute in Gaston
Vehicle Availability by Sex in Gaston
The most prevalent vehicle ownership categories in Gaston are males with 2 vehicles (73, accounting for 39.7%) and females with 2 vehicles (55, making up 53.3%).
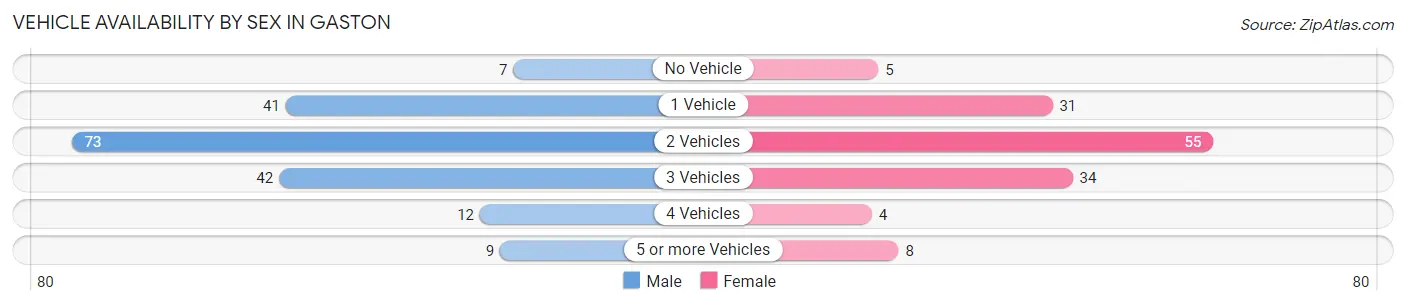
| Vehicles Available | Male | Female |
| No Vehicle | 7 (3.8%) | 5 (3.6%) |
| 1 Vehicle | 41 (22.3%) | 31 (22.6%) |
| 2 Vehicles | 73 (39.7%) | 55 (40.2%) |
| 3 Vehicles | 42 (22.8%) | 34 (24.8%) |
| 4 Vehicles | 12 (6.5%) | 4 (2.9%) |
| 5 or more Vehicles | 9 (4.9%) | 8 (5.8%) |
| Total | 184 (100.0%) | 137 (100.0%) |
Commute Time in Gaston
The most frequently occuring commute durations in Gaston are 20 to 24 minutes (79 commuters, 24.8%), 10 to 14 minutes (45 commuters, 14.1%), and 15 to 19 minutes (42 commuters, 13.2%).
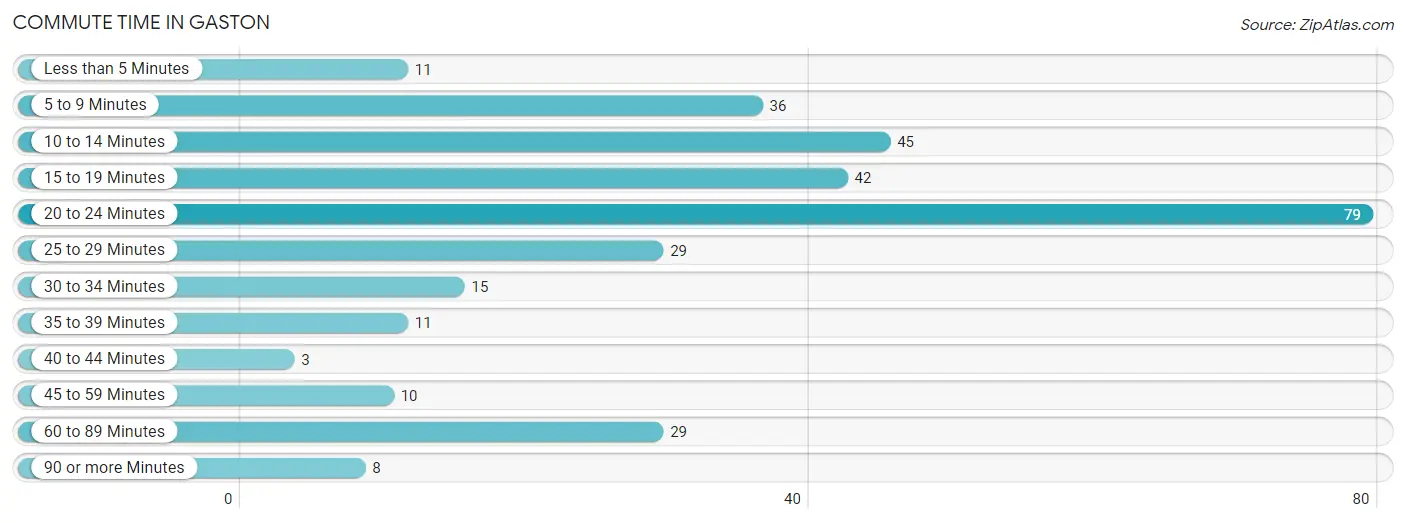
| Commute Time | # Commuters | % Commuters |
| Less than 5 Minutes | 11 | 3.5% |
| 5 to 9 Minutes | 36 | 11.3% |
| 10 to 14 Minutes | 45 | 14.1% |
| 15 to 19 Minutes | 42 | 13.2% |
| 20 to 24 Minutes | 79 | 24.8% |
| 25 to 29 Minutes | 29 | 9.1% |
| 30 to 34 Minutes | 15 | 4.7% |
| 35 to 39 Minutes | 11 | 3.5% |
| 40 to 44 Minutes | 3 | 0.9% |
| 45 to 59 Minutes | 10 | 3.1% |
| 60 to 89 Minutes | 29 | 9.1% |
| 90 or more Minutes | 8 | 2.5% |
Commute Time by Sex in Gaston
The most common commute times in Gaston are 20 to 24 minutes (57 commuters, 31.0%) for males and 15 to 19 minutes (29 commuters, 21.6%) for females.
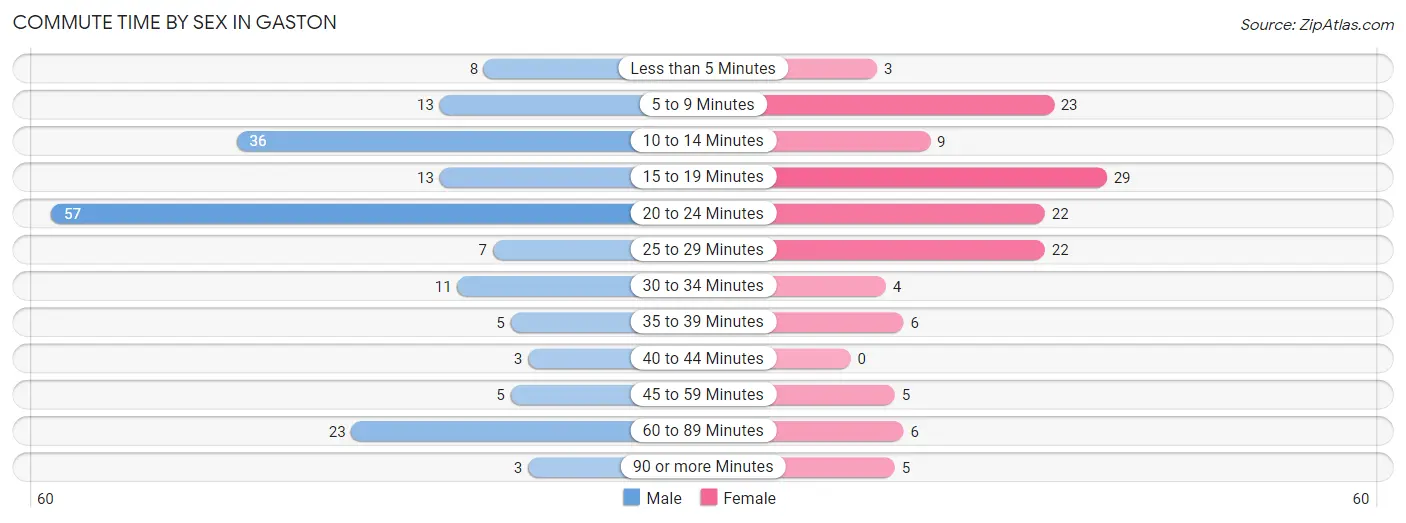
| Commute Time | Male | Female |
| Less than 5 Minutes | 8 (4.3%) | 3 (2.2%) |
| 5 to 9 Minutes | 13 (7.1%) | 23 (17.2%) |
| 10 to 14 Minutes | 36 (19.6%) | 9 (6.7%) |
| 15 to 19 Minutes | 13 (7.1%) | 29 (21.6%) |
| 20 to 24 Minutes | 57 (31.0%) | 22 (16.4%) |
| 25 to 29 Minutes | 7 (3.8%) | 22 (16.4%) |
| 30 to 34 Minutes | 11 (6.0%) | 4 (3.0%) |
| 35 to 39 Minutes | 5 (2.7%) | 6 (4.5%) |
| 40 to 44 Minutes | 3 (1.6%) | 0 (0.0%) |
| 45 to 59 Minutes | 5 (2.7%) | 5 (3.7%) |
| 60 to 89 Minutes | 23 (12.5%) | 6 (4.5%) |
| 90 or more Minutes | 3 (1.6%) | 5 (3.7%) |
Time of Departure to Work by Sex in Gaston
The most frequent times of departure to work in Gaston are 5:30 AM to 5:59 AM (39, 21.2%) for males and 7:00 AM to 7:29 AM (37, 27.6%) for females.
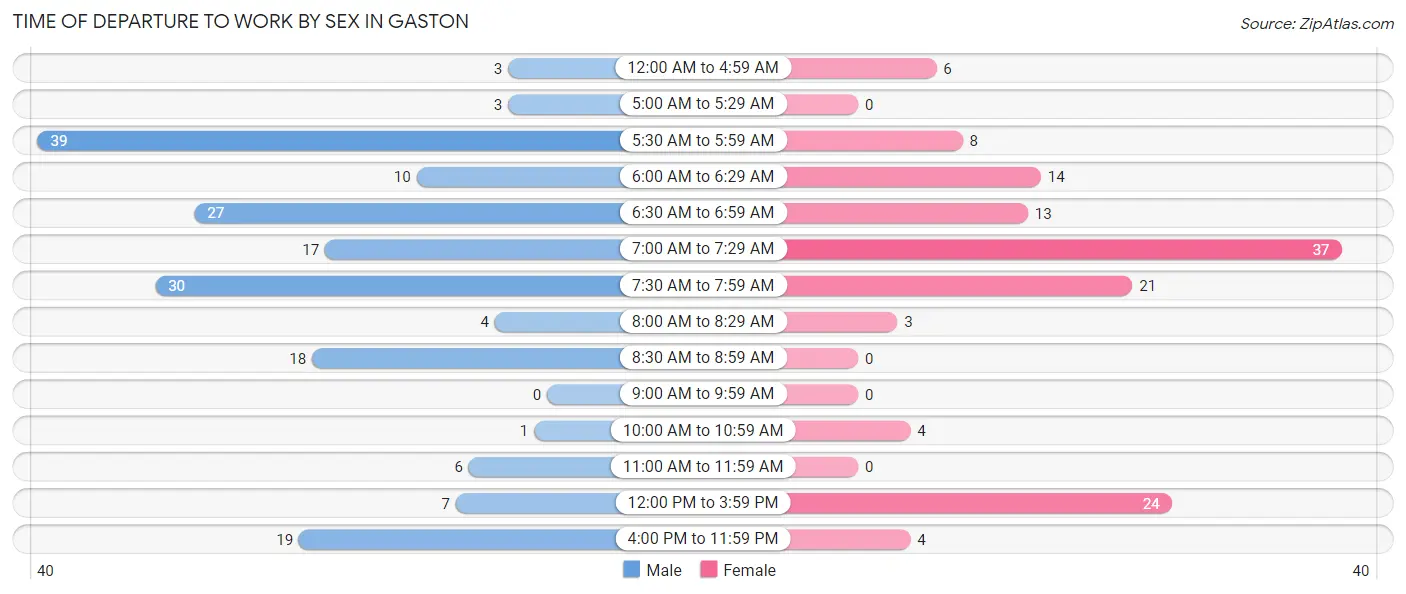
| Time of Departure | Male | Female |
| 12:00 AM to 4:59 AM | 3 (1.6%) | 6 (4.5%) |
| 5:00 AM to 5:29 AM | 3 (1.6%) | 0 (0.0%) |
| 5:30 AM to 5:59 AM | 39 (21.2%) | 8 (6.0%) |
| 6:00 AM to 6:29 AM | 10 (5.4%) | 14 (10.4%) |
| 6:30 AM to 6:59 AM | 27 (14.7%) | 13 (9.7%) |
| 7:00 AM to 7:29 AM | 17 (9.2%) | 37 (27.6%) |
| 7:30 AM to 7:59 AM | 30 (16.3%) | 21 (15.7%) |
| 8:00 AM to 8:29 AM | 4 (2.2%) | 3 (2.2%) |
| 8:30 AM to 8:59 AM | 18 (9.8%) | 0 (0.0%) |
| 9:00 AM to 9:59 AM | 0 (0.0%) | 0 (0.0%) |
| 10:00 AM to 10:59 AM | 1 (0.5%) | 4 (3.0%) |
| 11:00 AM to 11:59 AM | 6 (3.3%) | 0 (0.0%) |
| 12:00 PM to 3:59 PM | 7 (3.8%) | 24 (17.9%) |
| 4:00 PM to 11:59 PM | 19 (10.3%) | 4 (3.0%) |
| Total | 184 (100.0%) | 134 (100.0%) |
Housing Occupancy in Gaston
Occupancy by Ownership in Gaston
Of the total 285 dwellings in Gaston, owner-occupied units account for 210 (73.7%), while renter-occupied units make up 75 (26.3%).
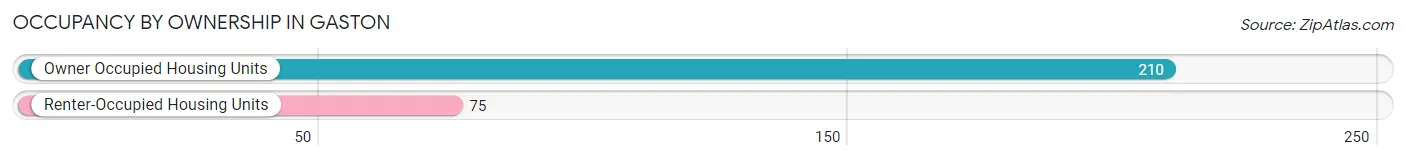
| Occupancy | # Housing Units | % Housing Units |
| Owner Occupied Housing Units | 210 | 73.7% |
| Renter-Occupied Housing Units | 75 | 26.3% |
| Total Occupied Housing Units | 285 | 100.0% |
Occupancy by Household Size in Gaston
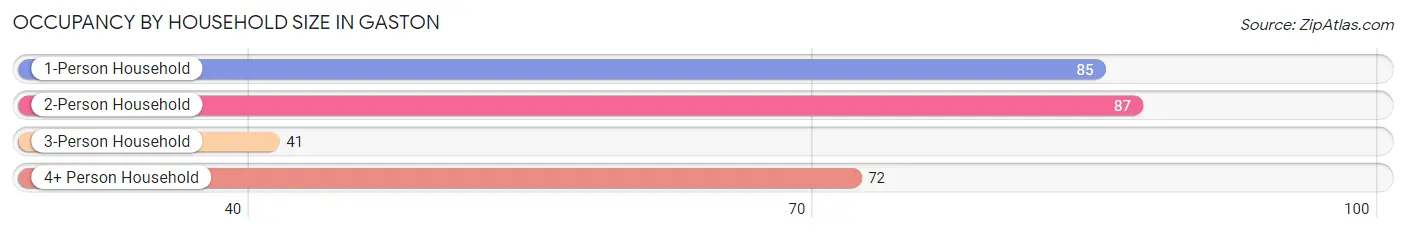
| Household Size | # Housing Units | % Housing Units |
| 1-Person Household | 85 | 29.8% |
| 2-Person Household | 87 | 30.5% |
| 3-Person Household | 41 | 14.4% |
| 4+ Person Household | 72 | 25.3% |
| Total Housing Units | 285 | 100.0% |
Occupancy by Ownership by Household Size in Gaston
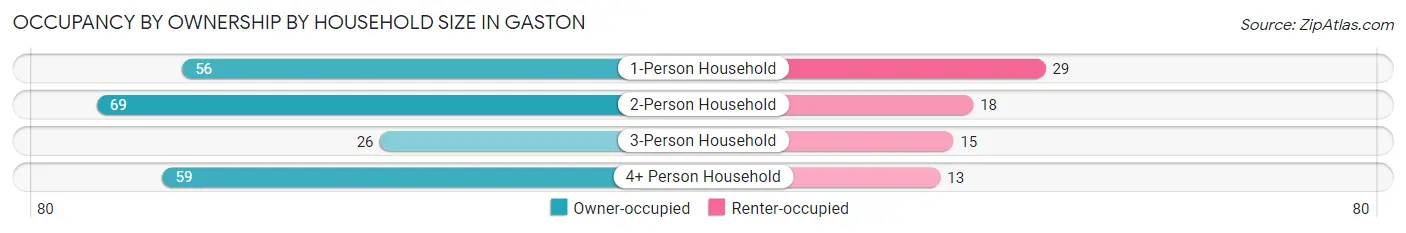
| Household Size | Owner-occupied | Renter-occupied |
| 1-Person Household | 56 (65.9%) | 29 (34.1%) |
| 2-Person Household | 69 (79.3%) | 18 (20.7%) |
| 3-Person Household | 26 (63.4%) | 15 (36.6%) |
| 4+ Person Household | 59 (81.9%) | 13 (18.1%) |
| Total Housing Units | 210 (73.7%) | 75 (26.3%) |
Occupancy by Educational Attainment in Gaston
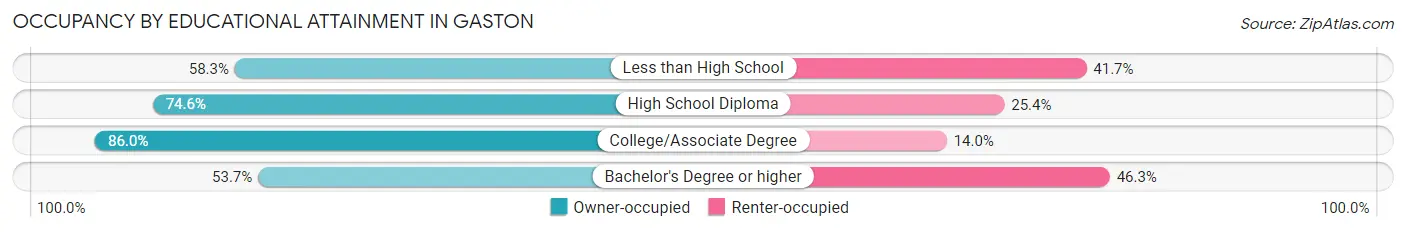
| Household Size | Owner-occupied | Renter-occupied |
| Less than High School | 7 (58.3%) | 5 (41.7%) |
| High School Diploma | 94 (74.6%) | 32 (25.4%) |
| College/Associate Degree | 80 (86.0%) | 13 (14.0%) |
| Bachelor's Degree or higher | 29 (53.7%) | 25 (46.3%) |
Occupancy by Age of Householder in Gaston
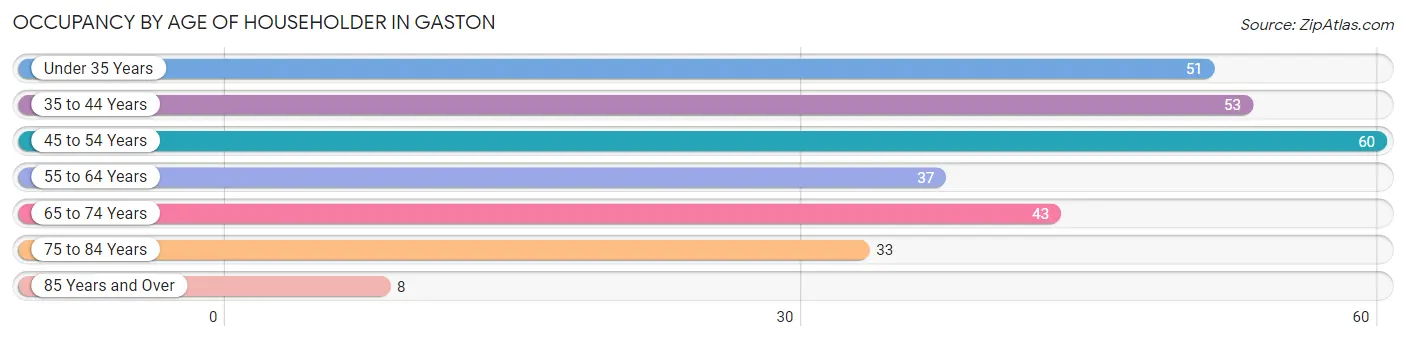
| Age Bracket | # Households | % Households |
| Under 35 Years | 51 | 17.9% |
| 35 to 44 Years | 53 | 18.6% |
| 45 to 54 Years | 60 | 21.0% |
| 55 to 64 Years | 37 | 13.0% |
| 65 to 74 Years | 43 | 15.1% |
| 75 to 84 Years | 33 | 11.6% |
| 85 Years and Over | 8 | 2.8% |
| Total | 285 | 100.0% |
Housing Finances in Gaston
Median Income by Occupancy in Gaston
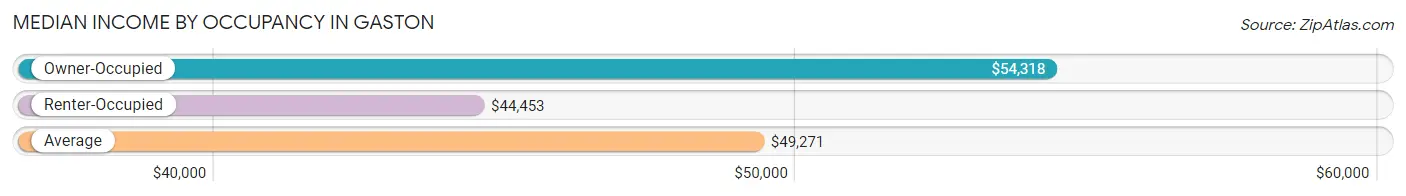
| Occupancy Type | # Households | Median Income |
| Owner-Occupied | 210 (73.7%) | $54,318 |
| Renter-Occupied | 75 (26.3%) | $44,453 |
| Average | 285 (100.0%) | $49,271 |
Occupancy by Householder Income Bracket in Gaston
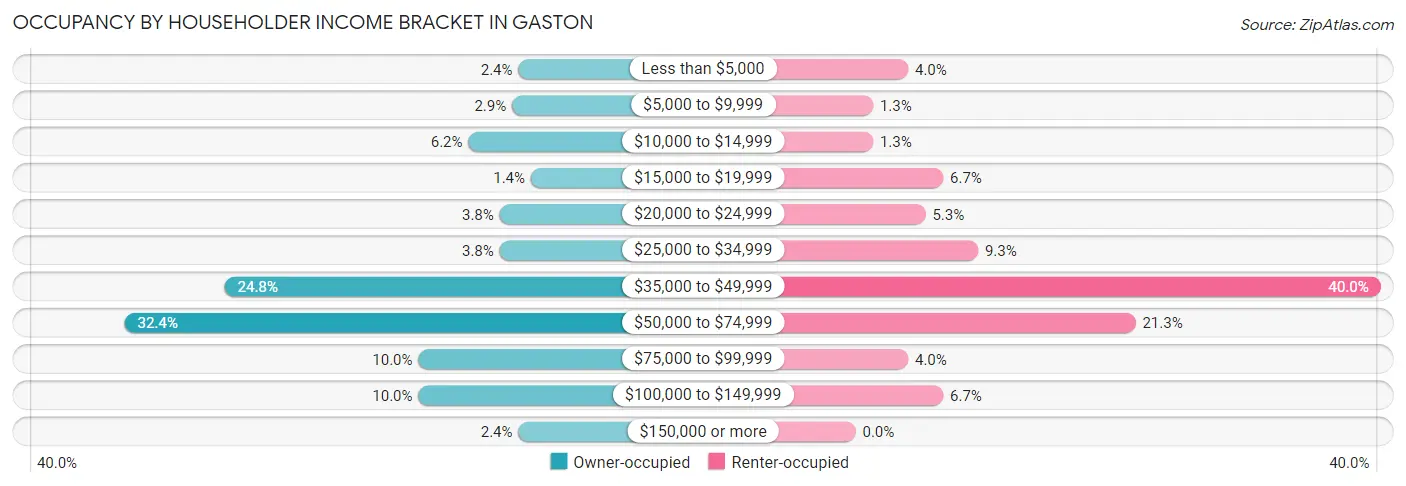
| Income Bracket | Owner-occupied | Renter-occupied |
| Less than $5,000 | 5 (2.4%) | 3 (4.0%) |
| $5,000 to $9,999 | 6 (2.9%) | 1 (1.3%) |
| $10,000 to $14,999 | 13 (6.2%) | 1 (1.3%) |
| $15,000 to $19,999 | 3 (1.4%) | 5 (6.7%) |
| $20,000 to $24,999 | 8 (3.8%) | 4 (5.3%) |
| $25,000 to $34,999 | 8 (3.8%) | 7 (9.3%) |
| $35,000 to $49,999 | 52 (24.8%) | 30 (40.0%) |
| $50,000 to $74,999 | 68 (32.4%) | 16 (21.3%) |
| $75,000 to $99,999 | 21 (10.0%) | 3 (4.0%) |
| $100,000 to $149,999 | 21 (10.0%) | 5 (6.7%) |
| $150,000 or more | 5 (2.4%) | 0 (0.0%) |
| Total | 210 (100.0%) | 75 (100.0%) |
Monthly Housing Cost Tiers in Gaston
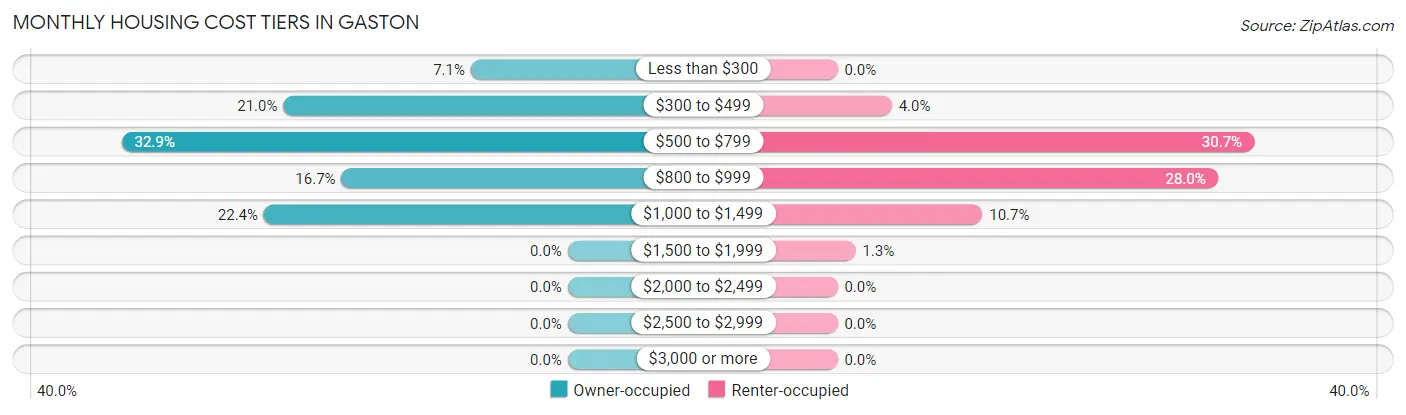
| Monthly Cost | Owner-occupied | Renter-occupied |
| Less than $300 | 15 (7.1%) | 0 (0.0%) |
| $300 to $499 | 44 (20.9%) | 3 (4.0%) |
| $500 to $799 | 69 (32.9%) | 23 (30.7%) |
| $800 to $999 | 35 (16.7%) | 21 (28.0%) |
| $1,000 to $1,499 | 47 (22.4%) | 8 (10.7%) |
| $1,500 to $1,999 | 0 (0.0%) | 1 (1.3%) |
| $2,000 to $2,499 | 0 (0.0%) | 0 (0.0%) |
| $2,500 to $2,999 | 0 (0.0%) | 0 (0.0%) |
| $3,000 or more | 0 (0.0%) | 0 (0.0%) |
| Total | 210 (100.0%) | 75 (100.0%) |
Physical Housing Characteristics in Gaston
Housing Structures in Gaston
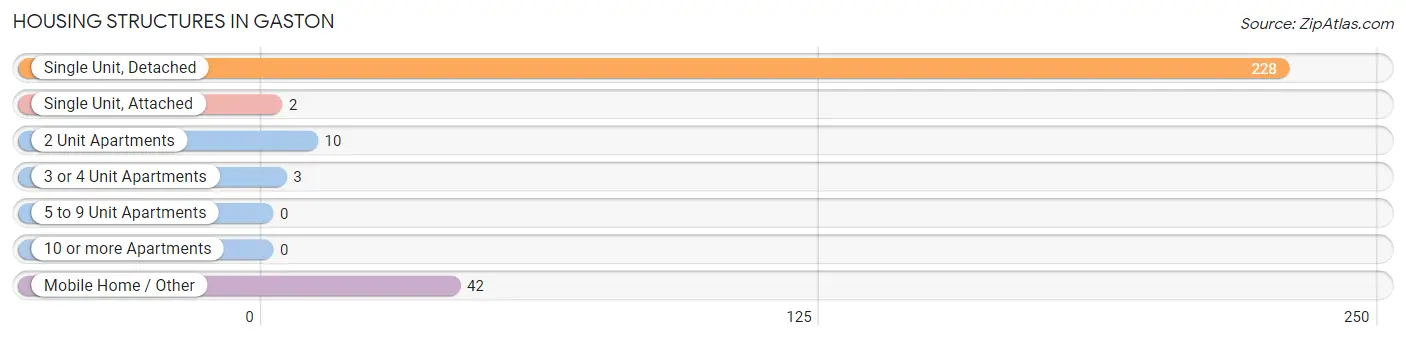
| Structure Type | # Housing Units | % Housing Units |
| Single Unit, Detached | 228 | 80.0% |
| Single Unit, Attached | 2 | 0.7% |
| 2 Unit Apartments | 10 | 3.5% |
| 3 or 4 Unit Apartments | 3 | 1.1% |
| 5 to 9 Unit Apartments | 0 | 0.0% |
| 10 or more Apartments | 0 | 0.0% |
| Mobile Home / Other | 42 | 14.7% |
| Total | 285 | 100.0% |
Housing Structures by Occupancy in Gaston
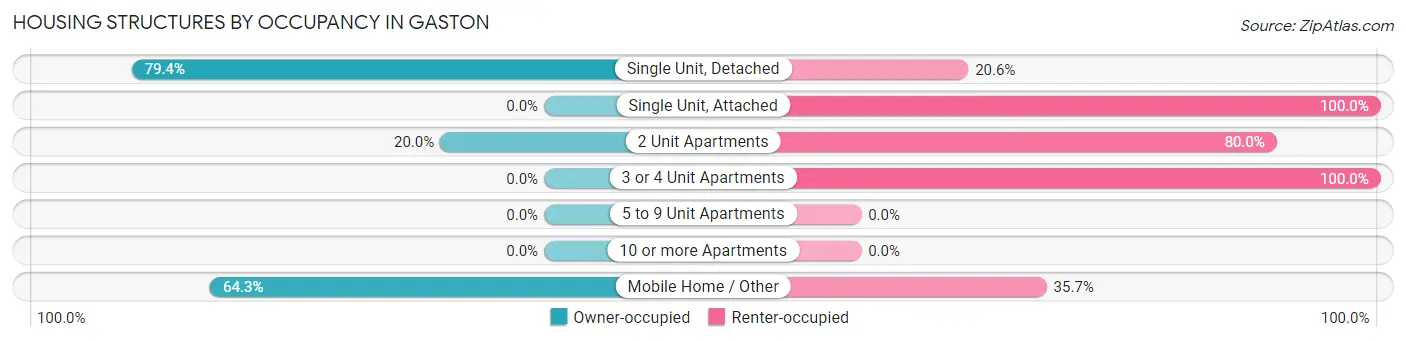
| Structure Type | Owner-occupied | Renter-occupied |
| Single Unit, Detached | 181 (79.4%) | 47 (20.6%) |
| Single Unit, Attached | 0 (0.0%) | 2 (100.0%) |
| 2 Unit Apartments | 2 (20.0%) | 8 (80.0%) |
| 3 or 4 Unit Apartments | 0 (0.0%) | 3 (100.0%) |
| 5 to 9 Unit Apartments | 0 (0.0%) | 0 (0.0%) |
| 10 or more Apartments | 0 (0.0%) | 0 (0.0%) |
| Mobile Home / Other | 27 (64.3%) | 15 (35.7%) |
| Total | 210 (73.7%) | 75 (26.3%) |
Housing Structures by Number of Rooms in Gaston
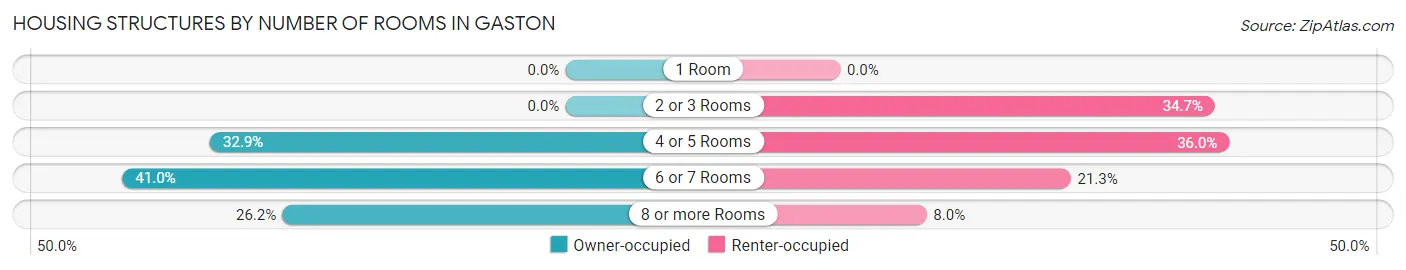
| Number of Rooms | Owner-occupied | Renter-occupied |
| 1 Room | 0 (0.0%) | 0 (0.0%) |
| 2 or 3 Rooms | 0 (0.0%) | 26 (34.7%) |
| 4 or 5 Rooms | 69 (32.9%) | 27 (36.0%) |
| 6 or 7 Rooms | 86 (40.9%) | 16 (21.3%) |
| 8 or more Rooms | 55 (26.2%) | 6 (8.0%) |
| Total | 210 (100.0%) | 75 (100.0%) |
Housing Structure by Heating Type in Gaston
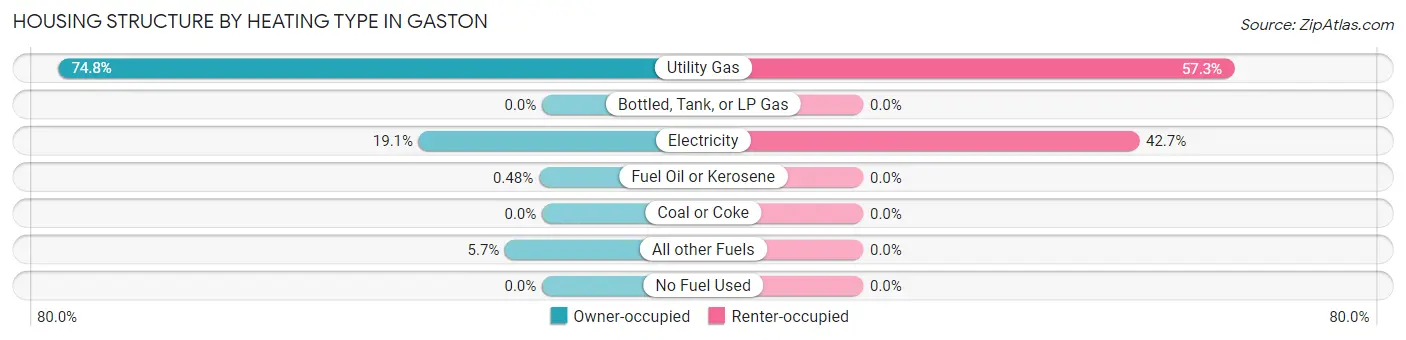
| Heating Type | Owner-occupied | Renter-occupied |
| Utility Gas | 157 (74.8%) | 43 (57.3%) |
| Bottled, Tank, or LP Gas | 0 (0.0%) | 0 (0.0%) |
| Electricity | 40 (19.1%) | 32 (42.7%) |
| Fuel Oil or Kerosene | 1 (0.5%) | 0 (0.0%) |
| Coal or Coke | 0 (0.0%) | 0 (0.0%) |
| All other Fuels | 12 (5.7%) | 0 (0.0%) |
| No Fuel Used | 0 (0.0%) | 0 (0.0%) |
| Total | 210 (100.0%) | 75 (100.0%) |
Household Vehicle Usage in Gaston
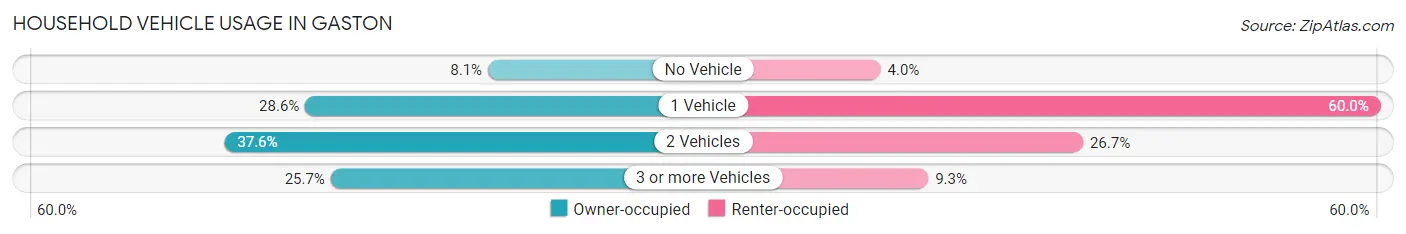
| Vehicles per Household | Owner-occupied | Renter-occupied |
| No Vehicle | 17 (8.1%) | 3 (4.0%) |
| 1 Vehicle | 60 (28.6%) | 45 (60.0%) |
| 2 Vehicles | 79 (37.6%) | 20 (26.7%) |
| 3 or more Vehicles | 54 (25.7%) | 7 (9.3%) |
| Total | 210 (100.0%) | 75 (100.0%) |
Real Estate & Mortgages in Gaston
Real Estate and Mortgage Overview in Gaston
| Characteristic | Without Mortgage | With Mortgage |
| Housing Units | 95 | 115 |
| Median Property Value | $44,700 | $86,000 |
| Median Household Income | $38,750 | $5 |
| Monthly Housing Costs | $447 | $0 |
| Real Estate Taxes | $388 | $5 |
Property Value by Mortgage Status in Gaston
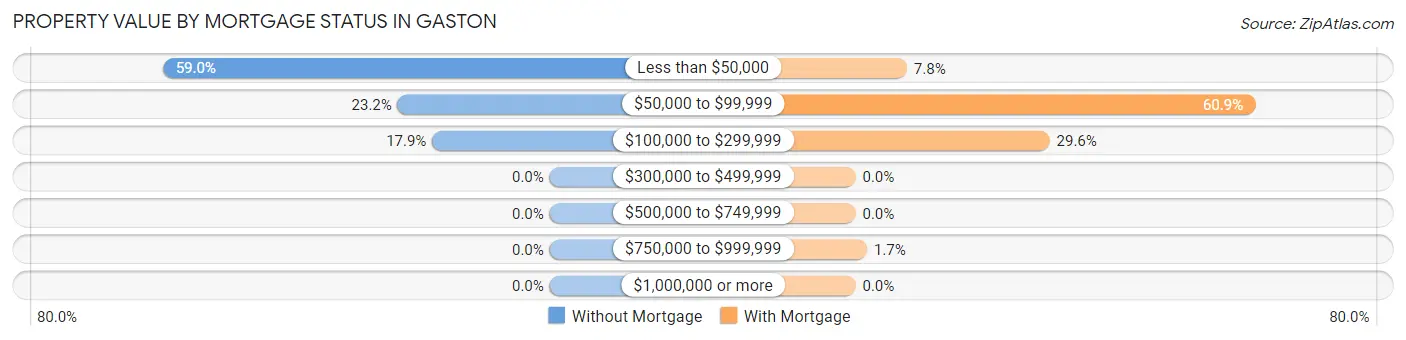
| Property Value | Without Mortgage | With Mortgage |
| Less than $50,000 | 56 (59.0%) | 9 (7.8%) |
| $50,000 to $99,999 | 22 (23.2%) | 70 (60.9%) |
| $100,000 to $299,999 | 17 (17.9%) | 34 (29.6%) |
| $300,000 to $499,999 | 0 (0.0%) | 0 (0.0%) |
| $500,000 to $749,999 | 0 (0.0%) | 0 (0.0%) |
| $750,000 to $999,999 | 0 (0.0%) | 2 (1.7%) |
| $1,000,000 or more | 0 (0.0%) | 0 (0.0%) |
| Total | 95 (100.0%) | 115 (100.0%) |
Household Income by Mortgage Status in Gaston
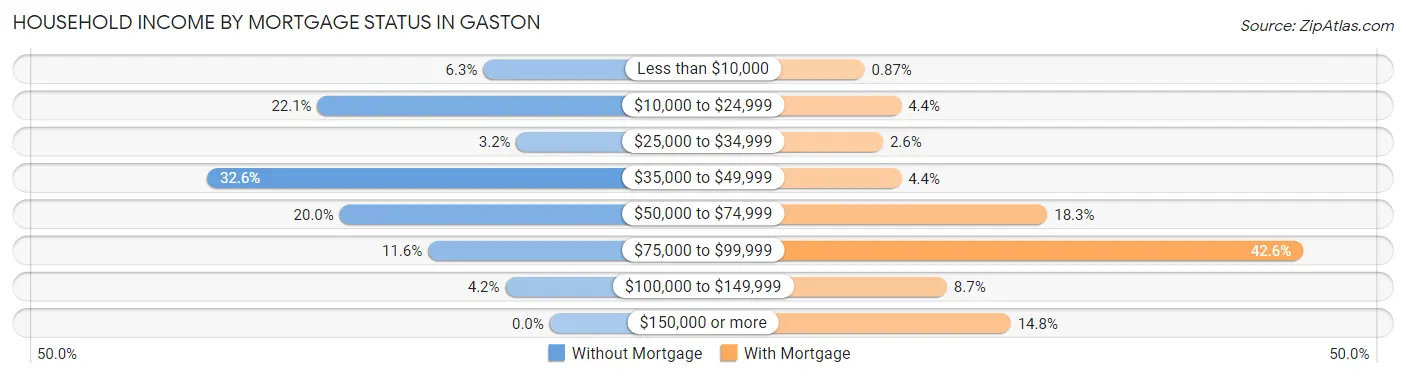
| Household Income | Without Mortgage | With Mortgage |
| Less than $10,000 | 6 (6.3%) | 1 (0.9%) |
| $10,000 to $24,999 | 21 (22.1%) | 5 (4.3%) |
| $25,000 to $34,999 | 3 (3.2%) | 3 (2.6%) |
| $35,000 to $49,999 | 31 (32.6%) | 5 (4.3%) |
| $50,000 to $74,999 | 19 (20.0%) | 21 (18.3%) |
| $75,000 to $99,999 | 11 (11.6%) | 49 (42.6%) |
| $100,000 to $149,999 | 4 (4.2%) | 10 (8.7%) |
| $150,000 or more | 0 (0.0%) | 17 (14.8%) |
| Total | 95 (100.0%) | 115 (100.0%) |
Property Value to Household Income Ratio in Gaston
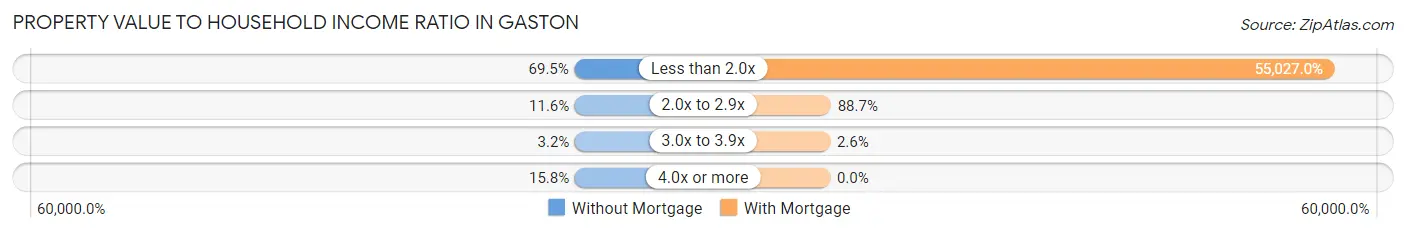
| Value-to-Income Ratio | Without Mortgage | With Mortgage |
| Less than 2.0x | 66 (69.5%) | 63,281 (55,027.0%) |
| 2.0x to 2.9x | 11 (11.6%) | 102 (88.7%) |
| 3.0x to 3.9x | 3 (3.2%) | 3 (2.6%) |
| 4.0x or more | 15 (15.8%) | 0 (0.0%) |
| Total | 95 (100.0%) | 115 (100.0%) |
Real Estate Taxes by Mortgage Status in Gaston
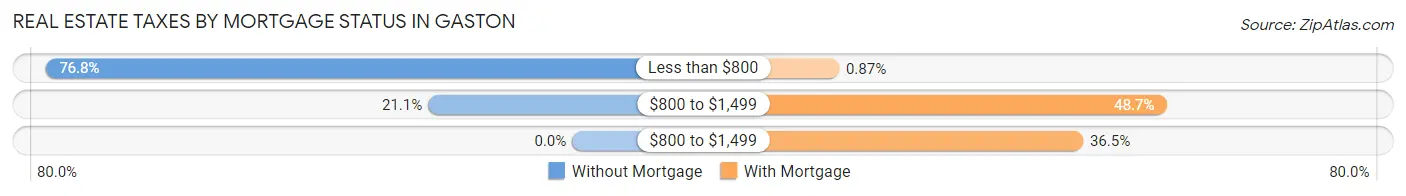
| Property Taxes | Without Mortgage | With Mortgage |
| Less than $800 | 73 (76.8%) | 1 (0.9%) |
| $800 to $1,499 | 20 (21.0%) | 56 (48.7%) |
| $800 to $1,499 | 0 (0.0%) | 42 (36.5%) |
| Total | 95 (100.0%) | 115 (100.0%) |
Health & Disability in Gaston
Health Insurance Coverage by Age in Gaston
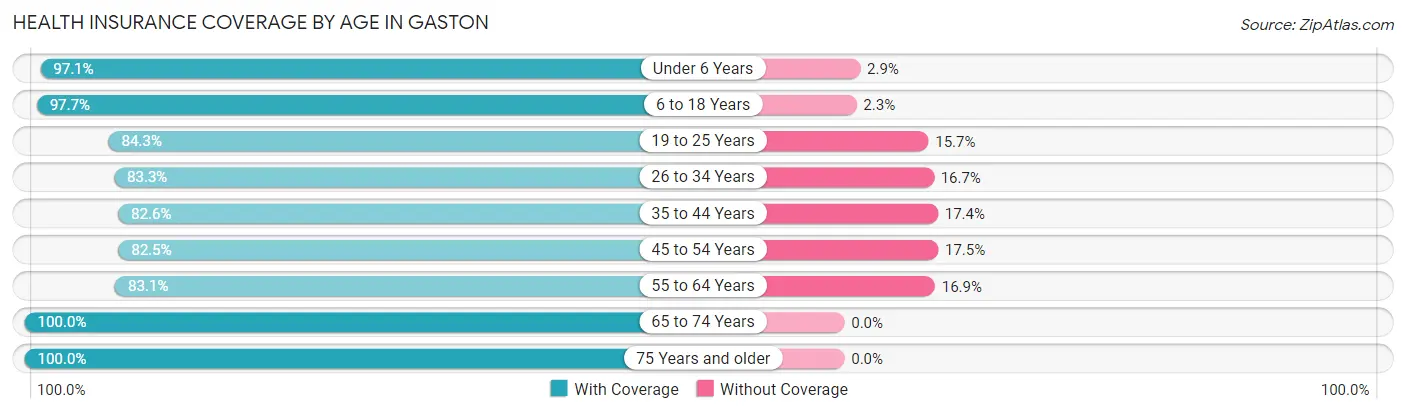
| Age Bracket | With Coverage | Without Coverage |
| Under 6 Years | 33 (97.1%) | 1 (2.9%) |
| 6 to 18 Years | 130 (97.7%) | 3 (2.3%) |
| 19 to 25 Years | 70 (84.3%) | 13 (15.7%) |
| 26 to 34 Years | 60 (83.3%) | 12 (16.7%) |
| 35 to 44 Years | 71 (82.6%) | 15 (17.4%) |
| 45 to 54 Years | 85 (82.5%) | 18 (17.5%) |
| 55 to 64 Years | 64 (83.1%) | 13 (16.9%) |
| 65 to 74 Years | 67 (100.0%) | 0 (0.0%) |
| 75 Years and older | 50 (100.0%) | 0 (0.0%) |
| Total | 630 (89.4%) | 75 (10.6%) |
Health Insurance Coverage by Citizenship Status in Gaston
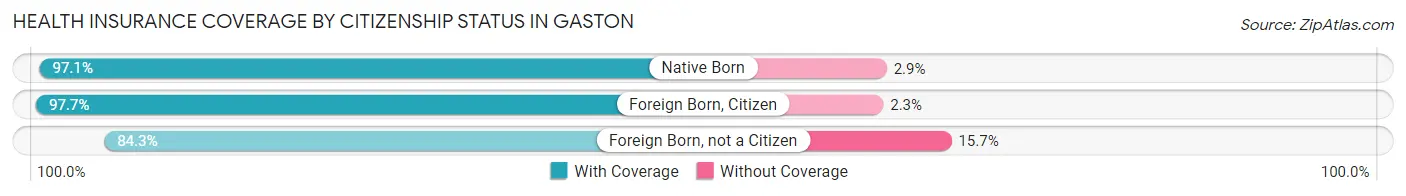
| Citizenship Status | With Coverage | Without Coverage |
| Native Born | 33 (97.1%) | 1 (2.9%) |
| Foreign Born, Citizen | 130 (97.7%) | 3 (2.3%) |
| Foreign Born, not a Citizen | 70 (84.3%) | 13 (15.7%) |
Health Insurance Coverage by Household Income in Gaston
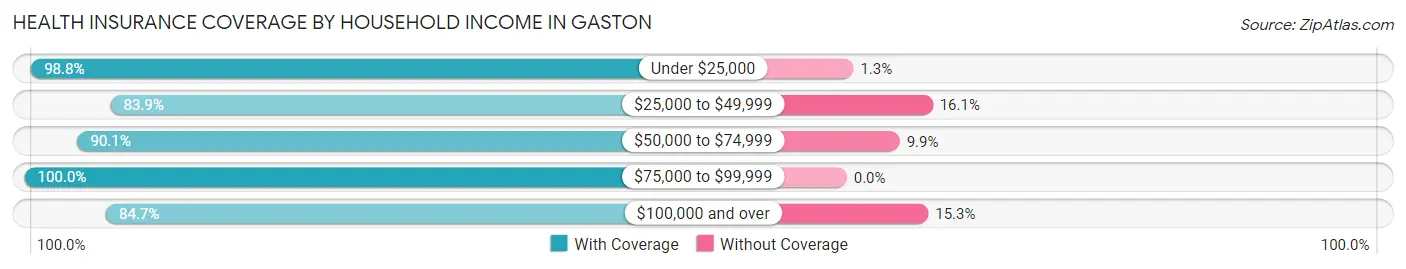
| Household Income | With Coverage | Without Coverage |
| Under $25,000 | 79 (98.8%) | 1 (1.3%) |
| $25,000 to $49,999 | 172 (83.9%) | 33 (16.1%) |
| $50,000 to $74,999 | 191 (90.1%) | 21 (9.9%) |
| $75,000 to $99,999 | 77 (100.0%) | 0 (0.0%) |
| $100,000 and over | 111 (84.7%) | 20 (15.3%) |
Public vs Private Health Insurance Coverage by Age in Gaston
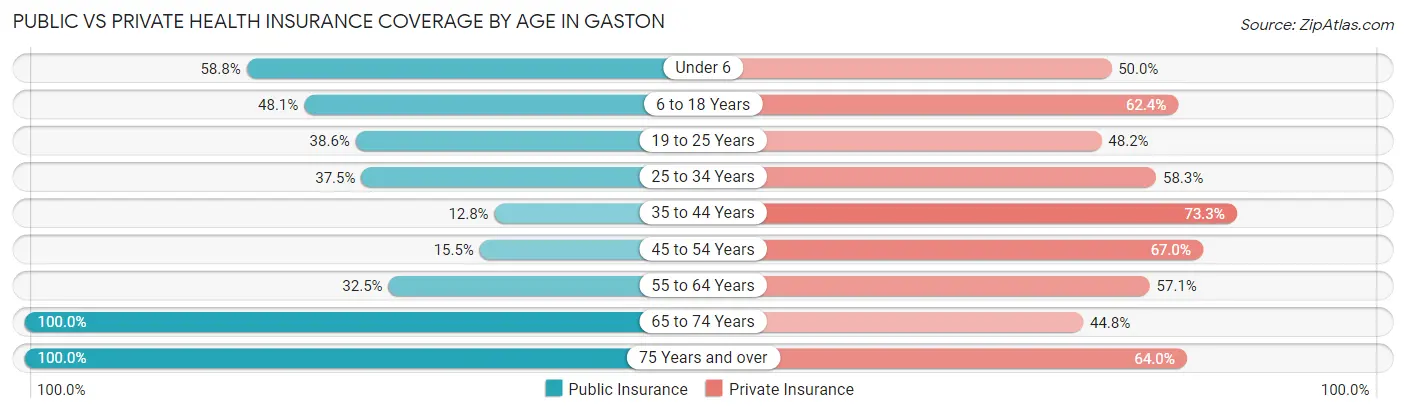
| Age Bracket | Public Insurance | Private Insurance |
| Under 6 | 20 (58.8%) | 17 (50.0%) |
| 6 to 18 Years | 64 (48.1%) | 83 (62.4%) |
| 19 to 25 Years | 32 (38.6%) | 40 (48.2%) |
| 25 to 34 Years | 27 (37.5%) | 42 (58.3%) |
| 35 to 44 Years | 11 (12.8%) | 63 (73.3%) |
| 45 to 54 Years | 16 (15.5%) | 69 (67.0%) |
| 55 to 64 Years | 25 (32.5%) | 44 (57.1%) |
| 65 to 74 Years | 67 (100.0%) | 30 (44.8%) |
| 75 Years and over | 50 (100.0%) | 32 (64.0%) |
| Total | 312 (44.3%) | 420 (59.6%) |
Disability Status by Sex by Age in Gaston
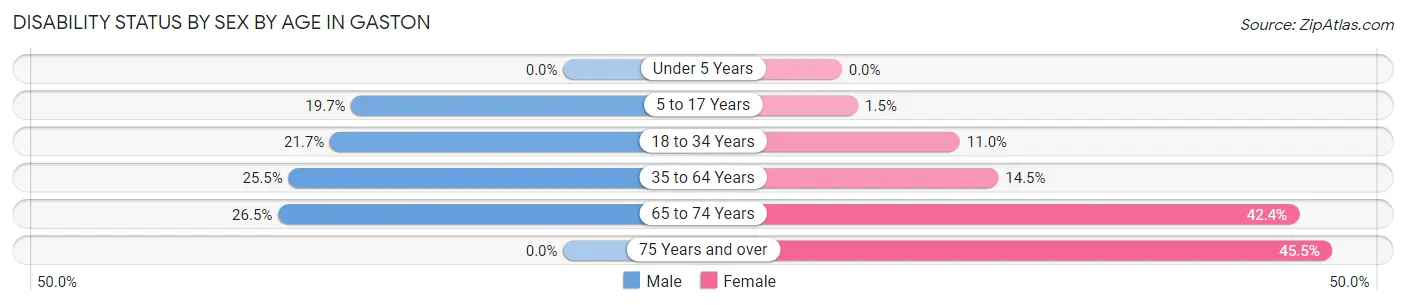
| Age Bracket | Male | Female |
| Under 5 Years | 0 (0.0%) | 0 (0.0%) |
| 5 to 17 Years | 12 (19.7%) | 1 (1.5%) |
| 18 to 34 Years | 21 (21.6%) | 8 (11.0%) |
| 35 to 64 Years | 38 (25.5%) | 17 (14.5%) |
| 65 to 74 Years | 9 (26.5%) | 14 (42.4%) |
| 75 Years and over | 0 (0.0%) | 20 (45.5%) |
Disability Class by Sex by Age in Gaston
Disability Class: Hearing Difficulty
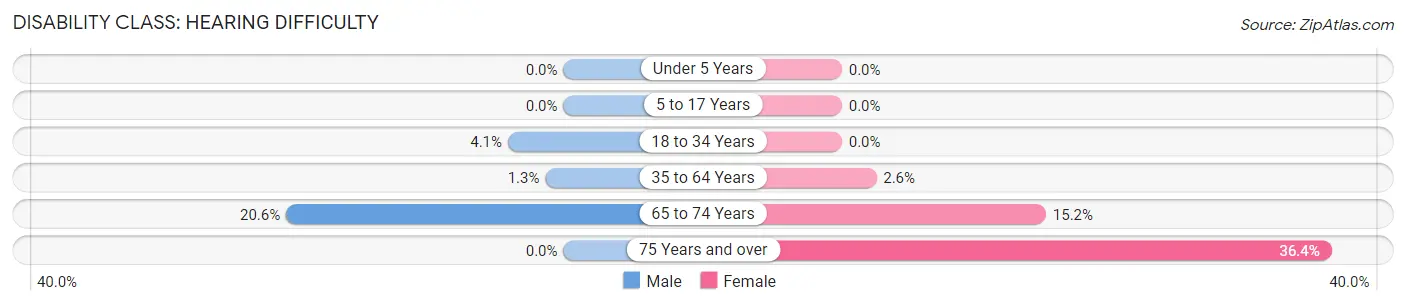
| Age Bracket | Male | Female |
| Under 5 Years | 0 (0.0%) | 0 (0.0%) |
| 5 to 17 Years | 0 (0.0%) | 0 (0.0%) |
| 18 to 34 Years | 4 (4.1%) | 0 (0.0%) |
| 35 to 64 Years | 2 (1.3%) | 3 (2.6%) |
| 65 to 74 Years | 7 (20.6%) | 5 (15.1%) |
| 75 Years and over | 0 (0.0%) | 16 (36.4%) |
Disability Class: Vision Difficulty
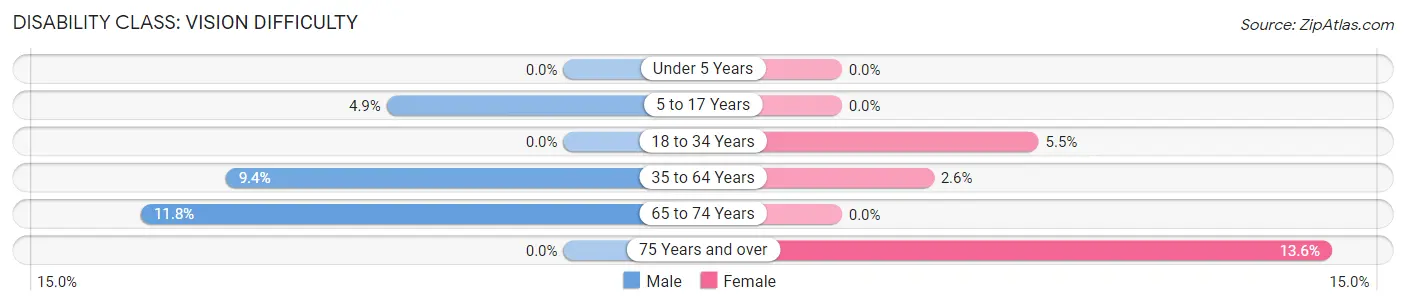
| Age Bracket | Male | Female |
| Under 5 Years | 0 (0.0%) | 0 (0.0%) |
| 5 to 17 Years | 3 (4.9%) | 0 (0.0%) |
| 18 to 34 Years | 0 (0.0%) | 4 (5.5%) |
| 35 to 64 Years | 14 (9.4%) | 3 (2.6%) |
| 65 to 74 Years | 4 (11.8%) | 0 (0.0%) |
| 75 Years and over | 0 (0.0%) | 6 (13.6%) |
Disability Class: Cognitive Difficulty
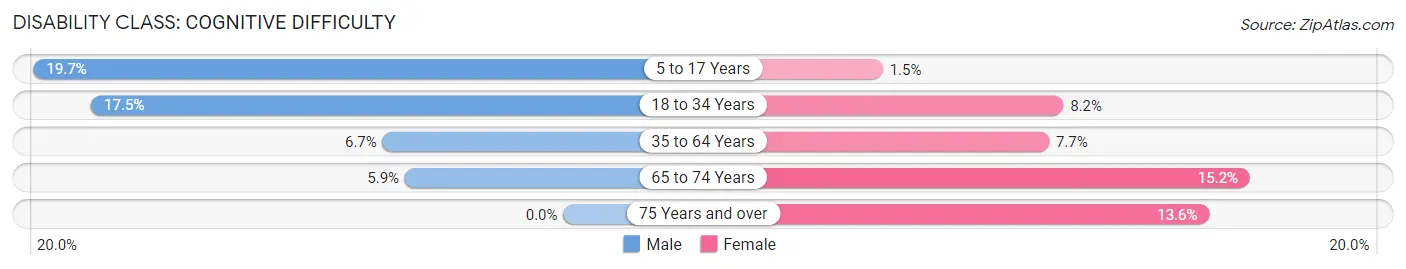
| Age Bracket | Male | Female |
| 5 to 17 Years | 12 (19.7%) | 1 (1.5%) |
| 18 to 34 Years | 17 (17.5%) | 6 (8.2%) |
| 35 to 64 Years | 10 (6.7%) | 9 (7.7%) |
| 65 to 74 Years | 2 (5.9%) | 5 (15.1%) |
| 75 Years and over | 0 (0.0%) | 6 (13.6%) |
Disability Class: Ambulatory Difficulty
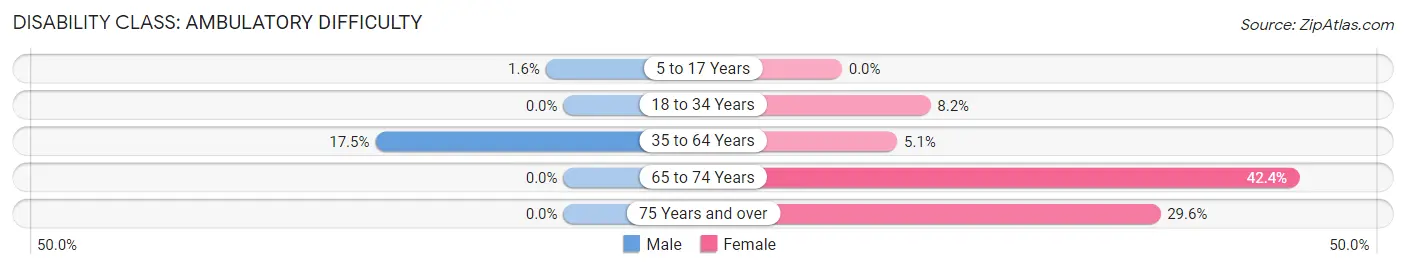
| Age Bracket | Male | Female |
| 5 to 17 Years | 1 (1.6%) | 0 (0.0%) |
| 18 to 34 Years | 0 (0.0%) | 6 (8.2%) |
| 35 to 64 Years | 26 (17.4%) | 6 (5.1%) |
| 65 to 74 Years | 0 (0.0%) | 14 (42.4%) |
| 75 Years and over | 0 (0.0%) | 13 (29.5%) |
Disability Class: Self-Care Difficulty
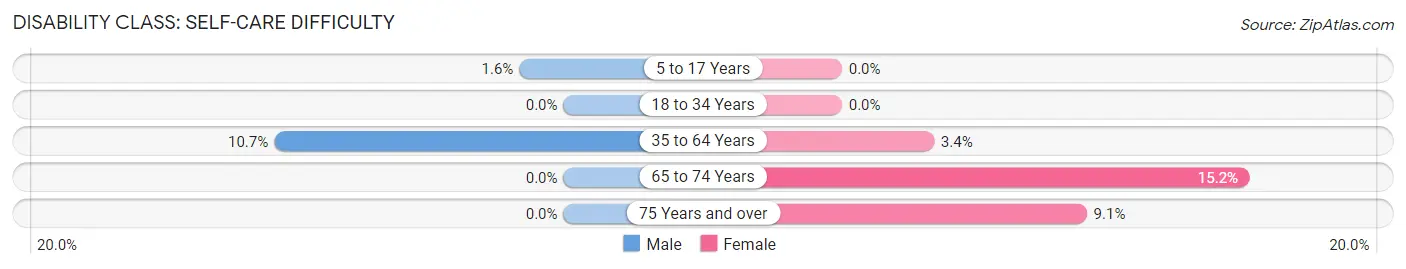
| Age Bracket | Male | Female |
| 5 to 17 Years | 1 (1.6%) | 0 (0.0%) |
| 18 to 34 Years | 0 (0.0%) | 0 (0.0%) |
| 35 to 64 Years | 16 (10.7%) | 4 (3.4%) |
| 65 to 74 Years | 0 (0.0%) | 5 (15.1%) |
| 75 Years and over | 0 (0.0%) | 4 (9.1%) |
Technology Access in Gaston
Computing Device Access in Gaston
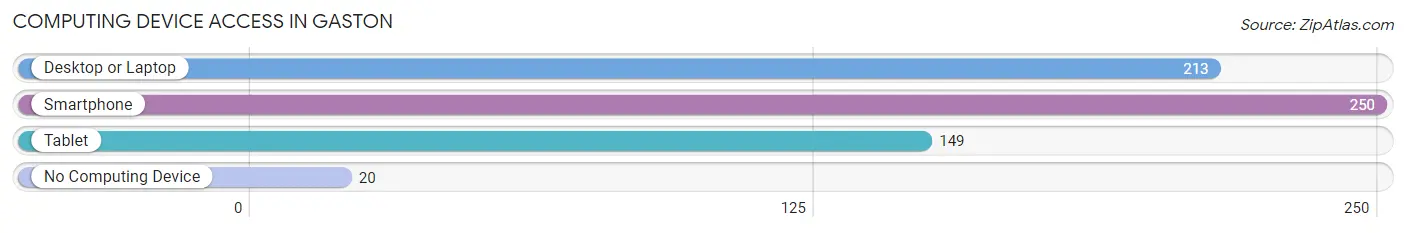
| Device Type | # Households | % Households |
| Desktop or Laptop | 213 | 74.7% |
| Smartphone | 250 | 87.7% |
| Tablet | 149 | 52.3% |
| No Computing Device | 20 | 7.0% |
| Total | 285 | 100.0% |
Internet Access in Gaston
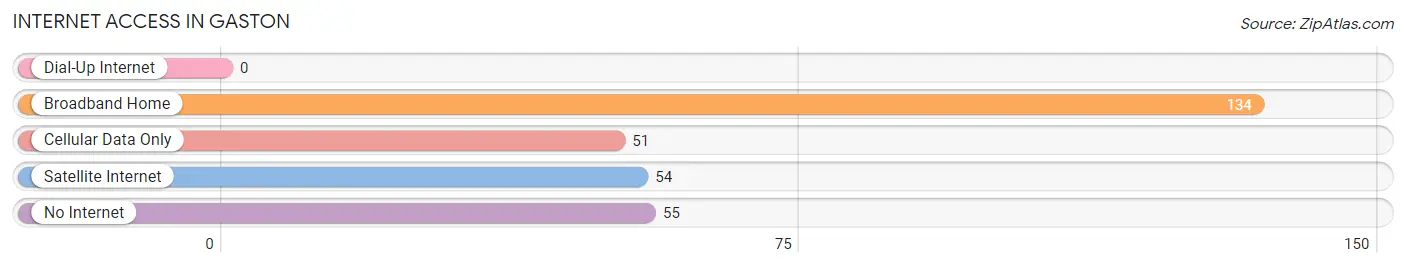
| Internet Type | # Households | % Households |
| Dial-Up Internet | 0 | 0.0% |
| Broadband Home | 134 | 47.0% |
| Cellular Data Only | 51 | 17.9% |
| Satellite Internet | 54 | 19.0% |
| No Internet | 55 | 19.3% |
| Total | 285 | 100.0% |
Gaston Summary
Gaston, Indiana is a small town located in the northeastern part of the state, in the county of Delaware. It is situated on the banks of the White River, and is home to a population of just over 1,000 people. The town was founded in 1837, and has a rich history of industry, agriculture, and community.
Geography
Gaston is located in the northeastern part of Indiana, in the county of Delaware. It is situated on the banks of the White River, and is surrounded by rolling hills and farmland. The town is located approximately 30 miles from the state capital of Indianapolis, and is within easy driving distance of several major cities, including Fort Wayne, Muncie, and Anderson. The town is also close to several state parks, including Mounds State Park, which is located just a few miles away.
Economy
Gaston’s economy is largely based on agriculture and manufacturing. The town is home to several large farms, which produce a variety of crops, including corn, soybeans, and wheat. The town is also home to several manufacturing companies, which produce a variety of products, including furniture, automotive parts, and medical supplies. In addition, the town is home to several small businesses, including restaurants, retail stores, and service providers.
Demographics
As of the 2010 census, the population of Gaston was 1,072. The town is predominantly white, with a population that is 97.2% Caucasian. The median household income is $41,250, and the median age is 38.7 years. The town is home to a variety of religious denominations, including Baptist, Methodist, and Catholic.
History
Gaston was founded in 1837 by a group of settlers from Ohio. The town was named after the Gaston family, who were among the first settlers. The town quickly grew, and by the late 19th century, it was home to several businesses, including a sawmill, a gristmill, and a blacksmith shop. The town was also home to several churches, and a school.
In the early 20th century, Gaston experienced a period of growth and prosperity. The town was home to several factories, which produced a variety of products, including furniture, automotive parts, and medical supplies. The town was also home to several banks, and a variety of stores and restaurants.
In the late 20th century, Gaston experienced a period of decline. Many of the factories and businesses closed, and the population began to decline. However, in recent years, the town has experienced a resurgence, and is now home to several small businesses, including restaurants, retail stores, and service providers.
Gaston is a small town with a rich history and a bright future. The town is home to a variety of businesses, and is surrounded by beautiful countryside. The town is also home to a diverse population, and is a great place to live and work.
Common Questions
What is Per Capita Income in Gaston?
Per Capita income in Gaston is $23,056.
What is the Median Family Income in Gaston?
Median Family Income in Gaston is $61,875.
What is the Median Household income in Gaston?
Median Household Income in Gaston is $49,271.
What is Income or Wage Gap in Gaston?
Income or Wage Gap in Gaston is 15.4%.
Women in Gaston earn 84.6 cents for every dollar earned by a man.
What is Inequality or Gini Index in Gaston?
Inequality or Gini Index in Gaston is 0.33.
What is the Total Population of Gaston?
Total Population of Gaston is 705.
What is the Total Male Population of Gaston?
Total Male Population of Gaston is 355.
What is the Total Female Population of Gaston?
Total Female Population of Gaston is 350.
What is the Ratio of Males per 100 Females in Gaston?
There are 101.43 Males per 100 Females in Gaston.
What is the Ratio of Females per 100 Males in Gaston?
There are 98.59 Females per 100 Males in Gaston.
What is the Median Population Age in Gaston?
Median Population Age in Gaston is 38.8 Years.
What is the Average Family Size in Gaston
Average Family Size in Gaston is 3.1 People.
What is the Average Household Size in Gaston
Average Household Size in Gaston is 2.5 People.
How Large is the Labor Force in Gaston?
There are 357 People in the Labor Forcein in Gaston.
What is the Percentage of People in the Labor Force in Gaston?
62.7% of People are in the Labor Force in Gaston.
What is the Unemployment Rate in Gaston?
Unemployment Rate in Gaston is 8.1%.