Gas City, IN Map & Demographics
Gas City Map
Gas City Overview
$27,670
PER CAPITA INCOME
$71,352
AVG FAMILY INCOME
$58,778
AVG HOUSEHOLD INCOME
39.0%
WAGE / INCOME GAP [ % ]
61.0¢/ $1
WAGE / INCOME GAP [ $ ]
0.39
INEQUALITY / GINI INDEX
6,099
TOTAL POPULATION
2,735
MALE POPULATION
3,364
FEMALE POPULATION
81.30
MALES / 100 FEMALES
123.00
FEMALES / 100 MALES
44.7
MEDIAN AGE
2.8
AVG FAMILY SIZE
2.4
AVG HOUSEHOLD SIZE
2,891
LABOR FORCE [ PEOPLE ]
57.8%
PERCENT IN LABOR FORCE
10.8%
UNEMPLOYMENT RATE
Gas City Zip Codes
Gas City Area Codes
Income in Gas City
Income Overview in Gas City
Per Capita Income in Gas City is $27,670, while median incomes of families and households are $71,352 and $58,778 respectively.
| Characteristic | Number | Measure |
| Per Capita Income | 6,099 | $27,670 |
| Median Family Income | 1,772 | $71,352 |
| Mean Family Income | 1,772 | $77,875 |
| Median Household Income | 2,562 | $58,778 |
| Mean Household Income | 2,562 | $66,648 |
| Income Deficit | 1,772 | $0 |
| Wage / Income Gap (%) | 6,099 | 39.05% |
| Wage / Income Gap ($) | 6,099 | 60.95¢ per $1 |
| Gini / Inequality Index | 6,099 | 0.39 |
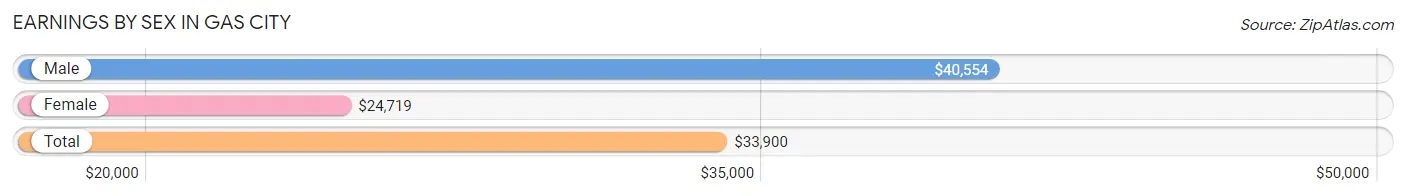
Earnings by Sex in Gas City
Average Earnings in Gas City are $33,900, $40,554 for men and $24,719 for women, a difference of 39.1%.
| Sex | Number | Average Earnings |
| Male | 1,453 (48.2%) | $40,554 |
| Female | 1,563 (51.8%) | $24,719 |
| Total | 3,016 (100.0%) | $33,900 |
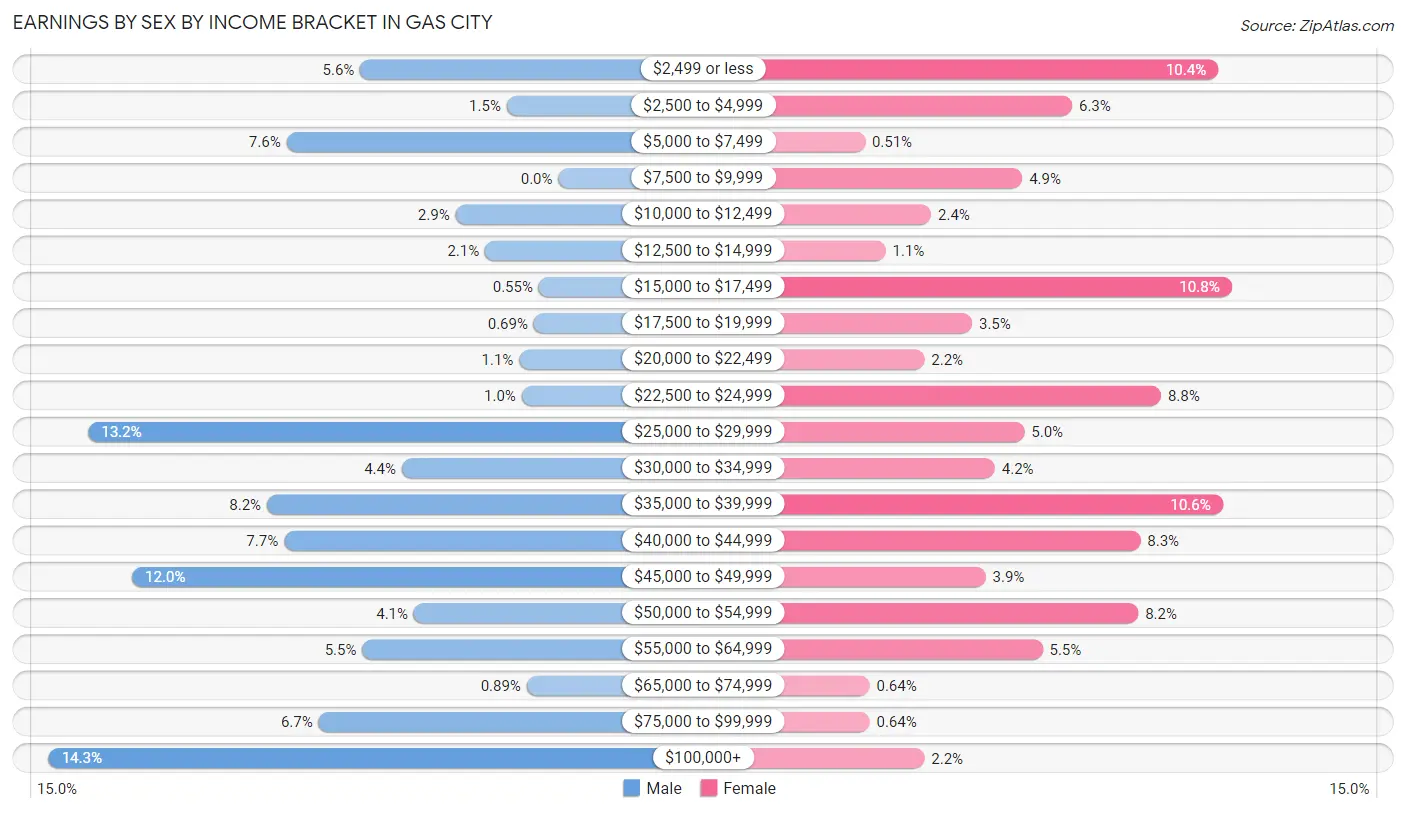
Earnings by Sex by Income Bracket in Gas City
The most common earnings brackets in Gas City are $100,000+ for men (208 | 14.3%) and $15,000 to $17,499 for women (169 | 10.8%).
| Income | Male | Female |
| $2,499 or less | 81 (5.6%) | 163 (10.4%) |
| $2,500 to $4,999 | 21 (1.5%) | 99 (6.3%) |
| $5,000 to $7,499 | 111 (7.6%) | 8 (0.5%) |
| $7,500 to $9,999 | 0 (0.0%) | 77 (4.9%) |
| $10,000 to $12,499 | 42 (2.9%) | 37 (2.4%) |
| $12,500 to $14,999 | 30 (2.1%) | 17 (1.1%) |
| $15,000 to $17,499 | 8 (0.5%) | 169 (10.8%) |
| $17,500 to $19,999 | 10 (0.7%) | 55 (3.5%) |
| $20,000 to $22,499 | 16 (1.1%) | 34 (2.2%) |
| $22,500 to $24,999 | 15 (1.0%) | 138 (8.8%) |
| $25,000 to $29,999 | 192 (13.2%) | 78 (5.0%) |
| $30,000 to $34,999 | 64 (4.4%) | 65 (4.2%) |
| $35,000 to $39,999 | 119 (8.2%) | 165 (10.6%) |
| $40,000 to $44,999 | 112 (7.7%) | 129 (8.3%) |
| $45,000 to $49,999 | 174 (12.0%) | 61 (3.9%) |
| $50,000 to $54,999 | 59 (4.1%) | 128 (8.2%) |
| $55,000 to $64,999 | 80 (5.5%) | 86 (5.5%) |
| $65,000 to $74,999 | 13 (0.9%) | 10 (0.6%) |
| $75,000 to $99,999 | 98 (6.7%) | 10 (0.6%) |
| $100,000+ | 208 (14.3%) | 34 (2.2%) |
| Total | 1,453 (100.0%) | 1,563 (100.0%) |
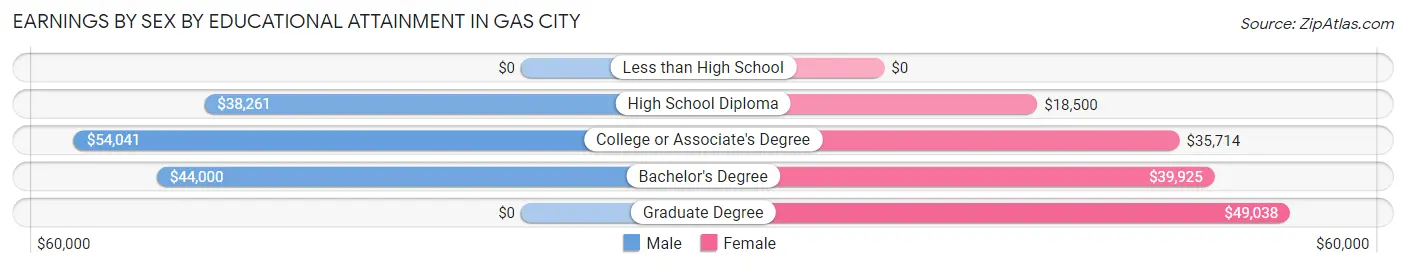
Earnings by Sex by Educational Attainment in Gas City
Average earnings in Gas City are $45,195 for men and $32,984 for women, a difference of 27.0%. Men with an educational attainment of college or associate's degree enjoy the highest average annual earnings of $54,041, while those with high school diploma education earn the least with $38,261. Women with an educational attainment of graduate degree earn the most with the average annual earnings of $49,038, while those with high school diploma education have the smallest earnings of $18,500.
| Educational Attainment | Male Income | Female Income |
| Less than High School | - | - |
| High School Diploma | $38,261 | $18,500 |
| College or Associate's Degree | $54,041 | $35,714 |
| Bachelor's Degree | $44,000 | $39,925 |
| Graduate Degree | - | - |
| Total | $45,195 | $32,984 |
Family Income in Gas City
Family Income Brackets in Gas City
According to the Gas City family income data, there are 555 families falling into the $50,000 to $74,999 income range, which is the most common income bracket and makes up 31.3% of all families. Conversely, the $200,000+ income bracket is the least frequent group with only 5 families (0.3%) belonging to this category.
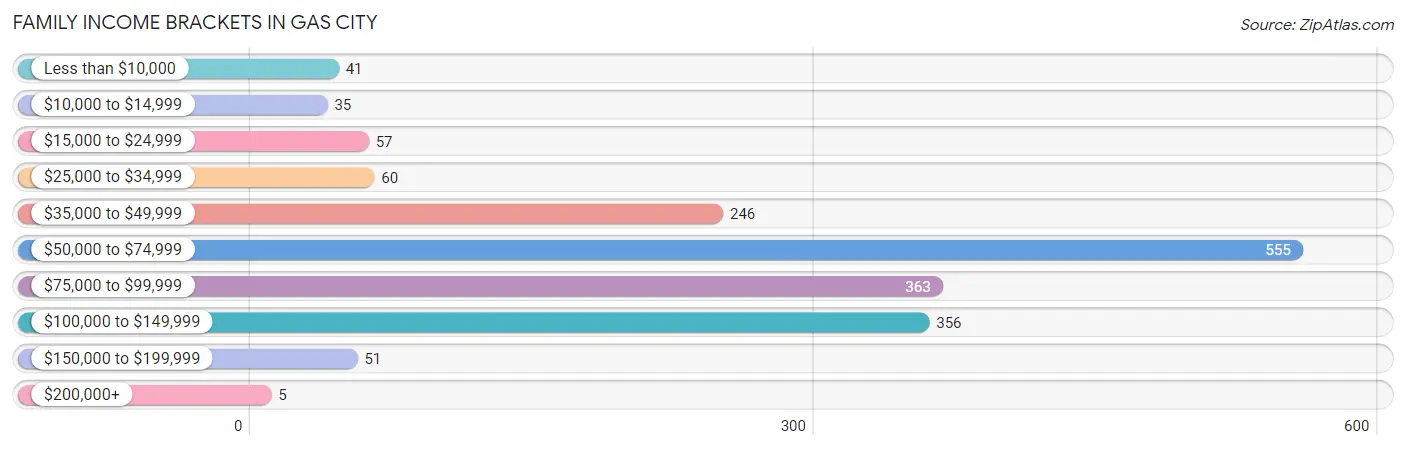
| Income Bracket | # Families | % Families |
| Less than $10,000 | 41 | 2.3% |
| $10,000 to $14,999 | 35 | 2.0% |
| $15,000 to $24,999 | 57 | 3.2% |
| $25,000 to $34,999 | 60 | 3.4% |
| $35,000 to $49,999 | 246 | 13.9% |
| $50,000 to $74,999 | 555 | 31.3% |
| $75,000 to $99,999 | 363 | 20.5% |
| $100,000 to $149,999 | 356 | 20.1% |
| $150,000 to $199,999 | 51 | 2.9% |
| $200,000+ | 5 | 0.3% |
Family Income by Famaliy Size in Gas City
4-person families (310 | 17.5%) account for the highest median family income in Gas City with $135,201 per family, while 2-person families (789 | 44.5%) have the highest median income of $34,104 per family member.
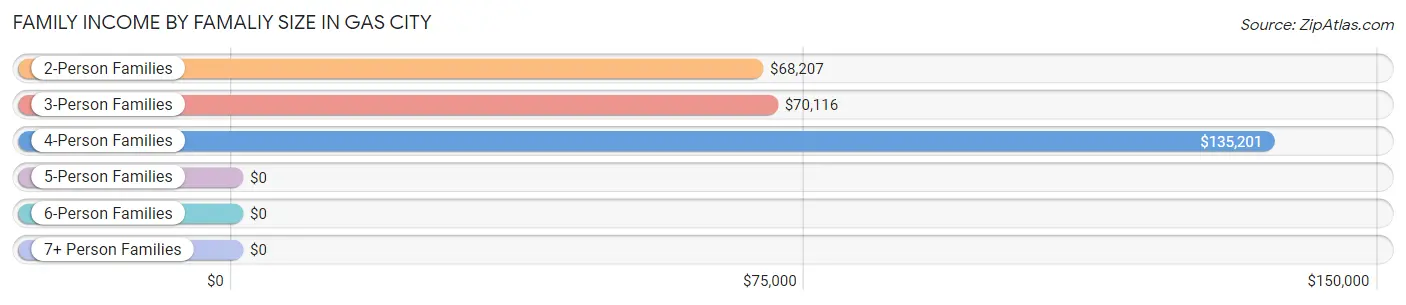
| Income Bracket | # Families | Median Income |
| 2-Person Families | 789 (44.5%) | $68,207 |
| 3-Person Families | 592 (33.4%) | $70,116 |
| 4-Person Families | 310 (17.5%) | $135,201 |
| 5-Person Families | 57 (3.2%) | $0 |
| 6-Person Families | 24 (1.3%) | $0 |
| 7+ Person Families | 0 (0.0%) | $0 |
| Total | 1,772 (100.0%) | $71,352 |
Family Income by Number of Earners in Gas City
The median family income in Gas City is $71,352, with families comprising 3+ earners (260) having the highest median family income of $135,586, while families with no earners (432) have the lowest median family income of $48,636, accounting for 14.7% and 24.4% of families, respectively.
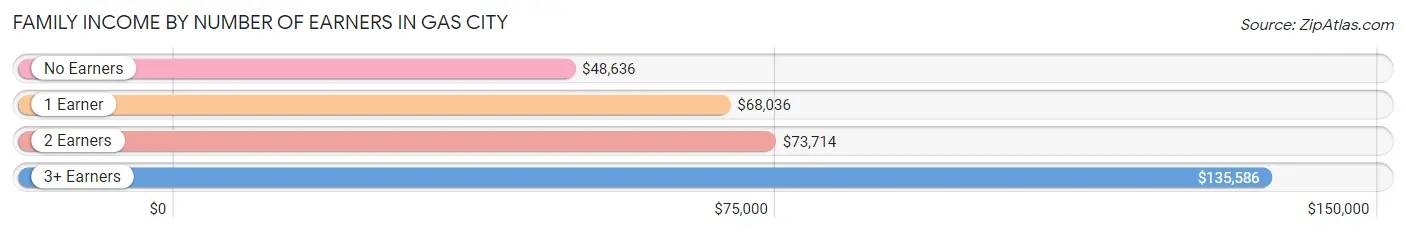
| Number of Earners | # Families | Median Income |
| No Earners | 432 (24.4%) | $48,636 |
| 1 Earner | 436 (24.6%) | $68,036 |
| 2 Earners | 644 (36.3%) | $73,714 |
| 3+ Earners | 260 (14.7%) | $135,586 |
| Total | 1,772 (100.0%) | $71,352 |
Household Income in Gas City
Household Income Brackets in Gas City
With 648 households falling in the category, the $50,000 to $74,999 income range is the most frequent in Gas City, accounting for 25.3% of all households. In contrast, only 41 households (1.6%) fall into the $200,000+ income bracket, making it the least populous group.
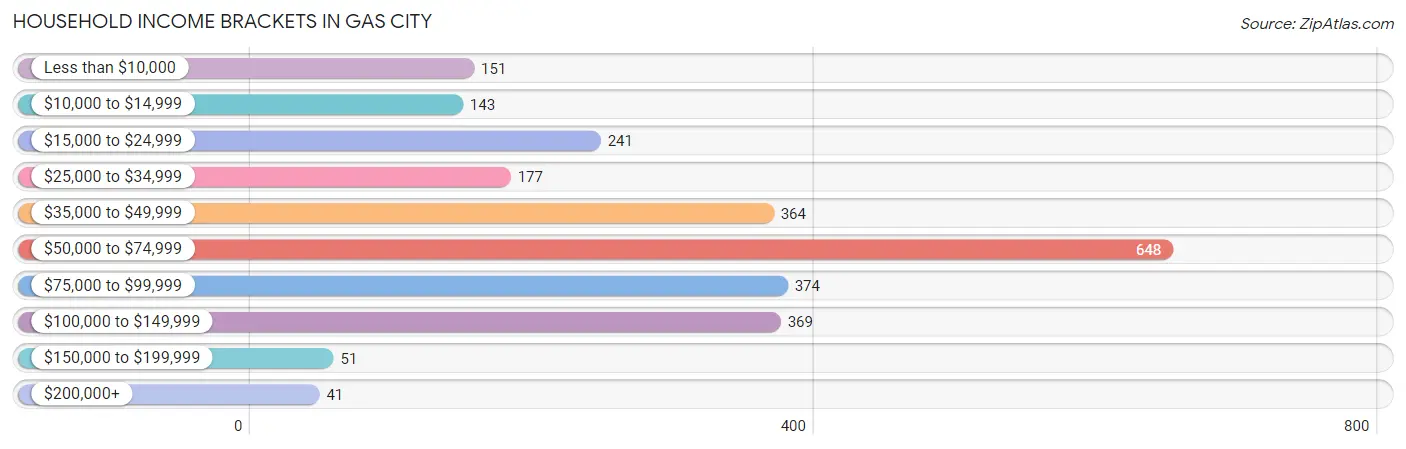
| Income Bracket | # Households | % Households |
| Less than $10,000 | 151 | 5.9% |
| $10,000 to $14,999 | 143 | 5.6% |
| $15,000 to $24,999 | 241 | 9.4% |
| $25,000 to $34,999 | 177 | 6.9% |
| $35,000 to $49,999 | 364 | 14.2% |
| $50,000 to $74,999 | 648 | 25.3% |
| $75,000 to $99,999 | 374 | 14.6% |
| $100,000 to $149,999 | 369 | 14.4% |
| $150,000 to $199,999 | 51 | 2.0% |
| $200,000+ | 41 | 1.6% |
Household Income by Householder Age in Gas City
The median household income in Gas City is $58,778, with the highest median household income of $71,163 found in the 45 to 64 years age bracket for the primary householder. A total of 944 households (36.8%) fall into this category. Meanwhile, the 15 to 24 years age bracket for the primary householder has the lowest median household income of $0, with 7 households (0.3%) in this group.
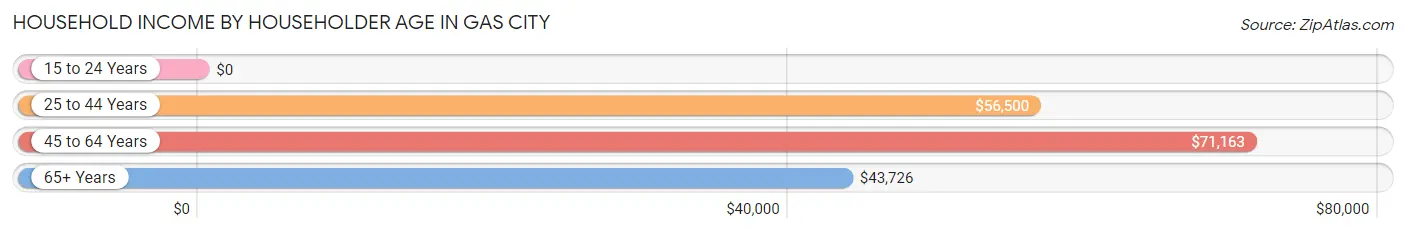
| Income Bracket | # Households | Median Income |
| 15 to 24 Years | 7 (0.3%) | $0 |
| 25 to 44 Years | 820 (32.0%) | $56,500 |
| 45 to 64 Years | 944 (36.8%) | $71,163 |
| 65+ Years | 791 (30.9%) | $43,726 |
| Total | 2,562 (100.0%) | $58,778 |
Poverty in Gas City
Income Below Poverty by Sex and Age in Gas City
With 16.3% poverty level for males and 16.7% for females among the residents of Gas City, under 5 year old males and 18 to 24 year old females are the most vulnerable to poverty, with 32 males (38.6%) and 31 females (58.5%) in their respective age groups living below the poverty level.
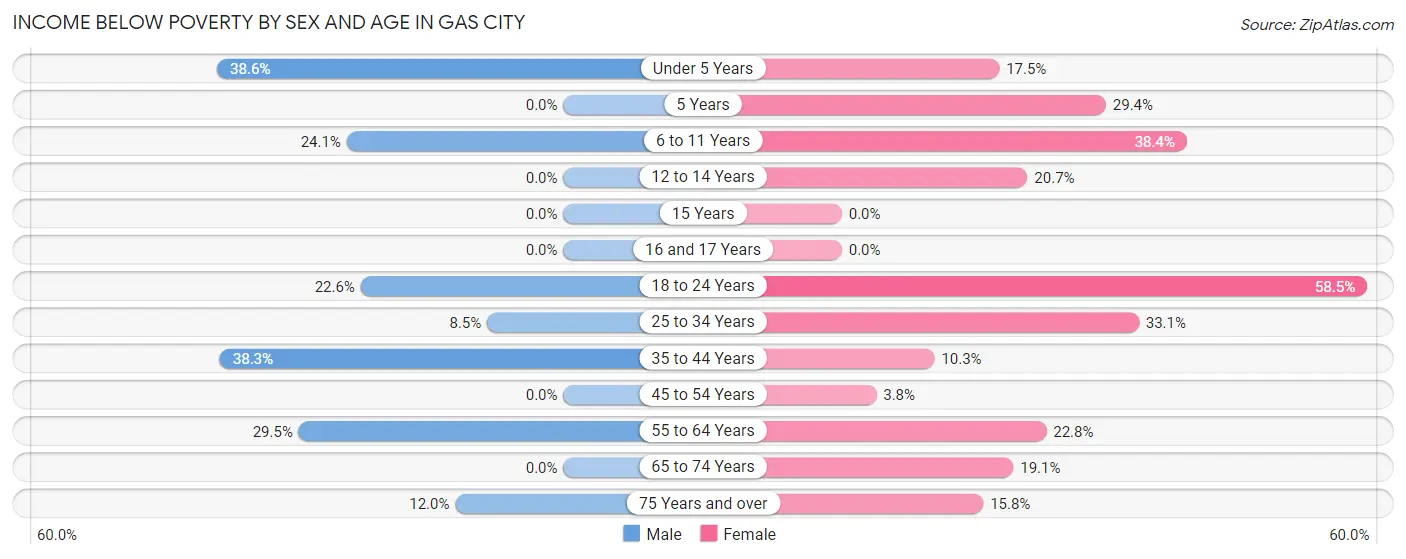
| Age Bracket | Male | Female |
| Under 5 Years | 32 (38.6%) | 34 (17.5%) |
| 5 Years | 0 (0.0%) | 20 (29.4%) |
| 6 to 11 Years | 69 (24.1%) | 63 (38.4%) |
| 12 to 14 Years | 0 (0.0%) | 43 (20.7%) |
| 15 Years | 0 (0.0%) | 0 (0.0%) |
| 16 and 17 Years | 0 (0.0%) | 0 (0.0%) |
| 18 to 24 Years | 51 (22.6%) | 31 (58.5%) |
| 25 to 34 Years | 31 (8.5%) | 87 (33.1%) |
| 35 to 44 Years | 96 (38.3%) | 48 (10.3%) |
| 45 to 54 Years | 0 (0.0%) | 19 (3.8%) |
| 55 to 64 Years | 112 (29.5%) | 87 (22.8%) |
| 65 to 74 Years | 0 (0.0%) | 68 (19.1%) |
| 75 Years and over | 48 (12.0%) | 57 (15.8%) |
| Total | 439 (16.3%) | 557 (16.7%) |
Income Above Poverty by Sex and Age in Gas City
According to the poverty statistics in Gas City, males aged 5 years and females aged 15 years are the age groups that are most secure financially, with 100.0% of males and 100.0% of females in these age groups living above the poverty line.
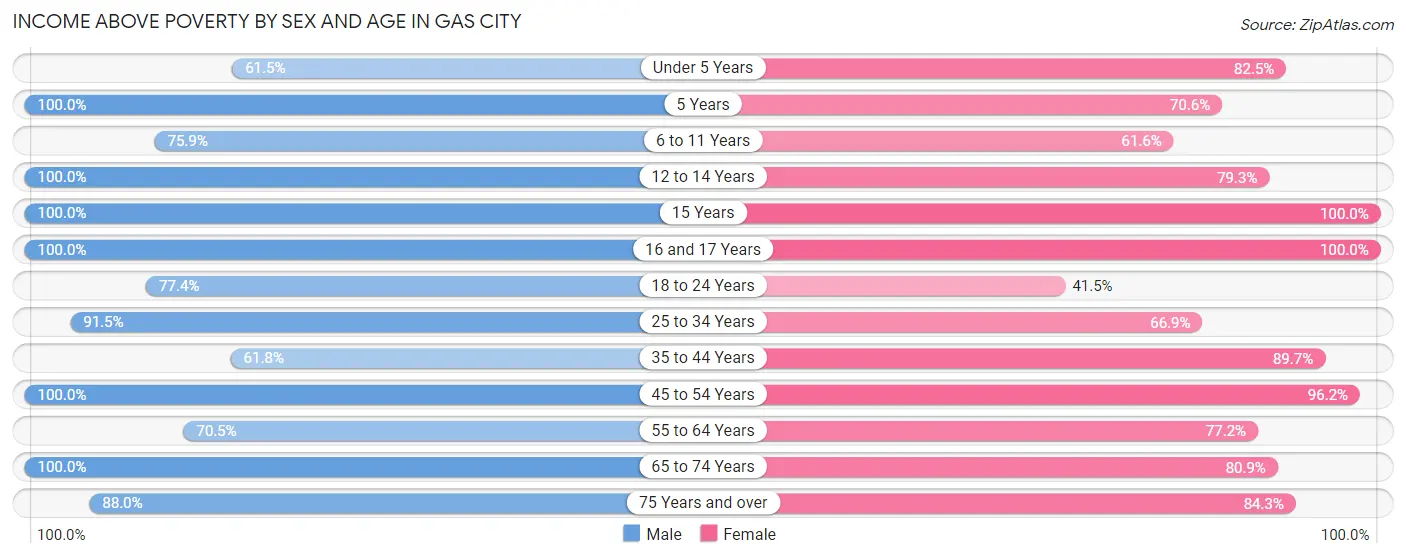
| Age Bracket | Male | Female |
| Under 5 Years | 51 (61.5%) | 160 (82.5%) |
| 5 Years | 11 (100.0%) | 48 (70.6%) |
| 6 to 11 Years | 217 (75.9%) | 101 (61.6%) |
| 12 to 14 Years | 29 (100.0%) | 165 (79.3%) |
| 15 Years | 11 (100.0%) | 43 (100.0%) |
| 16 and 17 Years | 82 (100.0%) | 275 (100.0%) |
| 18 to 24 Years | 175 (77.4%) | 22 (41.5%) |
| 25 to 34 Years | 334 (91.5%) | 176 (66.9%) |
| 35 to 44 Years | 155 (61.8%) | 417 (89.7%) |
| 45 to 54 Years | 321 (100.0%) | 476 (96.2%) |
| 55 to 64 Years | 268 (70.5%) | 295 (77.2%) |
| 65 to 74 Years | 258 (100.0%) | 288 (80.9%) |
| 75 Years and over | 351 (88.0%) | 305 (84.3%) |
| Total | 2,263 (83.8%) | 2,771 (83.3%) |
Income Below Poverty Among Married-Couple Families in Gas City
The poverty statistics for married-couple families in Gas City show that 6.6% or 80 of the total 1,214 families live below the poverty line. Families with 3 or 4 children have the highest poverty rate of 17.8%, comprising of 13 families. On the other hand, families with 1 or 2 children have the lowest poverty rate of 4.0%, which includes 17 families.
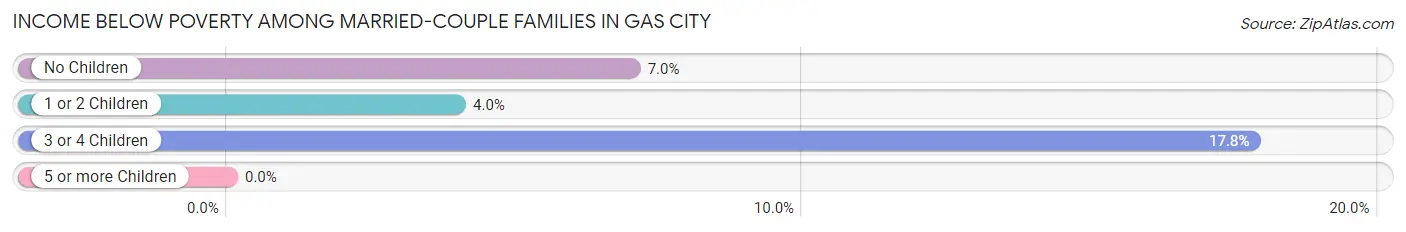
| Children | Above Poverty | Below Poverty |
| No Children | 663 (93.0%) | 50 (7.0%) |
| 1 or 2 Children | 411 (96.0%) | 17 (4.0%) |
| 3 or 4 Children | 60 (82.2%) | 13 (17.8%) |
| 5 or more Children | 0 (0.0%) | 0 (0.0%) |
| Total | 1,134 (93.4%) | 80 (6.6%) |
Income Below Poverty Among Single-Parent Households in Gas City
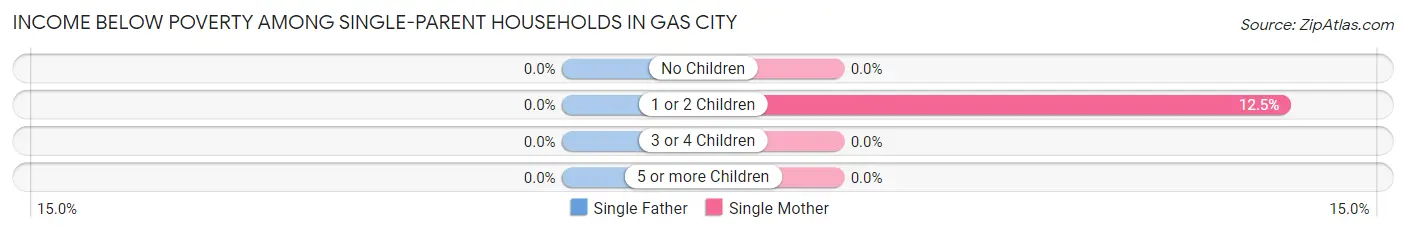
| Children | Single Father | Single Mother |
| No Children | 0 (0.0%) | 0 (0.0%) |
| 1 or 2 Children | 0 (0.0%) | 44 (12.5%) |
| 3 or 4 Children | 0 (0.0%) | 0 (0.0%) |
| 5 or more Children | 0 (0.0%) | 0 (0.0%) |
| Total | 0 (0.0%) | 44 (10.9%) |
Income Below Poverty Among Married-Couple vs Single-Parent Households in Gas City
The poverty data for Gas City shows that 80 of the married-couple family households (6.6%) and 44 of the single-parent households (7.9%) are living below the poverty level. Within the married-couple family households, those with 3 or 4 children have the highest poverty rate, with 13 households (17.8%) falling below the poverty line. Among the single-parent households, those with 1 or 2 children have the highest poverty rate, with 44 household (9.9%) living below poverty.
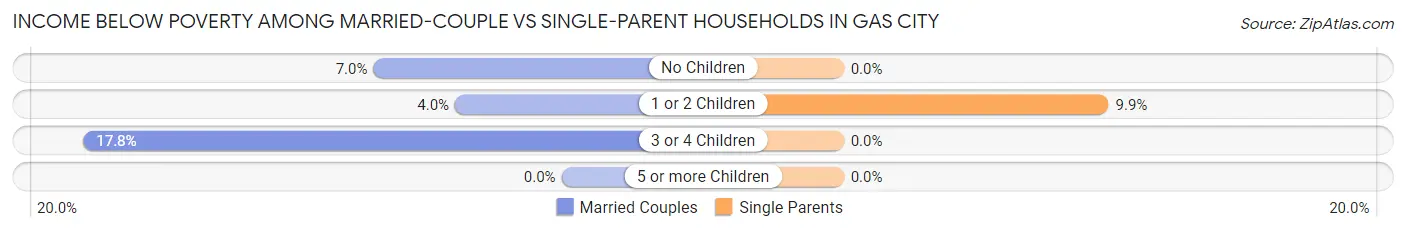
| Children | Married-Couple Families | Single-Parent Households |
| No Children | 50 (7.0%) | 0 (0.0%) |
| 1 or 2 Children | 17 (4.0%) | 44 (9.9%) |
| 3 or 4 Children | 13 (17.8%) | 0 (0.0%) |
| 5 or more Children | 0 (0.0%) | 0 (0.0%) |
| Total | 80 (6.6%) | 44 (7.9%) |
Race in Gas City
The most populous races in Gas City are White / Caucasian (5,531 | 90.7%), Two or more Races (361 | 5.9%), and Hispanic or Latino (351 | 5.8%).
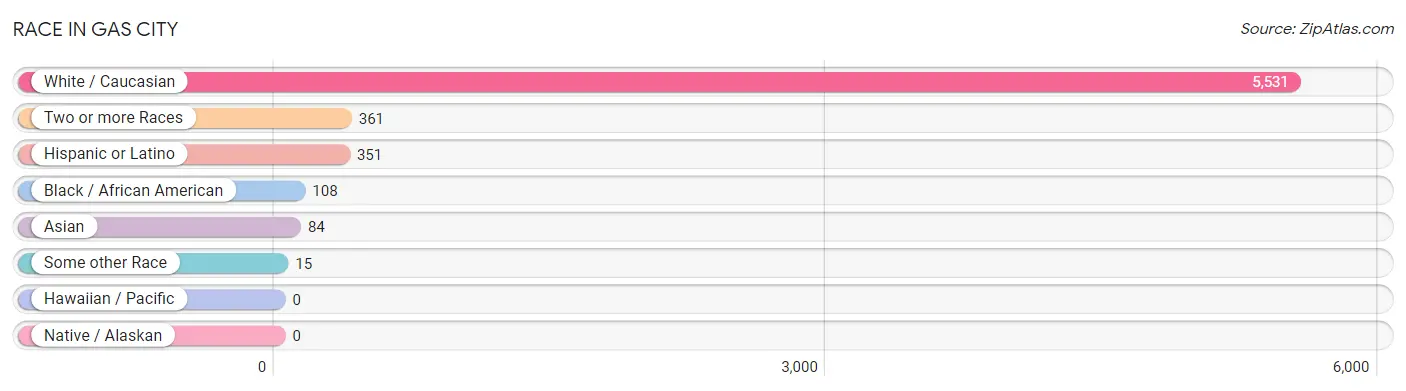
| Race | # Population | % Population |
| Asian | 84 | 1.4% |
| Black / African American | 108 | 1.8% |
| Hawaiian / Pacific | 0 | 0.0% |
| Hispanic or Latino | 351 | 5.8% |
| Native / Alaskan | 0 | 0.0% |
| White / Caucasian | 5,531 | 90.7% |
| Two or more Races | 361 | 5.9% |
| Some other Race | 15 | 0.3% |
| Total | 6,099 | 100.0% |
Ancestry in Gas City
The most populous ancestries reported in Gas City are German (1,131 | 18.5%), American (834 | 13.7%), Irish (572 | 9.4%), Mexican (347 | 5.7%), and English (328 | 5.4%), together accounting for 52.7% of all Gas City residents.
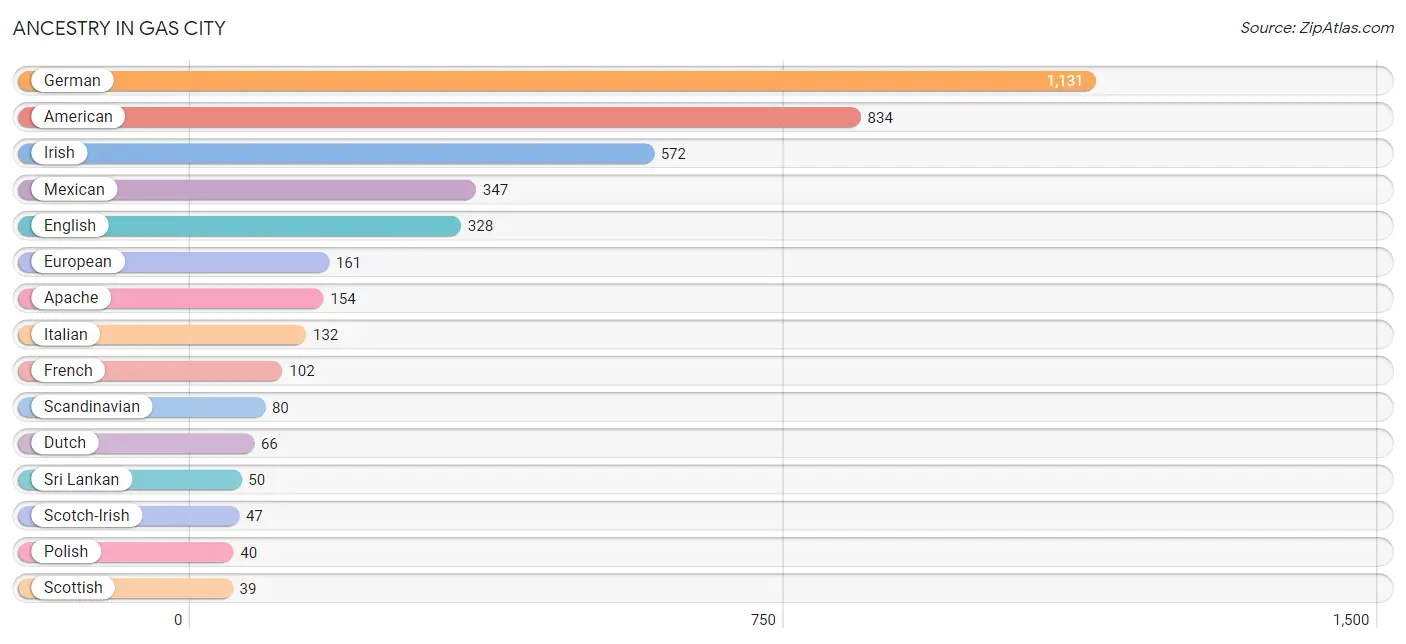
| Ancestry | # Population | % Population |
| African | 16 | 0.3% |
| American | 834 | 13.7% |
| Apache | 154 | 2.5% |
| Blackfeet | 2 | 0.0% |
| Cape Verdean | 16 | 0.3% |
| Cherokee | 14 | 0.2% |
| Dutch | 66 | 1.1% |
| English | 328 | 5.4% |
| European | 161 | 2.6% |
| French | 102 | 1.7% |
| German | 1,131 | 18.5% |
| German Russian | 20 | 0.3% |
| Indonesian | 34 | 0.6% |
| Irish | 572 | 9.4% |
| Italian | 132 | 2.2% |
| Mexican | 347 | 5.7% |
| Polish | 40 | 0.7% |
| Scandinavian | 80 | 1.3% |
| Scotch-Irish | 47 | 0.8% |
| Scottish | 39 | 0.6% |
| Sri Lankan | 50 | 0.8% |
| Subsaharan African | 16 | 0.3% |
| Swedish | 9 | 0.2% |
| Swiss | 15 | 0.3% | View All 24 Rows |
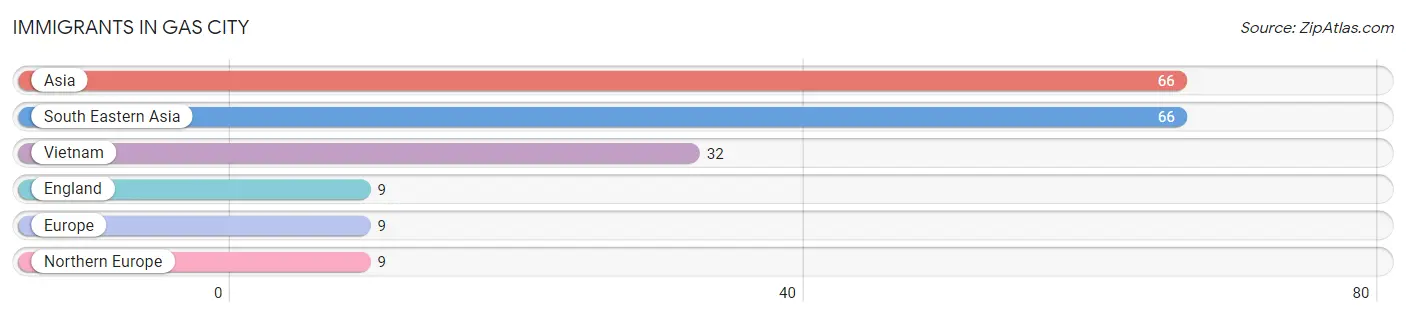
Immigrants in Gas City
The most numerous immigrant groups reported in Gas City came from Asia (66 | 1.1%), South Eastern Asia (66 | 1.1%), Vietnam (32 | 0.5%), England (9 | 0.2%), and Europe (9 | 0.2%), together accounting for 3.0% of all Gas City residents.
| Immigration Origin | # Population | % Population |
| Asia | 66 | 1.1% |
| England | 9 | 0.2% |
| Europe | 9 | 0.2% |
| Northern Europe | 9 | 0.2% |
| South Eastern Asia | 66 | 1.1% |
| Vietnam | 32 | 0.5% | View All 6 Rows |
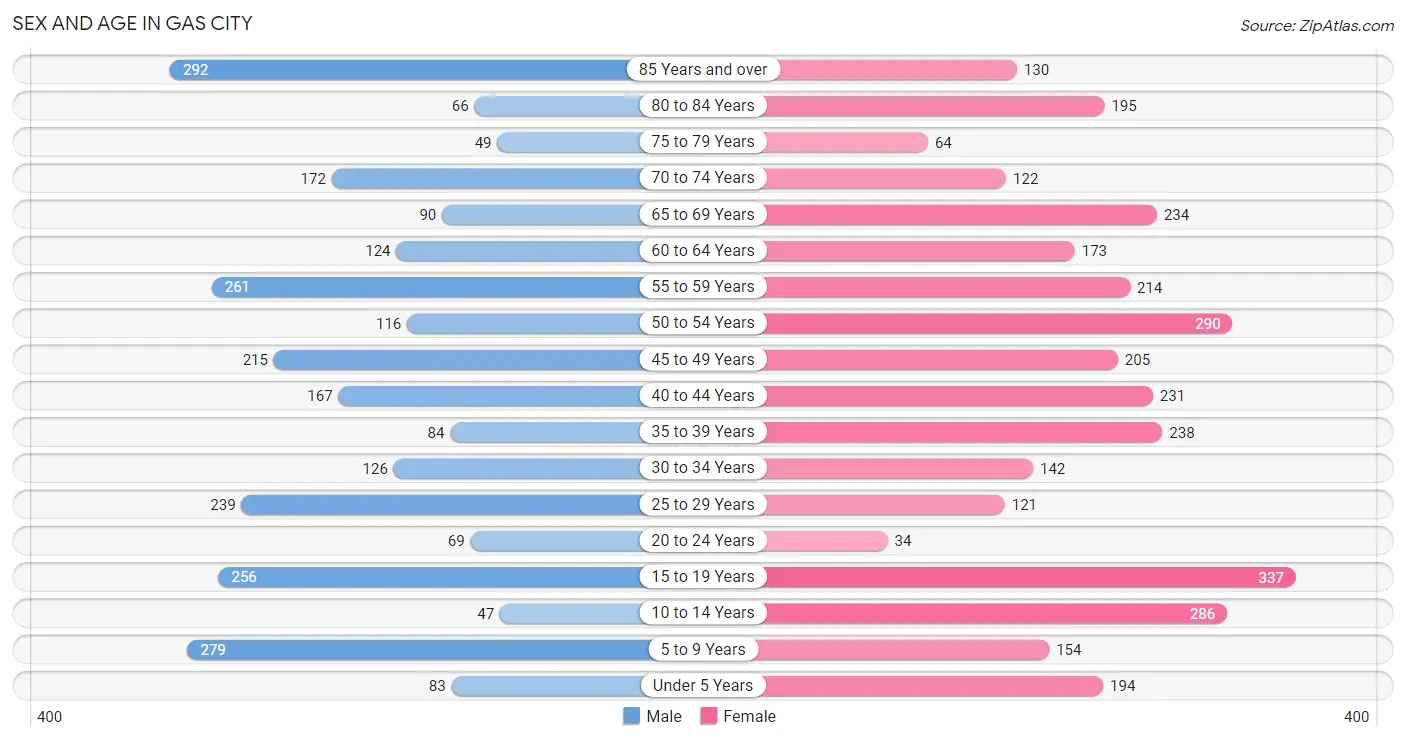
Sex and Age in Gas City
Sex and Age in Gas City
The most populous age groups in Gas City are 85 Years and over (292 | 10.7%) for men and 15 to 19 Years (337 | 10.0%) for women.
| Age Bracket | Male | Female |
| Under 5 Years | 83 (3.0%) | 194 (5.8%) |
| 5 to 9 Years | 279 (10.2%) | 154 (4.6%) |
| 10 to 14 Years | 47 (1.7%) | 286 (8.5%) |
| 15 to 19 Years | 256 (9.4%) | 337 (10.0%) |
| 20 to 24 Years | 69 (2.5%) | 34 (1.0%) |
| 25 to 29 Years | 239 (8.7%) | 121 (3.6%) |
| 30 to 34 Years | 126 (4.6%) | 142 (4.2%) |
| 35 to 39 Years | 84 (3.1%) | 238 (7.1%) |
| 40 to 44 Years | 167 (6.1%) | 231 (6.9%) |
| 45 to 49 Years | 215 (7.9%) | 205 (6.1%) |
| 50 to 54 Years | 116 (4.2%) | 290 (8.6%) |
| 55 to 59 Years | 261 (9.5%) | 214 (6.4%) |
| 60 to 64 Years | 124 (4.5%) | 173 (5.1%) |
| 65 to 69 Years | 90 (3.3%) | 234 (7.0%) |
| 70 to 74 Years | 172 (6.3%) | 122 (3.6%) |
| 75 to 79 Years | 49 (1.8%) | 64 (1.9%) |
| 80 to 84 Years | 66 (2.4%) | 195 (5.8%) |
| 85 Years and over | 292 (10.7%) | 130 (3.9%) |
| Total | 2,735 (100.0%) | 3,364 (100.0%) |
Families and Households in Gas City
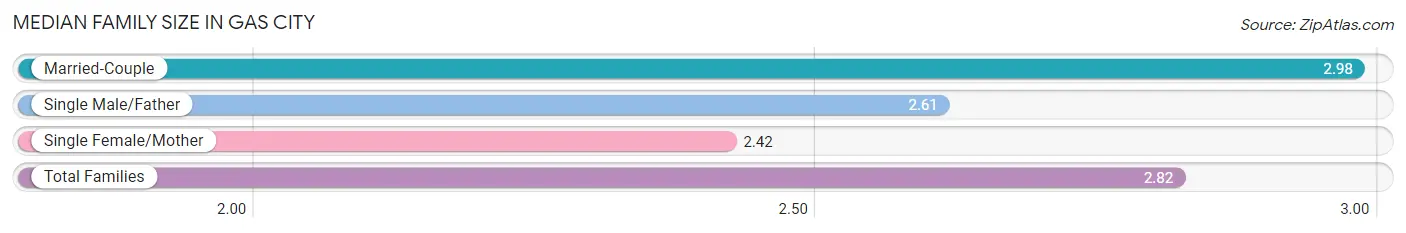
Median Family Size in Gas City
The median family size in Gas City is 2.82 persons per family, with married-couple families (1,214 | 68.5%) accounting for the largest median family size of 2.98 persons per family. On the other hand, single female/mother families (405 | 22.9%) represent the smallest median family size with 2.42 persons per family.
| Family Type | # Families | Family Size |
| Married-Couple | 1,214 (68.5%) | 2.98 |
| Single Male/Father | 153 (8.6%) | 2.61 |
| Single Female/Mother | 405 (22.9%) | 2.42 |
| Total Families | 1,772 (100.0%) | 2.82 |
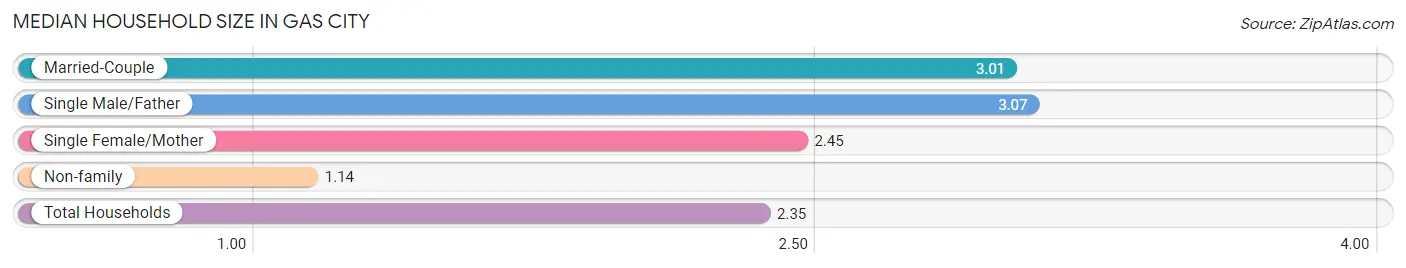
Median Household Size in Gas City
The median household size in Gas City is 2.35 persons per household, with single male/father households (153 | 6.0%) accounting for the largest median household size of 3.07 persons per household. non-family households (790 | 30.8%) represent the smallest median household size with 1.14 persons per household.
| Household Type | # Households | Household Size |
| Married-Couple | 1,214 (47.4%) | 3.01 |
| Single Male/Father | 153 (6.0%) | 3.07 |
| Single Female/Mother | 405 (15.8%) | 2.45 |
| Non-family | 790 (30.8%) | 1.14 |
| Total Households | 2,562 (100.0%) | 2.35 |
Household Size by Marriage Status in Gas City
Out of a total of 2,562 households in Gas City, 1,772 (69.2%) are family households, while 790 (30.8%) are nonfamily households. The most numerous type of family households are 2-person households, comprising 789, and the most common type of nonfamily households are 1-person households, comprising 693.
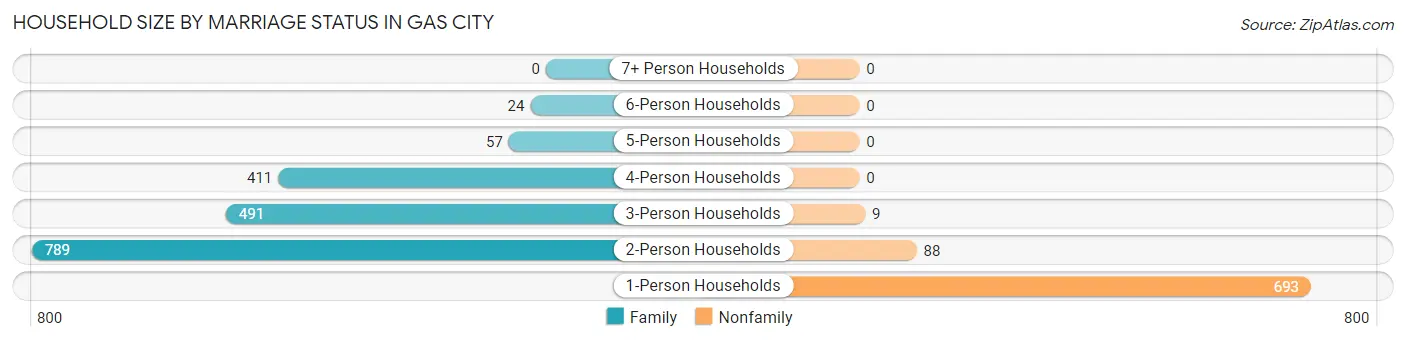
| Household Size | Family Households | Nonfamily Households |
| 1-Person Households | - | 693 (27.1%) |
| 2-Person Households | 789 (30.8%) | 88 (3.4%) |
| 3-Person Households | 491 (19.2%) | 9 (0.4%) |
| 4-Person Households | 411 (16.0%) | 0 (0.0%) |
| 5-Person Households | 57 (2.2%) | 0 (0.0%) |
| 6-Person Households | 24 (0.9%) | 0 (0.0%) |
| 7+ Person Households | 0 (0.0%) | 0 (0.0%) |
| Total | 1,772 (69.2%) | 790 (30.8%) |
Female Fertility in Gas City
Fertility by Age in Gas City
Average fertility rate in Gas City is 7.0 births per 1,000 women. Women in the age bracket of 20 to 34 years have the highest fertility rate with 34.0 births per 1,000 women. Women in the age bracket of 20 to 34 years acount for 100.0% of all women with births.
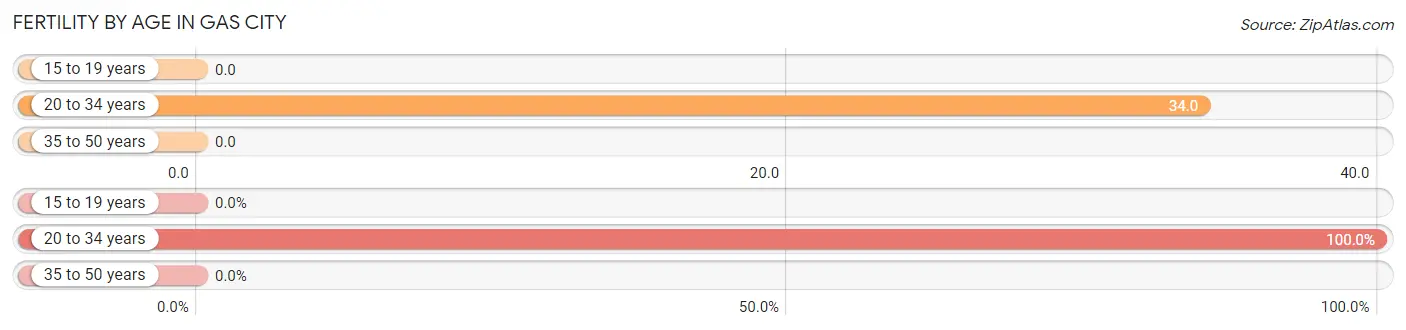
| Age Bracket | Women with Births | Births / 1,000 Women |
| 15 to 19 years | 0 (0.0%) | 0.0 |
| 20 to 34 years | 10 (100.0%) | 34.0 |
| 35 to 50 years | 0 (0.0%) | 0.0 |
| Total | 10 (100.0%) | 7.0 |
Fertility by Age by Marriage Status in Gas City
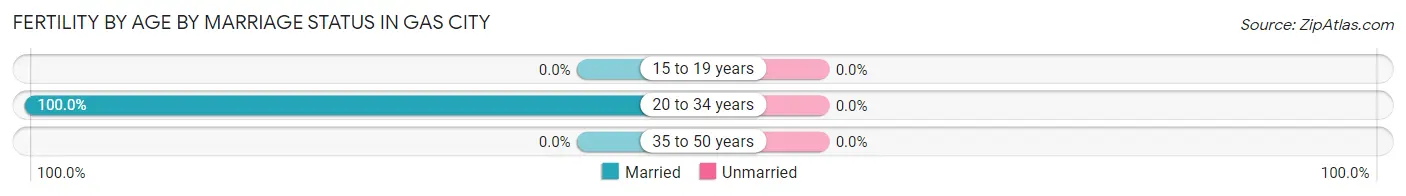
| Age Bracket | Married | Unmarried |
| 15 to 19 years | 0 (0.0%) | 0 (0.0%) |
| 20 to 34 years | 10 (100.0%) | 0 (0.0%) |
| 35 to 50 years | 0 (0.0%) | 0 (0.0%) |
| Total | 10 (100.0%) | 0 (0.0%) |
Fertility by Education in Gas City
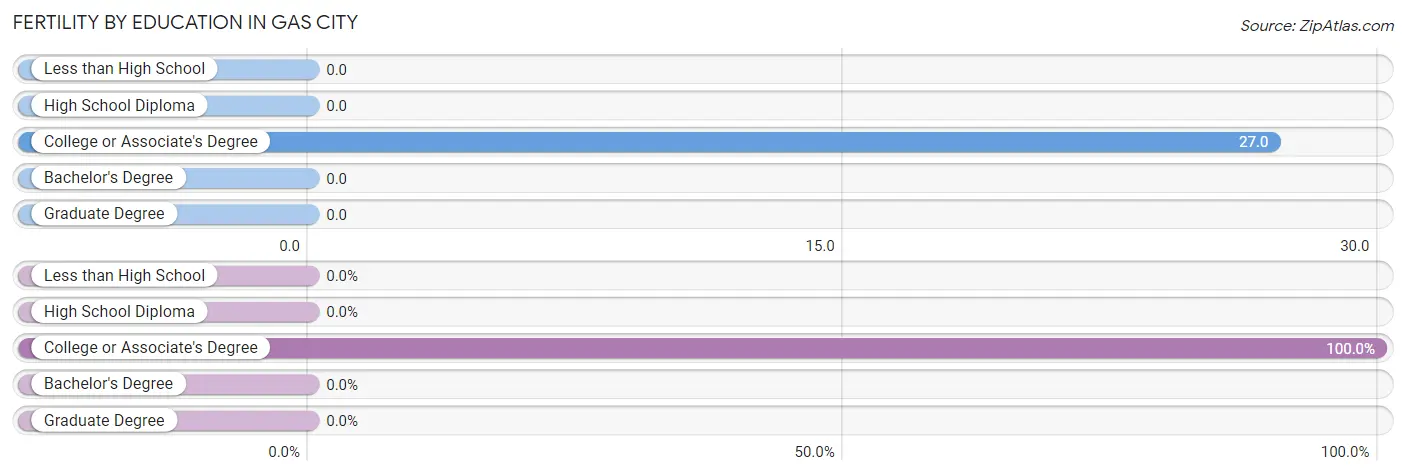
| Educational Attainment | Women with Births | Births / 1,000 Women |
| Less than High School | 0 (0.0%) | 0.0 |
| High School Diploma | 0 (0.0%) | 0.0 |
| College or Associate's Degree | 10 (100.0%) | 27.0 |
| Bachelor's Degree | 0 (0.0%) | 0.0 |
| Graduate Degree | 0 (0.0%) | 0.0 |
| Total | 10 (100.0%) | 7.0 |
Fertility by Education by Marriage Status in Gas City
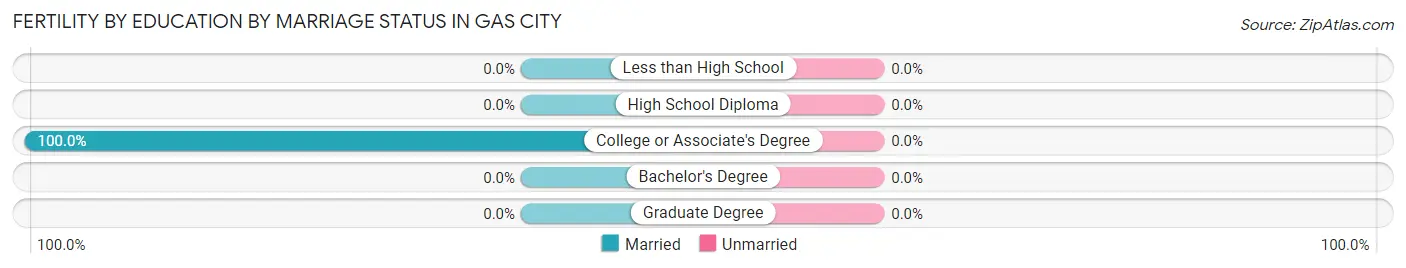
| Educational Attainment | Married | Unmarried |
| Less than High School | 0 (0.0%) | 0 (0.0%) |
| High School Diploma | 0 (0.0%) | 0 (0.0%) |
| College or Associate's Degree | 10 (100.0%) | 0 (0.0%) |
| Bachelor's Degree | 0 (0.0%) | 0 (0.0%) |
| Graduate Degree | 0 (0.0%) | 0 (0.0%) |
| Total | 10 (100.0%) | 0 (0.0%) |
Employment Characteristics in Gas City
Employment by Class of Employer in Gas City
Among the 2,571 employed individuals in Gas City, private company employees (1,905 | 74.1%), local government employees (216 | 8.4%), and not-for-profit organizations (159 | 6.2%) make up the most common classes of employment.
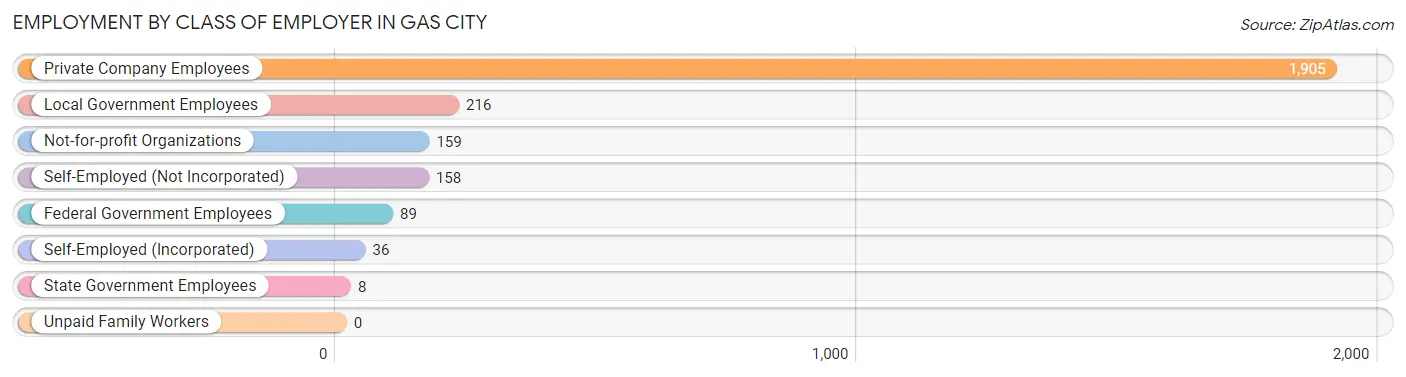
| Employer Class | # Employees | % Employees |
| Private Company Employees | 1,905 | 74.1% |
| Self-Employed (Incorporated) | 36 | 1.4% |
| Self-Employed (Not Incorporated) | 158 | 6.1% |
| Not-for-profit Organizations | 159 | 6.2% |
| Local Government Employees | 216 | 8.4% |
| State Government Employees | 8 | 0.3% |
| Federal Government Employees | 89 | 3.5% |
| Unpaid Family Workers | 0 | 0.0% |
| Total | 2,571 | 100.0% |
Employment Status by Age in Gas City
According to the labor force statistics for Gas City, out of the total population over 16 years of age (5,002), 57.8% or 2,891 individuals are in the labor force, with 10.8% or 312 of them unemployed. The age group with the highest labor force participation rate is 35 to 44 years, with 99.4% or 716 individuals in the labor force. Within the labor force, the 16 to 19 years age range has the highest percentage of unemployed individuals, with 54.5% or 169 of them being unemployed.
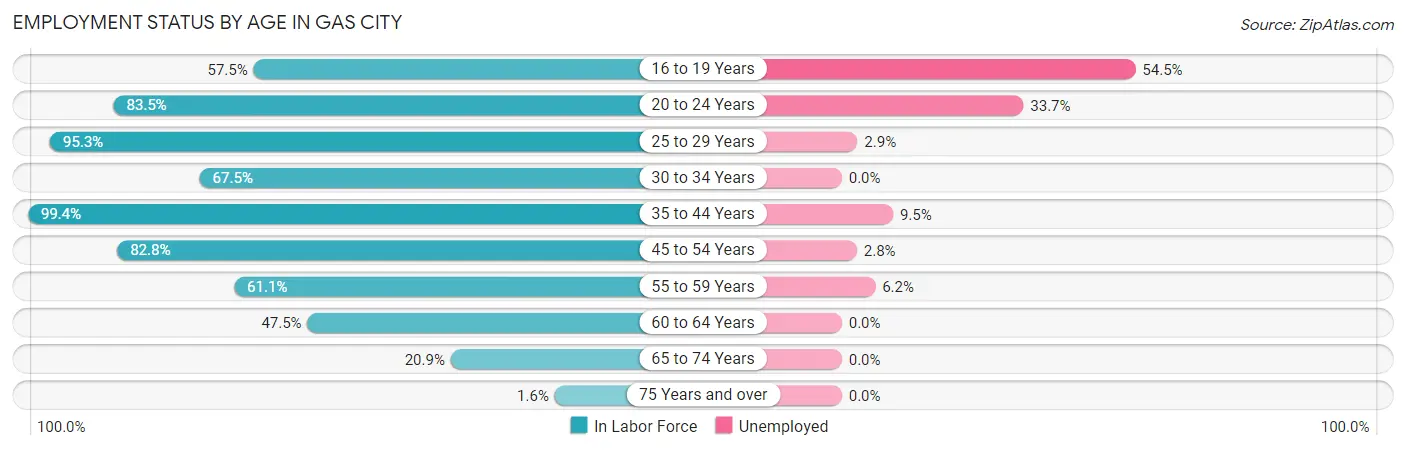
| Age Bracket | In Labor Force | Unemployed |
| 16 to 19 Years | 310 (57.5%) | 169 (54.5%) |
| 20 to 24 Years | 86 (83.5%) | 29 (33.7%) |
| 25 to 29 Years | 343 (95.3%) | 10 (2.9%) |
| 30 to 34 Years | 181 (67.5%) | 0 (0.0%) |
| 35 to 44 Years | 716 (99.4%) | 68 (9.5%) |
| 45 to 54 Years | 684 (82.8%) | 19 (2.8%) |
| 55 to 59 Years | 290 (61.1%) | 18 (6.2%) |
| 60 to 64 Years | 141 (47.5%) | 0 (0.0%) |
| 65 to 74 Years | 129 (20.9%) | 0 (0.0%) |
| 75 Years and over | 13 (1.6%) | 0 (0.0%) |
| Total | 2,891 (57.8%) | 312 (10.8%) |
Employment Status by Educational Attainment in Gas City
According to labor force statistics for Gas City, 79.9% of individuals (2,354) out of the total population between 25 and 64 years of age (2,946) are in the labor force, with 4.9% or 115 of them being unemployed. The group with the highest labor force participation rate are those with the educational attainment of bachelor's degree or higher, with 90.1% or 557 individuals in the labor force. Within the labor force, individuals with less than high school education have the highest percentage of unemployment, with 52.4% or 11 of them being unemployed.
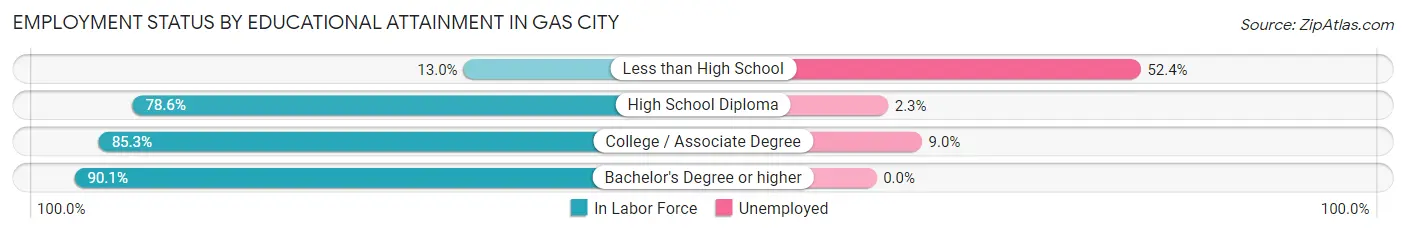
| Educational Attainment | In Labor Force | Unemployed |
| Less than High School | 21 (13.0%) | 85 (52.4%) |
| High School Diploma | 828 (78.6%) | 24 (2.3%) |
| College / Associate Degree | 949 (85.3%) | 100 (9.0%) |
| Bachelor's Degree or higher | 557 (90.1%) | 0 (0.0%) |
| Total | 2,354 (79.9%) | 144 (4.9%) |
Employment Occupations by Sex in Gas City
Management, Business, Science and Arts Occupations
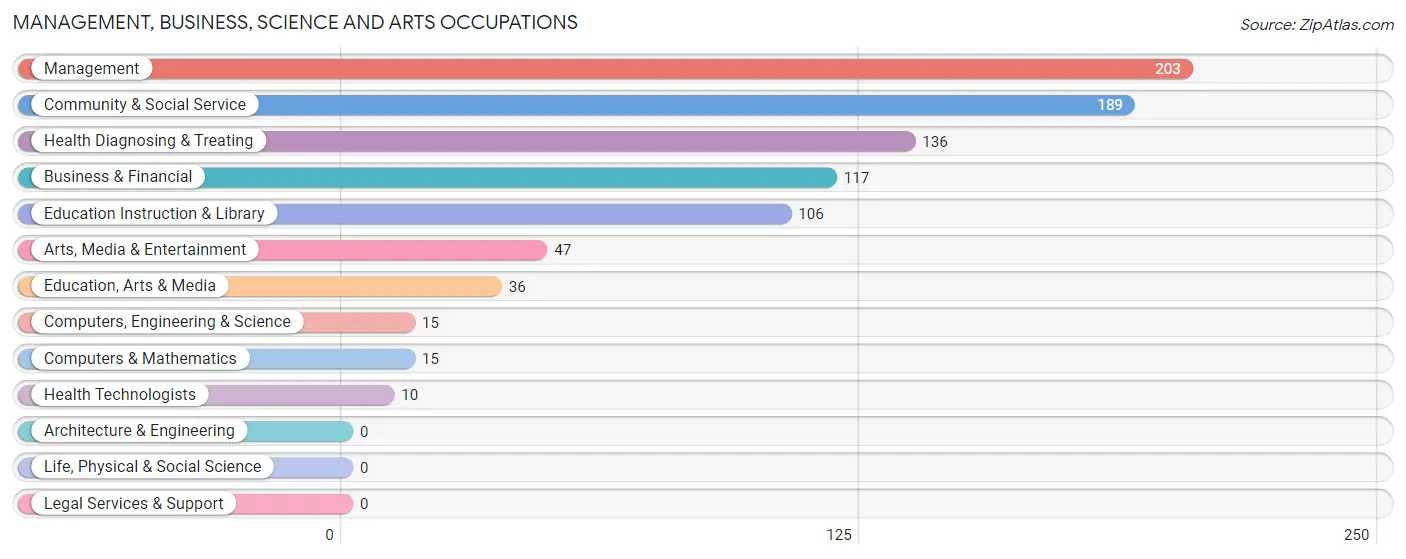
The most common Management, Business, Science and Arts occupations in Gas City are Management (203 | 7.9%), Community & Social Service (189 | 7.3%), Health Diagnosing & Treating (136 | 5.3%), Business & Financial (117 | 4.5%), and Education Instruction & Library (106 | 4.1%).
Management, Business, Science and Arts Occupations by Sex
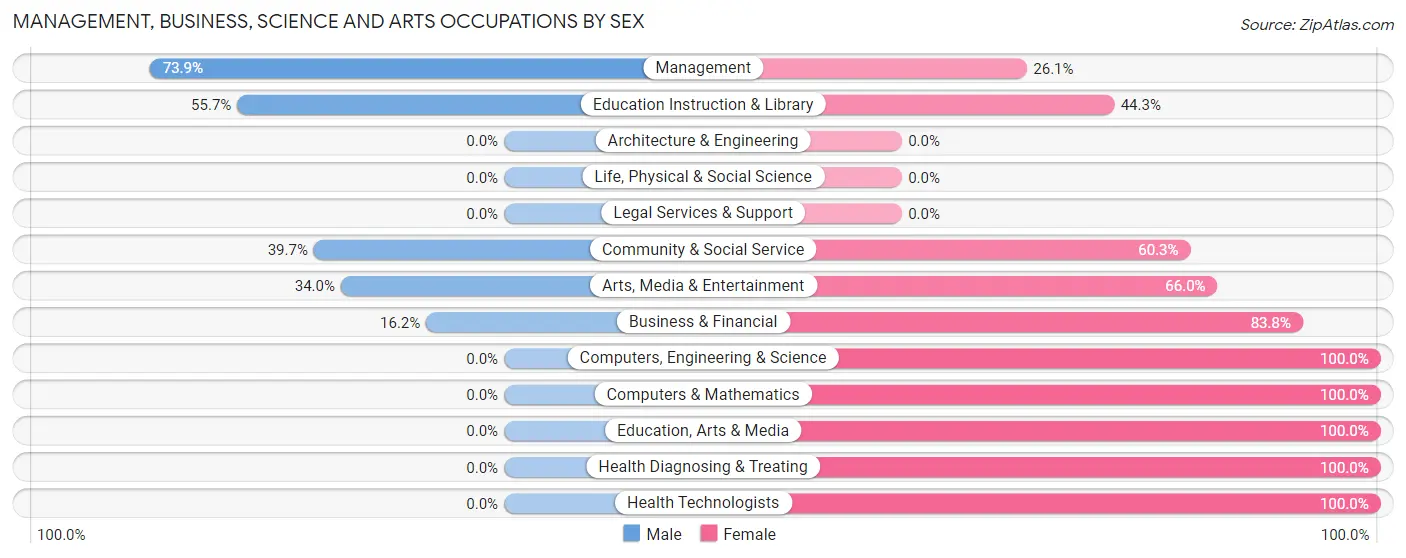
Within the Management, Business, Science and Arts occupations in Gas City, the most male-oriented occupations are Management (73.9%), Education Instruction & Library (55.7%), and Community & Social Service (39.7%), while the most female-oriented occupations are Computers, Engineering & Science (100.0%), Computers & Mathematics (100.0%), and Education, Arts & Media (100.0%).
| Occupation | Male | Female |
| Management | 150 (73.9%) | 53 (26.1%) |
| Business & Financial | 19 (16.2%) | 98 (83.8%) |
| Computers, Engineering & Science | 0 (0.0%) | 15 (100.0%) |
| Computers & Mathematics | 0 (0.0%) | 15 (100.0%) |
| Architecture & Engineering | 0 (0.0%) | 0 (0.0%) |
| Life, Physical & Social Science | 0 (0.0%) | 0 (0.0%) |
| Community & Social Service | 75 (39.7%) | 114 (60.3%) |
| Education, Arts & Media | 0 (0.0%) | 36 (100.0%) |
| Legal Services & Support | 0 (0.0%) | 0 (0.0%) |
| Education Instruction & Library | 59 (55.7%) | 47 (44.3%) |
| Arts, Media & Entertainment | 16 (34.0%) | 31 (66.0%) |
| Health Diagnosing & Treating | 0 (0.0%) | 136 (100.0%) |
| Health Technologists | 0 (0.0%) | 10 (100.0%) |
| Total (Category) | 244 (37.0%) | 416 (63.0%) |
| Total (Overall) | 1,233 (47.8%) | 1,347 (52.2%) |
Services Occupations
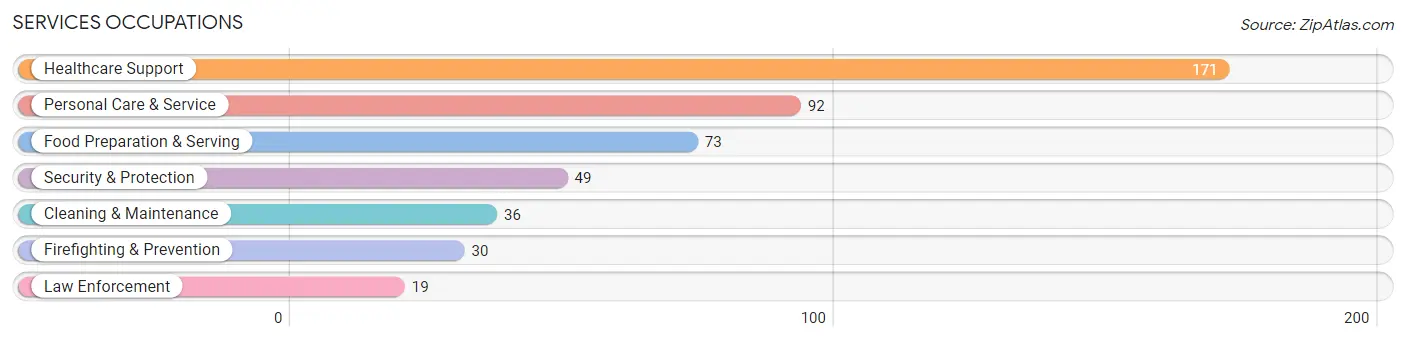
The most common Services occupations in Gas City are Healthcare Support (171 | 6.6%), Personal Care & Service (92 | 3.6%), Food Preparation & Serving (73 | 2.8%), Security & Protection (49 | 1.9%), and Cleaning & Maintenance (36 | 1.4%).
Services Occupations by Sex
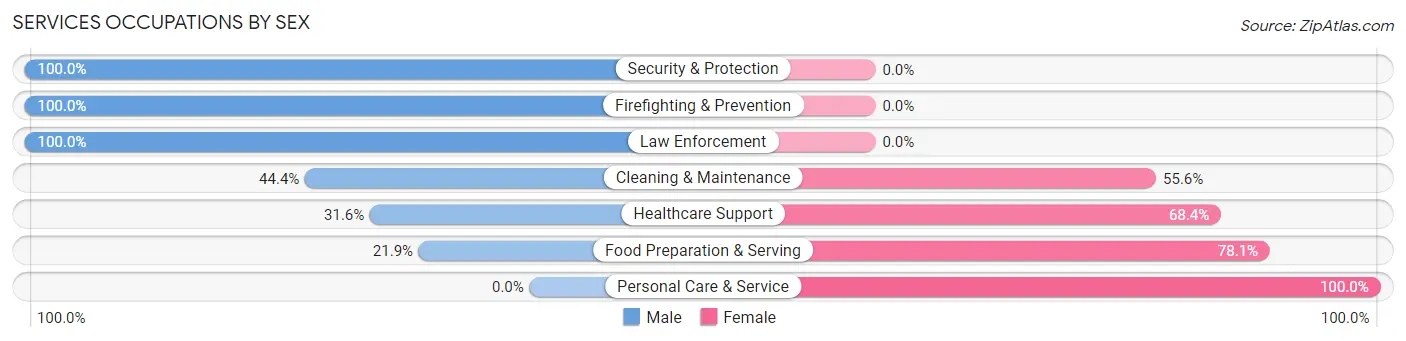
Within the Services occupations in Gas City, the most male-oriented occupations are Security & Protection (100.0%), Firefighting & Prevention (100.0%), and Law Enforcement (100.0%), while the most female-oriented occupations are Personal Care & Service (100.0%), Food Preparation & Serving (78.1%), and Healthcare Support (68.4%).
| Occupation | Male | Female |
| Healthcare Support | 54 (31.6%) | 117 (68.4%) |
| Security & Protection | 49 (100.0%) | 0 (0.0%) |
| Firefighting & Prevention | 30 (100.0%) | 0 (0.0%) |
| Law Enforcement | 19 (100.0%) | 0 (0.0%) |
| Food Preparation & Serving | 16 (21.9%) | 57 (78.1%) |
| Cleaning & Maintenance | 16 (44.4%) | 20 (55.6%) |
| Personal Care & Service | 0 (0.0%) | 92 (100.0%) |
| Total (Category) | 135 (32.1%) | 286 (67.9%) |
| Total (Overall) | 1,233 (47.8%) | 1,347 (52.2%) |
Sales and Office Occupations
The most common Sales and Office occupations in Gas City are Sales & Related (406 | 15.7%), and Office & Administration (374 | 14.5%).
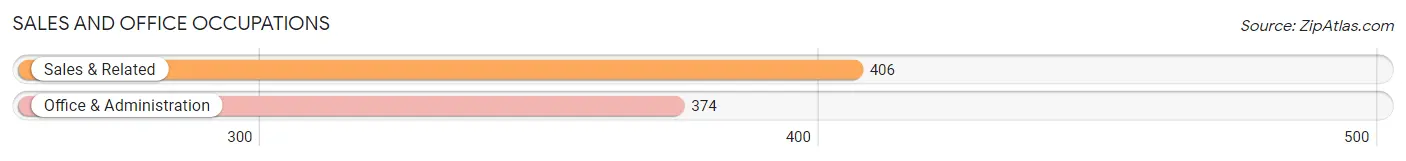
Sales and Office Occupations by Sex

| Occupation | Male | Female |
| Sales & Related | 70 (17.2%) | 336 (82.8%) |
| Office & Administration | 161 (43.0%) | 213 (57.0%) |
| Total (Category) | 231 (29.6%) | 549 (70.4%) |
| Total (Overall) | 1,233 (47.8%) | 1,347 (52.2%) |
Natural Resources, Construction and Maintenance Occupations
The most common Natural Resources, Construction and Maintenance occupations in Gas City are Construction & Extraction (147 | 5.7%), and Installation, Maintenance & Repair (68 | 2.6%).
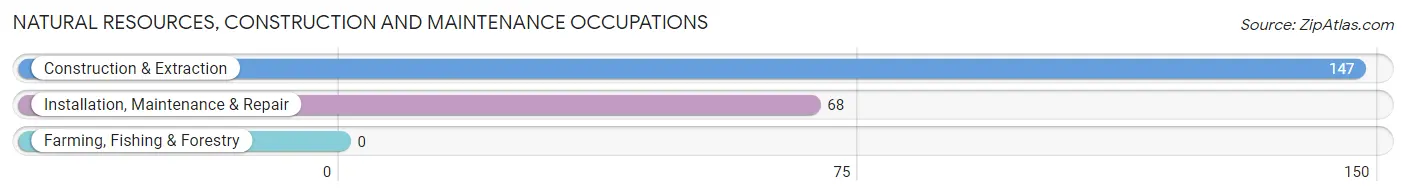
Natural Resources, Construction and Maintenance Occupations by Sex
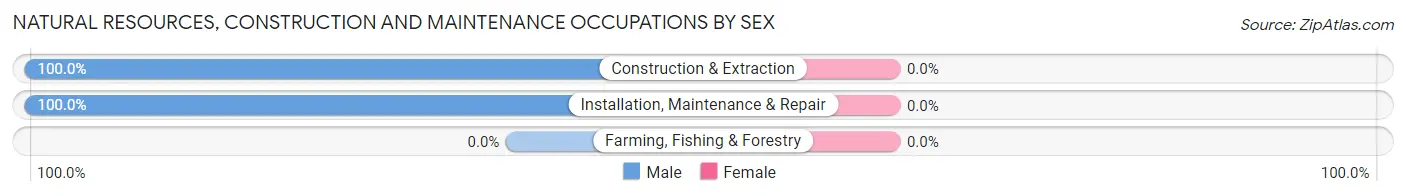
| Occupation | Male | Female |
| Farming, Fishing & Forestry | 0 (0.0%) | 0 (0.0%) |
| Construction & Extraction | 147 (100.0%) | 0 (0.0%) |
| Installation, Maintenance & Repair | 68 (100.0%) | 0 (0.0%) |
| Total (Category) | 215 (100.0%) | 0 (0.0%) |
| Total (Overall) | 1,233 (47.8%) | 1,347 (52.2%) |
Production, Transportation and Moving Occupations
The most common Production, Transportation and Moving occupations in Gas City are Material Moving (222 | 8.6%), Production (213 | 8.3%), and Transportation (69 | 2.7%).
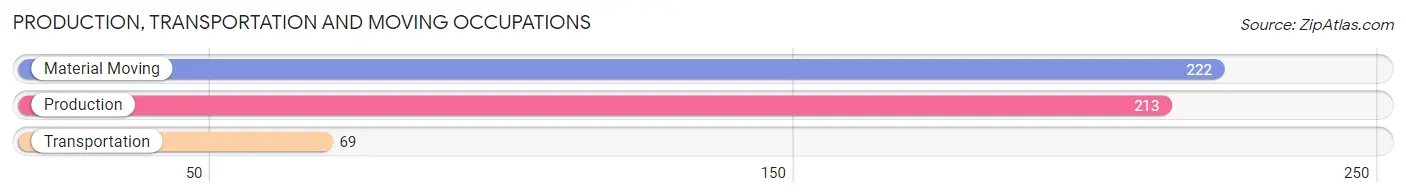
Production, Transportation and Moving Occupations by Sex
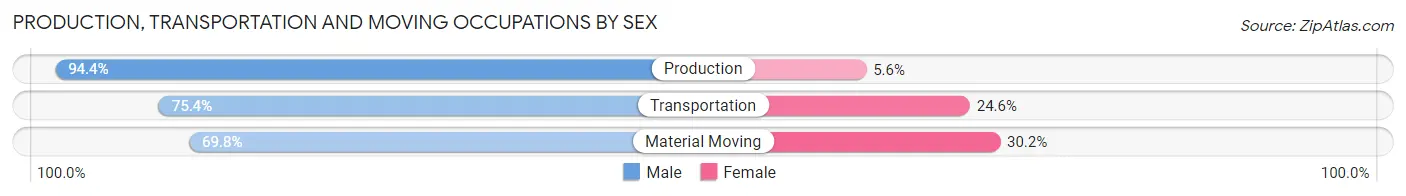
| Occupation | Male | Female |
| Production | 201 (94.4%) | 12 (5.6%) |
| Transportation | 52 (75.4%) | 17 (24.6%) |
| Material Moving | 155 (69.8%) | 67 (30.2%) |
| Total (Category) | 408 (80.9%) | 96 (19.1%) |
| Total (Overall) | 1,233 (47.8%) | 1,347 (52.2%) |
Employment Industries by Sex in Gas City
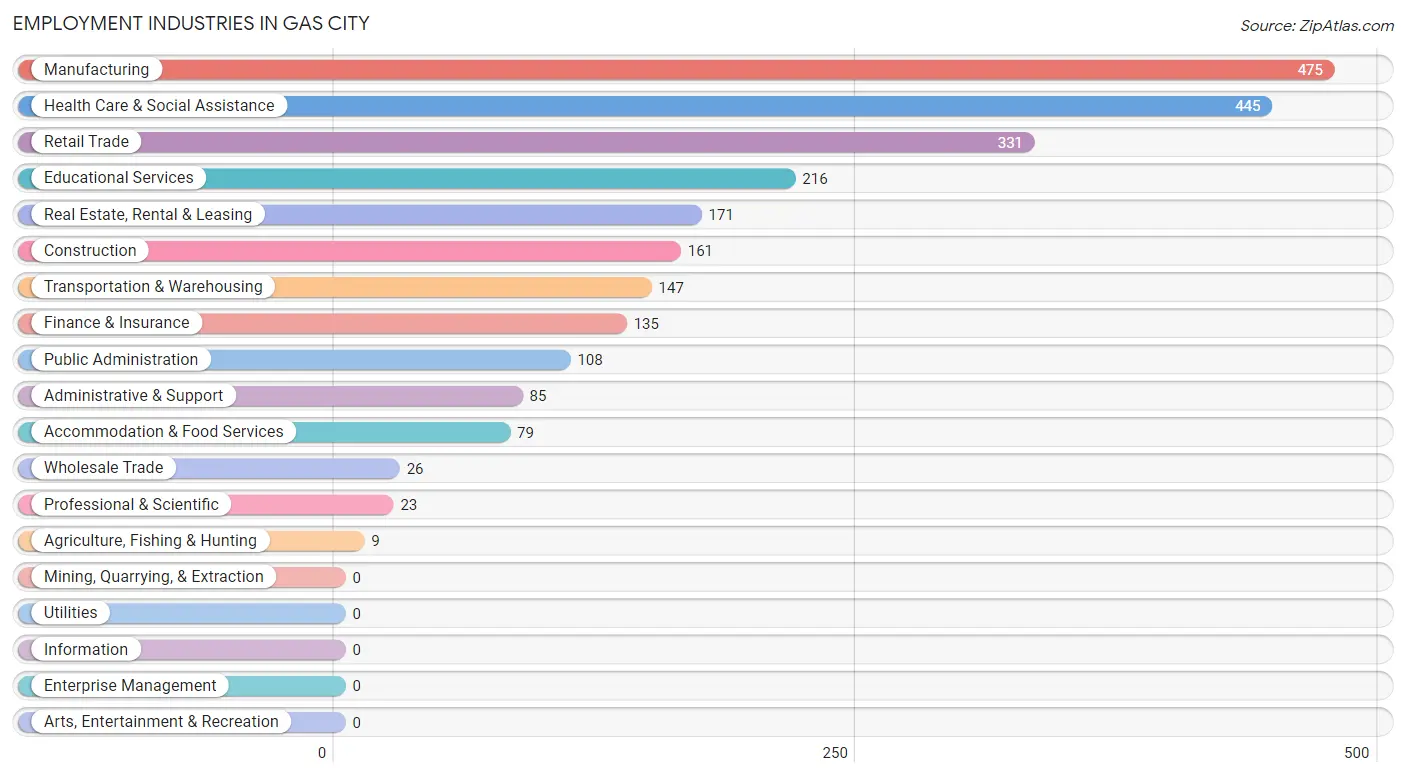
Employment Industries in Gas City
The major employment industries in Gas City include Manufacturing (475 | 18.4%), Health Care & Social Assistance (445 | 17.2%), Retail Trade (331 | 12.8%), Educational Services (216 | 8.4%), and Real Estate, Rental & Leasing (171 | 6.6%).
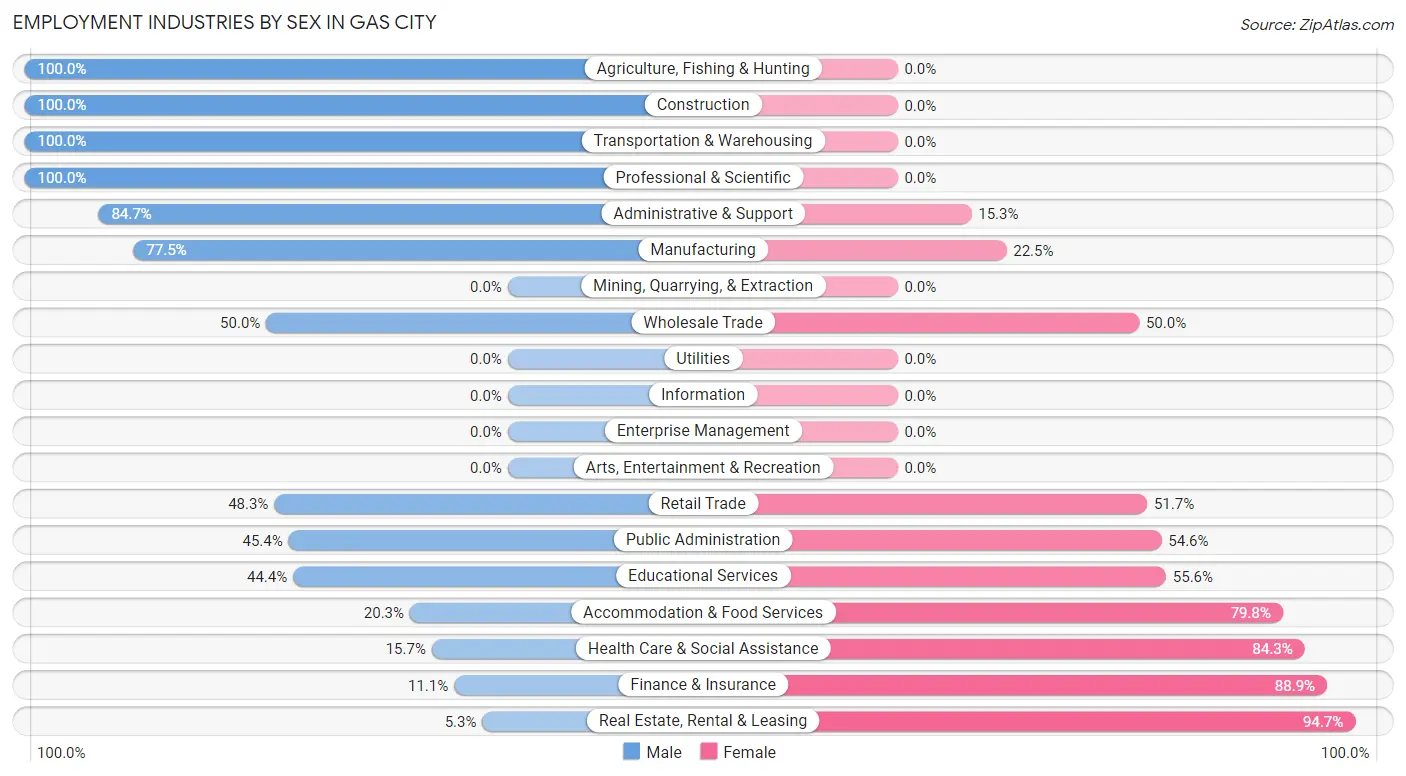
Employment Industries by Sex in Gas City
The Gas City industries that see more men than women are Agriculture, Fishing & Hunting (100.0%), Construction (100.0%), and Transportation & Warehousing (100.0%), whereas the industries that tend to have a higher number of women are Real Estate, Rental & Leasing (94.7%), Finance & Insurance (88.9%), and Health Care & Social Assistance (84.3%).
| Industry | Male | Female |
| Agriculture, Fishing & Hunting | 9 (100.0%) | 0 (0.0%) |
| Mining, Quarrying, & Extraction | 0 (0.0%) | 0 (0.0%) |
| Construction | 161 (100.0%) | 0 (0.0%) |
| Manufacturing | 368 (77.5%) | 107 (22.5%) |
| Wholesale Trade | 13 (50.0%) | 13 (50.0%) |
| Retail Trade | 160 (48.3%) | 171 (51.7%) |
| Transportation & Warehousing | 147 (100.0%) | 0 (0.0%) |
| Utilities | 0 (0.0%) | 0 (0.0%) |
| Information | 0 (0.0%) | 0 (0.0%) |
| Finance & Insurance | 15 (11.1%) | 120 (88.9%) |
| Real Estate, Rental & Leasing | 9 (5.3%) | 162 (94.7%) |
| Professional & Scientific | 23 (100.0%) | 0 (0.0%) |
| Enterprise Management | 0 (0.0%) | 0 (0.0%) |
| Administrative & Support | 72 (84.7%) | 13 (15.3%) |
| Educational Services | 96 (44.4%) | 120 (55.6%) |
| Health Care & Social Assistance | 70 (15.7%) | 375 (84.3%) |
| Arts, Entertainment & Recreation | 0 (0.0%) | 0 (0.0%) |
| Accommodation & Food Services | 16 (20.3%) | 63 (79.7%) |
| Public Administration | 49 (45.4%) | 59 (54.6%) |
| Total | 1,233 (47.8%) | 1,347 (52.2%) |
Education in Gas City
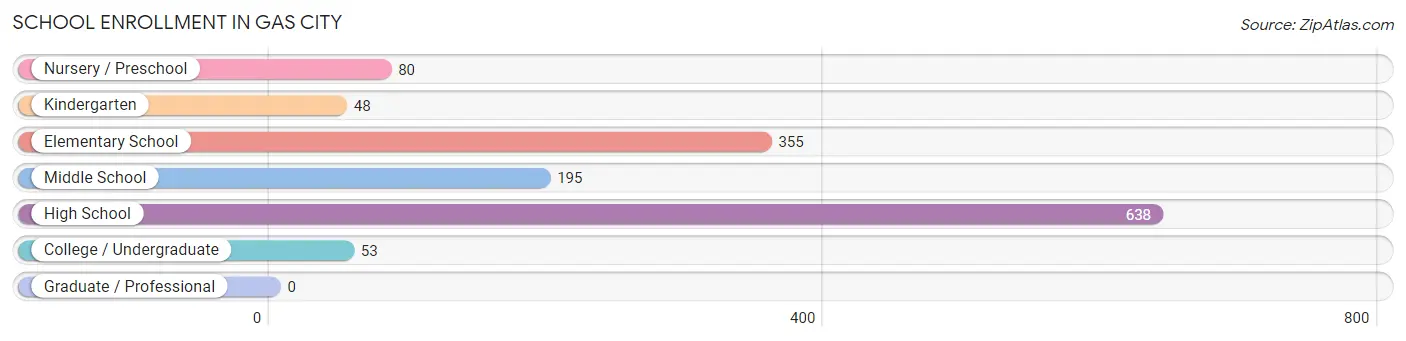
School Enrollment in Gas City
The most common levels of schooling among the 1,369 students in Gas City are high school (638 | 46.6%), elementary school (355 | 25.9%), and middle school (195 | 14.2%).
| School Level | # Students | % Students |
| Nursery / Preschool | 80 | 5.8% |
| Kindergarten | 48 | 3.5% |
| Elementary School | 355 | 25.9% |
| Middle School | 195 | 14.2% |
| High School | 638 | 46.6% |
| College / Undergraduate | 53 | 3.9% |
| Graduate / Professional | 0 | 0.0% |
| Total | 1,369 | 100.0% |
School Enrollment by Age by Funding Source in Gas City
Out of a total of 1,369 students who are enrolled in schools in Gas City, 81 (5.9%) attend a private institution, while the remaining 1,288 (94.1%) are enrolled in public schools. The age group of 3 to 4 year olds has the highest likelihood of being enrolled in private schools, with 32 (100.0% in the age bracket) enrolled. Conversely, the age group of 20 to 24 year olds has the lowest likelihood of being enrolled in a private school, with 27 (100.0% in the age bracket) attending a public institution.
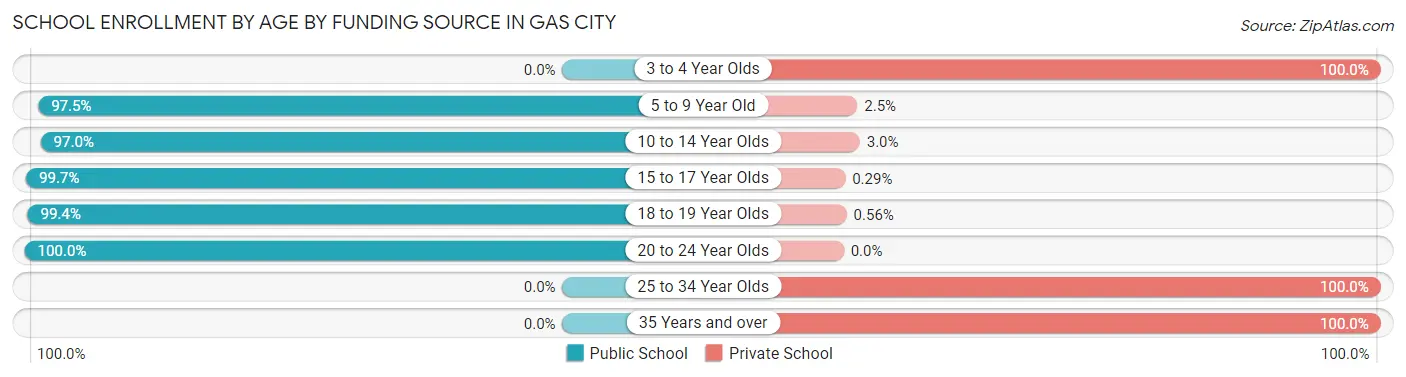
| Age Bracket | Public School | Private School |
| 3 to 4 Year Olds | 0 (0.0%) | 32 (100.0%) |
| 5 to 9 Year Old | 422 (97.5%) | 11 (2.5%) |
| 10 to 14 Year Olds | 323 (97.0%) | 10 (3.0%) |
| 15 to 17 Year Olds | 339 (99.7%) | 1 (0.3%) |
| 18 to 19 Year Olds | 177 (99.4%) | 1 (0.6%) |
| 20 to 24 Year Olds | 27 (100.0%) | 0 (0.0%) |
| 25 to 34 Year Olds | 0 (0.0%) | 15 (100.0%) |
| 35 Years and over | 0 (0.0%) | 11 (100.0%) |
| Total | 1,288 (94.1%) | 81 (5.9%) |
Educational Attainment by Field of Study in Gas City
Education (233 | 28.3%), business (162 | 19.7%), liberal arts & history (105 | 12.8%), arts & humanities (81 | 9.8%), and science & technology (80 | 9.7%) are the most common fields of study among 823 individuals in Gas City who have obtained a bachelor's degree or higher.
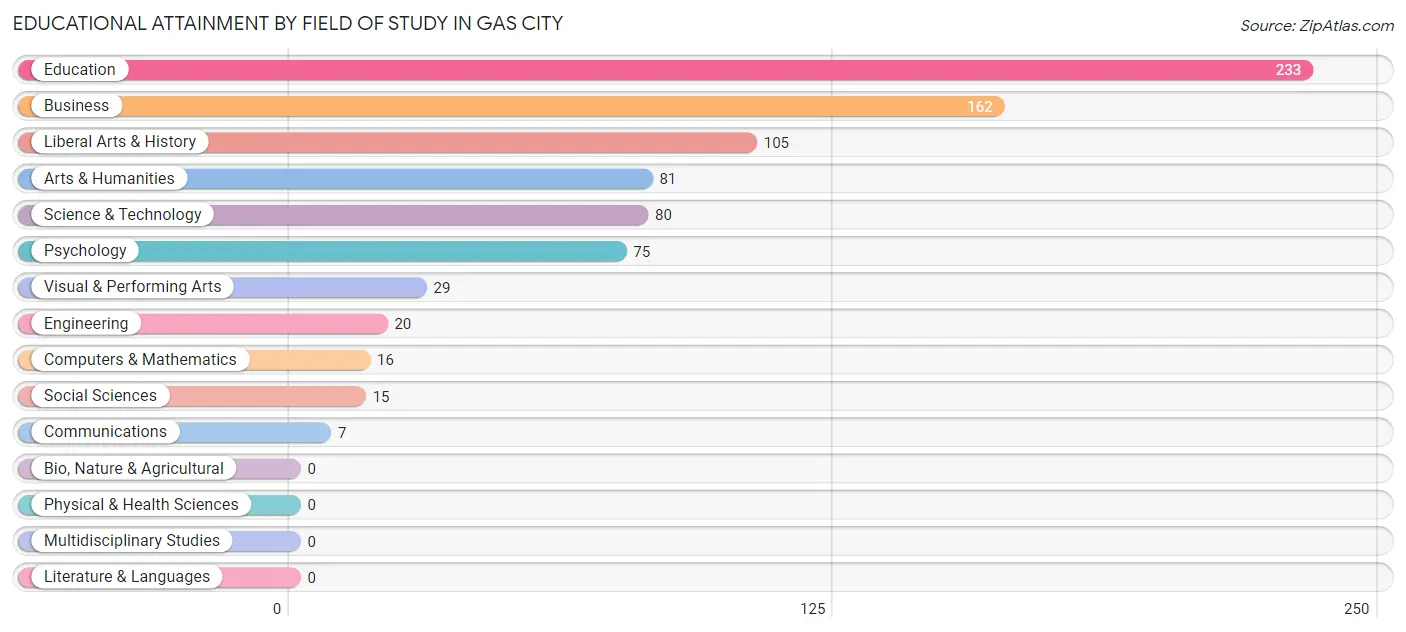
| Field of Study | # Graduates | % Graduates |
| Computers & Mathematics | 16 | 1.9% |
| Bio, Nature & Agricultural | 0 | 0.0% |
| Physical & Health Sciences | 0 | 0.0% |
| Psychology | 75 | 9.1% |
| Social Sciences | 15 | 1.8% |
| Engineering | 20 | 2.4% |
| Multidisciplinary Studies | 0 | 0.0% |
| Science & Technology | 80 | 9.7% |
| Business | 162 | 19.7% |
| Education | 233 | 28.3% |
| Literature & Languages | 0 | 0.0% |
| Liberal Arts & History | 105 | 12.8% |
| Visual & Performing Arts | 29 | 3.5% |
| Communications | 7 | 0.9% |
| Arts & Humanities | 81 | 9.8% |
| Total | 823 | 100.0% |
Transportation & Commute in Gas City
Vehicle Availability by Sex in Gas City
The most prevalent vehicle ownership categories in Gas City are males with 2 vehicles (625, accounting for 51.1%) and females with 2 vehicles (590, making up 46.4%).
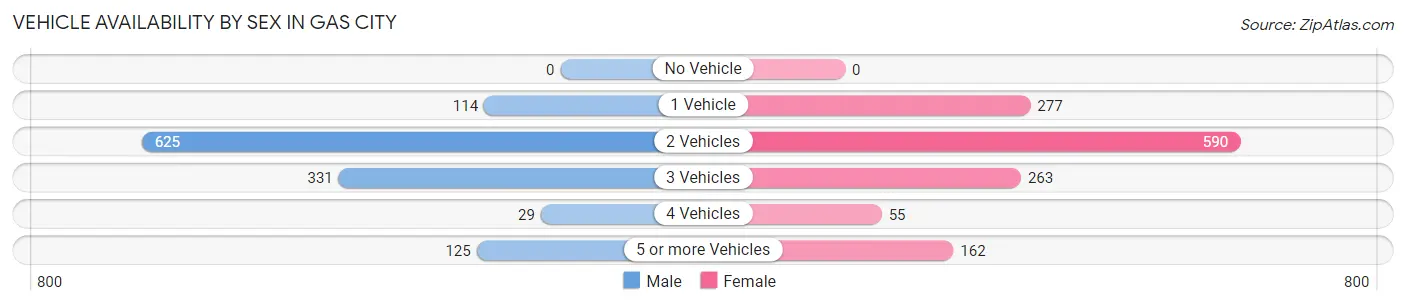
| Vehicles Available | Male | Female |
| No Vehicle | 0 (0.0%) | 0 (0.0%) |
| 1 Vehicle | 114 (9.3%) | 277 (20.6%) |
| 2 Vehicles | 625 (51.1%) | 590 (43.8%) |
| 3 Vehicles | 331 (27.0%) | 263 (19.5%) |
| 4 Vehicles | 29 (2.4%) | 55 (4.1%) |
| 5 or more Vehicles | 125 (10.2%) | 162 (12.0%) |
| Total | 1,224 (100.0%) | 1,347 (100.0%) |
Commute Time in Gas City
The most frequently occuring commute durations in Gas City are 15 to 19 minutes (637 commuters, 26.3%), 10 to 14 minutes (400 commuters, 16.5%), and 20 to 24 minutes (341 commuters, 14.1%).
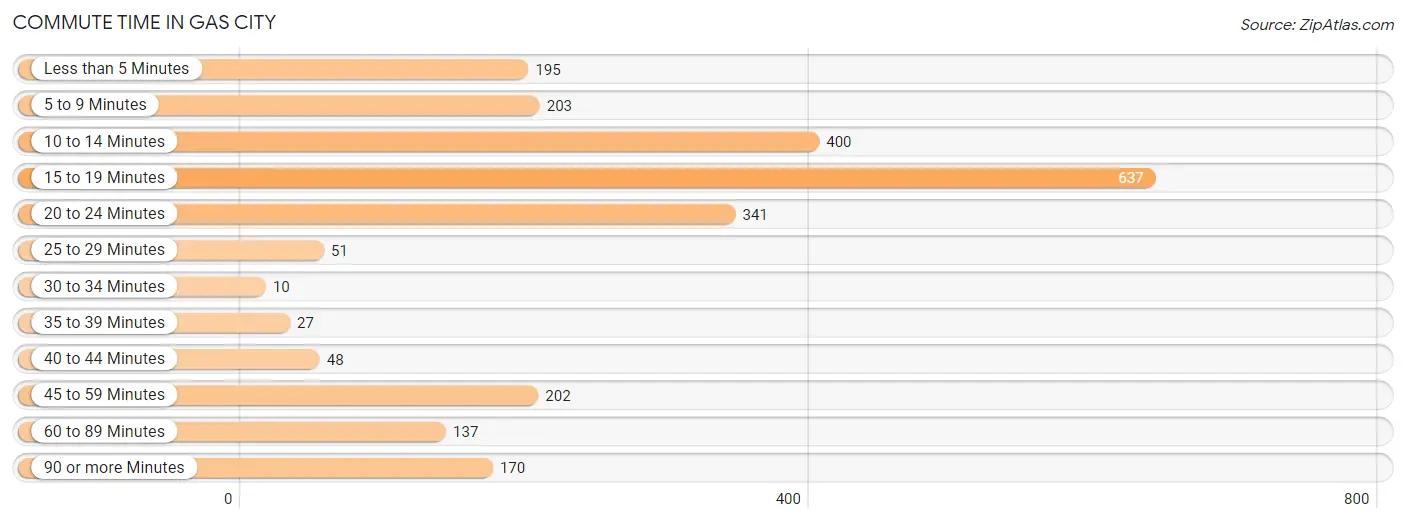
| Commute Time | # Commuters | % Commuters |
| Less than 5 Minutes | 195 | 8.1% |
| 5 to 9 Minutes | 203 | 8.4% |
| 10 to 14 Minutes | 400 | 16.5% |
| 15 to 19 Minutes | 637 | 26.3% |
| 20 to 24 Minutes | 341 | 14.1% |
| 25 to 29 Minutes | 51 | 2.1% |
| 30 to 34 Minutes | 10 | 0.4% |
| 35 to 39 Minutes | 27 | 1.1% |
| 40 to 44 Minutes | 48 | 2.0% |
| 45 to 59 Minutes | 202 | 8.3% |
| 60 to 89 Minutes | 137 | 5.7% |
| 90 or more Minutes | 170 | 7.0% |
Commute Time by Sex in Gas City
The most common commute times in Gas City are 15 to 19 minutes (310 commuters, 25.8%) for males and 15 to 19 minutes (327 commuters, 26.8%) for females.
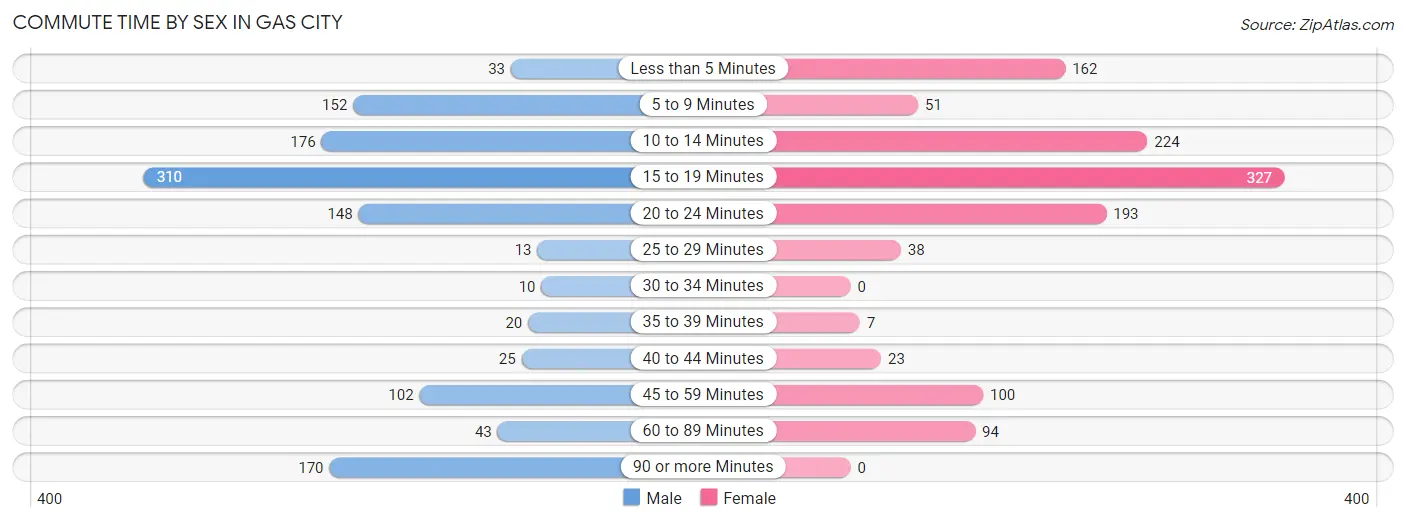
| Commute Time | Male | Female |
| Less than 5 Minutes | 33 (2.8%) | 162 (13.3%) |
| 5 to 9 Minutes | 152 (12.7%) | 51 (4.2%) |
| 10 to 14 Minutes | 176 (14.6%) | 224 (18.4%) |
| 15 to 19 Minutes | 310 (25.8%) | 327 (26.8%) |
| 20 to 24 Minutes | 148 (12.3%) | 193 (15.8%) |
| 25 to 29 Minutes | 13 (1.1%) | 38 (3.1%) |
| 30 to 34 Minutes | 10 (0.8%) | 0 (0.0%) |
| 35 to 39 Minutes | 20 (1.7%) | 7 (0.6%) |
| 40 to 44 Minutes | 25 (2.1%) | 23 (1.9%) |
| 45 to 59 Minutes | 102 (8.5%) | 100 (8.2%) |
| 60 to 89 Minutes | 43 (3.6%) | 94 (7.7%) |
| 90 or more Minutes | 170 (14.1%) | 0 (0.0%) |
Time of Departure to Work by Sex in Gas City
The most frequent times of departure to work in Gas City are 6:30 AM to 6:59 AM (308, 25.6%) for males and 7:30 AM to 7:59 AM (211, 17.3%) for females.
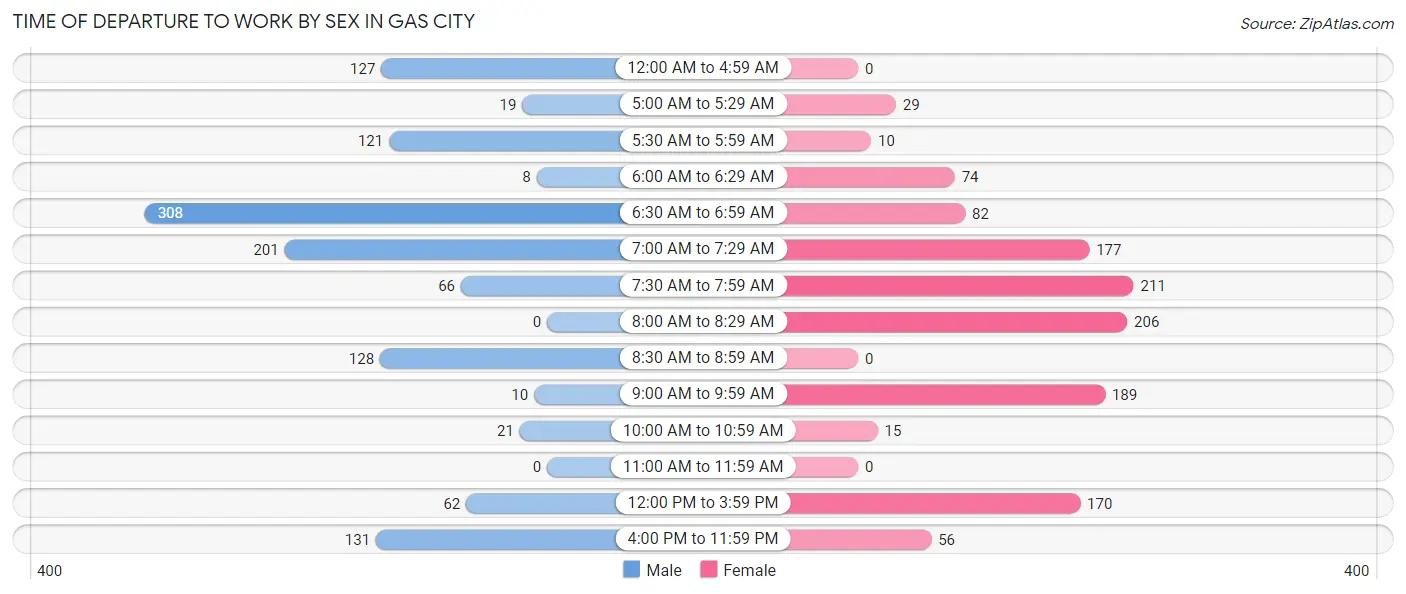
| Time of Departure | Male | Female |
| 12:00 AM to 4:59 AM | 127 (10.6%) | 0 (0.0%) |
| 5:00 AM to 5:29 AM | 19 (1.6%) | 29 (2.4%) |
| 5:30 AM to 5:59 AM | 121 (10.1%) | 10 (0.8%) |
| 6:00 AM to 6:29 AM | 8 (0.7%) | 74 (6.1%) |
| 6:30 AM to 6:59 AM | 308 (25.6%) | 82 (6.7%) |
| 7:00 AM to 7:29 AM | 201 (16.7%) | 177 (14.5%) |
| 7:30 AM to 7:59 AM | 66 (5.5%) | 211 (17.3%) |
| 8:00 AM to 8:29 AM | 0 (0.0%) | 206 (16.9%) |
| 8:30 AM to 8:59 AM | 128 (10.6%) | 0 (0.0%) |
| 9:00 AM to 9:59 AM | 10 (0.8%) | 189 (15.5%) |
| 10:00 AM to 10:59 AM | 21 (1.8%) | 15 (1.2%) |
| 11:00 AM to 11:59 AM | 0 (0.0%) | 0 (0.0%) |
| 12:00 PM to 3:59 PM | 62 (5.2%) | 170 (14.0%) |
| 4:00 PM to 11:59 PM | 131 (10.9%) | 56 (4.6%) |
| Total | 1,202 (100.0%) | 1,219 (100.0%) |
Housing Occupancy in Gas City
Occupancy by Ownership in Gas City
Of the total 2,562 dwellings in Gas City, owner-occupied units account for 1,949 (76.1%), while renter-occupied units make up 613 (23.9%).
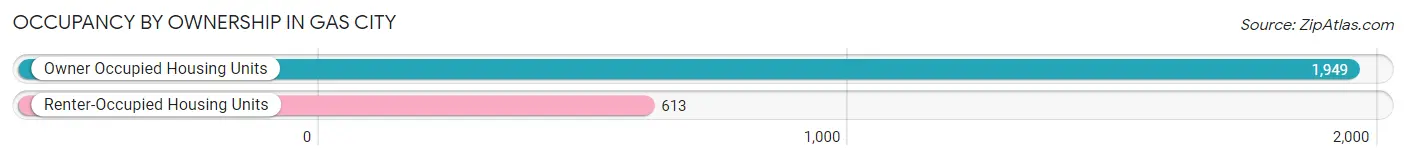
| Occupancy | # Housing Units | % Housing Units |
| Owner Occupied Housing Units | 1,949 | 76.1% |
| Renter-Occupied Housing Units | 613 | 23.9% |
| Total Occupied Housing Units | 2,562 | 100.0% |
Occupancy by Household Size in Gas City
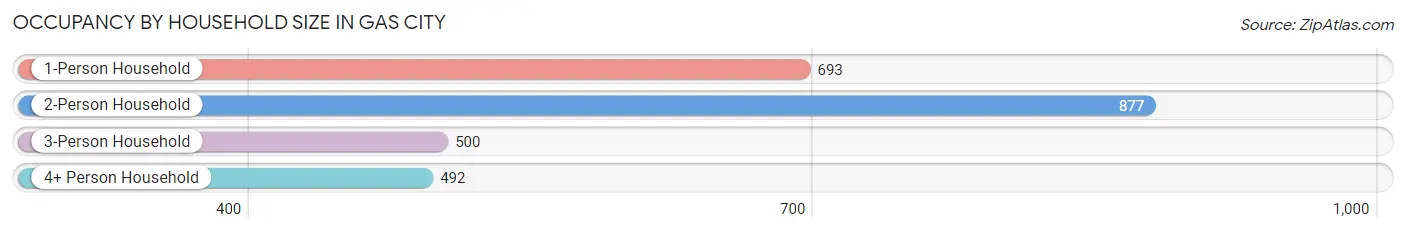
| Household Size | # Housing Units | % Housing Units |
| 1-Person Household | 693 | 27.1% |
| 2-Person Household | 877 | 34.2% |
| 3-Person Household | 500 | 19.5% |
| 4+ Person Household | 492 | 19.2% |
| Total Housing Units | 2,562 | 100.0% |
Occupancy by Ownership by Household Size in Gas City
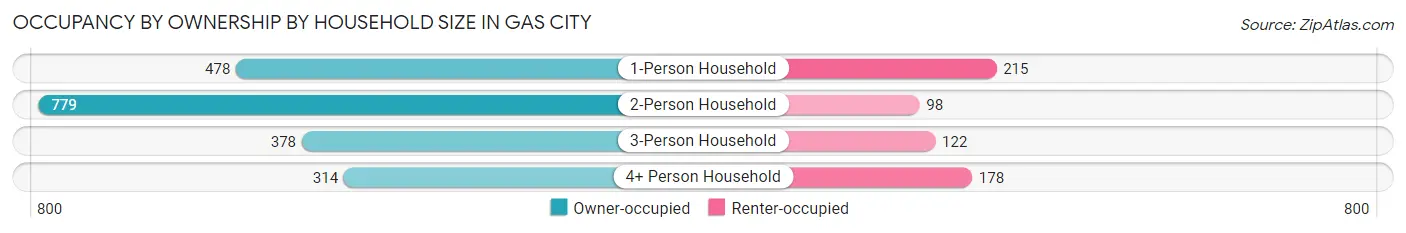
| Household Size | Owner-occupied | Renter-occupied |
| 1-Person Household | 478 (69.0%) | 215 (31.0%) |
| 2-Person Household | 779 (88.8%) | 98 (11.2%) |
| 3-Person Household | 378 (75.6%) | 122 (24.4%) |
| 4+ Person Household | 314 (63.8%) | 178 (36.2%) |
| Total Housing Units | 1,949 (76.1%) | 613 (23.9%) |
Occupancy by Educational Attainment in Gas City
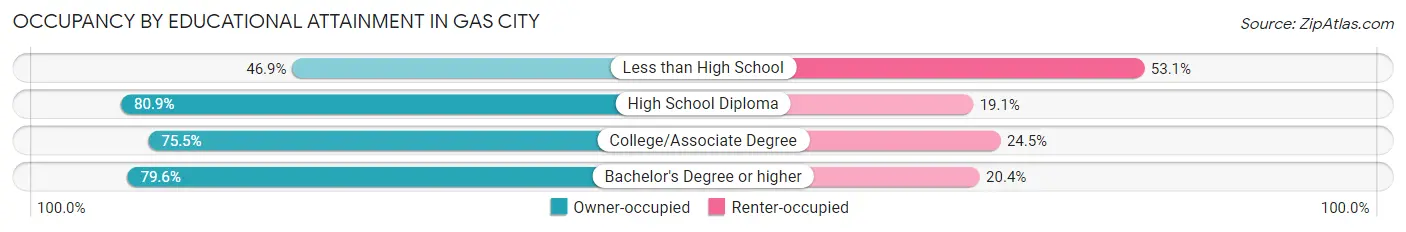
| Household Size | Owner-occupied | Renter-occupied |
| Less than High School | 107 (46.9%) | 121 (53.1%) |
| High School Diploma | 883 (80.9%) | 209 (19.1%) |
| College/Associate Degree | 538 (75.5%) | 175 (24.5%) |
| Bachelor's Degree or higher | 421 (79.6%) | 108 (20.4%) |
Occupancy by Age of Householder in Gas City
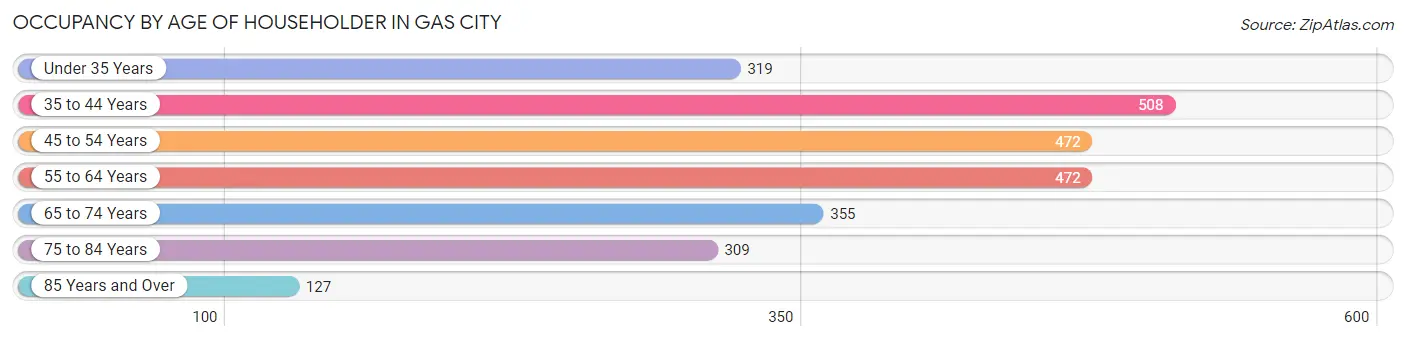
| Age Bracket | # Households | % Households |
| Under 35 Years | 319 | 12.4% |
| 35 to 44 Years | 508 | 19.8% |
| 45 to 54 Years | 472 | 18.4% |
| 55 to 64 Years | 472 | 18.4% |
| 65 to 74 Years | 355 | 13.9% |
| 75 to 84 Years | 309 | 12.1% |
| 85 Years and Over | 127 | 5.0% |
| Total | 2,562 | 100.0% |
Housing Finances in Gas City
Median Income by Occupancy in Gas City
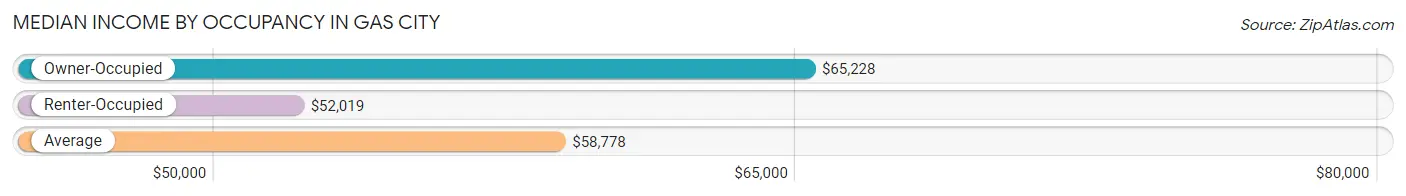
| Occupancy Type | # Households | Median Income |
| Owner-Occupied | 1,949 (76.1%) | $65,228 |
| Renter-Occupied | 613 (23.9%) | $52,019 |
| Average | 2,562 (100.0%) | $58,778 |
Occupancy by Householder Income Bracket in Gas City
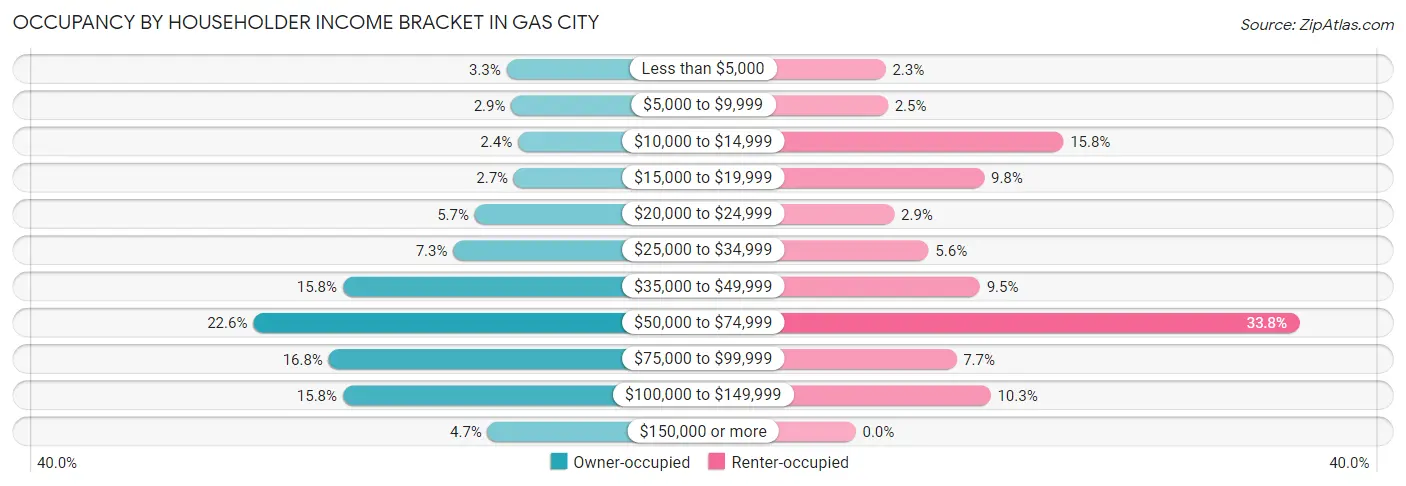
| Income Bracket | Owner-occupied | Renter-occupied |
| Less than $5,000 | 64 (3.3%) | 14 (2.3%) |
| $5,000 to $9,999 | 57 (2.9%) | 15 (2.5%) |
| $10,000 to $14,999 | 47 (2.4%) | 97 (15.8%) |
| $15,000 to $19,999 | 53 (2.7%) | 60 (9.8%) |
| $20,000 to $24,999 | 111 (5.7%) | 18 (2.9%) |
| $25,000 to $34,999 | 143 (7.3%) | 34 (5.6%) |
| $35,000 to $49,999 | 307 (15.8%) | 58 (9.5%) |
| $50,000 to $74,999 | 440 (22.6%) | 207 (33.8%) |
| $75,000 to $99,999 | 328 (16.8%) | 47 (7.7%) |
| $100,000 to $149,999 | 307 (15.8%) | 63 (10.3%) |
| $150,000 or more | 92 (4.7%) | 0 (0.0%) |
| Total | 1,949 (100.0%) | 613 (100.0%) |
Monthly Housing Cost Tiers in Gas City
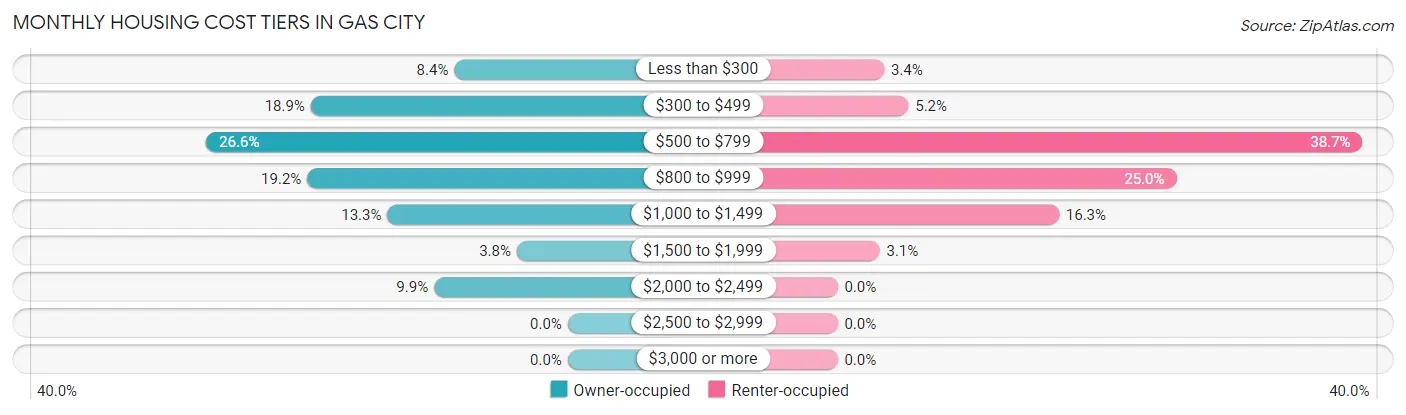
| Monthly Cost | Owner-occupied | Renter-occupied |
| Less than $300 | 163 (8.4%) | 21 (3.4%) |
| $300 to $499 | 369 (18.9%) | 32 (5.2%) |
| $500 to $799 | 519 (26.6%) | 237 (38.7%) |
| $800 to $999 | 374 (19.2%) | 153 (25.0%) |
| $1,000 to $1,499 | 259 (13.3%) | 100 (16.3%) |
| $1,500 to $1,999 | 73 (3.7%) | 19 (3.1%) |
| $2,000 to $2,499 | 192 (9.9%) | 0 (0.0%) |
| $2,500 to $2,999 | 0 (0.0%) | 0 (0.0%) |
| $3,000 or more | 0 (0.0%) | 0 (0.0%) |
| Total | 1,949 (100.0%) | 613 (100.0%) |
Physical Housing Characteristics in Gas City
Housing Structures in Gas City
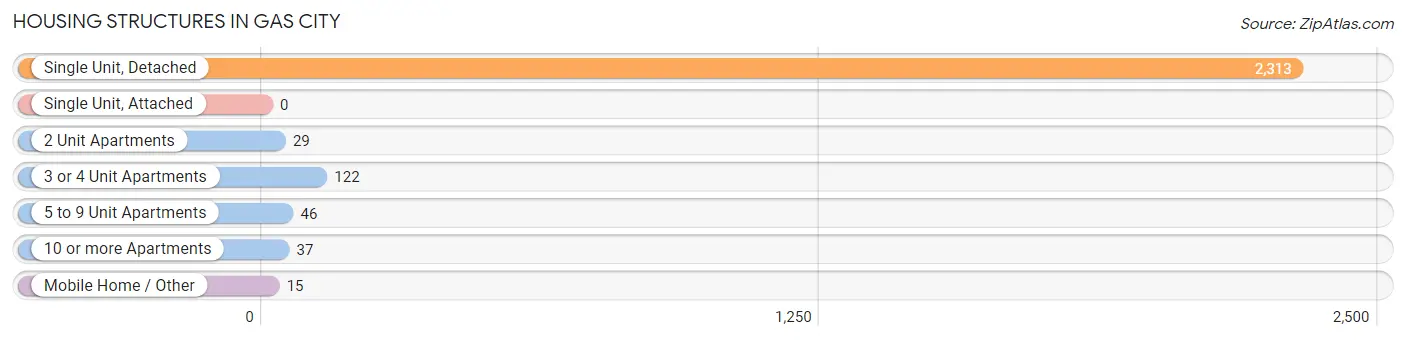
| Structure Type | # Housing Units | % Housing Units |
| Single Unit, Detached | 2,313 | 90.3% |
| Single Unit, Attached | 0 | 0.0% |
| 2 Unit Apartments | 29 | 1.1% |
| 3 or 4 Unit Apartments | 122 | 4.8% |
| 5 to 9 Unit Apartments | 46 | 1.8% |
| 10 or more Apartments | 37 | 1.4% |
| Mobile Home / Other | 15 | 0.6% |
| Total | 2,562 | 100.0% |
Housing Structures by Occupancy in Gas City
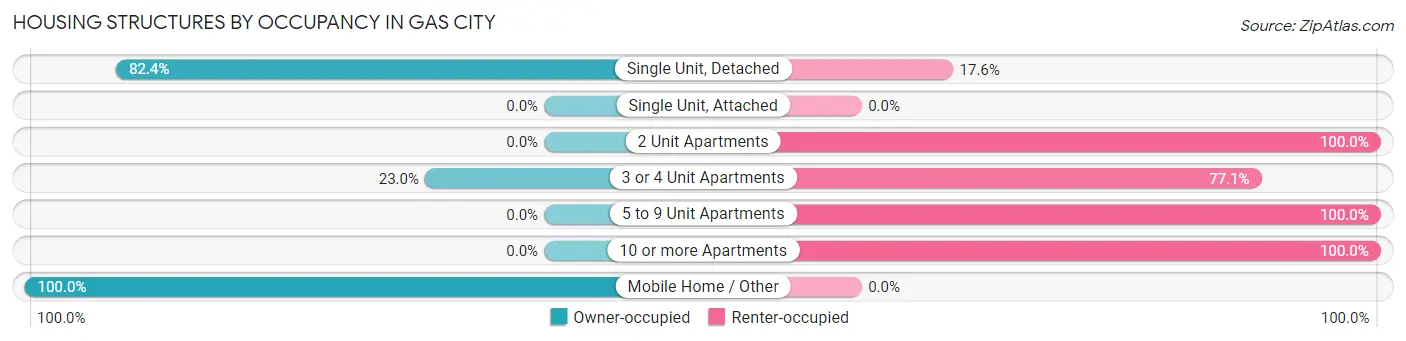
| Structure Type | Owner-occupied | Renter-occupied |
| Single Unit, Detached | 1,906 (82.4%) | 407 (17.6%) |
| Single Unit, Attached | 0 (0.0%) | 0 (0.0%) |
| 2 Unit Apartments | 0 (0.0%) | 29 (100.0%) |
| 3 or 4 Unit Apartments | 28 (23.0%) | 94 (77.0%) |
| 5 to 9 Unit Apartments | 0 (0.0%) | 46 (100.0%) |
| 10 or more Apartments | 0 (0.0%) | 37 (100.0%) |
| Mobile Home / Other | 15 (100.0%) | 0 (0.0%) |
| Total | 1,949 (76.1%) | 613 (23.9%) |
Housing Structures by Number of Rooms in Gas City
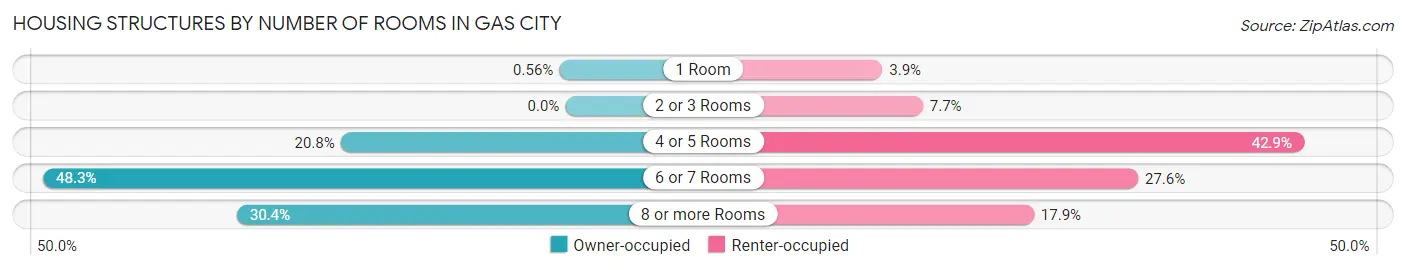
| Number of Rooms | Owner-occupied | Renter-occupied |
| 1 Room | 11 (0.6%) | 24 (3.9%) |
| 2 or 3 Rooms | 0 (0.0%) | 47 (7.7%) |
| 4 or 5 Rooms | 405 (20.8%) | 263 (42.9%) |
| 6 or 7 Rooms | 941 (48.3%) | 169 (27.6%) |
| 8 or more Rooms | 592 (30.4%) | 110 (17.9%) |
| Total | 1,949 (100.0%) | 613 (100.0%) |
Housing Structure by Heating Type in Gas City
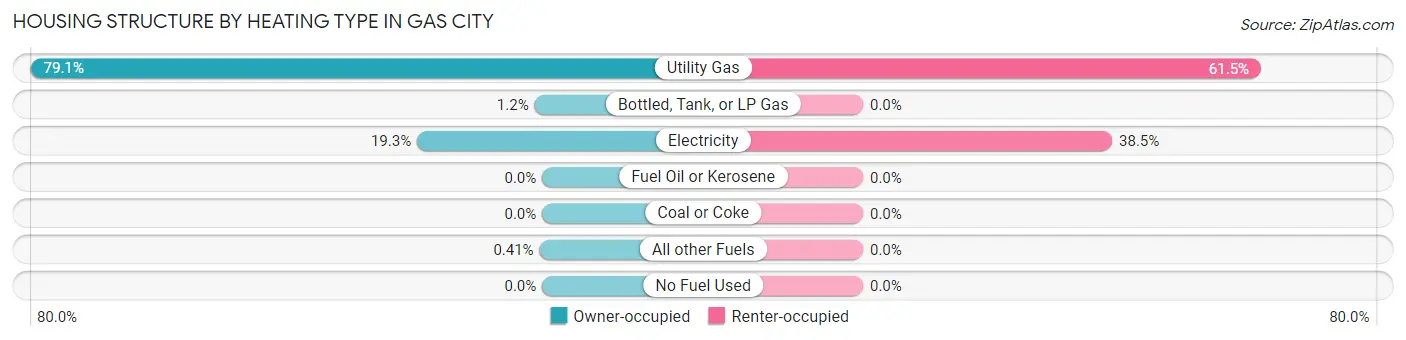
| Heating Type | Owner-occupied | Renter-occupied |
| Utility Gas | 1,541 (79.1%) | 377 (61.5%) |
| Bottled, Tank, or LP Gas | 23 (1.2%) | 0 (0.0%) |
| Electricity | 377 (19.3%) | 236 (38.5%) |
| Fuel Oil or Kerosene | 0 (0.0%) | 0 (0.0%) |
| Coal or Coke | 0 (0.0%) | 0 (0.0%) |
| All other Fuels | 8 (0.4%) | 0 (0.0%) |
| No Fuel Used | 0 (0.0%) | 0 (0.0%) |
| Total | 1,949 (100.0%) | 613 (100.0%) |
Household Vehicle Usage in Gas City
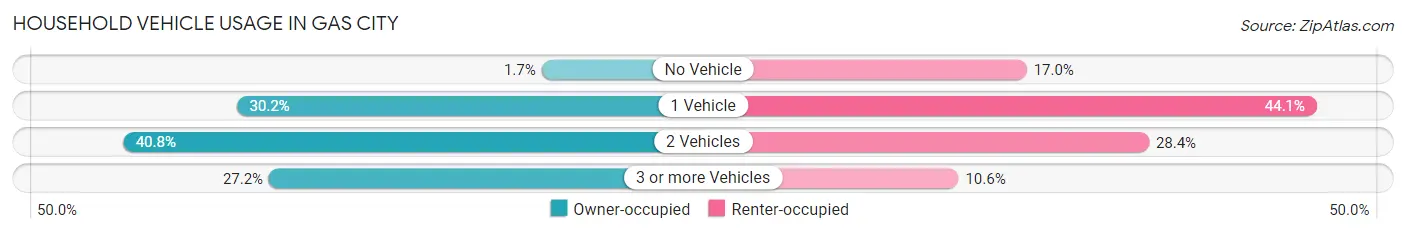
| Vehicles per Household | Owner-occupied | Renter-occupied |
| No Vehicle | 34 (1.7%) | 104 (17.0%) |
| 1 Vehicle | 589 (30.2%) | 270 (44.1%) |
| 2 Vehicles | 796 (40.8%) | 174 (28.4%) |
| 3 or more Vehicles | 530 (27.2%) | 65 (10.6%) |
| Total | 1,949 (100.0%) | 613 (100.0%) |
Real Estate & Mortgages in Gas City
Real Estate and Mortgage Overview in Gas City
| Characteristic | Without Mortgage | With Mortgage |
| Housing Units | 766 | 1,183 |
| Median Property Value | $102,400 | $121,800 |
| Median Household Income | $43,750 | $49 |
| Monthly Housing Costs | $365 | $0 |
| Real Estate Taxes | $682 | $47 |
Property Value by Mortgage Status in Gas City
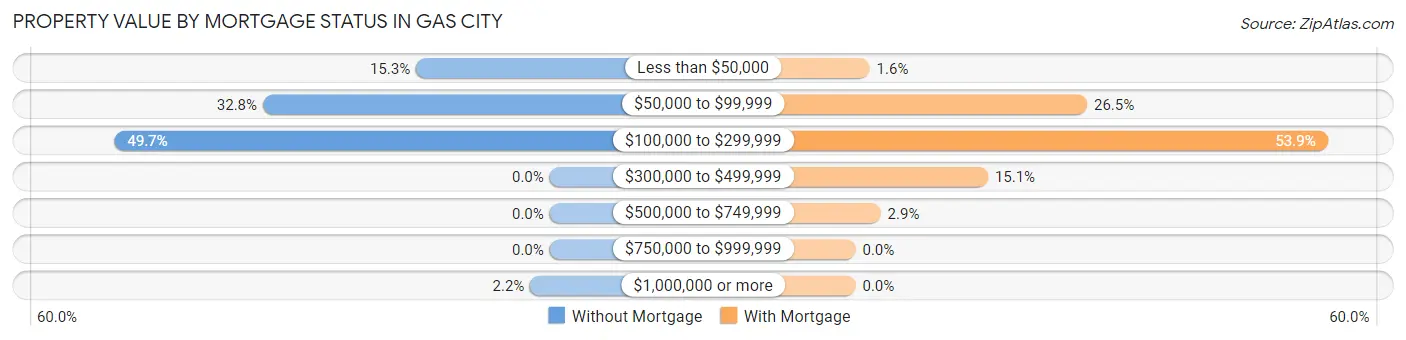
| Property Value | Without Mortgage | With Mortgage |
| Less than $50,000 | 117 (15.3%) | 19 (1.6%) |
| $50,000 to $99,999 | 251 (32.8%) | 313 (26.5%) |
| $100,000 to $299,999 | 381 (49.7%) | 638 (53.9%) |
| $300,000 to $499,999 | 0 (0.0%) | 179 (15.1%) |
| $500,000 to $749,999 | 0 (0.0%) | 34 (2.9%) |
| $750,000 to $999,999 | 0 (0.0%) | 0 (0.0%) |
| $1,000,000 or more | 17 (2.2%) | 0 (0.0%) |
| Total | 766 (100.0%) | 1,183 (100.0%) |
Household Income by Mortgage Status in Gas City
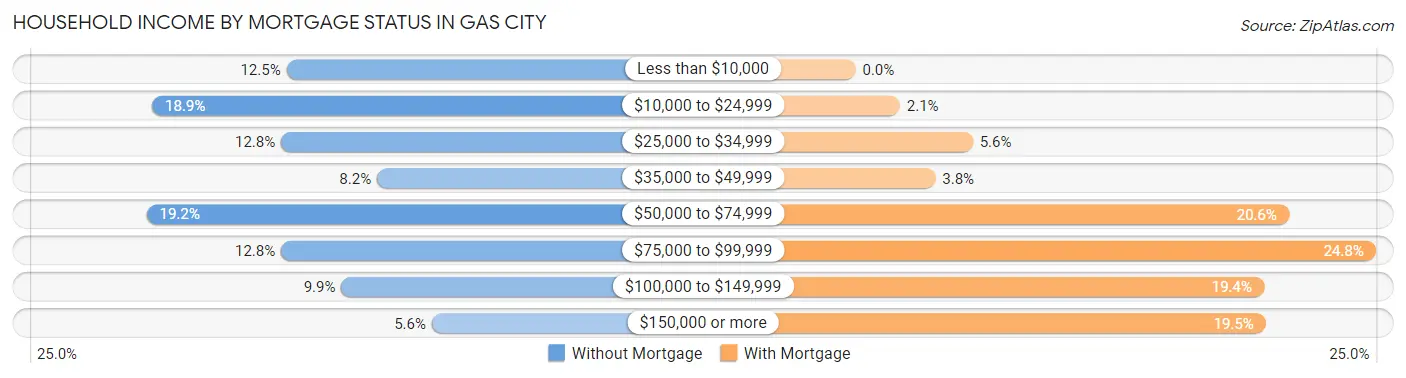
| Household Income | Without Mortgage | With Mortgage |
| Less than $10,000 | 96 (12.5%) | 0 (0.0%) |
| $10,000 to $24,999 | 145 (18.9%) | 25 (2.1%) |
| $25,000 to $34,999 | 98 (12.8%) | 66 (5.6%) |
| $35,000 to $49,999 | 63 (8.2%) | 45 (3.8%) |
| $50,000 to $74,999 | 147 (19.2%) | 244 (20.6%) |
| $75,000 to $99,999 | 98 (12.8%) | 293 (24.8%) |
| $100,000 to $149,999 | 76 (9.9%) | 230 (19.4%) |
| $150,000 or more | 43 (5.6%) | 231 (19.5%) |
| Total | 766 (100.0%) | 1,183 (100.0%) |
Property Value to Household Income Ratio in Gas City
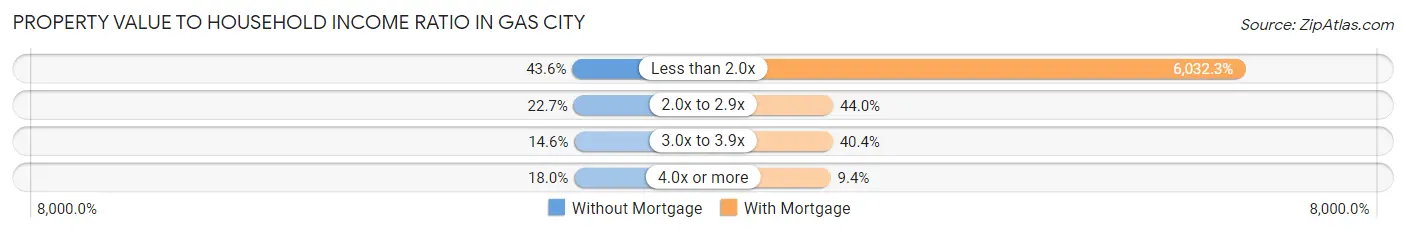
| Value-to-Income Ratio | Without Mortgage | With Mortgage |
| Less than 2.0x | 334 (43.6%) | 71,362 (6,032.3%) |
| 2.0x to 2.9x | 174 (22.7%) | 521 (44.0%) |
| 3.0x to 3.9x | 112 (14.6%) | 478 (40.4%) |
| 4.0x or more | 138 (18.0%) | 111 (9.4%) |
| Total | 766 (100.0%) | 1,183 (100.0%) |
Real Estate Taxes by Mortgage Status in Gas City
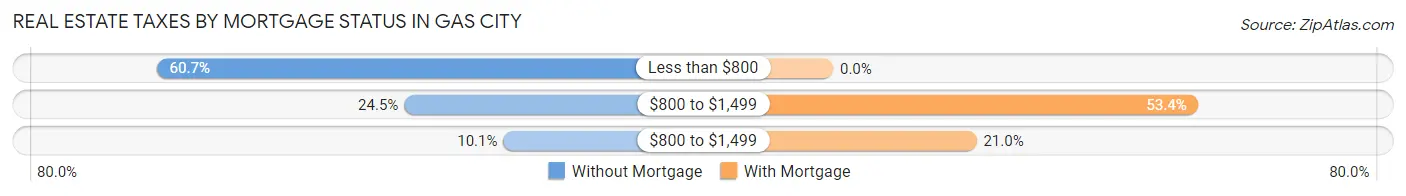
| Property Taxes | Without Mortgage | With Mortgage |
| Less than $800 | 465 (60.7%) | 0 (0.0%) |
| $800 to $1,499 | 188 (24.5%) | 632 (53.4%) |
| $800 to $1,499 | 77 (10.1%) | 248 (21.0%) |
| Total | 766 (100.0%) | 1,183 (100.0%) |
Health & Disability in Gas City
Health Insurance Coverage by Age in Gas City
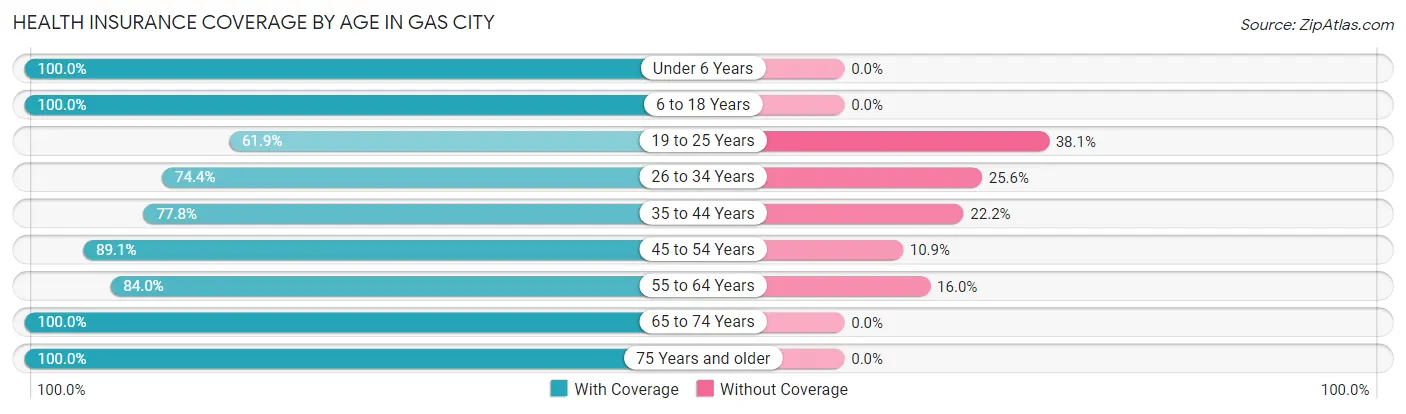
| Age Bracket | With Coverage | Without Coverage |
| Under 6 Years | 356 (100.0%) | 0 (0.0%) |
| 6 to 18 Years | 1,274 (100.0%) | 0 (0.0%) |
| 19 to 25 Years | 112 (61.9%) | 69 (38.1%) |
| 26 to 34 Years | 409 (74.4%) | 141 (25.6%) |
| 35 to 44 Years | 557 (77.8%) | 159 (22.2%) |
| 45 to 54 Years | 727 (89.1%) | 89 (10.9%) |
| 55 to 64 Years | 640 (84.0%) | 122 (16.0%) |
| 65 to 74 Years | 614 (100.0%) | 0 (0.0%) |
| 75 Years and older | 761 (100.0%) | 0 (0.0%) |
| Total | 5,450 (90.4%) | 580 (9.6%) |
Health Insurance Coverage by Citizenship Status in Gas City

| Citizenship Status | With Coverage | Without Coverage |
| Native Born | 356 (100.0%) | 0 (0.0%) |
| Foreign Born, Citizen | 1,274 (100.0%) | 0 (0.0%) |
| Foreign Born, not a Citizen | 112 (61.9%) | 69 (38.1%) |
Health Insurance Coverage by Household Income in Gas City
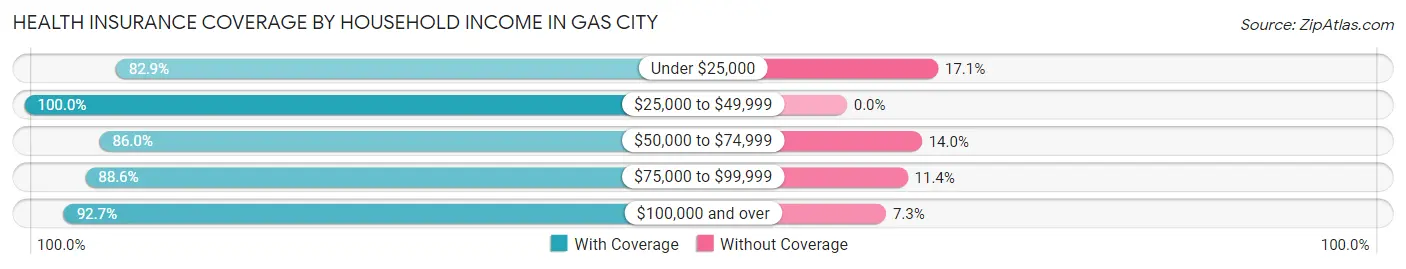
| Household Income | With Coverage | Without Coverage |
| Under $25,000 | 645 (82.9%) | 133 (17.1%) |
| $25,000 to $49,999 | 1,235 (100.0%) | 0 (0.0%) |
| $50,000 to $74,999 | 1,506 (86.0%) | 246 (14.0%) |
| $75,000 to $99,999 | 770 (88.6%) | 99 (11.4%) |
| $100,000 and over | 1,287 (92.7%) | 102 (7.3%) |
Public vs Private Health Insurance Coverage by Age in Gas City
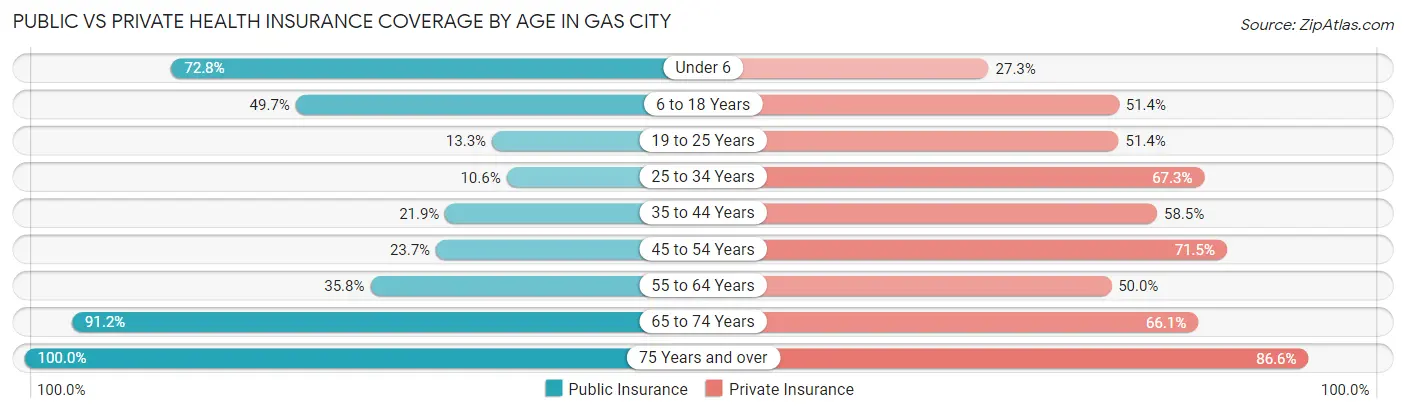
| Age Bracket | Public Insurance | Private Insurance |
| Under 6 | 259 (72.8%) | 97 (27.3%) |
| 6 to 18 Years | 633 (49.7%) | 655 (51.4%) |
| 19 to 25 Years | 24 (13.3%) | 93 (51.4%) |
| 25 to 34 Years | 58 (10.5%) | 370 (67.3%) |
| 35 to 44 Years | 157 (21.9%) | 419 (58.5%) |
| 45 to 54 Years | 193 (23.6%) | 583 (71.5%) |
| 55 to 64 Years | 273 (35.8%) | 381 (50.0%) |
| 65 to 74 Years | 560 (91.2%) | 406 (66.1%) |
| 75 Years and over | 761 (100.0%) | 659 (86.6%) |
| Total | 2,918 (48.4%) | 3,663 (60.8%) |
Disability Status by Sex by Age in Gas City
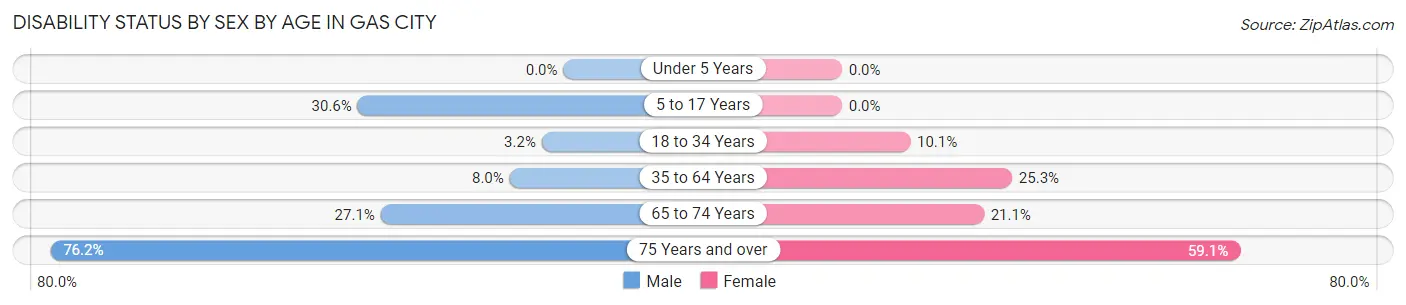
| Age Bracket | Male | Female |
| Under 5 Years | 0 (0.0%) | 0 (0.0%) |
| 5 to 17 Years | 128 (30.5%) | 0 (0.0%) |
| 18 to 34 Years | 19 (3.2%) | 32 (10.1%) |
| 35 to 64 Years | 76 (8.0%) | 339 (25.3%) |
| 65 to 74 Years | 70 (27.1%) | 75 (21.1%) |
| 75 Years and over | 304 (76.2%) | 214 (59.1%) |
Disability Class by Sex by Age in Gas City
Disability Class: Hearing Difficulty
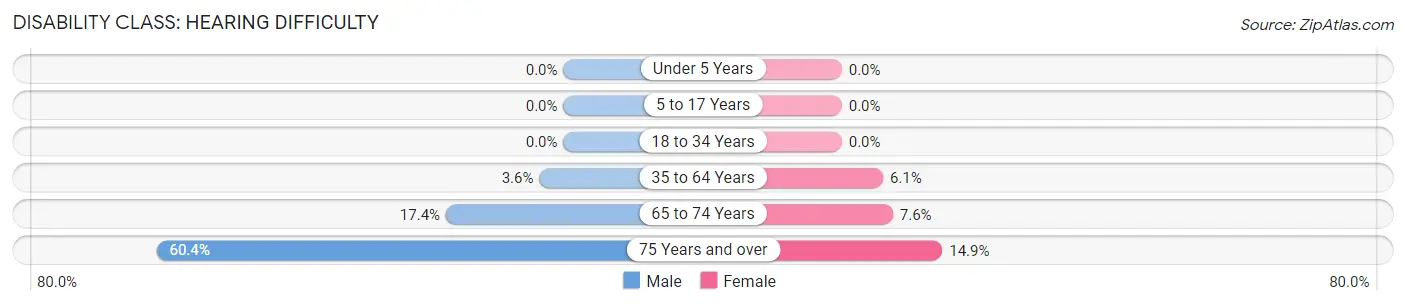
| Age Bracket | Male | Female |
| Under 5 Years | 0 (0.0%) | 0 (0.0%) |
| 5 to 17 Years | 0 (0.0%) | 0 (0.0%) |
| 18 to 34 Years | 0 (0.0%) | 0 (0.0%) |
| 35 to 64 Years | 34 (3.6%) | 82 (6.1%) |
| 65 to 74 Years | 45 (17.4%) | 27 (7.6%) |
| 75 Years and over | 241 (60.4%) | 54 (14.9%) |
Disability Class: Vision Difficulty
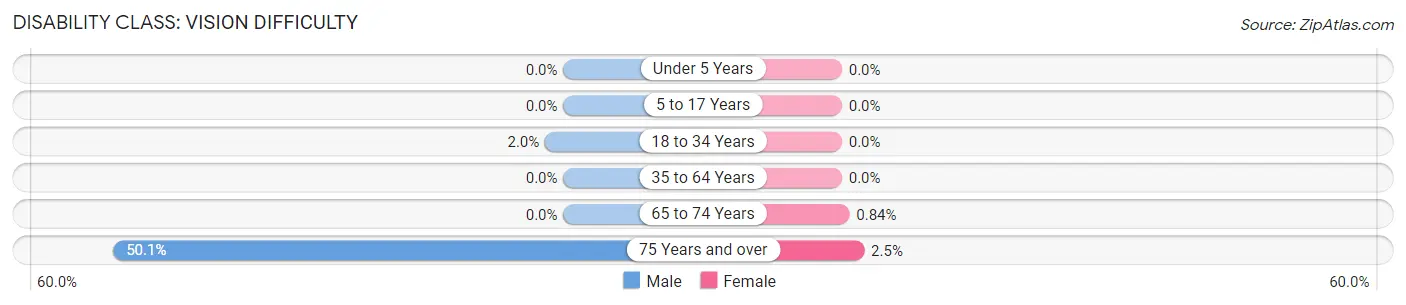
| Age Bracket | Male | Female |
| Under 5 Years | 0 (0.0%) | 0 (0.0%) |
| 5 to 17 Years | 0 (0.0%) | 0 (0.0%) |
| 18 to 34 Years | 12 (2.0%) | 0 (0.0%) |
| 35 to 64 Years | 0 (0.0%) | 0 (0.0%) |
| 65 to 74 Years | 0 (0.0%) | 3 (0.8%) |
| 75 Years and over | 200 (50.1%) | 9 (2.5%) |
Disability Class: Cognitive Difficulty
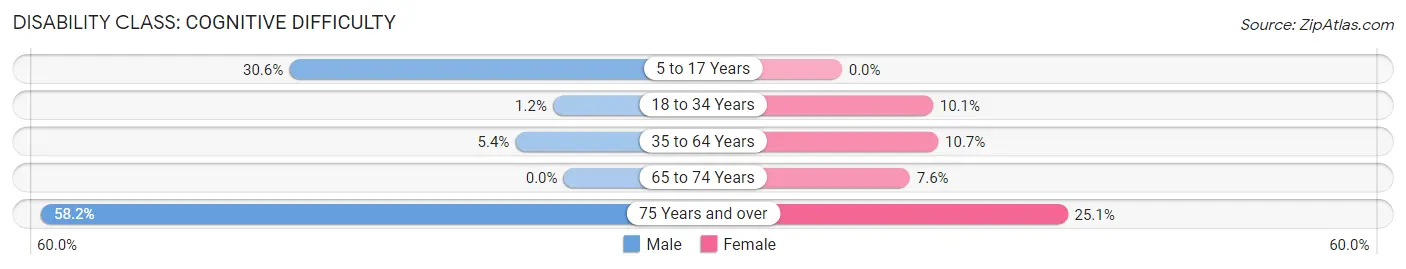
| Age Bracket | Male | Female |
| 5 to 17 Years | 128 (30.5%) | 0 (0.0%) |
| 18 to 34 Years | 7 (1.2%) | 32 (10.1%) |
| 35 to 64 Years | 51 (5.4%) | 144 (10.7%) |
| 65 to 74 Years | 0 (0.0%) | 27 (7.6%) |
| 75 Years and over | 232 (58.2%) | 91 (25.1%) |
Disability Class: Ambulatory Difficulty
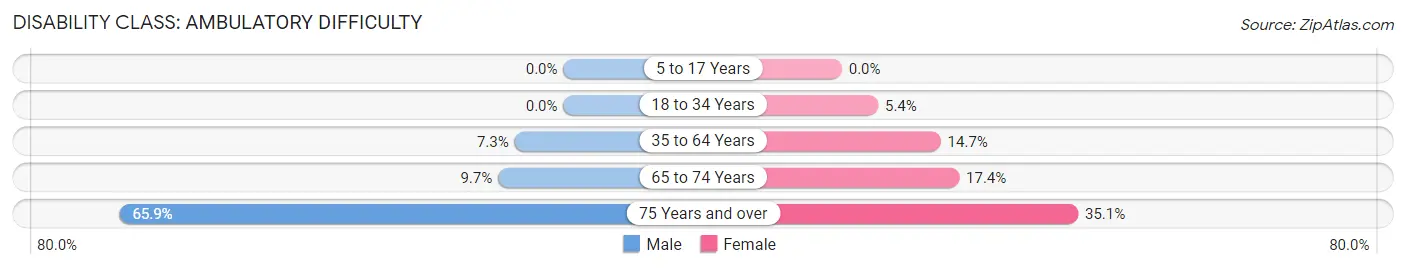
| Age Bracket | Male | Female |
| 5 to 17 Years | 0 (0.0%) | 0 (0.0%) |
| 18 to 34 Years | 0 (0.0%) | 17 (5.4%) |
| 35 to 64 Years | 69 (7.2%) | 197 (14.7%) |
| 65 to 74 Years | 25 (9.7%) | 62 (17.4%) |
| 75 Years and over | 263 (65.9%) | 127 (35.1%) |
Disability Class: Self-Care Difficulty
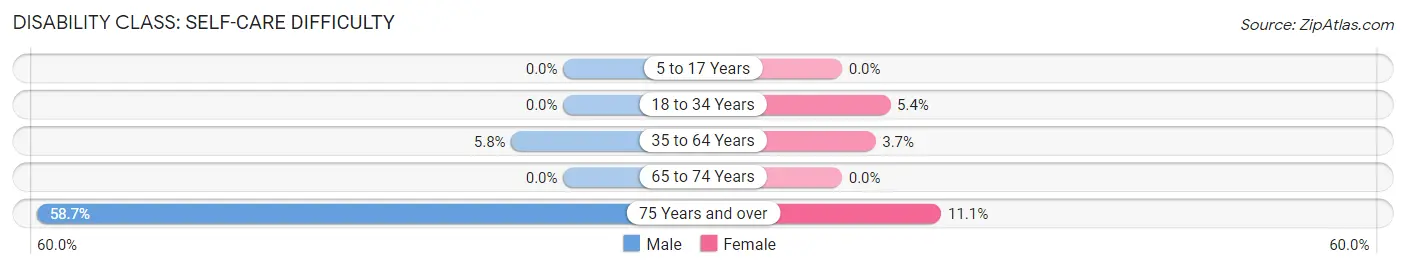
| Age Bracket | Male | Female |
| 5 to 17 Years | 0 (0.0%) | 0 (0.0%) |
| 18 to 34 Years | 0 (0.0%) | 17 (5.4%) |
| 35 to 64 Years | 55 (5.8%) | 50 (3.7%) |
| 65 to 74 Years | 0 (0.0%) | 0 (0.0%) |
| 75 Years and over | 234 (58.7%) | 40 (11.1%) |
Technology Access in Gas City
Computing Device Access in Gas City
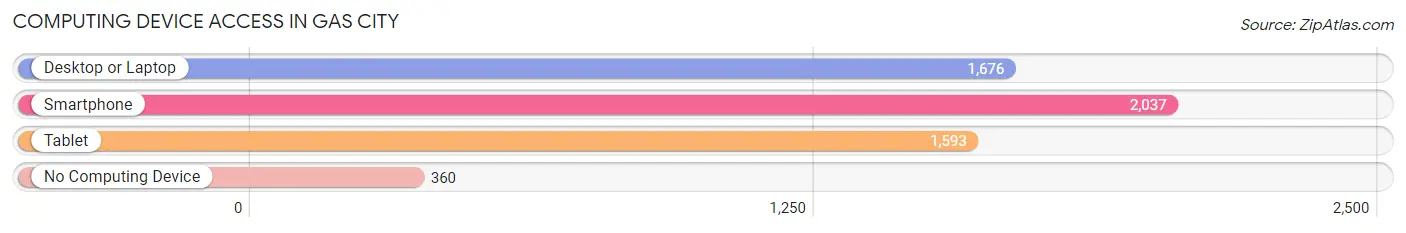
| Device Type | # Households | % Households |
| Desktop or Laptop | 1,676 | 65.4% |
| Smartphone | 2,037 | 79.5% |
| Tablet | 1,593 | 62.2% |
| No Computing Device | 360 | 14.1% |
| Total | 2,562 | 100.0% |
Internet Access in Gas City
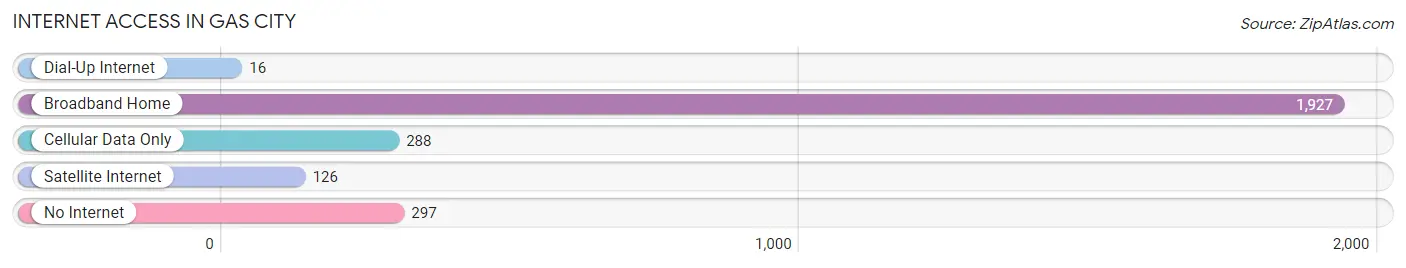
| Internet Type | # Households | % Households |
| Dial-Up Internet | 16 | 0.6% |
| Broadband Home | 1,927 | 75.2% |
| Cellular Data Only | 288 | 11.2% |
| Satellite Internet | 126 | 4.9% |
| No Internet | 297 | 11.6% |
| Total | 2,562 | 100.0% |
Gas City Summary
City of Gas City Indiana
Gas City, Indiana is a small city located in Grant County, Indiana. It is situated along the Mississinewa River, approximately 20 miles northeast of Marion, Indiana. The city was founded in 1887 and incorporated in 1895. As of the 2010 census, the population of Gas City was 3,921.
History
The area that is now Gas City was originally inhabited by the Miami Indians. The first settlers arrived in the area in the early 1800s. The city was founded in 1887 by the Gas City Land Company, which was formed by a group of investors from Marion, Indiana. The company purchased the land from the Miami Indians and began to develop the area. The city was named after the natural gas that was discovered in the area.
The first post office was established in 1887 and the city was officially incorporated in 1895. The city quickly grew and by the early 1900s, it had become a thriving industrial center. The city was home to several factories, including a glass factory, a brick factory, and a canning factory.
Geography
Gas City is located in Grant County, Indiana, approximately 20 miles northeast of Marion, Indiana. The city is situated along the Mississinewa River. The city has a total area of 2.2 square miles, all of which is land.
Economy
Gas City is a small city with a population of just over 3,900 people. The city’s economy is largely based on manufacturing and agriculture. The city is home to several factories, including a glass factory, a brick factory, and a canning factory. The city is also home to several agricultural businesses, including a dairy farm and a grain elevator.
Demographics
As of the 2010 census, the population of Gas City was 3,921. The racial makeup of the city was 95.3% White, 0.7% African American, 0.3% Native American, 0.4% Asian, 0.1% Pacific Islander, 1.2% from other races, and 2.0% from two or more races. Hispanic or Latino of any race were 3.2% of the population.
The median income for a household in the city was $37,917, and the median income for a family was $45,938. The per capita income for the city was $17,945. About 11.2% of families and 14.2% of the population were below the poverty line, including 19.2% of those under age 18 and 8.2% of those age 65 or over.
Conclusion
Gas City, Indiana is a small city located in Grant County, Indiana. It was founded in 1887 and incorporated in 1895. The city’s economy is largely based on manufacturing and agriculture. As of the 2010 census, the population of Gas City was 3,921. The city is home to several factories, including a glass factory, a brick factory, and a canning factory. The city is also home to several agricultural businesses, including a dairy farm and a grain elevator. The median income for a household in the city was $37,917, and the median income for a family was $45,938. About 11.2% of families and 14.2% of the population were below the poverty line.
Common Questions
What is Per Capita Income in Gas City?
Per Capita income in Gas City is $27,670.
What is the Median Family Income in Gas City?
Median Family Income in Gas City is $71,352.
What is the Median Household income in Gas City?
Median Household Income in Gas City is $58,778.
What is Income or Wage Gap in Gas City?
Income or Wage Gap in Gas City is 39.0%.
Women in Gas City earn 61.0 cents for every dollar earned by a man.
What is Inequality or Gini Index in Gas City?
Inequality or Gini Index in Gas City is 0.39.
What is the Total Population of Gas City?
Total Population of Gas City is 6,099.
What is the Total Male Population of Gas City?
Total Male Population of Gas City is 2,735.
What is the Total Female Population of Gas City?
Total Female Population of Gas City is 3,364.
What is the Ratio of Males per 100 Females in Gas City?
There are 81.30 Males per 100 Females in Gas City.
What is the Ratio of Females per 100 Males in Gas City?
There are 123.00 Females per 100 Males in Gas City.
What is the Median Population Age in Gas City?
Median Population Age in Gas City is 44.7 Years.
What is the Average Family Size in Gas City
Average Family Size in Gas City is 2.8 People.
What is the Average Household Size in Gas City
Average Household Size in Gas City is 2.4 People.
How Large is the Labor Force in Gas City?
There are 2,891 People in the Labor Forcein in Gas City.
What is the Percentage of People in the Labor Force in Gas City?
57.8% of People are in the Labor Force in Gas City.
What is the Unemployment Rate in Gas City?
Unemployment Rate in Gas City is 10.8%.