Fremont, IN Map & Demographics
Fremont Map
Fremont Overview
$27,874
PER CAPITA INCOME
$61,417
AVG FAMILY INCOME
$57,500
AVG HOUSEHOLD INCOME
45.2%
WAGE / INCOME GAP [ % ]
54.8¢/ $1
WAGE / INCOME GAP [ $ ]
$12,570
FAMILY INCOME DEFICIT
0.36
INEQUALITY / GINI INDEX
2,170
TOTAL POPULATION
1,161
MALE POPULATION
1,009
FEMALE POPULATION
115.06
MALES / 100 FEMALES
86.91
FEMALES / 100 MALES
36.3
MEDIAN AGE
2.9
AVG FAMILY SIZE
2.5
AVG HOUSEHOLD SIZE
1,157
LABOR FORCE [ PEOPLE ]
66.9%
PERCENT IN LABOR FORCE
12.3%
UNEMPLOYMENT RATE
Fremont Zip Codes
Fremont Area Codes
Income in Fremont
Income Overview in Fremont
Per Capita Income in Fremont is $27,874, while median incomes of families and households are $61,417 and $57,500 respectively.
| Characteristic | Number | Measure |
| Per Capita Income | 2,170 | $27,874 |
| Median Family Income | 495 | $61,417 |
| Mean Family Income | 495 | $72,661 |
| Median Household Income | 886 | $57,500 |
| Mean Household Income | 886 | $67,831 |
| Income Deficit | 495 | $12,570 |
| Wage / Income Gap (%) | 2,170 | 45.24% |
| Wage / Income Gap ($) | 2,170 | 54.76¢ per $1 |
| Gini / Inequality Index | 2,170 | 0.36 |
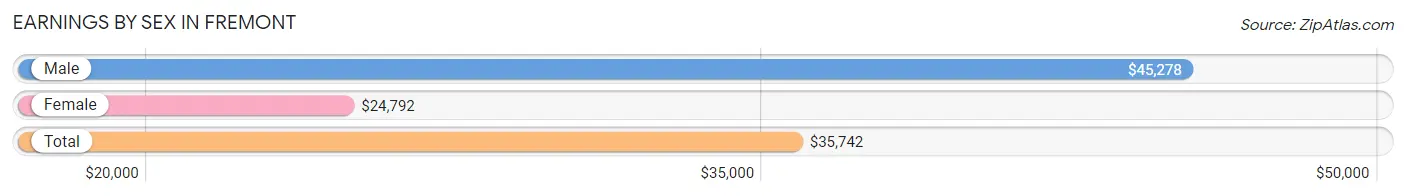
Earnings by Sex in Fremont
Average Earnings in Fremont are $35,742, $45,278 for men and $24,792 for women, a difference of 45.2%.
| Sex | Number | Average Earnings |
| Male | 596 (51.5%) | $45,278 |
| Female | 562 (48.5%) | $24,792 |
| Total | 1,158 (100.0%) | $35,742 |
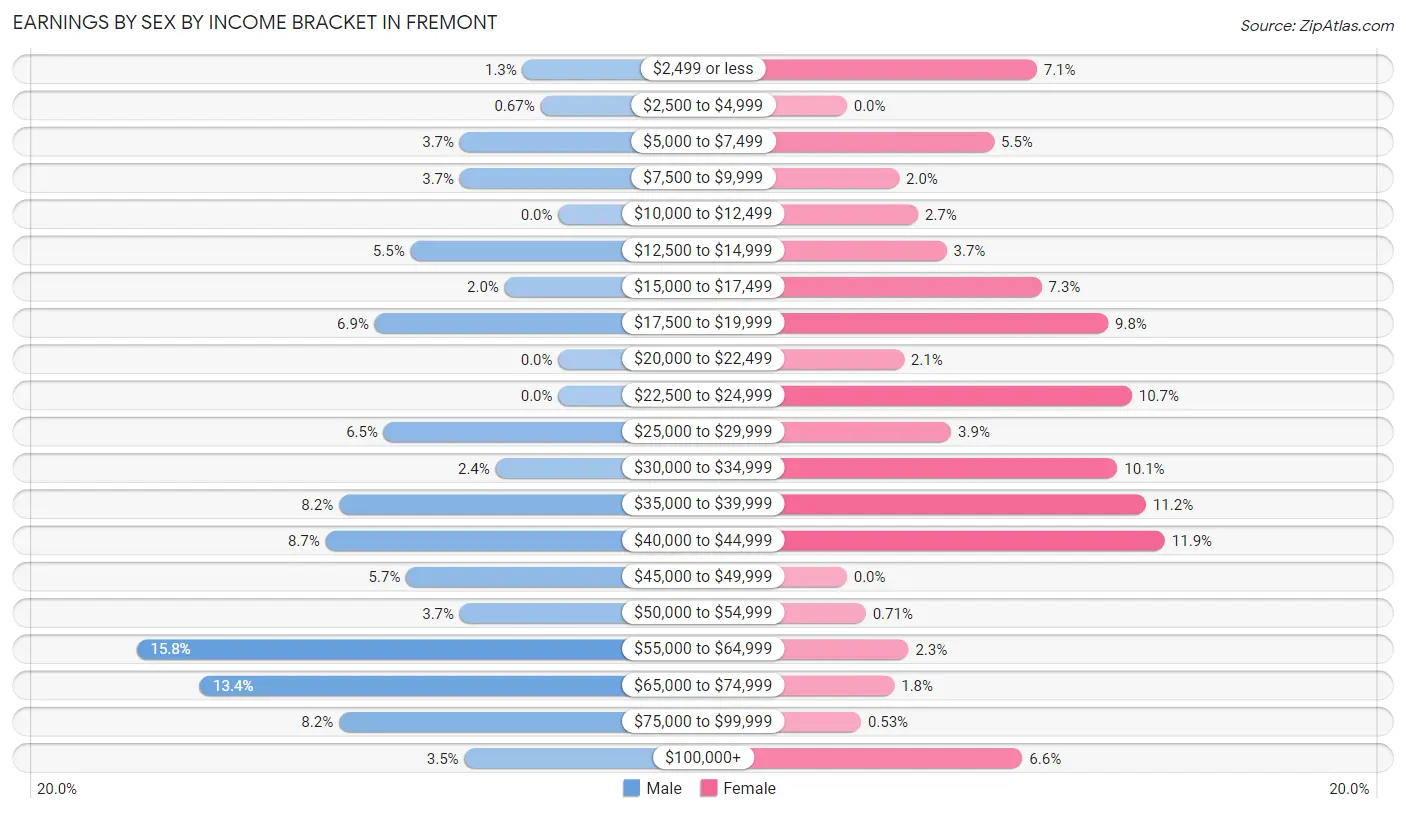
Earnings by Sex by Income Bracket in Fremont
The most common earnings brackets in Fremont are $55,000 to $64,999 for men (94 | 15.8%) and $40,000 to $44,999 for women (67 | 11.9%).
| Income | Male | Female |
| $2,499 or less | 8 (1.3%) | 40 (7.1%) |
| $2,500 to $4,999 | 4 (0.7%) | 0 (0.0%) |
| $5,000 to $7,499 | 22 (3.7%) | 31 (5.5%) |
| $7,500 to $9,999 | 22 (3.7%) | 11 (2.0%) |
| $10,000 to $12,499 | 0 (0.0%) | 15 (2.7%) |
| $12,500 to $14,999 | 33 (5.5%) | 21 (3.7%) |
| $15,000 to $17,499 | 12 (2.0%) | 41 (7.3%) |
| $17,500 to $19,999 | 41 (6.9%) | 55 (9.8%) |
| $20,000 to $22,499 | 0 (0.0%) | 12 (2.1%) |
| $22,500 to $24,999 | 0 (0.0%) | 60 (10.7%) |
| $25,000 to $29,999 | 39 (6.5%) | 22 (3.9%) |
| $30,000 to $34,999 | 14 (2.4%) | 57 (10.1%) |
| $35,000 to $39,999 | 49 (8.2%) | 63 (11.2%) |
| $40,000 to $44,999 | 52 (8.7%) | 67 (11.9%) |
| $45,000 to $49,999 | 34 (5.7%) | 0 (0.0%) |
| $50,000 to $54,999 | 22 (3.7%) | 4 (0.7%) |
| $55,000 to $64,999 | 94 (15.8%) | 13 (2.3%) |
| $65,000 to $74,999 | 80 (13.4%) | 10 (1.8%) |
| $75,000 to $99,999 | 49 (8.2%) | 3 (0.5%) |
| $100,000+ | 21 (3.5%) | 37 (6.6%) |
| Total | 596 (100.0%) | 562 (100.0%) |
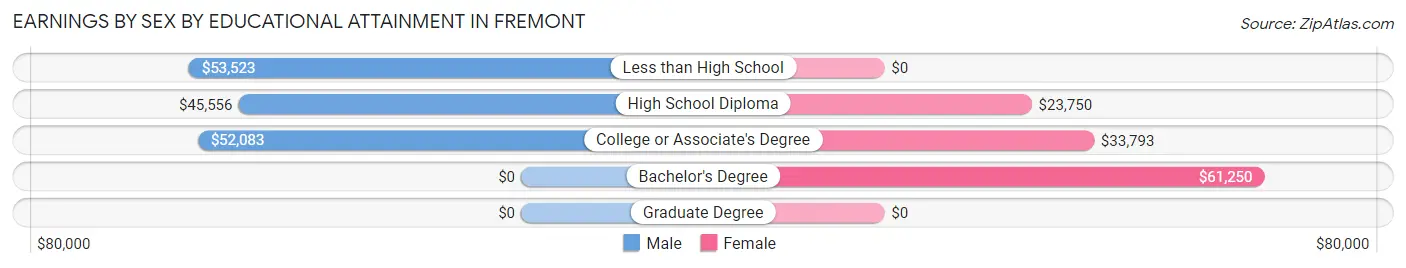
Earnings by Sex by Educational Attainment in Fremont
Average earnings in Fremont are $46,250 for men and $27,750 for women, a difference of 40.0%. Men with an educational attainment of less than high school enjoy the highest average annual earnings of $53,523, while those with high school diploma education earn the least with $45,556. Women with an educational attainment of bachelor's degree earn the most with the average annual earnings of $61,250, while those with high school diploma education have the smallest earnings of $23,750.
| Educational Attainment | Male Income | Female Income |
| Less than High School | $53,523 | $0 |
| High School Diploma | $45,556 | $23,750 |
| College or Associate's Degree | $52,083 | $33,793 |
| Bachelor's Degree | - | - |
| Graduate Degree | - | - |
| Total | $46,250 | $27,750 |
Family Income in Fremont
Family Income Brackets in Fremont
According to the Fremont family income data, there are 140 families falling into the $50,000 to $74,999 income range, which is the most common income bracket and makes up 28.3% of all families.
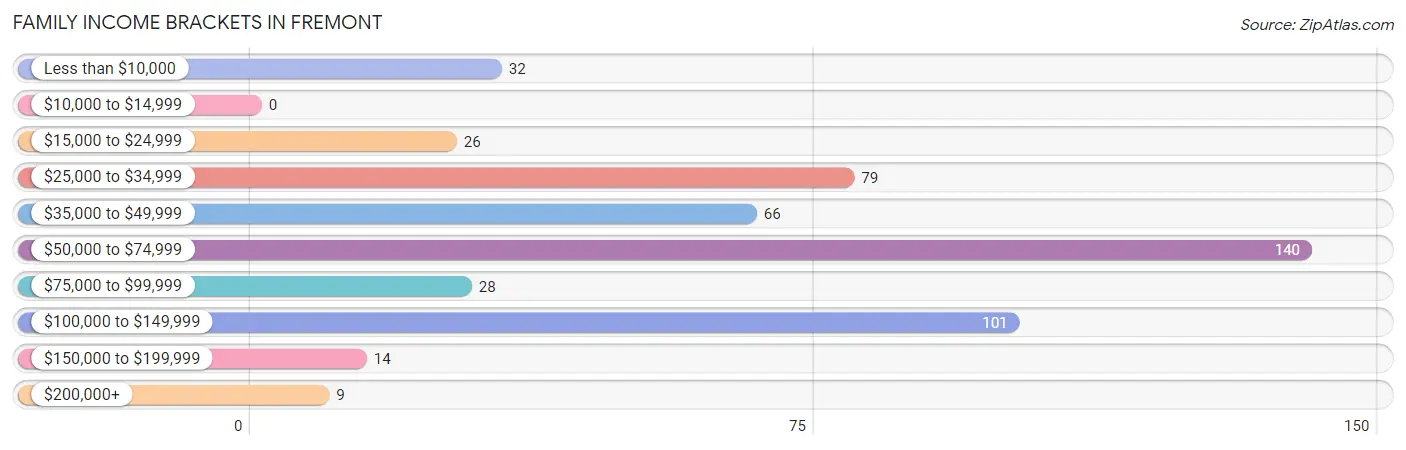
| Income Bracket | # Families | % Families |
| Less than $10,000 | 32 | 6.5% |
| $10,000 to $14,999 | 0 | 0.0% |
| $15,000 to $24,999 | 26 | 5.3% |
| $25,000 to $34,999 | 79 | 16.0% |
| $35,000 to $49,999 | 66 | 13.3% |
| $50,000 to $74,999 | 140 | 28.3% |
| $75,000 to $99,999 | 28 | 5.7% |
| $100,000 to $149,999 | 101 | 20.4% |
| $150,000 to $199,999 | 14 | 2.8% |
| $200,000+ | 9 | 1.8% |
Family Income by Famaliy Size in Fremont
4-person families (44 | 8.9%) account for the highest median family income in Fremont with $66,111 per family, while 2-person families (280 | 56.6%) have the highest median income of $28,842 per family member.
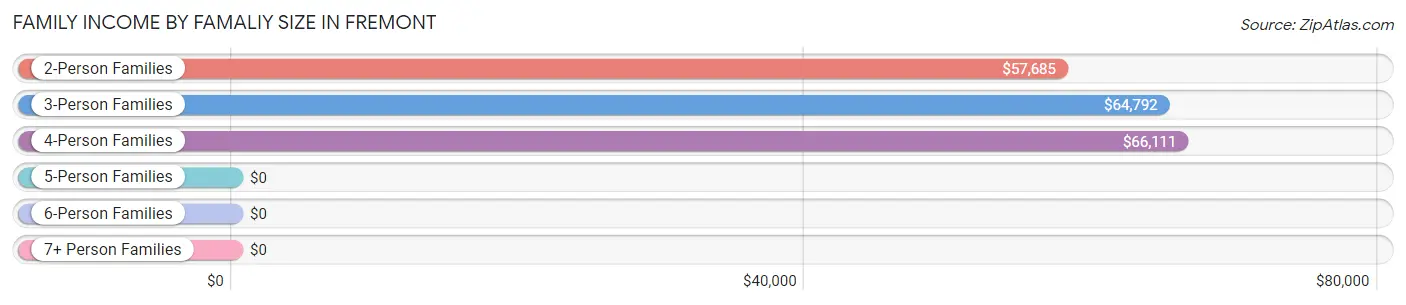
| Income Bracket | # Families | Median Income |
| 2-Person Families | 280 (56.6%) | $57,685 |
| 3-Person Families | 169 (34.1%) | $64,792 |
| 4-Person Families | 44 (8.9%) | $66,111 |
| 5-Person Families | 2 (0.4%) | $0 |
| 6-Person Families | 0 (0.0%) | $0 |
| 7+ Person Families | 0 (0.0%) | $0 |
| Total | 495 (100.0%) | $61,417 |
Family Income by Number of Earners in Fremont
The median family income in Fremont is $61,417, with families comprising 3+ earners (32) having the highest median family income of $149,583, while families with 1 earner (213) have the lowest median family income of $35,850, accounting for 6.5% and 43.0% of families, respectively.
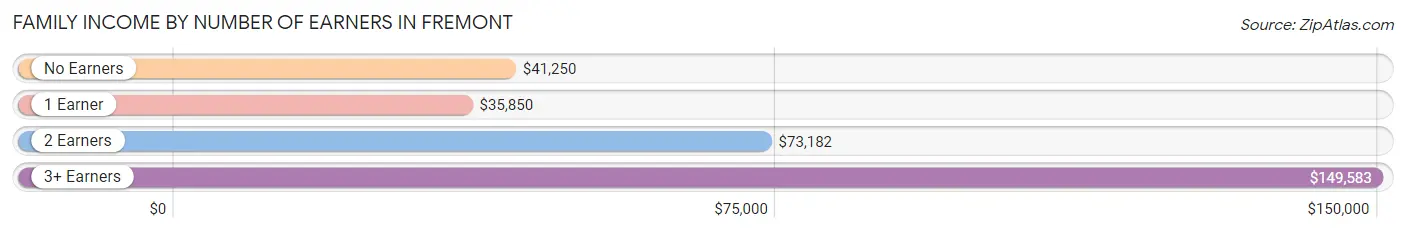
| Number of Earners | # Families | Median Income |
| No Earners | 62 (12.5%) | $41,250 |
| 1 Earner | 213 (43.0%) | $35,850 |
| 2 Earners | 188 (38.0%) | $73,182 |
| 3+ Earners | 32 (6.5%) | $149,583 |
| Total | 495 (100.0%) | $61,417 |
Household Income in Fremont
Household Income Brackets in Fremont
With 222 households falling in the category, the $50,000 to $74,999 income range is the most frequent in Fremont, accounting for 25.1% of all households. In contrast, only 5 households (0.6%) fall into the less than $10,000 income bracket, making it the least populous group.
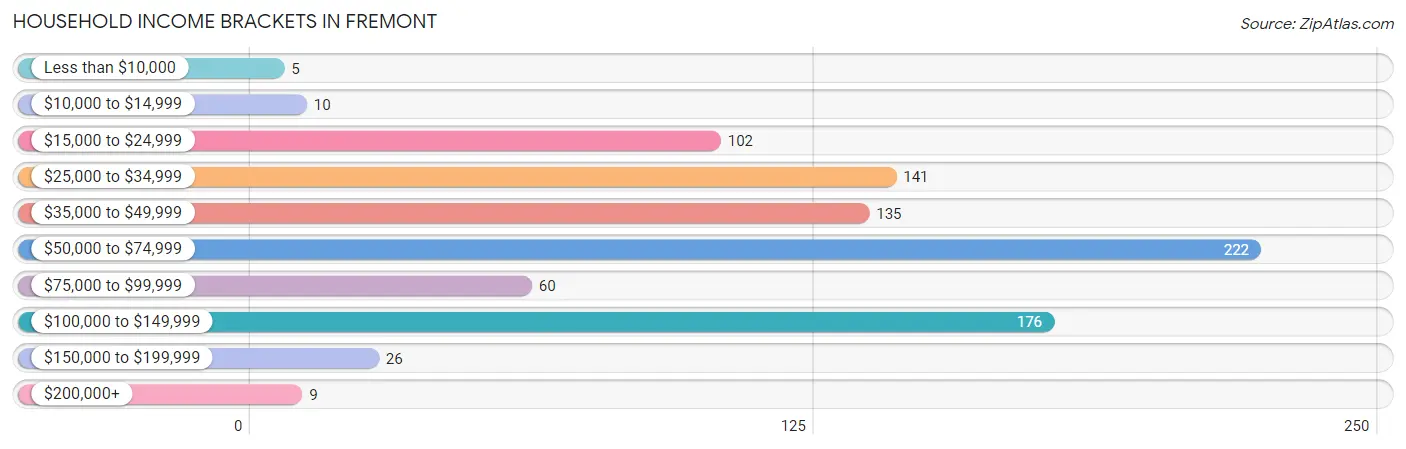
| Income Bracket | # Households | % Households |
| Less than $10,000 | 5 | 0.6% |
| $10,000 to $14,999 | 10 | 1.1% |
| $15,000 to $24,999 | 102 | 11.5% |
| $25,000 to $34,999 | 141 | 15.9% |
| $35,000 to $49,999 | 135 | 15.2% |
| $50,000 to $74,999 | 222 | 25.1% |
| $75,000 to $99,999 | 60 | 6.8% |
| $100,000 to $149,999 | 176 | 19.9% |
| $150,000 to $199,999 | 26 | 2.9% |
| $200,000+ | 9 | 1.0% |
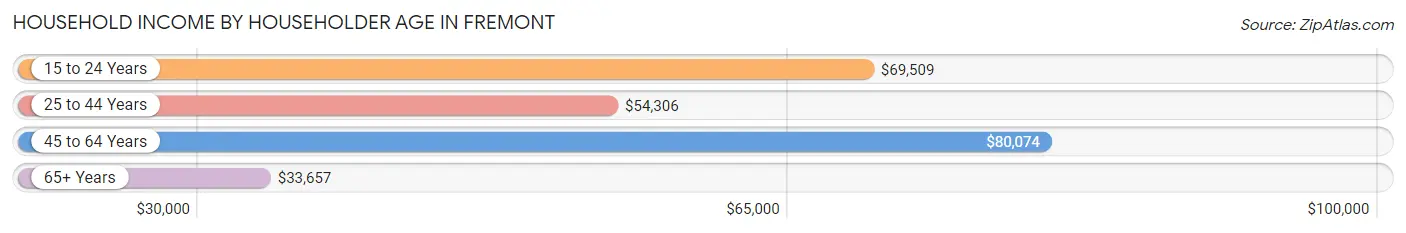
Household Income by Householder Age in Fremont
The median household income in Fremont is $57,500, with the highest median household income of $80,074 found in the 45 to 64 years age bracket for the primary householder. A total of 247 households (27.9%) fall into this category. Meanwhile, the 65+ years age bracket for the primary householder has the lowest median household income of $33,657, with 249 households (28.1%) in this group.
| Income Bracket | # Households | Median Income |
| 15 to 24 Years | 45 (5.1%) | $69,509 |
| 25 to 44 Years | 345 (38.9%) | $54,306 |
| 45 to 64 Years | 247 (27.9%) | $80,074 |
| 65+ Years | 249 (28.1%) | $33,657 |
| Total | 886 (100.0%) | $57,500 |
Poverty in Fremont
Income Below Poverty by Sex and Age in Fremont
With 12.1% poverty level for males and 12.0% for females among the residents of Fremont, 45 to 54 year old males and under 5 year old females are the most vulnerable to poverty, with 65 males (32.8%) and 12 females (40.0%) in their respective age groups living below the poverty level.
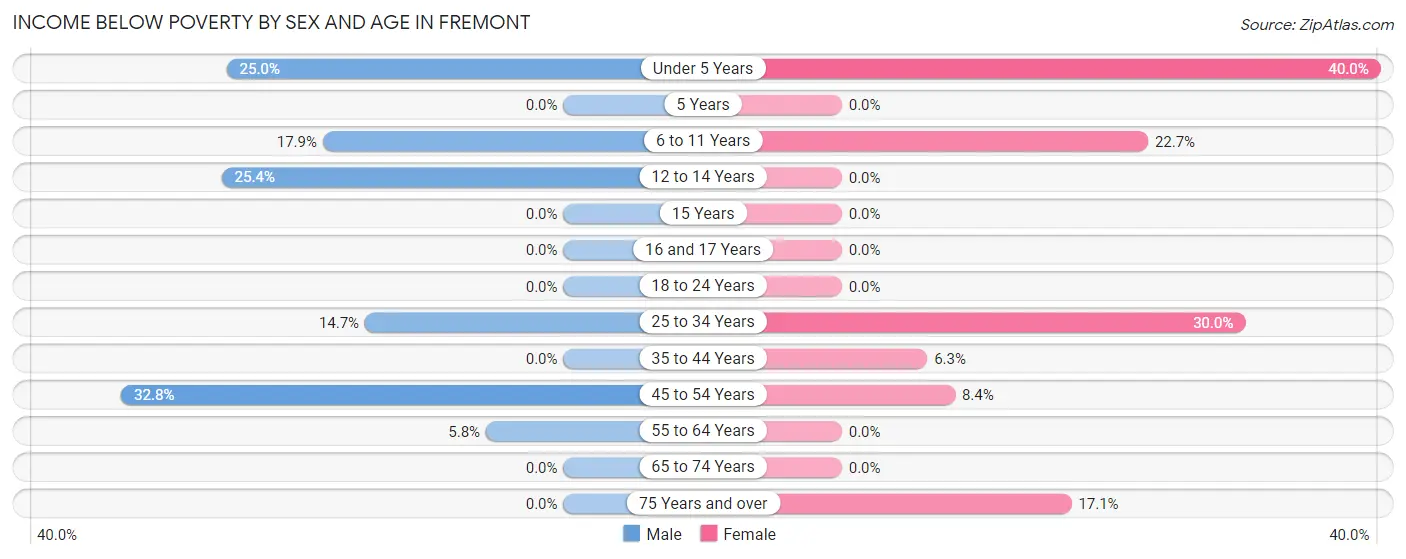
| Age Bracket | Male | Female |
| Under 5 Years | 21 (25.0%) | 12 (40.0%) |
| 5 Years | 0 (0.0%) | 0 (0.0%) |
| 6 to 11 Years | 10 (17.9%) | 10 (22.7%) |
| 12 to 14 Years | 17 (25.4%) | 0 (0.0%) |
| 15 Years | 0 (0.0%) | 0 (0.0%) |
| 16 and 17 Years | 0 (0.0%) | 0 (0.0%) |
| 18 to 24 Years | 0 (0.0%) | 0 (0.0%) |
| 25 to 34 Years | 19 (14.7%) | 56 (29.9%) |
| 35 to 44 Years | 0 (0.0%) | 9 (6.3%) |
| 45 to 54 Years | 65 (32.8%) | 11 (8.4%) |
| 55 to 64 Years | 5 (5.8%) | 0 (0.0%) |
| 65 to 74 Years | 0 (0.0%) | 0 (0.0%) |
| 75 Years and over | 0 (0.0%) | 15 (17.1%) |
| Total | 137 (12.1%) | 113 (12.0%) |
Income Above Poverty by Sex and Age in Fremont
According to the poverty statistics in Fremont, males aged 15 years and females aged 5 years are the age groups that are most secure financially, with 100.0% of males and 100.0% of females in these age groups living above the poverty line.
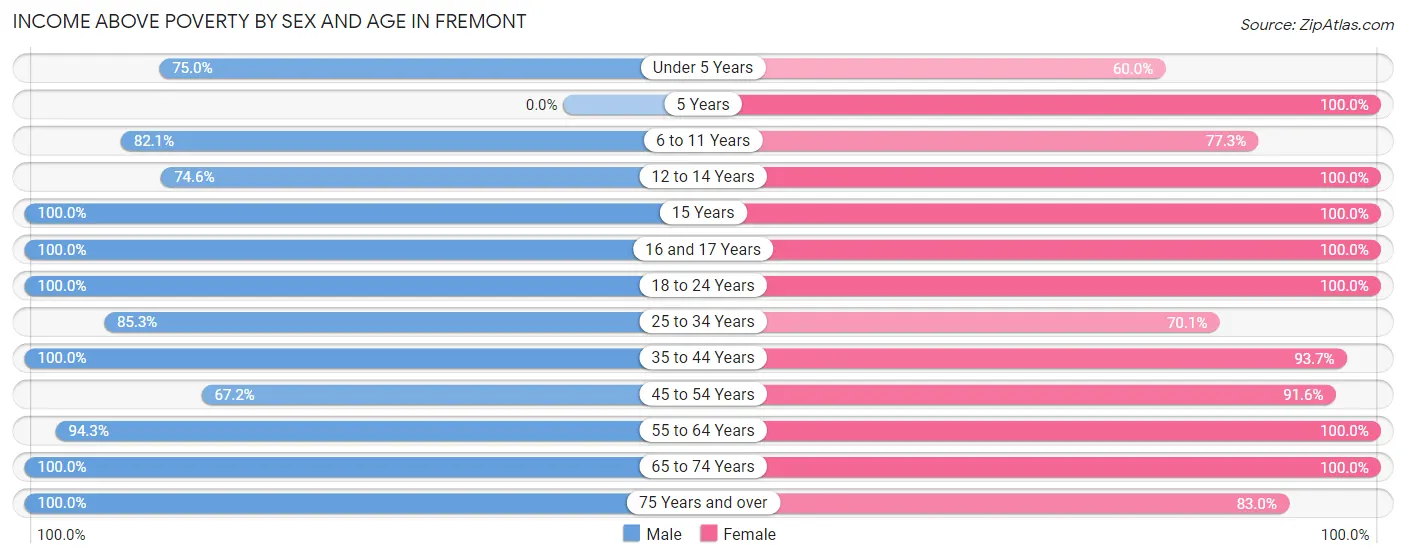
| Age Bracket | Male | Female |
| Under 5 Years | 63 (75.0%) | 18 (60.0%) |
| 5 Years | 0 (0.0%) | 14 (100.0%) |
| 6 to 11 Years | 46 (82.1%) | 34 (77.3%) |
| 12 to 14 Years | 50 (74.6%) | 34 (100.0%) |
| 15 Years | 4 (100.0%) | 14 (100.0%) |
| 16 and 17 Years | 13 (100.0%) | 5 (100.0%) |
| 18 to 24 Years | 179 (100.0%) | 62 (100.0%) |
| 25 to 34 Years | 110 (85.3%) | 131 (70.1%) |
| 35 to 44 Years | 145 (100.0%) | 133 (93.7%) |
| 45 to 54 Years | 133 (67.2%) | 120 (91.6%) |
| 55 to 64 Years | 82 (94.3%) | 82 (100.0%) |
| 65 to 74 Years | 120 (100.0%) | 112 (100.0%) |
| 75 Years and over | 49 (100.0%) | 73 (83.0%) |
| Total | 994 (87.9%) | 832 (88.0%) |
Income Below Poverty Among Married-Couple Families in Fremont
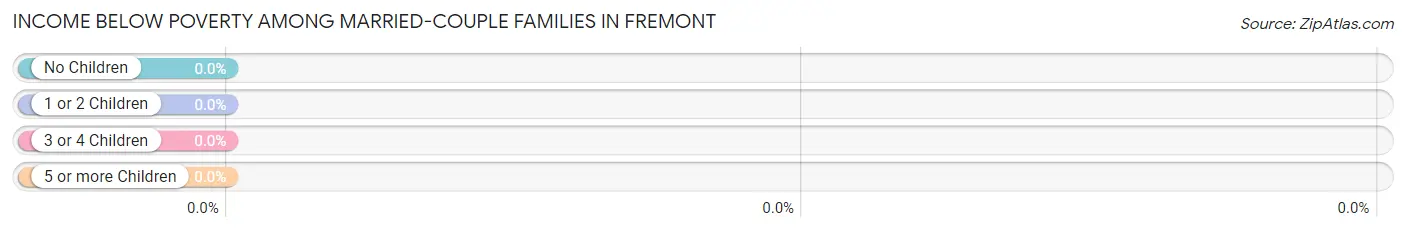
| Children | Above Poverty | Below Poverty |
| No Children | 252 (100.0%) | 0 (0.0%) |
| 1 or 2 Children | 94 (100.0%) | 0 (0.0%) |
| 3 or 4 Children | 2 (100.0%) | 0 (0.0%) |
| 5 or more Children | 0 (0.0%) | 0 (0.0%) |
| Total | 348 (100.0%) | 0 (0.0%) |
Income Below Poverty Among Single-Parent Households in Fremont
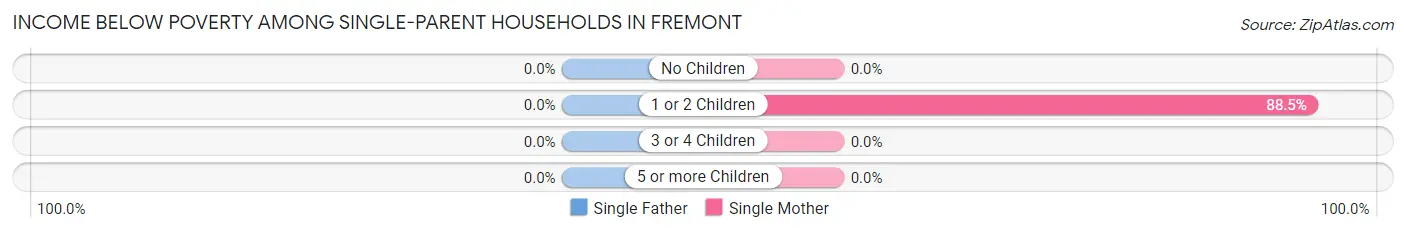
| Children | Single Father | Single Mother |
| No Children | 0 (0.0%) | 0 (0.0%) |
| 1 or 2 Children | 0 (0.0%) | 46 (88.5%) |
| 3 or 4 Children | 0 (0.0%) | 0 (0.0%) |
| 5 or more Children | 0 (0.0%) | 0 (0.0%) |
| Total | 0 (0.0%) | 46 (54.1%) |
Income Below Poverty Among Married-Couple vs Single-Parent Households in Fremont
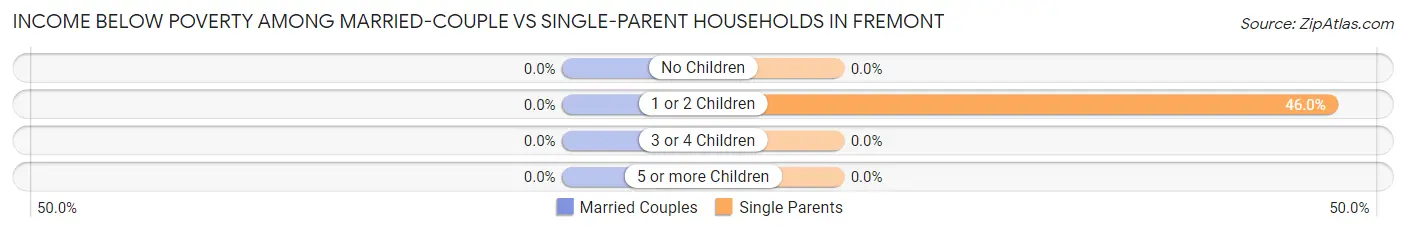
| Children | Married-Couple Families | Single-Parent Households |
| No Children | 0 (0.0%) | 0 (0.0%) |
| 1 or 2 Children | 0 (0.0%) | 46 (46.0%) |
| 3 or 4 Children | 0 (0.0%) | 0 (0.0%) |
| 5 or more Children | 0 (0.0%) | 0 (0.0%) |
| Total | 0 (0.0%) | 46 (31.3%) |
Race in Fremont
The most populous races in Fremont are White / Caucasian (1,948 | 89.8%), Hispanic or Latino (152 | 7.0%), and Asian (91 | 4.2%).
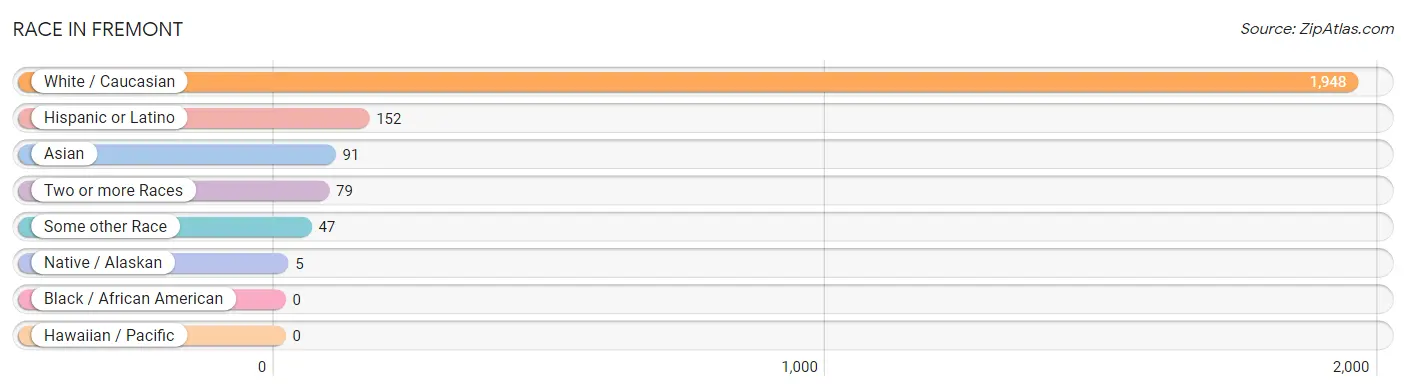
| Race | # Population | % Population |
| Asian | 91 | 4.2% |
| Black / African American | 0 | 0.0% |
| Hawaiian / Pacific | 0 | 0.0% |
| Hispanic or Latino | 152 | 7.0% |
| Native / Alaskan | 5 | 0.2% |
| White / Caucasian | 1,948 | 89.8% |
| Two or more Races | 79 | 3.6% |
| Some other Race | 47 | 2.2% |
| Total | 2,170 | 100.0% |
Ancestry in Fremont
The most populous ancestries reported in Fremont are German (481 | 22.2%), English (461 | 21.2%), Irish (232 | 10.7%), Mexican (152 | 7.0%), and Scottish (106 | 4.9%), together accounting for 66.0% of all Fremont residents.
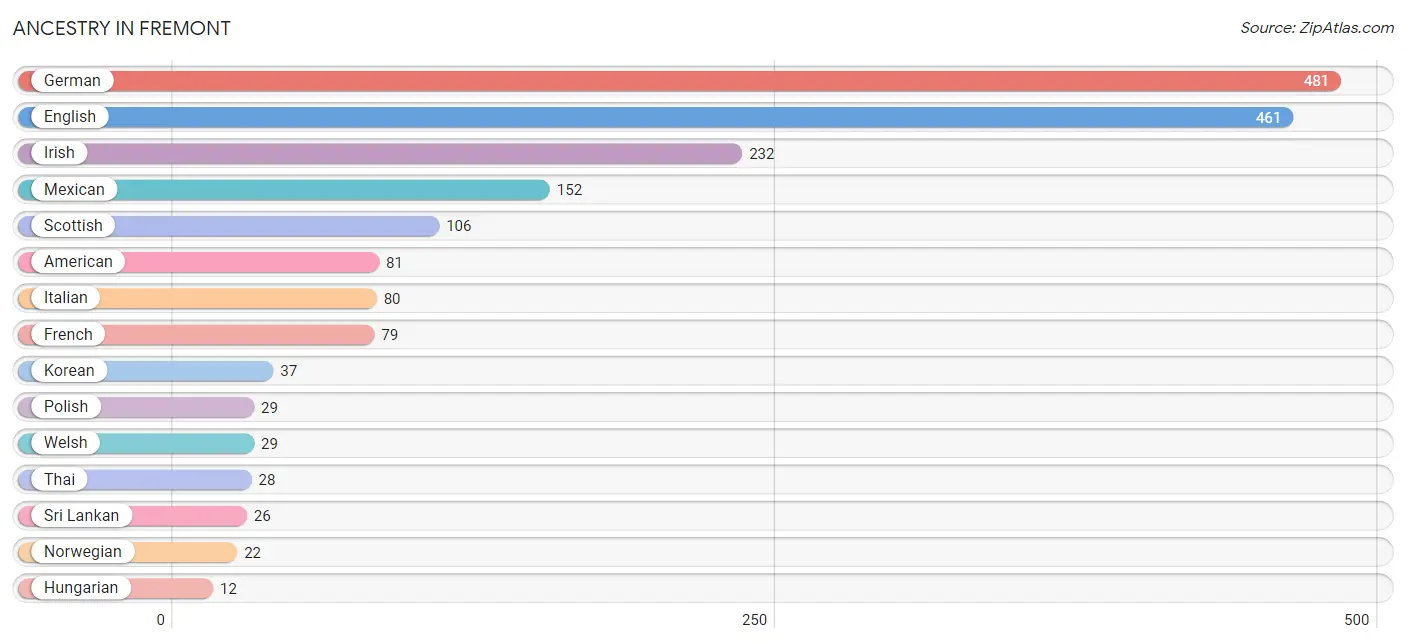
| Ancestry | # Population | % Population |
| American | 81 | 3.7% |
| Czechoslovakian | 11 | 0.5% |
| Danish | 5 | 0.2% |
| Dutch | 5 | 0.2% |
| English | 461 | 21.2% |
| European | 5 | 0.2% |
| French | 79 | 3.6% |
| German | 481 | 22.2% |
| Hungarian | 12 | 0.5% |
| Irish | 232 | 10.7% |
| Italian | 80 | 3.7% |
| Korean | 37 | 1.7% |
| Mexican | 152 | 7.0% |
| Norwegian | 22 | 1.0% |
| Pennsylvania German | 5 | 0.2% |
| Polish | 29 | 1.3% |
| Potawatomi | 5 | 0.2% |
| Russian | 7 | 0.3% |
| Scottish | 106 | 4.9% |
| Sri Lankan | 26 | 1.2% |
| Thai | 28 | 1.3% |
| Ukrainian | 5 | 0.2% |
| Welsh | 29 | 1.3% | View All 23 Rows |
Immigrants in Fremont
The most numerous immigrant groups reported in Fremont came from Asia (91 | 4.2%), South Eastern Asia (63 | 2.9%), Philippines (37 | 1.7%), India (28 | 1.3%), and South Central Asia (28 | 1.3%), together accounting for 11.4% of all Fremont residents.
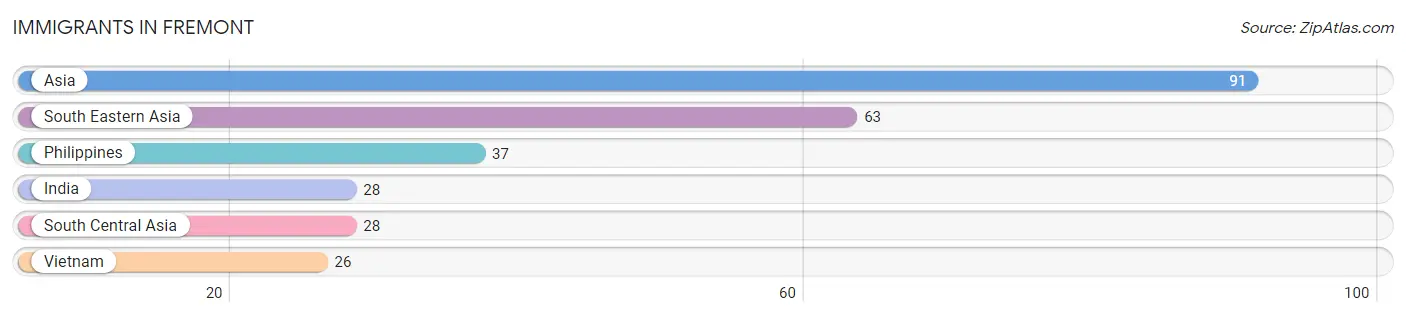
| Immigration Origin | # Population | % Population |
| Asia | 91 | 4.2% |
| India | 28 | 1.3% |
| Philippines | 37 | 1.7% |
| South Central Asia | 28 | 1.3% |
| South Eastern Asia | 63 | 2.9% |
| Vietnam | 26 | 1.2% | View All 6 Rows |
Sex and Age in Fremont
Sex and Age in Fremont
The most populous age groups in Fremont are 45 to 49 Years (132 | 11.4%) for men and 10 to 14 Years (107 | 10.6%) for women.
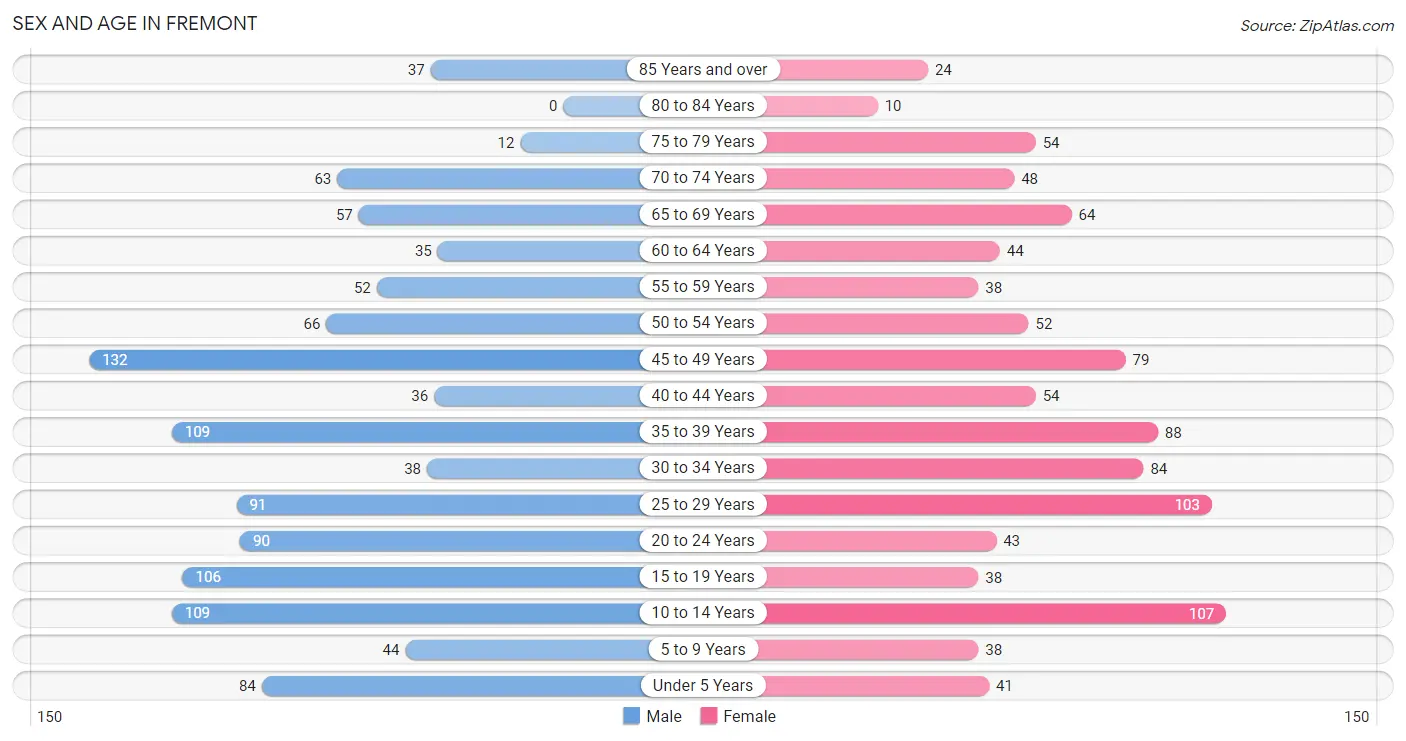
| Age Bracket | Male | Female |
| Under 5 Years | 84 (7.2%) | 41 (4.1%) |
| 5 to 9 Years | 44 (3.8%) | 38 (3.8%) |
| 10 to 14 Years | 109 (9.4%) | 107 (10.6%) |
| 15 to 19 Years | 106 (9.1%) | 38 (3.8%) |
| 20 to 24 Years | 90 (7.7%) | 43 (4.3%) |
| 25 to 29 Years | 91 (7.8%) | 103 (10.2%) |
| 30 to 34 Years | 38 (3.3%) | 84 (8.3%) |
| 35 to 39 Years | 109 (9.4%) | 88 (8.7%) |
| 40 to 44 Years | 36 (3.1%) | 54 (5.3%) |
| 45 to 49 Years | 132 (11.4%) | 79 (7.8%) |
| 50 to 54 Years | 66 (5.7%) | 52 (5.1%) |
| 55 to 59 Years | 52 (4.5%) | 38 (3.8%) |
| 60 to 64 Years | 35 (3.0%) | 44 (4.4%) |
| 65 to 69 Years | 57 (4.9%) | 64 (6.3%) |
| 70 to 74 Years | 63 (5.4%) | 48 (4.8%) |
| 75 to 79 Years | 12 (1.0%) | 54 (5.3%) |
| 80 to 84 Years | 0 (0.0%) | 10 (1.0%) |
| 85 Years and over | 37 (3.2%) | 24 (2.4%) |
| Total | 1,161 (100.0%) | 1,009 (100.0%) |
Families and Households in Fremont
Median Family Size in Fremont
The median family size in Fremont is 2.91 persons per family, with married-couple families (348 | 70.3%) accounting for the largest median family size of 2.96 persons per family. On the other hand, single female/mother families (85 | 17.2%) represent the smallest median family size with 2.69 persons per family.
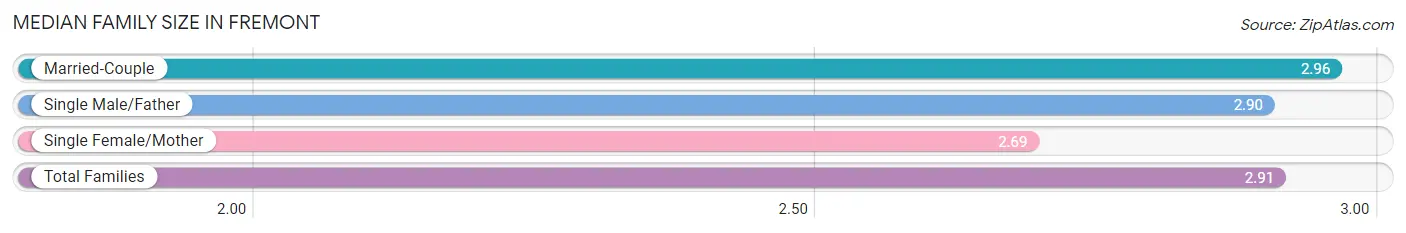
| Family Type | # Families | Family Size |
| Married-Couple | 348 (70.3%) | 2.96 |
| Single Male/Father | 62 (12.5%) | 2.90 |
| Single Female/Mother | 85 (17.2%) | 2.69 |
| Total Families | 495 (100.0%) | 2.91 |
Median Household Size in Fremont
The median household size in Fremont is 2.45 persons per household, with single male/father households (62 | 7.0%) accounting for the largest median household size of 3.76 persons per household. non-family households (391 | 44.1%) represent the smallest median household size with 1.64 persons per household.
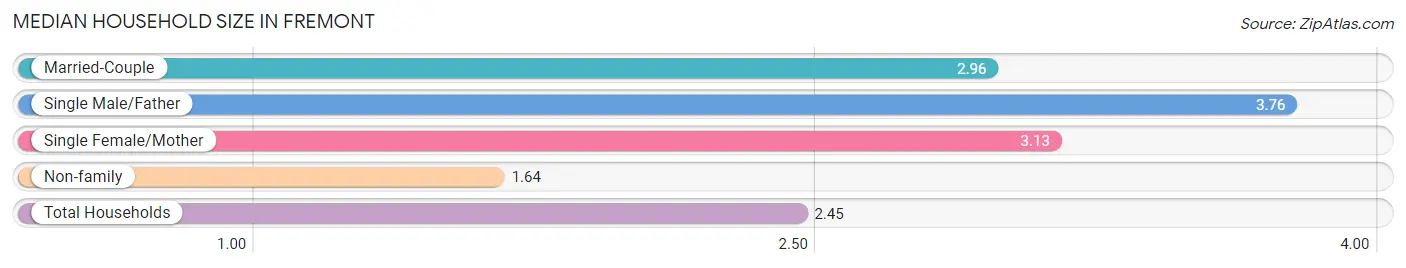
| Household Type | # Households | Household Size |
| Married-Couple | 348 (39.3%) | 2.96 |
| Single Male/Father | 62 (7.0%) | 3.76 |
| Single Female/Mother | 85 (9.6%) | 3.13 |
| Non-family | 391 (44.1%) | 1.64 |
| Total Households | 886 (100.0%) | 2.45 |
Household Size by Marriage Status in Fremont
Out of a total of 886 households in Fremont, 495 (55.9%) are family households, while 391 (44.1%) are nonfamily households. The most numerous type of family households are 2-person households, comprising 250, and the most common type of nonfamily households are 1-person households, comprising 255.
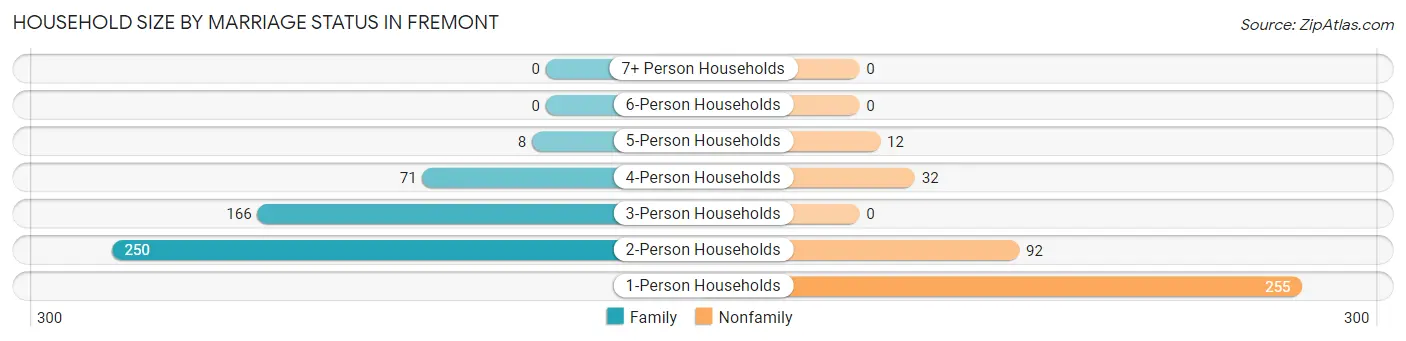
| Household Size | Family Households | Nonfamily Households |
| 1-Person Households | - | 255 (28.8%) |
| 2-Person Households | 250 (28.2%) | 92 (10.4%) |
| 3-Person Households | 166 (18.7%) | 0 (0.0%) |
| 4-Person Households | 71 (8.0%) | 32 (3.6%) |
| 5-Person Households | 8 (0.9%) | 12 (1.3%) |
| 6-Person Households | 0 (0.0%) | 0 (0.0%) |
| 7+ Person Households | 0 (0.0%) | 0 (0.0%) |
| Total | 495 (55.9%) | 391 (44.1%) |
Female Fertility in Fremont
Fertility by Age in Fremont
Average fertility rate in Fremont is 38.0 births per 1,000 women. Women in the age bracket of 20 to 34 years have the highest fertility rate with 43.0 births per 1,000 women. Women in the age bracket of 20 to 34 years acount for 52.6% of all women with births.
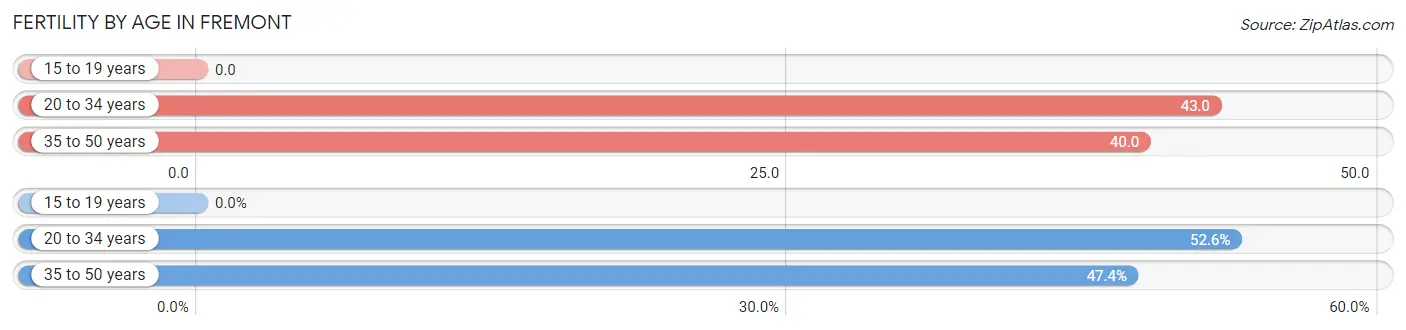
| Age Bracket | Women with Births | Births / 1,000 Women |
| 15 to 19 years | 0 (0.0%) | 0.0 |
| 20 to 34 years | 10 (52.6%) | 43.0 |
| 35 to 50 years | 9 (47.4%) | 40.0 |
| Total | 19 (100.0%) | 38.0 |
Fertility by Age by Marriage Status in Fremont
52.6% of women with births (19) in Fremont are married. The highest percentage of unmarried women with births falls into 35 to 50 years age bracket with 100.0% of them unmarried at the time of birth, while the lowest percentage of unmarried women with births belong to 20 to 34 years age bracket with 0.0% of them unmarried.
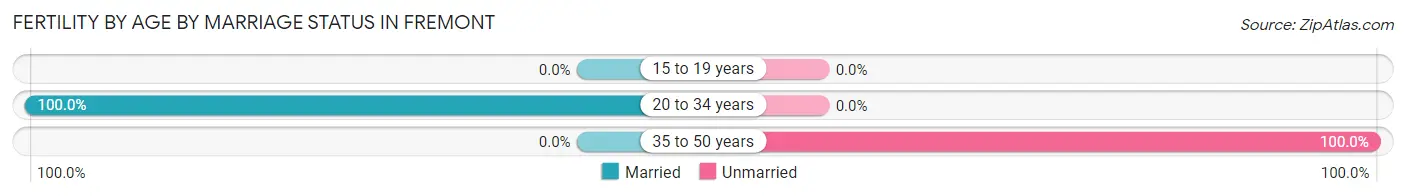
| Age Bracket | Married | Unmarried |
| 15 to 19 years | 0 (0.0%) | 0 (0.0%) |
| 20 to 34 years | 10 (100.0%) | 0 (0.0%) |
| 35 to 50 years | 0 (0.0%) | 9 (100.0%) |
| Total | 10 (52.6%) | 9 (47.4%) |
Fertility by Education in Fremont
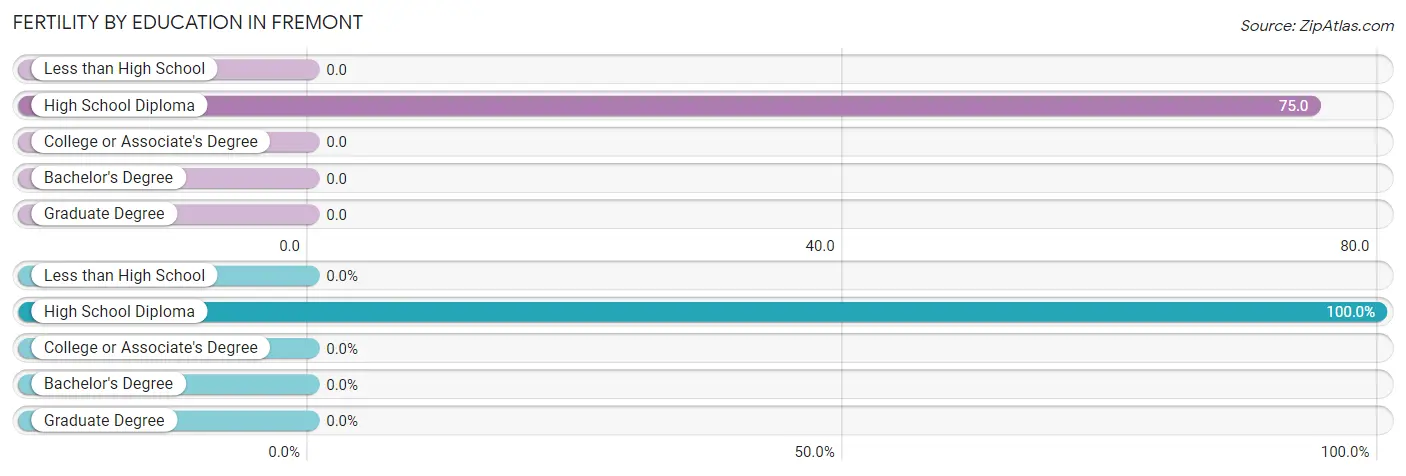
| Educational Attainment | Women with Births | Births / 1,000 Women |
| Less than High School | 0 (0.0%) | 0.0 |
| High School Diploma | 19 (100.0%) | 75.0 |
| College or Associate's Degree | 0 (0.0%) | 0.0 |
| Bachelor's Degree | 0 (0.0%) | 0.0 |
| Graduate Degree | 0 (0.0%) | 0.0 |
| Total | 19 (100.0%) | 38.0 |
Fertility by Education by Marriage Status in Fremont
47.4% of women with births in Fremont are unmarried. Women with the educational attainment of high school diploma are most likely to be married with 52.6% of them married at childbirth, while women with the educational attainment of high school diploma are least likely to be married with 47.4% of them unmarried at childbirth.
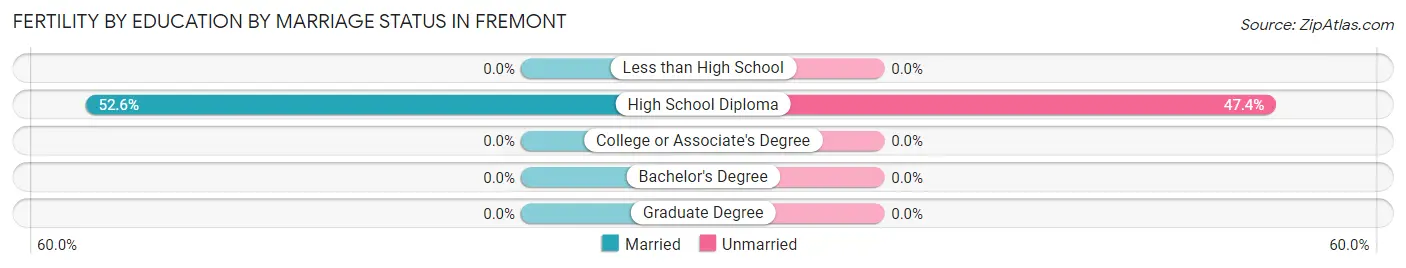
| Educational Attainment | Married | Unmarried |
| Less than High School | 0 (0.0%) | 0 (0.0%) |
| High School Diploma | 10 (52.6%) | 9 (47.4%) |
| College or Associate's Degree | 0 (0.0%) | 0 (0.0%) |
| Bachelor's Degree | 0 (0.0%) | 0 (0.0%) |
| Graduate Degree | 0 (0.0%) | 0 (0.0%) |
| Total | 10 (52.6%) | 9 (47.4%) |
Employment Characteristics in Fremont
Employment by Class of Employer in Fremont
Among the 966 employed individuals in Fremont, private company employees (724 | 75.0%), local government employees (109 | 11.3%), and self-employed (not incorporated) (67 | 6.9%) make up the most common classes of employment.
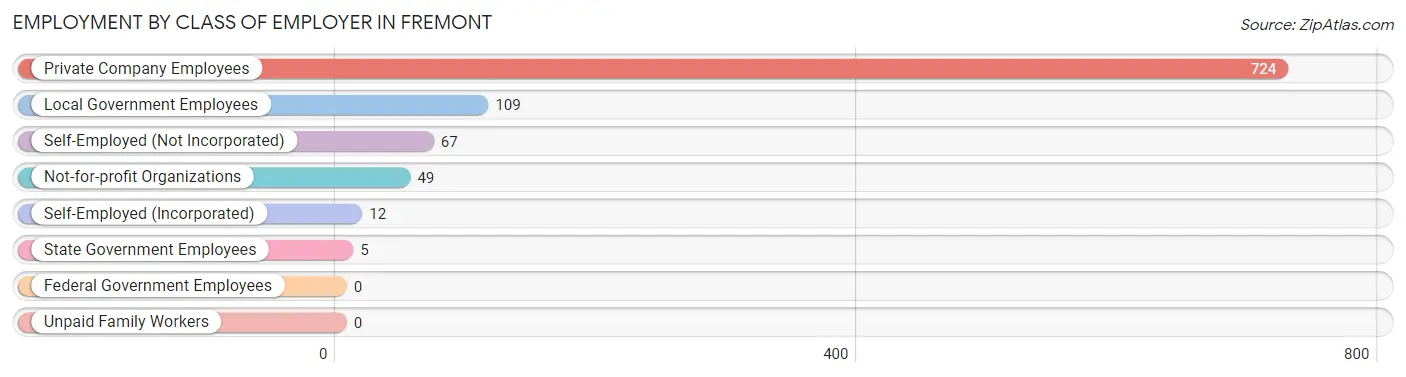
| Employer Class | # Employees | % Employees |
| Private Company Employees | 724 | 75.0% |
| Self-Employed (Incorporated) | 12 | 1.2% |
| Self-Employed (Not Incorporated) | 67 | 6.9% |
| Not-for-profit Organizations | 49 | 5.1% |
| Local Government Employees | 109 | 11.3% |
| State Government Employees | 5 | 0.5% |
| Federal Government Employees | 0 | 0.0% |
| Unpaid Family Workers | 0 | 0.0% |
| Total | 966 | 100.0% |
Employment Status by Age in Fremont
According to the labor force statistics for Fremont, out of the total population over 16 years of age (1,729), 66.9% or 1,157 individuals are in the labor force, with 12.3% or 142 of them unemployed. The age group with the highest labor force participation rate is 30 to 34 years, with 100.0% or 122 individuals in the labor force. Within the labor force, the 16 to 19 years age range has the highest percentage of unemployed individuals, with 82.9% or 58 of them being unemployed.
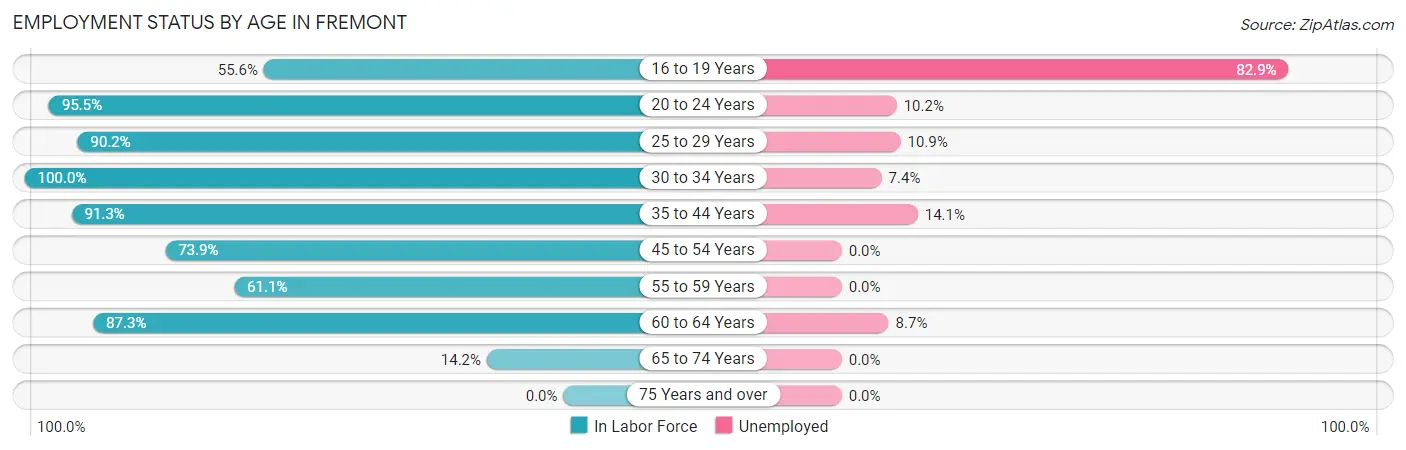
| Age Bracket | In Labor Force | Unemployed |
| 16 to 19 Years | 70 (55.6%) | 58 (82.9%) |
| 20 to 24 Years | 127 (95.5%) | 13 (10.2%) |
| 25 to 29 Years | 175 (90.2%) | 19 (10.9%) |
| 30 to 34 Years | 122 (100.0%) | 9 (7.4%) |
| 35 to 44 Years | 262 (91.3%) | 37 (14.1%) |
| 45 to 54 Years | 243 (73.9%) | 0 (0.0%) |
| 55 to 59 Years | 55 (61.1%) | 0 (0.0%) |
| 60 to 64 Years | 69 (87.3%) | 6 (8.7%) |
| 65 to 74 Years | 33 (14.2%) | 0 (0.0%) |
| 75 Years and over | 0 (0.0%) | 0 (0.0%) |
| Total | 1,157 (66.9%) | 142 (12.3%) |
Employment Status by Educational Attainment in Fremont
According to labor force statistics for Fremont, 84.1% of individuals (926) out of the total population between 25 and 64 years of age (1,101) are in the labor force, with 7.7% or 71 of them being unemployed. The group with the highest labor force participation rate are those with the educational attainment of bachelor's degree or higher, with 94.6% or 87 individuals in the labor force. Within the labor force, individuals with college / associate degree education have the highest percentage of unemployment, with 13.8% or 41 of them being unemployed.
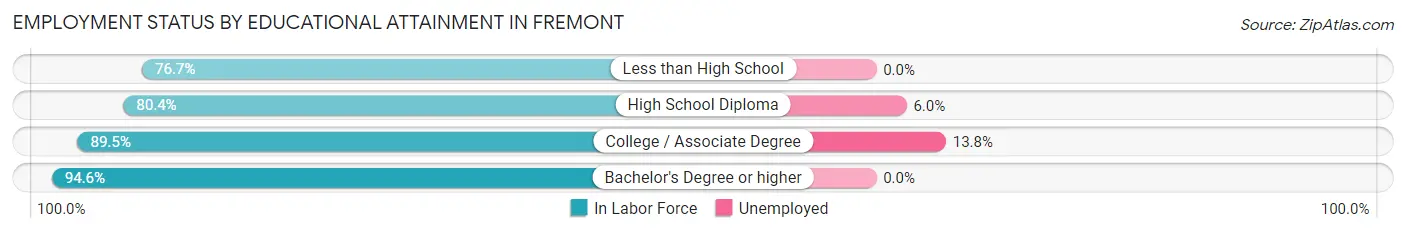
| Educational Attainment | In Labor Force | Unemployed |
| Less than High School | 46 (76.7%) | 0 (0.0%) |
| High School Diploma | 496 (80.4%) | 37 (6.0%) |
| College / Associate Degree | 297 (89.5%) | 46 (13.8%) |
| Bachelor's Degree or higher | 87 (94.6%) | 0 (0.0%) |
| Total | 926 (84.1%) | 85 (7.7%) |
Employment Occupations by Sex in Fremont
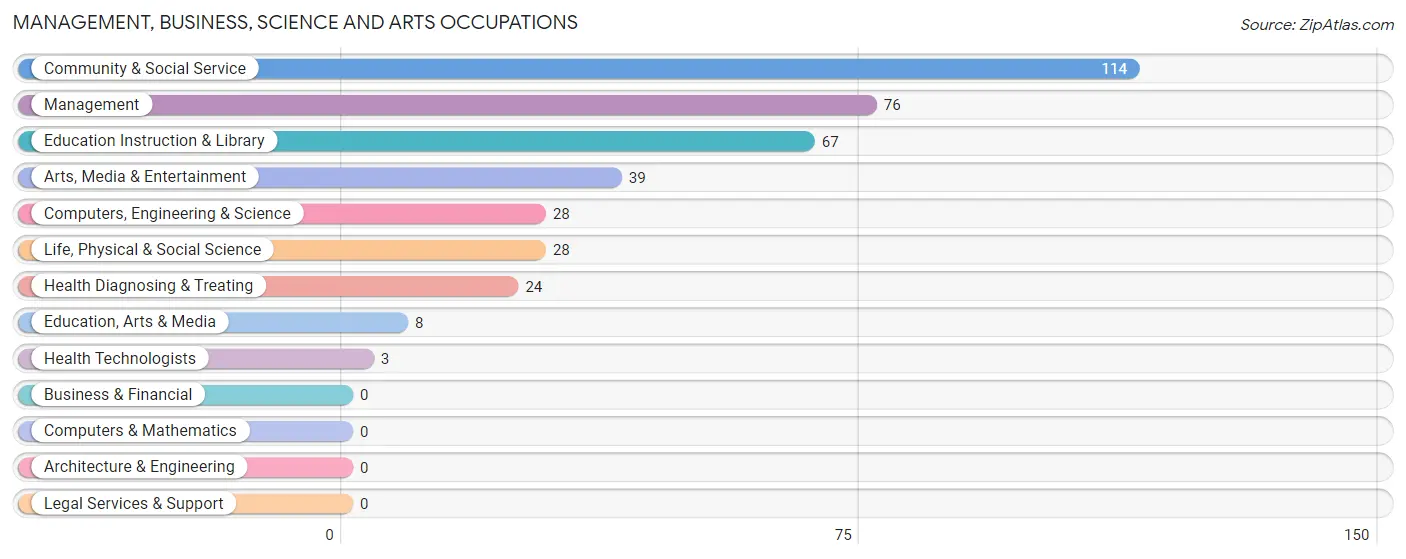
Management, Business, Science and Arts Occupations
The most common Management, Business, Science and Arts occupations in Fremont are Community & Social Service (114 | 11.2%), Management (76 | 7.5%), Education Instruction & Library (67 | 6.6%), Arts, Media & Entertainment (39 | 3.8%), and Computers, Engineering & Science (28 | 2.8%).
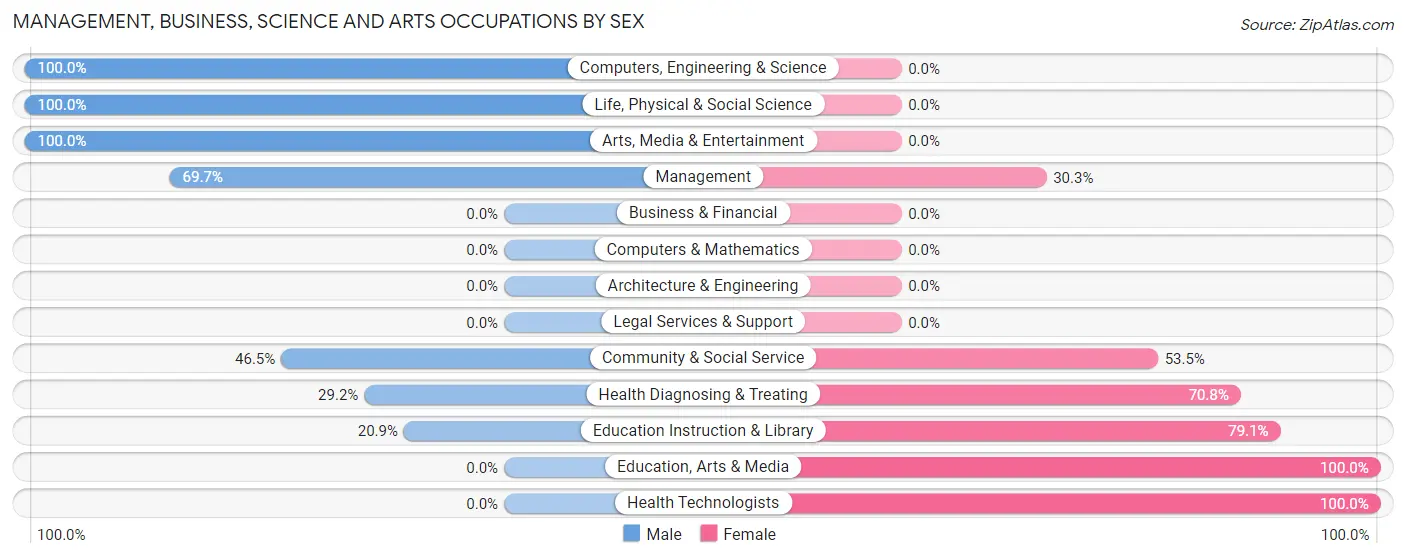
Management, Business, Science and Arts Occupations by Sex
Within the Management, Business, Science and Arts occupations in Fremont, the most male-oriented occupations are Computers, Engineering & Science (100.0%), Life, Physical & Social Science (100.0%), and Arts, Media & Entertainment (100.0%), while the most female-oriented occupations are Education, Arts & Media (100.0%), Health Technologists (100.0%), and Education Instruction & Library (79.1%).
| Occupation | Male | Female |
| Management | 53 (69.7%) | 23 (30.3%) |
| Business & Financial | 0 (0.0%) | 0 (0.0%) |
| Computers, Engineering & Science | 28 (100.0%) | 0 (0.0%) |
| Computers & Mathematics | 0 (0.0%) | 0 (0.0%) |
| Architecture & Engineering | 0 (0.0%) | 0 (0.0%) |
| Life, Physical & Social Science | 28 (100.0%) | 0 (0.0%) |
| Community & Social Service | 53 (46.5%) | 61 (53.5%) |
| Education, Arts & Media | 0 (0.0%) | 8 (100.0%) |
| Legal Services & Support | 0 (0.0%) | 0 (0.0%) |
| Education Instruction & Library | 14 (20.9%) | 53 (79.1%) |
| Arts, Media & Entertainment | 39 (100.0%) | 0 (0.0%) |
| Health Diagnosing & Treating | 7 (29.2%) | 17 (70.8%) |
| Health Technologists | 0 (0.0%) | 3 (100.0%) |
| Total (Category) | 141 (58.3%) | 101 (41.7%) |
| Total (Overall) | 474 (46.8%) | 540 (53.2%) |
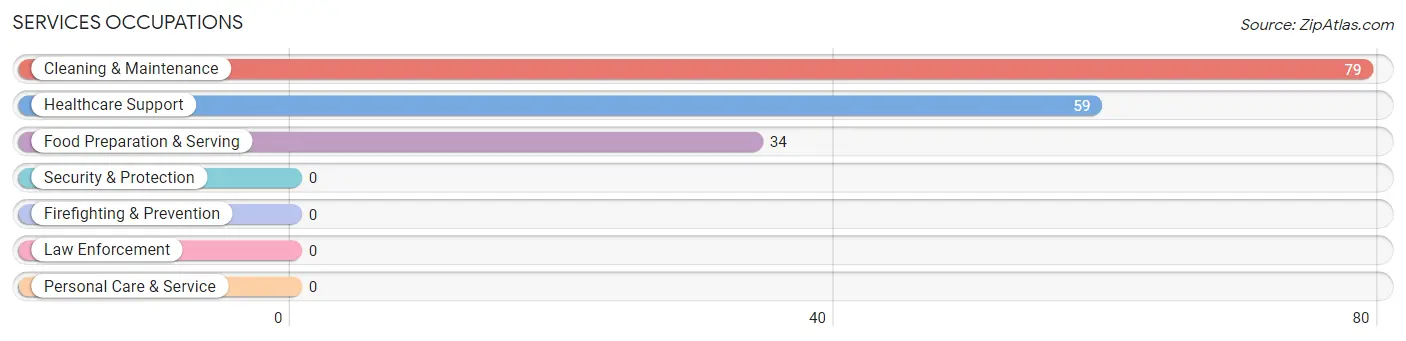
Services Occupations
The most common Services occupations in Fremont are Cleaning & Maintenance (79 | 7.8%), Healthcare Support (59 | 5.8%), and Food Preparation & Serving (34 | 3.4%).
Services Occupations by Sex
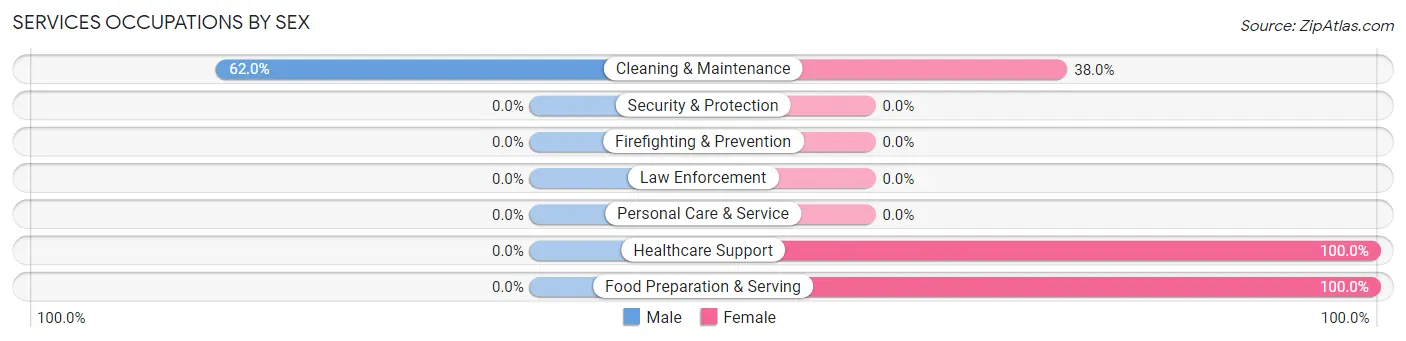
| Occupation | Male | Female |
| Healthcare Support | 0 (0.0%) | 59 (100.0%) |
| Security & Protection | 0 (0.0%) | 0 (0.0%) |
| Firefighting & Prevention | 0 (0.0%) | 0 (0.0%) |
| Law Enforcement | 0 (0.0%) | 0 (0.0%) |
| Food Preparation & Serving | 0 (0.0%) | 34 (100.0%) |
| Cleaning & Maintenance | 49 (62.0%) | 30 (38.0%) |
| Personal Care & Service | 0 (0.0%) | 0 (0.0%) |
| Total (Category) | 49 (28.5%) | 123 (71.5%) |
| Total (Overall) | 474 (46.8%) | 540 (53.2%) |
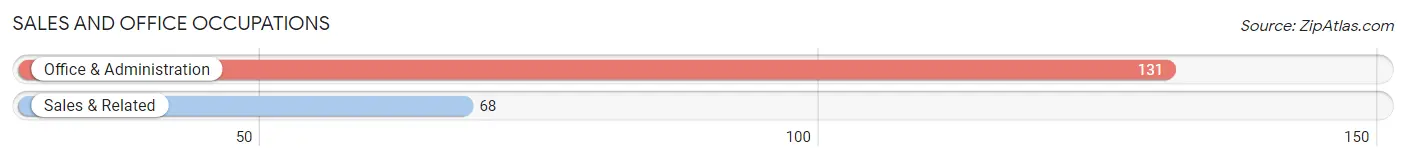
Sales and Office Occupations
The most common Sales and Office occupations in Fremont are Office & Administration (131 | 12.9%), and Sales & Related (68 | 6.7%).
Sales and Office Occupations by Sex
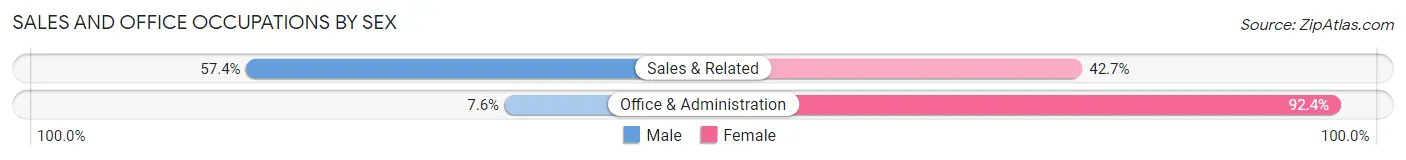
| Occupation | Male | Female |
| Sales & Related | 39 (57.4%) | 29 (42.6%) |
| Office & Administration | 10 (7.6%) | 121 (92.4%) |
| Total (Category) | 49 (24.6%) | 150 (75.4%) |
| Total (Overall) | 474 (46.8%) | 540 (53.2%) |
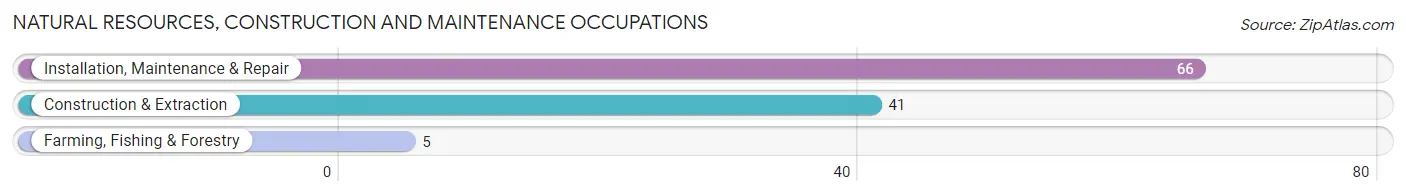
Natural Resources, Construction and Maintenance Occupations
The most common Natural Resources, Construction and Maintenance occupations in Fremont are Installation, Maintenance & Repair (66 | 6.5%), Construction & Extraction (41 | 4.0%), and Farming, Fishing & Forestry (5 | 0.5%).
Natural Resources, Construction and Maintenance Occupations by Sex
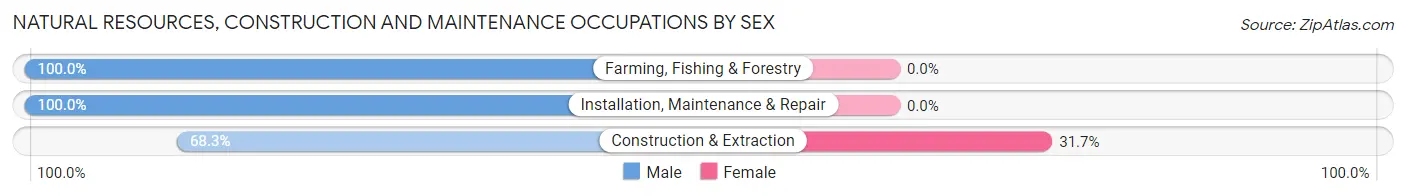
| Occupation | Male | Female |
| Farming, Fishing & Forestry | 5 (100.0%) | 0 (0.0%) |
| Construction & Extraction | 28 (68.3%) | 13 (31.7%) |
| Installation, Maintenance & Repair | 66 (100.0%) | 0 (0.0%) |
| Total (Category) | 99 (88.4%) | 13 (11.6%) |
| Total (Overall) | 474 (46.8%) | 540 (53.2%) |
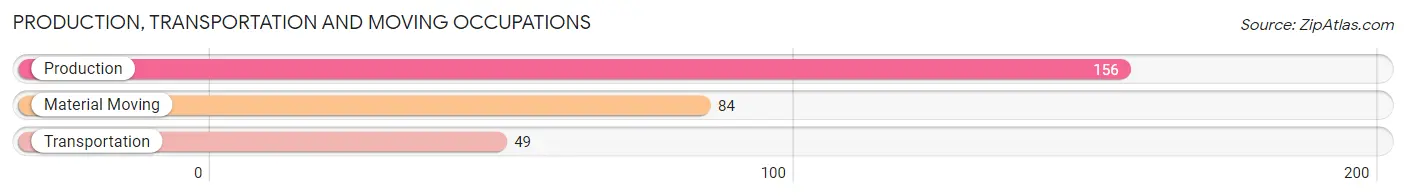
Production, Transportation and Moving Occupations
The most common Production, Transportation and Moving occupations in Fremont are Production (156 | 15.4%), Material Moving (84 | 8.3%), and Transportation (49 | 4.8%).
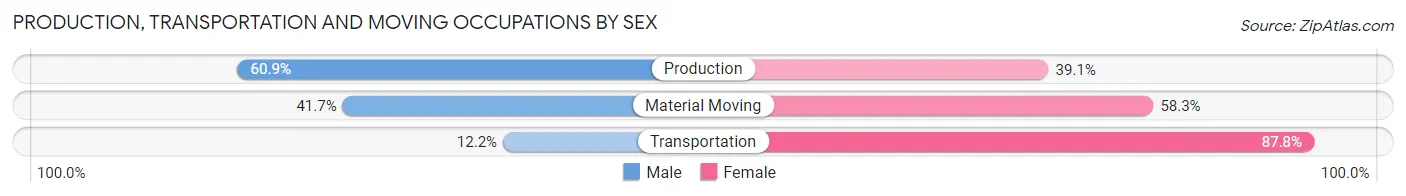
Production, Transportation and Moving Occupations by Sex
| Occupation | Male | Female |
| Production | 95 (60.9%) | 61 (39.1%) |
| Transportation | 6 (12.2%) | 43 (87.8%) |
| Material Moving | 35 (41.7%) | 49 (58.3%) |
| Total (Category) | 136 (47.1%) | 153 (52.9%) |
| Total (Overall) | 474 (46.8%) | 540 (53.2%) |
Employment Industries by Sex in Fremont
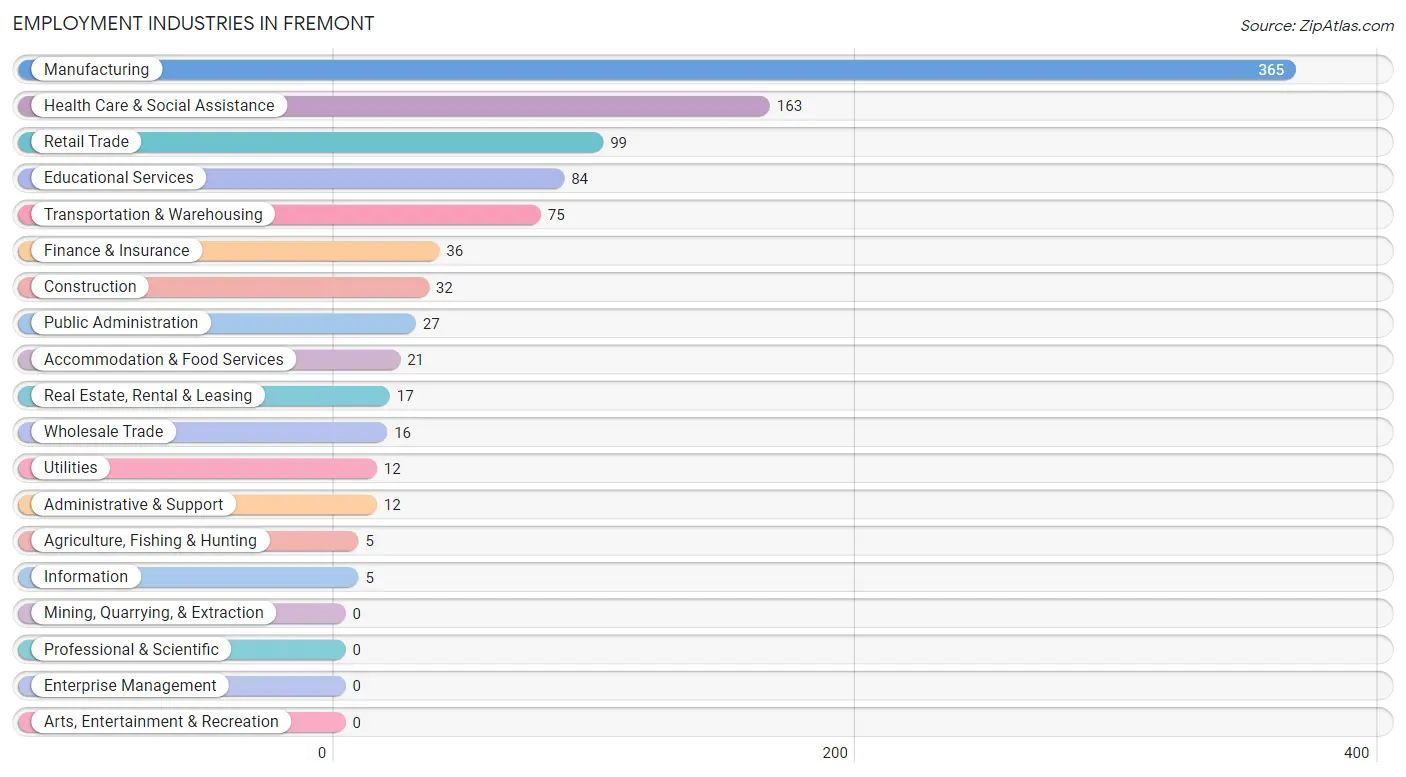
Employment Industries in Fremont
The major employment industries in Fremont include Manufacturing (365 | 36.0%), Health Care & Social Assistance (163 | 16.1%), Retail Trade (99 | 9.8%), Educational Services (84 | 8.3%), and Transportation & Warehousing (75 | 7.4%).
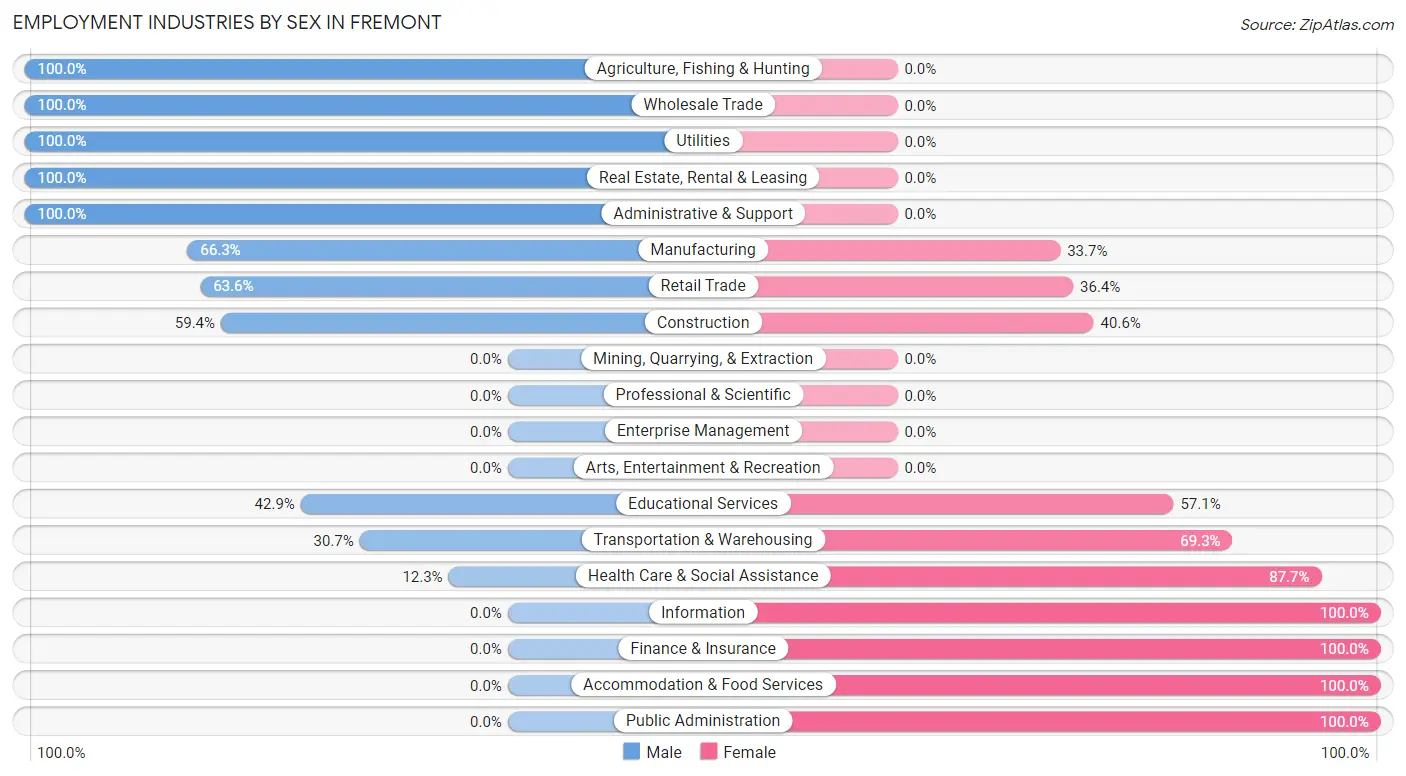
Employment Industries by Sex in Fremont
The Fremont industries that see more men than women are Agriculture, Fishing & Hunting (100.0%), Wholesale Trade (100.0%), and Utilities (100.0%), whereas the industries that tend to have a higher number of women are Information (100.0%), Finance & Insurance (100.0%), and Accommodation & Food Services (100.0%).
| Industry | Male | Female |
| Agriculture, Fishing & Hunting | 5 (100.0%) | 0 (0.0%) |
| Mining, Quarrying, & Extraction | 0 (0.0%) | 0 (0.0%) |
| Construction | 19 (59.4%) | 13 (40.6%) |
| Manufacturing | 242 (66.3%) | 123 (33.7%) |
| Wholesale Trade | 16 (100.0%) | 0 (0.0%) |
| Retail Trade | 63 (63.6%) | 36 (36.4%) |
| Transportation & Warehousing | 23 (30.7%) | 52 (69.3%) |
| Utilities | 12 (100.0%) | 0 (0.0%) |
| Information | 0 (0.0%) | 5 (100.0%) |
| Finance & Insurance | 0 (0.0%) | 36 (100.0%) |
| Real Estate, Rental & Leasing | 17 (100.0%) | 0 (0.0%) |
| Professional & Scientific | 0 (0.0%) | 0 (0.0%) |
| Enterprise Management | 0 (0.0%) | 0 (0.0%) |
| Administrative & Support | 12 (100.0%) | 0 (0.0%) |
| Educational Services | 36 (42.9%) | 48 (57.1%) |
| Health Care & Social Assistance | 20 (12.3%) | 143 (87.7%) |
| Arts, Entertainment & Recreation | 0 (0.0%) | 0 (0.0%) |
| Accommodation & Food Services | 0 (0.0%) | 21 (100.0%) |
| Public Administration | 0 (0.0%) | 27 (100.0%) |
| Total | 474 (46.8%) | 540 (53.2%) |
Education in Fremont
School Enrollment in Fremont
The most common levels of schooling among the 443 students in Fremont are middle school (195 | 44.0%), elementary school (89 | 20.1%), and high school (80 | 18.1%).
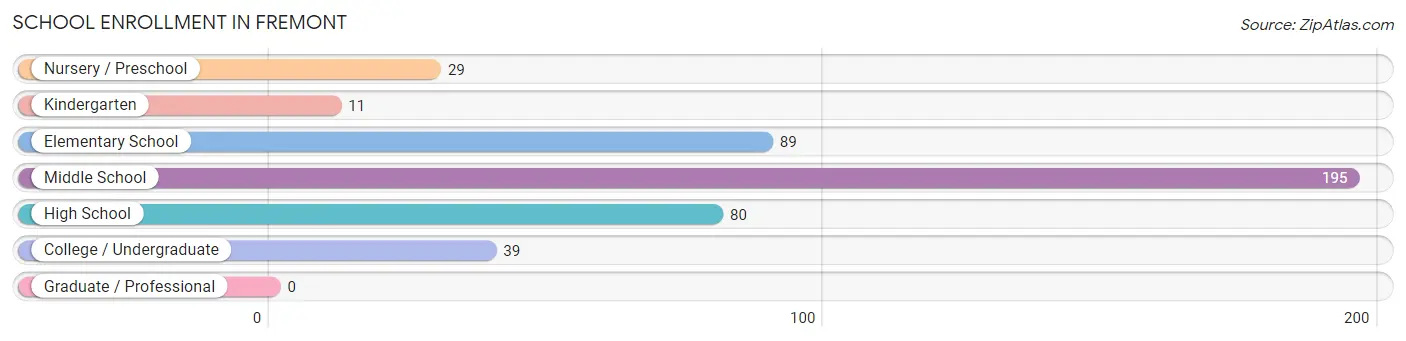
| School Level | # Students | % Students |
| Nursery / Preschool | 29 | 6.6% |
| Kindergarten | 11 | 2.5% |
| Elementary School | 89 | 20.1% |
| Middle School | 195 | 44.0% |
| High School | 80 | 18.1% |
| College / Undergraduate | 39 | 8.8% |
| Graduate / Professional | 0 | 0.0% |
| Total | 443 | 100.0% |
School Enrollment by Age by Funding Source in Fremont
Out of a total of 443 students who are enrolled in schools in Fremont, 9 (2.0%) attend a private institution, while the remaining 434 (98.0%) are enrolled in public schools. The age group of 15 to 17 year olds has the highest likelihood of being enrolled in private schools, with 4 (11.1% in the age bracket) enrolled. Conversely, the age group of 3 to 4 year olds has the lowest likelihood of being enrolled in a private school, with 26 (100.0% in the age bracket) attending a public institution.
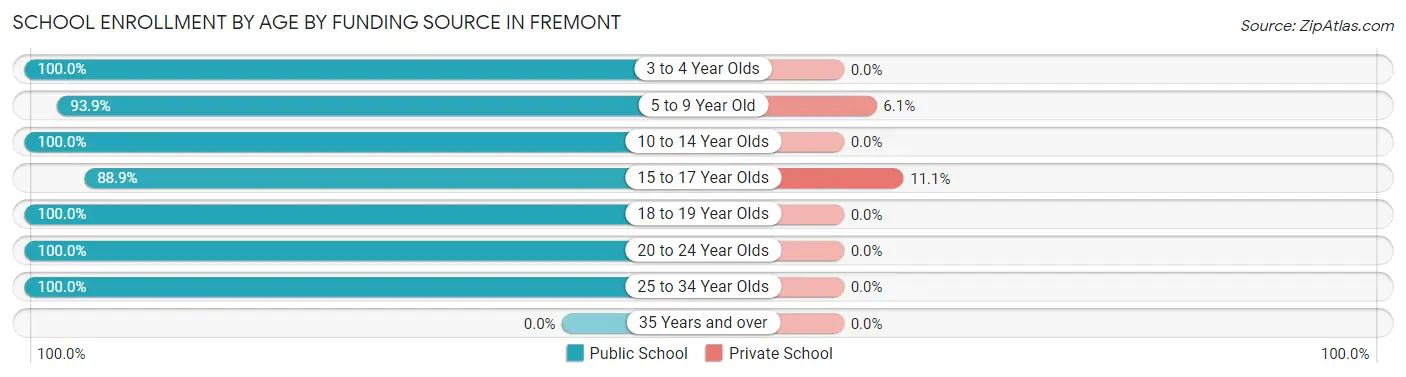
| Age Bracket | Public School | Private School |
| 3 to 4 Year Olds | 26 (100.0%) | 0 (0.0%) |
| 5 to 9 Year Old | 77 (93.9%) | 5 (6.1%) |
| 10 to 14 Year Olds | 216 (100.0%) | 0 (0.0%) |
| 15 to 17 Year Olds | 32 (88.9%) | 4 (11.1%) |
| 18 to 19 Year Olds | 50 (100.0%) | 0 (0.0%) |
| 20 to 24 Year Olds | 28 (100.0%) | 0 (0.0%) |
| 25 to 34 Year Olds | 5 (100.0%) | 0 (0.0%) |
| 35 Years and over | 0 (0.0%) | 0 (0.0%) |
| Total | 434 (98.0%) | 9 (2.0%) |
Educational Attainment by Field of Study in Fremont
Physical & health sciences (33 | 23.2%), engineering (30 | 21.1%), science & technology (20 | 14.1%), education (20 | 14.1%), and bio, nature & agricultural (14 | 9.9%) are the most common fields of study among 142 individuals in Fremont who have obtained a bachelor's degree or higher.
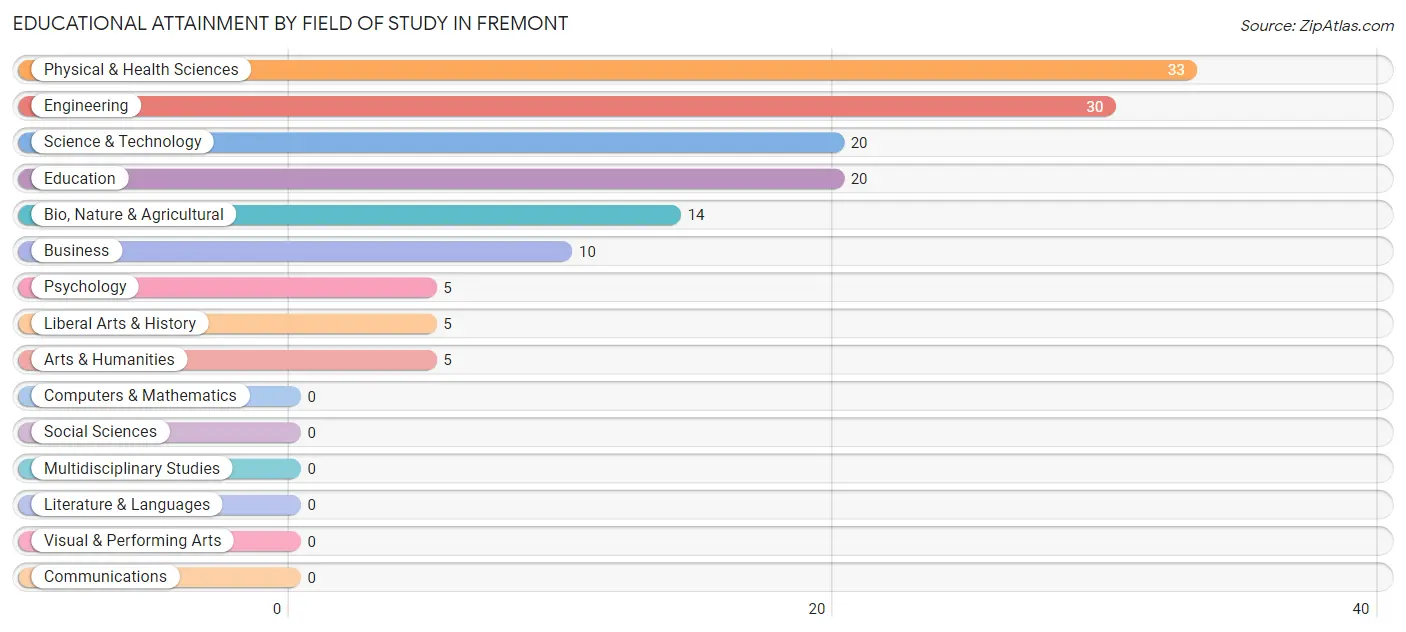
| Field of Study | # Graduates | % Graduates |
| Computers & Mathematics | 0 | 0.0% |
| Bio, Nature & Agricultural | 14 | 9.9% |
| Physical & Health Sciences | 33 | 23.2% |
| Psychology | 5 | 3.5% |
| Social Sciences | 0 | 0.0% |
| Engineering | 30 | 21.1% |
| Multidisciplinary Studies | 0 | 0.0% |
| Science & Technology | 20 | 14.1% |
| Business | 10 | 7.0% |
| Education | 20 | 14.1% |
| Literature & Languages | 0 | 0.0% |
| Liberal Arts & History | 5 | 3.5% |
| Visual & Performing Arts | 0 | 0.0% |
| Communications | 0 | 0.0% |
| Arts & Humanities | 5 | 3.5% |
| Total | 142 | 100.0% |
Transportation & Commute in Fremont
Vehicle Availability by Sex in Fremont
The most prevalent vehicle ownership categories in Fremont are males with 2 vehicles (233, accounting for 52.5%) and females with 2 vehicles (285, making up 44.6%).
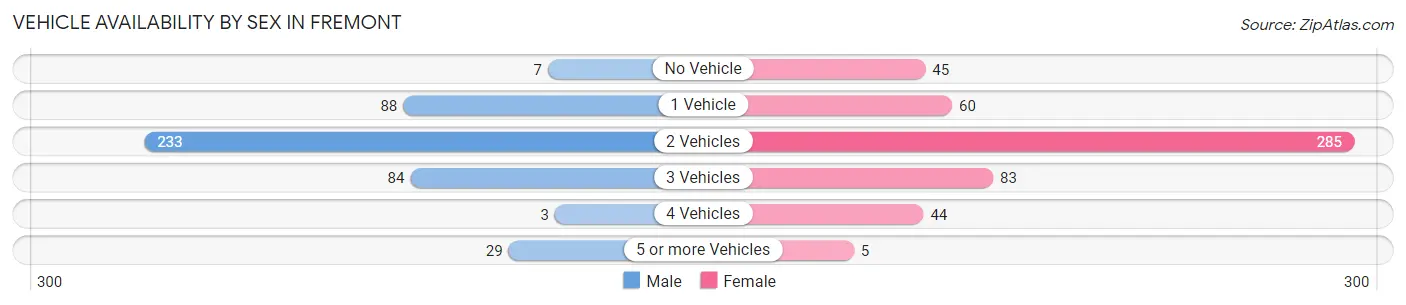
| Vehicles Available | Male | Female |
| No Vehicle | 7 (1.6%) | 45 (8.6%) |
| 1 Vehicle | 88 (19.8%) | 60 (11.5%) |
| 2 Vehicles | 233 (52.5%) | 285 (54.6%) |
| 3 Vehicles | 84 (18.9%) | 83 (15.9%) |
| 4 Vehicles | 3 (0.7%) | 44 (8.4%) |
| 5 or more Vehicles | 29 (6.5%) | 5 (1.0%) |
| Total | 444 (100.0%) | 522 (100.0%) |
Commute Time in Fremont
The most frequently occuring commute durations in Fremont are 15 to 19 minutes (191 commuters, 20.1%), 5 to 9 minutes (179 commuters, 18.9%), and less than 5 minutes (114 commuters, 12.0%).
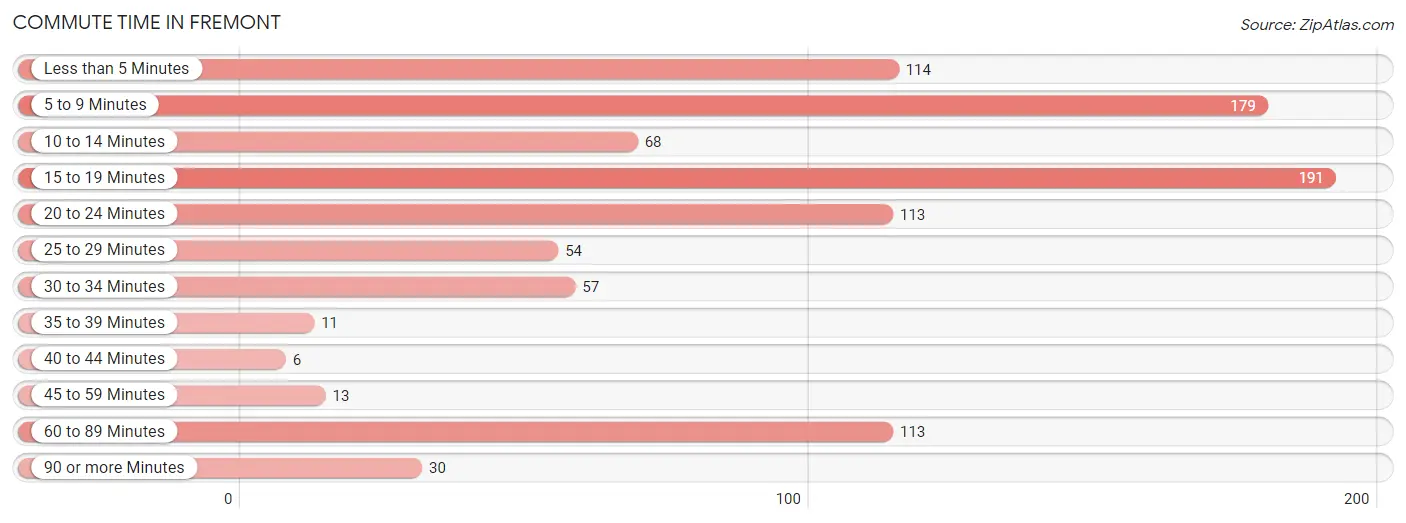
| Commute Time | # Commuters | % Commuters |
| Less than 5 Minutes | 114 | 12.0% |
| 5 to 9 Minutes | 179 | 18.9% |
| 10 to 14 Minutes | 68 | 7.2% |
| 15 to 19 Minutes | 191 | 20.1% |
| 20 to 24 Minutes | 113 | 11.9% |
| 25 to 29 Minutes | 54 | 5.7% |
| 30 to 34 Minutes | 57 | 6.0% |
| 35 to 39 Minutes | 11 | 1.2% |
| 40 to 44 Minutes | 6 | 0.6% |
| 45 to 59 Minutes | 13 | 1.4% |
| 60 to 89 Minutes | 113 | 11.9% |
| 90 or more Minutes | 30 | 3.2% |
Commute Time by Sex in Fremont
The most common commute times in Fremont are 5 to 9 minutes (100 commuters, 22.5%) for males and 15 to 19 minutes (133 commuters, 26.3%) for females.
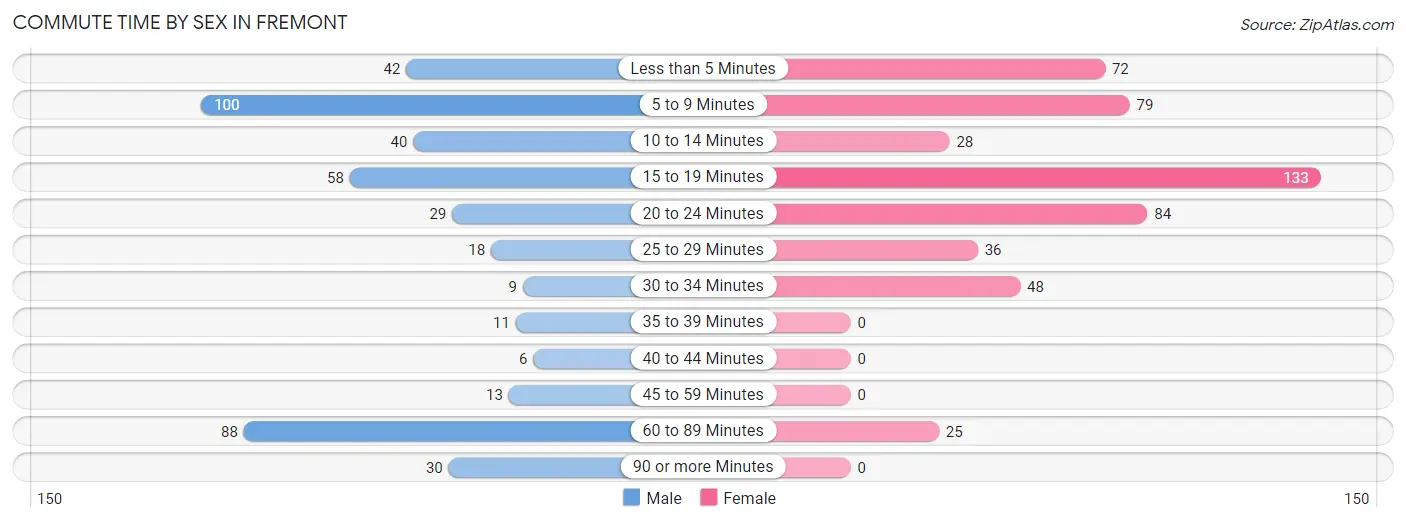
| Commute Time | Male | Female |
| Less than 5 Minutes | 42 (9.5%) | 72 (14.3%) |
| 5 to 9 Minutes | 100 (22.5%) | 79 (15.6%) |
| 10 to 14 Minutes | 40 (9.0%) | 28 (5.5%) |
| 15 to 19 Minutes | 58 (13.1%) | 133 (26.3%) |
| 20 to 24 Minutes | 29 (6.5%) | 84 (16.6%) |
| 25 to 29 Minutes | 18 (4.1%) | 36 (7.1%) |
| 30 to 34 Minutes | 9 (2.0%) | 48 (9.5%) |
| 35 to 39 Minutes | 11 (2.5%) | 0 (0.0%) |
| 40 to 44 Minutes | 6 (1.3%) | 0 (0.0%) |
| 45 to 59 Minutes | 13 (2.9%) | 0 (0.0%) |
| 60 to 89 Minutes | 88 (19.8%) | 25 (5.0%) |
| 90 or more Minutes | 30 (6.8%) | 0 (0.0%) |
Time of Departure to Work by Sex in Fremont
The most frequent times of departure to work in Fremont are 6:30 AM to 6:59 AM (78, 17.6%) for males and 5:30 AM to 5:59 AM (74, 14.6%) for females.
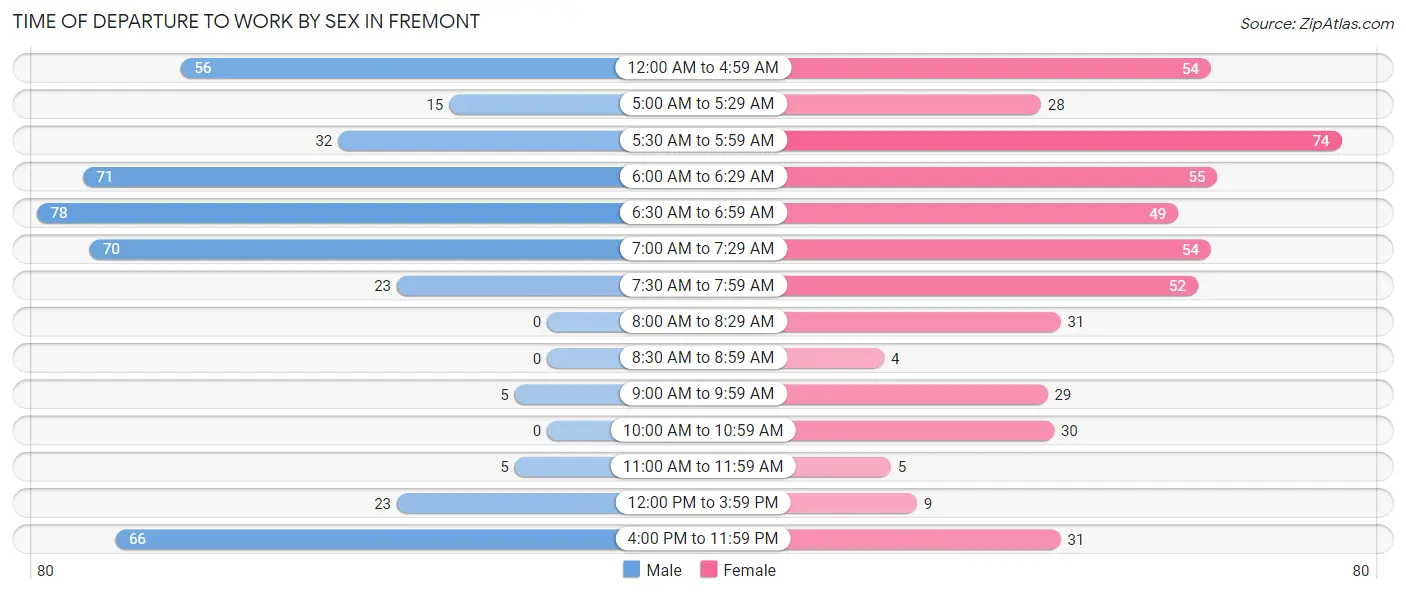
| Time of Departure | Male | Female |
| 12:00 AM to 4:59 AM | 56 (12.6%) | 54 (10.7%) |
| 5:00 AM to 5:29 AM | 15 (3.4%) | 28 (5.5%) |
| 5:30 AM to 5:59 AM | 32 (7.2%) | 74 (14.6%) |
| 6:00 AM to 6:29 AM | 71 (16.0%) | 55 (10.9%) |
| 6:30 AM to 6:59 AM | 78 (17.6%) | 49 (9.7%) |
| 7:00 AM to 7:29 AM | 70 (15.8%) | 54 (10.7%) |
| 7:30 AM to 7:59 AM | 23 (5.2%) | 52 (10.3%) |
| 8:00 AM to 8:29 AM | 0 (0.0%) | 31 (6.1%) |
| 8:30 AM to 8:59 AM | 0 (0.0%) | 4 (0.8%) |
| 9:00 AM to 9:59 AM | 5 (1.1%) | 29 (5.7%) |
| 10:00 AM to 10:59 AM | 0 (0.0%) | 30 (5.9%) |
| 11:00 AM to 11:59 AM | 5 (1.1%) | 5 (1.0%) |
| 12:00 PM to 3:59 PM | 23 (5.2%) | 9 (1.8%) |
| 4:00 PM to 11:59 PM | 66 (14.9%) | 31 (6.1%) |
| Total | 444 (100.0%) | 505 (100.0%) |
Housing Occupancy in Fremont
Occupancy by Ownership in Fremont
Of the total 886 dwellings in Fremont, owner-occupied units account for 702 (79.2%), while renter-occupied units make up 184 (20.8%).
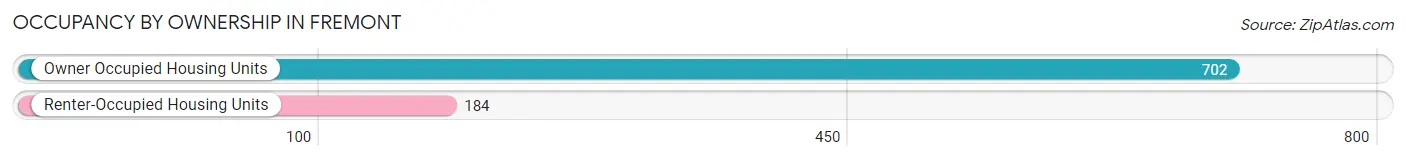
| Occupancy | # Housing Units | % Housing Units |
| Owner Occupied Housing Units | 702 | 79.2% |
| Renter-Occupied Housing Units | 184 | 20.8% |
| Total Occupied Housing Units | 886 | 100.0% |
Occupancy by Household Size in Fremont
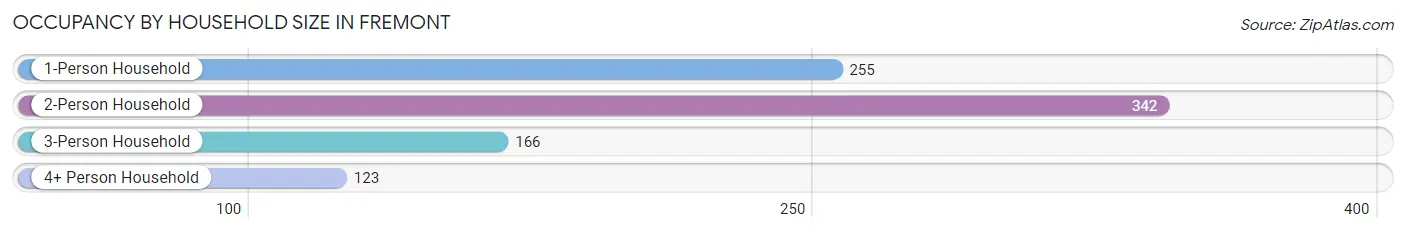
| Household Size | # Housing Units | % Housing Units |
| 1-Person Household | 255 | 28.8% |
| 2-Person Household | 342 | 38.6% |
| 3-Person Household | 166 | 18.7% |
| 4+ Person Household | 123 | 13.9% |
| Total Housing Units | 886 | 100.0% |
Occupancy by Ownership by Household Size in Fremont
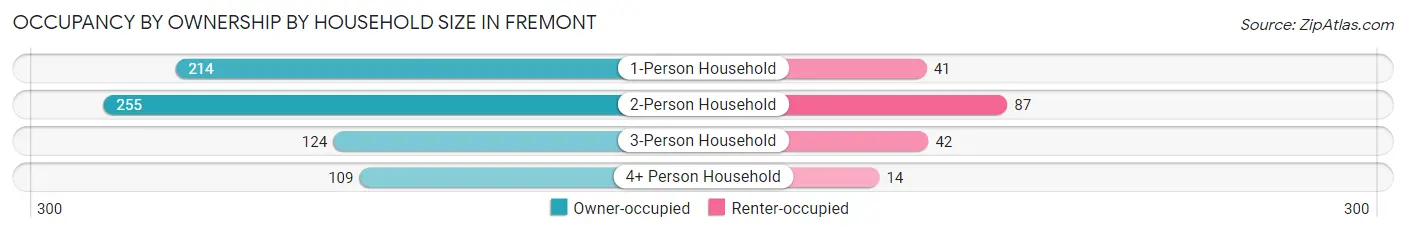
| Household Size | Owner-occupied | Renter-occupied |
| 1-Person Household | 214 (83.9%) | 41 (16.1%) |
| 2-Person Household | 255 (74.6%) | 87 (25.4%) |
| 3-Person Household | 124 (74.7%) | 42 (25.3%) |
| 4+ Person Household | 109 (88.6%) | 14 (11.4%) |
| Total Housing Units | 702 (79.2%) | 184 (20.8%) |
Occupancy by Educational Attainment in Fremont
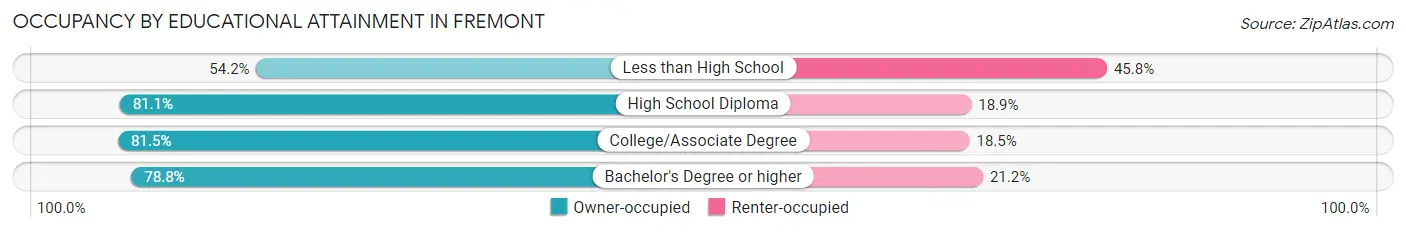
| Household Size | Owner-occupied | Renter-occupied |
| Less than High School | 32 (54.2%) | 27 (45.8%) |
| High School Diploma | 383 (81.1%) | 89 (18.9%) |
| College/Associate Degree | 220 (81.5%) | 50 (18.5%) |
| Bachelor's Degree or higher | 67 (78.8%) | 18 (21.2%) |
Occupancy by Age of Householder in Fremont
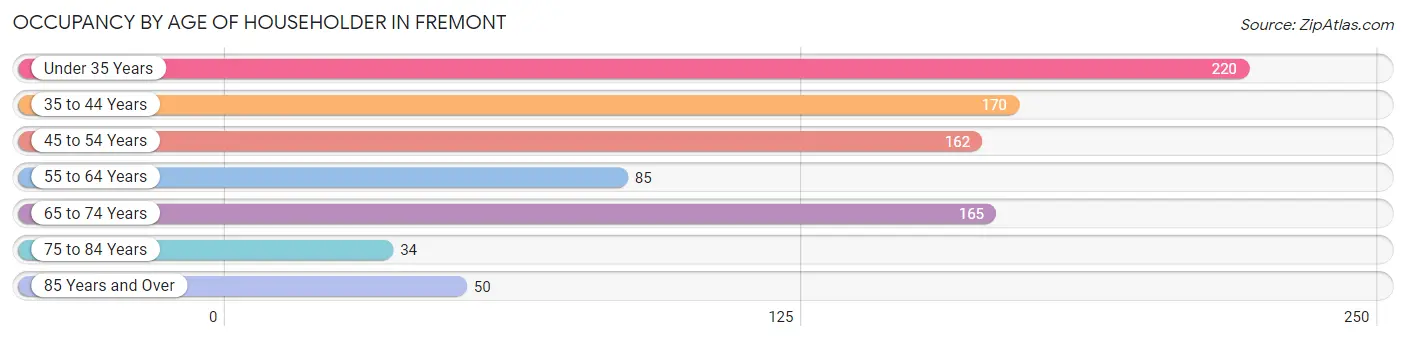
| Age Bracket | # Households | % Households |
| Under 35 Years | 220 | 24.8% |
| 35 to 44 Years | 170 | 19.2% |
| 45 to 54 Years | 162 | 18.3% |
| 55 to 64 Years | 85 | 9.6% |
| 65 to 74 Years | 165 | 18.6% |
| 75 to 84 Years | 34 | 3.8% |
| 85 Years and Over | 50 | 5.6% |
| Total | 886 | 100.0% |
Housing Finances in Fremont
Median Income by Occupancy in Fremont
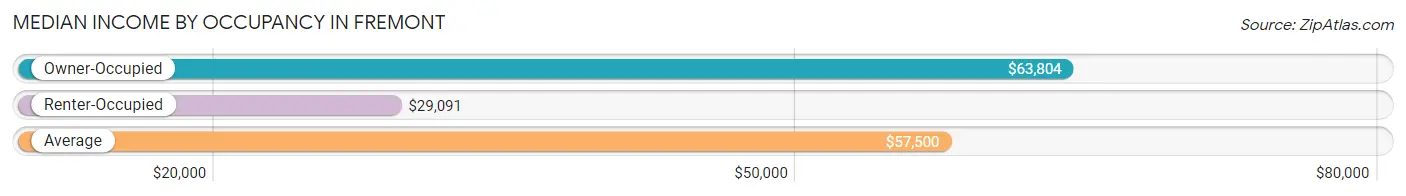
| Occupancy Type | # Households | Median Income |
| Owner-Occupied | 702 (79.2%) | $63,804 |
| Renter-Occupied | 184 (20.8%) | $29,091 |
| Average | 886 (100.0%) | $57,500 |
Occupancy by Householder Income Bracket in Fremont
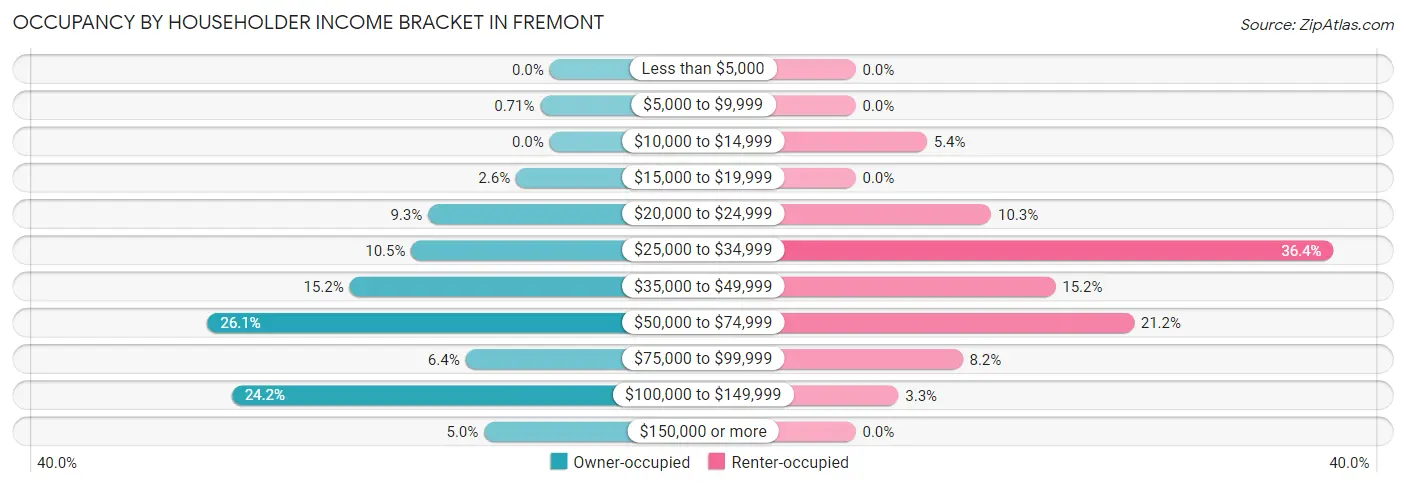
| Income Bracket | Owner-occupied | Renter-occupied |
| Less than $5,000 | 0 (0.0%) | 0 (0.0%) |
| $5,000 to $9,999 | 5 (0.7%) | 0 (0.0%) |
| $10,000 to $14,999 | 0 (0.0%) | 10 (5.4%) |
| $15,000 to $19,999 | 18 (2.6%) | 0 (0.0%) |
| $20,000 to $24,999 | 65 (9.3%) | 19 (10.3%) |
| $25,000 to $34,999 | 74 (10.5%) | 67 (36.4%) |
| $35,000 to $49,999 | 107 (15.2%) | 28 (15.2%) |
| $50,000 to $74,999 | 183 (26.1%) | 39 (21.2%) |
| $75,000 to $99,999 | 45 (6.4%) | 15 (8.2%) |
| $100,000 to $149,999 | 170 (24.2%) | 6 (3.3%) |
| $150,000 or more | 35 (5.0%) | 0 (0.0%) |
| Total | 702 (100.0%) | 184 (100.0%) |
Monthly Housing Cost Tiers in Fremont
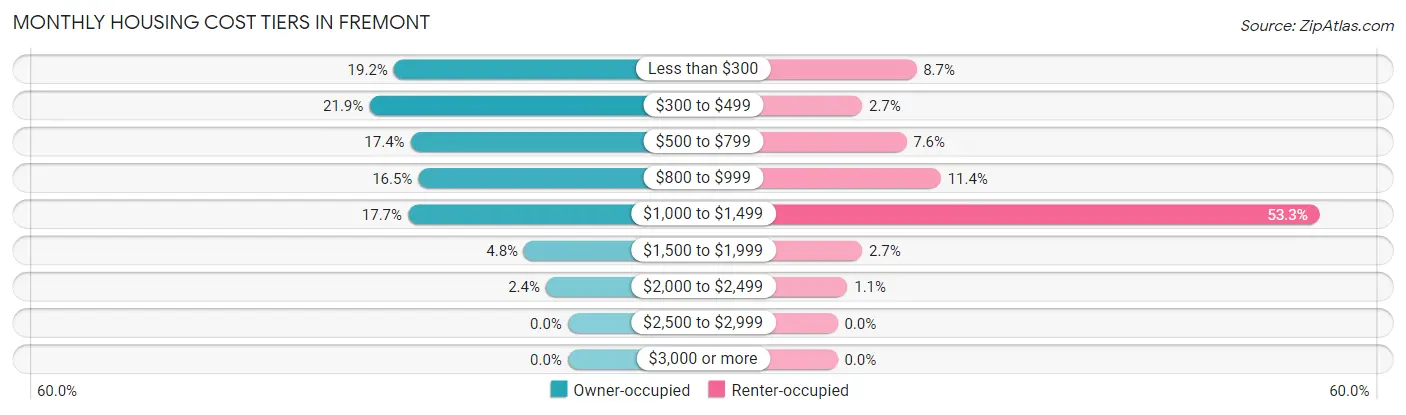
| Monthly Cost | Owner-occupied | Renter-occupied |
| Less than $300 | 135 (19.2%) | 16 (8.7%) |
| $300 to $499 | 154 (21.9%) | 5 (2.7%) |
| $500 to $799 | 122 (17.4%) | 14 (7.6%) |
| $800 to $999 | 116 (16.5%) | 21 (11.4%) |
| $1,000 to $1,499 | 124 (17.7%) | 98 (53.3%) |
| $1,500 to $1,999 | 34 (4.8%) | 5 (2.7%) |
| $2,000 to $2,499 | 17 (2.4%) | 2 (1.1%) |
| $2,500 to $2,999 | 0 (0.0%) | 0 (0.0%) |
| $3,000 or more | 0 (0.0%) | 0 (0.0%) |
| Total | 702 (100.0%) | 184 (100.0%) |
Physical Housing Characteristics in Fremont
Housing Structures in Fremont
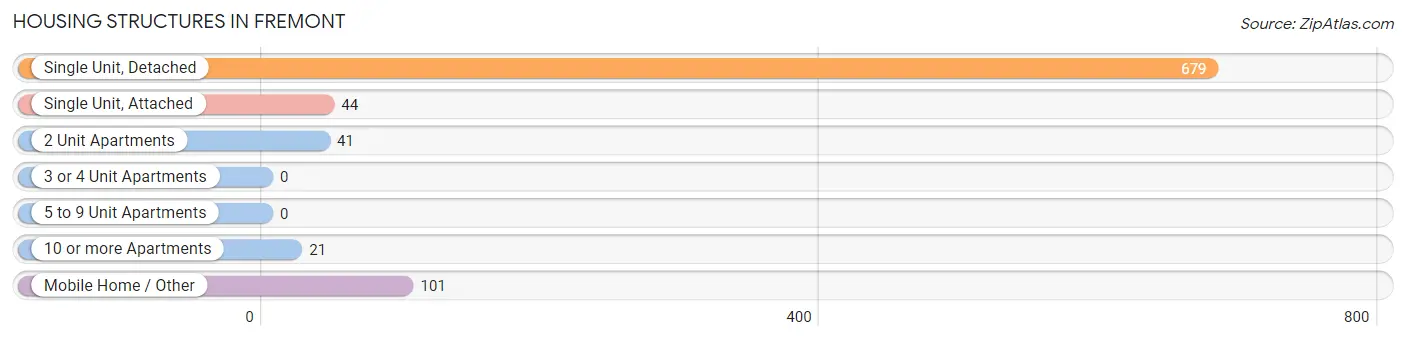
| Structure Type | # Housing Units | % Housing Units |
| Single Unit, Detached | 679 | 76.6% |
| Single Unit, Attached | 44 | 5.0% |
| 2 Unit Apartments | 41 | 4.6% |
| 3 or 4 Unit Apartments | 0 | 0.0% |
| 5 to 9 Unit Apartments | 0 | 0.0% |
| 10 or more Apartments | 21 | 2.4% |
| Mobile Home / Other | 101 | 11.4% |
| Total | 886 | 100.0% |
Housing Structures by Occupancy in Fremont
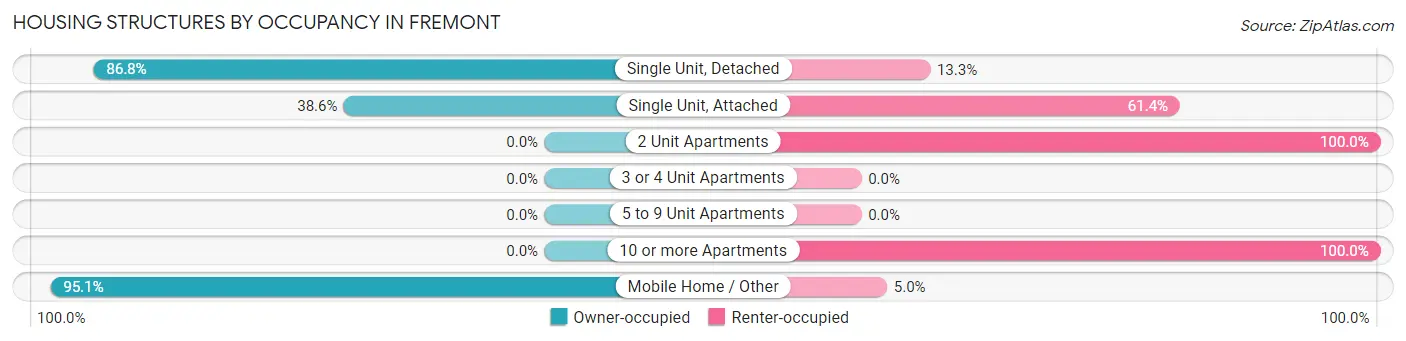
| Structure Type | Owner-occupied | Renter-occupied |
| Single Unit, Detached | 589 (86.8%) | 90 (13.3%) |
| Single Unit, Attached | 17 (38.6%) | 27 (61.4%) |
| 2 Unit Apartments | 0 (0.0%) | 41 (100.0%) |
| 3 or 4 Unit Apartments | 0 (0.0%) | 0 (0.0%) |
| 5 to 9 Unit Apartments | 0 (0.0%) | 0 (0.0%) |
| 10 or more Apartments | 0 (0.0%) | 21 (100.0%) |
| Mobile Home / Other | 96 (95.1%) | 5 (5.0%) |
| Total | 702 (79.2%) | 184 (20.8%) |
Housing Structures by Number of Rooms in Fremont
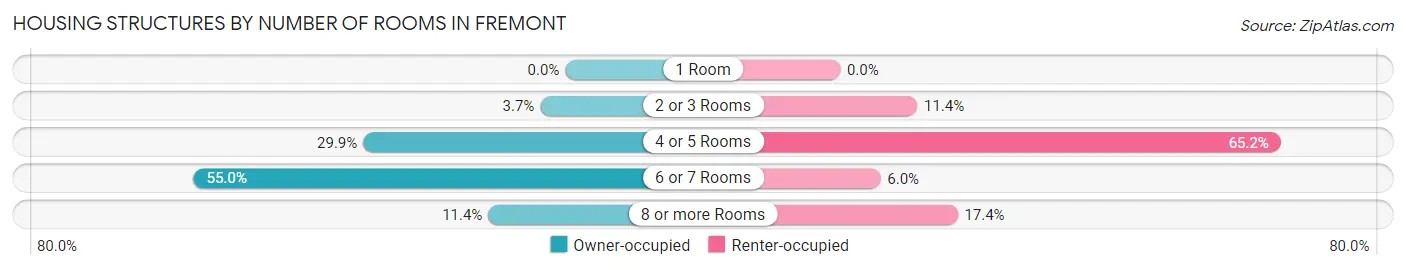
| Number of Rooms | Owner-occupied | Renter-occupied |
| 1 Room | 0 (0.0%) | 0 (0.0%) |
| 2 or 3 Rooms | 26 (3.7%) | 21 (11.4%) |
| 4 or 5 Rooms | 210 (29.9%) | 120 (65.2%) |
| 6 or 7 Rooms | 386 (55.0%) | 11 (6.0%) |
| 8 or more Rooms | 80 (11.4%) | 32 (17.4%) |
| Total | 702 (100.0%) | 184 (100.0%) |
Housing Structure by Heating Type in Fremont
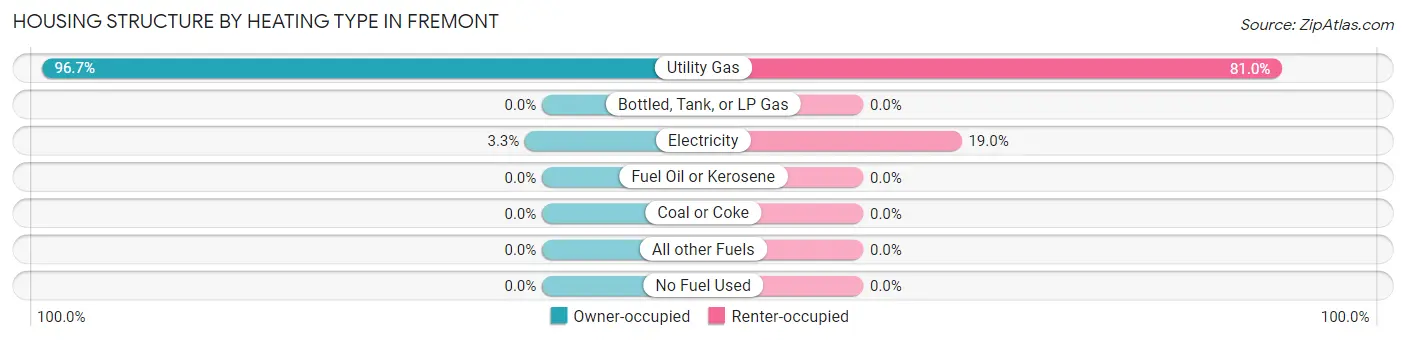
| Heating Type | Owner-occupied | Renter-occupied |
| Utility Gas | 679 (96.7%) | 149 (81.0%) |
| Bottled, Tank, or LP Gas | 0 (0.0%) | 0 (0.0%) |
| Electricity | 23 (3.3%) | 35 (19.0%) |
| Fuel Oil or Kerosene | 0 (0.0%) | 0 (0.0%) |
| Coal or Coke | 0 (0.0%) | 0 (0.0%) |
| All other Fuels | 0 (0.0%) | 0 (0.0%) |
| No Fuel Used | 0 (0.0%) | 0 (0.0%) |
| Total | 702 (100.0%) | 184 (100.0%) |
Household Vehicle Usage in Fremont
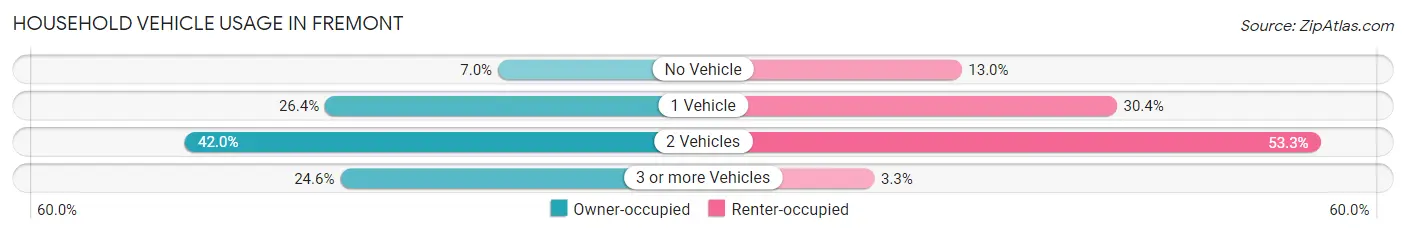
| Vehicles per Household | Owner-occupied | Renter-occupied |
| No Vehicle | 49 (7.0%) | 24 (13.0%) |
| 1 Vehicle | 185 (26.4%) | 56 (30.4%) |
| 2 Vehicles | 295 (42.0%) | 98 (53.3%) |
| 3 or more Vehicles | 173 (24.6%) | 6 (3.3%) |
| Total | 702 (100.0%) | 184 (100.0%) |
Real Estate & Mortgages in Fremont
Real Estate and Mortgage Overview in Fremont
| Characteristic | Without Mortgage | With Mortgage |
| Housing Units | 318 | 384 |
| Median Property Value | $121,000 | $119,800 |
| Median Household Income | $63,421 | $26 |
| Monthly Housing Costs | $326 | $0 |
| Real Estate Taxes | $605 | $25 |
Property Value by Mortgage Status in Fremont
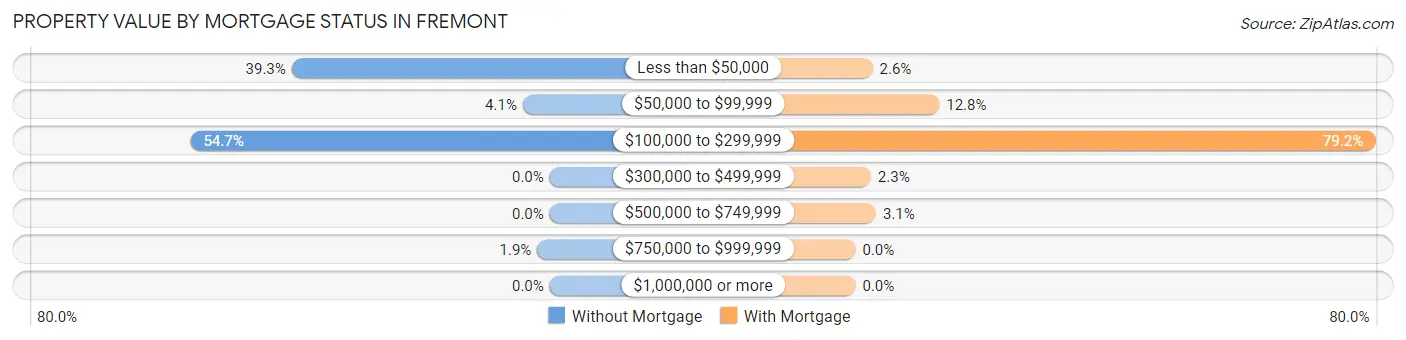
| Property Value | Without Mortgage | With Mortgage |
| Less than $50,000 | 125 (39.3%) | 10 (2.6%) |
| $50,000 to $99,999 | 13 (4.1%) | 49 (12.8%) |
| $100,000 to $299,999 | 174 (54.7%) | 304 (79.2%) |
| $300,000 to $499,999 | 0 (0.0%) | 9 (2.3%) |
| $500,000 to $749,999 | 0 (0.0%) | 12 (3.1%) |
| $750,000 to $999,999 | 6 (1.9%) | 0 (0.0%) |
| $1,000,000 or more | 0 (0.0%) | 0 (0.0%) |
| Total | 318 (100.0%) | 384 (100.0%) |
Household Income by Mortgage Status in Fremont
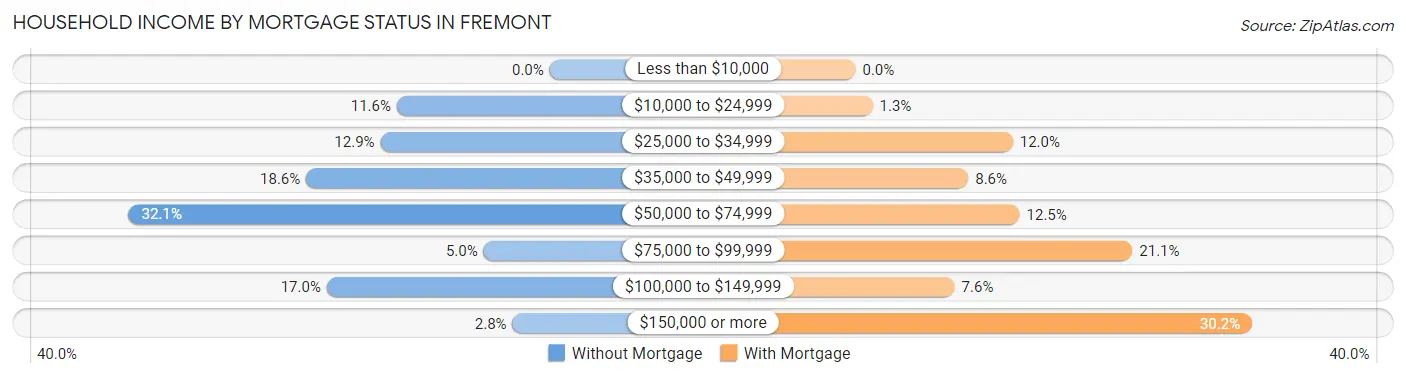
| Household Income | Without Mortgage | With Mortgage |
| Less than $10,000 | 0 (0.0%) | 0 (0.0%) |
| $10,000 to $24,999 | 37 (11.6%) | 5 (1.3%) |
| $25,000 to $34,999 | 41 (12.9%) | 46 (12.0%) |
| $35,000 to $49,999 | 59 (18.5%) | 33 (8.6%) |
| $50,000 to $74,999 | 102 (32.1%) | 48 (12.5%) |
| $75,000 to $99,999 | 16 (5.0%) | 81 (21.1%) |
| $100,000 to $149,999 | 54 (17.0%) | 29 (7.5%) |
| $150,000 or more | 9 (2.8%) | 116 (30.2%) |
| Total | 318 (100.0%) | 384 (100.0%) |
Property Value to Household Income Ratio in Fremont
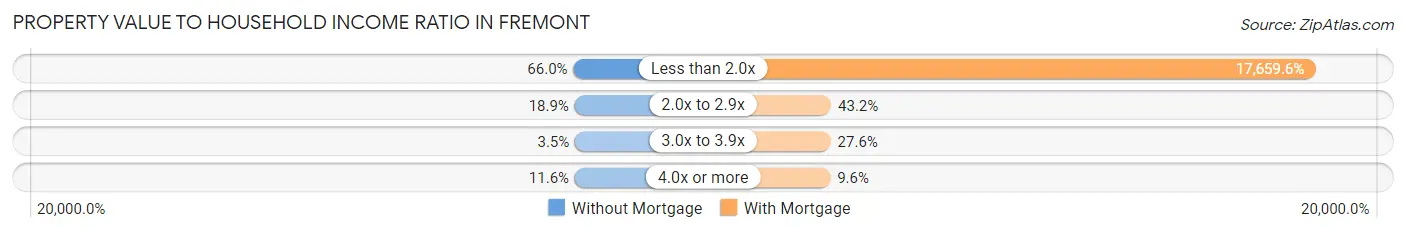
| Value-to-Income Ratio | Without Mortgage | With Mortgage |
| Less than 2.0x | 210 (66.0%) | 67,813 (17,659.6%) |
| 2.0x to 2.9x | 60 (18.9%) | 166 (43.2%) |
| 3.0x to 3.9x | 11 (3.5%) | 106 (27.6%) |
| 4.0x or more | 37 (11.6%) | 37 (9.6%) |
| Total | 318 (100.0%) | 384 (100.0%) |
Real Estate Taxes by Mortgage Status in Fremont
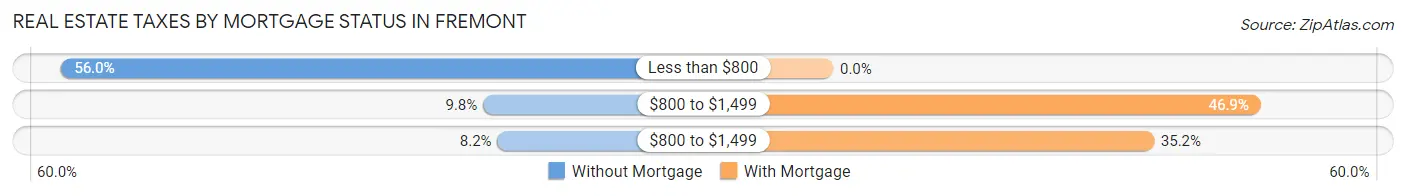
| Property Taxes | Without Mortgage | With Mortgage |
| Less than $800 | 178 (56.0%) | 0 (0.0%) |
| $800 to $1,499 | 31 (9.8%) | 180 (46.9%) |
| $800 to $1,499 | 26 (8.2%) | 135 (35.2%) |
| Total | 318 (100.0%) | 384 (100.0%) |
Health & Disability in Fremont
Health Insurance Coverage by Age in Fremont
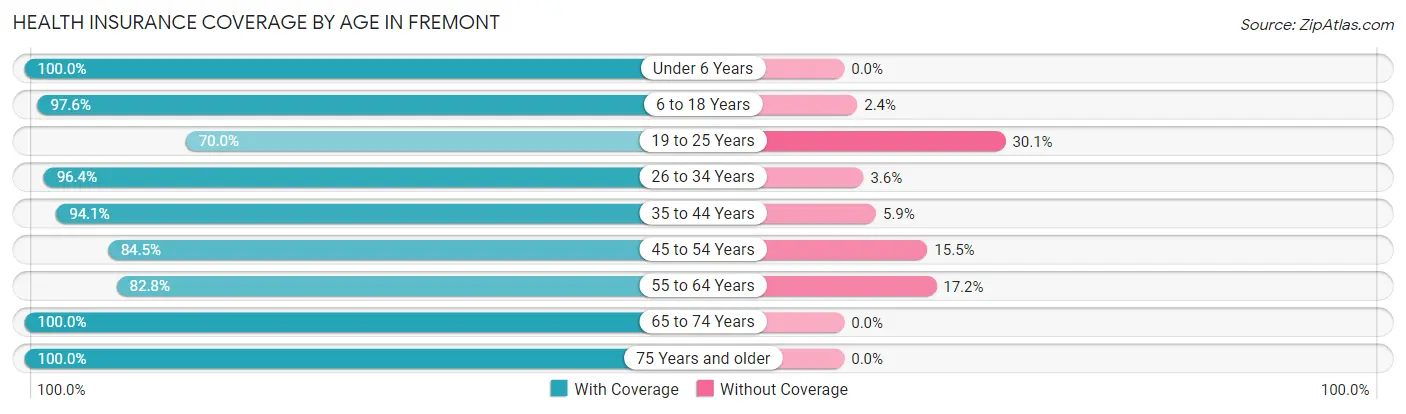
| Age Bracket | With Coverage | Without Coverage |
| Under 6 Years | 139 (100.0%) | 0 (0.0%) |
| 6 to 18 Years | 404 (97.6%) | 10 (2.4%) |
| 19 to 25 Years | 128 (70.0%) | 55 (30.0%) |
| 26 to 34 Years | 270 (96.4%) | 10 (3.6%) |
| 35 to 44 Years | 270 (94.1%) | 17 (5.9%) |
| 45 to 54 Years | 278 (84.5%) | 51 (15.5%) |
| 55 to 64 Years | 140 (82.8%) | 29 (17.2%) |
| 65 to 74 Years | 232 (100.0%) | 0 (0.0%) |
| 75 Years and older | 137 (100.0%) | 0 (0.0%) |
| Total | 1,998 (92.1%) | 172 (7.9%) |
Health Insurance Coverage by Citizenship Status in Fremont
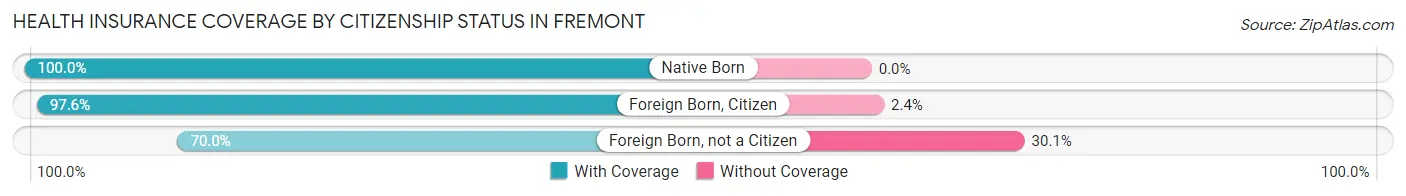
| Citizenship Status | With Coverage | Without Coverage |
| Native Born | 139 (100.0%) | 0 (0.0%) |
| Foreign Born, Citizen | 404 (97.6%) | 10 (2.4%) |
| Foreign Born, not a Citizen | 128 (70.0%) | 55 (30.0%) |
Health Insurance Coverage by Household Income in Fremont
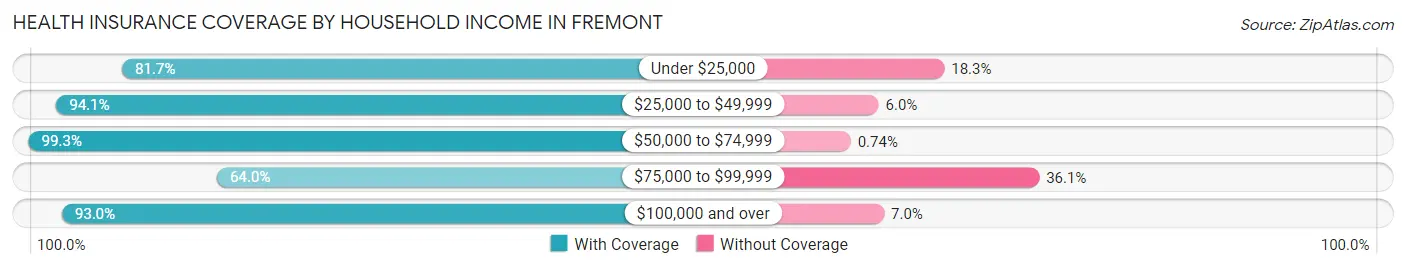
| Household Income | With Coverage | Without Coverage |
| Under $25,000 | 188 (81.7%) | 42 (18.3%) |
| $25,000 to $49,999 | 537 (94.1%) | 34 (5.9%) |
| $50,000 to $74,999 | 673 (99.3%) | 5 (0.7%) |
| $75,000 to $99,999 | 94 (63.9%) | 53 (36.0%) |
| $100,000 and over | 506 (93.0%) | 38 (7.0%) |
Public vs Private Health Insurance Coverage by Age in Fremont
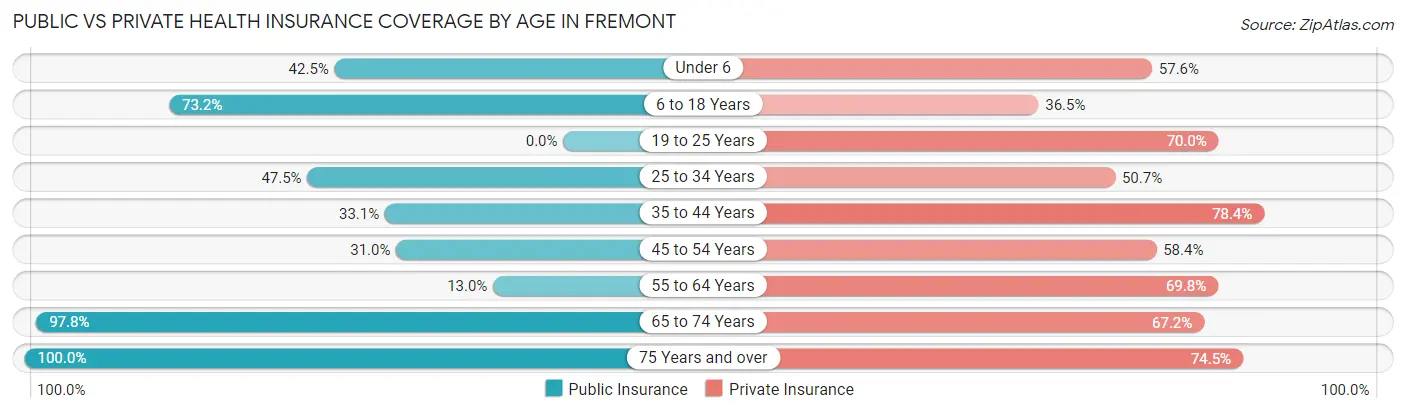
| Age Bracket | Public Insurance | Private Insurance |
| Under 6 | 59 (42.4%) | 80 (57.6%) |
| 6 to 18 Years | 303 (73.2%) | 151 (36.5%) |
| 19 to 25 Years | 0 (0.0%) | 128 (70.0%) |
| 25 to 34 Years | 133 (47.5%) | 142 (50.7%) |
| 35 to 44 Years | 95 (33.1%) | 225 (78.4%) |
| 45 to 54 Years | 102 (31.0%) | 192 (58.4%) |
| 55 to 64 Years | 22 (13.0%) | 118 (69.8%) |
| 65 to 74 Years | 227 (97.8%) | 156 (67.2%) |
| 75 Years and over | 137 (100.0%) | 102 (74.5%) |
| Total | 1,078 (49.7%) | 1,294 (59.6%) |
Disability Status by Sex by Age in Fremont
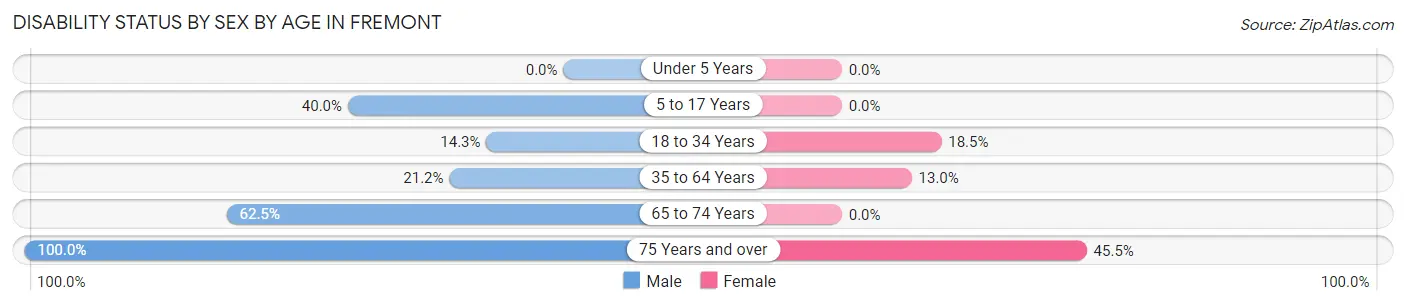
| Age Bracket | Male | Female |
| Under 5 Years | 0 (0.0%) | 0 (0.0%) |
| 5 to 17 Years | 68 (40.0%) | 0 (0.0%) |
| 18 to 34 Years | 44 (14.3%) | 46 (18.5%) |
| 35 to 64 Years | 91 (21.2%) | 46 (13.0%) |
| 65 to 74 Years | 75 (62.5%) | 0 (0.0%) |
| 75 Years and over | 49 (100.0%) | 40 (45.5%) |
Disability Class by Sex by Age in Fremont
Disability Class: Hearing Difficulty
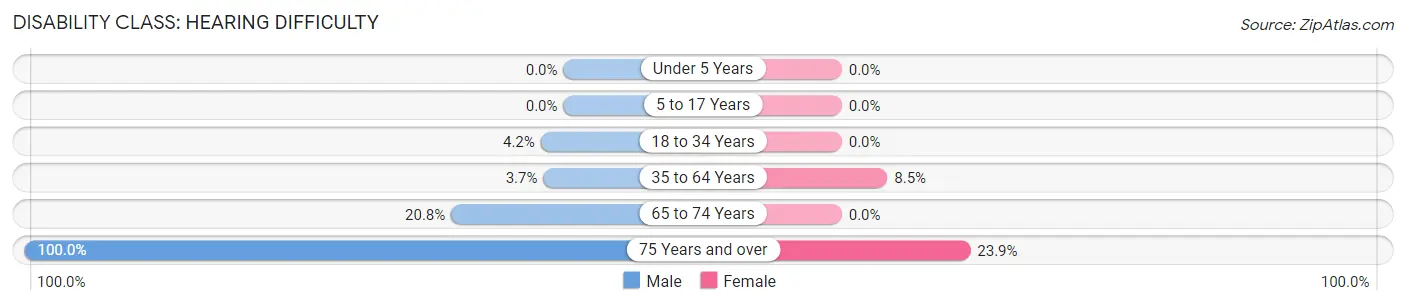
| Age Bracket | Male | Female |
| Under 5 Years | 0 (0.0%) | 0 (0.0%) |
| 5 to 17 Years | 0 (0.0%) | 0 (0.0%) |
| 18 to 34 Years | 13 (4.2%) | 0 (0.0%) |
| 35 to 64 Years | 16 (3.7%) | 30 (8.5%) |
| 65 to 74 Years | 25 (20.8%) | 0 (0.0%) |
| 75 Years and over | 49 (100.0%) | 21 (23.9%) |
Disability Class: Vision Difficulty
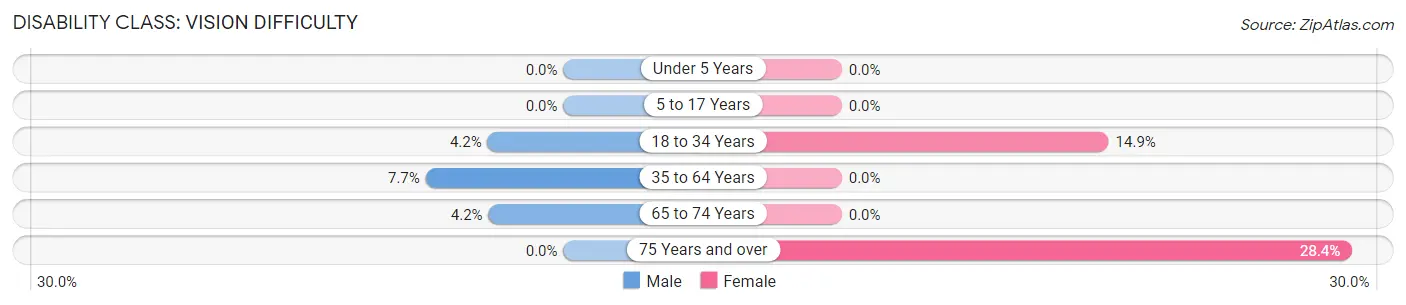
| Age Bracket | Male | Female |
| Under 5 Years | 0 (0.0%) | 0 (0.0%) |
| 5 to 17 Years | 0 (0.0%) | 0 (0.0%) |
| 18 to 34 Years | 13 (4.2%) | 37 (14.9%) |
| 35 to 64 Years | 33 (7.7%) | 0 (0.0%) |
| 65 to 74 Years | 5 (4.2%) | 0 (0.0%) |
| 75 Years and over | 0 (0.0%) | 25 (28.4%) |
Disability Class: Cognitive Difficulty
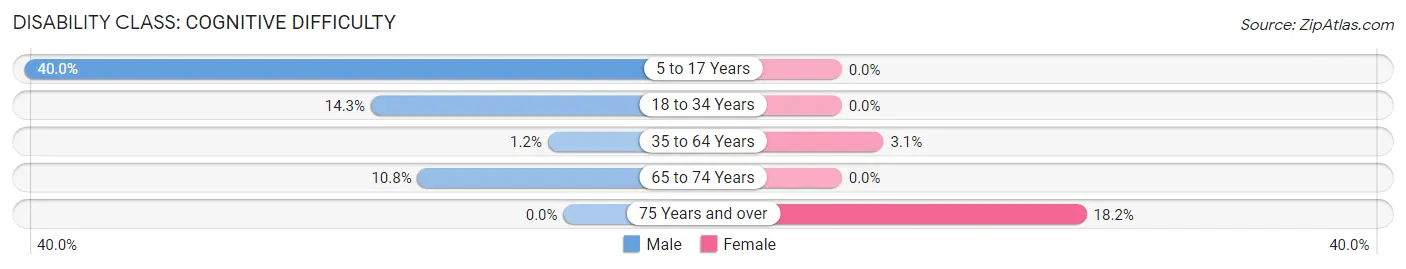
| Age Bracket | Male | Female |
| 5 to 17 Years | 68 (40.0%) | 0 (0.0%) |
| 18 to 34 Years | 44 (14.3%) | 0 (0.0%) |
| 35 to 64 Years | 5 (1.2%) | 11 (3.1%) |
| 65 to 74 Years | 13 (10.8%) | 0 (0.0%) |
| 75 Years and over | 0 (0.0%) | 16 (18.2%) |
Disability Class: Ambulatory Difficulty
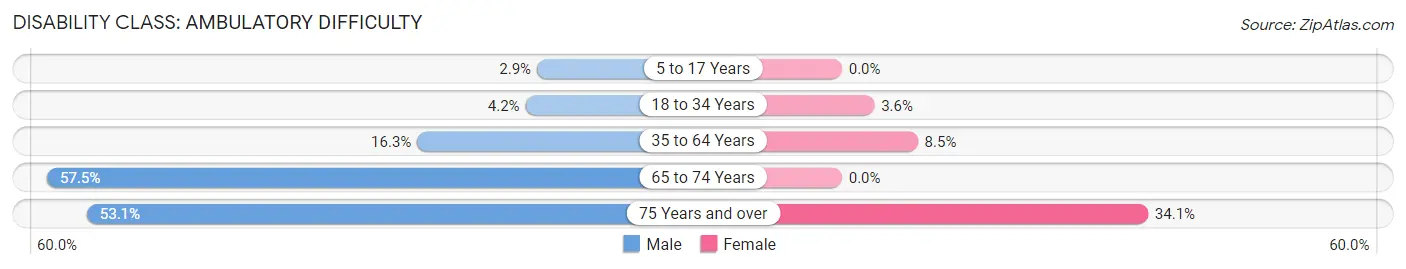
| Age Bracket | Male | Female |
| 5 to 17 Years | 5 (2.9%) | 0 (0.0%) |
| 18 to 34 Years | 13 (4.2%) | 9 (3.6%) |
| 35 to 64 Years | 70 (16.3%) | 30 (8.5%) |
| 65 to 74 Years | 69 (57.5%) | 0 (0.0%) |
| 75 Years and over | 26 (53.1%) | 30 (34.1%) |
Disability Class: Self-Care Difficulty
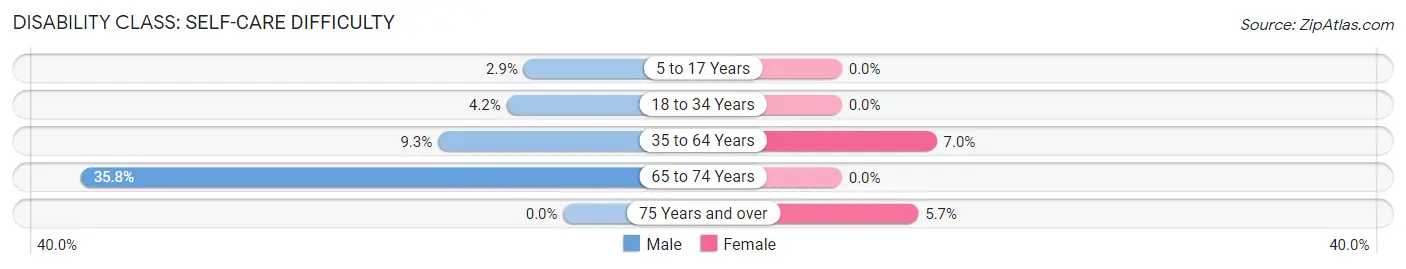
| Age Bracket | Male | Female |
| 5 to 17 Years | 5 (2.9%) | 0 (0.0%) |
| 18 to 34 Years | 13 (4.2%) | 0 (0.0%) |
| 35 to 64 Years | 40 (9.3%) | 25 (7.0%) |
| 65 to 74 Years | 43 (35.8%) | 0 (0.0%) |
| 75 Years and over | 0 (0.0%) | 5 (5.7%) |
Technology Access in Fremont
Computing Device Access in Fremont
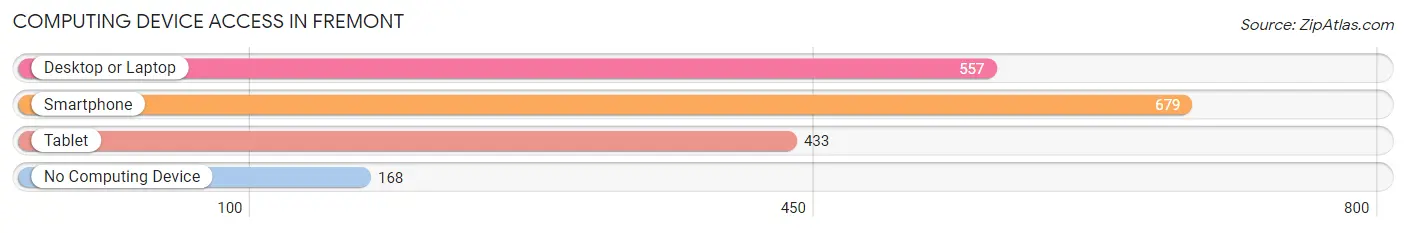
| Device Type | # Households | % Households |
| Desktop or Laptop | 557 | 62.9% |
| Smartphone | 679 | 76.6% |
| Tablet | 433 | 48.9% |
| No Computing Device | 168 | 19.0% |
| Total | 886 | 100.0% |
Internet Access in Fremont
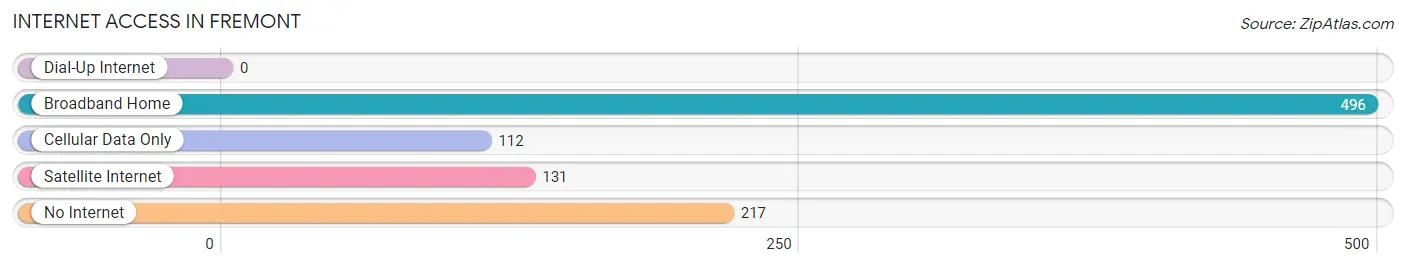
| Internet Type | # Households | % Households |
| Dial-Up Internet | 0 | 0.0% |
| Broadband Home | 496 | 56.0% |
| Cellular Data Only | 112 | 12.6% |
| Satellite Internet | 131 | 14.8% |
| No Internet | 217 | 24.5% |
| Total | 886 | 100.0% |
Fremont Summary
Fremont, Indiana is a small town located in Steuben County, Indiana. It is situated on the banks of the St. Joseph River and is part of the Fort Wayne metropolitan area. The town has a population of approximately 1,500 people and is known for its small-town charm and friendly atmosphere.
History
Fremont was founded in 1837 by a group of settlers from Ohio. The town was named after General John C. Fremont, a famous explorer and politician. The town was originally a farming community, but it soon developed into a manufacturing center. The first industry in Fremont was a sawmill, which was built in 1845. The town also had a gristmill, a woolen mill, and a tannery.
In the late 19th century, Fremont became a popular tourist destination. The town was known for its beautiful scenery and its many outdoor activities, such as fishing, hunting, and boating. The town also had a number of hotels and resorts, which attracted visitors from all over the country.
Geography
Fremont is located in the northeastern corner of Steuben County, Indiana. It is situated on the banks of the St. Joseph River and is part of the Fort Wayne metropolitan area. The town is surrounded by rolling hills and farmland. The nearest major city is Fort Wayne, which is located about 25 miles to the south.
Economy
Fremont’s economy is largely based on agriculture and manufacturing. The town is home to several large farms, which produce corn, soybeans, and other crops. The town also has several manufacturing plants, which produce a variety of products, including furniture, automotive parts, and medical supplies.
Demographics
As of the 2010 census, Fremont had a population of 1,500 people. The racial makeup of the town was 95.3% White, 0.7% African American, 0.3% Native American, 0.7% Asian, 0.3% from other races, and 2.7% from two or more races. The median household income was $37,500, and the median family income was $45,000.
Fremont is a small town with a rich history and a friendly atmosphere. It is a great place to live and work, and it offers a variety of activities and attractions for visitors and residents alike. The town is a great place to raise a family, and it is a great place to call home.
Common Questions
What is Per Capita Income in Fremont?
Per Capita income in Fremont is $27,874.
What is the Median Family Income in Fremont?
Median Family Income in Fremont is $61,417.
What is the Median Household income in Fremont?
Median Household Income in Fremont is $57,500.
What is Income or Wage Gap in Fremont?
Income or Wage Gap in Fremont is 45.2%.
Women in Fremont earn 54.8 cents for every dollar earned by a man.
What is Family Income Deficit in Fremont?
Family Income Deficit in Fremont is $12,570.
Families that are below poverty line in Fremont earn $12,570 less on average than the poverty threshold level.
What is Inequality or Gini Index in Fremont?
Inequality or Gini Index in Fremont is 0.36.
What is the Total Population of Fremont?
Total Population of Fremont is 2,170.
What is the Total Male Population of Fremont?
Total Male Population of Fremont is 1,161.
What is the Total Female Population of Fremont?
Total Female Population of Fremont is 1,009.
What is the Ratio of Males per 100 Females in Fremont?
There are 115.06 Males per 100 Females in Fremont.
What is the Ratio of Females per 100 Males in Fremont?
There are 86.91 Females per 100 Males in Fremont.
What is the Median Population Age in Fremont?
Median Population Age in Fremont is 36.3 Years.
What is the Average Family Size in Fremont
Average Family Size in Fremont is 2.9 People.
What is the Average Household Size in Fremont
Average Household Size in Fremont is 2.5 People.
How Large is the Labor Force in Fremont?
There are 1,157 People in the Labor Forcein in Fremont.
What is the Percentage of People in the Labor Force in Fremont?
66.9% of People are in the Labor Force in Fremont.
What is the Unemployment Rate in Fremont?
Unemployment Rate in Fremont is 12.3%.