Frankton, IN Map & Demographics
Frankton Map
Frankton Overview
$29,778
PER CAPITA INCOME
$75,478
AVG FAMILY INCOME
$57,250
AVG HOUSEHOLD INCOME
13.7%
WAGE / INCOME GAP [ % ]
86.3¢/ $1
WAGE / INCOME GAP [ $ ]
0.42
INEQUALITY / GINI INDEX
1,849
TOTAL POPULATION
955
MALE POPULATION
894
FEMALE POPULATION
106.82
MALES / 100 FEMALES
93.61
FEMALES / 100 MALES
42.0
MEDIAN AGE
3.1
AVG FAMILY SIZE
2.6
AVG HOUSEHOLD SIZE
910
LABOR FORCE [ PEOPLE ]
61.1%
PERCENT IN LABOR FORCE
2.6%
UNEMPLOYMENT RATE
Frankton Zip Codes
Frankton Area Codes
Income in Frankton
Income Overview in Frankton
Per Capita Income in Frankton is $29,778, while median incomes of families and households are $75,478 and $57,250 respectively.
| Characteristic | Number | Measure |
| Per Capita Income | 1,849 | $29,778 |
| Median Family Income | 499 | $75,478 |
| Mean Family Income | 499 | $86,843 |
| Median Household Income | 723 | $57,250 |
| Mean Household Income | 723 | $71,937 |
| Income Deficit | 499 | $0 |
| Wage / Income Gap (%) | 1,849 | 13.71% |
| Wage / Income Gap ($) | 1,849 | 86.29¢ per $1 |
| Gini / Inequality Index | 1,849 | 0.42 |
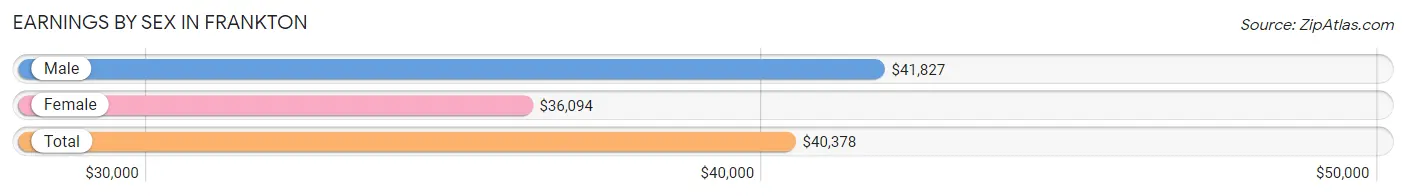
Earnings by Sex in Frankton
Average Earnings in Frankton are $40,378, $41,827 for men and $36,094 for women, a difference of 13.7%.
| Sex | Number | Average Earnings |
| Male | 488 (51.7%) | $41,827 |
| Female | 455 (48.2%) | $36,094 |
| Total | 943 (100.0%) | $40,378 |
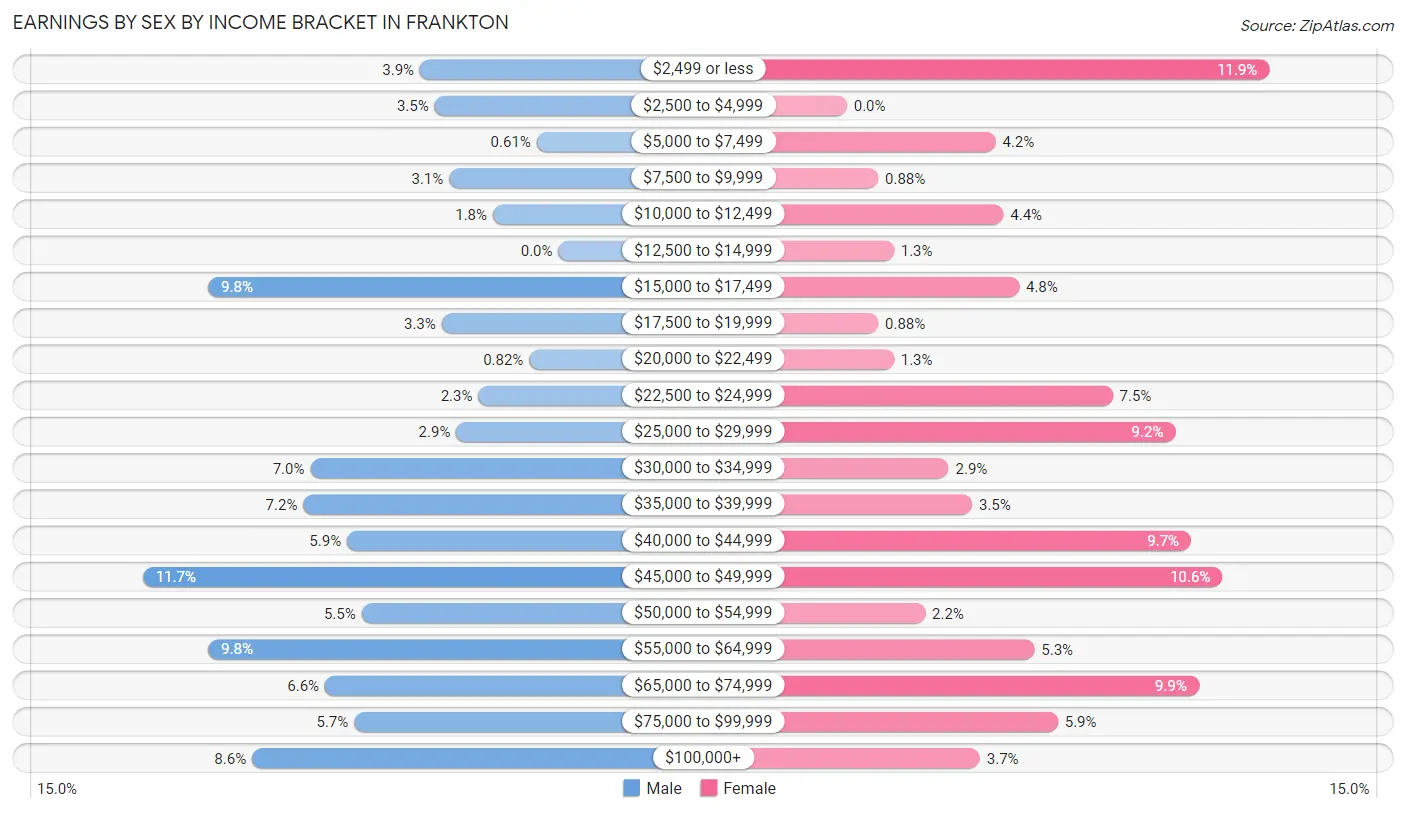
Earnings by Sex by Income Bracket in Frankton
The most common earnings brackets in Frankton are $45,000 to $49,999 for men (57 | 11.7%) and $2,499 or less for women (54 | 11.9%).
| Income | Male | Female |
| $2,499 or less | 19 (3.9%) | 54 (11.9%) |
| $2,500 to $4,999 | 17 (3.5%) | 0 (0.0%) |
| $5,000 to $7,499 | 3 (0.6%) | 19 (4.2%) |
| $7,500 to $9,999 | 15 (3.1%) | 4 (0.9%) |
| $10,000 to $12,499 | 9 (1.8%) | 20 (4.4%) |
| $12,500 to $14,999 | 0 (0.0%) | 6 (1.3%) |
| $15,000 to $17,499 | 48 (9.8%) | 22 (4.8%) |
| $17,500 to $19,999 | 16 (3.3%) | 4 (0.9%) |
| $20,000 to $22,499 | 4 (0.8%) | 6 (1.3%) |
| $22,500 to $24,999 | 11 (2.2%) | 34 (7.5%) |
| $25,000 to $29,999 | 14 (2.9%) | 42 (9.2%) |
| $30,000 to $34,999 | 34 (7.0%) | 13 (2.9%) |
| $35,000 to $39,999 | 35 (7.2%) | 16 (3.5%) |
| $40,000 to $44,999 | 29 (5.9%) | 44 (9.7%) |
| $45,000 to $49,999 | 57 (11.7%) | 48 (10.5%) |
| $50,000 to $54,999 | 27 (5.5%) | 10 (2.2%) |
| $55,000 to $64,999 | 48 (9.8%) | 24 (5.3%) |
| $65,000 to $74,999 | 32 (6.6%) | 45 (9.9%) |
| $75,000 to $99,999 | 28 (5.7%) | 27 (5.9%) |
| $100,000+ | 42 (8.6%) | 17 (3.7%) |
| Total | 488 (100.0%) | 455 (100.0%) |
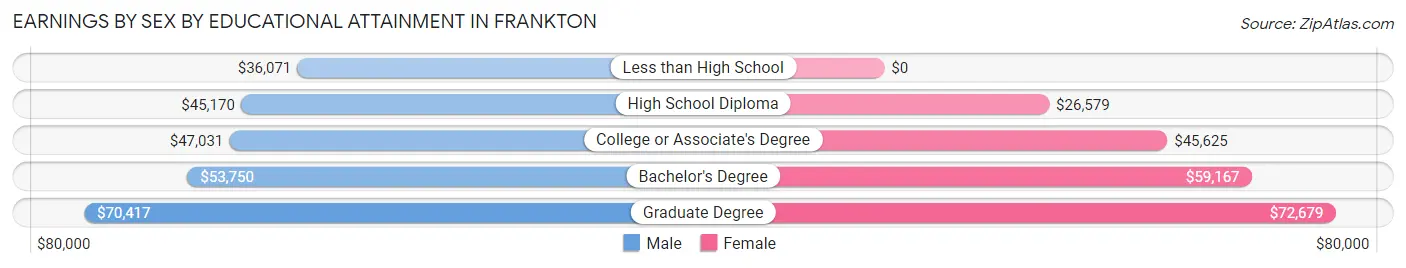
Earnings by Sex by Educational Attainment in Frankton
Average earnings in Frankton are $45,865 for men and $43,148 for women, a difference of 5.9%. Men with an educational attainment of graduate degree enjoy the highest average annual earnings of $70,417, while those with less than high school education earn the least with $36,071. Women with an educational attainment of graduate degree earn the most with the average annual earnings of $72,679, while those with high school diploma education have the smallest earnings of $26,579.
| Educational Attainment | Male Income | Female Income |
| Less than High School | $36,071 | $0 |
| High School Diploma | $45,170 | $26,579 |
| College or Associate's Degree | $47,031 | $45,625 |
| Bachelor's Degree | $53,750 | $59,167 |
| Graduate Degree | $70,417 | $72,679 |
| Total | $45,865 | $43,148 |
Family Income in Frankton
Family Income Brackets in Frankton
According to the Frankton family income data, there are 107 families falling into the $100,000 to $149,999 income range, which is the most common income bracket and makes up 21.4% of all families. Conversely, the $200,000+ income bracket is the least frequent group with only 8 families (1.6%) belonging to this category.
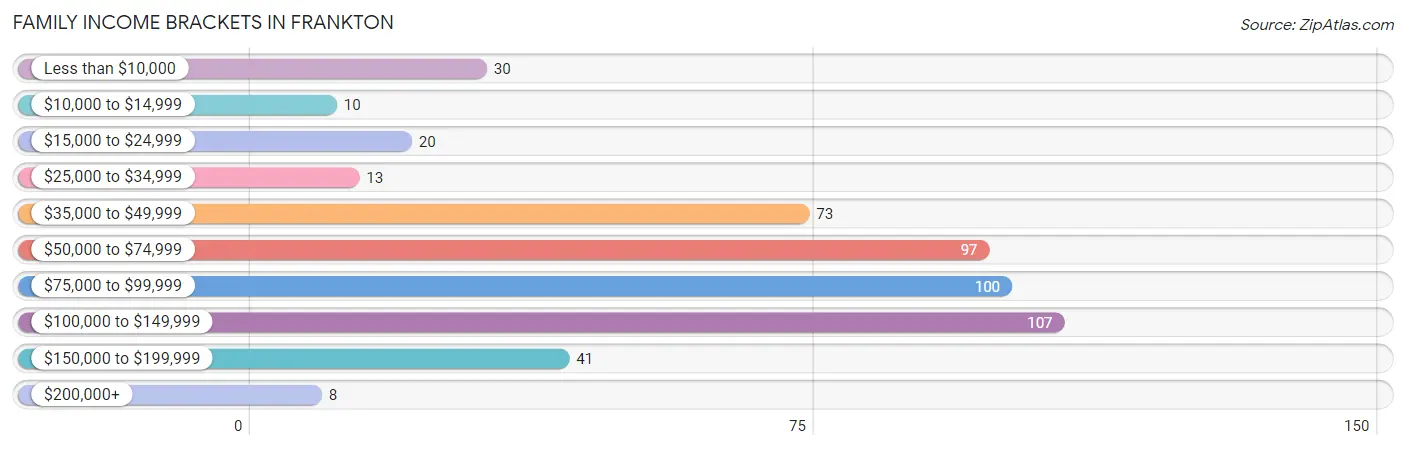
| Income Bracket | # Families | % Families |
| Less than $10,000 | 30 | 6.0% |
| $10,000 to $14,999 | 10 | 2.0% |
| $15,000 to $24,999 | 20 | 4.0% |
| $25,000 to $34,999 | 13 | 2.6% |
| $35,000 to $49,999 | 73 | 14.6% |
| $50,000 to $74,999 | 97 | 19.4% |
| $75,000 to $99,999 | 100 | 20.0% |
| $100,000 to $149,999 | 107 | 21.4% |
| $150,000 to $199,999 | 41 | 8.2% |
| $200,000+ | 8 | 1.6% |
Family Income by Famaliy Size in Frankton
5-person families (45 | 9.0%) account for the highest median family income in Frankton with $114,219 per family, while 2-person families (236 | 47.3%) have the highest median income of $34,062 per family member.
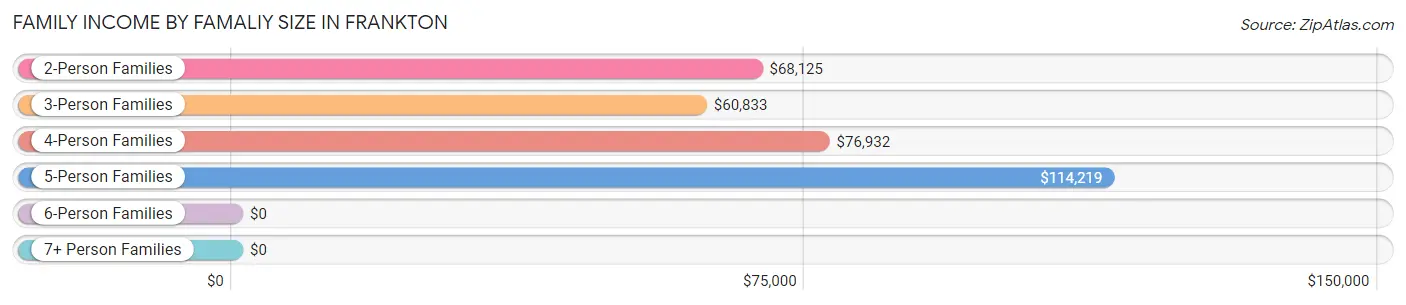
| Income Bracket | # Families | Median Income |
| 2-Person Families | 236 (47.3%) | $68,125 |
| 3-Person Families | 116 (23.3%) | $60,833 |
| 4-Person Families | 99 (19.8%) | $76,932 |
| 5-Person Families | 45 (9.0%) | $114,219 |
| 6-Person Families | 2 (0.4%) | $0 |
| 7+ Person Families | 1 (0.2%) | $0 |
| Total | 499 (100.0%) | $75,478 |
Family Income by Number of Earners in Frankton
The median family income in Frankton is $75,478, with families comprising 3+ earners (50) having the highest median family income of $115,833, while families with no earners (88) have the lowest median family income of $37,381, accounting for 10.0% and 17.6% of families, respectively.
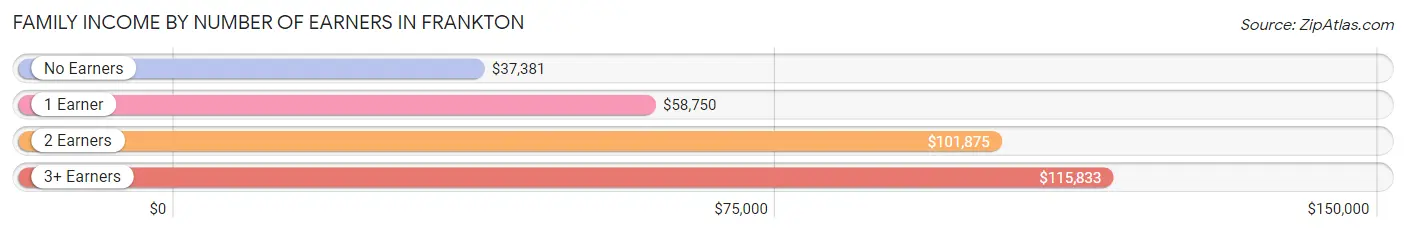
| Number of Earners | # Families | Median Income |
| No Earners | 88 (17.6%) | $37,381 |
| 1 Earner | 126 (25.3%) | $58,750 |
| 2 Earners | 235 (47.1%) | $101,875 |
| 3+ Earners | 50 (10.0%) | $115,833 |
| Total | 499 (100.0%) | $75,478 |
Household Income in Frankton
Household Income Brackets in Frankton
With 148 households falling in the category, the $35,000 to $49,999 income range is the most frequent in Frankton, accounting for 20.5% of all households. In contrast, only 8 households (1.1%) fall into the $200,000+ income bracket, making it the least populous group.
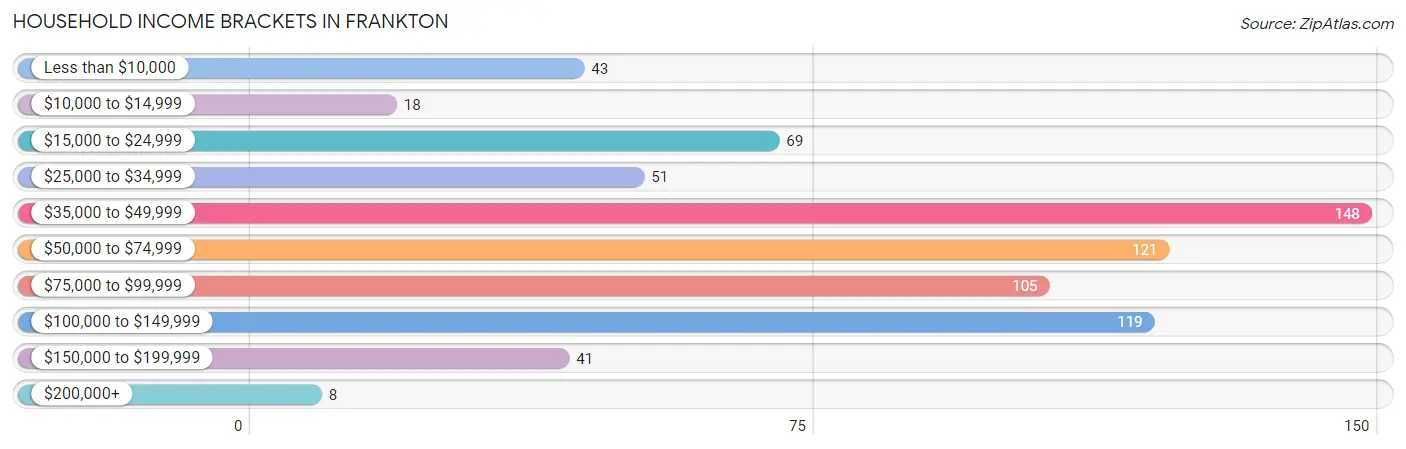
| Income Bracket | # Households | % Households |
| Less than $10,000 | 43 | 5.9% |
| $10,000 to $14,999 | 18 | 2.5% |
| $15,000 to $24,999 | 69 | 9.5% |
| $25,000 to $34,999 | 51 | 7.1% |
| $35,000 to $49,999 | 148 | 20.5% |
| $50,000 to $74,999 | 121 | 16.7% |
| $75,000 to $99,999 | 105 | 14.5% |
| $100,000 to $149,999 | 119 | 16.5% |
| $150,000 to $199,999 | 41 | 5.7% |
| $200,000+ | 8 | 1.1% |
Household Income by Householder Age in Frankton
The median household income in Frankton is $57,250, with the highest median household income of $75,568 found in the 25 to 44 years age bracket for the primary householder. A total of 209 households (28.9%) fall into this category. Meanwhile, the 15 to 24 years age bracket for the primary householder has the lowest median household income of $0, with 18 households (2.5%) in this group.
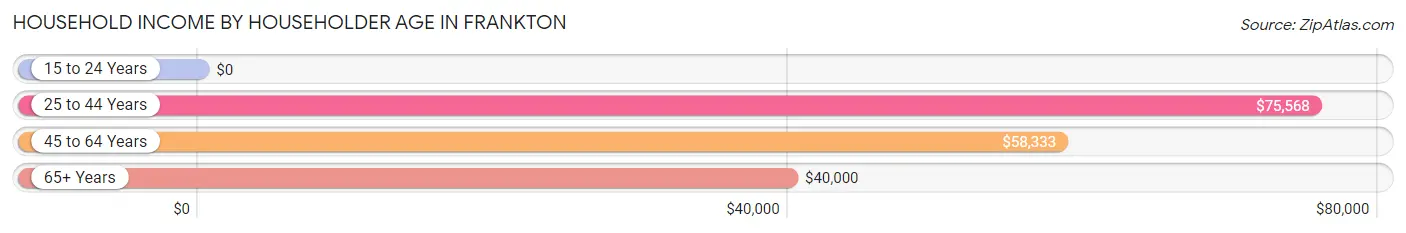
| Income Bracket | # Households | Median Income |
| 15 to 24 Years | 18 (2.5%) | $0 |
| 25 to 44 Years | 209 (28.9%) | $75,568 |
| 45 to 64 Years | 308 (42.6%) | $58,333 |
| 65+ Years | 188 (26.0%) | $40,000 |
| Total | 723 (100.0%) | $57,250 |
Poverty in Frankton
Income Below Poverty by Sex and Age in Frankton
With 9.2% poverty level for males and 11.7% for females among the residents of Frankton, 5 year old males and 16 and 17 year old females are the most vulnerable to poverty, with 2 males (66.7%) and 10 females (23.8%) in their respective age groups living below the poverty level.
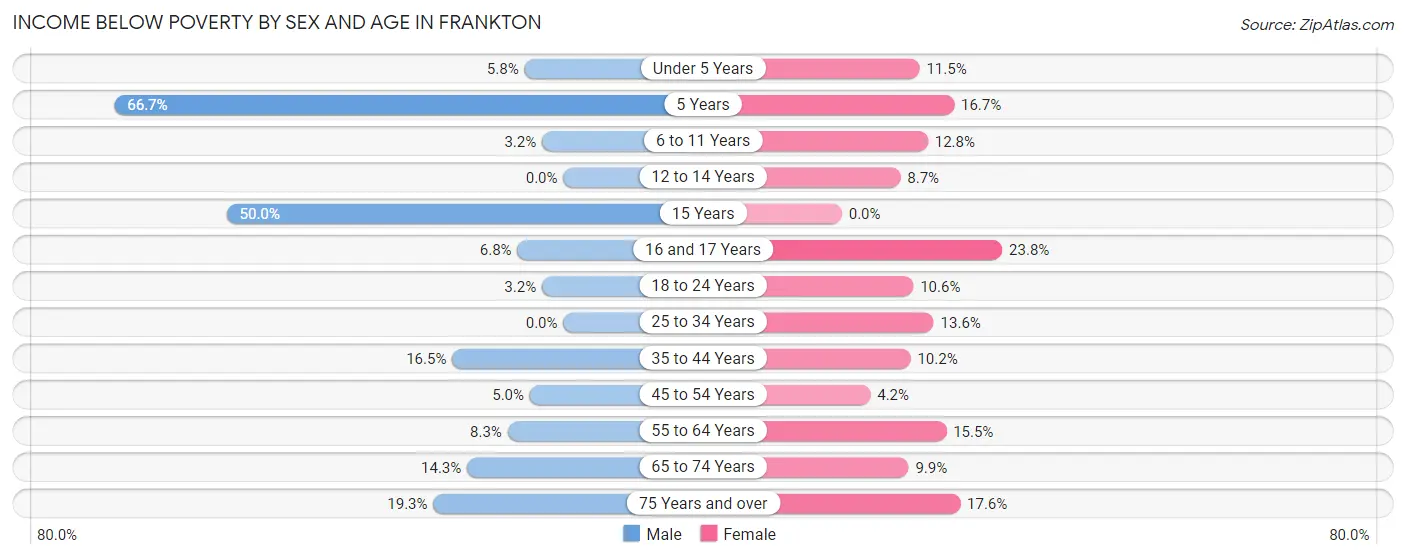
| Age Bracket | Male | Female |
| Under 5 Years | 3 (5.8%) | 3 (11.5%) |
| 5 Years | 2 (66.7%) | 2 (16.7%) |
| 6 to 11 Years | 3 (3.2%) | 6 (12.8%) |
| 12 to 14 Years | 0 (0.0%) | 2 (8.7%) |
| 15 Years | 19 (50.0%) | 0 (0.0%) |
| 16 and 17 Years | 3 (6.8%) | 10 (23.8%) |
| 18 to 24 Years | 2 (3.2%) | 7 (10.6%) |
| 25 to 34 Years | 0 (0.0%) | 15 (13.6%) |
| 35 to 44 Years | 17 (16.5%) | 10 (10.2%) |
| 45 to 54 Years | 8 (5.0%) | 6 (4.2%) |
| 55 to 64 Years | 10 (8.3%) | 20 (15.5%) |
| 65 to 74 Years | 9 (14.3%) | 10 (9.9%) |
| 75 Years and over | 11 (19.3%) | 13 (17.6%) |
| Total | 87 (9.2%) | 104 (11.7%) |
Income Above Poverty by Sex and Age in Frankton
According to the poverty statistics in Frankton, males aged 12 to 14 years and females aged 15 years are the age groups that are most secure financially, with 100.0% of males and 100.0% of females in these age groups living above the poverty line.
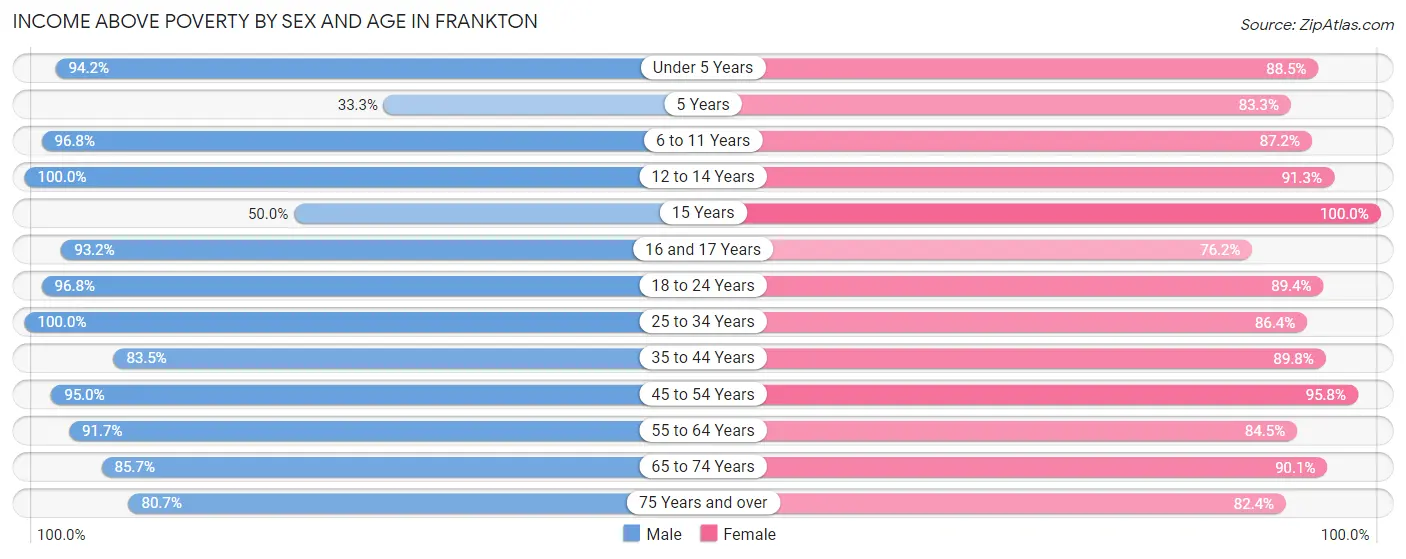
| Age Bracket | Male | Female |
| Under 5 Years | 49 (94.2%) | 23 (88.5%) |
| 5 Years | 1 (33.3%) | 10 (83.3%) |
| 6 to 11 Years | 92 (96.8%) | 41 (87.2%) |
| 12 to 14 Years | 30 (100.0%) | 21 (91.3%) |
| 15 Years | 19 (50.0%) | 15 (100.0%) |
| 16 and 17 Years | 41 (93.2%) | 32 (76.2%) |
| 18 to 24 Years | 61 (96.8%) | 59 (89.4%) |
| 25 to 34 Years | 116 (100.0%) | 95 (86.4%) |
| 35 to 44 Years | 86 (83.5%) | 88 (89.8%) |
| 45 to 54 Years | 153 (95.0%) | 136 (95.8%) |
| 55 to 64 Years | 111 (91.7%) | 109 (84.5%) |
| 65 to 74 Years | 54 (85.7%) | 91 (90.1%) |
| 75 Years and over | 46 (80.7%) | 61 (82.4%) |
| Total | 859 (90.8%) | 781 (88.2%) |
Income Below Poverty Among Married-Couple Families in Frankton
The poverty statistics for married-couple families in Frankton show that 6.8% or 25 of the total 366 families live below the poverty line. Families with 3 or 4 children have the highest poverty rate of 8.6%, comprising of 3 families. On the other hand, families with 5 or more children have the lowest poverty rate of 0.0%, which includes 0 families.
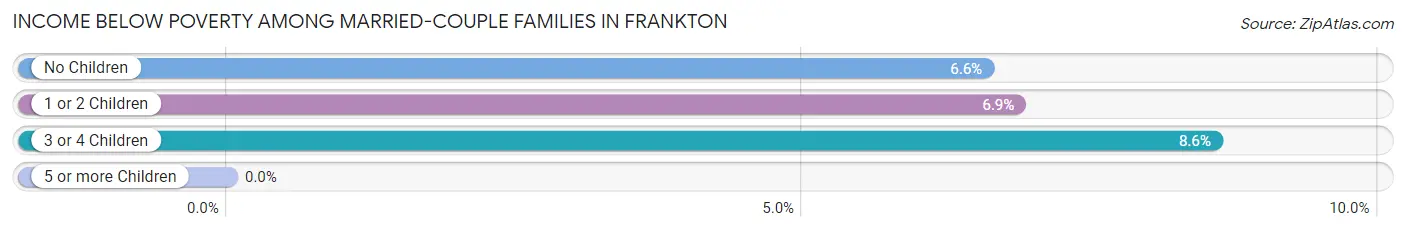
| Children | Above Poverty | Below Poverty |
| No Children | 213 (93.4%) | 15 (6.6%) |
| 1 or 2 Children | 95 (93.1%) | 7 (6.9%) |
| 3 or 4 Children | 32 (91.4%) | 3 (8.6%) |
| 5 or more Children | 1 (100.0%) | 0 (0.0%) |
| Total | 341 (93.2%) | 25 (6.8%) |
Income Below Poverty Among Single-Parent Households in Frankton
According to the poverty data in Frankton, 30.4% or 14 single-father households and 12.6% or 11 single-mother households are living below the poverty line. Among single-father households, those with no children have the highest poverty rate, with 5 households (50.0%) experiencing poverty. Likewise, among single-mother households, those with 3 or 4 children have the highest poverty rate, with 3 households (100.0%) falling below the poverty line.
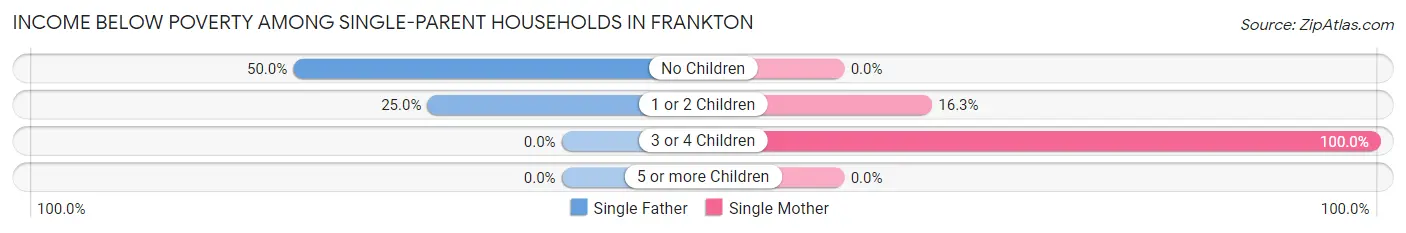
| Children | Single Father | Single Mother |
| No Children | 5 (50.0%) | 0 (0.0%) |
| 1 or 2 Children | 9 (25.0%) | 8 (16.3%) |
| 3 or 4 Children | 0 (0.0%) | 3 (100.0%) |
| 5 or more Children | 0 (0.0%) | 0 (0.0%) |
| Total | 14 (30.4%) | 11 (12.6%) |
Income Below Poverty Among Married-Couple vs Single-Parent Households in Frankton
The poverty data for Frankton shows that 25 of the married-couple family households (6.8%) and 25 of the single-parent households (18.8%) are living below the poverty level. Within the married-couple family households, those with 3 or 4 children have the highest poverty rate, with 3 households (8.6%) falling below the poverty line. Among the single-parent households, those with 3 or 4 children have the highest poverty rate, with 3 household (100.0%) living below poverty.
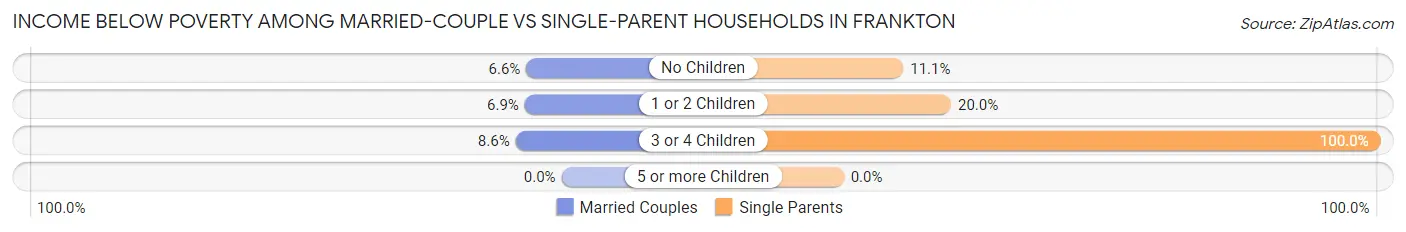
| Children | Married-Couple Families | Single-Parent Households |
| No Children | 15 (6.6%) | 5 (11.1%) |
| 1 or 2 Children | 7 (6.9%) | 17 (20.0%) |
| 3 or 4 Children | 3 (8.6%) | 3 (100.0%) |
| 5 or more Children | 0 (0.0%) | 0 (0.0%) |
| Total | 25 (6.8%) | 25 (18.8%) |
Race in Frankton
The most populous races in Frankton are White / Caucasian (1,740 | 94.1%), Hispanic or Latino (85 | 4.6%), and Some other Race (58 | 3.1%).
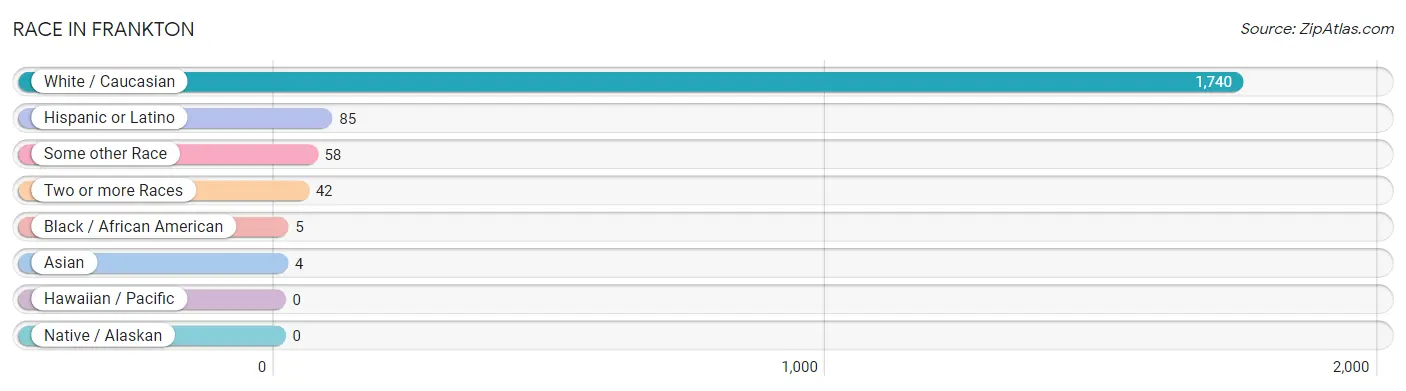
| Race | # Population | % Population |
| Asian | 4 | 0.2% |
| Black / African American | 5 | 0.3% |
| Hawaiian / Pacific | 0 | 0.0% |
| Hispanic or Latino | 85 | 4.6% |
| Native / Alaskan | 0 | 0.0% |
| White / Caucasian | 1,740 | 94.1% |
| Two or more Races | 42 | 2.3% |
| Some other Race | 58 | 3.1% |
| Total | 1,849 | 100.0% |
Ancestry in Frankton
The most populous ancestries reported in Frankton are German (261 | 14.1%), American (238 | 12.9%), English (210 | 11.4%), Irish (149 | 8.1%), and Croatian (53 | 2.9%), together accounting for 49.3% of all Frankton residents.
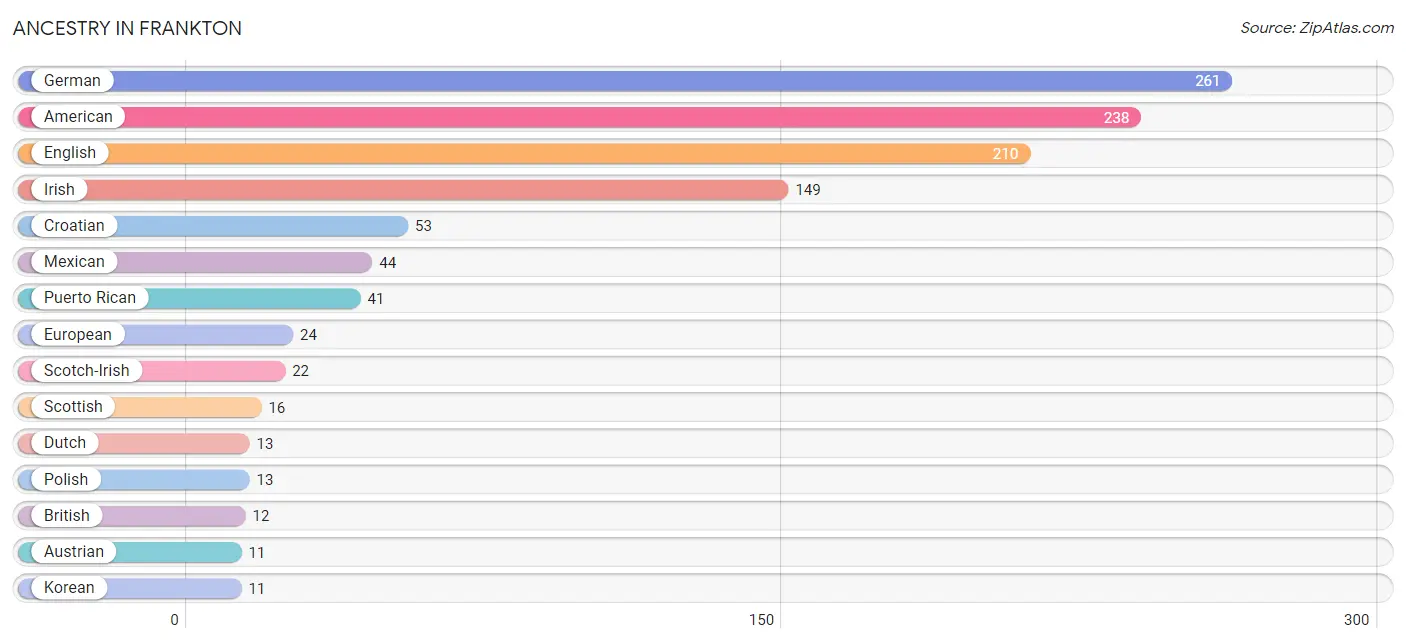
| Ancestry | # Population | % Population |
| American | 238 | 12.9% |
| Arab | 9 | 0.5% |
| Austrian | 11 | 0.6% |
| British | 12 | 0.6% |
| Cherokee | 1 | 0.1% |
| Croatian | 53 | 2.9% |
| Danish | 2 | 0.1% |
| Dutch | 13 | 0.7% |
| English | 210 | 11.4% |
| European | 24 | 1.3% |
| French | 8 | 0.4% |
| German | 261 | 14.1% |
| Greek | 4 | 0.2% |
| Hungarian | 2 | 0.1% |
| Irish | 149 | 8.1% |
| Korean | 11 | 0.6% |
| Mexican | 44 | 2.4% |
| Polish | 13 | 0.7% |
| Puerto Rican | 41 | 2.2% |
| Scandinavian | 3 | 0.2% |
| Scotch-Irish | 22 | 1.2% |
| Scottish | 16 | 0.9% |
| Slovak | 3 | 0.2% |
| Swedish | 6 | 0.3% |
| Syrian | 9 | 0.5% |
| Welsh | 8 | 0.4% | View All 26 Rows |
Immigrants in Frankton
The most numerous immigrant groups reported in Frankton came from Central America (13 | 0.7%), Latin America (13 | 0.7%), Mexico (13 | 0.7%), Europe (12 | 0.6%), and Northern Europe (12 | 0.6%), together accounting for 3.4% of all Frankton residents.
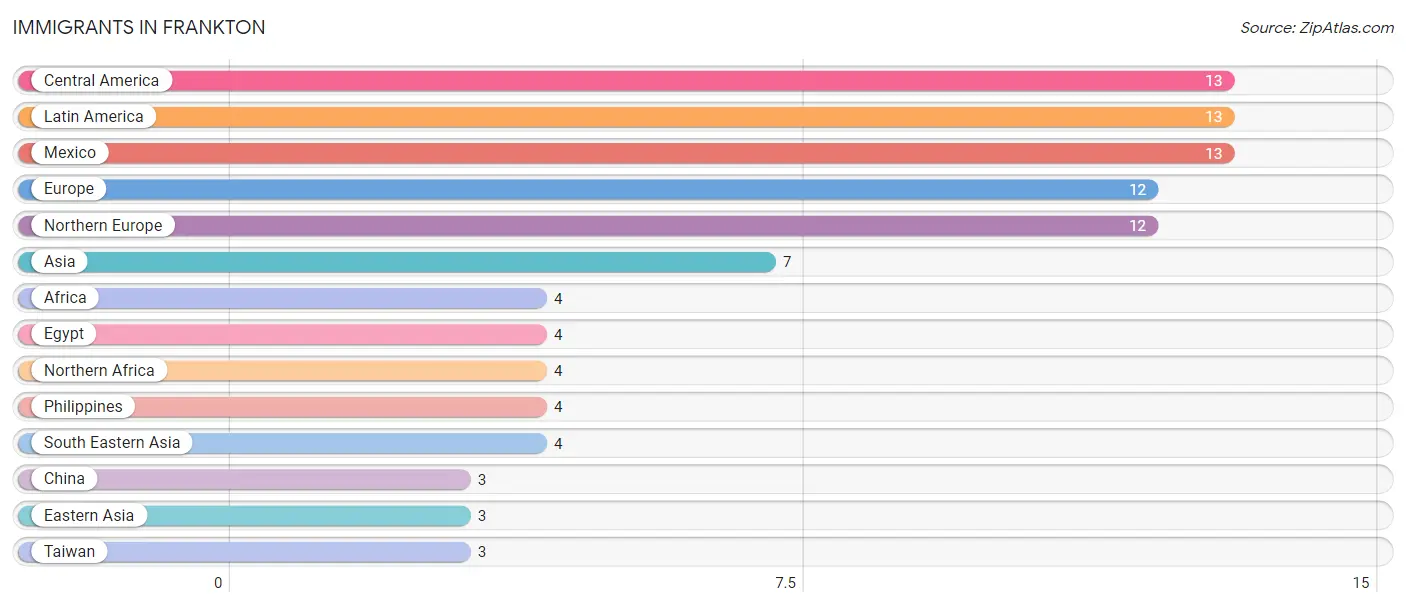
| Immigration Origin | # Population | % Population |
| Africa | 4 | 0.2% |
| Asia | 7 | 0.4% |
| Central America | 13 | 0.7% |
| China | 3 | 0.2% |
| Eastern Asia | 3 | 0.2% |
| Egypt | 4 | 0.2% |
| Europe | 12 | 0.6% |
| Latin America | 13 | 0.7% |
| Mexico | 13 | 0.7% |
| Northern Africa | 4 | 0.2% |
| Northern Europe | 12 | 0.6% |
| Philippines | 4 | 0.2% |
| South Eastern Asia | 4 | 0.2% |
| Taiwan | 3 | 0.2% | View All 14 Rows |
Sex and Age in Frankton
Sex and Age in Frankton
The most populous age groups in Frankton are 45 to 49 Years (106 | 11.1%) for men and 45 to 49 Years (94 | 10.5%) for women.
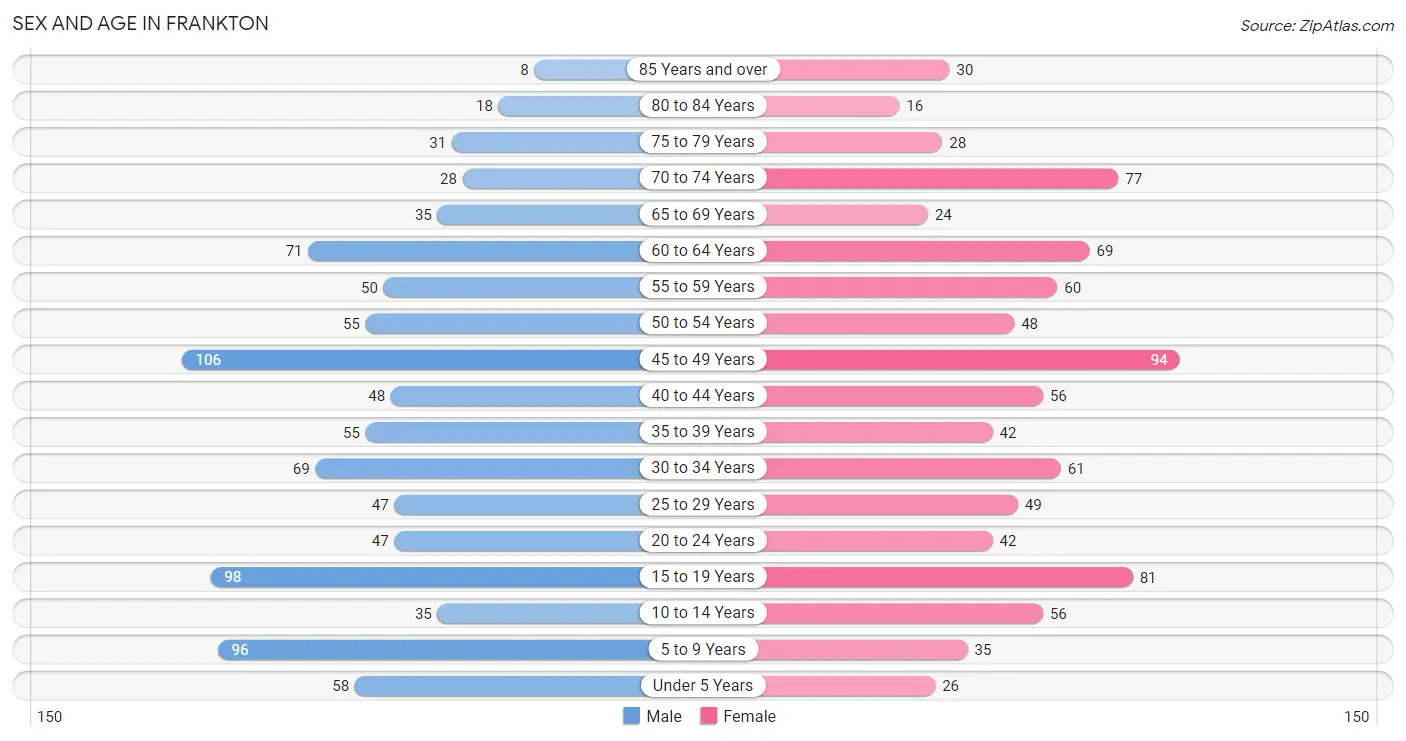
| Age Bracket | Male | Female |
| Under 5 Years | 58 (6.1%) | 26 (2.9%) |
| 5 to 9 Years | 96 (10.1%) | 35 (3.9%) |
| 10 to 14 Years | 35 (3.7%) | 56 (6.3%) |
| 15 to 19 Years | 98 (10.3%) | 81 (9.1%) |
| 20 to 24 Years | 47 (4.9%) | 42 (4.7%) |
| 25 to 29 Years | 47 (4.9%) | 49 (5.5%) |
| 30 to 34 Years | 69 (7.2%) | 61 (6.8%) |
| 35 to 39 Years | 55 (5.8%) | 42 (4.7%) |
| 40 to 44 Years | 48 (5.0%) | 56 (6.3%) |
| 45 to 49 Years | 106 (11.1%) | 94 (10.5%) |
| 50 to 54 Years | 55 (5.8%) | 48 (5.4%) |
| 55 to 59 Years | 50 (5.2%) | 60 (6.7%) |
| 60 to 64 Years | 71 (7.4%) | 69 (7.7%) |
| 65 to 69 Years | 35 (3.7%) | 24 (2.7%) |
| 70 to 74 Years | 28 (2.9%) | 77 (8.6%) |
| 75 to 79 Years | 31 (3.3%) | 28 (3.1%) |
| 80 to 84 Years | 18 (1.9%) | 16 (1.8%) |
| 85 Years and over | 8 (0.8%) | 30 (3.4%) |
| Total | 955 (100.0%) | 894 (100.0%) |
Families and Households in Frankton
Median Family Size in Frankton
The median family size in Frankton is 3.10 persons per family, with single female/mother families (87 | 17.4%) accounting for the largest median family size of 3.25 persons per family. On the other hand, single male/father families (46 | 9.2%) represent the smallest median family size with 2.54 persons per family.
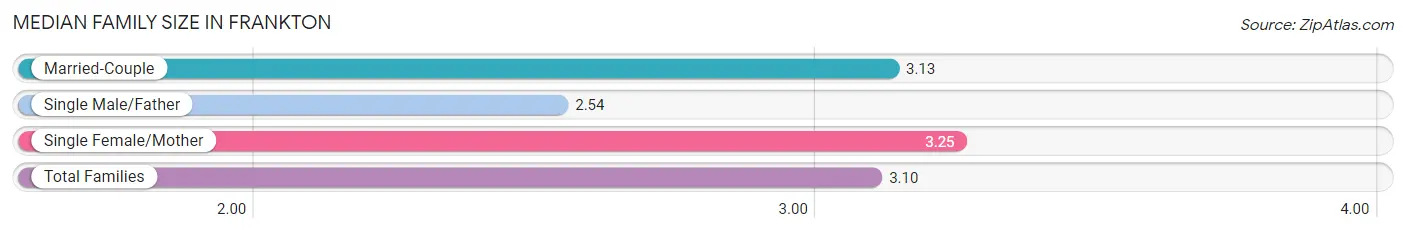
| Family Type | # Families | Family Size |
| Married-Couple | 366 (73.4%) | 3.13 |
| Single Male/Father | 46 (9.2%) | 2.54 |
| Single Female/Mother | 87 (17.4%) | 3.25 |
| Total Families | 499 (100.0%) | 3.10 |
Median Household Size in Frankton
The median household size in Frankton is 2.56 persons per household, with single female/mother households (87 | 12.0%) accounting for the largest median household size of 3.29 persons per household. non-family households (224 | 31.0%) represent the smallest median household size with 1.19 persons per household.
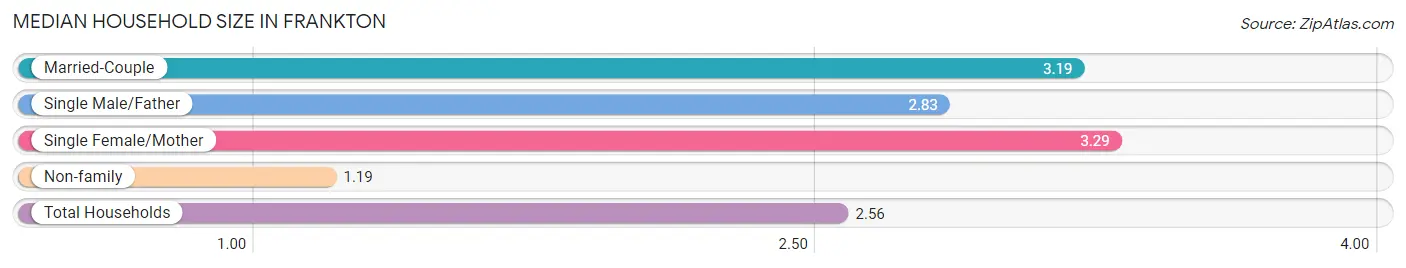
| Household Type | # Households | Household Size |
| Married-Couple | 366 (50.6%) | 3.19 |
| Single Male/Father | 46 (6.4%) | 2.83 |
| Single Female/Mother | 87 (12.0%) | 3.29 |
| Non-family | 224 (31.0%) | 1.19 |
| Total Households | 723 (100.0%) | 2.56 |
Household Size by Marriage Status in Frankton
Out of a total of 723 households in Frankton, 499 (69.0%) are family households, while 224 (31.0%) are nonfamily households. The most numerous type of family households are 2-person households, comprising 230, and the most common type of nonfamily households are 1-person households, comprising 201.
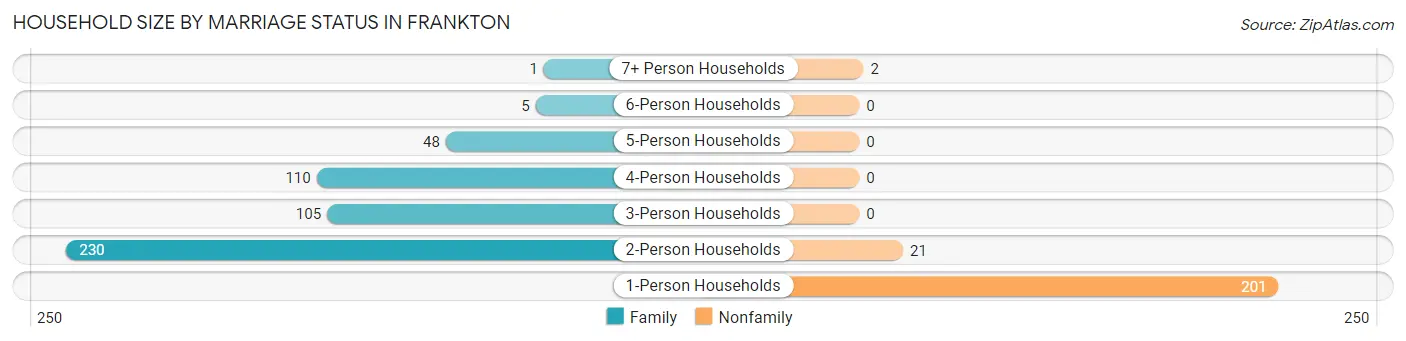
| Household Size | Family Households | Nonfamily Households |
| 1-Person Households | - | 201 (27.8%) |
| 2-Person Households | 230 (31.8%) | 21 (2.9%) |
| 3-Person Households | 105 (14.5%) | 0 (0.0%) |
| 4-Person Households | 110 (15.2%) | 0 (0.0%) |
| 5-Person Households | 48 (6.6%) | 0 (0.0%) |
| 6-Person Households | 5 (0.7%) | 0 (0.0%) |
| 7+ Person Households | 1 (0.1%) | 2 (0.3%) |
| Total | 499 (69.0%) | 224 (31.0%) |
Female Fertility in Frankton
Fertility by Age in Frankton
| Age Bracket | Women with Births | Births / 1,000 Women |
| 15 to 19 years | 0 (0.0%) | 0.0 |
| 20 to 34 years | 0 (0.0%) | 0.0 |
| 35 to 50 years | 0 (0.0%) | 0.0 |
| Total | 0 (0.0%) | 0.0 |
Fertility by Age by Marriage Status in Frankton
| Age Bracket | Married | Unmarried |
| 15 to 19 years | 0 (0.0%) | 0 (0.0%) |
| 20 to 34 years | 0 (0.0%) | 0 (0.0%) |
| 35 to 50 years | 0 (0.0%) | 0 (0.0%) |
| Total | 0 (0.0%) | 0 (0.0%) |
Fertility by Education in Frankton
| Educational Attainment | Women with Births | Births / 1,000 Women |
| Less than High School | 0 (0.0%) | 0.0 |
| High School Diploma | 0 (0.0%) | 0.0 |
| College or Associate's Degree | 0 (0.0%) | 0.0 |
| Bachelor's Degree | 0 (0.0%) | 0.0 |
| Graduate Degree | 0 (0.0%) | 0.0 |
| Total | 0 (0.0%) | 0.0 |
Fertility by Education by Marriage Status in Frankton
| Educational Attainment | Married | Unmarried |
| Less than High School | 0 (0.0%) | 0 (0.0%) |
| High School Diploma | 0 (0.0%) | 0 (0.0%) |
| College or Associate's Degree | 0 (0.0%) | 0 (0.0%) |
| Bachelor's Degree | 0 (0.0%) | 0 (0.0%) |
| Graduate Degree | 0 (0.0%) | 0 (0.0%) |
| Total | 0 (0.0%) | 0 (0.0%) |
Employment Characteristics in Frankton
Employment by Class of Employer in Frankton
Among the 830 employed individuals in Frankton, private company employees (592 | 71.3%), local government employees (103 | 12.4%), and not-for-profit organizations (38 | 4.6%) make up the most common classes of employment.
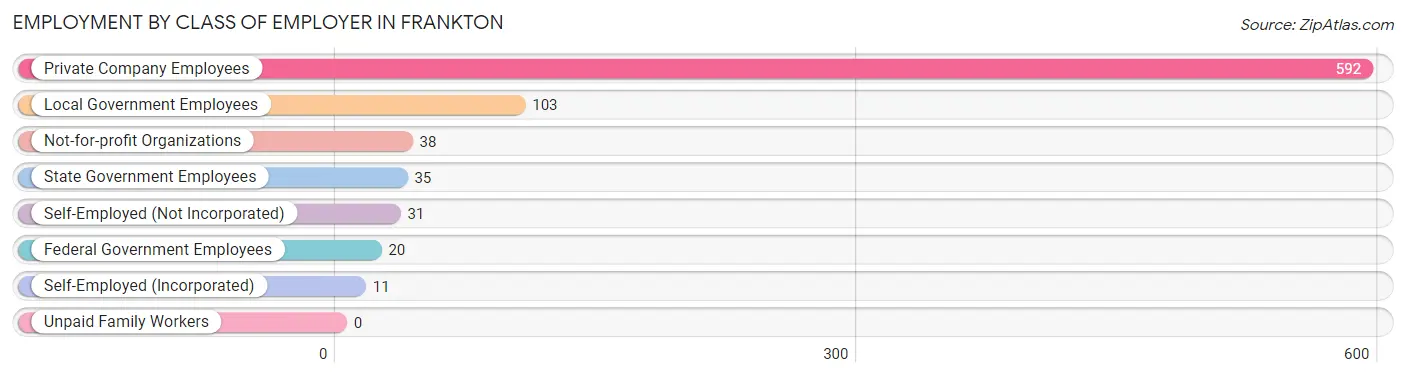
| Employer Class | # Employees | % Employees |
| Private Company Employees | 592 | 71.3% |
| Self-Employed (Incorporated) | 11 | 1.3% |
| Self-Employed (Not Incorporated) | 31 | 3.7% |
| Not-for-profit Organizations | 38 | 4.6% |
| Local Government Employees | 103 | 12.4% |
| State Government Employees | 35 | 4.2% |
| Federal Government Employees | 20 | 2.4% |
| Unpaid Family Workers | 0 | 0.0% |
| Total | 830 | 100.0% |
Employment Status by Age in Frankton
According to the labor force statistics for Frankton, out of the total population over 16 years of age (1,490), 61.1% or 910 individuals are in the labor force, with 2.6% or 24 of them unemployed. The age group with the highest labor force participation rate is 35 to 44 years, with 95.0% or 191 individuals in the labor force. Within the labor force, the 16 to 19 years age range has the highest percentage of unemployed individuals, with 20.9% or 9 of them being unemployed.
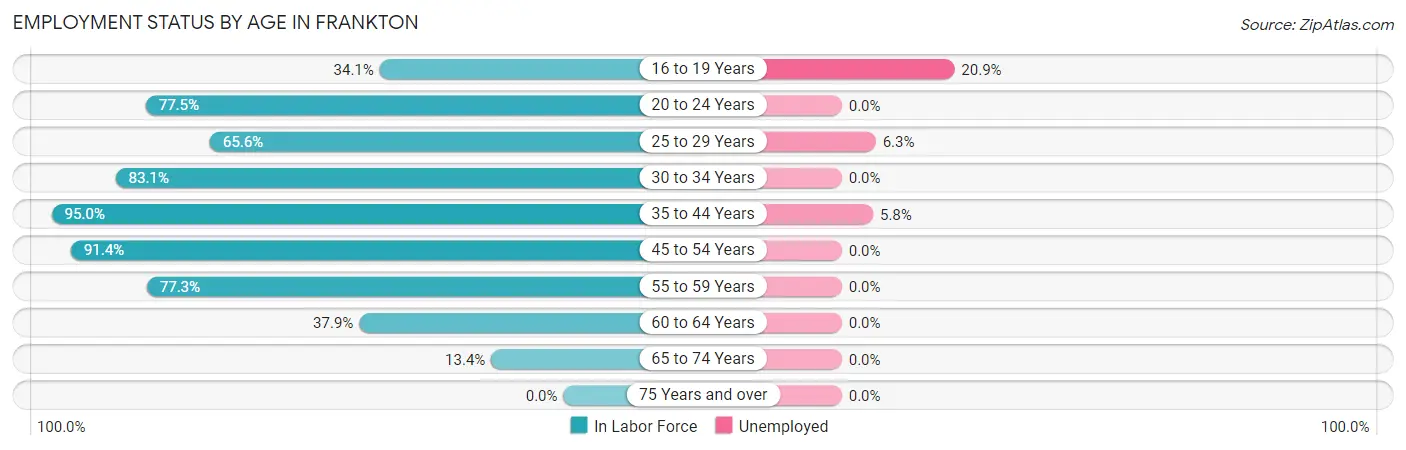
| Age Bracket | In Labor Force | Unemployed |
| 16 to 19 Years | 43 (34.1%) | 9 (20.9%) |
| 20 to 24 Years | 69 (77.5%) | 0 (0.0%) |
| 25 to 29 Years | 63 (65.6%) | 4 (6.3%) |
| 30 to 34 Years | 108 (83.1%) | 0 (0.0%) |
| 35 to 44 Years | 191 (95.0%) | 11 (5.8%) |
| 45 to 54 Years | 277 (91.4%) | 0 (0.0%) |
| 55 to 59 Years | 85 (77.3%) | 0 (0.0%) |
| 60 to 64 Years | 53 (37.9%) | 0 (0.0%) |
| 65 to 74 Years | 22 (13.4%) | 0 (0.0%) |
| 75 Years and over | 0 (0.0%) | 0 (0.0%) |
| Total | 910 (61.1%) | 24 (2.6%) |
Employment Status by Educational Attainment in Frankton
According to labor force statistics for Frankton, 79.3% of individuals (777) out of the total population between 25 and 64 years of age (980) are in the labor force, with 1.9% or 15 of them being unemployed. The group with the highest labor force participation rate are those with the educational attainment of bachelor's degree or higher, with 96.8% or 150 individuals in the labor force. Within the labor force, individuals with less than high school education have the highest percentage of unemployment, with 5.6% or 2 of them being unemployed.
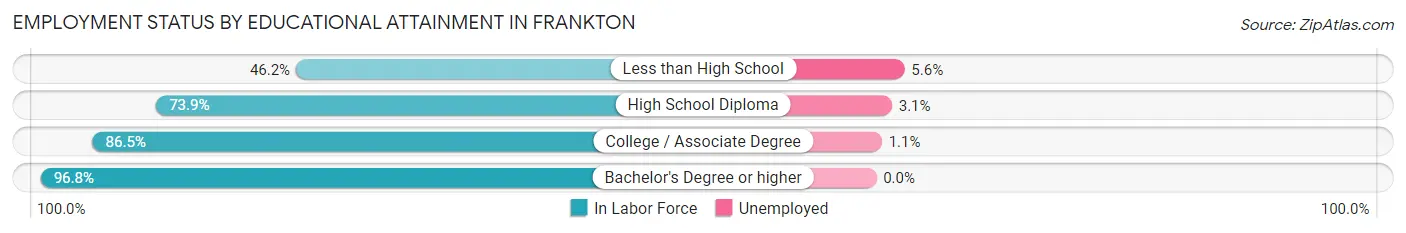
| Educational Attainment | In Labor Force | Unemployed |
| Less than High School | 36 (46.2%) | 4 (5.6%) |
| High School Diploma | 323 (73.9%) | 14 (3.1%) |
| College / Associate Degree | 268 (86.5%) | 3 (1.1%) |
| Bachelor's Degree or higher | 150 (96.8%) | 0 (0.0%) |
| Total | 777 (79.3%) | 19 (1.9%) |
Employment Occupations by Sex in Frankton
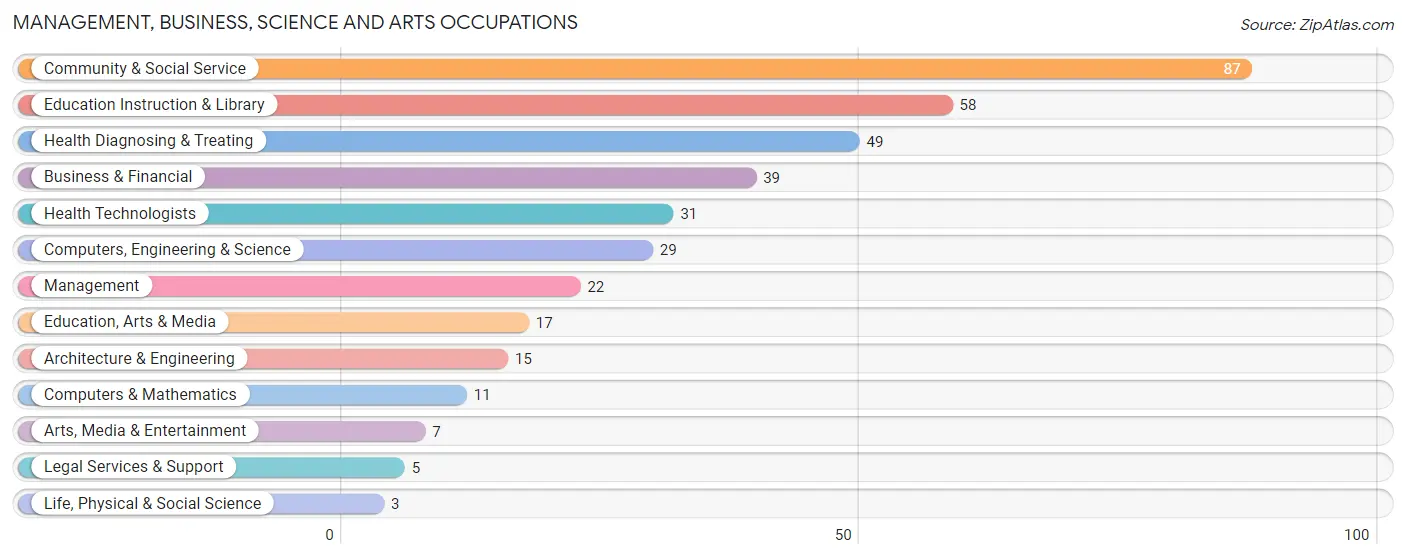
Management, Business, Science and Arts Occupations
The most common Management, Business, Science and Arts occupations in Frankton are Community & Social Service (87 | 9.8%), Education Instruction & Library (58 | 6.5%), Health Diagnosing & Treating (49 | 5.5%), Business & Financial (39 | 4.4%), and Health Technologists (31 | 3.5%).
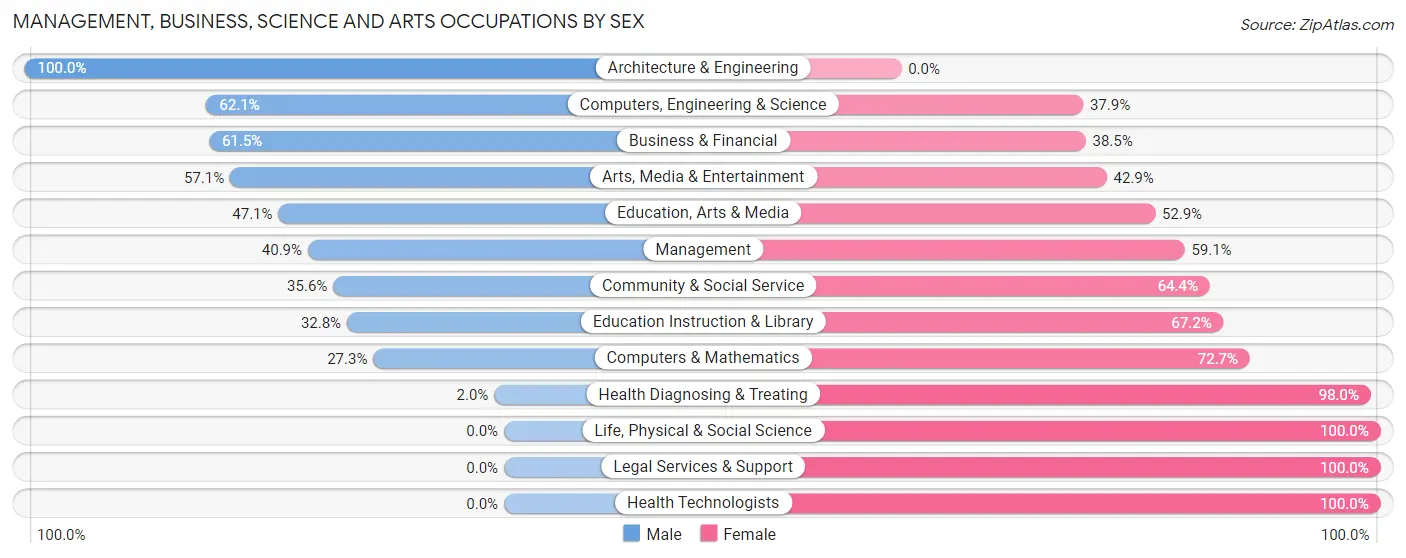
Management, Business, Science and Arts Occupations by Sex
Within the Management, Business, Science and Arts occupations in Frankton, the most male-oriented occupations are Architecture & Engineering (100.0%), Computers, Engineering & Science (62.1%), and Business & Financial (61.5%), while the most female-oriented occupations are Life, Physical & Social Science (100.0%), Legal Services & Support (100.0%), and Health Technologists (100.0%).
| Occupation | Male | Female |
| Management | 9 (40.9%) | 13 (59.1%) |
| Business & Financial | 24 (61.5%) | 15 (38.5%) |
| Computers, Engineering & Science | 18 (62.1%) | 11 (37.9%) |
| Computers & Mathematics | 3 (27.3%) | 8 (72.7%) |
| Architecture & Engineering | 15 (100.0%) | 0 (0.0%) |
| Life, Physical & Social Science | 0 (0.0%) | 3 (100.0%) |
| Community & Social Service | 31 (35.6%) | 56 (64.4%) |
| Education, Arts & Media | 8 (47.1%) | 9 (52.9%) |
| Legal Services & Support | 0 (0.0%) | 5 (100.0%) |
| Education Instruction & Library | 19 (32.8%) | 39 (67.2%) |
| Arts, Media & Entertainment | 4 (57.1%) | 3 (42.9%) |
| Health Diagnosing & Treating | 1 (2.0%) | 48 (98.0%) |
| Health Technologists | 0 (0.0%) | 31 (100.0%) |
| Total (Category) | 83 (36.7%) | 143 (63.3%) |
| Total (Overall) | 455 (51.3%) | 432 (48.7%) |
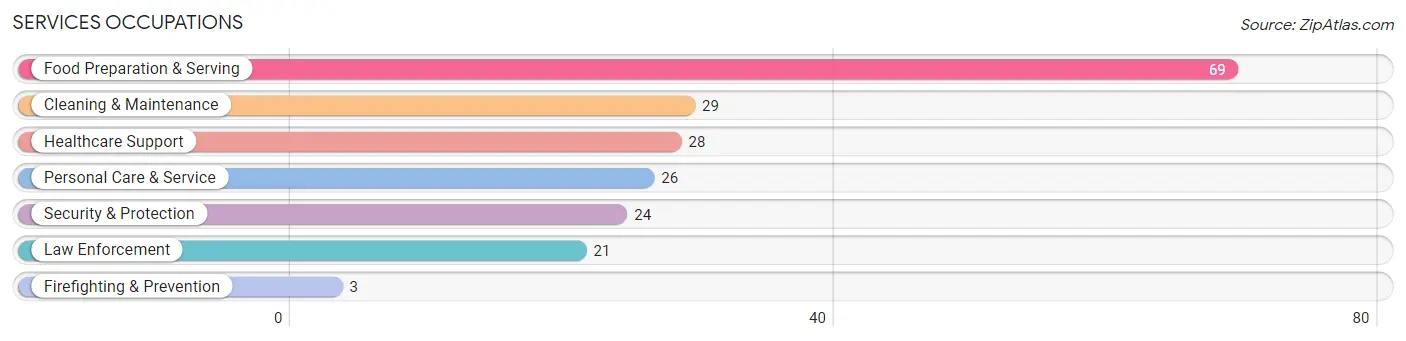
Services Occupations
The most common Services occupations in Frankton are Food Preparation & Serving (69 | 7.8%), Cleaning & Maintenance (29 | 3.3%), Healthcare Support (28 | 3.2%), Personal Care & Service (26 | 2.9%), and Security & Protection (24 | 2.7%).
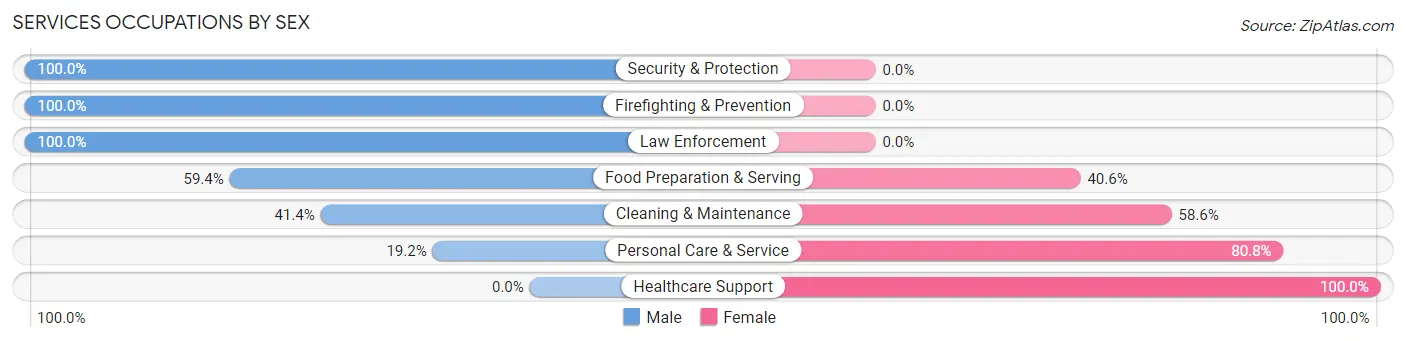
Services Occupations by Sex
Within the Services occupations in Frankton, the most male-oriented occupations are Security & Protection (100.0%), Firefighting & Prevention (100.0%), and Law Enforcement (100.0%), while the most female-oriented occupations are Healthcare Support (100.0%), Personal Care & Service (80.8%), and Cleaning & Maintenance (58.6%).
| Occupation | Male | Female |
| Healthcare Support | 0 (0.0%) | 28 (100.0%) |
| Security & Protection | 24 (100.0%) | 0 (0.0%) |
| Firefighting & Prevention | 3 (100.0%) | 0 (0.0%) |
| Law Enforcement | 21 (100.0%) | 0 (0.0%) |
| Food Preparation & Serving | 41 (59.4%) | 28 (40.6%) |
| Cleaning & Maintenance | 12 (41.4%) | 17 (58.6%) |
| Personal Care & Service | 5 (19.2%) | 21 (80.8%) |
| Total (Category) | 82 (46.6%) | 94 (53.4%) |
| Total (Overall) | 455 (51.3%) | 432 (48.7%) |
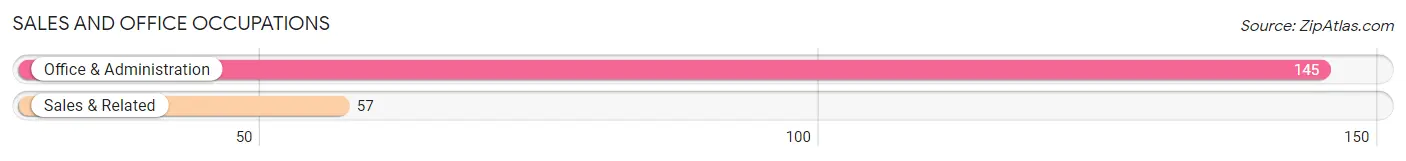
Sales and Office Occupations
The most common Sales and Office occupations in Frankton are Office & Administration (145 | 16.4%), and Sales & Related (57 | 6.4%).
Sales and Office Occupations by Sex
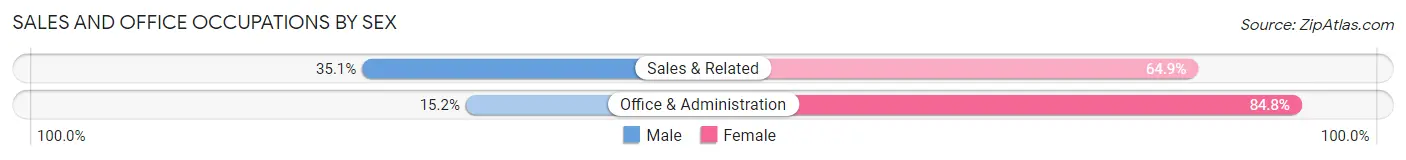
| Occupation | Male | Female |
| Sales & Related | 20 (35.1%) | 37 (64.9%) |
| Office & Administration | 22 (15.2%) | 123 (84.8%) |
| Total (Category) | 42 (20.8%) | 160 (79.2%) |
| Total (Overall) | 455 (51.3%) | 432 (48.7%) |
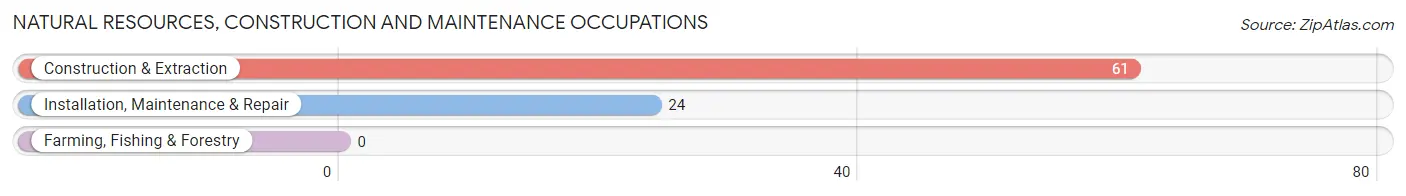
Natural Resources, Construction and Maintenance Occupations
The most common Natural Resources, Construction and Maintenance occupations in Frankton are Construction & Extraction (61 | 6.9%), and Installation, Maintenance & Repair (24 | 2.7%).
Natural Resources, Construction and Maintenance Occupations by Sex
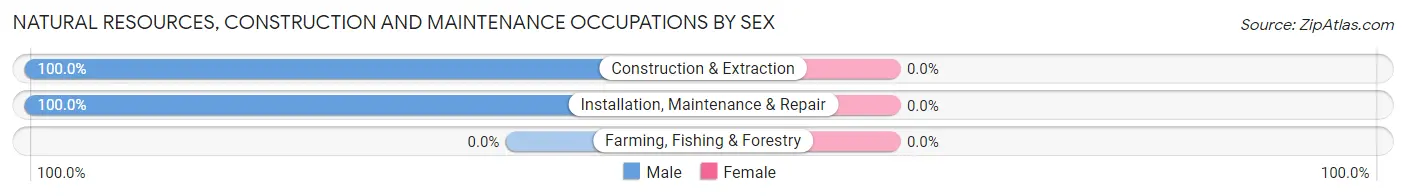
| Occupation | Male | Female |
| Farming, Fishing & Forestry | 0 (0.0%) | 0 (0.0%) |
| Construction & Extraction | 61 (100.0%) | 0 (0.0%) |
| Installation, Maintenance & Repair | 24 (100.0%) | 0 (0.0%) |
| Total (Category) | 85 (100.0%) | 0 (0.0%) |
| Total (Overall) | 455 (51.3%) | 432 (48.7%) |
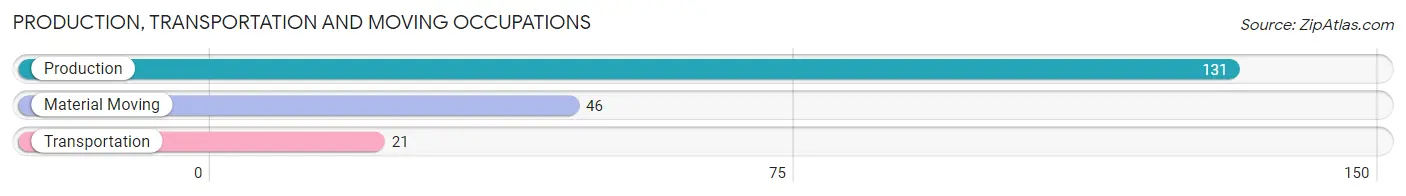
Production, Transportation and Moving Occupations
The most common Production, Transportation and Moving occupations in Frankton are Production (131 | 14.8%), Material Moving (46 | 5.2%), and Transportation (21 | 2.4%).
Production, Transportation and Moving Occupations by Sex
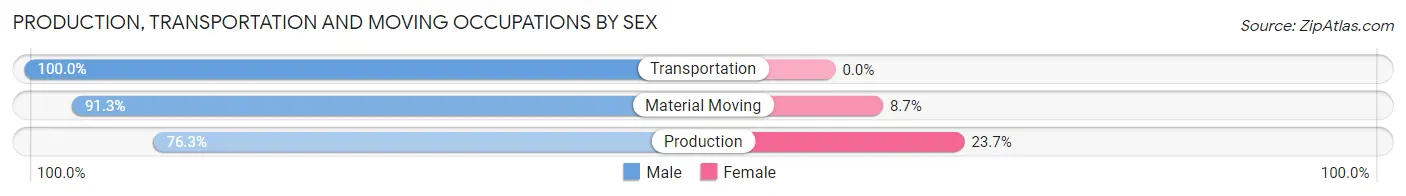
| Occupation | Male | Female |
| Production | 100 (76.3%) | 31 (23.7%) |
| Transportation | 21 (100.0%) | 0 (0.0%) |
| Material Moving | 42 (91.3%) | 4 (8.7%) |
| Total (Category) | 163 (82.3%) | 35 (17.7%) |
| Total (Overall) | 455 (51.3%) | 432 (48.7%) |
Employment Industries by Sex in Frankton
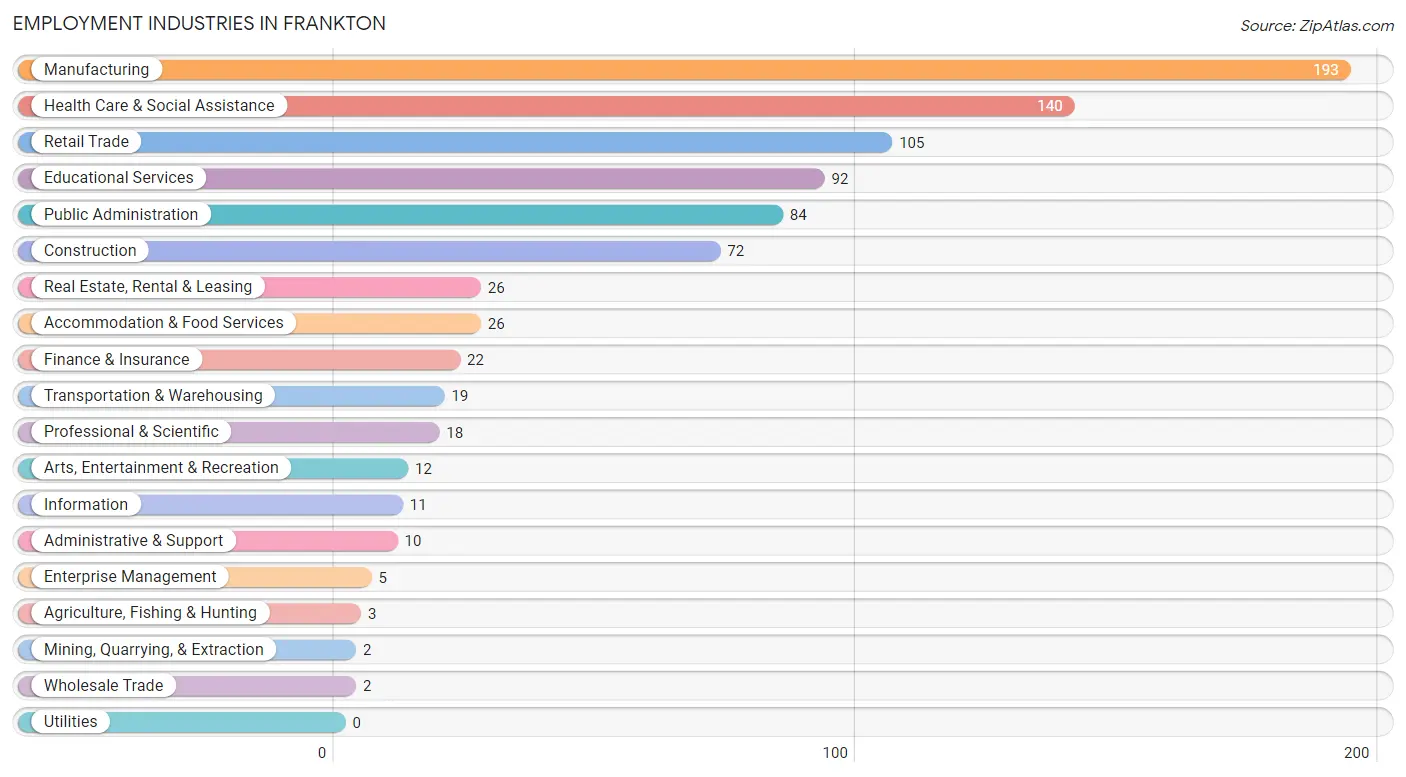
Employment Industries in Frankton
The major employment industries in Frankton include Manufacturing (193 | 21.8%), Health Care & Social Assistance (140 | 15.8%), Retail Trade (105 | 11.8%), Educational Services (92 | 10.4%), and Public Administration (84 | 9.5%).
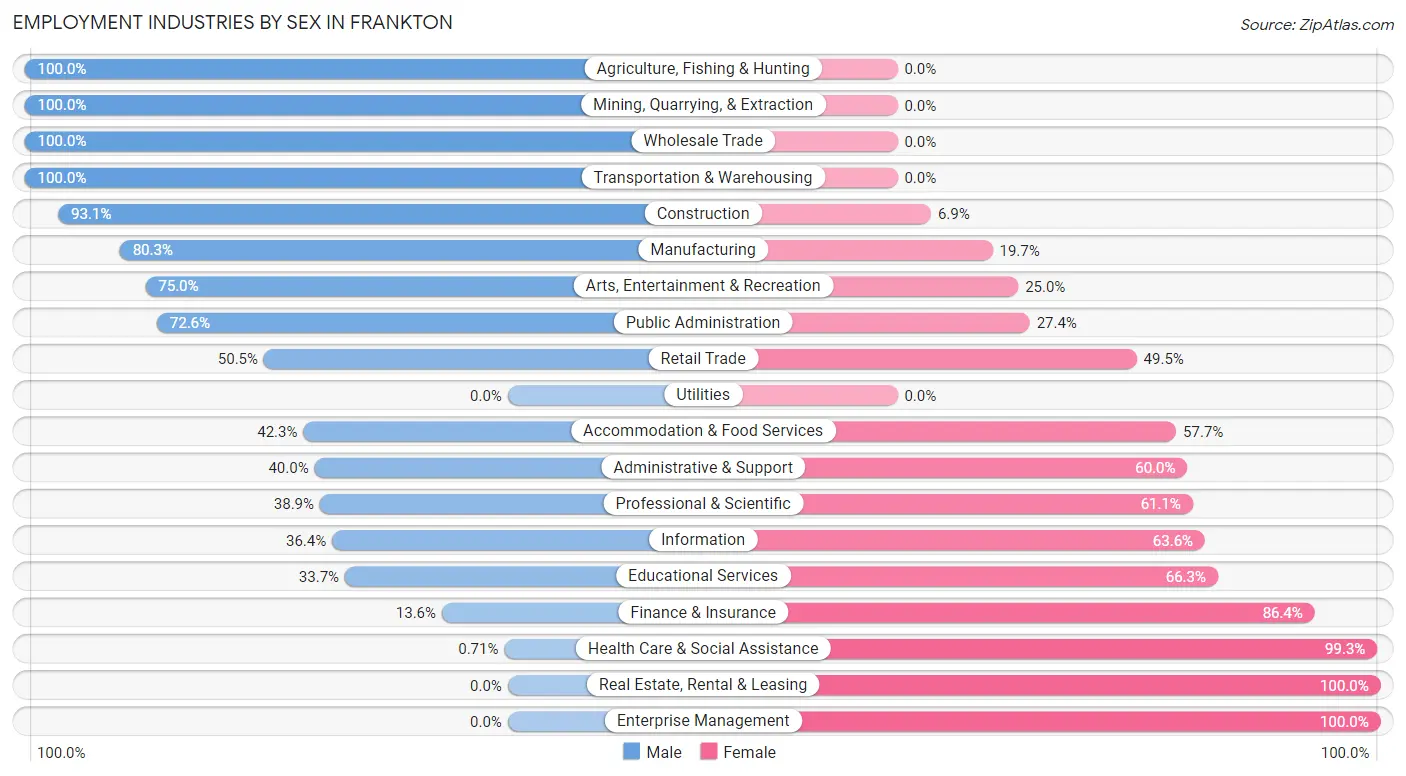
Employment Industries by Sex in Frankton
The Frankton industries that see more men than women are Agriculture, Fishing & Hunting (100.0%), Mining, Quarrying, & Extraction (100.0%), and Wholesale Trade (100.0%), whereas the industries that tend to have a higher number of women are Real Estate, Rental & Leasing (100.0%), Enterprise Management (100.0%), and Health Care & Social Assistance (99.3%).
| Industry | Male | Female |
| Agriculture, Fishing & Hunting | 3 (100.0%) | 0 (0.0%) |
| Mining, Quarrying, & Extraction | 2 (100.0%) | 0 (0.0%) |
| Construction | 67 (93.1%) | 5 (6.9%) |
| Manufacturing | 155 (80.3%) | 38 (19.7%) |
| Wholesale Trade | 2 (100.0%) | 0 (0.0%) |
| Retail Trade | 53 (50.5%) | 52 (49.5%) |
| Transportation & Warehousing | 19 (100.0%) | 0 (0.0%) |
| Utilities | 0 (0.0%) | 0 (0.0%) |
| Information | 4 (36.4%) | 7 (63.6%) |
| Finance & Insurance | 3 (13.6%) | 19 (86.4%) |
| Real Estate, Rental & Leasing | 0 (0.0%) | 26 (100.0%) |
| Professional & Scientific | 7 (38.9%) | 11 (61.1%) |
| Enterprise Management | 0 (0.0%) | 5 (100.0%) |
| Administrative & Support | 4 (40.0%) | 6 (60.0%) |
| Educational Services | 31 (33.7%) | 61 (66.3%) |
| Health Care & Social Assistance | 1 (0.7%) | 139 (99.3%) |
| Arts, Entertainment & Recreation | 9 (75.0%) | 3 (25.0%) |
| Accommodation & Food Services | 11 (42.3%) | 15 (57.7%) |
| Public Administration | 61 (72.6%) | 23 (27.4%) |
| Total | 455 (51.3%) | 432 (48.7%) |
Education in Frankton
School Enrollment in Frankton
The most common levels of schooling among the 445 students in Frankton are high school (167 | 37.5%), elementary school (125 | 28.1%), and college / undergraduate (65 | 14.6%).
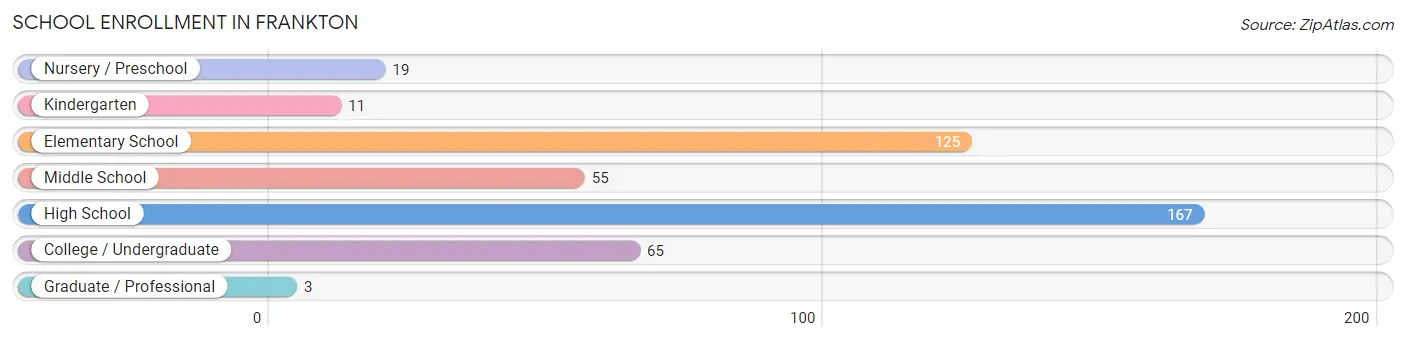
| School Level | # Students | % Students |
| Nursery / Preschool | 19 | 4.3% |
| Kindergarten | 11 | 2.5% |
| Elementary School | 125 | 28.1% |
| Middle School | 55 | 12.4% |
| High School | 167 | 37.5% |
| College / Undergraduate | 65 | 14.6% |
| Graduate / Professional | 3 | 0.7% |
| Total | 445 | 100.0% |
School Enrollment by Age by Funding Source in Frankton
Out of a total of 445 students who are enrolled in schools in Frankton, 19 (4.3%) attend a private institution, while the remaining 426 (95.7%) are enrolled in public schools. The age group of 3 to 4 year olds has the highest likelihood of being enrolled in private schools, with 3 (33.3% in the age bracket) enrolled. Conversely, the age group of 15 to 17 year olds has the lowest likelihood of being enrolled in a private school, with 139 (100.0% in the age bracket) attending a public institution.
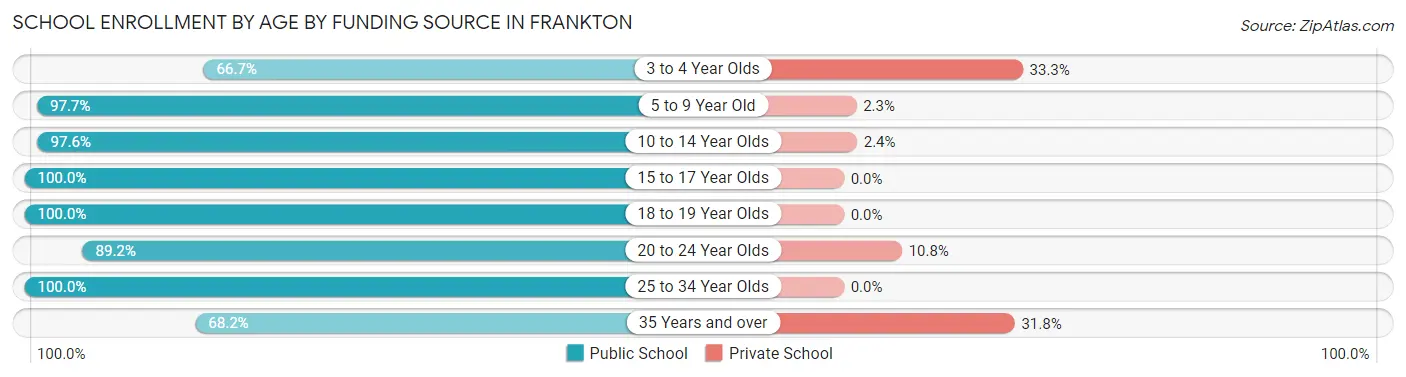
| Age Bracket | Public School | Private School |
| 3 to 4 Year Olds | 6 (66.7%) | 3 (33.3%) |
| 5 to 9 Year Old | 126 (97.7%) | 3 (2.3%) |
| 10 to 14 Year Olds | 80 (97.6%) | 2 (2.4%) |
| 15 to 17 Year Olds | 139 (100.0%) | 0 (0.0%) |
| 18 to 19 Year Olds | 24 (100.0%) | 0 (0.0%) |
| 20 to 24 Year Olds | 33 (89.2%) | 4 (10.8%) |
| 25 to 34 Year Olds | 3 (100.0%) | 0 (0.0%) |
| 35 Years and over | 15 (68.2%) | 7 (31.8%) |
| Total | 426 (95.7%) | 19 (4.3%) |
Educational Attainment by Field of Study in Frankton
Education (59 | 28.9%), science & technology (39 | 19.1%), arts & humanities (28 | 13.7%), business (25 | 12.2%), and computers & mathematics (16 | 7.8%) are the most common fields of study among 204 individuals in Frankton who have obtained a bachelor's degree or higher.
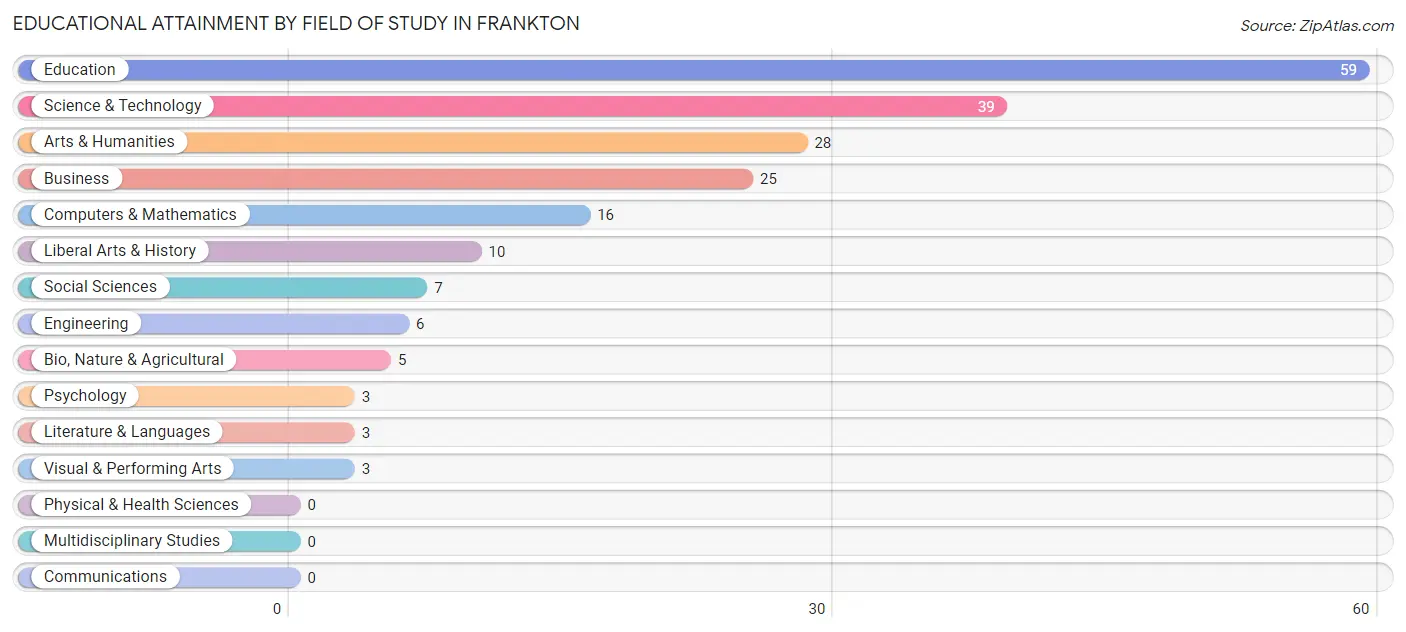
| Field of Study | # Graduates | % Graduates |
| Computers & Mathematics | 16 | 7.8% |
| Bio, Nature & Agricultural | 5 | 2.5% |
| Physical & Health Sciences | 0 | 0.0% |
| Psychology | 3 | 1.5% |
| Social Sciences | 7 | 3.4% |
| Engineering | 6 | 2.9% |
| Multidisciplinary Studies | 0 | 0.0% |
| Science & Technology | 39 | 19.1% |
| Business | 25 | 12.2% |
| Education | 59 | 28.9% |
| Literature & Languages | 3 | 1.5% |
| Liberal Arts & History | 10 | 4.9% |
| Visual & Performing Arts | 3 | 1.5% |
| Communications | 0 | 0.0% |
| Arts & Humanities | 28 | 13.7% |
| Total | 204 | 100.0% |
Transportation & Commute in Frankton
Vehicle Availability by Sex in Frankton
The most prevalent vehicle ownership categories in Frankton are males with 3 vehicles (155, accounting for 37.7%) and females with 3 vehicles (171, making up 37.0%).
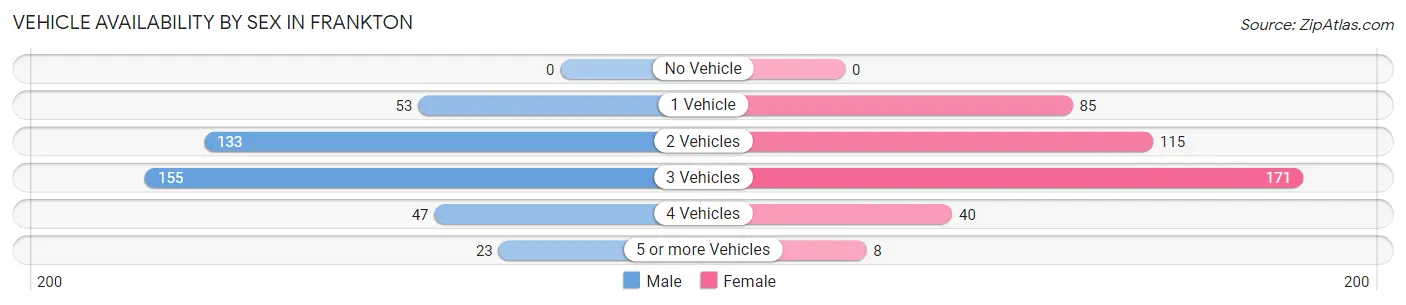
| Vehicles Available | Male | Female |
| No Vehicle | 0 (0.0%) | 0 (0.0%) |
| 1 Vehicle | 53 (12.9%) | 85 (20.3%) |
| 2 Vehicles | 133 (32.4%) | 115 (27.5%) |
| 3 Vehicles | 155 (37.7%) | 171 (40.8%) |
| 4 Vehicles | 47 (11.4%) | 40 (9.6%) |
| 5 or more Vehicles | 23 (5.6%) | 8 (1.9%) |
| Total | 411 (100.0%) | 419 (100.0%) |
Commute Time in Frankton
The most frequently occuring commute durations in Frankton are 25 to 29 minutes (143 commuters, 18.0%), 20 to 24 minutes (138 commuters, 17.3%), and 45 to 59 minutes (106 commuters, 13.3%).
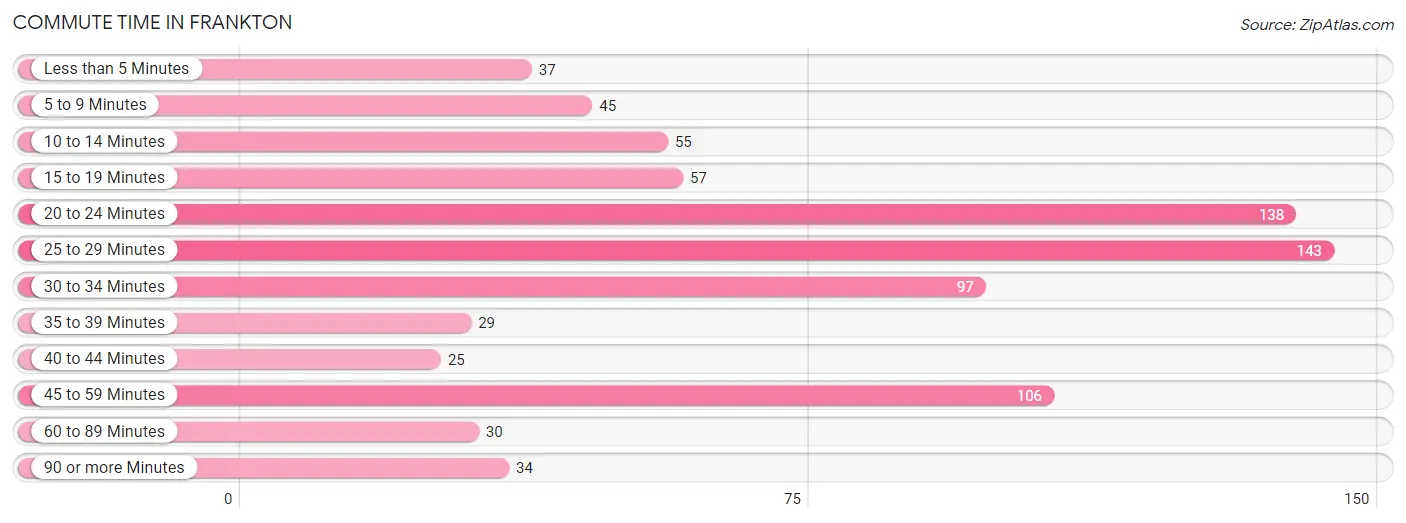
| Commute Time | # Commuters | % Commuters |
| Less than 5 Minutes | 37 | 4.6% |
| 5 to 9 Minutes | 45 | 5.7% |
| 10 to 14 Minutes | 55 | 6.9% |
| 15 to 19 Minutes | 57 | 7.2% |
| 20 to 24 Minutes | 138 | 17.3% |
| 25 to 29 Minutes | 143 | 18.0% |
| 30 to 34 Minutes | 97 | 12.2% |
| 35 to 39 Minutes | 29 | 3.6% |
| 40 to 44 Minutes | 25 | 3.1% |
| 45 to 59 Minutes | 106 | 13.3% |
| 60 to 89 Minutes | 30 | 3.8% |
| 90 or more Minutes | 34 | 4.3% |
Commute Time by Sex in Frankton
The most common commute times in Frankton are 45 to 59 minutes (78 commuters, 20.3%) for males and 25 to 29 minutes (95 commuters, 23.1%) for females.
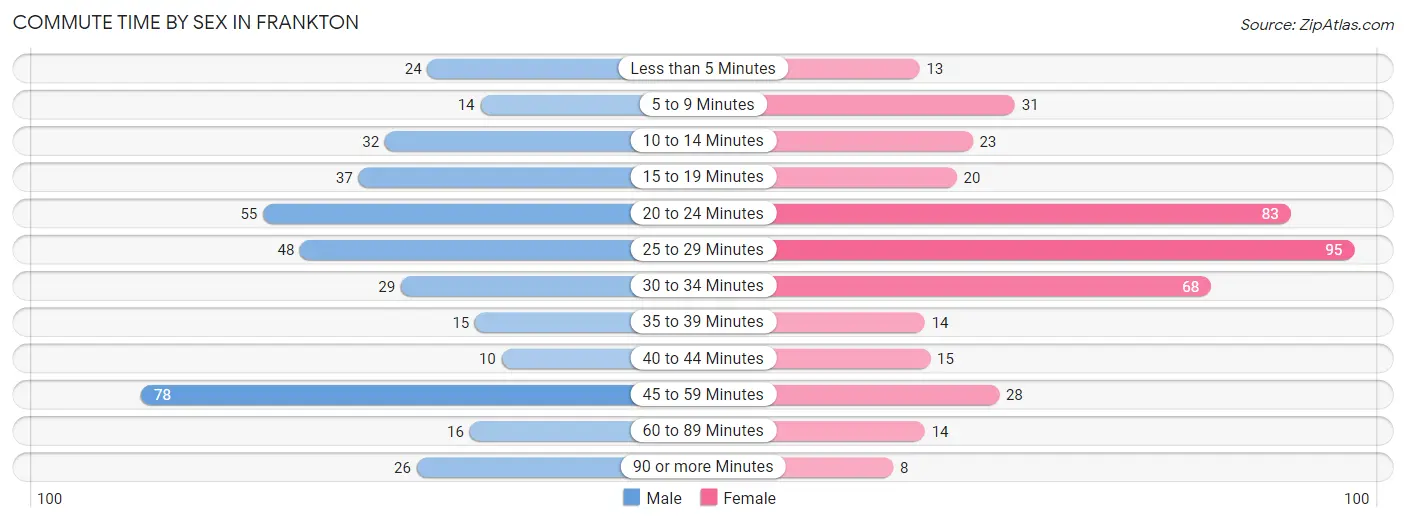
| Commute Time | Male | Female |
| Less than 5 Minutes | 24 (6.2%) | 13 (3.2%) |
| 5 to 9 Minutes | 14 (3.6%) | 31 (7.5%) |
| 10 to 14 Minutes | 32 (8.3%) | 23 (5.6%) |
| 15 to 19 Minutes | 37 (9.6%) | 20 (4.9%) |
| 20 to 24 Minutes | 55 (14.3%) | 83 (20.2%) |
| 25 to 29 Minutes | 48 (12.5%) | 95 (23.1%) |
| 30 to 34 Minutes | 29 (7.5%) | 68 (16.5%) |
| 35 to 39 Minutes | 15 (3.9%) | 14 (3.4%) |
| 40 to 44 Minutes | 10 (2.6%) | 15 (3.6%) |
| 45 to 59 Minutes | 78 (20.3%) | 28 (6.8%) |
| 60 to 89 Minutes | 16 (4.2%) | 14 (3.4%) |
| 90 or more Minutes | 26 (6.8%) | 8 (1.9%) |
Time of Departure to Work by Sex in Frankton
The most frequent times of departure to work in Frankton are 6:00 AM to 6:29 AM (59, 15.4%) for males and 7:00 AM to 7:29 AM (105, 25.5%) for females.
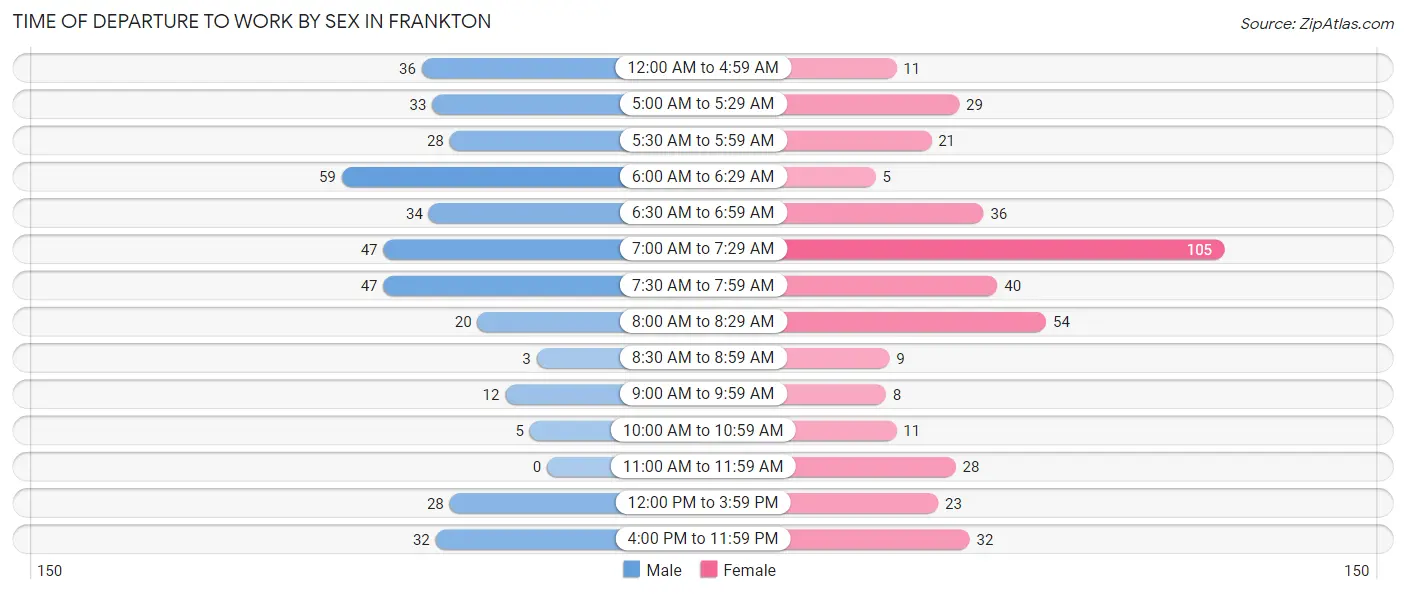
| Time of Departure | Male | Female |
| 12:00 AM to 4:59 AM | 36 (9.4%) | 11 (2.7%) |
| 5:00 AM to 5:29 AM | 33 (8.6%) | 29 (7.0%) |
| 5:30 AM to 5:59 AM | 28 (7.3%) | 21 (5.1%) |
| 6:00 AM to 6:29 AM | 59 (15.4%) | 5 (1.2%) |
| 6:30 AM to 6:59 AM | 34 (8.8%) | 36 (8.7%) |
| 7:00 AM to 7:29 AM | 47 (12.2%) | 105 (25.5%) |
| 7:30 AM to 7:59 AM | 47 (12.2%) | 40 (9.7%) |
| 8:00 AM to 8:29 AM | 20 (5.2%) | 54 (13.1%) |
| 8:30 AM to 8:59 AM | 3 (0.8%) | 9 (2.2%) |
| 9:00 AM to 9:59 AM | 12 (3.1%) | 8 (1.9%) |
| 10:00 AM to 10:59 AM | 5 (1.3%) | 11 (2.7%) |
| 11:00 AM to 11:59 AM | 0 (0.0%) | 28 (6.8%) |
| 12:00 PM to 3:59 PM | 28 (7.3%) | 23 (5.6%) |
| 4:00 PM to 11:59 PM | 32 (8.3%) | 32 (7.8%) |
| Total | 384 (100.0%) | 412 (100.0%) |
Housing Occupancy in Frankton
Occupancy by Ownership in Frankton
Of the total 723 dwellings in Frankton, owner-occupied units account for 538 (74.4%), while renter-occupied units make up 185 (25.6%).
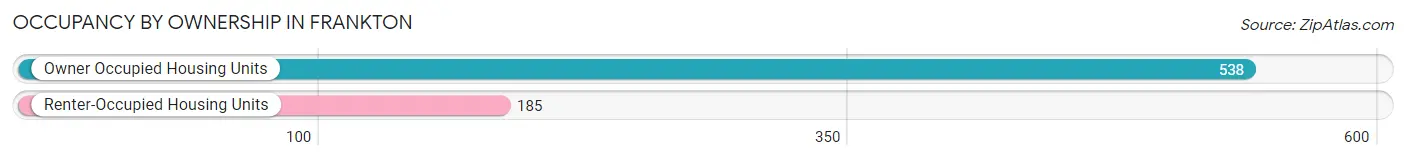
| Occupancy | # Housing Units | % Housing Units |
| Owner Occupied Housing Units | 538 | 74.4% |
| Renter-Occupied Housing Units | 185 | 25.6% |
| Total Occupied Housing Units | 723 | 100.0% |
Occupancy by Household Size in Frankton
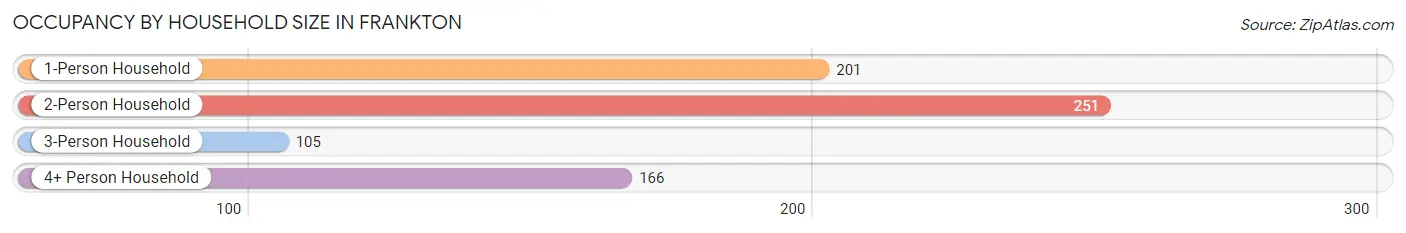
| Household Size | # Housing Units | % Housing Units |
| 1-Person Household | 201 | 27.8% |
| 2-Person Household | 251 | 34.7% |
| 3-Person Household | 105 | 14.5% |
| 4+ Person Household | 166 | 23.0% |
| Total Housing Units | 723 | 100.0% |
Occupancy by Ownership by Household Size in Frankton
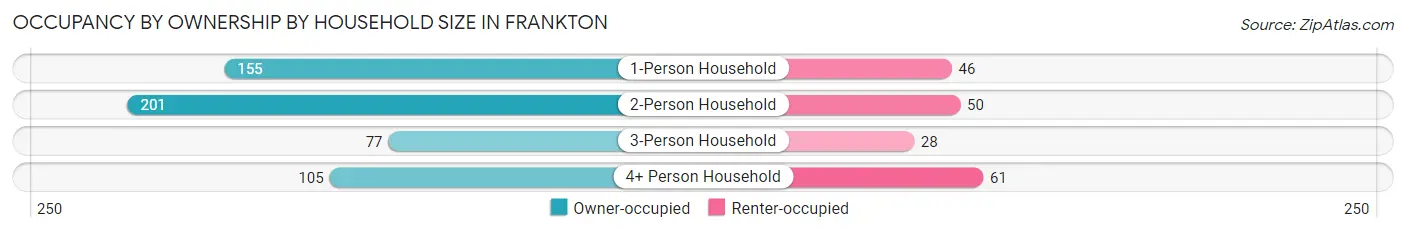
| Household Size | Owner-occupied | Renter-occupied |
| 1-Person Household | 155 (77.1%) | 46 (22.9%) |
| 2-Person Household | 201 (80.1%) | 50 (19.9%) |
| 3-Person Household | 77 (73.3%) | 28 (26.7%) |
| 4+ Person Household | 105 (63.2%) | 61 (36.7%) |
| Total Housing Units | 538 (74.4%) | 185 (25.6%) |
Occupancy by Educational Attainment in Frankton
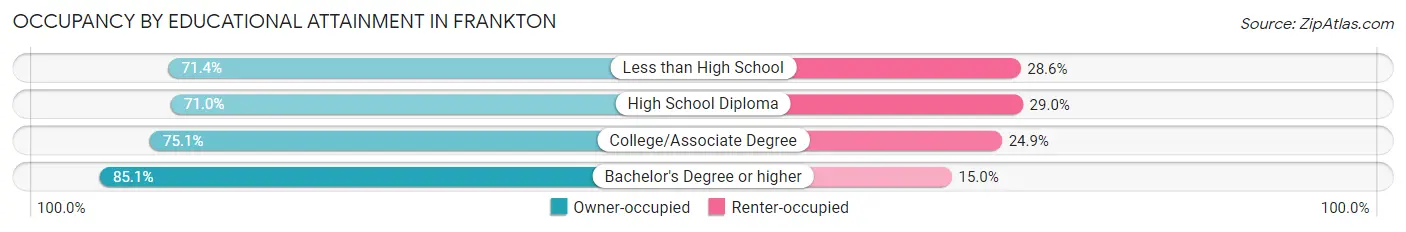
| Household Size | Owner-occupied | Renter-occupied |
| Less than High School | 35 (71.4%) | 14 (28.6%) |
| High School Diploma | 237 (71.0%) | 97 (29.0%) |
| College/Associate Degree | 175 (75.1%) | 58 (24.9%) |
| Bachelor's Degree or higher | 91 (85.1%) | 16 (14.9%) |
Occupancy by Age of Householder in Frankton
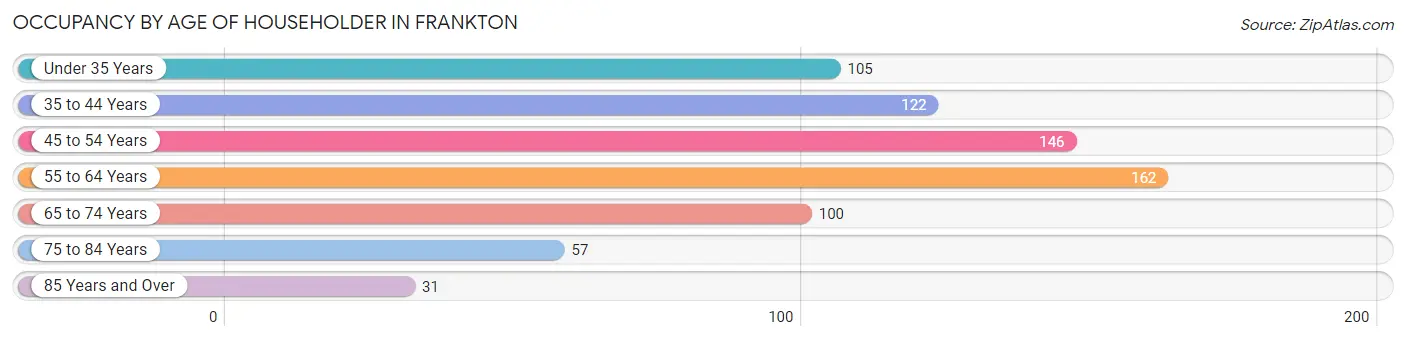
| Age Bracket | # Households | % Households |
| Under 35 Years | 105 | 14.5% |
| 35 to 44 Years | 122 | 16.9% |
| 45 to 54 Years | 146 | 20.2% |
| 55 to 64 Years | 162 | 22.4% |
| 65 to 74 Years | 100 | 13.8% |
| 75 to 84 Years | 57 | 7.9% |
| 85 Years and Over | 31 | 4.3% |
| Total | 723 | 100.0% |
Housing Finances in Frankton
Median Income by Occupancy in Frankton
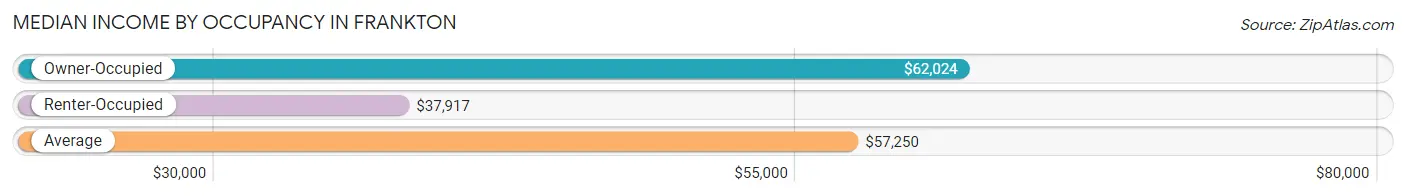
| Occupancy Type | # Households | Median Income |
| Owner-Occupied | 538 (74.4%) | $62,024 |
| Renter-Occupied | 185 (25.6%) | $37,917 |
| Average | 723 (100.0%) | $57,250 |
Occupancy by Householder Income Bracket in Frankton
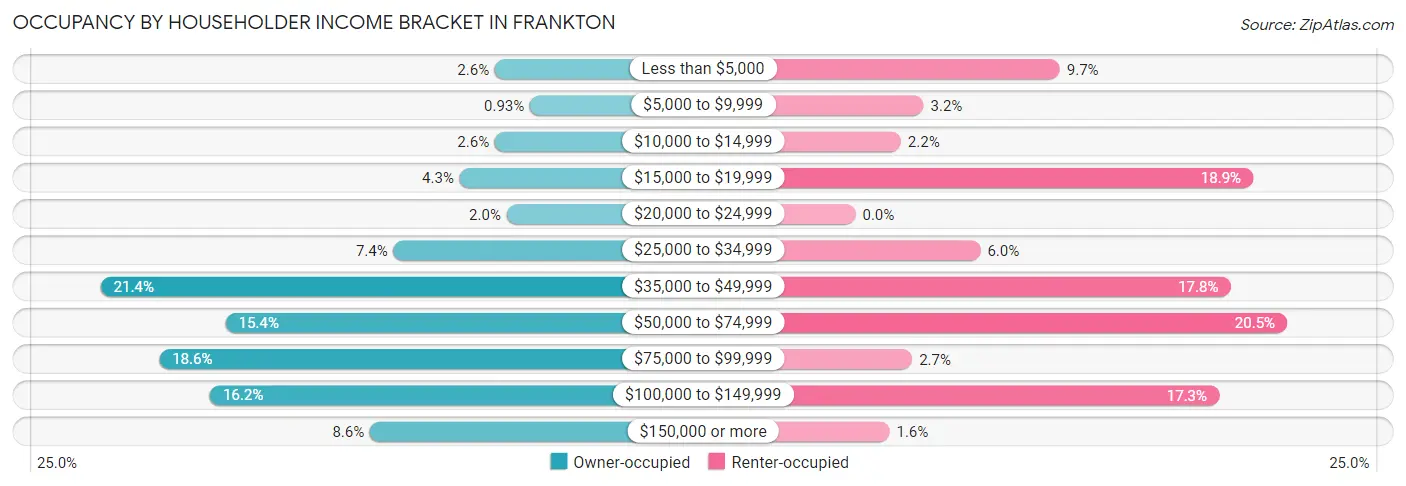
| Income Bracket | Owner-occupied | Renter-occupied |
| Less than $5,000 | 14 (2.6%) | 18 (9.7%) |
| $5,000 to $9,999 | 5 (0.9%) | 6 (3.2%) |
| $10,000 to $14,999 | 14 (2.6%) | 4 (2.2%) |
| $15,000 to $19,999 | 23 (4.3%) | 35 (18.9%) |
| $20,000 to $24,999 | 11 (2.0%) | 0 (0.0%) |
| $25,000 to $34,999 | 40 (7.4%) | 11 (5.9%) |
| $35,000 to $49,999 | 115 (21.4%) | 33 (17.8%) |
| $50,000 to $74,999 | 83 (15.4%) | 38 (20.5%) |
| $75,000 to $99,999 | 100 (18.6%) | 5 (2.7%) |
| $100,000 to $149,999 | 87 (16.2%) | 32 (17.3%) |
| $150,000 or more | 46 (8.6%) | 3 (1.6%) |
| Total | 538 (100.0%) | 185 (100.0%) |
Monthly Housing Cost Tiers in Frankton
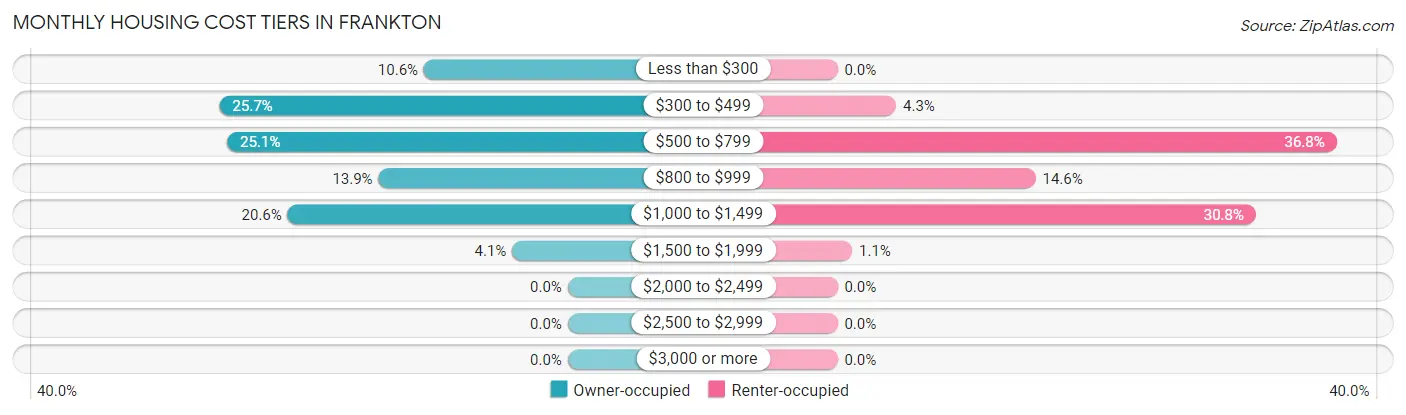
| Monthly Cost | Owner-occupied | Renter-occupied |
| Less than $300 | 57 (10.6%) | 0 (0.0%) |
| $300 to $499 | 138 (25.7%) | 8 (4.3%) |
| $500 to $799 | 135 (25.1%) | 68 (36.8%) |
| $800 to $999 | 75 (13.9%) | 27 (14.6%) |
| $1,000 to $1,499 | 111 (20.6%) | 57 (30.8%) |
| $1,500 to $1,999 | 22 (4.1%) | 2 (1.1%) |
| $2,000 to $2,499 | 0 (0.0%) | 0 (0.0%) |
| $2,500 to $2,999 | 0 (0.0%) | 0 (0.0%) |
| $3,000 or more | 0 (0.0%) | 0 (0.0%) |
| Total | 538 (100.0%) | 185 (100.0%) |
Physical Housing Characteristics in Frankton
Housing Structures in Frankton
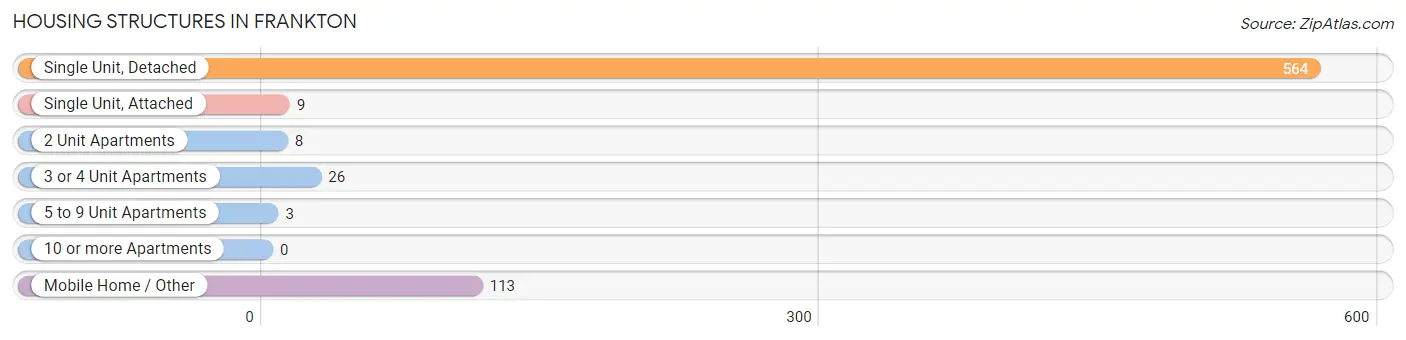
| Structure Type | # Housing Units | % Housing Units |
| Single Unit, Detached | 564 | 78.0% |
| Single Unit, Attached | 9 | 1.2% |
| 2 Unit Apartments | 8 | 1.1% |
| 3 or 4 Unit Apartments | 26 | 3.6% |
| 5 to 9 Unit Apartments | 3 | 0.4% |
| 10 or more Apartments | 0 | 0.0% |
| Mobile Home / Other | 113 | 15.6% |
| Total | 723 | 100.0% |
Housing Structures by Occupancy in Frankton
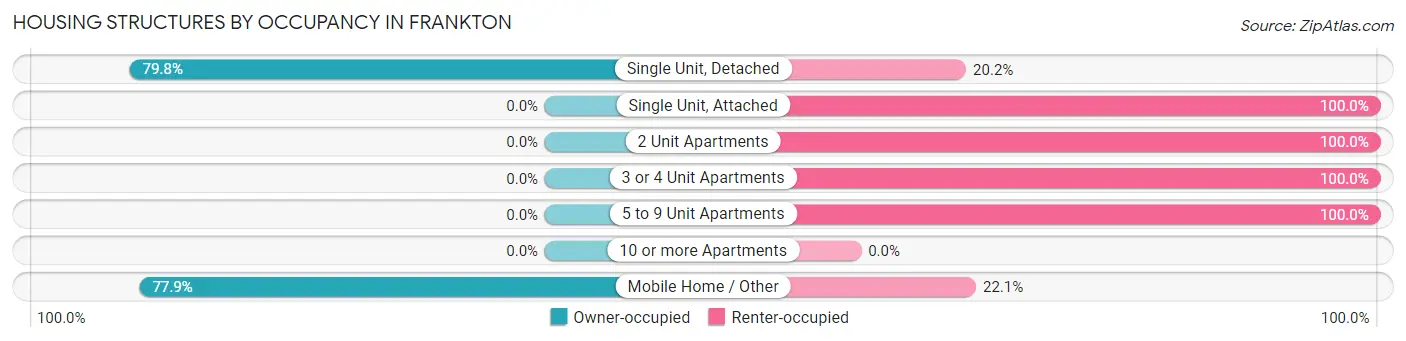
| Structure Type | Owner-occupied | Renter-occupied |
| Single Unit, Detached | 450 (79.8%) | 114 (20.2%) |
| Single Unit, Attached | 0 (0.0%) | 9 (100.0%) |
| 2 Unit Apartments | 0 (0.0%) | 8 (100.0%) |
| 3 or 4 Unit Apartments | 0 (0.0%) | 26 (100.0%) |
| 5 to 9 Unit Apartments | 0 (0.0%) | 3 (100.0%) |
| 10 or more Apartments | 0 (0.0%) | 0 (0.0%) |
| Mobile Home / Other | 88 (77.9%) | 25 (22.1%) |
| Total | 538 (74.4%) | 185 (25.6%) |
Housing Structures by Number of Rooms in Frankton
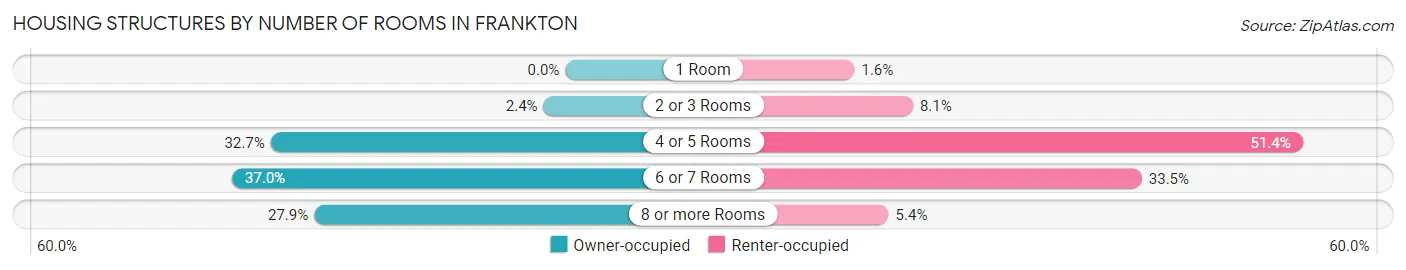
| Number of Rooms | Owner-occupied | Renter-occupied |
| 1 Room | 0 (0.0%) | 3 (1.6%) |
| 2 or 3 Rooms | 13 (2.4%) | 15 (8.1%) |
| 4 or 5 Rooms | 176 (32.7%) | 95 (51.3%) |
| 6 or 7 Rooms | 199 (37.0%) | 62 (33.5%) |
| 8 or more Rooms | 150 (27.9%) | 10 (5.4%) |
| Total | 538 (100.0%) | 185 (100.0%) |
Housing Structure by Heating Type in Frankton
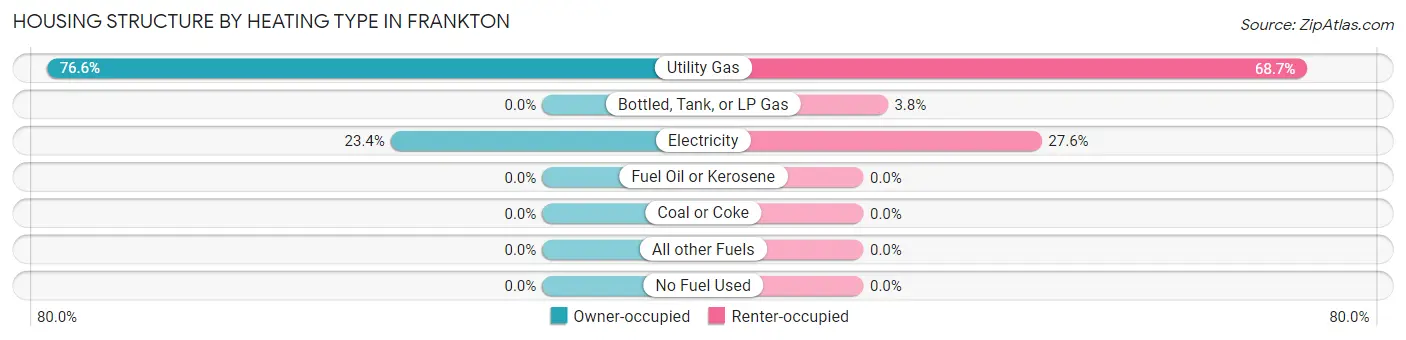
| Heating Type | Owner-occupied | Renter-occupied |
| Utility Gas | 412 (76.6%) | 127 (68.6%) |
| Bottled, Tank, or LP Gas | 0 (0.0%) | 7 (3.8%) |
| Electricity | 126 (23.4%) | 51 (27.6%) |
| Fuel Oil or Kerosene | 0 (0.0%) | 0 (0.0%) |
| Coal or Coke | 0 (0.0%) | 0 (0.0%) |
| All other Fuels | 0 (0.0%) | 0 (0.0%) |
| No Fuel Used | 0 (0.0%) | 0 (0.0%) |
| Total | 538 (100.0%) | 185 (100.0%) |
Household Vehicle Usage in Frankton
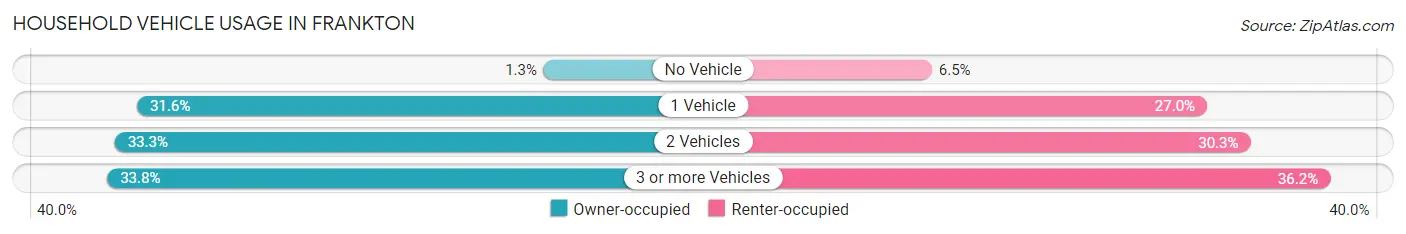
| Vehicles per Household | Owner-occupied | Renter-occupied |
| No Vehicle | 7 (1.3%) | 12 (6.5%) |
| 1 Vehicle | 170 (31.6%) | 50 (27.0%) |
| 2 Vehicles | 179 (33.3%) | 56 (30.3%) |
| 3 or more Vehicles | 182 (33.8%) | 67 (36.2%) |
| Total | 538 (100.0%) | 185 (100.0%) |
Real Estate & Mortgages in Frankton
Real Estate and Mortgage Overview in Frankton
| Characteristic | Without Mortgage | With Mortgage |
| Housing Units | 223 | 315 |
| Median Property Value | $85,000 | $118,500 |
| Median Household Income | $44,432 | $36 |
| Monthly Housing Costs | $392 | $0 |
| Real Estate Taxes | $538 | $0 |
Property Value by Mortgage Status in Frankton
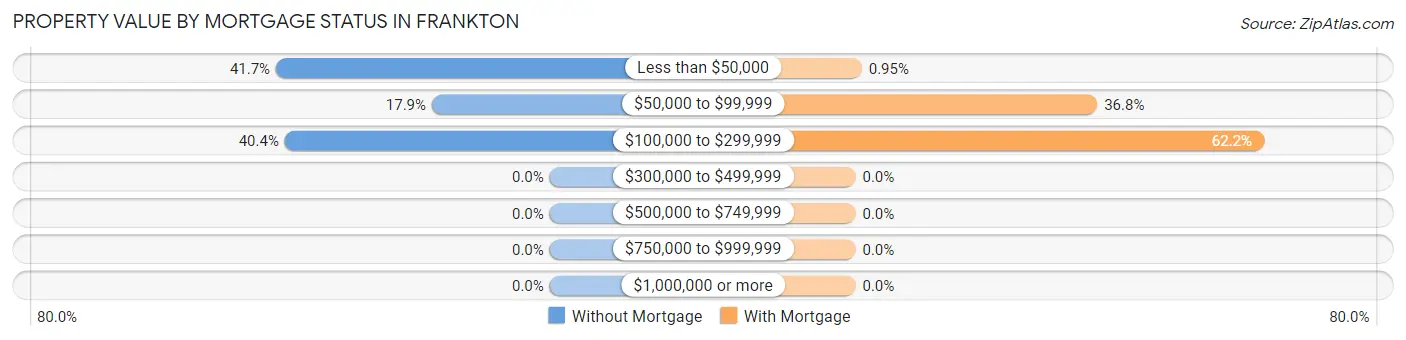
| Property Value | Without Mortgage | With Mortgage |
| Less than $50,000 | 93 (41.7%) | 3 (0.9%) |
| $50,000 to $99,999 | 40 (17.9%) | 116 (36.8%) |
| $100,000 to $299,999 | 90 (40.4%) | 196 (62.2%) |
| $300,000 to $499,999 | 0 (0.0%) | 0 (0.0%) |
| $500,000 to $749,999 | 0 (0.0%) | 0 (0.0%) |
| $750,000 to $999,999 | 0 (0.0%) | 0 (0.0%) |
| $1,000,000 or more | 0 (0.0%) | 0 (0.0%) |
| Total | 223 (100.0%) | 315 (100.0%) |
Household Income by Mortgage Status in Frankton
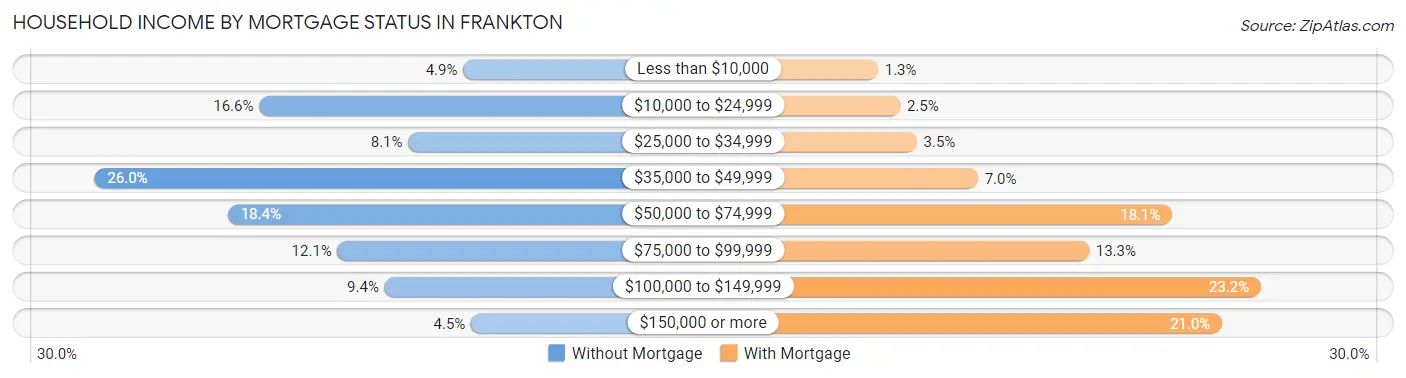
| Household Income | Without Mortgage | With Mortgage |
| Less than $10,000 | 11 (4.9%) | 4 (1.3%) |
| $10,000 to $24,999 | 37 (16.6%) | 8 (2.5%) |
| $25,000 to $34,999 | 18 (8.1%) | 11 (3.5%) |
| $35,000 to $49,999 | 58 (26.0%) | 22 (7.0%) |
| $50,000 to $74,999 | 41 (18.4%) | 57 (18.1%) |
| $75,000 to $99,999 | 27 (12.1%) | 42 (13.3%) |
| $100,000 to $149,999 | 21 (9.4%) | 73 (23.2%) |
| $150,000 or more | 10 (4.5%) | 66 (20.9%) |
| Total | 223 (100.0%) | 315 (100.0%) |
Property Value to Household Income Ratio in Frankton
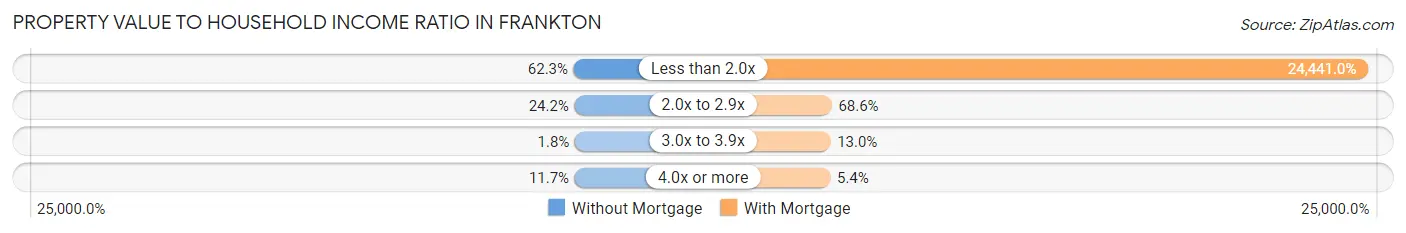
| Value-to-Income Ratio | Without Mortgage | With Mortgage |
| Less than 2.0x | 139 (62.3%) | 76,989 (24,441.0%) |
| 2.0x to 2.9x | 54 (24.2%) | 216 (68.6%) |
| 3.0x to 3.9x | 4 (1.8%) | 41 (13.0%) |
| 4.0x or more | 26 (11.7%) | 17 (5.4%) |
| Total | 223 (100.0%) | 315 (100.0%) |
Real Estate Taxes by Mortgage Status in Frankton
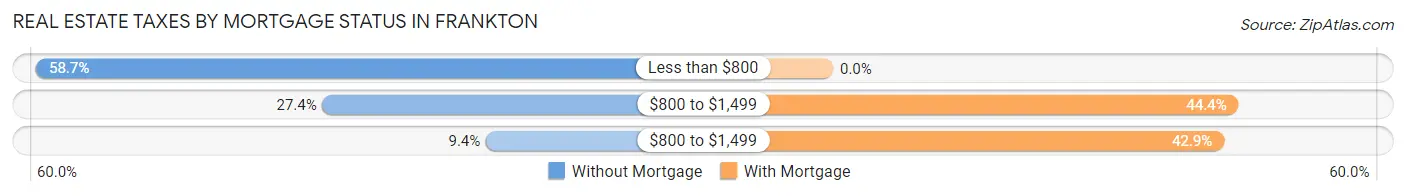
| Property Taxes | Without Mortgage | With Mortgage |
| Less than $800 | 131 (58.7%) | 0 (0.0%) |
| $800 to $1,499 | 61 (27.4%) | 140 (44.4%) |
| $800 to $1,499 | 21 (9.4%) | 135 (42.9%) |
| Total | 223 (100.0%) | 315 (100.0%) |
Health & Disability in Frankton
Health Insurance Coverage by Age in Frankton
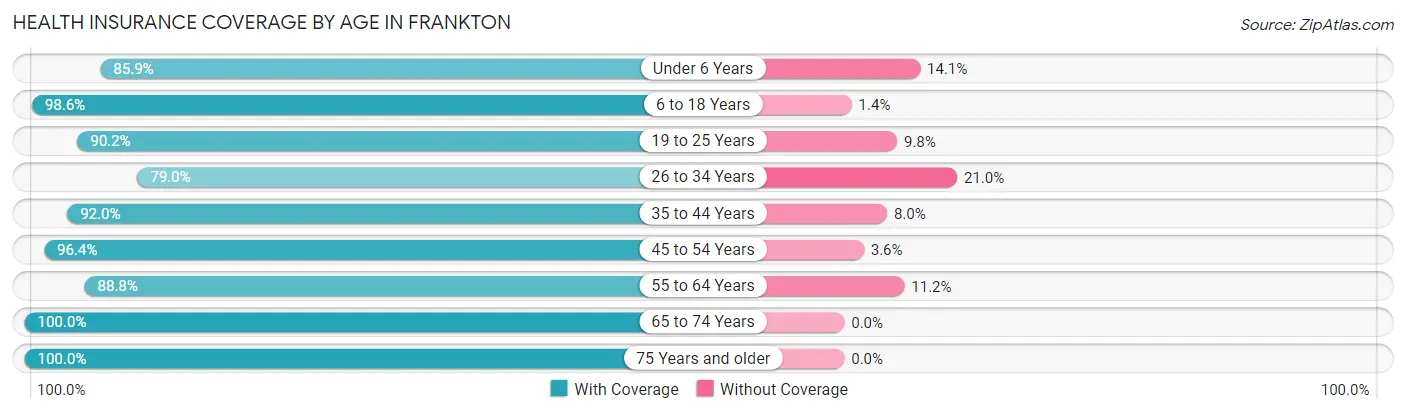
| Age Bracket | With Coverage | Without Coverage |
| Under 6 Years | 85 (85.9%) | 14 (14.1%) |
| 6 to 18 Years | 360 (98.6%) | 5 (1.4%) |
| 19 to 25 Years | 110 (90.2%) | 12 (9.8%) |
| 26 to 34 Years | 169 (79.0%) | 45 (21.0%) |
| 35 to 44 Years | 185 (92.0%) | 16 (8.0%) |
| 45 to 54 Years | 292 (96.4%) | 11 (3.6%) |
| 55 to 64 Years | 222 (88.8%) | 28 (11.2%) |
| 65 to 74 Years | 164 (100.0%) | 0 (0.0%) |
| 75 Years and older | 131 (100.0%) | 0 (0.0%) |
| Total | 1,718 (92.9%) | 131 (7.1%) |
Health Insurance Coverage by Citizenship Status in Frankton
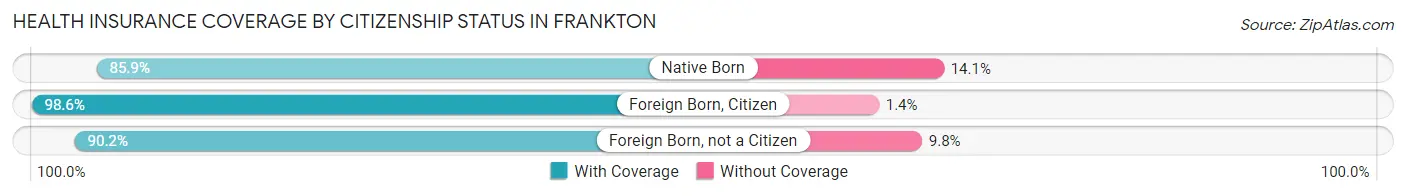
| Citizenship Status | With Coverage | Without Coverage |
| Native Born | 85 (85.9%) | 14 (14.1%) |
| Foreign Born, Citizen | 360 (98.6%) | 5 (1.4%) |
| Foreign Born, not a Citizen | 110 (90.2%) | 12 (9.8%) |
Health Insurance Coverage by Household Income in Frankton
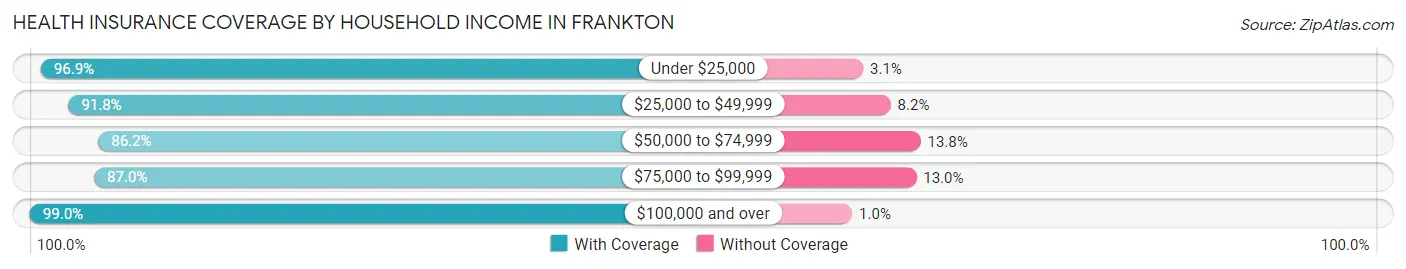
| Household Income | With Coverage | Without Coverage |
| Under $25,000 | 222 (96.9%) | 7 (3.1%) |
| $25,000 to $49,999 | 335 (91.8%) | 30 (8.2%) |
| $50,000 to $74,999 | 293 (86.2%) | 47 (13.8%) |
| $75,000 to $99,999 | 274 (87.0%) | 41 (13.0%) |
| $100,000 and over | 594 (99.0%) | 6 (1.0%) |
Public vs Private Health Insurance Coverage by Age in Frankton
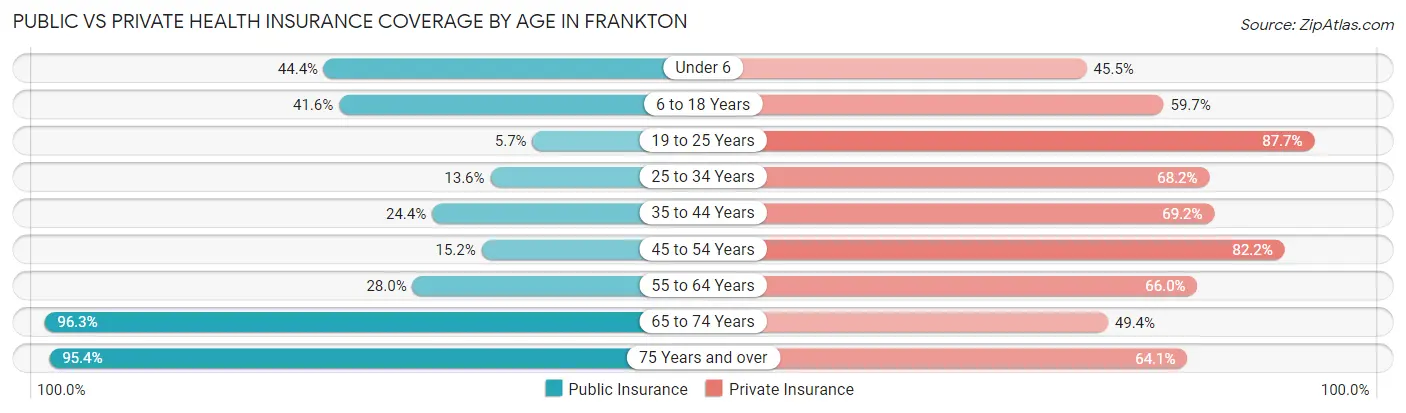
| Age Bracket | Public Insurance | Private Insurance |
| Under 6 | 44 (44.4%) | 45 (45.5%) |
| 6 to 18 Years | 152 (41.6%) | 218 (59.7%) |
| 19 to 25 Years | 7 (5.7%) | 107 (87.7%) |
| 25 to 34 Years | 29 (13.6%) | 146 (68.2%) |
| 35 to 44 Years | 49 (24.4%) | 139 (69.2%) |
| 45 to 54 Years | 46 (15.2%) | 249 (82.2%) |
| 55 to 64 Years | 70 (28.0%) | 165 (66.0%) |
| 65 to 74 Years | 158 (96.3%) | 81 (49.4%) |
| 75 Years and over | 125 (95.4%) | 84 (64.1%) |
| Total | 680 (36.8%) | 1,234 (66.7%) |
Disability Status by Sex by Age in Frankton
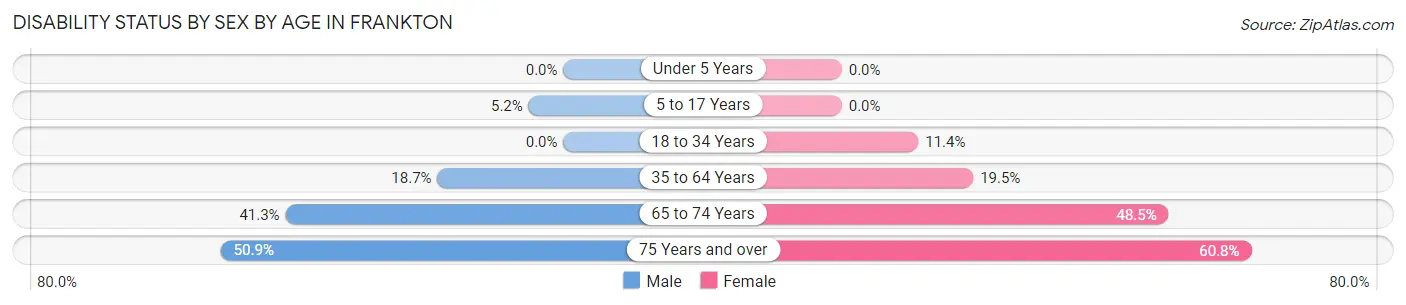
| Age Bracket | Male | Female |
| Under 5 Years | 0 (0.0%) | 0 (0.0%) |
| 5 to 17 Years | 11 (5.2%) | 0 (0.0%) |
| 18 to 34 Years | 0 (0.0%) | 20 (11.4%) |
| 35 to 64 Years | 72 (18.7%) | 72 (19.5%) |
| 65 to 74 Years | 26 (41.3%) | 49 (48.5%) |
| 75 Years and over | 29 (50.9%) | 45 (60.8%) |
Disability Class by Sex by Age in Frankton
Disability Class: Hearing Difficulty
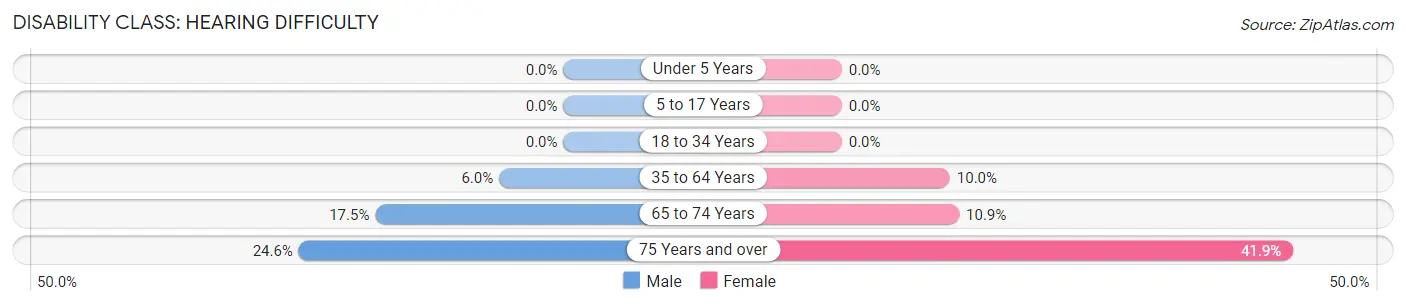
| Age Bracket | Male | Female |
| Under 5 Years | 0 (0.0%) | 0 (0.0%) |
| 5 to 17 Years | 0 (0.0%) | 0 (0.0%) |
| 18 to 34 Years | 0 (0.0%) | 0 (0.0%) |
| 35 to 64 Years | 23 (6.0%) | 37 (10.0%) |
| 65 to 74 Years | 11 (17.5%) | 11 (10.9%) |
| 75 Years and over | 14 (24.6%) | 31 (41.9%) |
Disability Class: Vision Difficulty
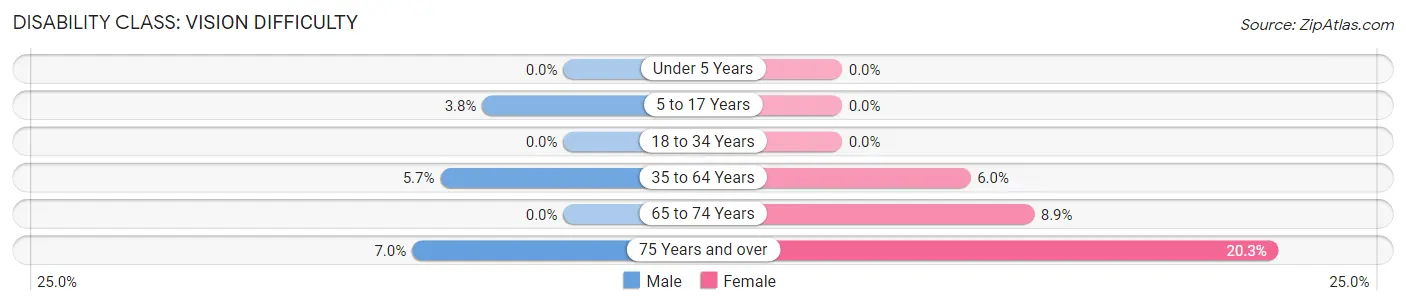
| Age Bracket | Male | Female |
| Under 5 Years | 0 (0.0%) | 0 (0.0%) |
| 5 to 17 Years | 8 (3.8%) | 0 (0.0%) |
| 18 to 34 Years | 0 (0.0%) | 0 (0.0%) |
| 35 to 64 Years | 22 (5.7%) | 22 (6.0%) |
| 65 to 74 Years | 0 (0.0%) | 9 (8.9%) |
| 75 Years and over | 4 (7.0%) | 15 (20.3%) |
Disability Class: Cognitive Difficulty
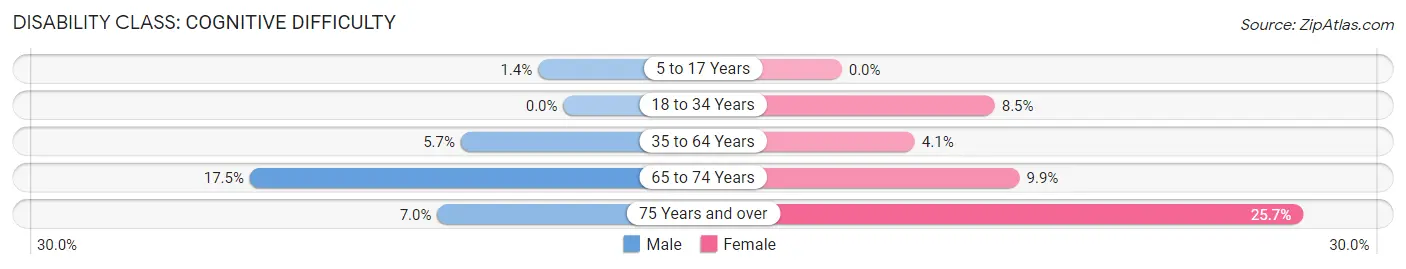
| Age Bracket | Male | Female |
| 5 to 17 Years | 3 (1.4%) | 0 (0.0%) |
| 18 to 34 Years | 0 (0.0%) | 15 (8.5%) |
| 35 to 64 Years | 22 (5.7%) | 15 (4.1%) |
| 65 to 74 Years | 11 (17.5%) | 10 (9.9%) |
| 75 Years and over | 4 (7.0%) | 19 (25.7%) |
Disability Class: Ambulatory Difficulty
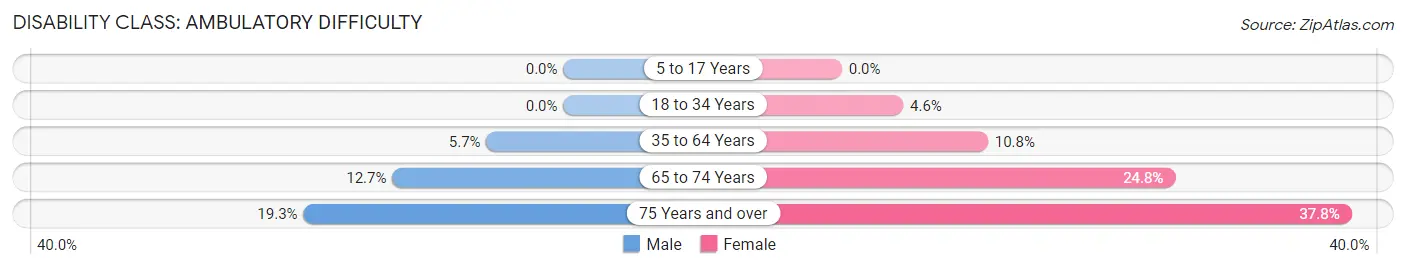
| Age Bracket | Male | Female |
| 5 to 17 Years | 0 (0.0%) | 0 (0.0%) |
| 18 to 34 Years | 0 (0.0%) | 8 (4.5%) |
| 35 to 64 Years | 22 (5.7%) | 40 (10.8%) |
| 65 to 74 Years | 8 (12.7%) | 25 (24.7%) |
| 75 Years and over | 11 (19.3%) | 28 (37.8%) |
Disability Class: Self-Care Difficulty
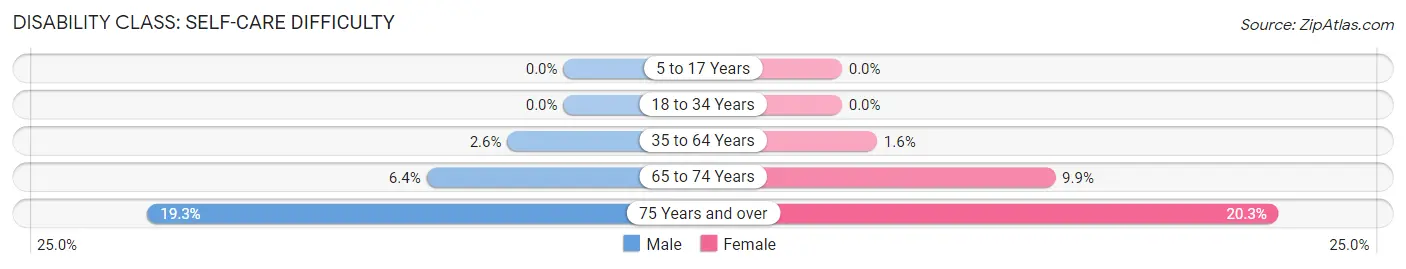
| Age Bracket | Male | Female |
| 5 to 17 Years | 0 (0.0%) | 0 (0.0%) |
| 18 to 34 Years | 0 (0.0%) | 0 (0.0%) |
| 35 to 64 Years | 10 (2.6%) | 6 (1.6%) |
| 65 to 74 Years | 4 (6.4%) | 10 (9.9%) |
| 75 Years and over | 11 (19.3%) | 15 (20.3%) |
Technology Access in Frankton
Computing Device Access in Frankton
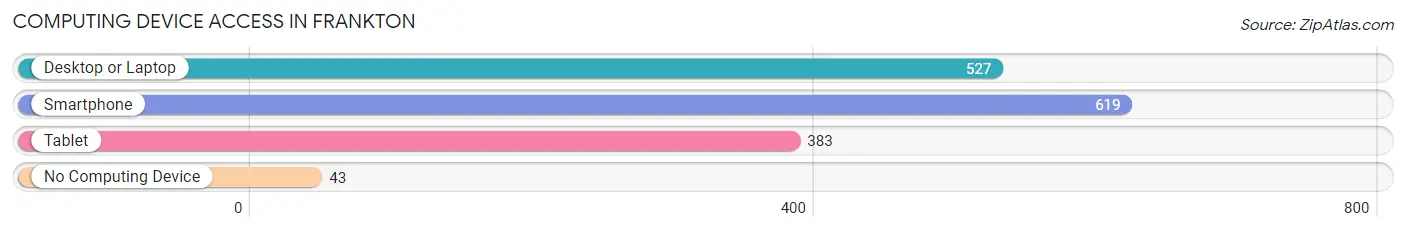
| Device Type | # Households | % Households |
| Desktop or Laptop | 527 | 72.9% |
| Smartphone | 619 | 85.6% |
| Tablet | 383 | 53.0% |
| No Computing Device | 43 | 5.9% |
| Total | 723 | 100.0% |
Internet Access in Frankton
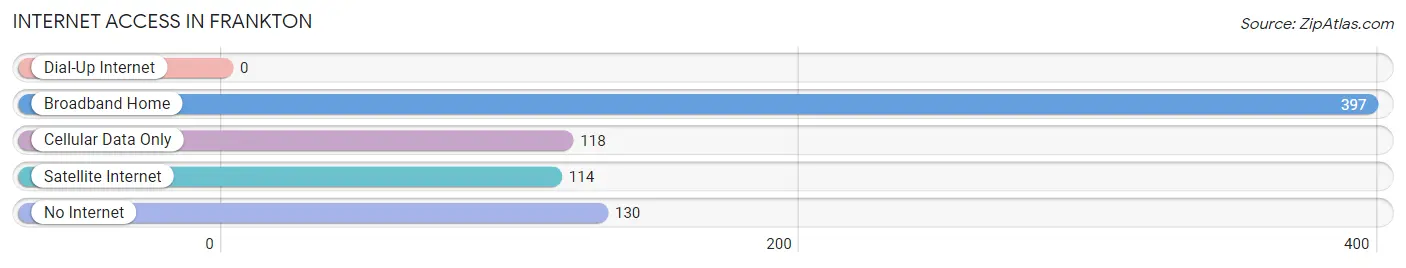
| Internet Type | # Households | % Households |
| Dial-Up Internet | 0 | 0.0% |
| Broadband Home | 397 | 54.9% |
| Cellular Data Only | 118 | 16.3% |
| Satellite Internet | 114 | 15.8% |
| No Internet | 130 | 18.0% |
| Total | 723 | 100.0% |
Frankton Summary
History
Frankton, Indiana is a small town located in Madison County, Indiana. It is situated on the banks of the White River, and is part of the Anderson Metropolitan Statistical Area. The town was founded in 1837 by William Frank, who named it after himself. The town was originally a farming community, but has since grown to include a variety of businesses and industries.
The town was originally part of the Delaware Nation, and was later settled by European settlers. The first settlers were mostly of German and English descent, and the town was originally known as Frank’s Town. The town was officially incorporated in 1837, and the first post office was established in 1838.
The town was a major stop on the Underground Railroad, and was home to many abolitionists. The town was also home to a number of prominent abolitionists, including William Lloyd Garrison and Frederick Douglass.
The town was also home to a number of prominent businesses, including a flour mill, a sawmill, a grist mill, and a distillery. The town was also home to a number of churches, including the First Presbyterian Church, which was founded in 1837.
The town was also home to a number of schools, including the Frankton Academy, which was founded in 1845. The town was also home to a number of newspapers, including the Frankton Herald, which was founded in 1851.
The town was also home to a number of prominent citizens, including William Frank, who was the founder of the town, and William Lloyd Garrison, who was an abolitionist.
Geography
Frankton is located in Madison County, Indiana, and is situated on the banks of the White River. The town is located approximately 25 miles northeast of Indianapolis, and is part of the Anderson Metropolitan Statistical Area. The town is located in a rural area, and is surrounded by farmland and wooded areas.
The town has a total area of 1.2 square miles, all of which is land. The town has a humid continental climate, with hot summers and cold winters. The average temperature in the summer is around 75 degrees Fahrenheit, and the average temperature in the winter is around 30 degrees Fahrenheit.
Economy
Frankton’s economy is largely based on agriculture and manufacturing. The town is home to a number of businesses, including a flour mill, a sawmill, a grist mill, and a distillery. The town is also home to a number of retail stores, including a grocery store, a hardware store, and a variety of other shops.
The town is also home to a number of manufacturing companies, including a plastics manufacturer, a metal fabricator, and a machine shop. The town is also home to a number of service-based businesses, including a bank, a post office, and a variety of other businesses.
Demographics
As of the 2010 census, the town had a population of 1,845. The racial makeup of the town was 97.3% White, 0.7% African American, 0.2% Native American, 0.2% Asian, 0.1% from other races, and 1.5% from two or more races. Hispanic or Latino of any race were 0.7% of the population.
The median income for a household in the town was $41,250, and the median income for a family was $50,000. The per capita income for the town was $20,845. About 8.3% of families and 10.2% of the population were below the poverty line, including 14.3% of those under age 18 and 8.2% of those age 65 or over.
Common Questions
What is Per Capita Income in Frankton?
Per Capita income in Frankton is $29,778.
What is the Median Family Income in Frankton?
Median Family Income in Frankton is $75,478.
What is the Median Household income in Frankton?
Median Household Income in Frankton is $57,250.
What is Income or Wage Gap in Frankton?
Income or Wage Gap in Frankton is 13.7%.
Women in Frankton earn 86.3 cents for every dollar earned by a man.
What is Inequality or Gini Index in Frankton?
Inequality or Gini Index in Frankton is 0.42.
What is the Total Population of Frankton?
Total Population of Frankton is 1,849.
What is the Total Male Population of Frankton?
Total Male Population of Frankton is 955.
What is the Total Female Population of Frankton?
Total Female Population of Frankton is 894.
What is the Ratio of Males per 100 Females in Frankton?
There are 106.82 Males per 100 Females in Frankton.
What is the Ratio of Females per 100 Males in Frankton?
There are 93.61 Females per 100 Males in Frankton.
What is the Median Population Age in Frankton?
Median Population Age in Frankton is 42.0 Years.
What is the Average Family Size in Frankton
Average Family Size in Frankton is 3.1 People.
What is the Average Household Size in Frankton
Average Household Size in Frankton is 2.6 People.
How Large is the Labor Force in Frankton?
There are 910 People in the Labor Forcein in Frankton.
What is the Percentage of People in the Labor Force in Frankton?
61.1% of People are in the Labor Force in Frankton.
What is the Unemployment Rate in Frankton?
Unemployment Rate in Frankton is 2.6%.