Frankfort, IN Map & Demographics
Frankfort Map
Frankfort Overview
$24,934
PER CAPITA INCOME
$61,983
AVG FAMILY INCOME
$49,821
AVG HOUSEHOLD INCOME
20.3%
WAGE / INCOME GAP [ % ]
79.7¢/ $1
WAGE / INCOME GAP [ $ ]
$10,920
FAMILY INCOME DEFICIT
0.40
INEQUALITY / GINI INDEX
15,976
TOTAL POPULATION
7,978
MALE POPULATION
7,998
FEMALE POPULATION
99.75
MALES / 100 FEMALES
100.25
FEMALES / 100 MALES
35.7
MEDIAN AGE
3.4
AVG FAMILY SIZE
2.5
AVG HOUSEHOLD SIZE
7,751
LABOR FORCE [ PEOPLE ]
62.9%
PERCENT IN LABOR FORCE
4.4%
UNEMPLOYMENT RATE
Frankfort Zip Codes
Frankfort Area Codes
Income in Frankfort
Income Overview in Frankfort
Per Capita Income in Frankfort is $24,934, while median incomes of families and households are $61,983 and $49,821 respectively.
| Characteristic | Number | Measure |
| Per Capita Income | 15,976 | $24,934 |
| Median Family Income | 3,514 | $61,983 |
| Mean Family Income | 3,514 | $76,507 |
| Median Household Income | 6,159 | $49,821 |
| Mean Household Income | 6,159 | $62,212 |
| Income Deficit | 3,514 | $10,920 |
| Wage / Income Gap (%) | 15,976 | 20.33% |
| Wage / Income Gap ($) | 15,976 | 79.67¢ per $1 |
| Gini / Inequality Index | 15,976 | 0.40 |
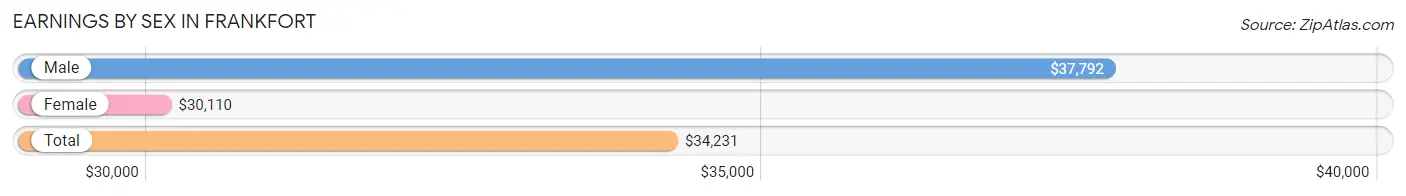
Earnings by Sex in Frankfort
Average Earnings in Frankfort are $34,231, $37,792 for men and $30,110 for women, a difference of 20.3%.
| Sex | Number | Average Earnings |
| Male | 4,643 (56.3%) | $37,792 |
| Female | 3,609 (43.7%) | $30,110 |
| Total | 8,252 (100.0%) | $34,231 |
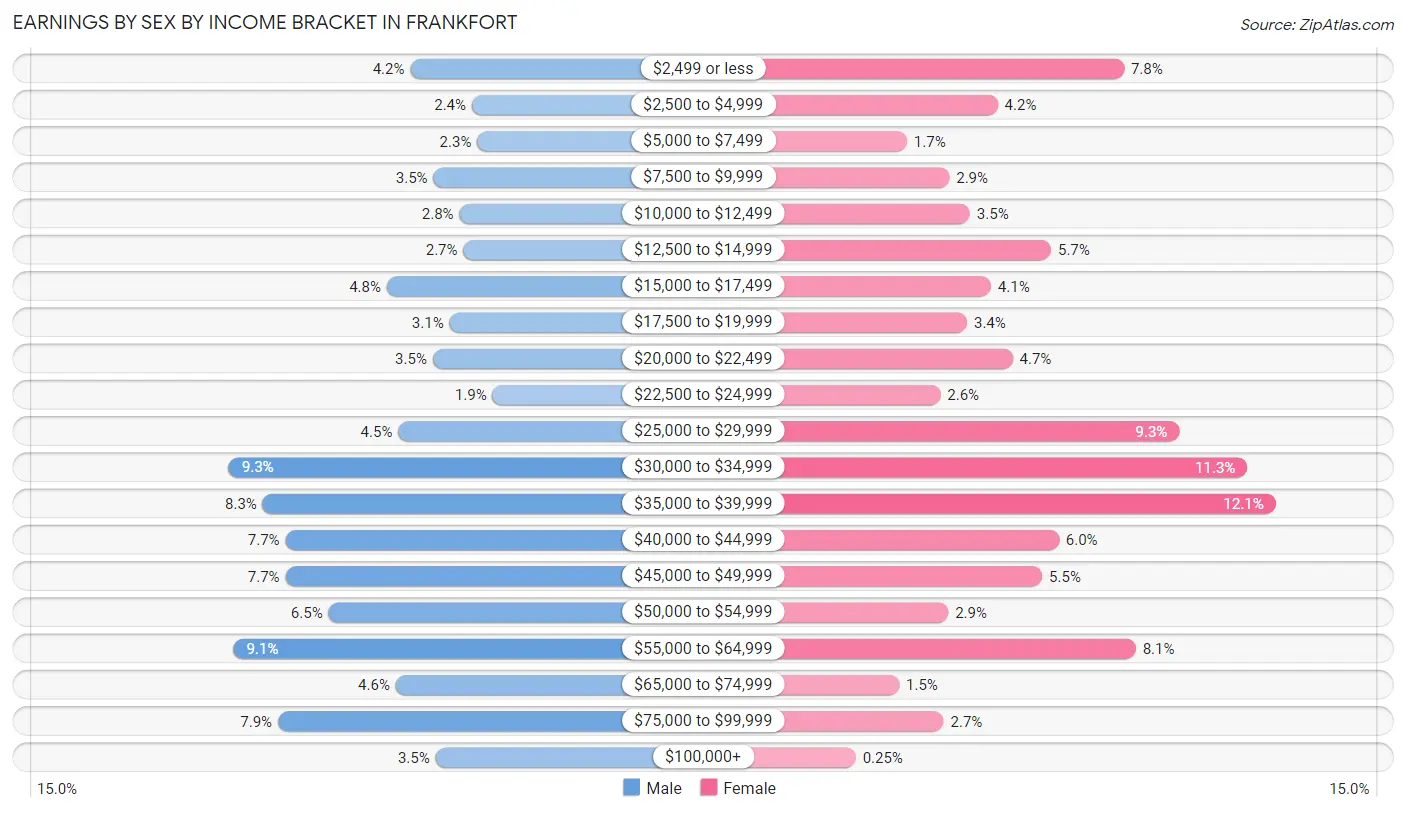
Earnings by Sex by Income Bracket in Frankfort
The most common earnings brackets in Frankfort are $30,000 to $34,999 for men (430 | 9.3%) and $35,000 to $39,999 for women (435 | 12.0%).
| Income | Male | Female |
| $2,499 or less | 193 (4.2%) | 281 (7.8%) |
| $2,500 to $4,999 | 113 (2.4%) | 153 (4.2%) |
| $5,000 to $7,499 | 106 (2.3%) | 61 (1.7%) |
| $7,500 to $9,999 | 163 (3.5%) | 104 (2.9%) |
| $10,000 to $12,499 | 129 (2.8%) | 125 (3.5%) |
| $12,500 to $14,999 | 124 (2.7%) | 207 (5.7%) |
| $15,000 to $17,499 | 224 (4.8%) | 146 (4.1%) |
| $17,500 to $19,999 | 142 (3.1%) | 122 (3.4%) |
| $20,000 to $22,499 | 164 (3.5%) | 168 (4.7%) |
| $22,500 to $24,999 | 86 (1.8%) | 95 (2.6%) |
| $25,000 to $29,999 | 209 (4.5%) | 337 (9.3%) |
| $30,000 to $34,999 | 430 (9.3%) | 406 (11.3%) |
| $35,000 to $39,999 | 386 (8.3%) | 435 (12.0%) |
| $40,000 to $44,999 | 356 (7.7%) | 215 (6.0%) |
| $45,000 to $49,999 | 356 (7.7%) | 198 (5.5%) |
| $50,000 to $54,999 | 300 (6.5%) | 103 (2.9%) |
| $55,000 to $64,999 | 424 (9.1%) | 293 (8.1%) |
| $65,000 to $74,999 | 212 (4.6%) | 53 (1.5%) |
| $75,000 to $99,999 | 366 (7.9%) | 98 (2.7%) |
| $100,000+ | 160 (3.5%) | 9 (0.3%) |
| Total | 4,643 (100.0%) | 3,609 (100.0%) |
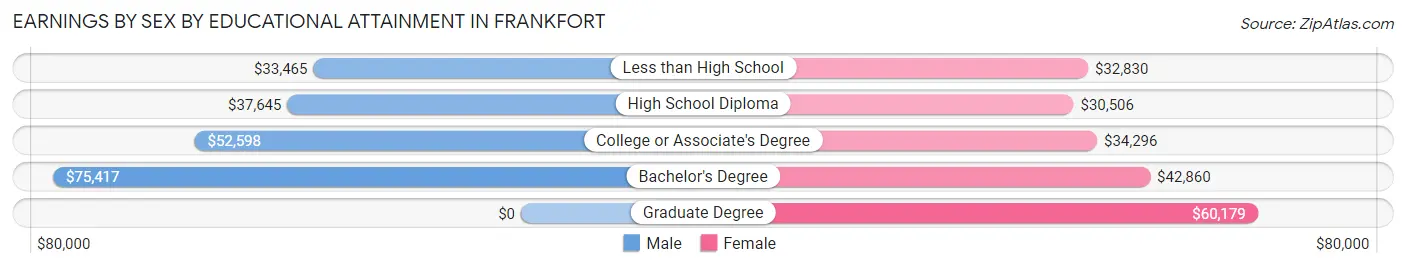
Earnings by Sex by Educational Attainment in Frankfort
Average earnings in Frankfort are $41,044 for men and $33,994 for women, a difference of 17.2%. Men with an educational attainment of bachelor's degree enjoy the highest average annual earnings of $75,417, while those with less than high school education earn the least with $33,465. Women with an educational attainment of graduate degree earn the most with the average annual earnings of $60,179, while those with high school diploma education have the smallest earnings of $30,506.
| Educational Attainment | Male Income | Female Income |
| Less than High School | $33,465 | $32,830 |
| High School Diploma | $37,645 | $30,506 |
| College or Associate's Degree | $52,598 | $34,296 |
| Bachelor's Degree | $75,417 | $42,860 |
| Graduate Degree | - | - |
| Total | $41,044 | $33,994 |
Family Income in Frankfort
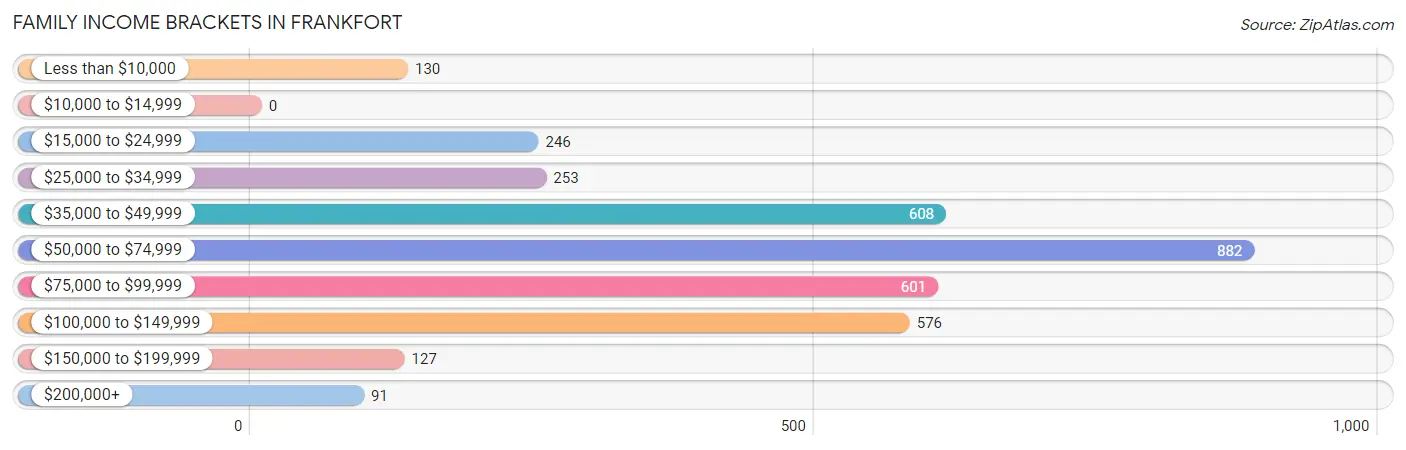
Family Income Brackets in Frankfort
According to the Frankfort family income data, there are 882 families falling into the $50,000 to $74,999 income range, which is the most common income bracket and makes up 25.1% of all families.
| Income Bracket | # Families | % Families |
| Less than $10,000 | 130 | 3.7% |
| $10,000 to $14,999 | 0 | 0.0% |
| $15,000 to $24,999 | 246 | 7.0% |
| $25,000 to $34,999 | 253 | 7.2% |
| $35,000 to $49,999 | 608 | 17.3% |
| $50,000 to $74,999 | 882 | 25.1% |
| $75,000 to $99,999 | 601 | 17.1% |
| $100,000 to $149,999 | 576 | 16.4% |
| $150,000 to $199,999 | 127 | 3.6% |
| $200,000+ | 91 | 2.6% |
Family Income by Famaliy Size in Frankfort
5-person families (310 | 8.8%) account for the highest median family income in Frankfort with $98,750 per family, while 2-person families (1,655 | 47.1%) have the highest median income of $26,603 per family member.

| Income Bracket | # Families | Median Income |
| 2-Person Families | 1,655 (47.1%) | $53,206 |
| 3-Person Families | 759 (21.6%) | $73,079 |
| 4-Person Families | 613 (17.4%) | $60,766 |
| 5-Person Families | 310 (8.8%) | $98,750 |
| 6-Person Families | 150 (4.3%) | $98,750 |
| 7+ Person Families | 27 (0.8%) | $75,139 |
| Total | 3,514 (100.0%) | $61,983 |
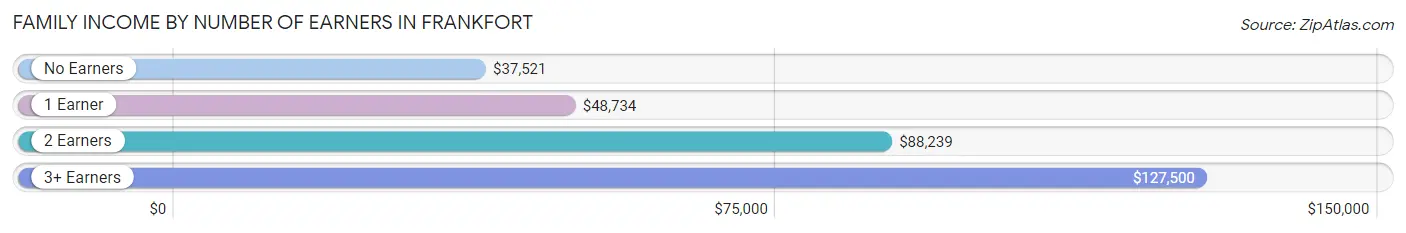
Family Income by Number of Earners in Frankfort
The median family income in Frankfort is $61,983, with families comprising 3+ earners (460) having the highest median family income of $127,500, while families with no earners (493) have the lowest median family income of $37,521, accounting for 13.1% and 14.0% of families, respectively.
| Number of Earners | # Families | Median Income |
| No Earners | 493 (14.0%) | $37,521 |
| 1 Earner | 1,255 (35.7%) | $48,734 |
| 2 Earners | 1,306 (37.2%) | $88,239 |
| 3+ Earners | 460 (13.1%) | $127,500 |
| Total | 3,514 (100.0%) | $61,983 |
Household Income in Frankfort
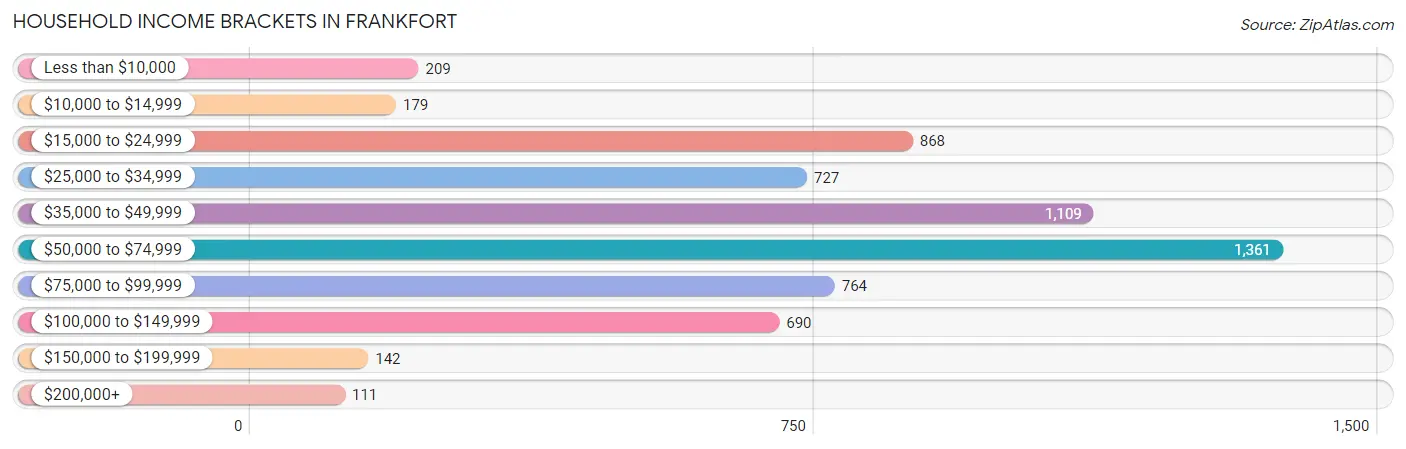
Household Income Brackets in Frankfort
With 1,361 households falling in the category, the $50,000 to $74,999 income range is the most frequent in Frankfort, accounting for 22.1% of all households. In contrast, only 111 households (1.8%) fall into the $200,000+ income bracket, making it the least populous group.
| Income Bracket | # Households | % Households |
| Less than $10,000 | 209 | 3.4% |
| $10,000 to $14,999 | 179 | 2.9% |
| $15,000 to $24,999 | 868 | 14.1% |
| $25,000 to $34,999 | 727 | 11.8% |
| $35,000 to $49,999 | 1,109 | 18.0% |
| $50,000 to $74,999 | 1,361 | 22.1% |
| $75,000 to $99,999 | 764 | 12.4% |
| $100,000 to $149,999 | 690 | 11.2% |
| $150,000 to $199,999 | 142 | 2.3% |
| $200,000+ | 111 | 1.8% |
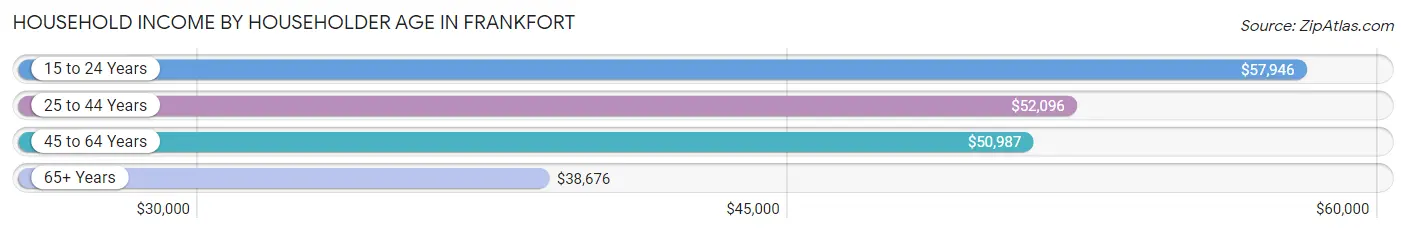
Household Income by Householder Age in Frankfort
The median household income in Frankfort is $49,821, with the highest median household income of $57,946 found in the 15 to 24 years age bracket for the primary householder. A total of 306 households (5.0%) fall into this category. Meanwhile, the 65+ years age bracket for the primary householder has the lowest median household income of $38,676, with 1,493 households (24.2%) in this group.
| Income Bracket | # Households | Median Income |
| 15 to 24 Years | 306 (5.0%) | $57,946 |
| 25 to 44 Years | 1,988 (32.3%) | $52,096 |
| 45 to 64 Years | 2,372 (38.5%) | $50,987 |
| 65+ Years | 1,493 (24.2%) | $38,676 |
| Total | 6,159 (100.0%) | $49,821 |
Poverty in Frankfort
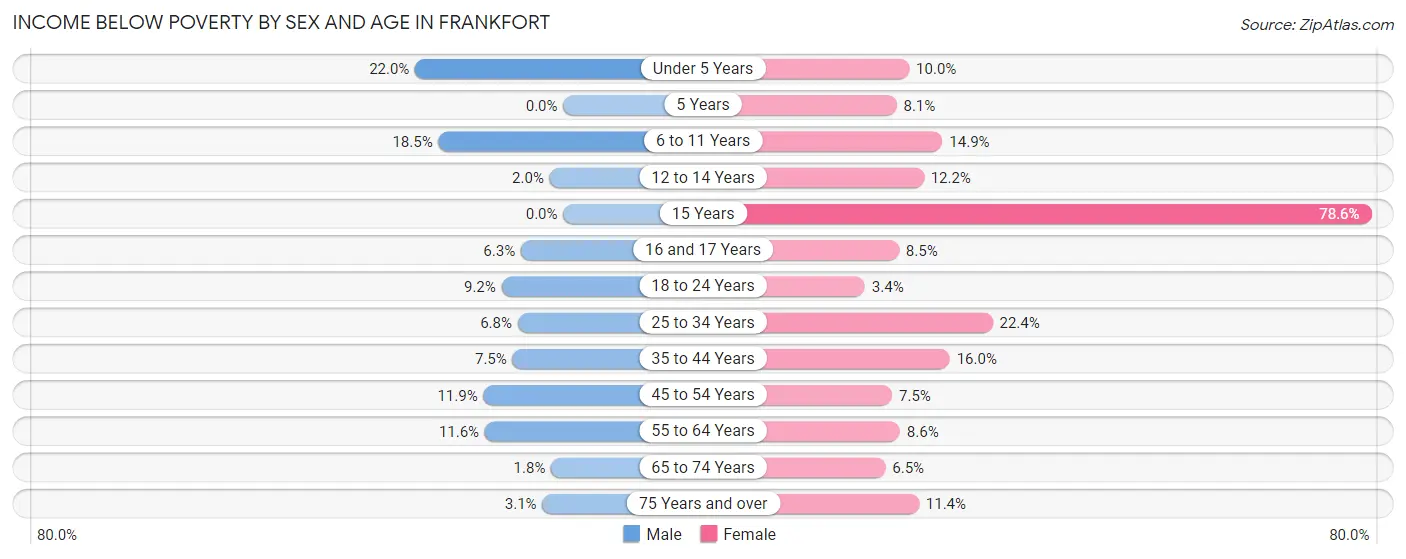
Income Below Poverty by Sex and Age in Frankfort
With 9.4% poverty level for males and 12.6% for females among the residents of Frankfort, under 5 year old males and 15 year old females are the most vulnerable to poverty, with 90 males (22.0%) and 103 females (78.6%) in their respective age groups living below the poverty level.
| Age Bracket | Male | Female |
| Under 5 Years | 90 (22.0%) | 45 (10.0%) |
| 5 Years | 0 (0.0%) | 17 (8.1%) |
| 6 to 11 Years | 140 (18.5%) | 105 (14.9%) |
| 12 to 14 Years | 8 (2.0%) | 36 (12.2%) |
| 15 Years | 0 (0.0%) | 103 (78.6%) |
| 16 and 17 Years | 20 (6.3%) | 19 (8.5%) |
| 18 to 24 Years | 65 (9.2%) | 26 (3.4%) |
| 25 to 34 Years | 70 (6.8%) | 218 (22.4%) |
| 35 to 44 Years | 82 (7.5%) | 142 (16.0%) |
| 45 to 54 Years | 108 (11.9%) | 57 (7.5%) |
| 55 to 64 Years | 128 (11.6%) | 90 (8.6%) |
| 65 to 74 Years | 10 (1.8%) | 41 (6.5%) |
| 75 Years and over | 10 (3.1%) | 77 (11.4%) |
| Total | 731 (9.4%) | 976 (12.6%) |
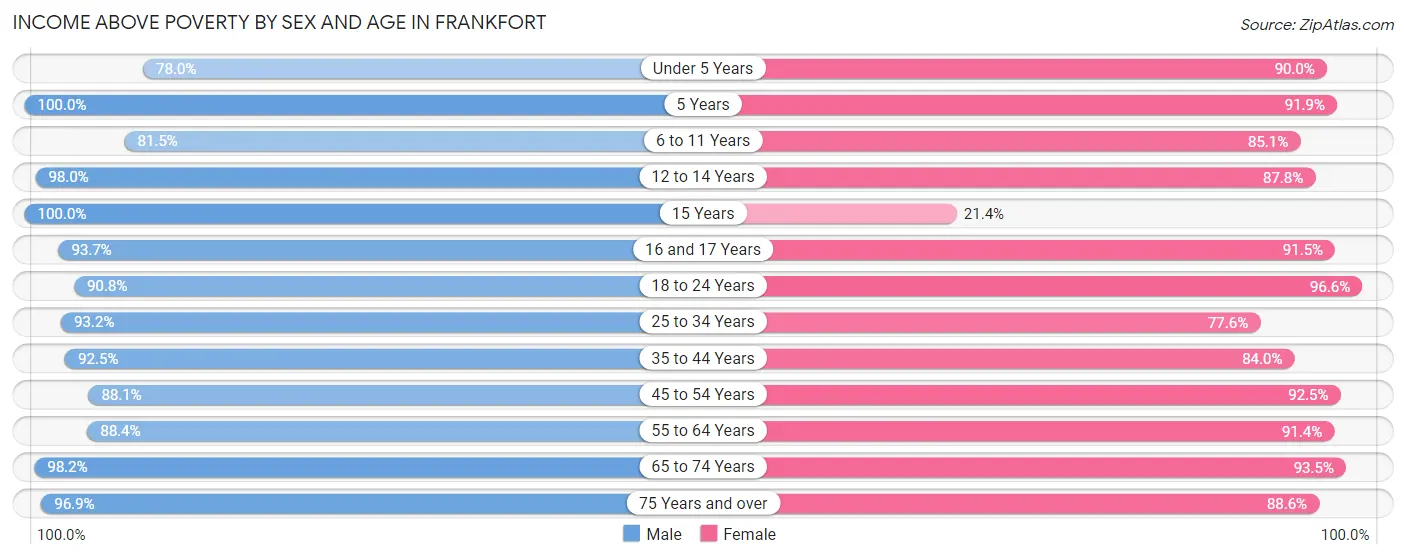
Income Above Poverty by Sex and Age in Frankfort
According to the poverty statistics in Frankfort, males aged 5 years and females aged 18 to 24 years are the age groups that are most secure financially, with 100.0% of males and 96.6% of females in these age groups living above the poverty line.
| Age Bracket | Male | Female |
| Under 5 Years | 319 (78.0%) | 405 (90.0%) |
| 5 Years | 27 (100.0%) | 192 (91.9%) |
| 6 to 11 Years | 615 (81.5%) | 598 (85.1%) |
| 12 to 14 Years | 389 (98.0%) | 260 (87.8%) |
| 15 Years | 127 (100.0%) | 28 (21.4%) |
| 16 and 17 Years | 298 (93.7%) | 205 (91.5%) |
| 18 to 24 Years | 644 (90.8%) | 731 (96.6%) |
| 25 to 34 Years | 965 (93.2%) | 756 (77.6%) |
| 35 to 44 Years | 1,007 (92.5%) | 744 (84.0%) |
| 45 to 54 Years | 803 (88.1%) | 706 (92.5%) |
| 55 to 64 Years | 972 (88.4%) | 953 (91.4%) |
| 65 to 74 Years | 547 (98.2%) | 593 (93.5%) |
| 75 Years and over | 312 (96.9%) | 596 (88.6%) |
| Total | 7,025 (90.6%) | 6,767 (87.4%) |
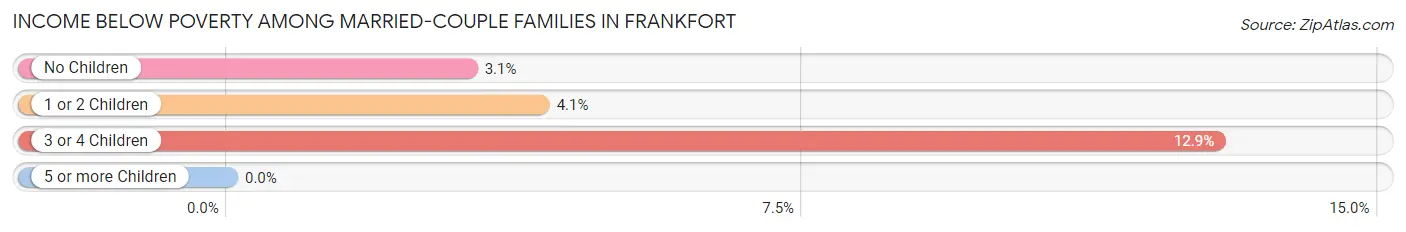
Income Below Poverty Among Married-Couple Families in Frankfort
The poverty statistics for married-couple families in Frankfort show that 4.5% or 107 of the total 2,383 families live below the poverty line. Families with 3 or 4 children have the highest poverty rate of 12.9%, comprising of 32 families. On the other hand, families with 5 or more children have the lowest poverty rate of 0.0%, which includes 0 families.
| Children | Above Poverty | Below Poverty |
| No Children | 1,206 (96.9%) | 39 (3.1%) |
| 1 or 2 Children | 848 (95.9%) | 36 (4.1%) |
| 3 or 4 Children | 216 (87.1%) | 32 (12.9%) |
| 5 or more Children | 6 (100.0%) | 0 (0.0%) |
| Total | 2,276 (95.5%) | 107 (4.5%) |
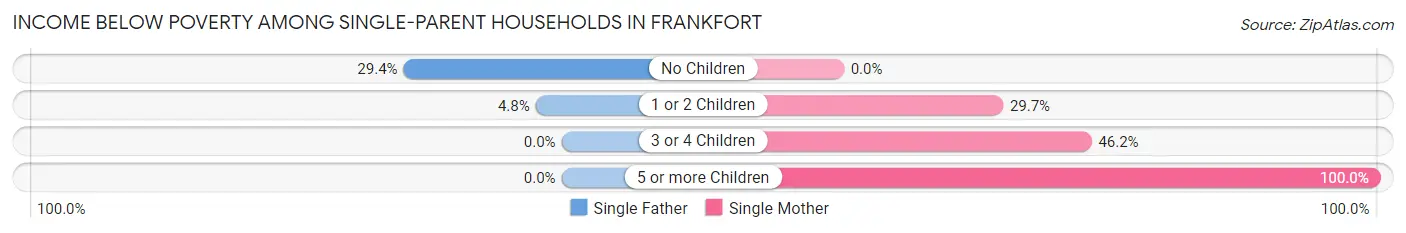
Income Below Poverty Among Single-Parent Households in Frankfort
According to the poverty data in Frankfort, 15.5% or 68 single-father households and 18.5% or 128 single-mother households are living below the poverty line. Among single-father households, those with no children have the highest poverty rate, with 58 households (29.4%) experiencing poverty. Likewise, among single-mother households, those with 5 or more children have the highest poverty rate, with 7 households (100.0%) falling below the poverty line.
| Children | Single Father | Single Mother |
| No Children | 58 (29.4%) | 0 (0.0%) |
| 1 or 2 Children | 10 (4.8%) | 73 (29.7%) |
| 3 or 4 Children | 0 (0.0%) | 48 (46.2%) |
| 5 or more Children | 0 (0.0%) | 7 (100.0%) |
| Total | 68 (15.5%) | 128 (18.5%) |
Income Below Poverty Among Married-Couple vs Single-Parent Households in Frankfort
The poverty data for Frankfort shows that 107 of the married-couple family households (4.5%) and 196 of the single-parent households (17.3%) are living below the poverty level. Within the married-couple family households, those with 3 or 4 children have the highest poverty rate, with 32 households (12.9%) falling below the poverty line. Among the single-parent households, those with 5 or more children have the highest poverty rate, with 7 household (100.0%) living below poverty.
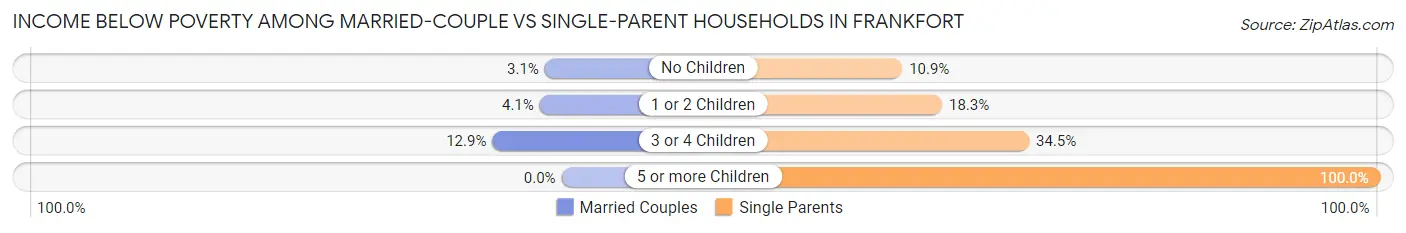
| Children | Married-Couple Families | Single-Parent Households |
| No Children | 39 (3.1%) | 58 (10.9%) |
| 1 or 2 Children | 36 (4.1%) | 83 (18.3%) |
| 3 or 4 Children | 32 (12.9%) | 48 (34.5%) |
| 5 or more Children | 0 (0.0%) | 7 (100.0%) |
| Total | 107 (4.5%) | 196 (17.3%) |
Race in Frankfort
The most populous races in Frankfort are White / Caucasian (12,105 | 75.8%), Hispanic or Latino (4,572 | 28.6%), and Two or more Races (1,957 | 12.2%).
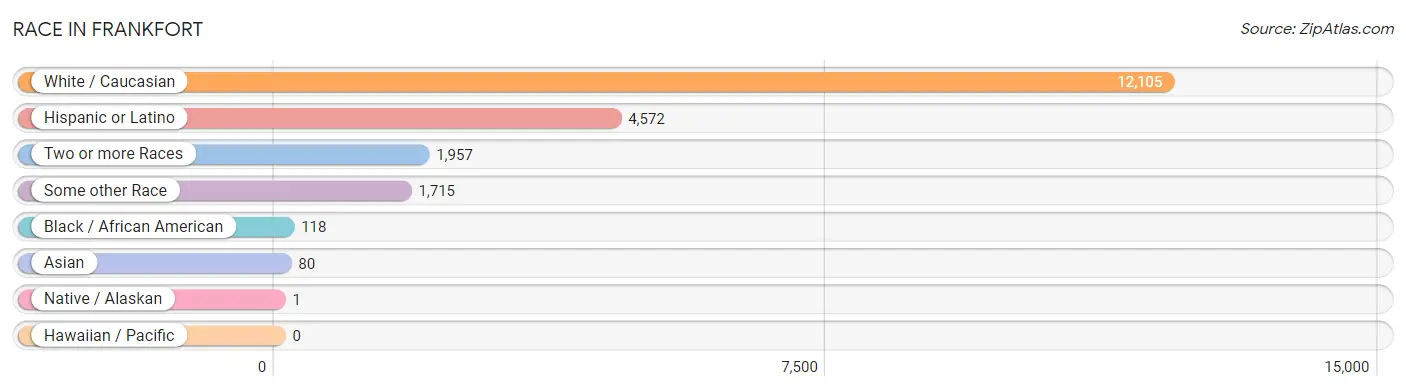
| Race | # Population | % Population |
| Asian | 80 | 0.5% |
| Black / African American | 118 | 0.7% |
| Hawaiian / Pacific | 0 | 0.0% |
| Hispanic or Latino | 4,572 | 28.6% |
| Native / Alaskan | 1 | 0.0% |
| White / Caucasian | 12,105 | 75.8% |
| Two or more Races | 1,957 | 12.2% |
| Some other Race | 1,715 | 10.7% |
| Total | 15,976 | 100.0% |
Ancestry in Frankfort
The most populous ancestries reported in Frankfort are Mexican (4,392 | 27.5%), German (1,900 | 11.9%), American (1,395 | 8.7%), English (1,149 | 7.2%), and Irish (667 | 4.2%), together accounting for 59.5% of all Frankfort residents.
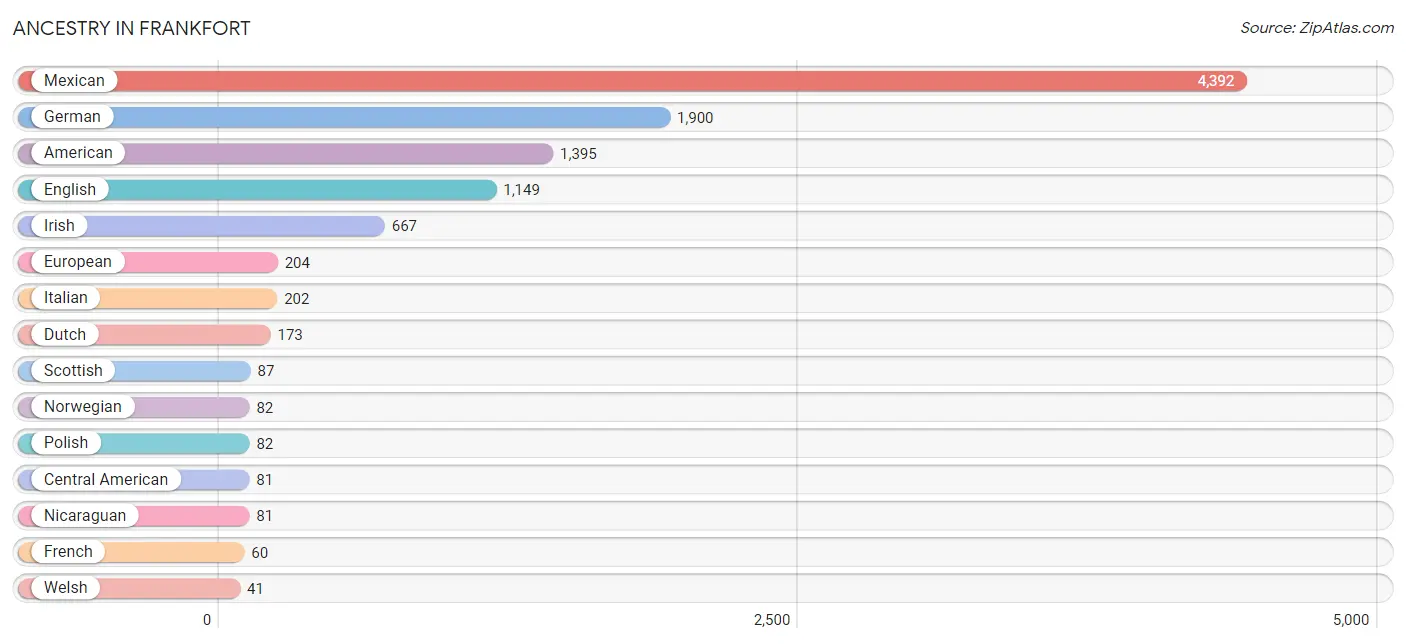
| Ancestry | # Population | % Population |
| American | 1,395 | 8.7% |
| Apache | 1 | 0.0% |
| Austrian | 19 | 0.1% |
| Bhutanese | 3 | 0.0% |
| British | 27 | 0.2% |
| Burmese | 1 | 0.0% |
| Central American | 81 | 0.5% |
| Cherokee | 23 | 0.1% |
| Chippewa | 1 | 0.0% |
| Dominican | 30 | 0.2% |
| Dutch | 173 | 1.1% |
| English | 1,149 | 7.2% |
| European | 204 | 1.3% |
| French | 60 | 0.4% |
| German | 1,900 | 11.9% |
| Greek | 34 | 0.2% |
| Hungarian | 30 | 0.2% |
| Irish | 667 | 4.2% |
| Italian | 202 | 1.3% |
| Mexican | 4,392 | 27.5% |
| Nicaraguan | 81 | 0.5% |
| Northern European | 22 | 0.1% |
| Norwegian | 82 | 0.5% |
| Pennsylvania German | 11 | 0.1% |
| Polish | 82 | 0.5% |
| Puerto Rican | 18 | 0.1% |
| Russian | 11 | 0.1% |
| Scotch-Irish | 32 | 0.2% |
| Scottish | 87 | 0.5% |
| Sri Lankan | 11 | 0.1% |
| Swedish | 35 | 0.2% |
| Swiss | 3 | 0.0% |
| Welsh | 41 | 0.3% | View All 33 Rows |
Immigrants in Frankfort
The most numerous immigrant groups reported in Frankfort came from Latin America (2,080 | 13.0%), Central America (2,072 | 13.0%), Mexico (1,894 | 11.9%), Asia (81 | 0.5%), and Nicaragua (81 | 0.5%), together accounting for 38.9% of all Frankfort residents.
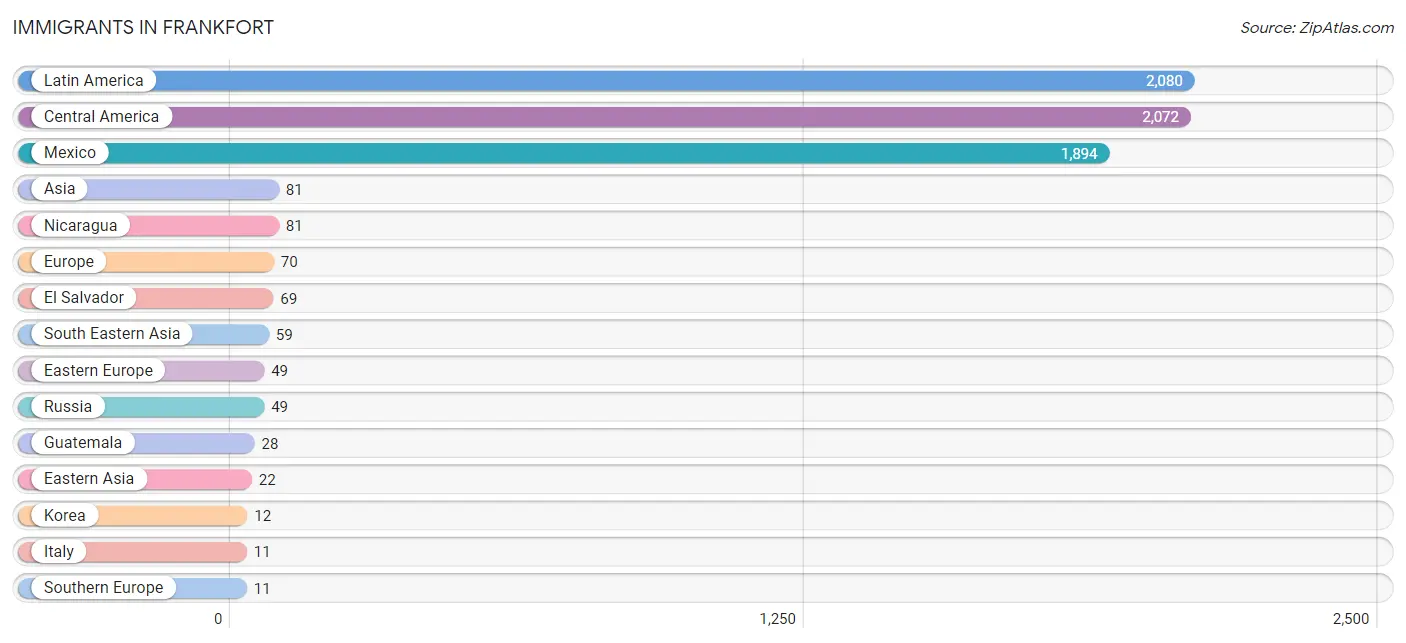
| Immigration Origin | # Population | % Population |
| Asia | 81 | 0.5% |
| Caribbean | 8 | 0.1% |
| Central America | 2,072 | 13.0% |
| Dominican Republic | 8 | 0.1% |
| Eastern Asia | 22 | 0.1% |
| Eastern Europe | 49 | 0.3% |
| El Salvador | 69 | 0.4% |
| Europe | 70 | 0.4% |
| Germany | 10 | 0.1% |
| Guatemala | 28 | 0.2% |
| Italy | 11 | 0.1% |
| Japan | 10 | 0.1% |
| Korea | 12 | 0.1% |
| Latin America | 2,080 | 13.0% |
| Mexico | 1,894 | 11.9% |
| Nicaragua | 81 | 0.5% |
| Russia | 49 | 0.3% |
| South Eastern Asia | 59 | 0.4% |
| Southern Europe | 11 | 0.1% |
| Western Europe | 10 | 0.1% | View All 20 Rows |
Sex and Age in Frankfort
Sex and Age in Frankfort
The most populous age groups in Frankfort are 5 to 9 Years (646 | 8.1%) for men and 5 to 9 Years (723 | 9.0%) for women.
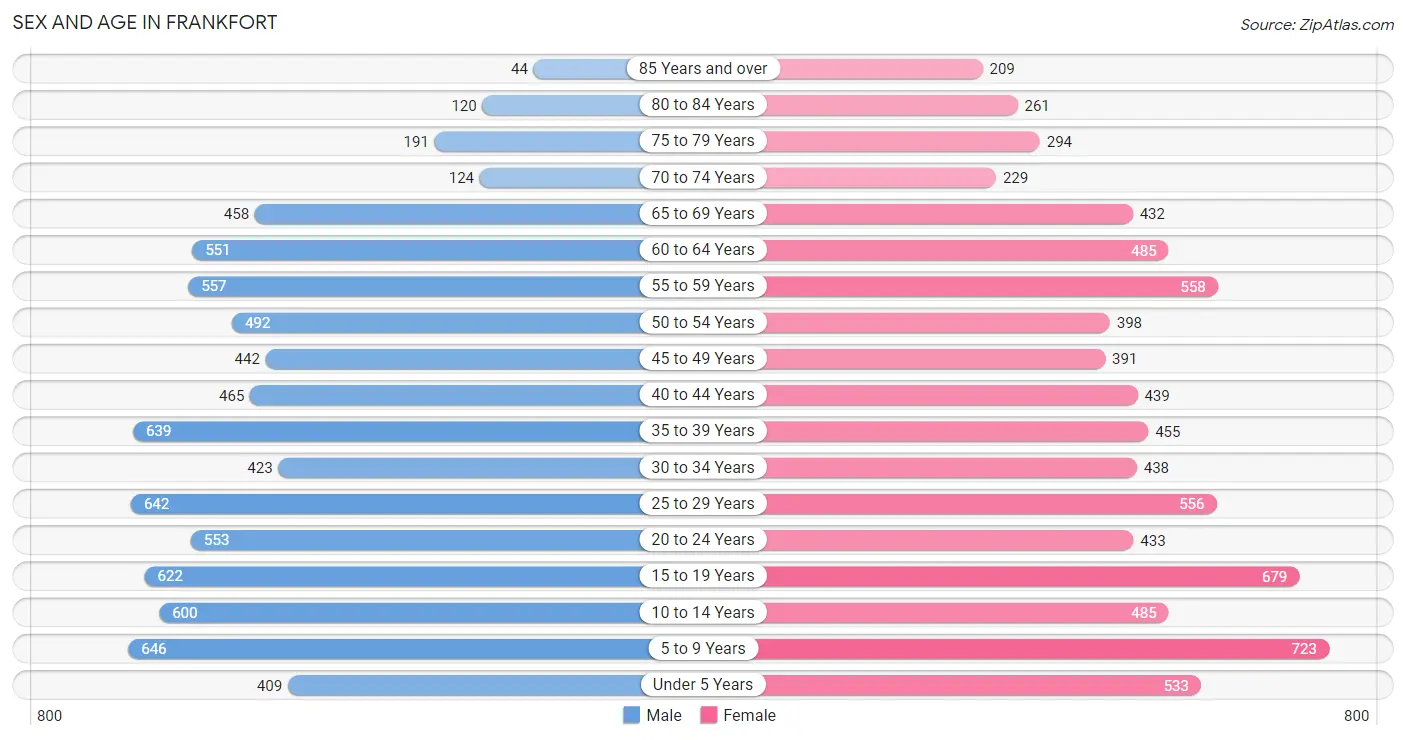
| Age Bracket | Male | Female |
| Under 5 Years | 409 (5.1%) | 533 (6.7%) |
| 5 to 9 Years | 646 (8.1%) | 723 (9.0%) |
| 10 to 14 Years | 600 (7.5%) | 485 (6.1%) |
| 15 to 19 Years | 622 (7.8%) | 679 (8.5%) |
| 20 to 24 Years | 553 (6.9%) | 433 (5.4%) |
| 25 to 29 Years | 642 (8.1%) | 556 (7.0%) |
| 30 to 34 Years | 423 (5.3%) | 438 (5.5%) |
| 35 to 39 Years | 639 (8.0%) | 455 (5.7%) |
| 40 to 44 Years | 465 (5.8%) | 439 (5.5%) |
| 45 to 49 Years | 442 (5.5%) | 391 (4.9%) |
| 50 to 54 Years | 492 (6.2%) | 398 (5.0%) |
| 55 to 59 Years | 557 (7.0%) | 558 (7.0%) |
| 60 to 64 Years | 551 (6.9%) | 485 (6.1%) |
| 65 to 69 Years | 458 (5.7%) | 432 (5.4%) |
| 70 to 74 Years | 124 (1.5%) | 229 (2.9%) |
| 75 to 79 Years | 191 (2.4%) | 294 (3.7%) |
| 80 to 84 Years | 120 (1.5%) | 261 (3.3%) |
| 85 Years and over | 44 (0.5%) | 209 (2.6%) |
| Total | 7,978 (100.0%) | 7,998 (100.0%) |
Families and Households in Frankfort
Median Family Size in Frankfort
The median family size in Frankfort is 3.40 persons per family, with married-couple families (2,383 | 67.8%) accounting for the largest median family size of 3.51 persons per family. On the other hand, single male/father families (439 | 12.5%) represent the smallest median family size with 3.08 persons per family.
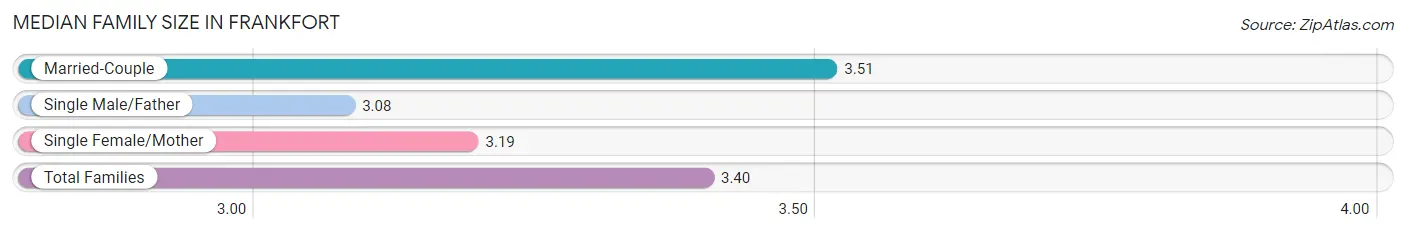
| Family Type | # Families | Family Size |
| Married-Couple | 2,383 (67.8%) | 3.51 |
| Single Male/Father | 439 (12.5%) | 3.08 |
| Single Female/Mother | 692 (19.7%) | 3.19 |
| Total Families | 3,514 (100.0%) | 3.40 |
Median Household Size in Frankfort
The median household size in Frankfort is 2.54 persons per household, with married-couple households (2,383 | 38.7%) accounting for the largest median household size of 3.6 persons per household. non-family households (2,645 | 42.9%) represent the smallest median household size with 1.21 persons per household.
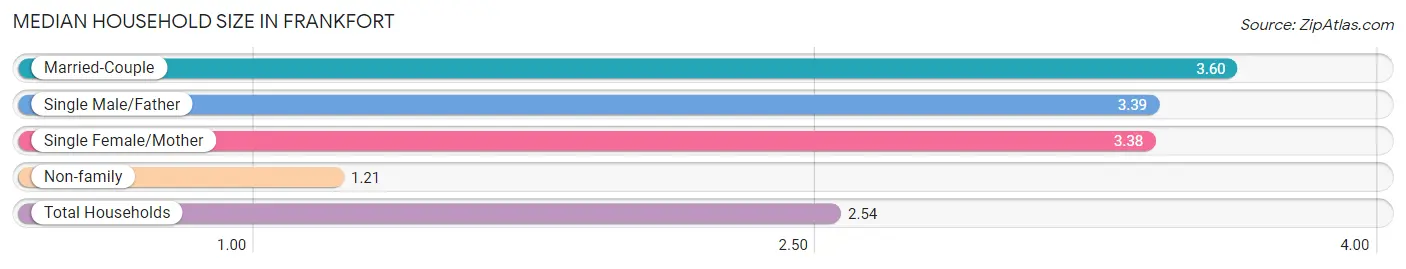
| Household Type | # Households | Household Size |
| Married-Couple | 2,383 (38.7%) | 3.60 |
| Single Male/Father | 439 (7.1%) | 3.39 |
| Single Female/Mother | 692 (11.2%) | 3.38 |
| Non-family | 2,645 (42.9%) | 1.21 |
| Total Households | 6,159 (100.0%) | 2.54 |
Household Size by Marriage Status in Frankfort
Out of a total of 6,159 households in Frankfort, 3,514 (57.1%) are family households, while 2,645 (42.9%) are nonfamily households. The most numerous type of family households are 2-person households, comprising 1,595, and the most common type of nonfamily households are 1-person households, comprising 2,259.
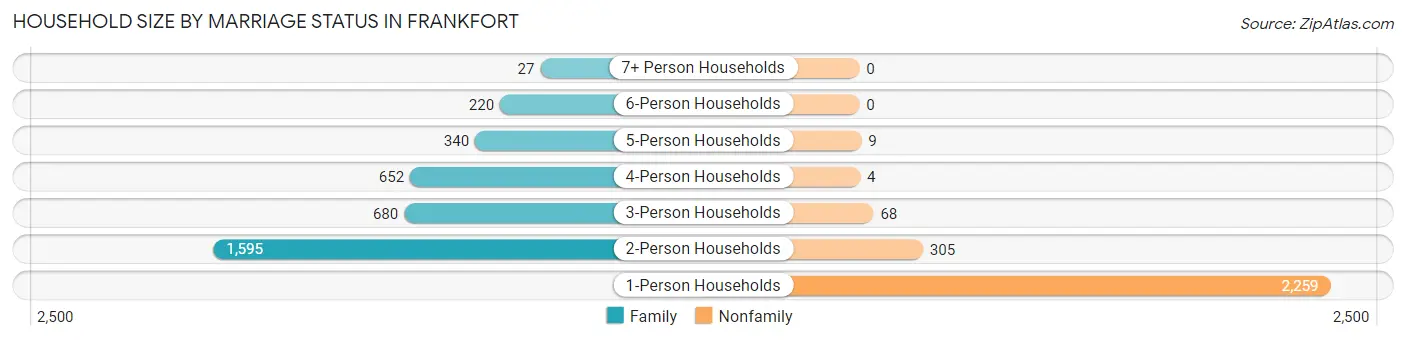
| Household Size | Family Households | Nonfamily Households |
| 1-Person Households | - | 2,259 (36.7%) |
| 2-Person Households | 1,595 (25.9%) | 305 (5.0%) |
| 3-Person Households | 680 (11.0%) | 68 (1.1%) |
| 4-Person Households | 652 (10.6%) | 4 (0.1%) |
| 5-Person Households | 340 (5.5%) | 9 (0.2%) |
| 6-Person Households | 220 (3.6%) | 0 (0.0%) |
| 7+ Person Households | 27 (0.4%) | 0 (0.0%) |
| Total | 3,514 (57.1%) | 2,645 (42.9%) |
Female Fertility in Frankfort
Fertility by Age in Frankfort
Average fertility rate in Frankfort is 43.0 births per 1,000 women. Women in the age bracket of 20 to 34 years have the highest fertility rate with 101.0 births per 1,000 women. Women in the age bracket of 20 to 34 years acount for 96.0% of all women with births.
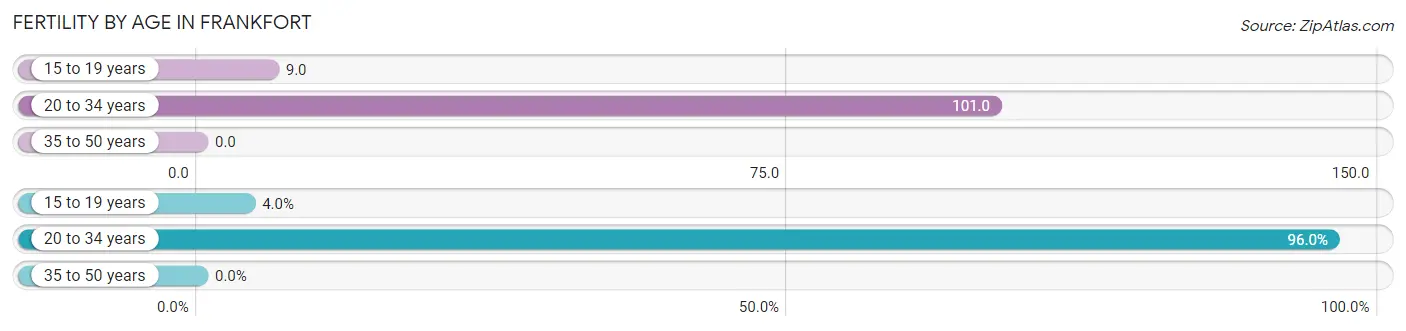
| Age Bracket | Women with Births | Births / 1,000 Women |
| 15 to 19 years | 6 (4.0%) | 9.0 |
| 20 to 34 years | 144 (96.0%) | 101.0 |
| 35 to 50 years | 0 (0.0%) | 0.0 |
| Total | 150 (100.0%) | 43.0 |
Fertility by Age by Marriage Status in Frankfort
60.0% of women with births (150) in Frankfort are married. The highest percentage of unmarried women with births falls into 15 to 19 years age bracket with 100.0% of them unmarried at the time of birth, while the lowest percentage of unmarried women with births belong to 20 to 34 years age bracket with 37.5% of them unmarried.
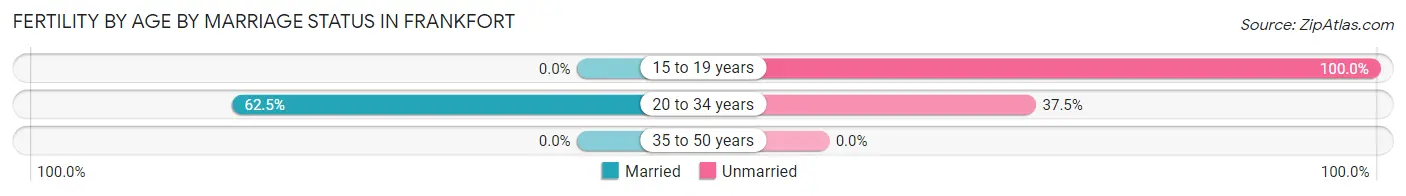
| Age Bracket | Married | Unmarried |
| 15 to 19 years | 0 (0.0%) | 6 (100.0%) |
| 20 to 34 years | 90 (62.5%) | 54 (37.5%) |
| 35 to 50 years | 0 (0.0%) | 0 (0.0%) |
| Total | 90 (60.0%) | 60 (40.0%) |
Fertility by Education in Frankfort
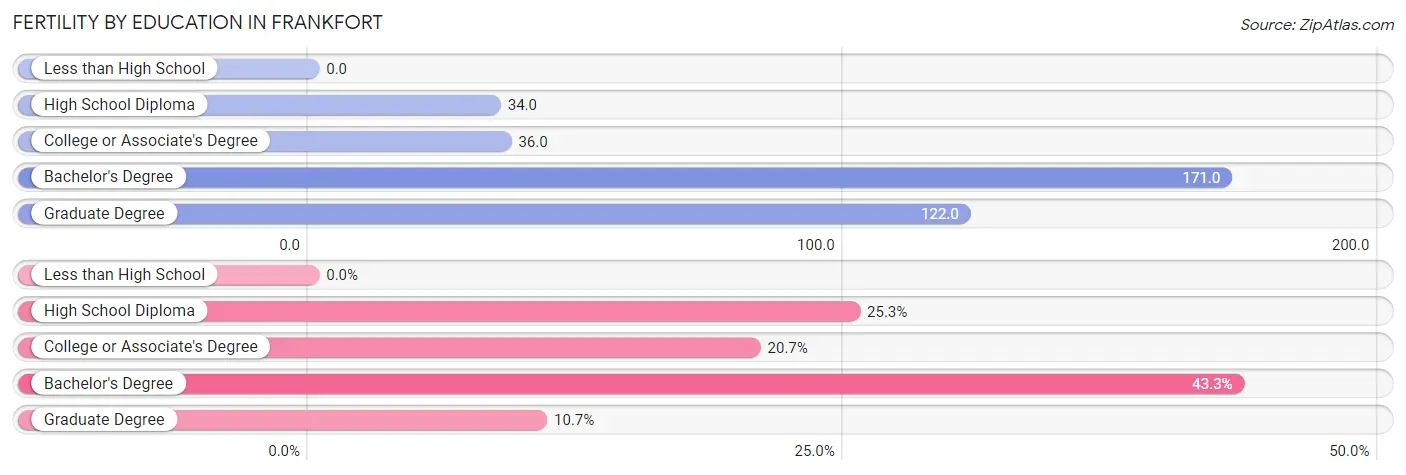
| Educational Attainment | Women with Births | Births / 1,000 Women |
| Less than High School | 0 (0.0%) | 0.0 |
| High School Diploma | 38 (25.3%) | 34.0 |
| College or Associate's Degree | 31 (20.7%) | 36.0 |
| Bachelor's Degree | 65 (43.3%) | 171.0 |
| Graduate Degree | 16 (10.7%) | 122.0 |
| Total | 150 (100.0%) | 43.0 |
Fertility by Education by Marriage Status in Frankfort
40.0% of women with births in Frankfort are unmarried. Women with the educational attainment of graduate degree are most likely to be married with 100.0% of them married at childbirth, while women with the educational attainment of college or associate's degree are least likely to be married with 83.9% of them unmarried at childbirth.
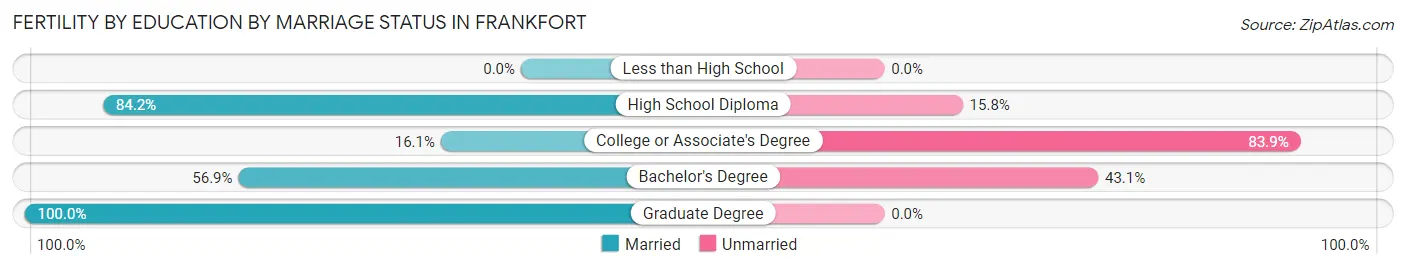
| Educational Attainment | Married | Unmarried |
| Less than High School | 0 (0.0%) | 0 (0.0%) |
| High School Diploma | 32 (84.2%) | 6 (15.8%) |
| College or Associate's Degree | 5 (16.1%) | 26 (83.9%) |
| Bachelor's Degree | 37 (56.9%) | 28 (43.1%) |
| Graduate Degree | 16 (100.0%) | 0 (0.0%) |
| Total | 90 (60.0%) | 60 (40.0%) |
Employment Characteristics in Frankfort
Employment by Class of Employer in Frankfort
Among the 7,337 employed individuals in Frankfort, private company employees (6,082 | 82.9%), self-employed (not incorporated) (369 | 5.0%), and local government employees (365 | 5.0%) make up the most common classes of employment.
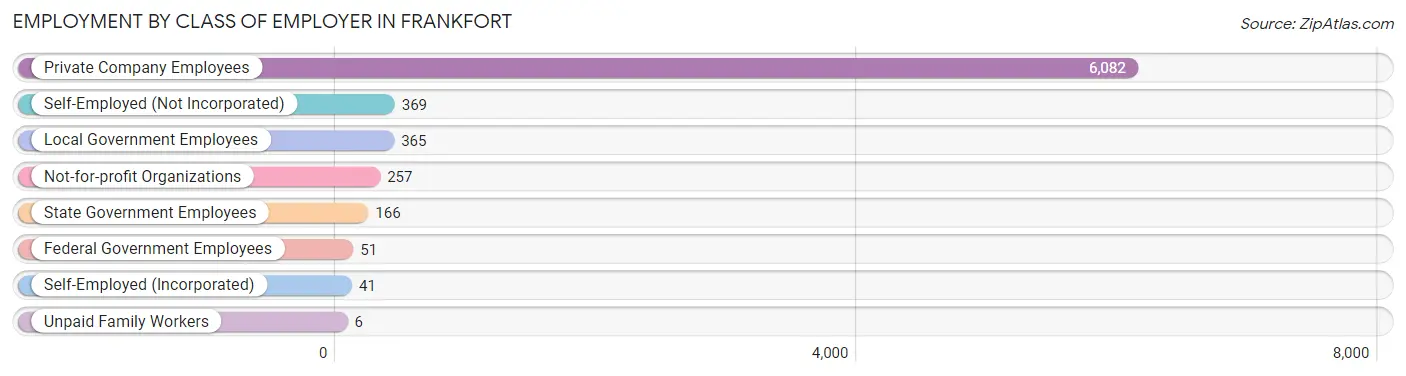
| Employer Class | # Employees | % Employees |
| Private Company Employees | 6,082 | 82.9% |
| Self-Employed (Incorporated) | 41 | 0.6% |
| Self-Employed (Not Incorporated) | 369 | 5.0% |
| Not-for-profit Organizations | 257 | 3.5% |
| Local Government Employees | 365 | 5.0% |
| State Government Employees | 166 | 2.3% |
| Federal Government Employees | 51 | 0.7% |
| Unpaid Family Workers | 6 | 0.1% |
| Total | 7,337 | 100.0% |
Employment Status by Age in Frankfort
According to the labor force statistics for Frankfort, out of the total population over 16 years of age (12,322), 62.9% or 7,751 individuals are in the labor force, with 4.4% or 341 of them unemployed. The age group with the highest labor force participation rate is 20 to 24 years, with 89.4% or 881 individuals in the labor force. Within the labor force, the 20 to 24 years age range has the highest percentage of unemployed individuals, with 11.6% or 102 of them being unemployed.
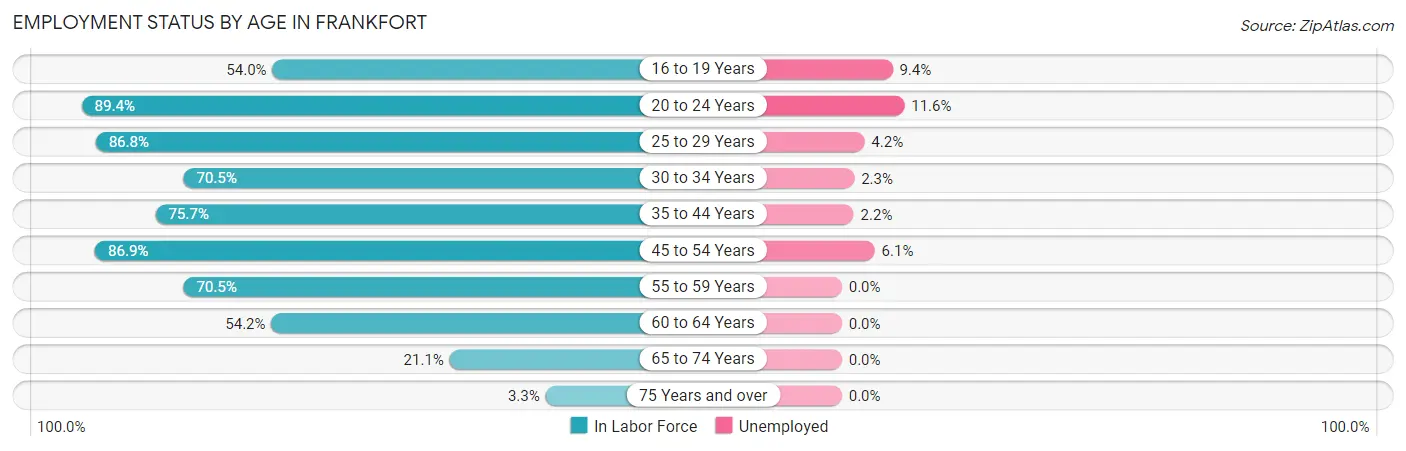
| Age Bracket | In Labor Force | Unemployed |
| 16 to 19 Years | 563 (54.0%) | 53 (9.4%) |
| 20 to 24 Years | 881 (89.4%) | 102 (11.6%) |
| 25 to 29 Years | 1,040 (86.8%) | 44 (4.2%) |
| 30 to 34 Years | 607 (70.5%) | 14 (2.3%) |
| 35 to 44 Years | 1,512 (75.7%) | 33 (2.2%) |
| 45 to 54 Years | 1,497 (86.9%) | 91 (6.1%) |
| 55 to 59 Years | 786 (70.5%) | 0 (0.0%) |
| 60 to 64 Years | 562 (54.2%) | 0 (0.0%) |
| 65 to 74 Years | 262 (21.1%) | 0 (0.0%) |
| 75 Years and over | 37 (3.3%) | 0 (0.0%) |
| Total | 7,751 (62.9%) | 341 (4.4%) |
Employment Status by Educational Attainment in Frankfort
According to labor force statistics for Frankfort, 75.7% of individuals (6,004) out of the total population between 25 and 64 years of age (7,931) are in the labor force, with 3.0% or 180 of them being unemployed. The group with the highest labor force participation rate are those with the educational attainment of college / associate degree, with 86.6% or 1,712 individuals in the labor force. Within the labor force, individuals with less than high school education have the highest percentage of unemployment, with 5.7% or 61 of them being unemployed.
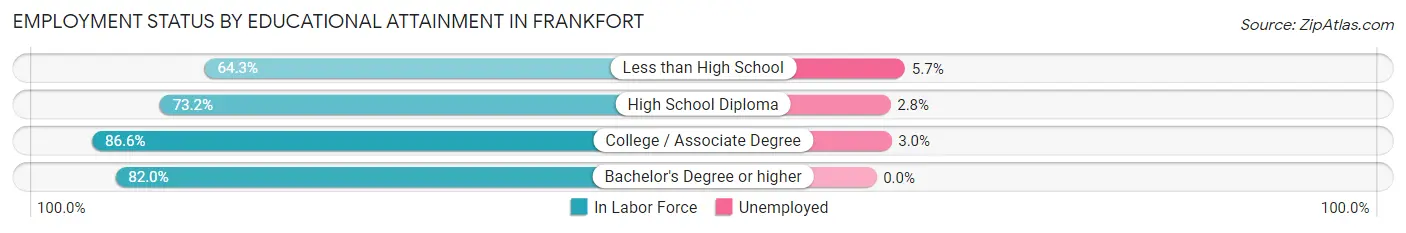
| Educational Attainment | In Labor Force | Unemployed |
| Less than High School | 1,062 (64.3%) | 94 (5.7%) |
| High School Diploma | 2,468 (73.2%) | 94 (2.8%) |
| College / Associate Degree | 1,712 (86.6%) | 59 (3.0%) |
| Bachelor's Degree or higher | 763 (82.0%) | 0 (0.0%) |
| Total | 6,004 (75.7%) | 238 (3.0%) |
Employment Occupations by Sex in Frankfort
Management, Business, Science and Arts Occupations
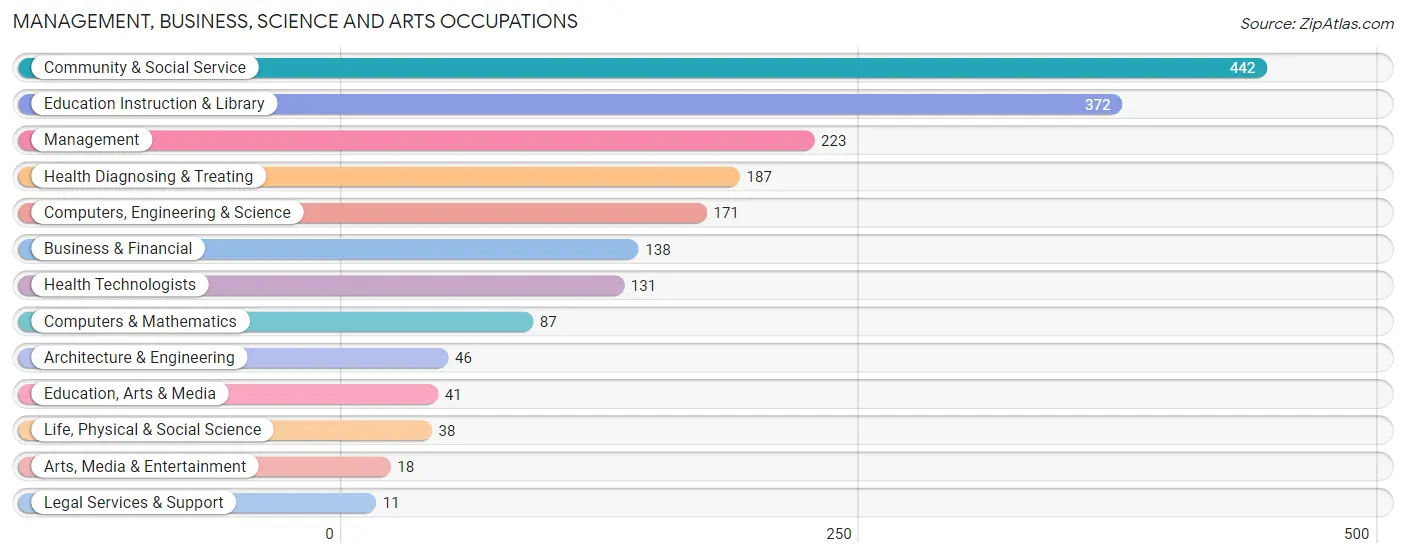
The most common Management, Business, Science and Arts occupations in Frankfort are Community & Social Service (442 | 6.0%), Education Instruction & Library (372 | 5.0%), Management (223 | 3.0%), Health Diagnosing & Treating (187 | 2.5%), and Computers, Engineering & Science (171 | 2.3%).
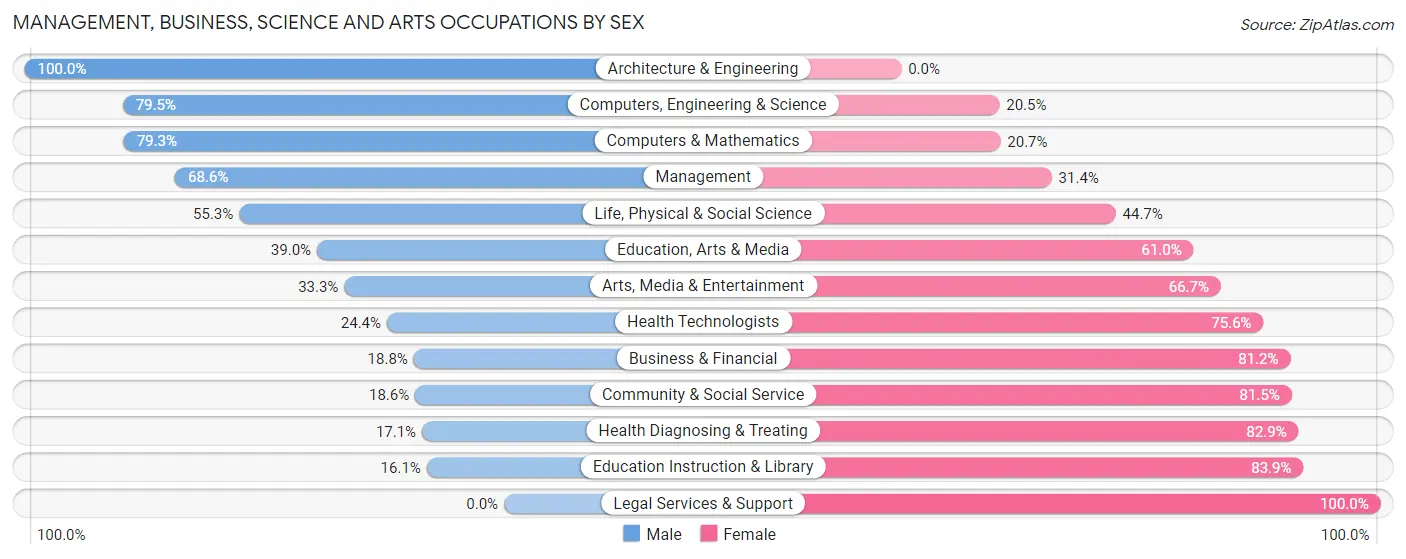
Management, Business, Science and Arts Occupations by Sex
Within the Management, Business, Science and Arts occupations in Frankfort, the most male-oriented occupations are Architecture & Engineering (100.0%), Computers, Engineering & Science (79.5%), and Computers & Mathematics (79.3%), while the most female-oriented occupations are Legal Services & Support (100.0%), Education Instruction & Library (83.9%), and Health Diagnosing & Treating (82.9%).
| Occupation | Male | Female |
| Management | 153 (68.6%) | 70 (31.4%) |
| Business & Financial | 26 (18.8%) | 112 (81.2%) |
| Computers, Engineering & Science | 136 (79.5%) | 35 (20.5%) |
| Computers & Mathematics | 69 (79.3%) | 18 (20.7%) |
| Architecture & Engineering | 46 (100.0%) | 0 (0.0%) |
| Life, Physical & Social Science | 21 (55.3%) | 17 (44.7%) |
| Community & Social Service | 82 (18.5%) | 360 (81.5%) |
| Education, Arts & Media | 16 (39.0%) | 25 (61.0%) |
| Legal Services & Support | 0 (0.0%) | 11 (100.0%) |
| Education Instruction & Library | 60 (16.1%) | 312 (83.9%) |
| Arts, Media & Entertainment | 6 (33.3%) | 12 (66.7%) |
| Health Diagnosing & Treating | 32 (17.1%) | 155 (82.9%) |
| Health Technologists | 32 (24.4%) | 99 (75.6%) |
| Total (Category) | 429 (36.9%) | 732 (63.0%) |
| Total (Overall) | 4,179 (56.5%) | 3,216 (43.5%) |
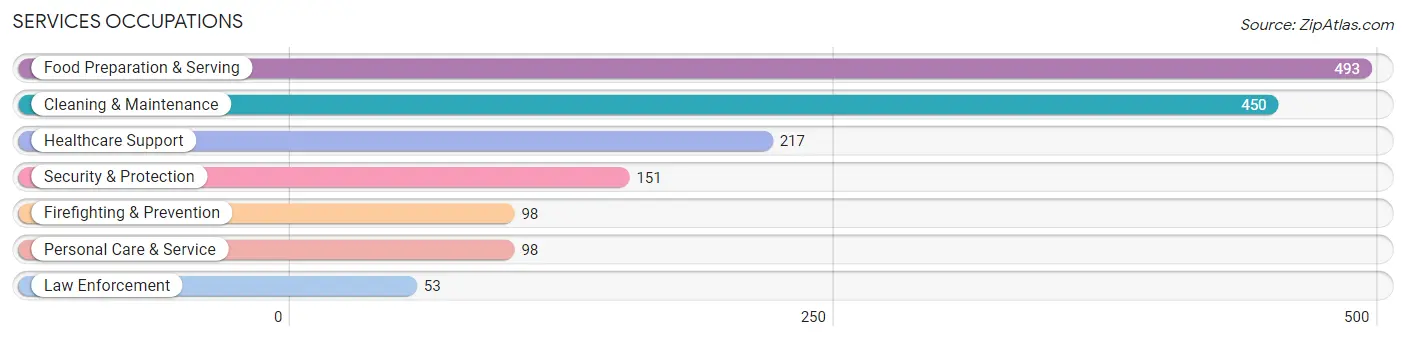
Services Occupations
The most common Services occupations in Frankfort are Food Preparation & Serving (493 | 6.7%), Cleaning & Maintenance (450 | 6.1%), Healthcare Support (217 | 2.9%), Security & Protection (151 | 2.0%), and Firefighting & Prevention (98 | 1.3%).
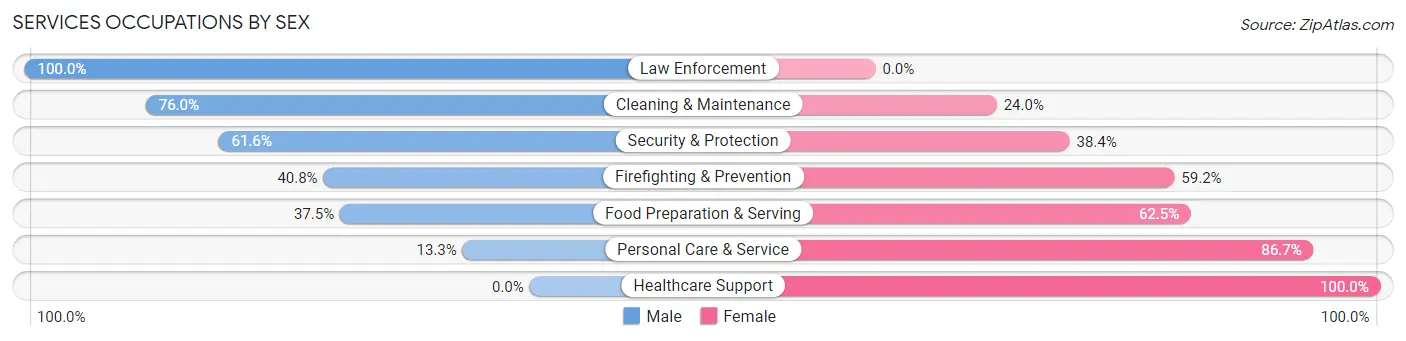
Services Occupations by Sex
Within the Services occupations in Frankfort, the most male-oriented occupations are Law Enforcement (100.0%), Cleaning & Maintenance (76.0%), and Security & Protection (61.6%), while the most female-oriented occupations are Healthcare Support (100.0%), Personal Care & Service (86.7%), and Food Preparation & Serving (62.5%).
| Occupation | Male | Female |
| Healthcare Support | 0 (0.0%) | 217 (100.0%) |
| Security & Protection | 93 (61.6%) | 58 (38.4%) |
| Firefighting & Prevention | 40 (40.8%) | 58 (59.2%) |
| Law Enforcement | 53 (100.0%) | 0 (0.0%) |
| Food Preparation & Serving | 185 (37.5%) | 308 (62.5%) |
| Cleaning & Maintenance | 342 (76.0%) | 108 (24.0%) |
| Personal Care & Service | 13 (13.3%) | 85 (86.7%) |
| Total (Category) | 633 (44.9%) | 776 (55.1%) |
| Total (Overall) | 4,179 (56.5%) | 3,216 (43.5%) |
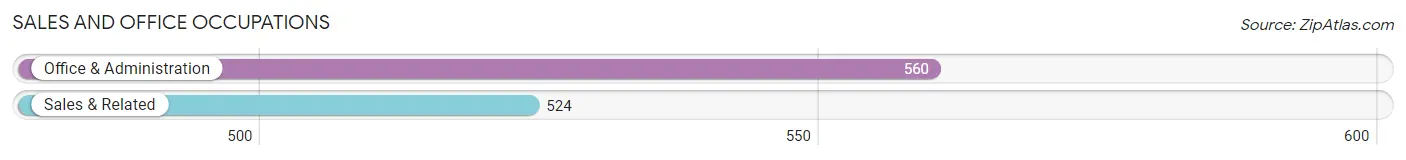
Sales and Office Occupations
The most common Sales and Office occupations in Frankfort are Office & Administration (560 | 7.6%), and Sales & Related (524 | 7.1%).
Sales and Office Occupations by Sex
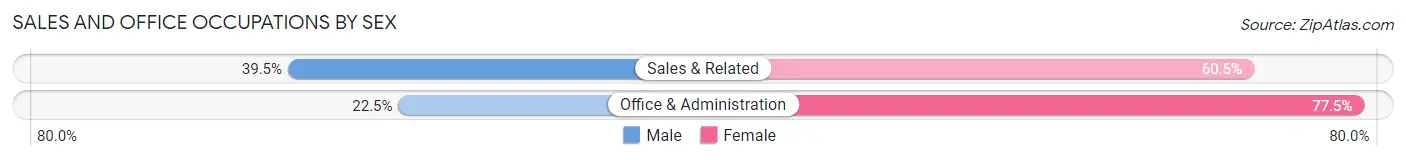
| Occupation | Male | Female |
| Sales & Related | 207 (39.5%) | 317 (60.5%) |
| Office & Administration | 126 (22.5%) | 434 (77.5%) |
| Total (Category) | 333 (30.7%) | 751 (69.3%) |
| Total (Overall) | 4,179 (56.5%) | 3,216 (43.5%) |
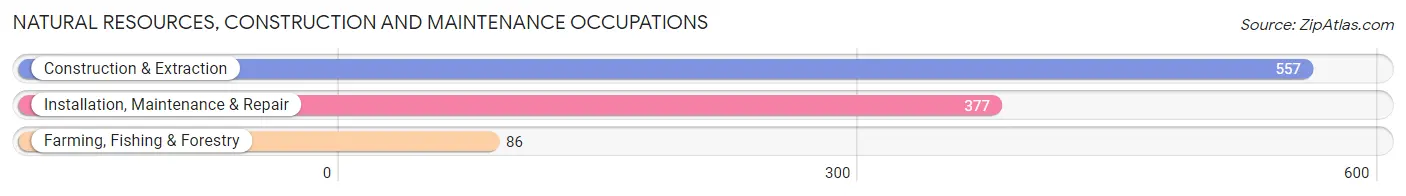
Natural Resources, Construction and Maintenance Occupations
The most common Natural Resources, Construction and Maintenance occupations in Frankfort are Construction & Extraction (557 | 7.5%), Installation, Maintenance & Repair (377 | 5.1%), and Farming, Fishing & Forestry (86 | 1.2%).
Natural Resources, Construction and Maintenance Occupations by Sex
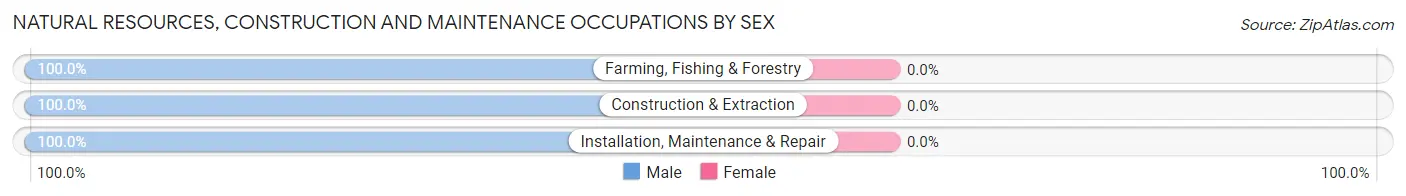
| Occupation | Male | Female |
| Farming, Fishing & Forestry | 86 (100.0%) | 0 (0.0%) |
| Construction & Extraction | 557 (100.0%) | 0 (0.0%) |
| Installation, Maintenance & Repair | 377 (100.0%) | 0 (0.0%) |
| Total (Category) | 1,020 (100.0%) | 0 (0.0%) |
| Total (Overall) | 4,179 (56.5%) | 3,216 (43.5%) |
Production, Transportation and Moving Occupations
The most common Production, Transportation and Moving occupations in Frankfort are Production (1,502 | 20.3%), Material Moving (914 | 12.4%), and Transportation (305 | 4.1%).
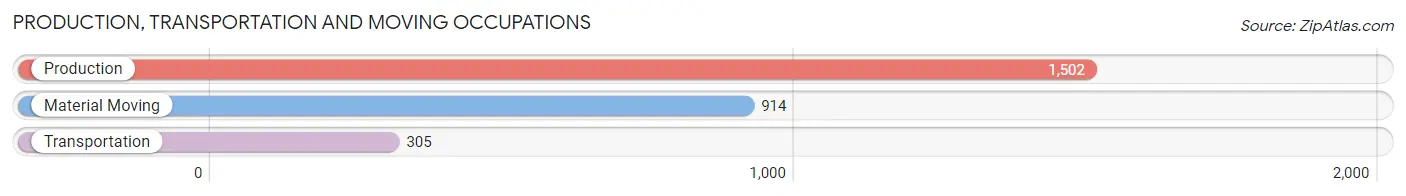
Production, Transportation and Moving Occupations by Sex
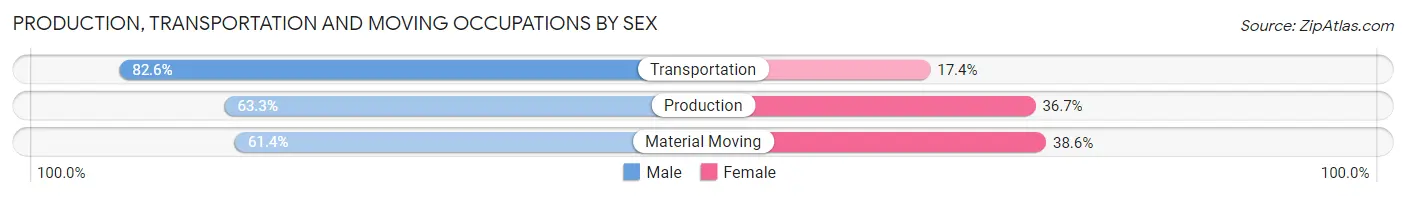
| Occupation | Male | Female |
| Production | 951 (63.3%) | 551 (36.7%) |
| Transportation | 252 (82.6%) | 53 (17.4%) |
| Material Moving | 561 (61.4%) | 353 (38.6%) |
| Total (Category) | 1,764 (64.8%) | 957 (35.2%) |
| Total (Overall) | 4,179 (56.5%) | 3,216 (43.5%) |
Employment Industries by Sex in Frankfort
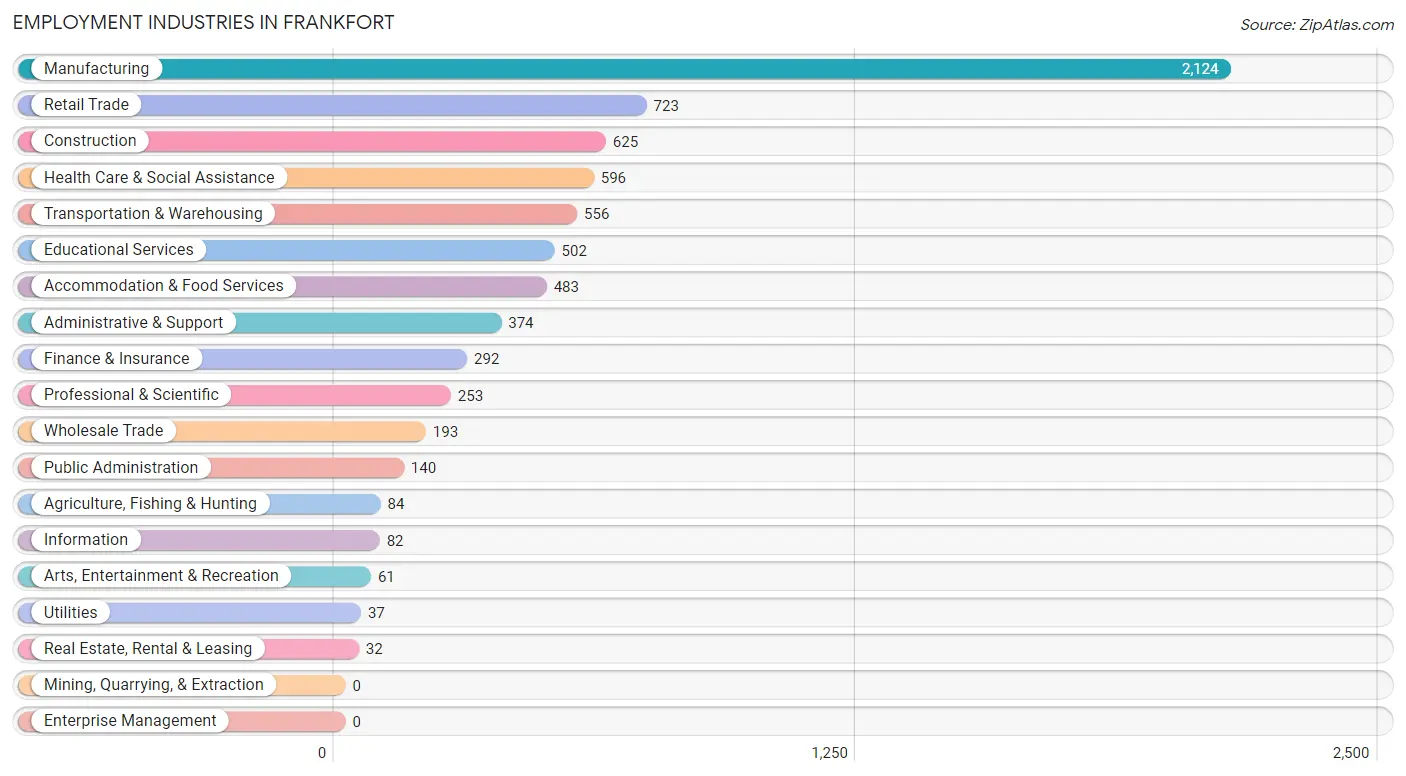
Employment Industries in Frankfort
The major employment industries in Frankfort include Manufacturing (2,124 | 28.7%), Retail Trade (723 | 9.8%), Construction (625 | 8.5%), Health Care & Social Assistance (596 | 8.1%), and Transportation & Warehousing (556 | 7.5%).
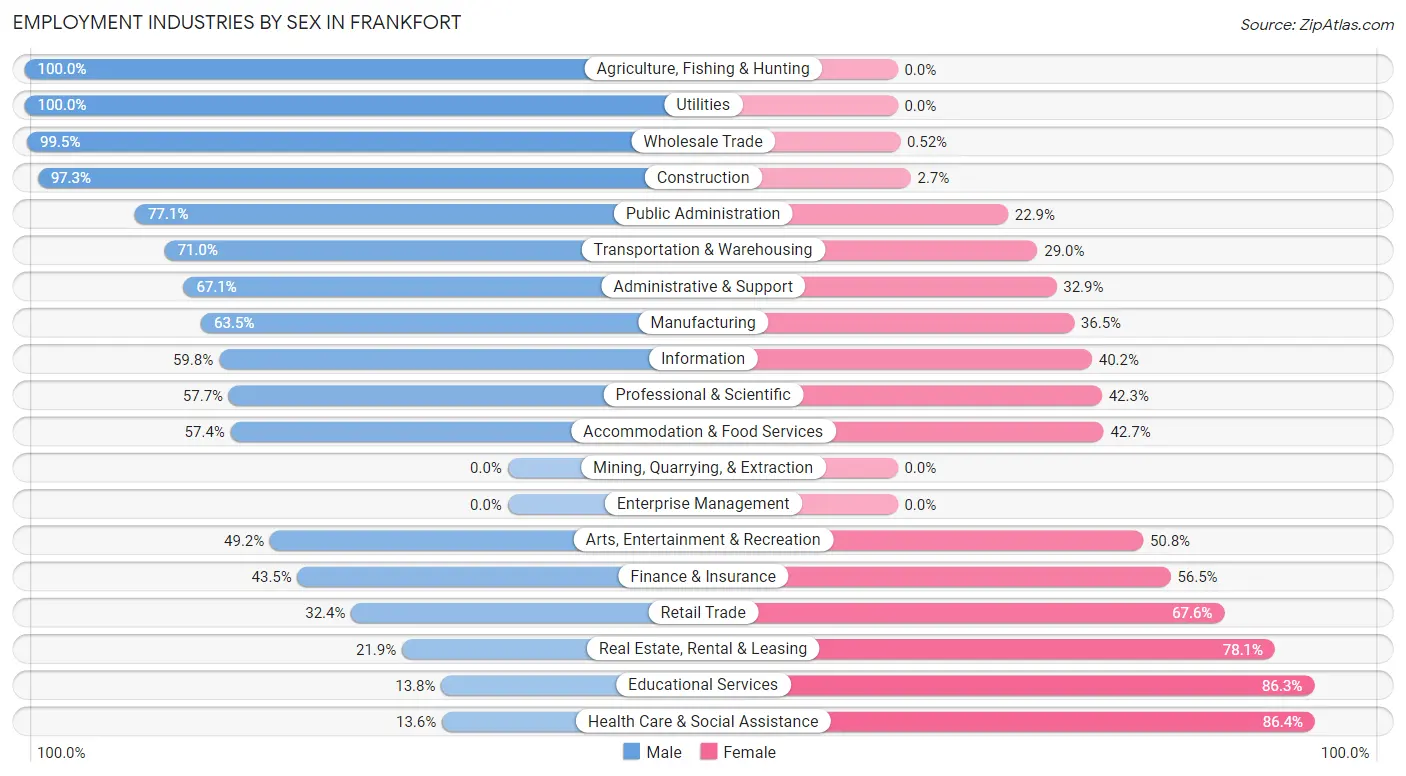
Employment Industries by Sex in Frankfort
The Frankfort industries that see more men than women are Agriculture, Fishing & Hunting (100.0%), Utilities (100.0%), and Wholesale Trade (99.5%), whereas the industries that tend to have a higher number of women are Health Care & Social Assistance (86.4%), Educational Services (86.3%), and Real Estate, Rental & Leasing (78.1%).
| Industry | Male | Female |
| Agriculture, Fishing & Hunting | 84 (100.0%) | 0 (0.0%) |
| Mining, Quarrying, & Extraction | 0 (0.0%) | 0 (0.0%) |
| Construction | 608 (97.3%) | 17 (2.7%) |
| Manufacturing | 1,348 (63.5%) | 776 (36.5%) |
| Wholesale Trade | 192 (99.5%) | 1 (0.5%) |
| Retail Trade | 234 (32.4%) | 489 (67.6%) |
| Transportation & Warehousing | 395 (71.0%) | 161 (29.0%) |
| Utilities | 37 (100.0%) | 0 (0.0%) |
| Information | 49 (59.8%) | 33 (40.2%) |
| Finance & Insurance | 127 (43.5%) | 165 (56.5%) |
| Real Estate, Rental & Leasing | 7 (21.9%) | 25 (78.1%) |
| Professional & Scientific | 146 (57.7%) | 107 (42.3%) |
| Enterprise Management | 0 (0.0%) | 0 (0.0%) |
| Administrative & Support | 251 (67.1%) | 123 (32.9%) |
| Educational Services | 69 (13.8%) | 433 (86.3%) |
| Health Care & Social Assistance | 81 (13.6%) | 515 (86.4%) |
| Arts, Entertainment & Recreation | 30 (49.2%) | 31 (50.8%) |
| Accommodation & Food Services | 277 (57.4%) | 206 (42.6%) |
| Public Administration | 108 (77.1%) | 32 (22.9%) |
| Total | 4,179 (56.5%) | 3,216 (43.5%) |
Education in Frankfort
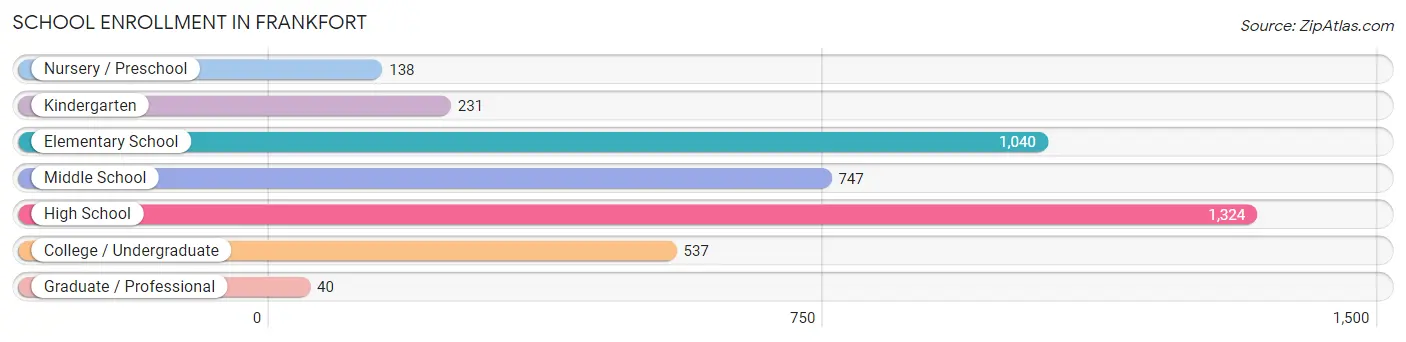
School Enrollment in Frankfort
The most common levels of schooling among the 4,057 students in Frankfort are high school (1,324 | 32.6%), elementary school (1,040 | 25.6%), and middle school (747 | 18.4%).
| School Level | # Students | % Students |
| Nursery / Preschool | 138 | 3.4% |
| Kindergarten | 231 | 5.7% |
| Elementary School | 1,040 | 25.6% |
| Middle School | 747 | 18.4% |
| High School | 1,324 | 32.6% |
| College / Undergraduate | 537 | 13.2% |
| Graduate / Professional | 40 | 1.0% |
| Total | 4,057 | 100.0% |
School Enrollment by Age by Funding Source in Frankfort
Out of a total of 4,057 students who are enrolled in schools in Frankfort, 337 (8.3%) attend a private institution, while the remaining 3,720 (91.7%) are enrolled in public schools. The age group of 3 to 4 year olds has the highest likelihood of being enrolled in private schools, with 40 (35.4% in the age bracket) enrolled. Conversely, the age group of 35 years and over has the lowest likelihood of being enrolled in a private school, with 64 (100.0% in the age bracket) attending a public institution.
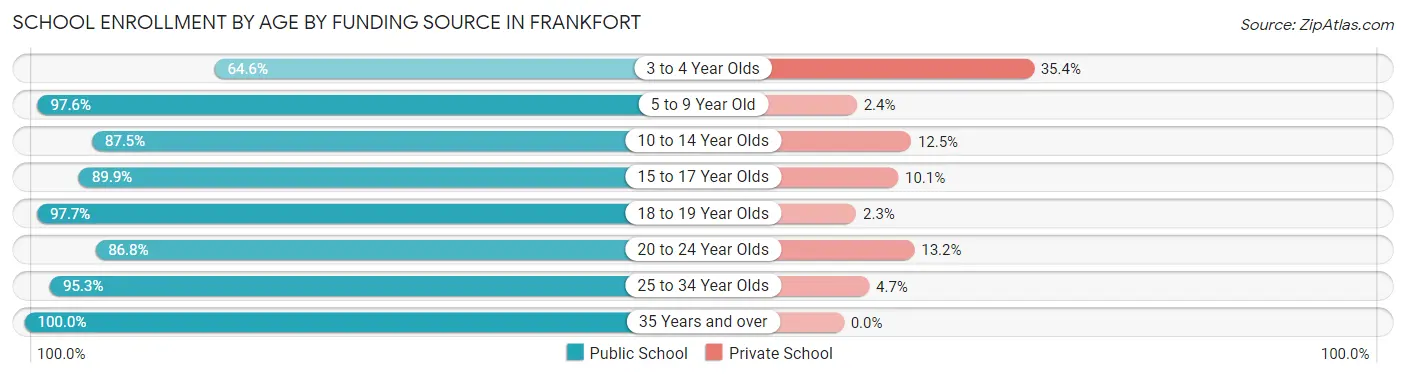
| Age Bracket | Public School | Private School |
| 3 to 4 Year Olds | 73 (64.6%) | 40 (35.4%) |
| 5 to 9 Year Old | 1,162 (97.6%) | 29 (2.4%) |
| 10 to 14 Year Olds | 949 (87.5%) | 136 (12.5%) |
| 15 to 17 Year Olds | 719 (89.9%) | 81 (10.1%) |
| 18 to 19 Year Olds | 381 (97.7%) | 9 (2.3%) |
| 20 to 24 Year Olds | 231 (86.8%) | 35 (13.2%) |
| 25 to 34 Year Olds | 141 (95.3%) | 7 (4.7%) |
| 35 Years and over | 64 (100.0%) | 0 (0.0%) |
| Total | 3,720 (91.7%) | 337 (8.3%) |
Educational Attainment by Field of Study in Frankfort
Education (395 | 29.6%), science & technology (243 | 18.2%), business (225 | 16.9%), psychology (105 | 7.9%), and visual & performing arts (64 | 4.8%) are the most common fields of study among 1,333 individuals in Frankfort who have obtained a bachelor's degree or higher.
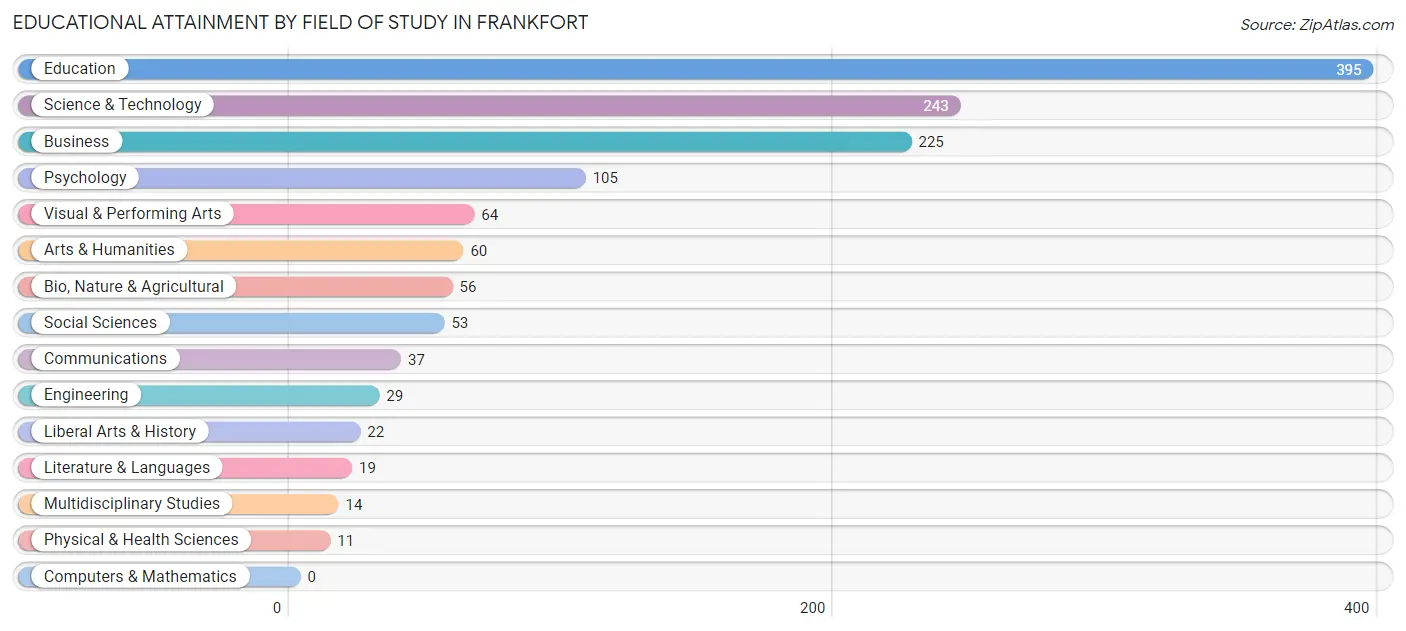
| Field of Study | # Graduates | % Graduates |
| Computers & Mathematics | 0 | 0.0% |
| Bio, Nature & Agricultural | 56 | 4.2% |
| Physical & Health Sciences | 11 | 0.8% |
| Psychology | 105 | 7.9% |
| Social Sciences | 53 | 4.0% |
| Engineering | 29 | 2.2% |
| Multidisciplinary Studies | 14 | 1.1% |
| Science & Technology | 243 | 18.2% |
| Business | 225 | 16.9% |
| Education | 395 | 29.6% |
| Literature & Languages | 19 | 1.4% |
| Liberal Arts & History | 22 | 1.7% |
| Visual & Performing Arts | 64 | 4.8% |
| Communications | 37 | 2.8% |
| Arts & Humanities | 60 | 4.5% |
| Total | 1,333 | 100.0% |
Transportation & Commute in Frankfort
Vehicle Availability by Sex in Frankfort
The most prevalent vehicle ownership categories in Frankfort are males with 2 vehicles (1,666, accounting for 40.2%) and females with 2 vehicles (1,067, making up 52.3%).
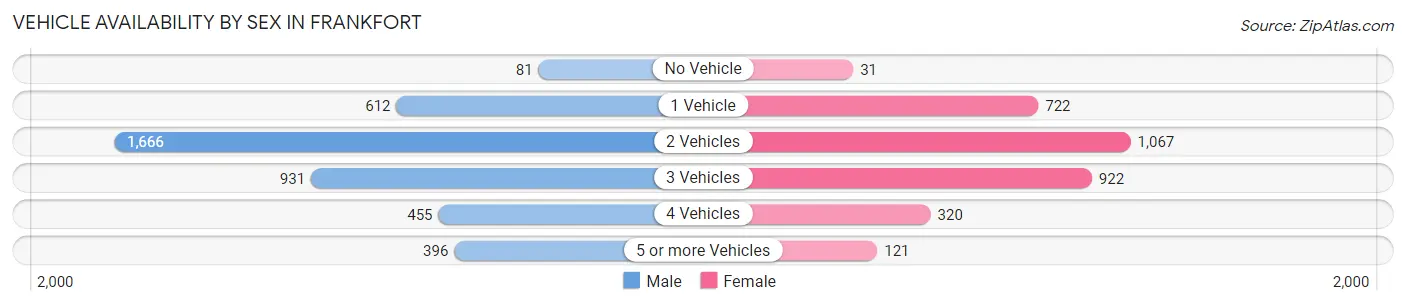
| Vehicles Available | Male | Female |
| No Vehicle | 81 (2.0%) | 31 (1.0%) |
| 1 Vehicle | 612 (14.8%) | 722 (22.7%) |
| 2 Vehicles | 1,666 (40.2%) | 1,067 (33.5%) |
| 3 Vehicles | 931 (22.5%) | 922 (29.0%) |
| 4 Vehicles | 455 (11.0%) | 320 (10.1%) |
| 5 or more Vehicles | 396 (9.6%) | 121 (3.8%) |
| Total | 4,141 (100.0%) | 3,183 (100.0%) |
Commute Time in Frankfort
The most frequently occuring commute durations in Frankfort are 10 to 14 minutes (1,684 commuters, 23.7%), 5 to 9 minutes (1,281 commuters, 18.0%), and 30 to 34 minutes (1,058 commuters, 14.9%).
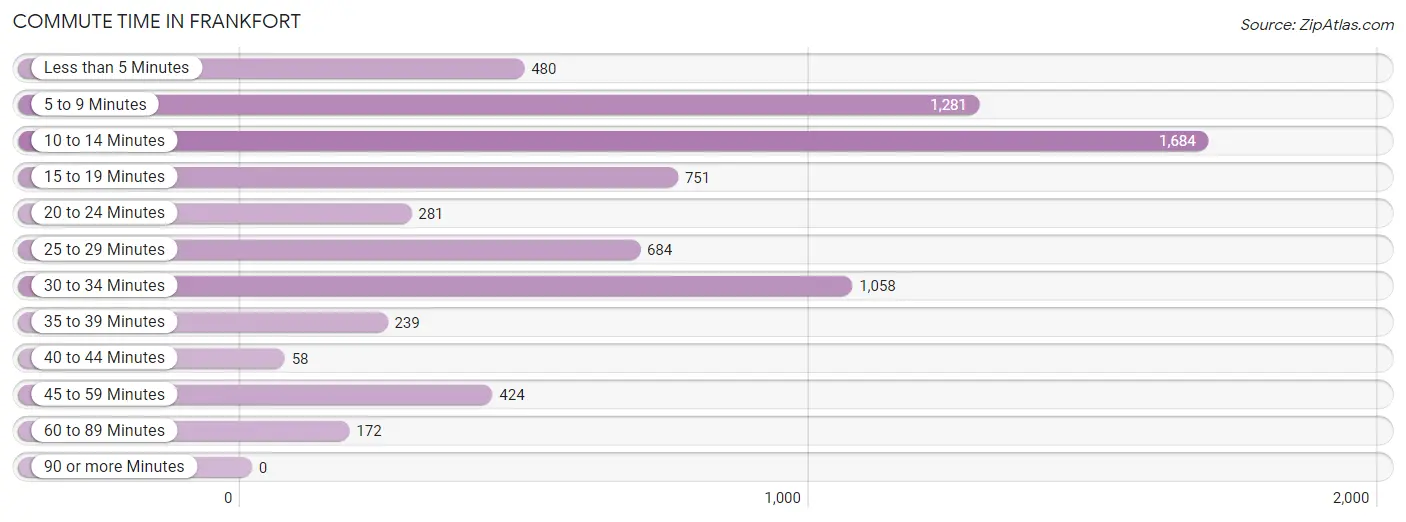
| Commute Time | # Commuters | % Commuters |
| Less than 5 Minutes | 480 | 6.8% |
| 5 to 9 Minutes | 1,281 | 18.0% |
| 10 to 14 Minutes | 1,684 | 23.7% |
| 15 to 19 Minutes | 751 | 10.6% |
| 20 to 24 Minutes | 281 | 4.0% |
| 25 to 29 Minutes | 684 | 9.6% |
| 30 to 34 Minutes | 1,058 | 14.9% |
| 35 to 39 Minutes | 239 | 3.4% |
| 40 to 44 Minutes | 58 | 0.8% |
| 45 to 59 Minutes | 424 | 6.0% |
| 60 to 89 Minutes | 172 | 2.4% |
| 90 or more Minutes | 0 | 0.0% |
Commute Time by Sex in Frankfort
The most common commute times in Frankfort are 10 to 14 minutes (830 commuters, 20.7%) for males and 10 to 14 minutes (854 commuters, 27.5%) for females.
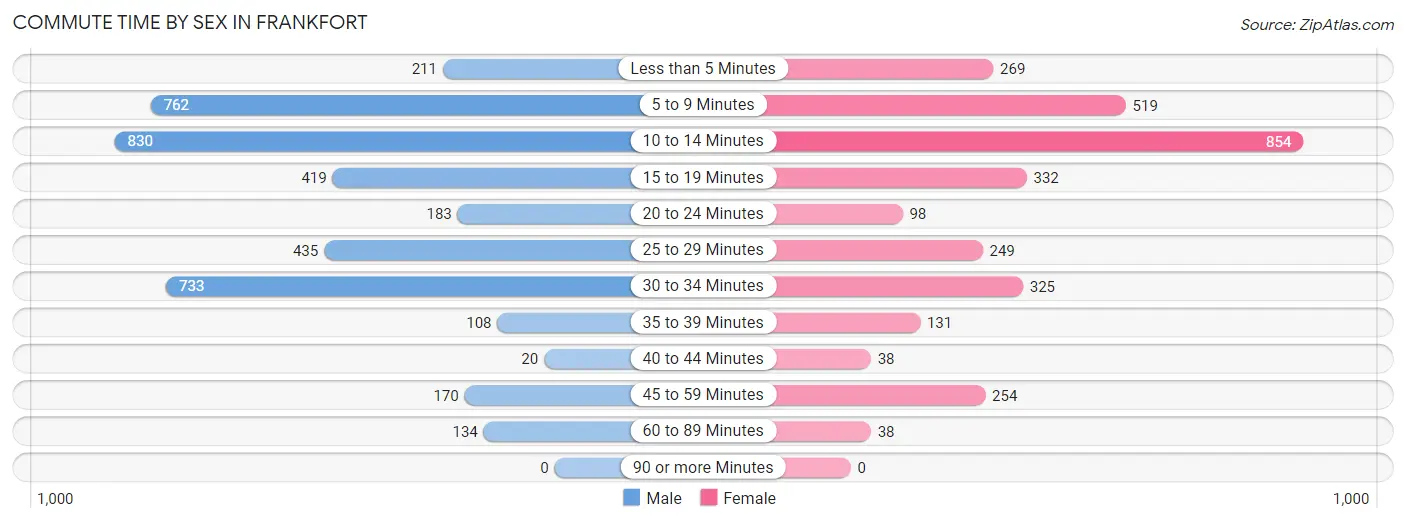
| Commute Time | Male | Female |
| Less than 5 Minutes | 211 (5.3%) | 269 (8.7%) |
| 5 to 9 Minutes | 762 (19.0%) | 519 (16.7%) |
| 10 to 14 Minutes | 830 (20.7%) | 854 (27.5%) |
| 15 to 19 Minutes | 419 (10.5%) | 332 (10.7%) |
| 20 to 24 Minutes | 183 (4.6%) | 98 (3.2%) |
| 25 to 29 Minutes | 435 (10.9%) | 249 (8.0%) |
| 30 to 34 Minutes | 733 (18.3%) | 325 (10.5%) |
| 35 to 39 Minutes | 108 (2.7%) | 131 (4.2%) |
| 40 to 44 Minutes | 20 (0.5%) | 38 (1.2%) |
| 45 to 59 Minutes | 170 (4.2%) | 254 (8.2%) |
| 60 to 89 Minutes | 134 (3.4%) | 38 (1.2%) |
| 90 or more Minutes | 0 (0.0%) | 0 (0.0%) |
Time of Departure to Work by Sex in Frankfort
The most frequent times of departure to work in Frankfort are 4:00 PM to 11:59 PM (647, 16.2%) for males and 7:30 AM to 7:59 AM (424, 13.7%) for females.
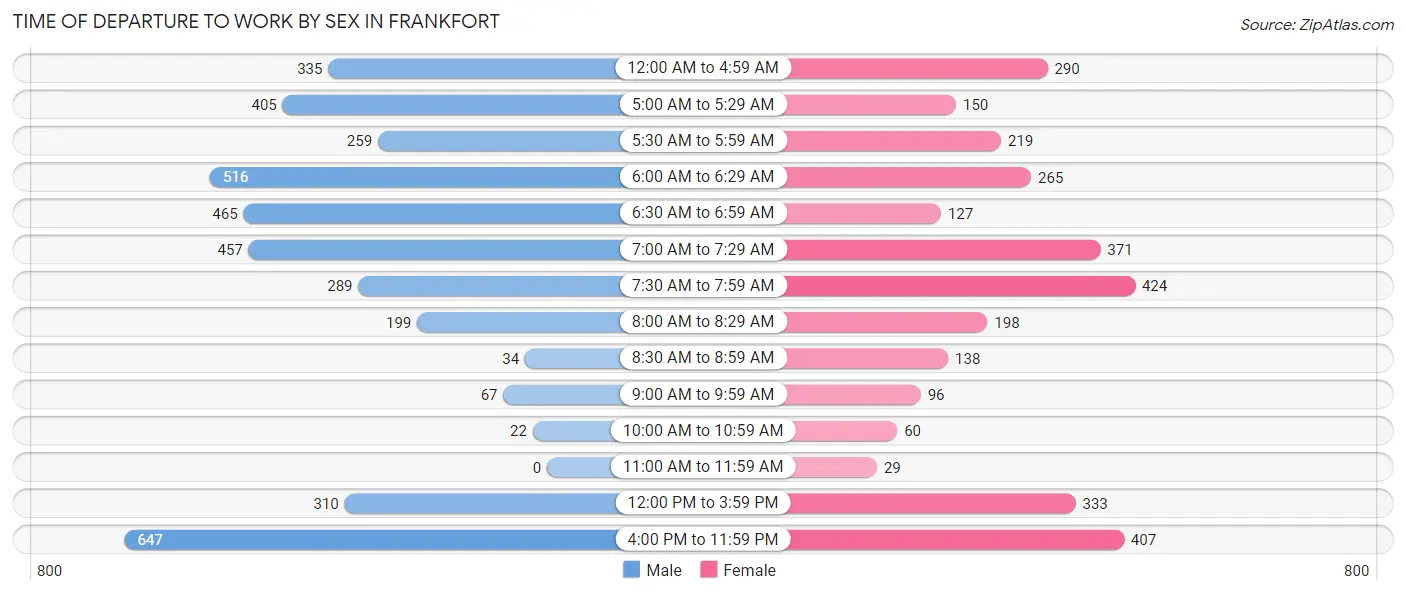
| Time of Departure | Male | Female |
| 12:00 AM to 4:59 AM | 335 (8.4%) | 290 (9.3%) |
| 5:00 AM to 5:29 AM | 405 (10.1%) | 150 (4.8%) |
| 5:30 AM to 5:59 AM | 259 (6.5%) | 219 (7.0%) |
| 6:00 AM to 6:29 AM | 516 (12.9%) | 265 (8.5%) |
| 6:30 AM to 6:59 AM | 465 (11.6%) | 127 (4.1%) |
| 7:00 AM to 7:29 AM | 457 (11.4%) | 371 (11.9%) |
| 7:30 AM to 7:59 AM | 289 (7.2%) | 424 (13.7%) |
| 8:00 AM to 8:29 AM | 199 (5.0%) | 198 (6.4%) |
| 8:30 AM to 8:59 AM | 34 (0.9%) | 138 (4.4%) |
| 9:00 AM to 9:59 AM | 67 (1.7%) | 96 (3.1%) |
| 10:00 AM to 10:59 AM | 22 (0.5%) | 60 (1.9%) |
| 11:00 AM to 11:59 AM | 0 (0.0%) | 29 (0.9%) |
| 12:00 PM to 3:59 PM | 310 (7.7%) | 333 (10.7%) |
| 4:00 PM to 11:59 PM | 647 (16.2%) | 407 (13.1%) |
| Total | 4,005 (100.0%) | 3,107 (100.0%) |
Housing Occupancy in Frankfort
Occupancy by Ownership in Frankfort
Of the total 6,159 dwellings in Frankfort, owner-occupied units account for 3,583 (58.2%), while renter-occupied units make up 2,576 (41.8%).
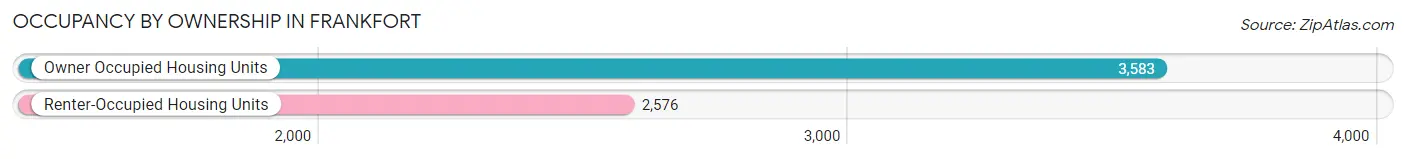
| Occupancy | # Housing Units | % Housing Units |
| Owner Occupied Housing Units | 3,583 | 58.2% |
| Renter-Occupied Housing Units | 2,576 | 41.8% |
| Total Occupied Housing Units | 6,159 | 100.0% |
Occupancy by Household Size in Frankfort
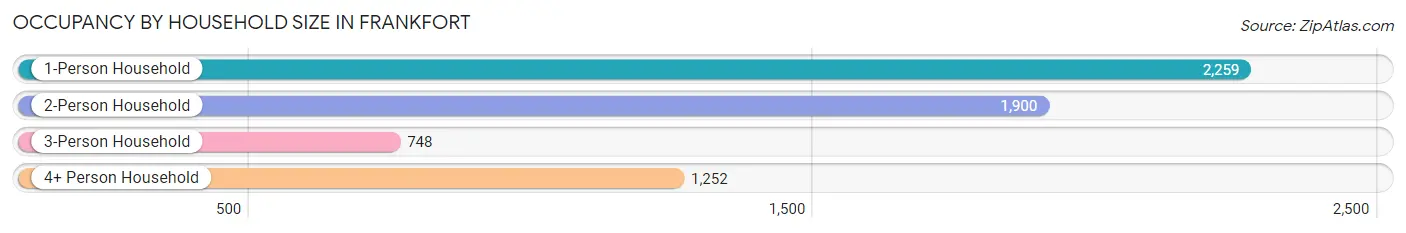
| Household Size | # Housing Units | % Housing Units |
| 1-Person Household | 2,259 | 36.7% |
| 2-Person Household | 1,900 | 30.8% |
| 3-Person Household | 748 | 12.1% |
| 4+ Person Household | 1,252 | 20.3% |
| Total Housing Units | 6,159 | 100.0% |
Occupancy by Ownership by Household Size in Frankfort
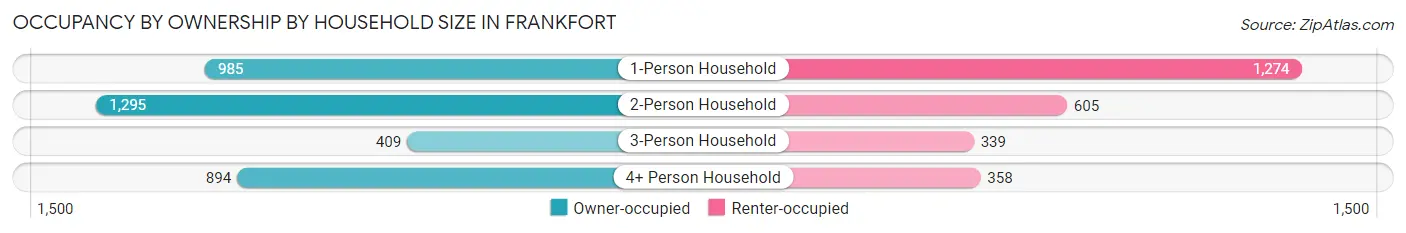
| Household Size | Owner-occupied | Renter-occupied |
| 1-Person Household | 985 (43.6%) | 1,274 (56.4%) |
| 2-Person Household | 1,295 (68.2%) | 605 (31.8%) |
| 3-Person Household | 409 (54.7%) | 339 (45.3%) |
| 4+ Person Household | 894 (71.4%) | 358 (28.6%) |
| Total Housing Units | 3,583 (58.2%) | 2,576 (41.8%) |
Occupancy by Educational Attainment in Frankfort
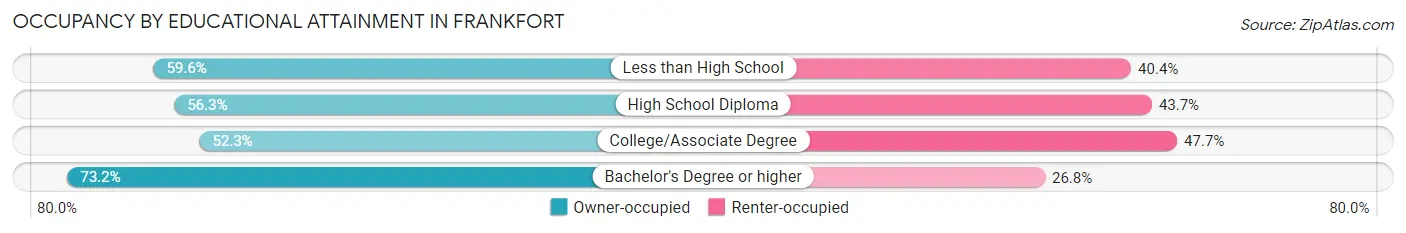
| Household Size | Owner-occupied | Renter-occupied |
| Less than High School | 676 (59.6%) | 459 (40.4%) |
| High School Diploma | 1,605 (56.3%) | 1,248 (43.7%) |
| College/Associate Degree | 717 (52.3%) | 655 (47.7%) |
| Bachelor's Degree or higher | 585 (73.2%) | 214 (26.8%) |
Occupancy by Age of Householder in Frankfort
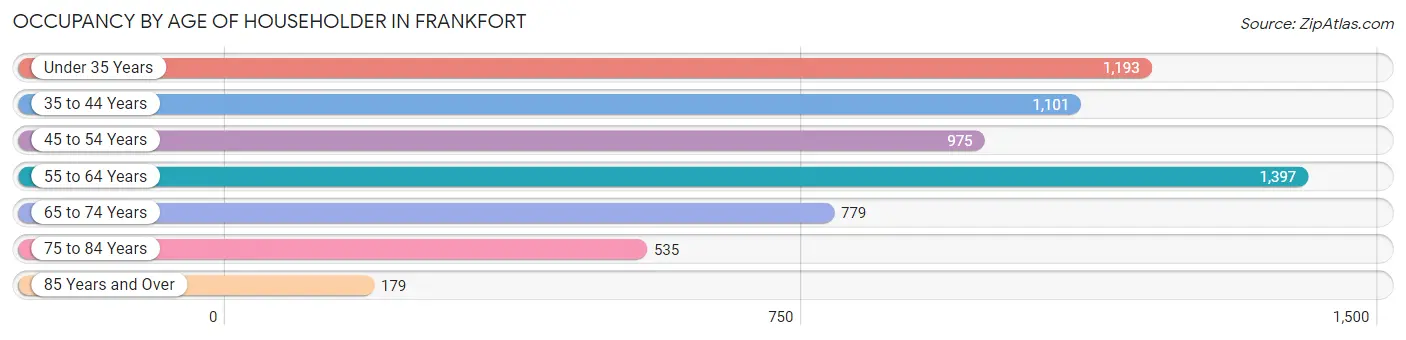
| Age Bracket | # Households | % Households |
| Under 35 Years | 1,193 | 19.4% |
| 35 to 44 Years | 1,101 | 17.9% |
| 45 to 54 Years | 975 | 15.8% |
| 55 to 64 Years | 1,397 | 22.7% |
| 65 to 74 Years | 779 | 12.7% |
| 75 to 84 Years | 535 | 8.7% |
| 85 Years and Over | 179 | 2.9% |
| Total | 6,159 | 100.0% |
Housing Finances in Frankfort
Median Income by Occupancy in Frankfort
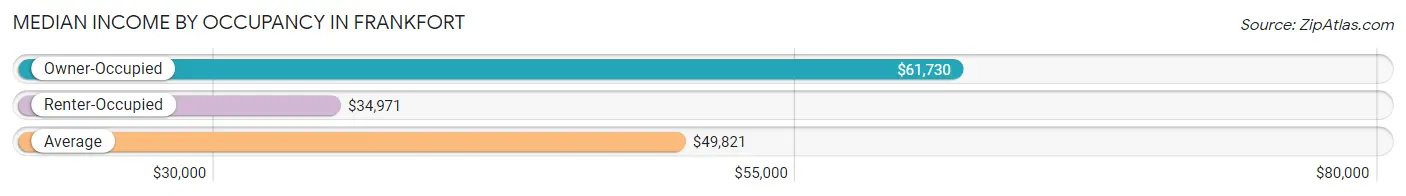
| Occupancy Type | # Households | Median Income |
| Owner-Occupied | 3,583 (58.2%) | $61,730 |
| Renter-Occupied | 2,576 (41.8%) | $34,971 |
| Average | 6,159 (100.0%) | $49,821 |
Occupancy by Householder Income Bracket in Frankfort
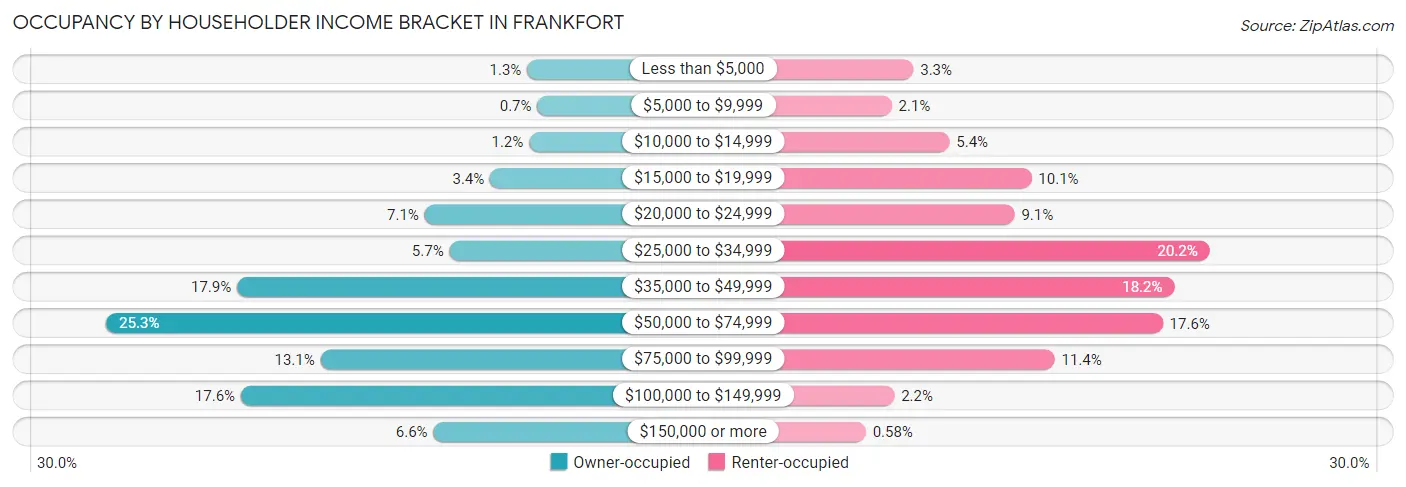
| Income Bracket | Owner-occupied | Renter-occupied |
| Less than $5,000 | 46 (1.3%) | 85 (3.3%) |
| $5,000 to $9,999 | 25 (0.7%) | 53 (2.1%) |
| $10,000 to $14,999 | 42 (1.2%) | 138 (5.4%) |
| $15,000 to $19,999 | 122 (3.4%) | 259 (10.1%) |
| $20,000 to $24,999 | 256 (7.1%) | 234 (9.1%) |
| $25,000 to $34,999 | 205 (5.7%) | 521 (20.2%) |
| $35,000 to $49,999 | 640 (17.9%) | 469 (18.2%) |
| $50,000 to $74,999 | 908 (25.3%) | 452 (17.5%) |
| $75,000 to $99,999 | 469 (13.1%) | 293 (11.4%) |
| $100,000 to $149,999 | 632 (17.6%) | 57 (2.2%) |
| $150,000 or more | 238 (6.6%) | 15 (0.6%) |
| Total | 3,583 (100.0%) | 2,576 (100.0%) |
Monthly Housing Cost Tiers in Frankfort
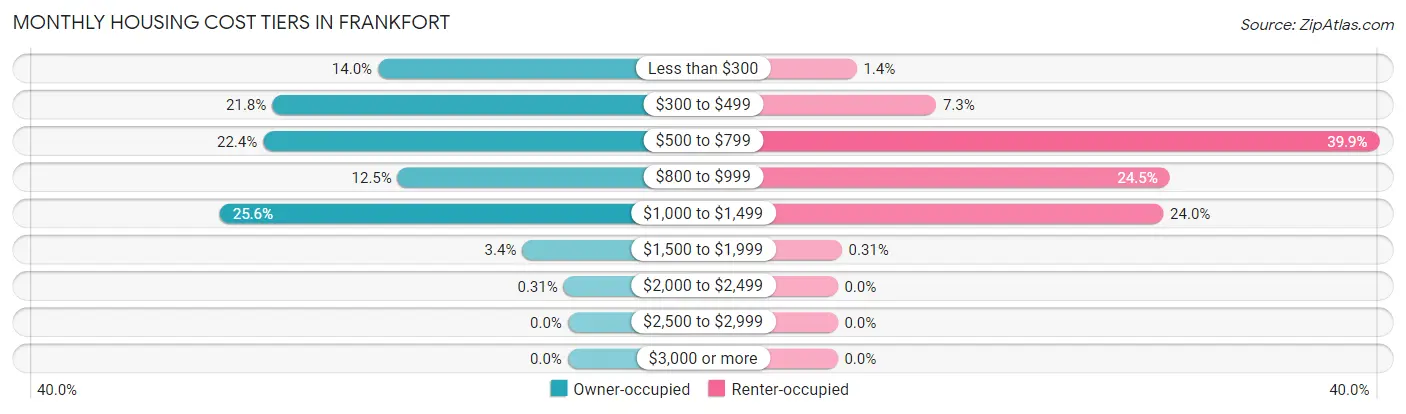
| Monthly Cost | Owner-occupied | Renter-occupied |
| Less than $300 | 501 (14.0%) | 36 (1.4%) |
| $300 to $499 | 780 (21.8%) | 187 (7.3%) |
| $500 to $799 | 804 (22.4%) | 1,028 (39.9%) |
| $800 to $999 | 449 (12.5%) | 630 (24.5%) |
| $1,000 to $1,499 | 918 (25.6%) | 618 (24.0%) |
| $1,500 to $1,999 | 120 (3.4%) | 8 (0.3%) |
| $2,000 to $2,499 | 11 (0.3%) | 0 (0.0%) |
| $2,500 to $2,999 | 0 (0.0%) | 0 (0.0%) |
| $3,000 or more | 0 (0.0%) | 0 (0.0%) |
| Total | 3,583 (100.0%) | 2,576 (100.0%) |
Physical Housing Characteristics in Frankfort
Housing Structures in Frankfort
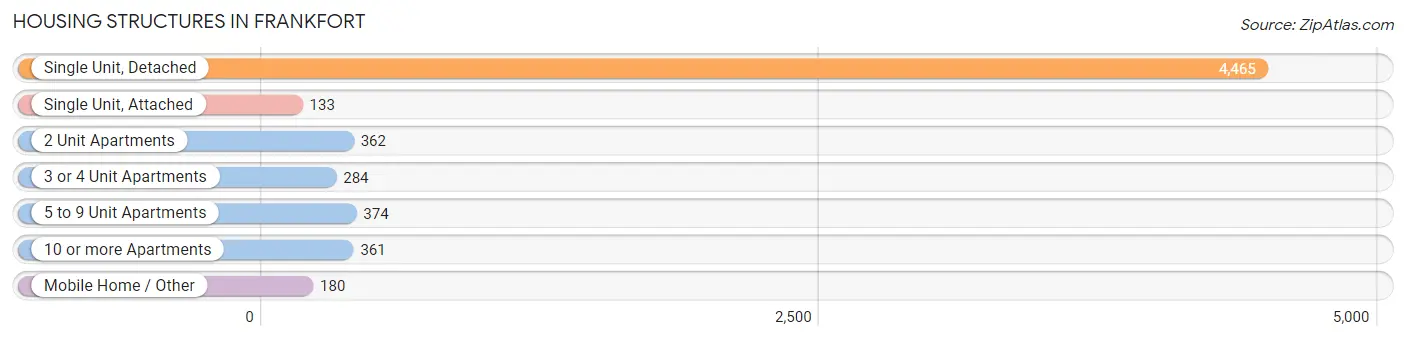
| Structure Type | # Housing Units | % Housing Units |
| Single Unit, Detached | 4,465 | 72.5% |
| Single Unit, Attached | 133 | 2.2% |
| 2 Unit Apartments | 362 | 5.9% |
| 3 or 4 Unit Apartments | 284 | 4.6% |
| 5 to 9 Unit Apartments | 374 | 6.1% |
| 10 or more Apartments | 361 | 5.9% |
| Mobile Home / Other | 180 | 2.9% |
| Total | 6,159 | 100.0% |
Housing Structures by Occupancy in Frankfort
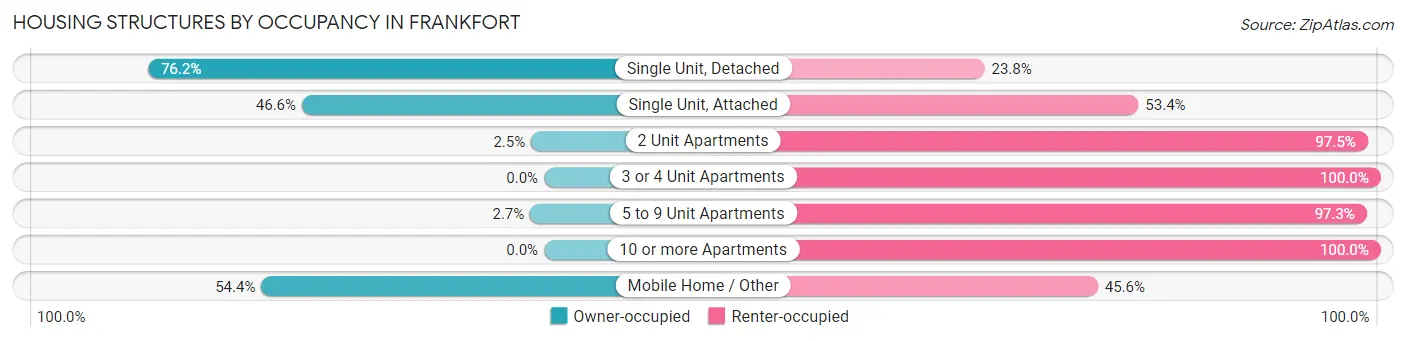
| Structure Type | Owner-occupied | Renter-occupied |
| Single Unit, Detached | 3,404 (76.2%) | 1,061 (23.8%) |
| Single Unit, Attached | 62 (46.6%) | 71 (53.4%) |
| 2 Unit Apartments | 9 (2.5%) | 353 (97.5%) |
| 3 or 4 Unit Apartments | 0 (0.0%) | 284 (100.0%) |
| 5 to 9 Unit Apartments | 10 (2.7%) | 364 (97.3%) |
| 10 or more Apartments | 0 (0.0%) | 361 (100.0%) |
| Mobile Home / Other | 98 (54.4%) | 82 (45.6%) |
| Total | 3,583 (58.2%) | 2,576 (41.8%) |
Housing Structures by Number of Rooms in Frankfort
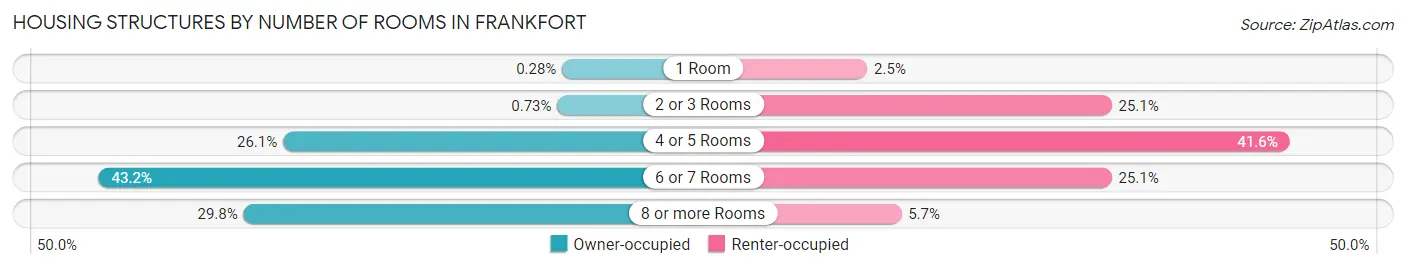
| Number of Rooms | Owner-occupied | Renter-occupied |
| 1 Room | 10 (0.3%) | 65 (2.5%) |
| 2 or 3 Rooms | 26 (0.7%) | 647 (25.1%) |
| 4 or 5 Rooms | 935 (26.1%) | 1,071 (41.6%) |
| 6 or 7 Rooms | 1,546 (43.1%) | 647 (25.1%) |
| 8 or more Rooms | 1,066 (29.7%) | 146 (5.7%) |
| Total | 3,583 (100.0%) | 2,576 (100.0%) |
Housing Structure by Heating Type in Frankfort
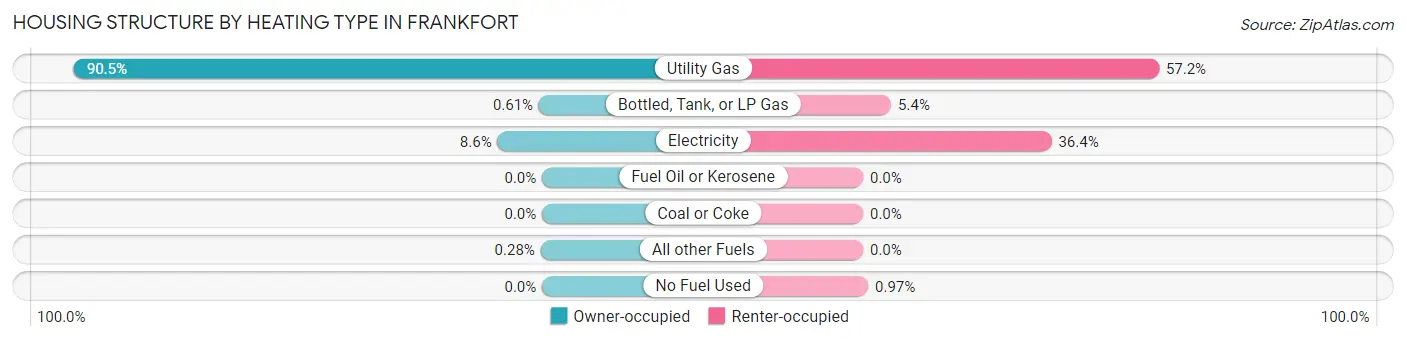
| Heating Type | Owner-occupied | Renter-occupied |
| Utility Gas | 3,242 (90.5%) | 1,473 (57.2%) |
| Bottled, Tank, or LP Gas | 22 (0.6%) | 140 (5.4%) |
| Electricity | 309 (8.6%) | 938 (36.4%) |
| Fuel Oil or Kerosene | 0 (0.0%) | 0 (0.0%) |
| Coal or Coke | 0 (0.0%) | 0 (0.0%) |
| All other Fuels | 10 (0.3%) | 0 (0.0%) |
| No Fuel Used | 0 (0.0%) | 25 (1.0%) |
| Total | 3,583 (100.0%) | 2,576 (100.0%) |
Household Vehicle Usage in Frankfort
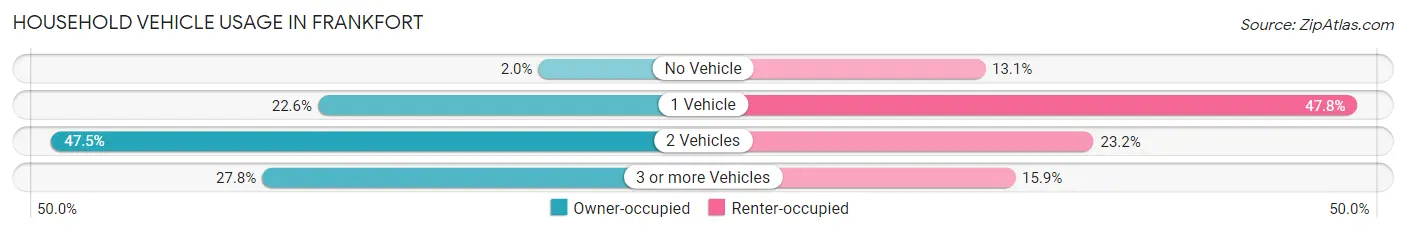
| Vehicles per Household | Owner-occupied | Renter-occupied |
| No Vehicle | 73 (2.0%) | 337 (13.1%) |
| 1 Vehicle | 811 (22.6%) | 1,232 (47.8%) |
| 2 Vehicles | 1,702 (47.5%) | 598 (23.2%) |
| 3 or more Vehicles | 997 (27.8%) | 409 (15.9%) |
| Total | 3,583 (100.0%) | 2,576 (100.0%) |
Real Estate & Mortgages in Frankfort
Real Estate and Mortgage Overview in Frankfort
| Characteristic | Without Mortgage | With Mortgage |
| Housing Units | 1,579 | 2,004 |
| Median Property Value | $94,800 | $123,400 |
| Median Household Income | $49,885 | $123 |
| Monthly Housing Costs | $367 | $0 |
| Real Estate Taxes | $710 | $57 |
Property Value by Mortgage Status in Frankfort
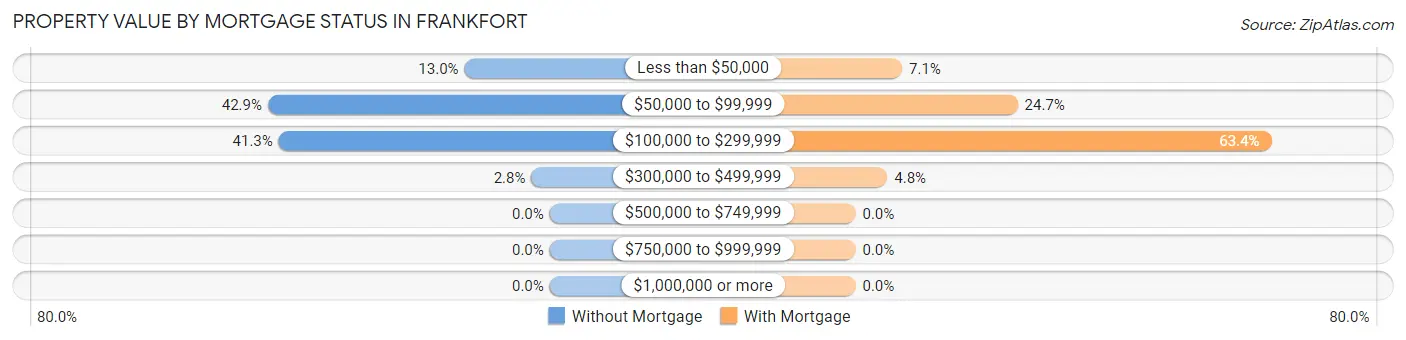
| Property Value | Without Mortgage | With Mortgage |
| Less than $50,000 | 205 (13.0%) | 142 (7.1%) |
| $50,000 to $99,999 | 678 (42.9%) | 495 (24.7%) |
| $100,000 to $299,999 | 652 (41.3%) | 1,270 (63.4%) |
| $300,000 to $499,999 | 44 (2.8%) | 97 (4.8%) |
| $500,000 to $749,999 | 0 (0.0%) | 0 (0.0%) |
| $750,000 to $999,999 | 0 (0.0%) | 0 (0.0%) |
| $1,000,000 or more | 0 (0.0%) | 0 (0.0%) |
| Total | 1,579 (100.0%) | 2,004 (100.0%) |
Household Income by Mortgage Status in Frankfort
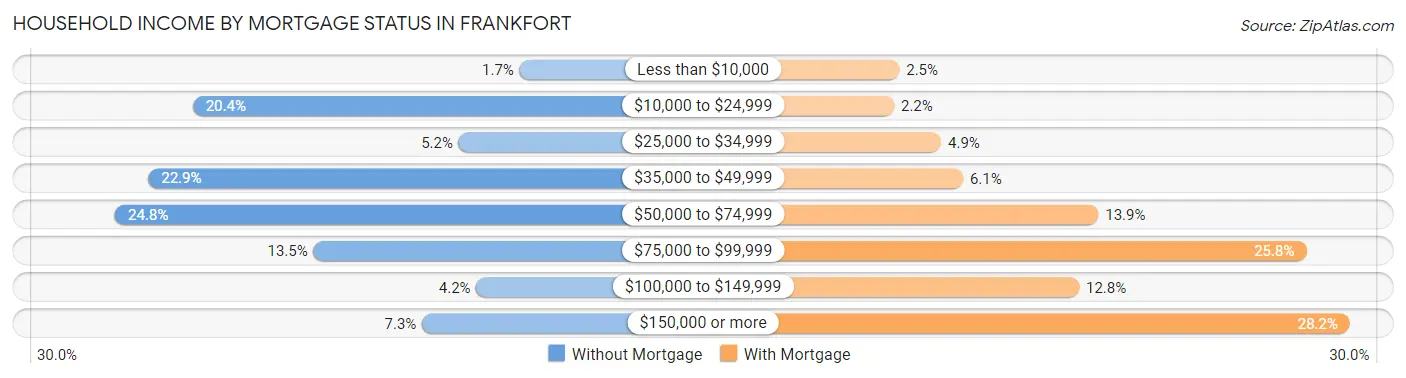
| Household Income | Without Mortgage | With Mortgage |
| Less than $10,000 | 27 (1.7%) | 50 (2.5%) |
| $10,000 to $24,999 | 322 (20.4%) | 44 (2.2%) |
| $25,000 to $34,999 | 82 (5.2%) | 98 (4.9%) |
| $35,000 to $49,999 | 362 (22.9%) | 123 (6.1%) |
| $50,000 to $74,999 | 392 (24.8%) | 278 (13.9%) |
| $75,000 to $99,999 | 213 (13.5%) | 516 (25.8%) |
| $100,000 to $149,999 | 66 (4.2%) | 256 (12.8%) |
| $150,000 or more | 115 (7.3%) | 566 (28.2%) |
| Total | 1,579 (100.0%) | 2,004 (100.0%) |
Property Value to Household Income Ratio in Frankfort
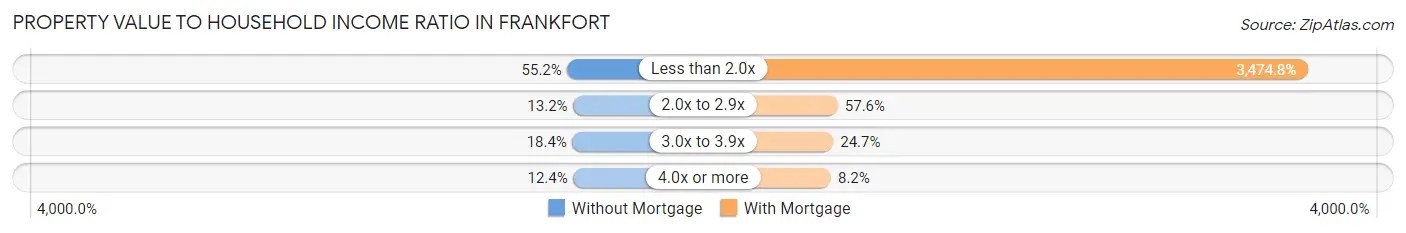
| Value-to-Income Ratio | Without Mortgage | With Mortgage |
| Less than 2.0x | 872 (55.2%) | 69,635 (3,474.8%) |
| 2.0x to 2.9x | 209 (13.2%) | 1,155 (57.6%) |
| 3.0x to 3.9x | 291 (18.4%) | 494 (24.6%) |
| 4.0x or more | 196 (12.4%) | 164 (8.2%) |
| Total | 1,579 (100.0%) | 2,004 (100.0%) |
Real Estate Taxes by Mortgage Status in Frankfort
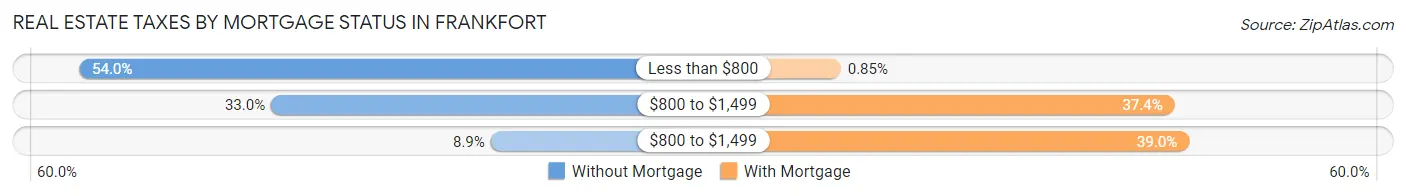
| Property Taxes | Without Mortgage | With Mortgage |
| Less than $800 | 853 (54.0%) | 17 (0.9%) |
| $800 to $1,499 | 521 (33.0%) | 750 (37.4%) |
| $800 to $1,499 | 141 (8.9%) | 782 (39.0%) |
| Total | 1,579 (100.0%) | 2,004 (100.0%) |
Health & Disability in Frankfort
Health Insurance Coverage by Age in Frankfort
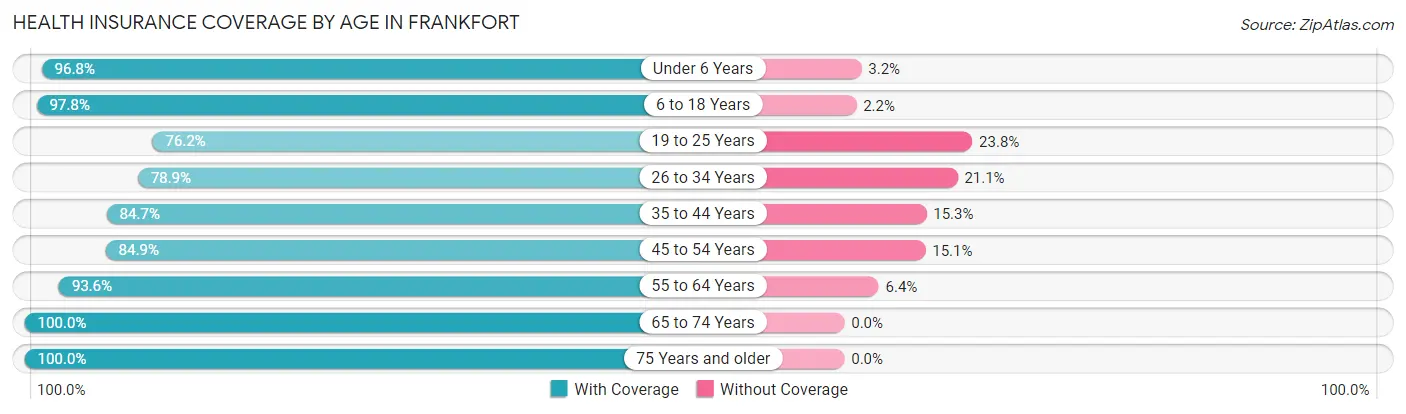
| Age Bracket | With Coverage | Without Coverage |
| Under 6 Years | 1,186 (96.8%) | 39 (3.2%) |
| 6 to 18 Years | 3,252 (97.8%) | 74 (2.2%) |
| 19 to 25 Years | 1,051 (76.2%) | 329 (23.8%) |
| 26 to 34 Years | 1,361 (78.9%) | 364 (21.1%) |
| 35 to 44 Years | 1,673 (84.7%) | 302 (15.3%) |
| 45 to 54 Years | 1,421 (84.9%) | 253 (15.1%) |
| 55 to 64 Years | 2,006 (93.6%) | 137 (6.4%) |
| 65 to 74 Years | 1,191 (100.0%) | 0 (0.0%) |
| 75 Years and older | 995 (100.0%) | 0 (0.0%) |
| Total | 14,136 (90.4%) | 1,498 (9.6%) |
Health Insurance Coverage by Citizenship Status in Frankfort
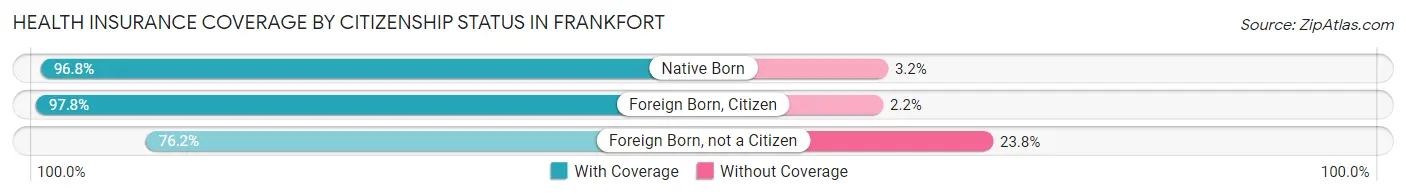
| Citizenship Status | With Coverage | Without Coverage |
| Native Born | 1,186 (96.8%) | 39 (3.2%) |
| Foreign Born, Citizen | 3,252 (97.8%) | 74 (2.2%) |
| Foreign Born, not a Citizen | 1,051 (76.2%) | 329 (23.8%) |
Health Insurance Coverage by Household Income in Frankfort
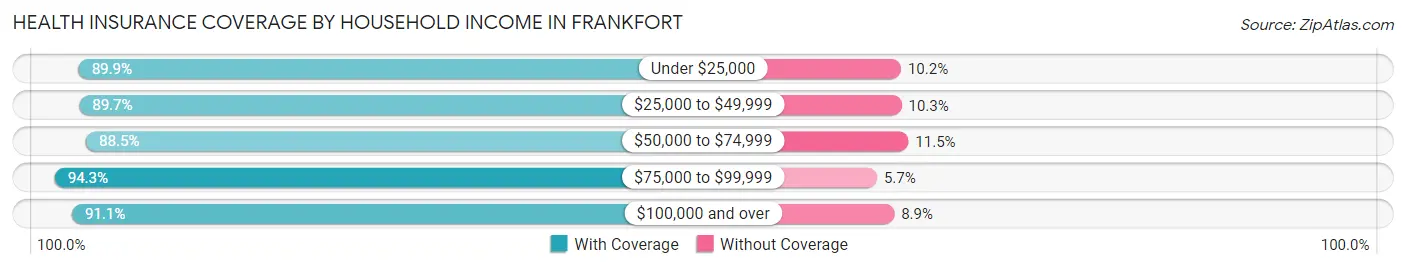
| Household Income | With Coverage | Without Coverage |
| Under $25,000 | 1,655 (89.8%) | 187 (10.2%) |
| $25,000 to $49,999 | 3,375 (89.7%) | 386 (10.3%) |
| $50,000 to $74,999 | 3,642 (88.5%) | 475 (11.5%) |
| $75,000 to $99,999 | 2,385 (94.3%) | 143 (5.7%) |
| $100,000 and over | 3,054 (91.1%) | 298 (8.9%) |
Public vs Private Health Insurance Coverage by Age in Frankfort
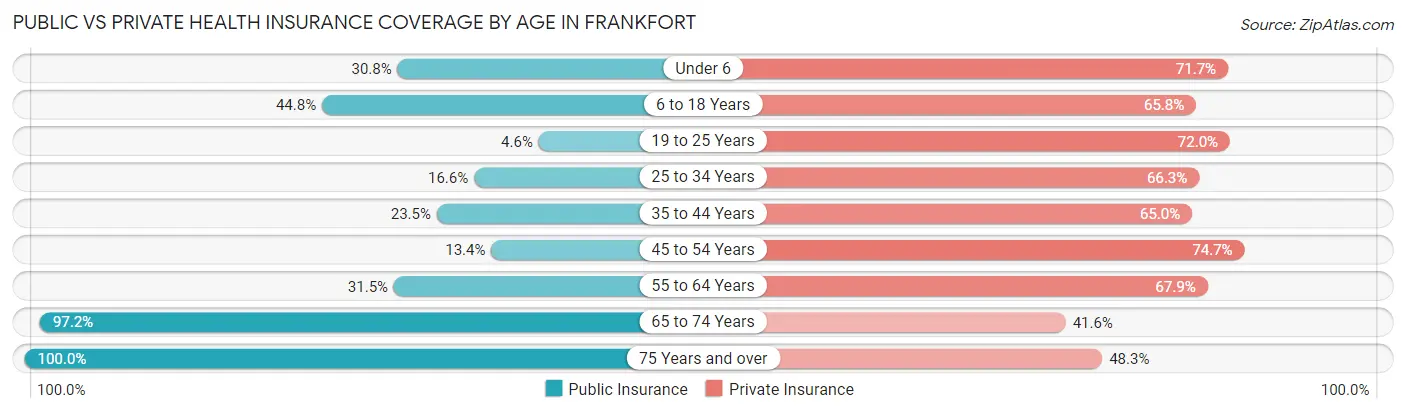
| Age Bracket | Public Insurance | Private Insurance |
| Under 6 | 377 (30.8%) | 878 (71.7%) |
| 6 to 18 Years | 1,490 (44.8%) | 2,187 (65.7%) |
| 19 to 25 Years | 63 (4.6%) | 994 (72.0%) |
| 25 to 34 Years | 286 (16.6%) | 1,144 (66.3%) |
| 35 to 44 Years | 464 (23.5%) | 1,284 (65.0%) |
| 45 to 54 Years | 224 (13.4%) | 1,251 (74.7%) |
| 55 to 64 Years | 674 (31.5%) | 1,455 (67.9%) |
| 65 to 74 Years | 1,157 (97.2%) | 495 (41.6%) |
| 75 Years and over | 995 (100.0%) | 481 (48.3%) |
| Total | 5,730 (36.6%) | 10,169 (65.0%) |
Disability Status by Sex by Age in Frankfort
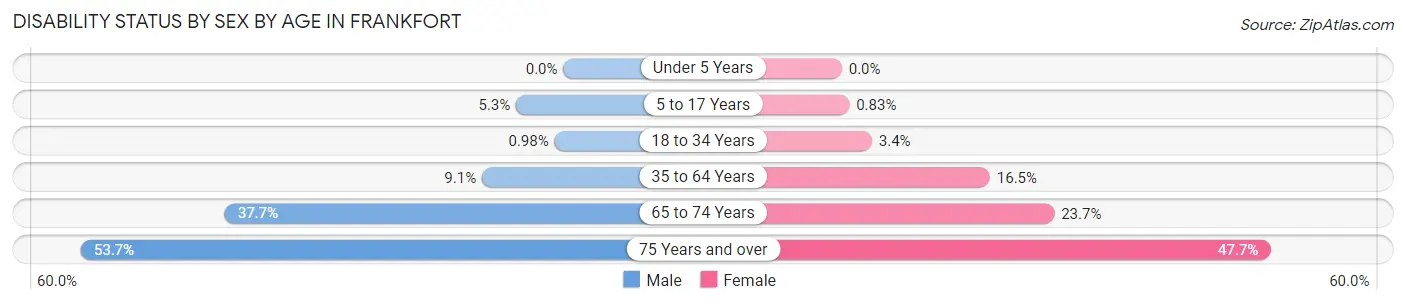
| Age Bracket | Male | Female |
| Under 5 Years | 0 (0.0%) | 0 (0.0%) |
| 5 to 17 Years | 89 (5.3%) | 13 (0.8%) |
| 18 to 34 Years | 17 (1.0%) | 58 (3.4%) |
| 35 to 64 Years | 281 (9.1%) | 444 (16.5%) |
| 65 to 74 Years | 210 (37.7%) | 150 (23.7%) |
| 75 Years and over | 173 (53.7%) | 321 (47.7%) |
Disability Class by Sex by Age in Frankfort
Disability Class: Hearing Difficulty
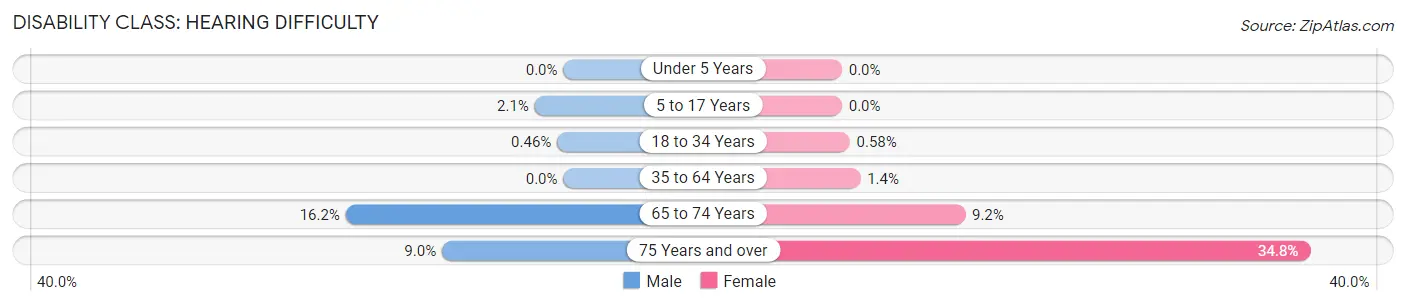
| Age Bracket | Male | Female |
| Under 5 Years | 0 (0.0%) | 0 (0.0%) |
| 5 to 17 Years | 36 (2.1%) | 0 (0.0%) |
| 18 to 34 Years | 8 (0.5%) | 10 (0.6%) |
| 35 to 64 Years | 0 (0.0%) | 37 (1.4%) |
| 65 to 74 Years | 90 (16.2%) | 58 (9.1%) |
| 75 Years and over | 29 (9.0%) | 234 (34.8%) |
Disability Class: Vision Difficulty
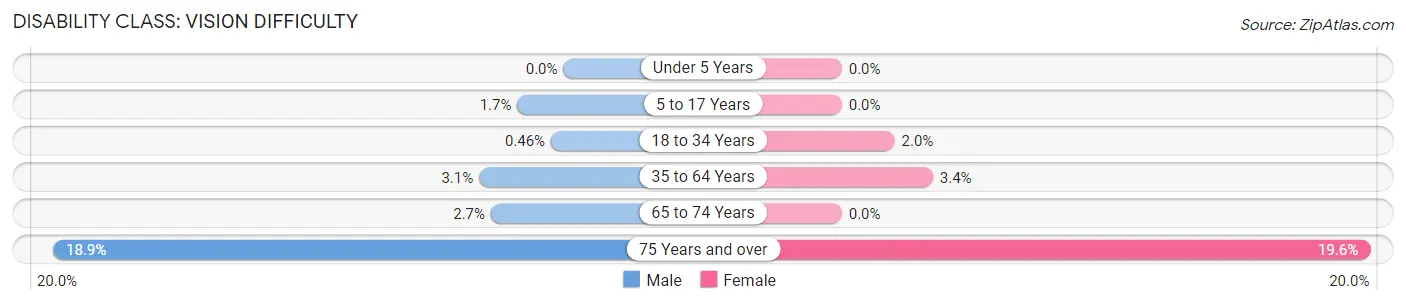
| Age Bracket | Male | Female |
| Under 5 Years | 0 (0.0%) | 0 (0.0%) |
| 5 to 17 Years | 29 (1.7%) | 0 (0.0%) |
| 18 to 34 Years | 8 (0.5%) | 34 (2.0%) |
| 35 to 64 Years | 97 (3.1%) | 91 (3.4%) |
| 65 to 74 Years | 15 (2.7%) | 0 (0.0%) |
| 75 Years and over | 61 (18.9%) | 132 (19.6%) |
Disability Class: Cognitive Difficulty
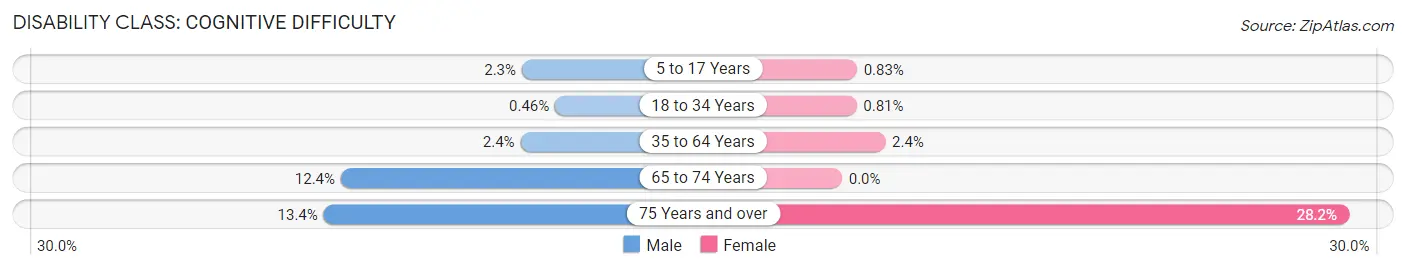
| Age Bracket | Male | Female |
| 5 to 17 Years | 39 (2.3%) | 13 (0.8%) |
| 18 to 34 Years | 8 (0.5%) | 14 (0.8%) |
| 35 to 64 Years | 74 (2.4%) | 65 (2.4%) |
| 65 to 74 Years | 69 (12.4%) | 0 (0.0%) |
| 75 Years and over | 43 (13.4%) | 190 (28.2%) |
Disability Class: Ambulatory Difficulty
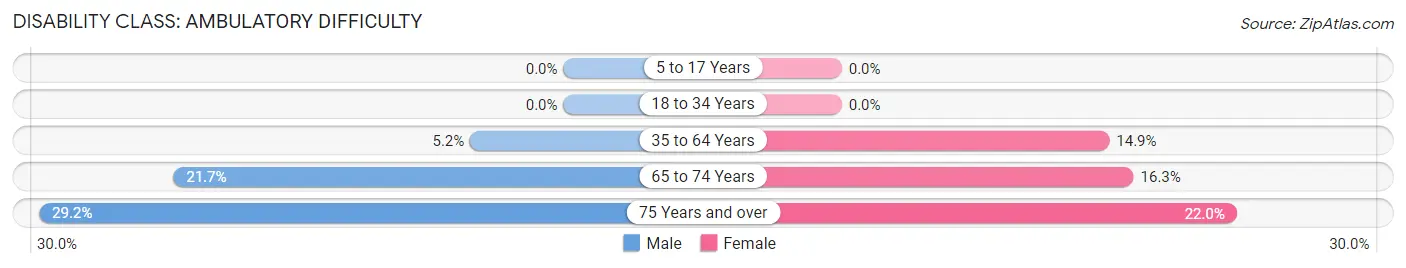
| Age Bracket | Male | Female |
| 5 to 17 Years | 0 (0.0%) | 0 (0.0%) |
| 18 to 34 Years | 0 (0.0%) | 0 (0.0%) |
| 35 to 64 Years | 161 (5.2%) | 401 (14.9%) |
| 65 to 74 Years | 121 (21.7%) | 103 (16.3%) |
| 75 Years and over | 94 (29.2%) | 148 (22.0%) |
Disability Class: Self-Care Difficulty
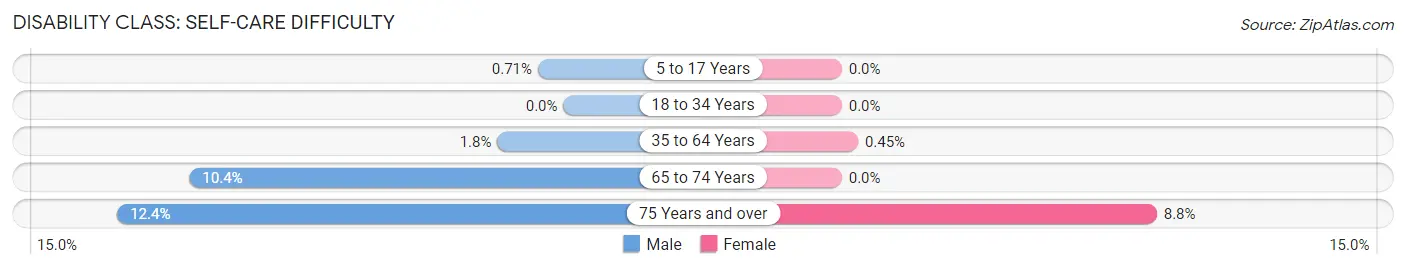
| Age Bracket | Male | Female |
| 5 to 17 Years | 12 (0.7%) | 0 (0.0%) |
| 18 to 34 Years | 0 (0.0%) | 0 (0.0%) |
| 35 to 64 Years | 57 (1.8%) | 12 (0.4%) |
| 65 to 74 Years | 58 (10.4%) | 0 (0.0%) |
| 75 Years and over | 40 (12.4%) | 59 (8.8%) |
Technology Access in Frankfort
Computing Device Access in Frankfort
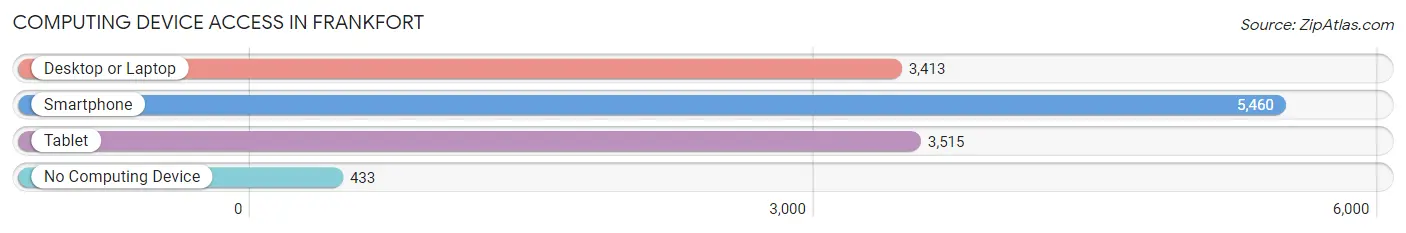
| Device Type | # Households | % Households |
| Desktop or Laptop | 3,413 | 55.4% |
| Smartphone | 5,460 | 88.6% |
| Tablet | 3,515 | 57.1% |
| No Computing Device | 433 | 7.0% |
| Total | 6,159 | 100.0% |
Internet Access in Frankfort
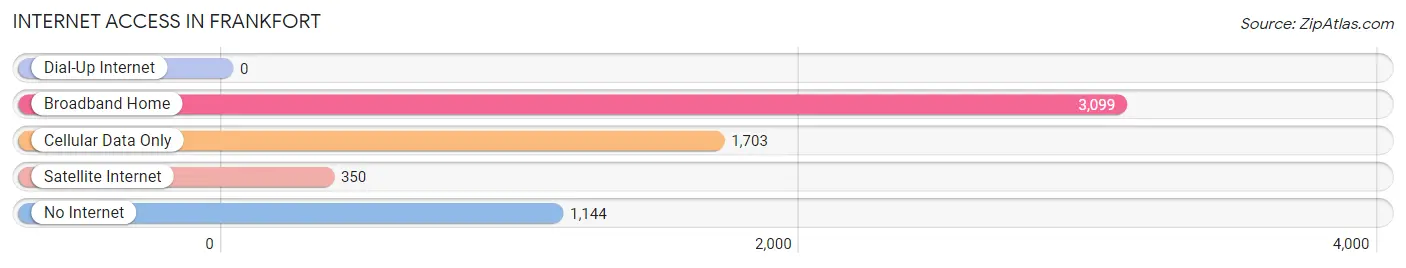
| Internet Type | # Households | % Households |
| Dial-Up Internet | 0 | 0.0% |
| Broadband Home | 3,099 | 50.3% |
| Cellular Data Only | 1,703 | 27.7% |
| Satellite Internet | 350 | 5.7% |
| No Internet | 1,144 | 18.6% |
| Total | 6,159 | 100.0% |
Frankfort Summary
Frankfort, Indiana is a city located in Clinton County, Indiana, United States. The population was 16,422 at the 2010 census. It is the county seat of Clinton County. The city is located along the Wabash River and is part of the Lafayette, Indiana metropolitan area.
History
Frankfort was founded in 1829 by settlers from Kentucky and Virginia. The city was named after the city of Frankfurt, Germany. The city was incorporated in 1845 and became the county seat of Clinton County in 1829.
Frankfort was an important stop on the Wabash and Erie Canal, which was built in the 1840s. The canal was used to transport goods and people between the Great Lakes and the Ohio River. The canal was abandoned in the late 19th century and the city's economy shifted to agriculture and manufacturing.
Frankfort was also an important stop on the Monon Railroad, which ran from Chicago to Louisville. The railroad was used to transport goods and people between the two cities. The railroad was abandoned in the late 20th century and the city's economy shifted to tourism and service industries.
Geography
Frankfort is located at 40°27'25" North, 86°06'45" West (40.456944, -86.112500). According to the 2010 census, the city has a total area of 8.3 square miles (21.5 km2), of which 8.2 square miles (21.3 km2) is land and 0.1 square miles (0.2 km2) is water.
Economy
Frankfort's economy is largely based on agriculture and manufacturing. The city is home to several large manufacturing companies, including Arvin Sango, Inc., a manufacturer of automotive parts, and Frankfort Foundry, a manufacturer of cast iron products.
The city is also home to several large agricultural operations, including the Frankfort Grain Company, which produces corn, soybeans, and wheat.
Demographics
As of the 2010 census, there were 16,422 people, 6,717 households, and 4,541 families residing in the city. The population density was 1,988.3 people per square mile (766.7/km2). There were 7,093 housing units at an average density of 860.3 per square mile (332.2/km2). The racial makeup of the city was 94.2% White, 1.2% African American, 0.3% Native American, 0.7% Asian, 0.1% Pacific Islander, 1.7% from other races, and 1.8% from two or more races. Hispanic or Latino of any race were 4.2% of the population.
There were 6,717 households, out of which 32.2% had children under the age of 18 living with them, 51.2% were married couples living together, 12.3% had a female householder with no husband present, and 32.2% were non-families. 27.2% of all households were made up of individuals, and 11.2% had someone living alone who was 65 years of age or older. The average household size was 2.44 and the average family size was 2.95.
In the city, the population was spread out, with 25.2% under the age of 18, 8.3% from 18 to 24, 28.3% from 25 to 44, 22.7% from 45 to 64, and 15.5% who were 65 years of age or older. The median age was 37 years. For every 100 females, there were 92.2 males. For every 100 females age 18 and over, there were 88.3 males.
The median income for a household in the city was $41,945, and the median income for a family was $50,945. Males had a median income of $37,945 versus $25,945 for females. The per capita income for the city was $20,945. About 6.2% of families and 8.3% of the population were below the poverty line, including 11.2% of those under age 18 and 6.2% of those age 65 or over.
Common Questions
What is Per Capita Income in Frankfort?
Per Capita income in Frankfort is $24,934.
What is the Median Family Income in Frankfort?
Median Family Income in Frankfort is $61,983.
What is the Median Household income in Frankfort?
Median Household Income in Frankfort is $49,821.
What is Income or Wage Gap in Frankfort?
Income or Wage Gap in Frankfort is 20.3%.
Women in Frankfort earn 79.7 cents for every dollar earned by a man.
What is Family Income Deficit in Frankfort?
Family Income Deficit in Frankfort is $10,920.
Families that are below poverty line in Frankfort earn $10,920 less on average than the poverty threshold level.
What is Inequality or Gini Index in Frankfort?
Inequality or Gini Index in Frankfort is 0.40.
What is the Total Population of Frankfort?
Total Population of Frankfort is 15,976.
What is the Total Male Population of Frankfort?
Total Male Population of Frankfort is 7,978.
What is the Total Female Population of Frankfort?
Total Female Population of Frankfort is 7,998.
What is the Ratio of Males per 100 Females in Frankfort?
There are 99.75 Males per 100 Females in Frankfort.
What is the Ratio of Females per 100 Males in Frankfort?
There are 100.25 Females per 100 Males in Frankfort.
What is the Median Population Age in Frankfort?
Median Population Age in Frankfort is 35.7 Years.
What is the Average Family Size in Frankfort
Average Family Size in Frankfort is 3.4 People.
What is the Average Household Size in Frankfort
Average Household Size in Frankfort is 2.5 People.
How Large is the Labor Force in Frankfort?
There are 7,751 People in the Labor Forcein in Frankfort.
What is the Percentage of People in the Labor Force in Frankfort?
62.9% of People are in the Labor Force in Frankfort.
What is the Unemployment Rate in Frankfort?
Unemployment Rate in Frankfort is 4.4%.