Fountain City, IN Map & Demographics
Fountain City Map
Fountain City Overview
$25,848
PER CAPITA INCOME
$48,295
AVG FAMILY INCOME
$48,802
AVG HOUSEHOLD INCOME
44.7%
WAGE / INCOME GAP [ % ]
55.3¢/ $1
WAGE / INCOME GAP [ $ ]
0.34
INEQUALITY / GINI INDEX
773
TOTAL POPULATION
374
MALE POPULATION
399
FEMALE POPULATION
93.73
MALES / 100 FEMALES
106.68
FEMALES / 100 MALES
39.0
MEDIAN AGE
2.6
AVG FAMILY SIZE
2.2
AVG HOUSEHOLD SIZE
395
LABOR FORCE [ PEOPLE ]
66.5%
PERCENT IN LABOR FORCE
3.0%
UNEMPLOYMENT RATE
Fountain City Zip Codes
Fountain City Area Codes
Income in Fountain City
Income Overview in Fountain City
Per Capita Income in Fountain City is $25,848, while median incomes of families and households are $48,295 and $48,802 respectively.
| Characteristic | Number | Measure |
| Per Capita Income | 773 | $25,848 |
| Median Family Income | 237 | $48,295 |
| Mean Family Income | 237 | $55,516 |
| Median Household Income | 345 | $48,802 |
| Mean Household Income | 345 | $58,678 |
| Income Deficit | 237 | $0 |
| Wage / Income Gap (%) | 773 | 44.72% |
| Wage / Income Gap ($) | 773 | 55.28¢ per $1 |
| Gini / Inequality Index | 773 | 0.34 |
Earnings by Sex in Fountain City
Average Earnings in Fountain City are $33,839, $43,929 for men and $24,286 for women, a difference of 44.7%.
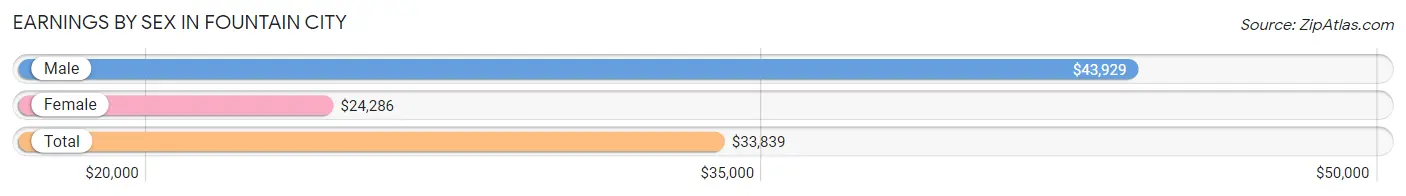
| Sex | Number | Average Earnings |
| Male | 230 (54.5%) | $43,929 |
| Female | 192 (45.5%) | $24,286 |
| Total | 422 (100.0%) | $33,839 |
Earnings by Sex by Income Bracket in Fountain City
The most common earnings brackets in Fountain City are $2,499 or less for men (29 | 12.6%) and $2,500 to $4,999 for women (26 | 13.5%).
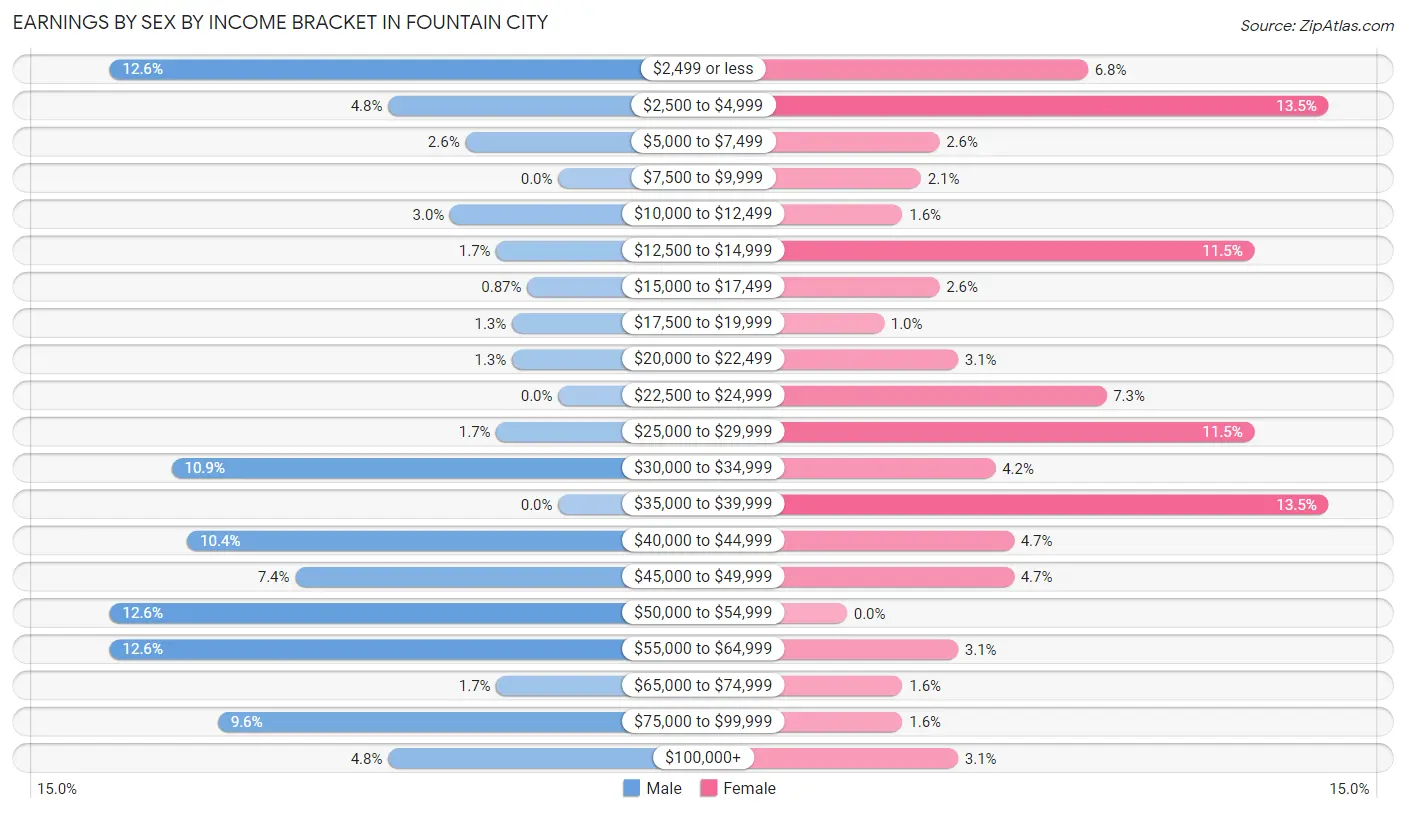
| Income | Male | Female |
| $2,499 or less | 29 (12.6%) | 13 (6.8%) |
| $2,500 to $4,999 | 11 (4.8%) | 26 (13.5%) |
| $5,000 to $7,499 | 6 (2.6%) | 5 (2.6%) |
| $7,500 to $9,999 | 0 (0.0%) | 4 (2.1%) |
| $10,000 to $12,499 | 7 (3.0%) | 3 (1.6%) |
| $12,500 to $14,999 | 4 (1.7%) | 22 (11.5%) |
| $15,000 to $17,499 | 2 (0.9%) | 5 (2.6%) |
| $17,500 to $19,999 | 3 (1.3%) | 2 (1.0%) |
| $20,000 to $22,499 | 3 (1.3%) | 6 (3.1%) |
| $22,500 to $24,999 | 0 (0.0%) | 14 (7.3%) |
| $25,000 to $29,999 | 4 (1.7%) | 22 (11.5%) |
| $30,000 to $34,999 | 25 (10.9%) | 8 (4.2%) |
| $35,000 to $39,999 | 0 (0.0%) | 26 (13.5%) |
| $40,000 to $44,999 | 24 (10.4%) | 9 (4.7%) |
| $45,000 to $49,999 | 17 (7.4%) | 9 (4.7%) |
| $50,000 to $54,999 | 29 (12.6%) | 0 (0.0%) |
| $55,000 to $64,999 | 29 (12.6%) | 6 (3.1%) |
| $65,000 to $74,999 | 4 (1.7%) | 3 (1.6%) |
| $75,000 to $99,999 | 22 (9.6%) | 3 (1.6%) |
| $100,000+ | 11 (4.8%) | 6 (3.1%) |
| Total | 230 (100.0%) | 192 (100.0%) |
Earnings by Sex by Educational Attainment in Fountain City
Average earnings in Fountain City are $42,679 for men and $25,313 for women, a difference of 40.7%. Men with an educational attainment of bachelor's degree enjoy the highest average annual earnings of $62,917, while those with high school diploma education earn the least with $34,750. Women with an educational attainment of college or associate's degree earn the most with the average annual earnings of $29,318, while those with high school diploma education have the smallest earnings of $26,563.
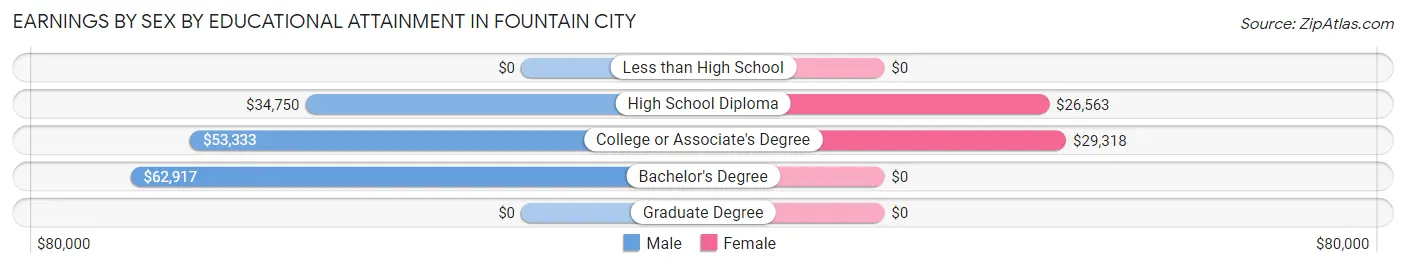
| Educational Attainment | Male Income | Female Income |
| Less than High School | - | - |
| High School Diploma | $34,750 | $26,563 |
| College or Associate's Degree | $53,333 | $29,318 |
| Bachelor's Degree | $62,917 | $0 |
| Graduate Degree | - | - |
| Total | $42,679 | $25,313 |
Family Income in Fountain City
Family Income Brackets in Fountain City
According to the Fountain City family income data, there are 59 families falling into the $35,000 to $49,999 income range, which is the most common income bracket and makes up 24.9% of all families.
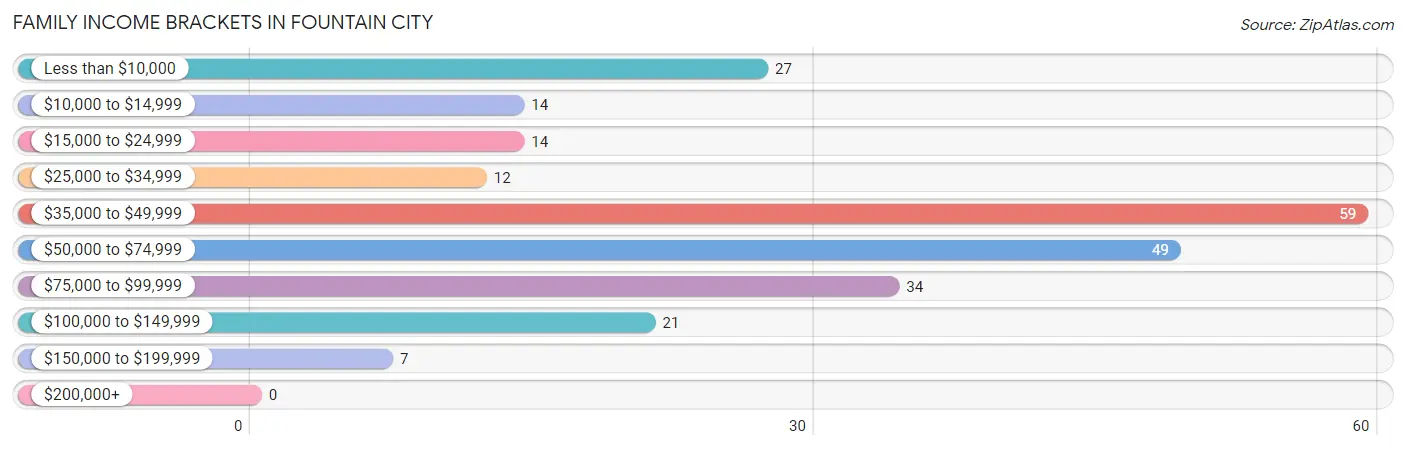
| Income Bracket | # Families | % Families |
| Less than $10,000 | 27 | 11.4% |
| $10,000 to $14,999 | 14 | 5.9% |
| $15,000 to $24,999 | 14 | 5.9% |
| $25,000 to $34,999 | 12 | 5.1% |
| $35,000 to $49,999 | 59 | 24.9% |
| $50,000 to $74,999 | 49 | 20.7% |
| $75,000 to $99,999 | 34 | 14.3% |
| $100,000 to $149,999 | 21 | 8.9% |
| $150,000 to $199,999 | 7 | 3.0% |
| $200,000+ | 0 | 0.0% |
Family Income by Famaliy Size in Fountain City
5-person families (8 | 3.4%) account for the highest median family income in Fountain City with $98,750 per family, while 2-person families (132 | 55.7%) have the highest median income of $21,696 per family member.
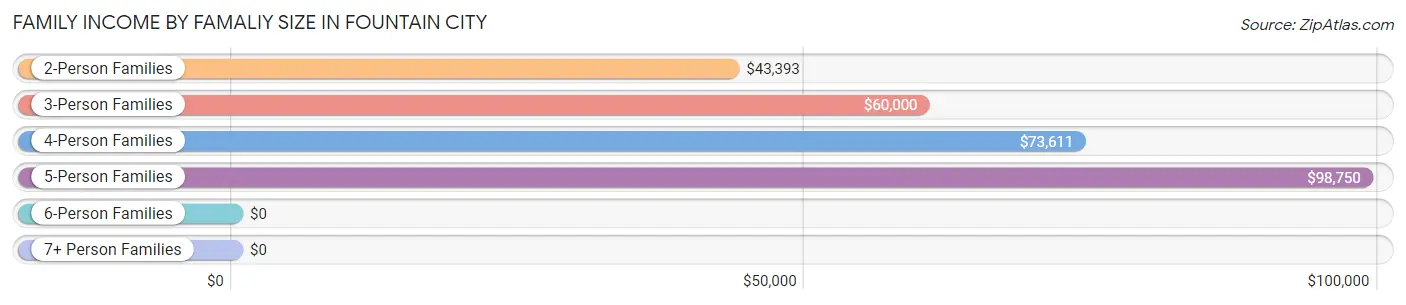
| Income Bracket | # Families | Median Income |
| 2-Person Families | 132 (55.7%) | $43,393 |
| 3-Person Families | 60 (25.3%) | $60,000 |
| 4-Person Families | 34 (14.3%) | $73,611 |
| 5-Person Families | 8 (3.4%) | $98,750 |
| 6-Person Families | 3 (1.3%) | $0 |
| 7+ Person Families | 0 (0.0%) | $0 |
| Total | 237 (100.0%) | $48,295 |
Family Income by Number of Earners in Fountain City
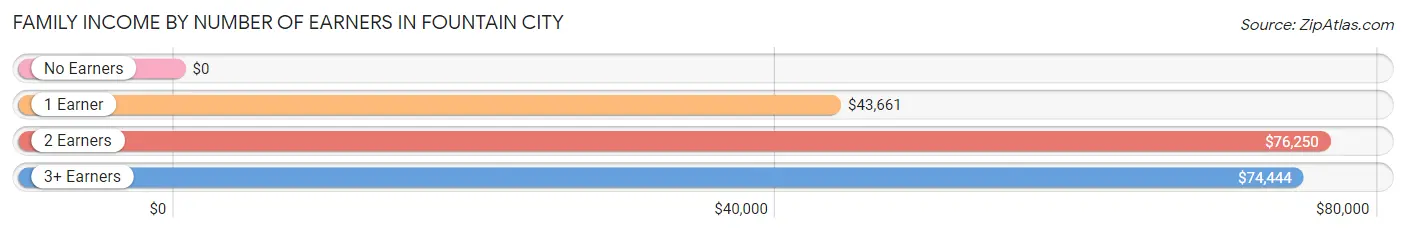
| Number of Earners | # Families | Median Income |
| No Earners | 28 (11.8%) | $0 |
| 1 Earner | 116 (48.9%) | $43,661 |
| 2 Earners | 79 (33.3%) | $76,250 |
| 3+ Earners | 14 (5.9%) | $74,444 |
| Total | 237 (100.0%) | $48,295 |
Household Income in Fountain City
Household Income Brackets in Fountain City
With 83 households falling in the category, the $35,000 to $49,999 income range is the most frequent in Fountain City, accounting for 24.1% of all households.
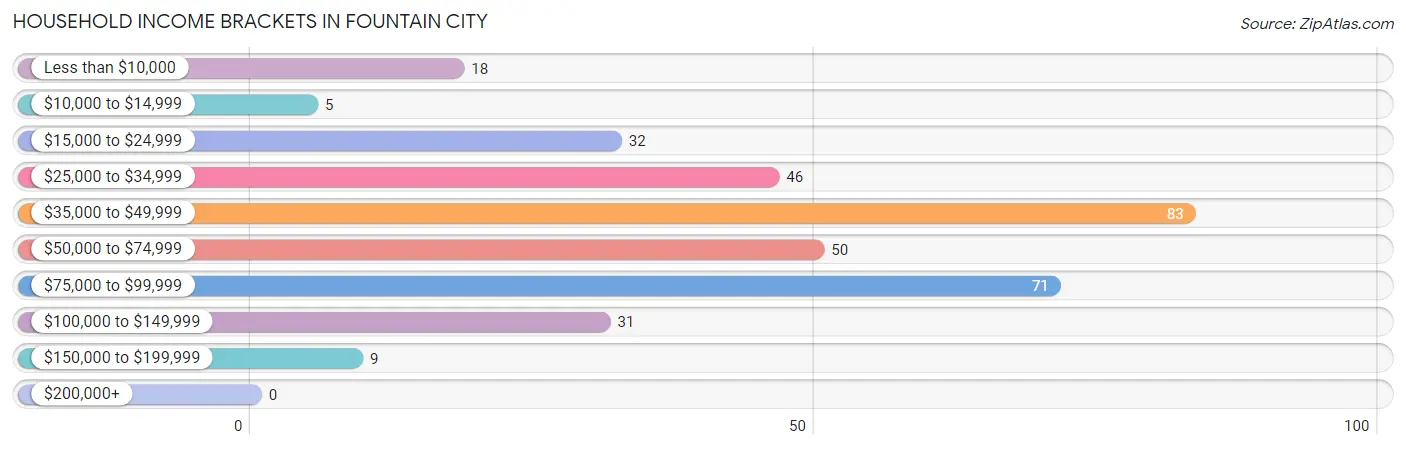
| Income Bracket | # Households | % Households |
| Less than $10,000 | 18 | 5.2% |
| $10,000 to $14,999 | 5 | 1.4% |
| $15,000 to $24,999 | 32 | 9.3% |
| $25,000 to $34,999 | 46 | 13.3% |
| $35,000 to $49,999 | 83 | 24.1% |
| $50,000 to $74,999 | 50 | 14.5% |
| $75,000 to $99,999 | 71 | 20.6% |
| $100,000 to $149,999 | 31 | 9.0% |
| $150,000 to $199,999 | 9 | 2.6% |
| $200,000+ | 0 | 0.0% |
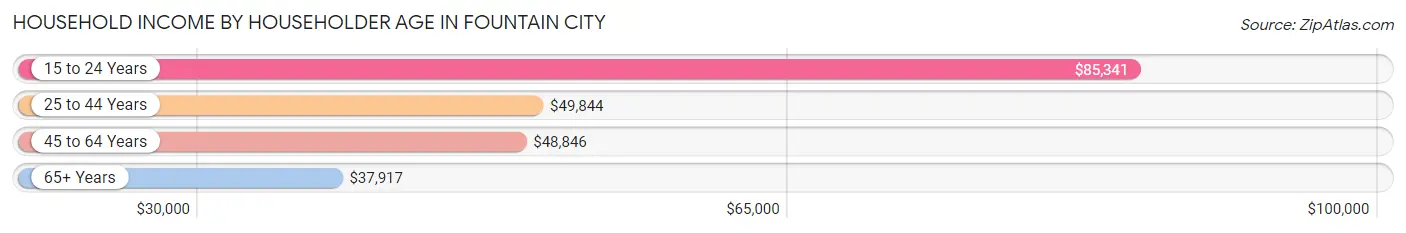
Household Income by Householder Age in Fountain City
The median household income in Fountain City is $48,802, with the highest median household income of $85,341 found in the 15 to 24 years age bracket for the primary householder. A total of 19 households (5.5%) fall into this category. Meanwhile, the 65+ years age bracket for the primary householder has the lowest median household income of $37,917, with 71 households (20.6%) in this group.
| Income Bracket | # Households | Median Income |
| 15 to 24 Years | 19 (5.5%) | $85,341 |
| 25 to 44 Years | 121 (35.1%) | $49,844 |
| 45 to 64 Years | 134 (38.8%) | $48,846 |
| 65+ Years | 71 (20.6%) | $37,917 |
| Total | 345 (100.0%) | $48,802 |
Poverty in Fountain City
Income Below Poverty by Sex and Age in Fountain City
With 15.5% poverty level for males and 26.1% for females among the residents of Fountain City, 16 and 17 year old males and 12 to 14 year old females are the most vulnerable to poverty, with 4 males (100.0%) and 13 females (72.2%) in their respective age groups living below the poverty level.
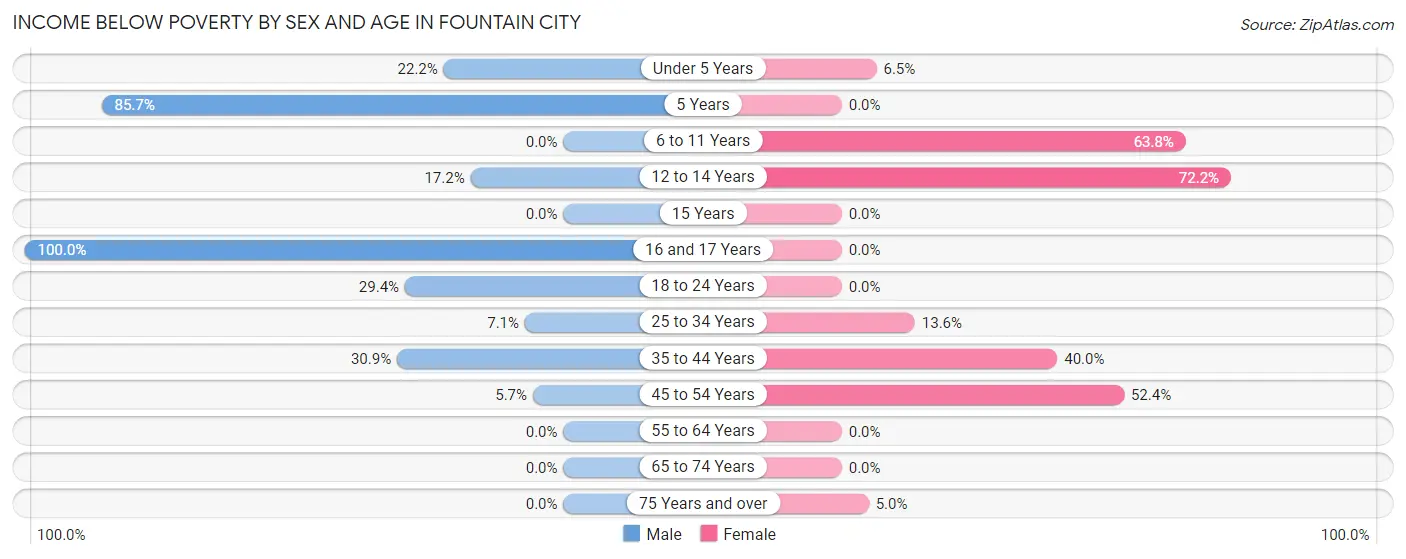
| Age Bracket | Male | Female |
| Under 5 Years | 6 (22.2%) | 2 (6.5%) |
| 5 Years | 6 (85.7%) | 0 (0.0%) |
| 6 to 11 Years | 0 (0.0%) | 30 (63.8%) |
| 12 to 14 Years | 5 (17.2%) | 13 (72.2%) |
| 15 Years | 0 (0.0%) | 0 (0.0%) |
| 16 and 17 Years | 4 (100.0%) | 0 (0.0%) |
| 18 to 24 Years | 10 (29.4%) | 0 (0.0%) |
| 25 to 34 Years | 3 (7.1%) | 8 (13.6%) |
| 35 to 44 Years | 21 (30.9%) | 16 (40.0%) |
| 45 to 54 Years | 3 (5.7%) | 33 (52.4%) |
| 55 to 64 Years | 0 (0.0%) | 0 (0.0%) |
| 65 to 74 Years | 0 (0.0%) | 0 (0.0%) |
| 75 Years and over | 0 (0.0%) | 2 (5.0%) |
| Total | 58 (15.5%) | 104 (26.1%) |
Income Above Poverty by Sex and Age in Fountain City
According to the poverty statistics in Fountain City, males aged 6 to 11 years and females aged 15 years are the age groups that are most secure financially, with 100.0% of males and 100.0% of females in these age groups living above the poverty line.
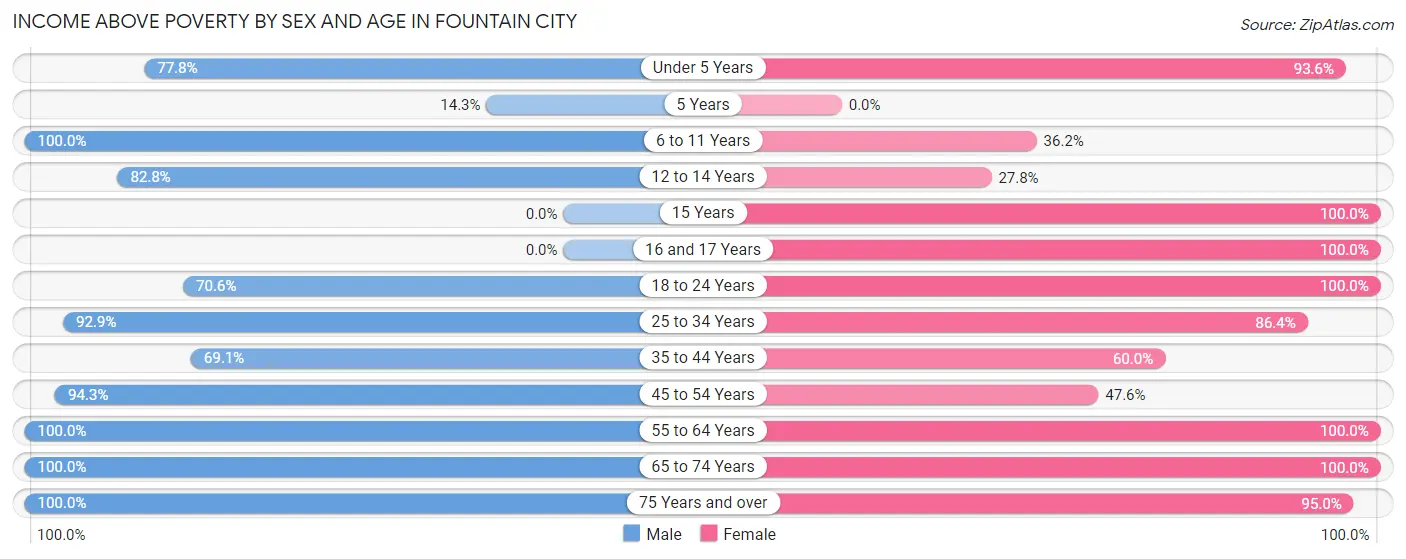
| Age Bracket | Male | Female |
| Under 5 Years | 21 (77.8%) | 29 (93.5%) |
| 5 Years | 1 (14.3%) | 0 (0.0%) |
| 6 to 11 Years | 17 (100.0%) | 17 (36.2%) |
| 12 to 14 Years | 24 (82.8%) | 5 (27.8%) |
| 15 Years | 0 (0.0%) | 3 (100.0%) |
| 16 and 17 Years | 0 (0.0%) | 11 (100.0%) |
| 18 to 24 Years | 24 (70.6%) | 11 (100.0%) |
| 25 to 34 Years | 39 (92.9%) | 51 (86.4%) |
| 35 to 44 Years | 47 (69.1%) | 24 (60.0%) |
| 45 to 54 Years | 50 (94.3%) | 30 (47.6%) |
| 55 to 64 Years | 45 (100.0%) | 47 (100.0%) |
| 65 to 74 Years | 31 (100.0%) | 29 (100.0%) |
| 75 Years and over | 17 (100.0%) | 38 (95.0%) |
| Total | 316 (84.5%) | 295 (73.9%) |
Income Below Poverty Among Married-Couple Families in Fountain City
The poverty statistics for married-couple families in Fountain City show that 5.1% or 6 of the total 118 families live below the poverty line. Families with 3 or 4 children have the highest poverty rate of 37.5%, comprising of 3 families. On the other hand, families with no children have the lowest poverty rate of 0.0%, which includes 0 families.
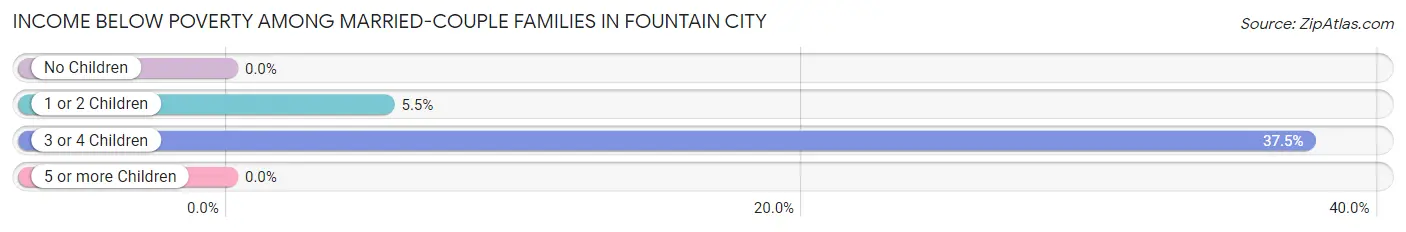
| Children | Above Poverty | Below Poverty |
| No Children | 55 (100.0%) | 0 (0.0%) |
| 1 or 2 Children | 52 (94.6%) | 3 (5.4%) |
| 3 or 4 Children | 5 (62.5%) | 3 (37.5%) |
| 5 or more Children | 0 (0.0%) | 0 (0.0%) |
| Total | 112 (94.9%) | 6 (5.1%) |
Income Below Poverty Among Single-Parent Households in Fountain City
According to the poverty data in Fountain City, 47.2% or 17 single-father households and 36.1% or 30 single-mother households are living below the poverty line. Among single-father households, those with 1 or 2 children have the highest poverty rate, with 17 households (58.6%) experiencing poverty. Likewise, among single-mother households, those with 1 or 2 children have the highest poverty rate, with 19 households (46.3%) falling below the poverty line.
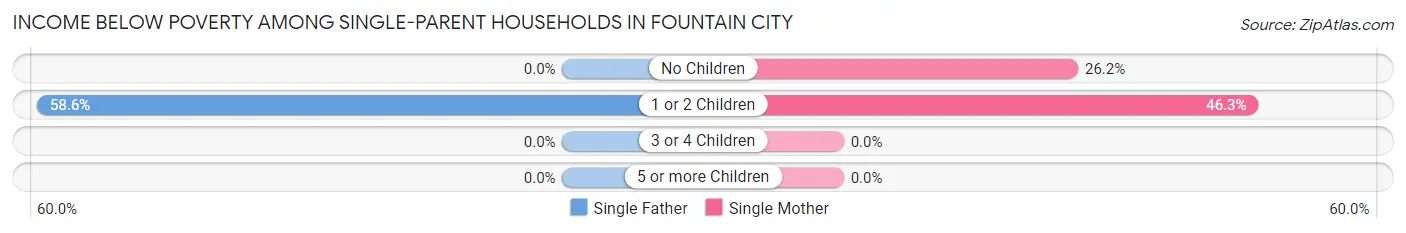
| Children | Single Father | Single Mother |
| No Children | 0 (0.0%) | 11 (26.2%) |
| 1 or 2 Children | 17 (58.6%) | 19 (46.3%) |
| 3 or 4 Children | 0 (0.0%) | 0 (0.0%) |
| 5 or more Children | 0 (0.0%) | 0 (0.0%) |
| Total | 17 (47.2%) | 30 (36.1%) |
Income Below Poverty Among Married-Couple vs Single-Parent Households in Fountain City
The poverty data for Fountain City shows that 6 of the married-couple family households (5.1%) and 47 of the single-parent households (39.5%) are living below the poverty level. Within the married-couple family households, those with 3 or 4 children have the highest poverty rate, with 3 households (37.5%) falling below the poverty line. Among the single-parent households, those with 1 or 2 children have the highest poverty rate, with 36 household (51.4%) living below poverty.
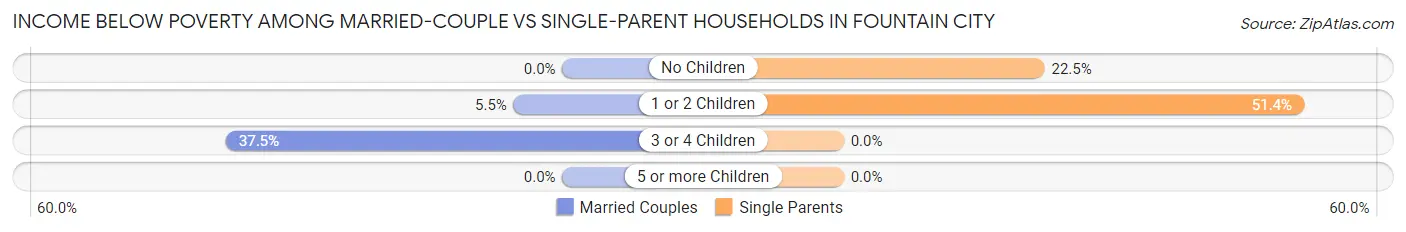
| Children | Married-Couple Families | Single-Parent Households |
| No Children | 0 (0.0%) | 11 (22.5%) |
| 1 or 2 Children | 3 (5.4%) | 36 (51.4%) |
| 3 or 4 Children | 3 (37.5%) | 0 (0.0%) |
| 5 or more Children | 0 (0.0%) | 0 (0.0%) |
| Total | 6 (5.1%) | 47 (39.5%) |
Race in Fountain City
The most populous races in Fountain City are White / Caucasian (759 | 98.2%), Hispanic or Latino (10 | 1.3%), and Two or more Races (10 | 1.3%).
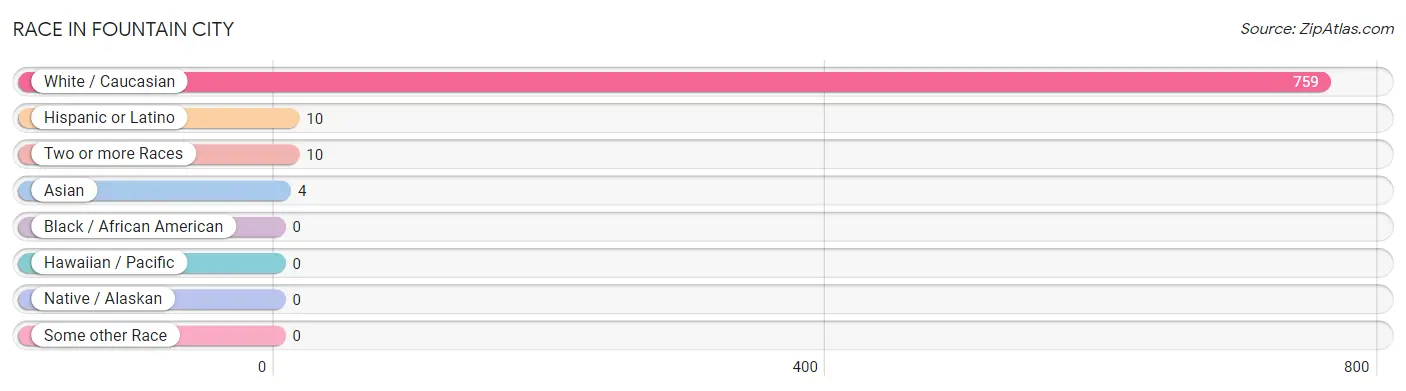
| Race | # Population | % Population |
| Asian | 4 | 0.5% |
| Black / African American | 0 | 0.0% |
| Hawaiian / Pacific | 0 | 0.0% |
| Hispanic or Latino | 10 | 1.3% |
| Native / Alaskan | 0 | 0.0% |
| White / Caucasian | 759 | 98.2% |
| Two or more Races | 10 | 1.3% |
| Some other Race | 0 | 0.0% |
| Total | 773 | 100.0% |
Ancestry in Fountain City
The most populous ancestries reported in Fountain City are German (180 | 23.3%), Irish (124 | 16.0%), American (113 | 14.6%), English (102 | 13.2%), and Italian (16 | 2.1%), together accounting for 69.2% of all Fountain City residents.
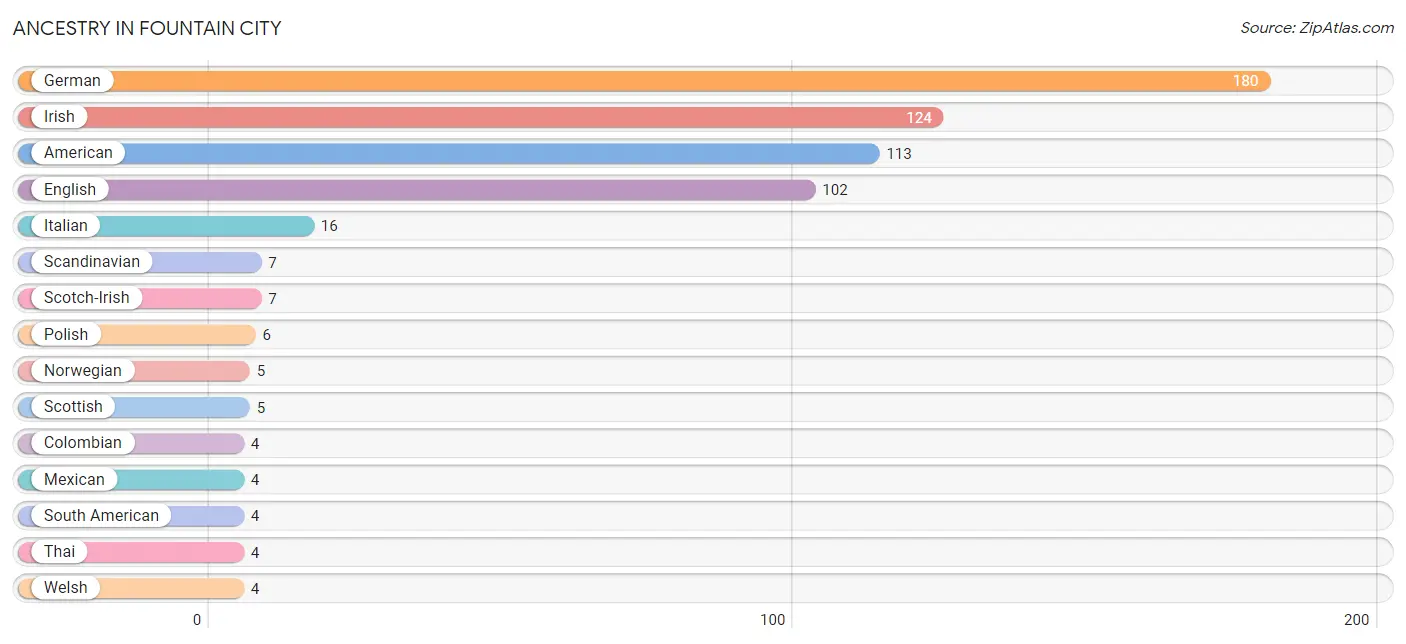
| Ancestry | # Population | % Population |
| American | 113 | 14.6% |
| British | 3 | 0.4% |
| Cherokee | 1 | 0.1% |
| Colombian | 4 | 0.5% |
| Czech | 2 | 0.3% |
| Dutch | 3 | 0.4% |
| English | 102 | 13.2% |
| French | 3 | 0.4% |
| German | 180 | 23.3% |
| Hungarian | 3 | 0.4% |
| Irish | 124 | 16.0% |
| Italian | 16 | 2.1% |
| Mexican | 4 | 0.5% |
| Norwegian | 5 | 0.6% |
| Polish | 6 | 0.8% |
| Puerto Rican | 2 | 0.3% |
| Scandinavian | 7 | 0.9% |
| Scotch-Irish | 7 | 0.9% |
| Scottish | 5 | 0.6% |
| South American | 4 | 0.5% |
| Swedish | 2 | 0.3% |
| Thai | 4 | 0.5% |
| Welsh | 4 | 0.5% | View All 23 Rows |
Immigrants in Fountain City
The most numerous immigrant groups reported in Fountain City came from Asia (1 | 0.1%), Central America (1 | 0.1%), India (1 | 0.1%), Latin America (1 | 0.1%), and Panama (1 | 0.1%), together accounting for 0.6% of all Fountain City residents.
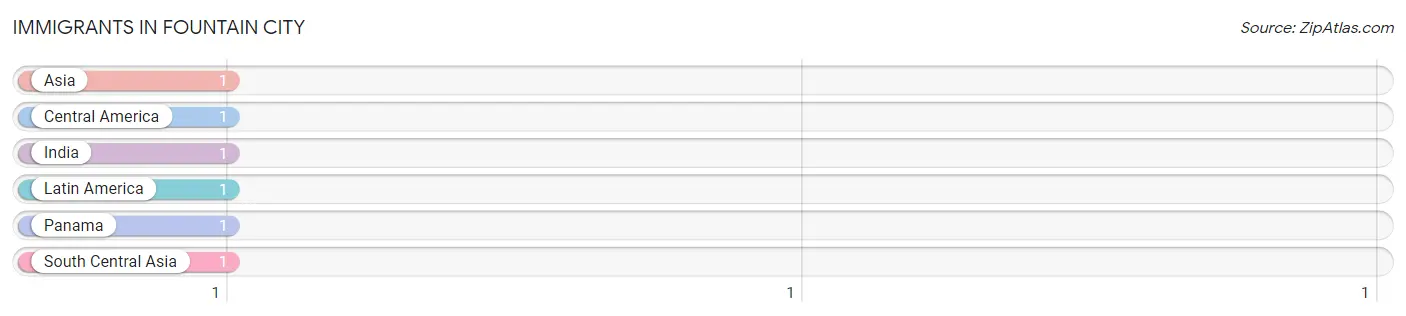
| Immigration Origin | # Population | % Population |
| Asia | 1 | 0.1% |
| Central America | 1 | 0.1% |
| India | 1 | 0.1% |
| Latin America | 1 | 0.1% |
| Panama | 1 | 0.1% |
| South Central Asia | 1 | 0.1% | View All 6 Rows |
Sex and Age in Fountain City
Sex and Age in Fountain City
The most populous age groups in Fountain City are 10 to 14 Years (43 | 11.5%) for men and 10 to 14 Years (39 | 9.8%) for women.
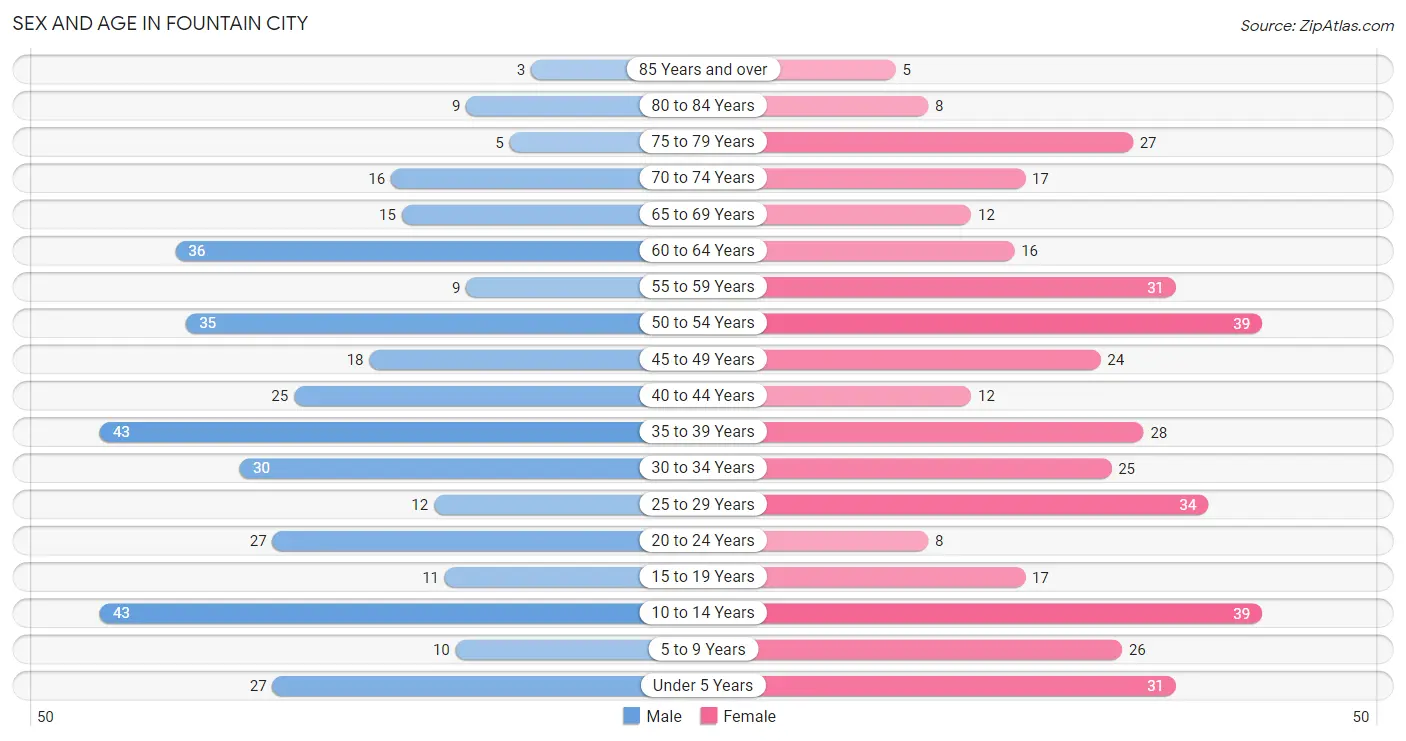
| Age Bracket | Male | Female |
| Under 5 Years | 27 (7.2%) | 31 (7.8%) |
| 5 to 9 Years | 10 (2.7%) | 26 (6.5%) |
| 10 to 14 Years | 43 (11.5%) | 39 (9.8%) |
| 15 to 19 Years | 11 (2.9%) | 17 (4.3%) |
| 20 to 24 Years | 27 (7.2%) | 8 (2.0%) |
| 25 to 29 Years | 12 (3.2%) | 34 (8.5%) |
| 30 to 34 Years | 30 (8.0%) | 25 (6.3%) |
| 35 to 39 Years | 43 (11.5%) | 28 (7.0%) |
| 40 to 44 Years | 25 (6.7%) | 12 (3.0%) |
| 45 to 49 Years | 18 (4.8%) | 24 (6.0%) |
| 50 to 54 Years | 35 (9.4%) | 39 (9.8%) |
| 55 to 59 Years | 9 (2.4%) | 31 (7.8%) |
| 60 to 64 Years | 36 (9.6%) | 16 (4.0%) |
| 65 to 69 Years | 15 (4.0%) | 12 (3.0%) |
| 70 to 74 Years | 16 (4.3%) | 17 (4.3%) |
| 75 to 79 Years | 5 (1.3%) | 27 (6.8%) |
| 80 to 84 Years | 9 (2.4%) | 8 (2.0%) |
| 85 Years and over | 3 (0.8%) | 5 (1.3%) |
| Total | 374 (100.0%) | 399 (100.0%) |
Families and Households in Fountain City
Median Family Size in Fountain City
The median family size in Fountain City is 2.56 persons per family, with married-couple families (118 | 49.8%) accounting for the largest median family size of 3.08 persons per family. On the other hand, single female/mother families (83 | 35.0%) represent the smallest median family size with 1.99 persons per family.
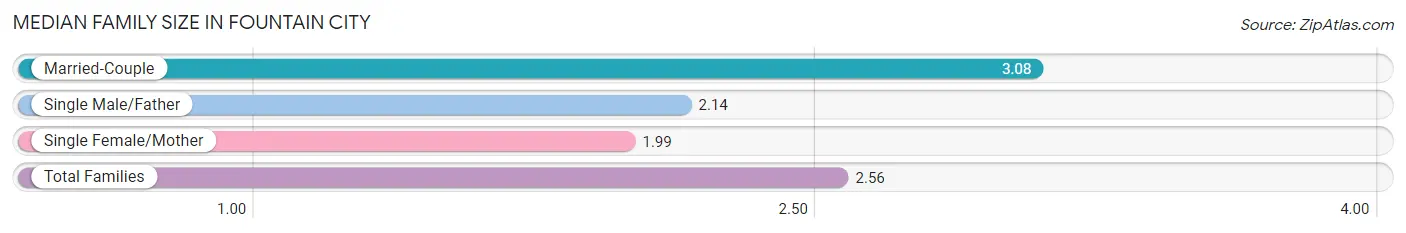
| Family Type | # Families | Family Size |
| Married-Couple | 118 (49.8%) | 3.08 |
| Single Male/Father | 36 (15.2%) | 2.14 |
| Single Female/Mother | 83 (35.0%) | 1.99 |
| Total Families | 237 (100.0%) | 2.56 |
Median Household Size in Fountain City
The median household size in Fountain City is 2.24 persons per household, with married-couple households (118 | 34.2%) accounting for the largest median household size of 3.13 persons per household. non-family households (108 | 31.3%) represent the smallest median household size with 1.14 persons per household.
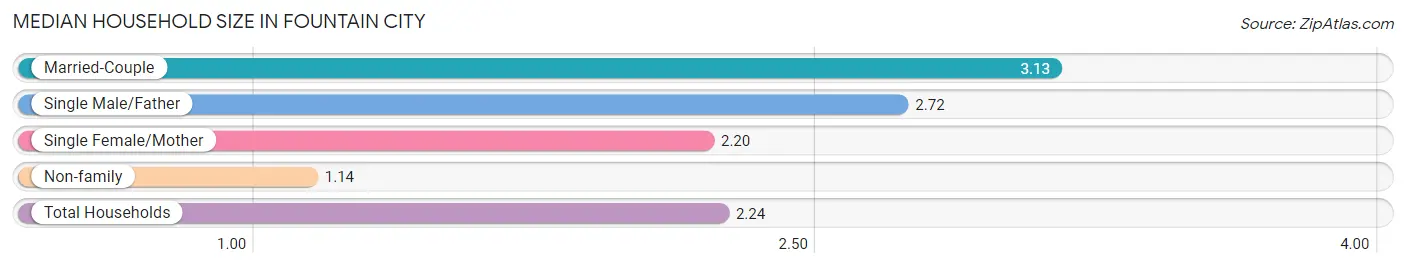
| Household Type | # Households | Household Size |
| Married-Couple | 118 (34.2%) | 3.13 |
| Single Male/Father | 36 (10.4%) | 2.72 |
| Single Female/Mother | 83 (24.1%) | 2.20 |
| Non-family | 108 (31.3%) | 1.14 |
| Total Households | 345 (100.0%) | 2.24 |
Household Size by Marriage Status in Fountain City
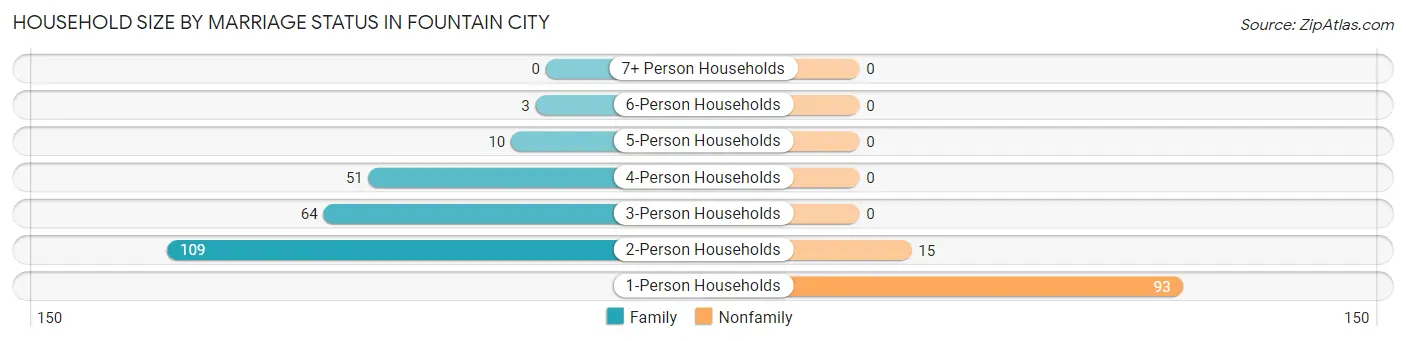
Out of a total of 345 households in Fountain City, 237 (68.7%) are family households, while 108 (31.3%) are nonfamily households. The most numerous type of family households are 2-person households, comprising 109, and the most common type of nonfamily households are 1-person households, comprising 93.
| Household Size | Family Households | Nonfamily Households |
| 1-Person Households | - | 93 (27.0%) |
| 2-Person Households | 109 (31.6%) | 15 (4.3%) |
| 3-Person Households | 64 (18.5%) | 0 (0.0%) |
| 4-Person Households | 51 (14.8%) | 0 (0.0%) |
| 5-Person Households | 10 (2.9%) | 0 (0.0%) |
| 6-Person Households | 3 (0.9%) | 0 (0.0%) |
| 7+ Person Households | 0 (0.0%) | 0 (0.0%) |
| Total | 237 (68.7%) | 108 (31.3%) |
Female Fertility in Fountain City
Fertility by Age in Fountain City
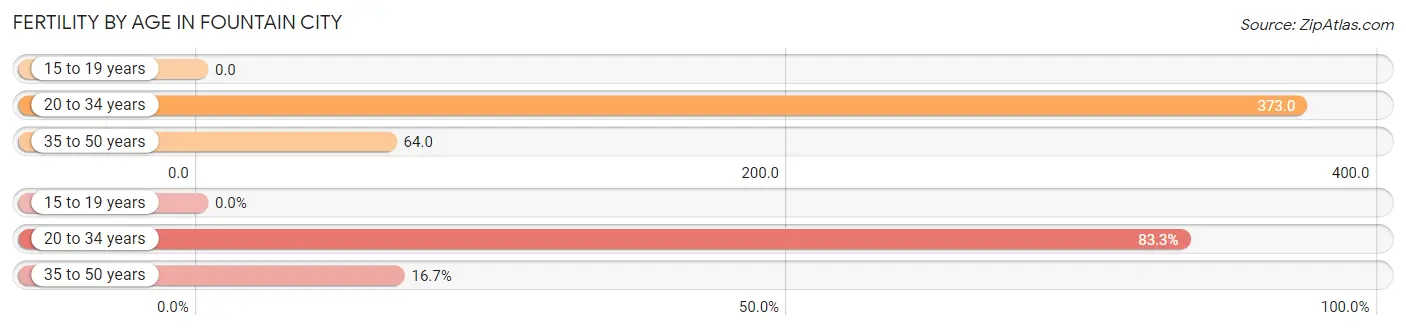
Average fertility rate in Fountain City is 185.0 births per 1,000 women. Women in the age bracket of 20 to 34 years have the highest fertility rate with 373.0 births per 1,000 women. Women in the age bracket of 20 to 34 years acount for 83.3% of all women with births.
| Age Bracket | Women with Births | Births / 1,000 Women |
| 15 to 19 years | 0 (0.0%) | 0.0 |
| 20 to 34 years | 25 (83.3%) | 373.0 |
| 35 to 50 years | 5 (16.7%) | 64.0 |
| Total | 30 (100.0%) | 185.0 |
Fertility by Age by Marriage Status in Fountain City
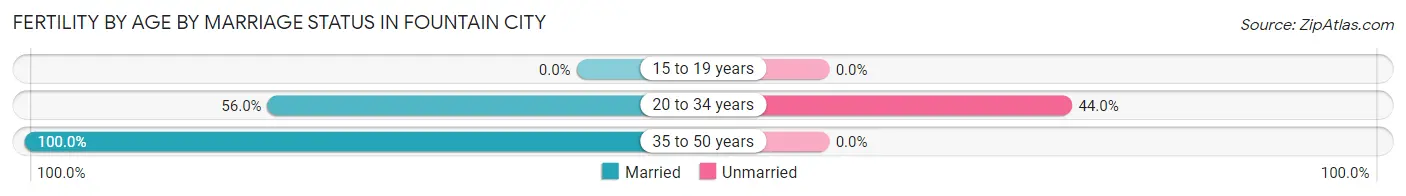
63.3% of women with births (30) in Fountain City are married. The highest percentage of unmarried women with births falls into 20 to 34 years age bracket with 44.0% of them unmarried at the time of birth, while the lowest percentage of unmarried women with births belong to 35 to 50 years age bracket with 0.0% of them unmarried.
| Age Bracket | Married | Unmarried |
| 15 to 19 years | 0 (0.0%) | 0 (0.0%) |
| 20 to 34 years | 14 (56.0%) | 11 (44.0%) |
| 35 to 50 years | 5 (100.0%) | 0 (0.0%) |
| Total | 19 (63.3%) | 11 (36.7%) |
Fertility by Education in Fountain City
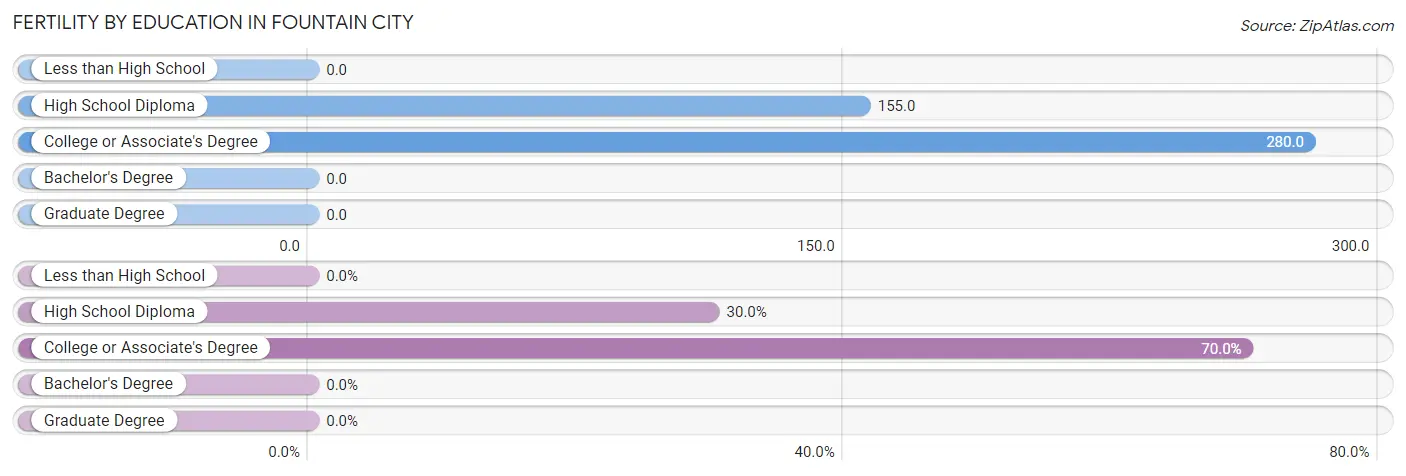
| Educational Attainment | Women with Births | Births / 1,000 Women |
| Less than High School | 0 (0.0%) | 0.0 |
| High School Diploma | 9 (30.0%) | 155.0 |
| College or Associate's Degree | 21 (70.0%) | 280.0 |
| Bachelor's Degree | 0 (0.0%) | 0.0 |
| Graduate Degree | 0 (0.0%) | 0.0 |
| Total | 30 (100.0%) | 185.0 |
Fertility by Education by Marriage Status in Fountain City
36.7% of women with births in Fountain City are unmarried. Women with the educational attainment of high school diploma are most likely to be married with 100.0% of them married at childbirth, while women with the educational attainment of college or associate's degree are least likely to be married with 52.4% of them unmarried at childbirth.
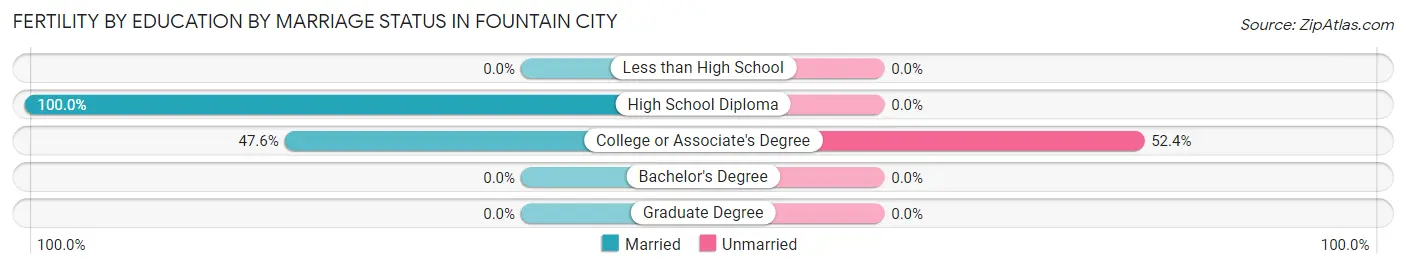
| Educational Attainment | Married | Unmarried |
| Less than High School | 0 (0.0%) | 0 (0.0%) |
| High School Diploma | 9 (100.0%) | 0 (0.0%) |
| College or Associate's Degree | 10 (47.6%) | 11 (52.4%) |
| Bachelor's Degree | 0 (0.0%) | 0 (0.0%) |
| Graduate Degree | 0 (0.0%) | 0 (0.0%) |
| Total | 19 (63.3%) | 11 (36.7%) |
Employment Characteristics in Fountain City
Employment by Class of Employer in Fountain City
Among the 374 employed individuals in Fountain City, private company employees (247 | 66.0%), not-for-profit organizations (56 | 15.0%), and self-employed (not incorporated) (30 | 8.0%) make up the most common classes of employment.
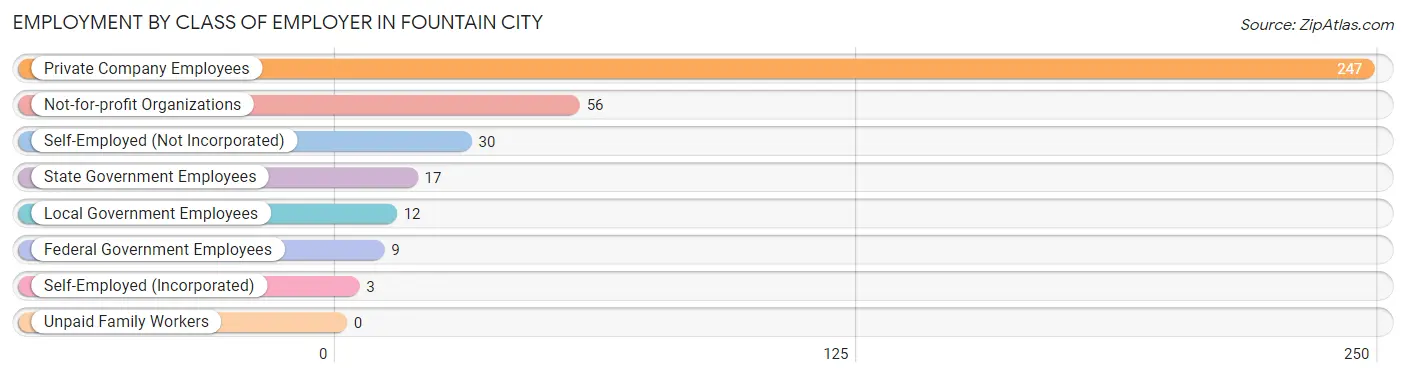
| Employer Class | # Employees | % Employees |
| Private Company Employees | 247 | 66.0% |
| Self-Employed (Incorporated) | 3 | 0.8% |
| Self-Employed (Not Incorporated) | 30 | 8.0% |
| Not-for-profit Organizations | 56 | 15.0% |
| Local Government Employees | 12 | 3.2% |
| State Government Employees | 17 | 4.5% |
| Federal Government Employees | 9 | 2.4% |
| Unpaid Family Workers | 0 | 0.0% |
| Total | 374 | 100.0% |
Employment Status by Age in Fountain City
According to the labor force statistics for Fountain City, out of the total population over 16 years of age (594), 66.5% or 395 individuals are in the labor force, with 3.0% or 12 of them unemployed. The age group with the highest labor force participation rate is 55 to 59 years, with 95.0% or 38 individuals in the labor force. Within the labor force, the 65 to 74 years age range has the highest percentage of unemployed individuals, with 16.7% or 2 of them being unemployed.
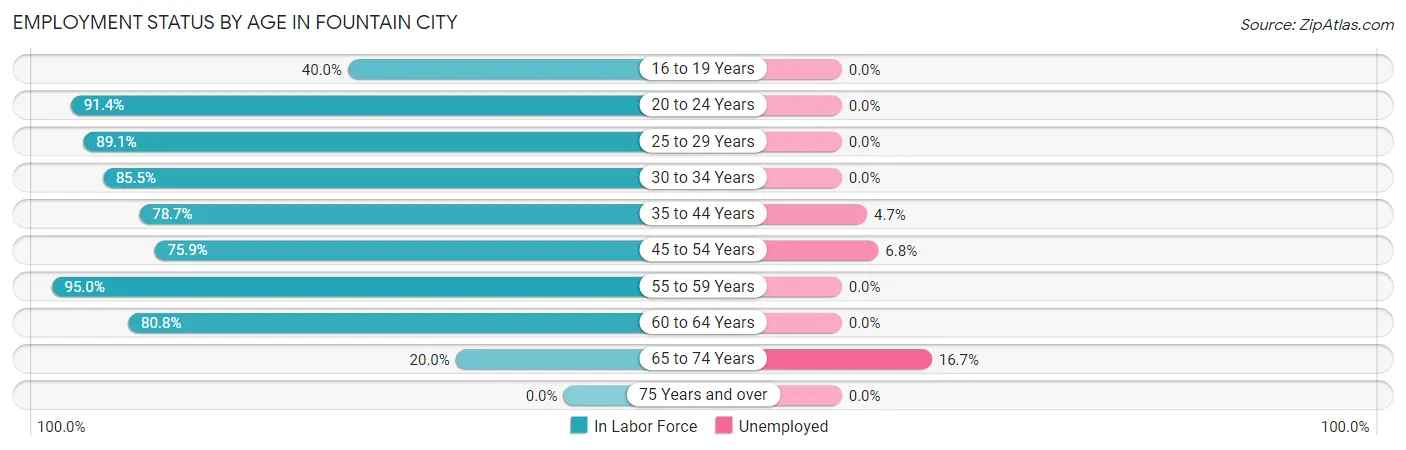
| Age Bracket | In Labor Force | Unemployed |
| 16 to 19 Years | 10 (40.0%) | 0 (0.0%) |
| 20 to 24 Years | 32 (91.4%) | 0 (0.0%) |
| 25 to 29 Years | 41 (89.1%) | 0 (0.0%) |
| 30 to 34 Years | 47 (85.5%) | 0 (0.0%) |
| 35 to 44 Years | 85 (78.7%) | 4 (4.7%) |
| 45 to 54 Years | 88 (75.9%) | 6 (6.8%) |
| 55 to 59 Years | 38 (95.0%) | 0 (0.0%) |
| 60 to 64 Years | 42 (80.8%) | 0 (0.0%) |
| 65 to 74 Years | 12 (20.0%) | 2 (16.7%) |
| 75 Years and over | 0 (0.0%) | 0 (0.0%) |
| Total | 395 (66.5%) | 12 (3.0%) |
Employment Status by Educational Attainment in Fountain City
According to labor force statistics for Fountain City, 81.8% of individuals (341) out of the total population between 25 and 64 years of age (417) are in the labor force, with 2.9% or 10 of them being unemployed. The group with the highest labor force participation rate are those with the educational attainment of bachelor's degree or higher, with 94.3% or 50 individuals in the labor force. Within the labor force, individuals with college / associate degree education have the highest percentage of unemployment, with 6.4% or 7 of them being unemployed.
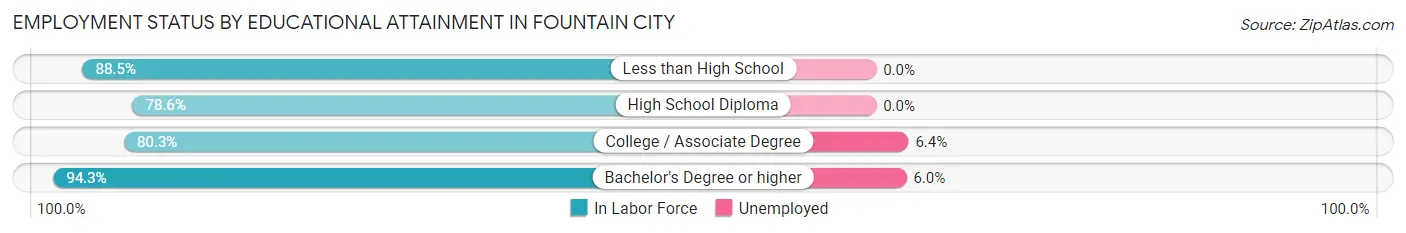
| Educational Attainment | In Labor Force | Unemployed |
| Less than High School | 23 (88.5%) | 0 (0.0%) |
| High School Diploma | 158 (78.6%) | 0 (0.0%) |
| College / Associate Degree | 110 (80.3%) | 9 (6.4%) |
| Bachelor's Degree or higher | 50 (94.3%) | 3 (6.0%) |
| Total | 341 (81.8%) | 12 (2.9%) |
Employment Occupations by Sex in Fountain City
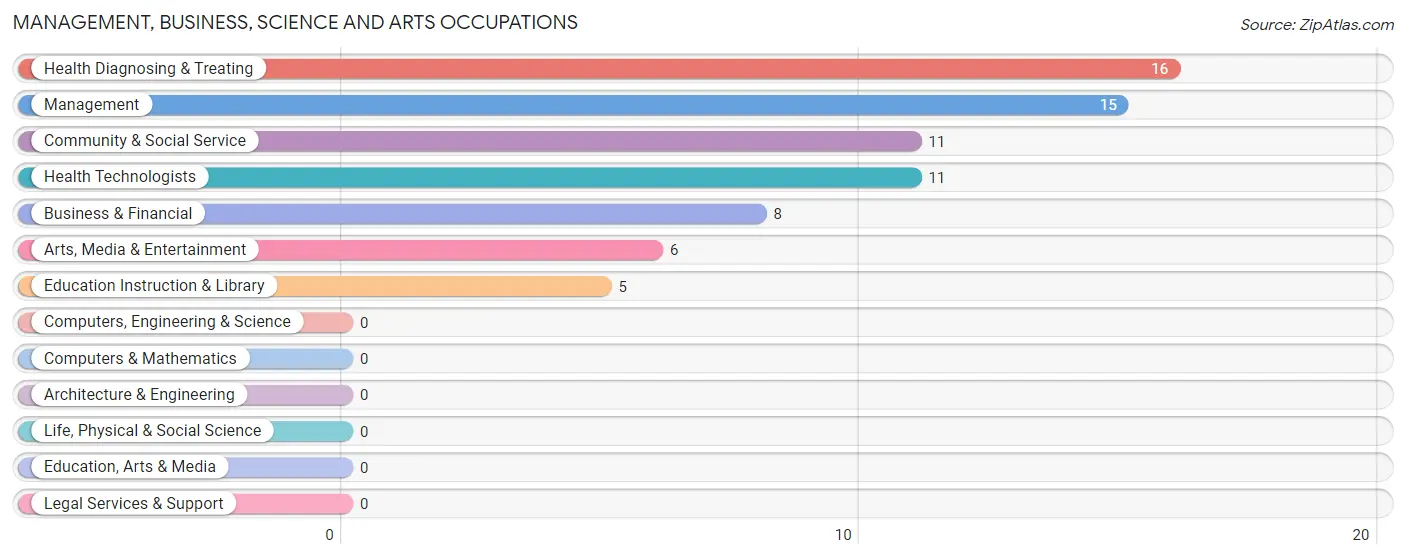
Management, Business, Science and Arts Occupations
The most common Management, Business, Science and Arts occupations in Fountain City are Health Diagnosing & Treating (16 | 4.2%), Management (15 | 3.9%), Community & Social Service (11 | 2.9%), Health Technologists (11 | 2.9%), and Business & Financial (8 | 2.1%).
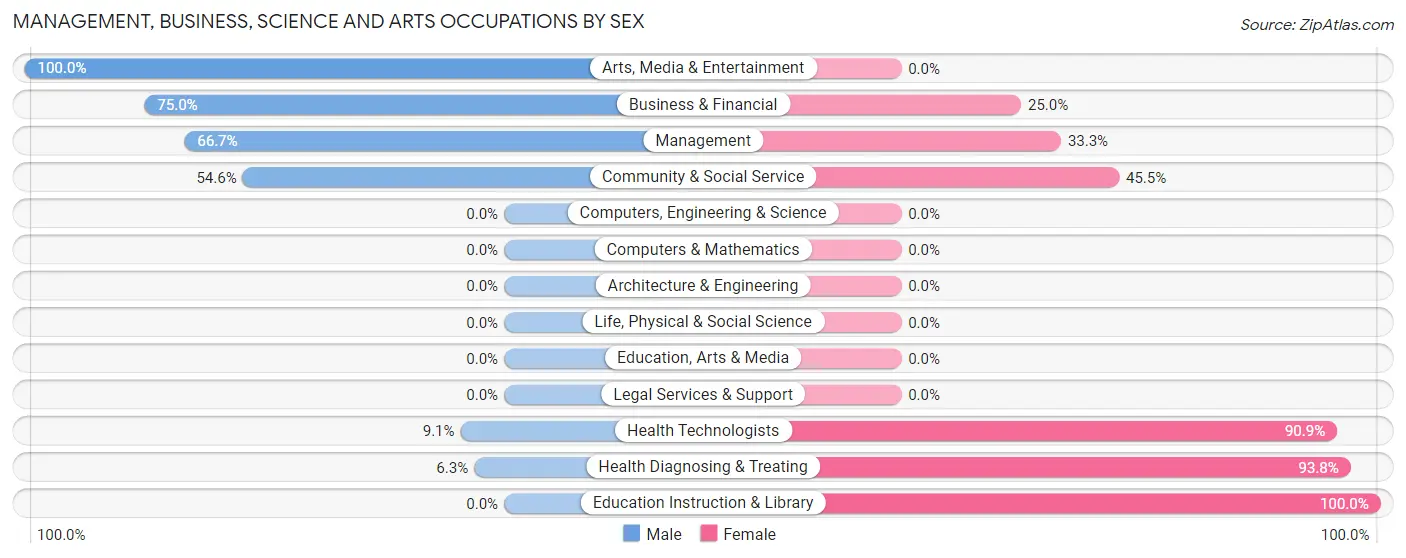
Management, Business, Science and Arts Occupations by Sex
Within the Management, Business, Science and Arts occupations in Fountain City, the most male-oriented occupations are Arts, Media & Entertainment (100.0%), Business & Financial (75.0%), and Management (66.7%), while the most female-oriented occupations are Education Instruction & Library (100.0%), Health Diagnosing & Treating (93.8%), and Health Technologists (90.9%).
| Occupation | Male | Female |
| Management | 10 (66.7%) | 5 (33.3%) |
| Business & Financial | 6 (75.0%) | 2 (25.0%) |
| Computers, Engineering & Science | 0 (0.0%) | 0 (0.0%) |
| Computers & Mathematics | 0 (0.0%) | 0 (0.0%) |
| Architecture & Engineering | 0 (0.0%) | 0 (0.0%) |
| Life, Physical & Social Science | 0 (0.0%) | 0 (0.0%) |
| Community & Social Service | 6 (54.5%) | 5 (45.5%) |
| Education, Arts & Media | 0 (0.0%) | 0 (0.0%) |
| Legal Services & Support | 0 (0.0%) | 0 (0.0%) |
| Education Instruction & Library | 0 (0.0%) | 5 (100.0%) |
| Arts, Media & Entertainment | 6 (100.0%) | 0 (0.0%) |
| Health Diagnosing & Treating | 1 (6.2%) | 15 (93.8%) |
| Health Technologists | 1 (9.1%) | 10 (90.9%) |
| Total (Category) | 23 (46.0%) | 27 (54.0%) |
| Total (Overall) | 227 (59.3%) | 156 (40.7%) |
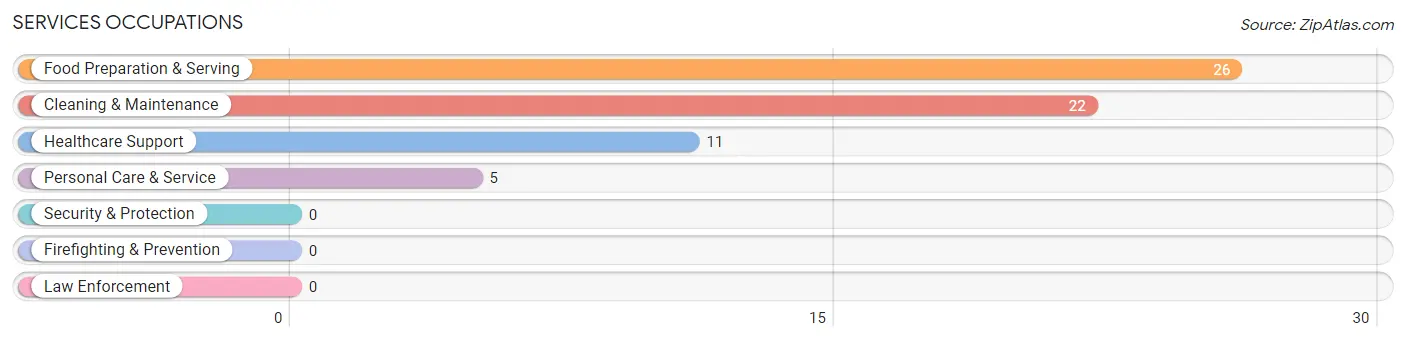
Services Occupations
The most common Services occupations in Fountain City are Food Preparation & Serving (26 | 6.8%), Cleaning & Maintenance (22 | 5.7%), Healthcare Support (11 | 2.9%), and Personal Care & Service (5 | 1.3%).
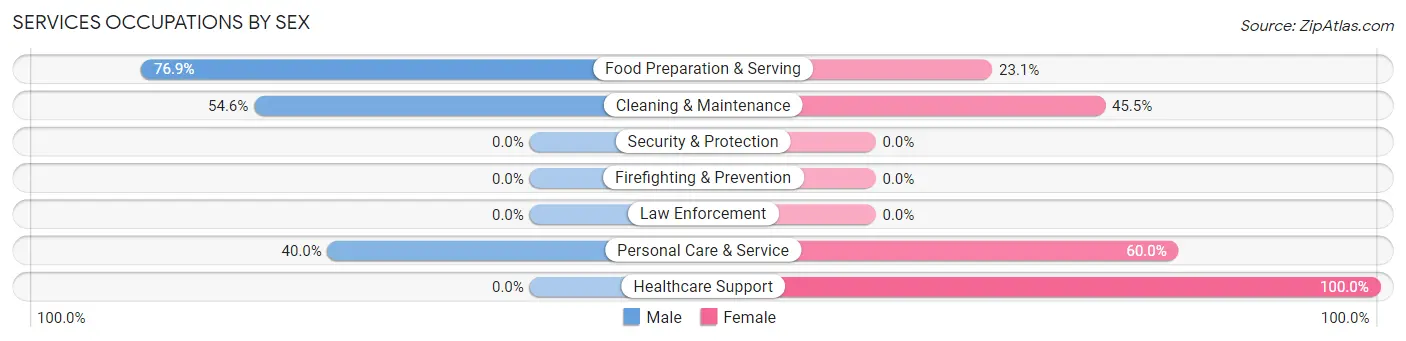
Services Occupations by Sex
Within the Services occupations in Fountain City, the most male-oriented occupations are Food Preparation & Serving (76.9%), Cleaning & Maintenance (54.5%), and Personal Care & Service (40.0%), while the most female-oriented occupations are Healthcare Support (100.0%), Personal Care & Service (60.0%), and Cleaning & Maintenance (45.5%).
| Occupation | Male | Female |
| Healthcare Support | 0 (0.0%) | 11 (100.0%) |
| Security & Protection | 0 (0.0%) | 0 (0.0%) |
| Firefighting & Prevention | 0 (0.0%) | 0 (0.0%) |
| Law Enforcement | 0 (0.0%) | 0 (0.0%) |
| Food Preparation & Serving | 20 (76.9%) | 6 (23.1%) |
| Cleaning & Maintenance | 12 (54.5%) | 10 (45.5%) |
| Personal Care & Service | 2 (40.0%) | 3 (60.0%) |
| Total (Category) | 34 (53.1%) | 30 (46.9%) |
| Total (Overall) | 227 (59.3%) | 156 (40.7%) |
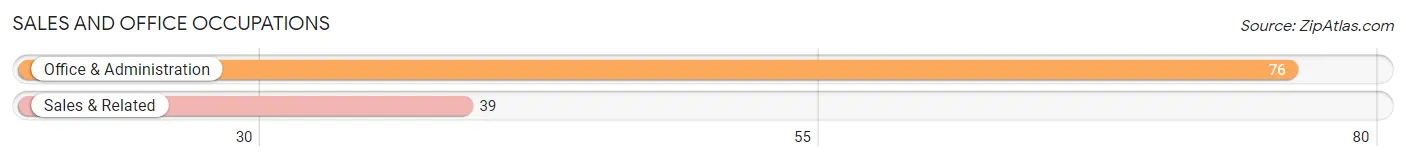
Sales and Office Occupations
The most common Sales and Office occupations in Fountain City are Office & Administration (76 | 19.8%), and Sales & Related (39 | 10.2%).
Sales and Office Occupations by Sex
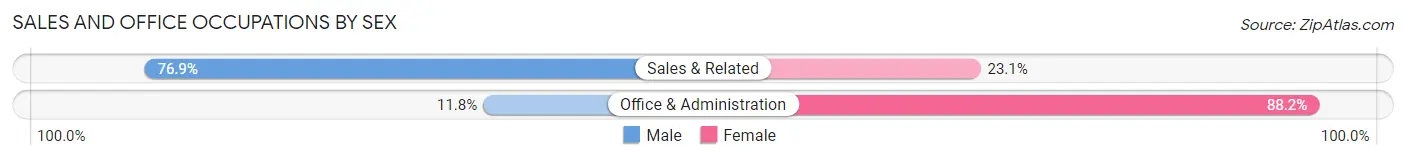
| Occupation | Male | Female |
| Sales & Related | 30 (76.9%) | 9 (23.1%) |
| Office & Administration | 9 (11.8%) | 67 (88.2%) |
| Total (Category) | 39 (33.9%) | 76 (66.1%) |
| Total (Overall) | 227 (59.3%) | 156 (40.7%) |
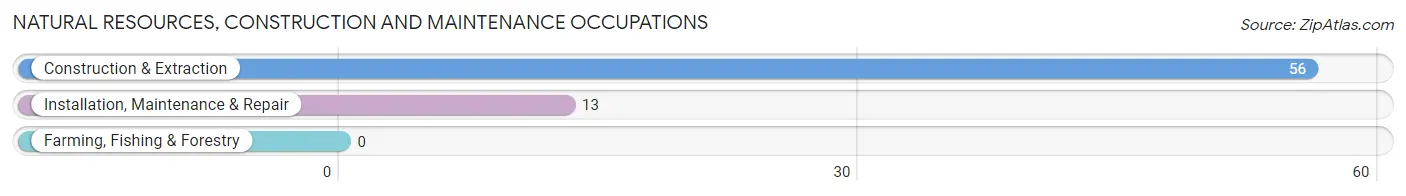
Natural Resources, Construction and Maintenance Occupations
The most common Natural Resources, Construction and Maintenance occupations in Fountain City are Construction & Extraction (56 | 14.6%), and Installation, Maintenance & Repair (13 | 3.4%).
Natural Resources, Construction and Maintenance Occupations by Sex
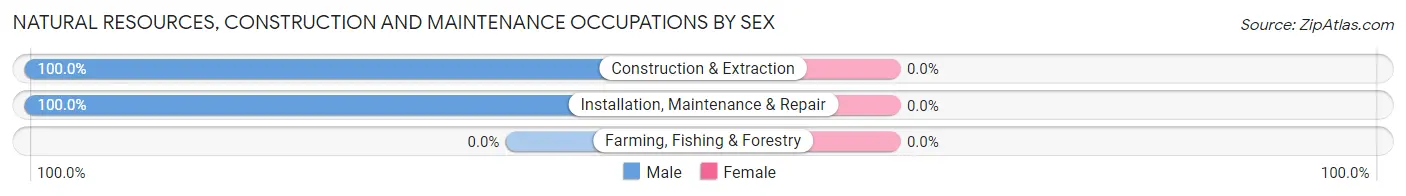
| Occupation | Male | Female |
| Farming, Fishing & Forestry | 0 (0.0%) | 0 (0.0%) |
| Construction & Extraction | 56 (100.0%) | 0 (0.0%) |
| Installation, Maintenance & Repair | 13 (100.0%) | 0 (0.0%) |
| Total (Category) | 69 (100.0%) | 0 (0.0%) |
| Total (Overall) | 227 (59.3%) | 156 (40.7%) |
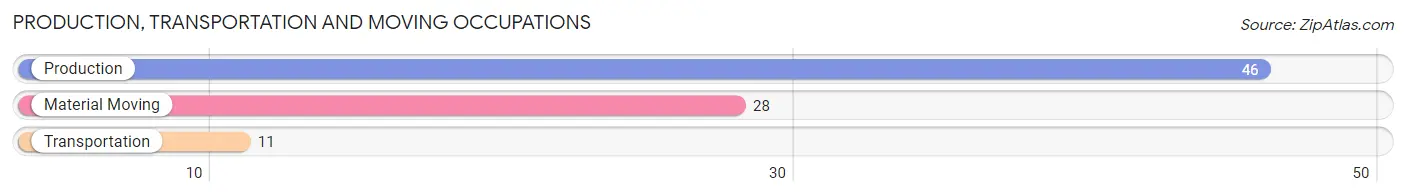
Production, Transportation and Moving Occupations
The most common Production, Transportation and Moving occupations in Fountain City are Production (46 | 12.0%), Material Moving (28 | 7.3%), and Transportation (11 | 2.9%).
Production, Transportation and Moving Occupations by Sex
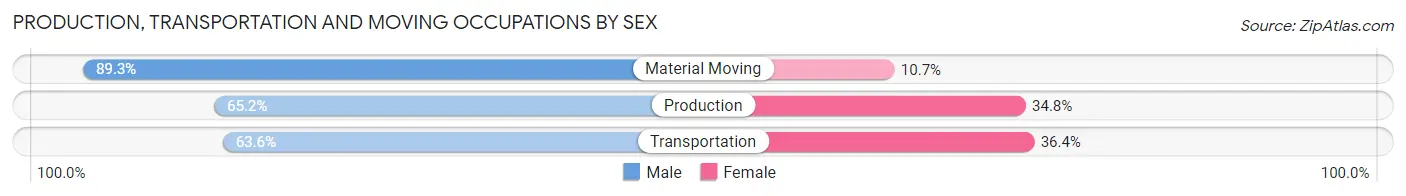
| Occupation | Male | Female |
| Production | 30 (65.2%) | 16 (34.8%) |
| Transportation | 7 (63.6%) | 4 (36.4%) |
| Material Moving | 25 (89.3%) | 3 (10.7%) |
| Total (Category) | 62 (72.9%) | 23 (27.1%) |
| Total (Overall) | 227 (59.3%) | 156 (40.7%) |
Employment Industries by Sex in Fountain City
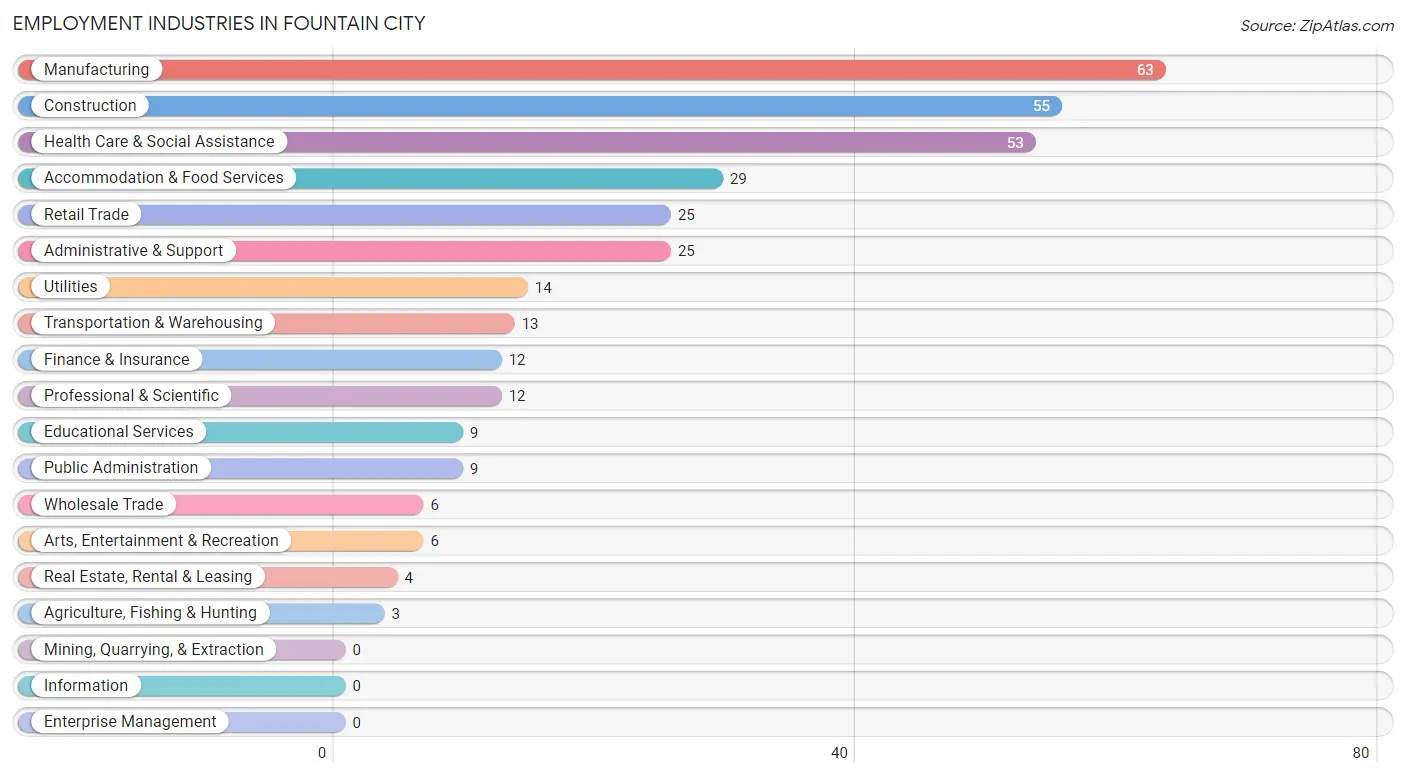
Employment Industries in Fountain City
The major employment industries in Fountain City include Manufacturing (63 | 16.5%), Construction (55 | 14.4%), Health Care & Social Assistance (53 | 13.8%), Accommodation & Food Services (29 | 7.6%), and Retail Trade (25 | 6.5%).
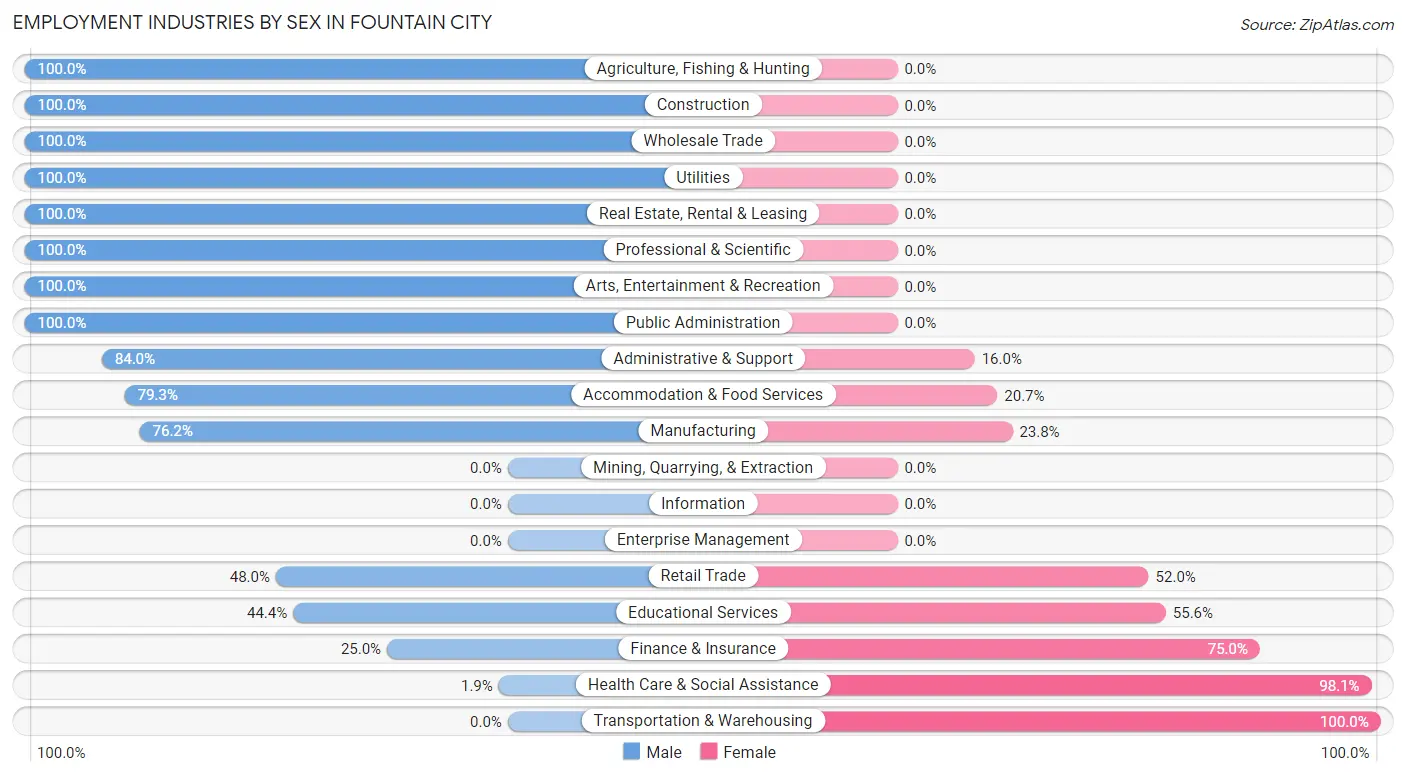
Employment Industries by Sex in Fountain City
The Fountain City industries that see more men than women are Agriculture, Fishing & Hunting (100.0%), Construction (100.0%), and Wholesale Trade (100.0%), whereas the industries that tend to have a higher number of women are Transportation & Warehousing (100.0%), Health Care & Social Assistance (98.1%), and Finance & Insurance (75.0%).
| Industry | Male | Female |
| Agriculture, Fishing & Hunting | 3 (100.0%) | 0 (0.0%) |
| Mining, Quarrying, & Extraction | 0 (0.0%) | 0 (0.0%) |
| Construction | 55 (100.0%) | 0 (0.0%) |
| Manufacturing | 48 (76.2%) | 15 (23.8%) |
| Wholesale Trade | 6 (100.0%) | 0 (0.0%) |
| Retail Trade | 12 (48.0%) | 13 (52.0%) |
| Transportation & Warehousing | 0 (0.0%) | 13 (100.0%) |
| Utilities | 14 (100.0%) | 0 (0.0%) |
| Information | 0 (0.0%) | 0 (0.0%) |
| Finance & Insurance | 3 (25.0%) | 9 (75.0%) |
| Real Estate, Rental & Leasing | 4 (100.0%) | 0 (0.0%) |
| Professional & Scientific | 12 (100.0%) | 0 (0.0%) |
| Enterprise Management | 0 (0.0%) | 0 (0.0%) |
| Administrative & Support | 21 (84.0%) | 4 (16.0%) |
| Educational Services | 4 (44.4%) | 5 (55.6%) |
| Health Care & Social Assistance | 1 (1.9%) | 52 (98.1%) |
| Arts, Entertainment & Recreation | 6 (100.0%) | 0 (0.0%) |
| Accommodation & Food Services | 23 (79.3%) | 6 (20.7%) |
| Public Administration | 9 (100.0%) | 0 (0.0%) |
| Total | 227 (59.3%) | 156 (40.7%) |
Education in Fountain City
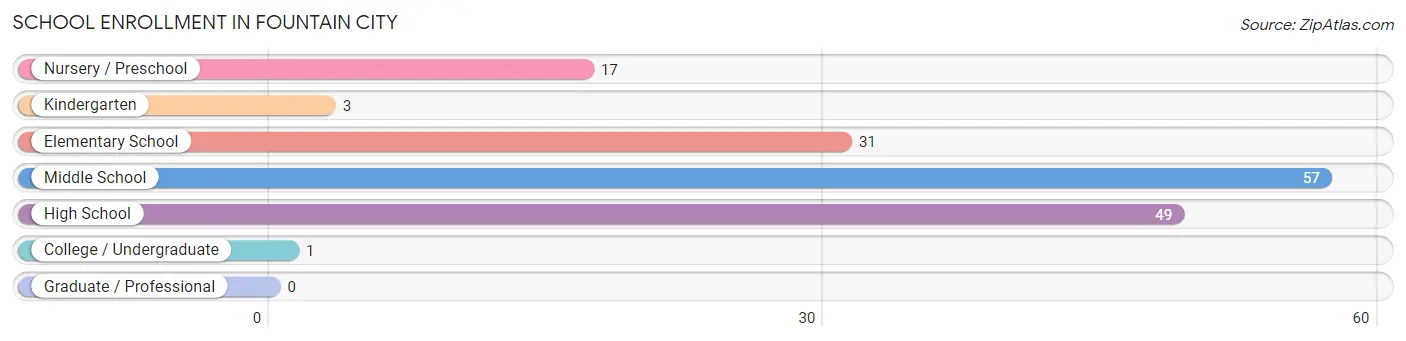
School Enrollment in Fountain City
The most common levels of schooling among the 158 students in Fountain City are middle school (57 | 36.1%), high school (49 | 31.0%), and elementary school (31 | 19.6%).
| School Level | # Students | % Students |
| Nursery / Preschool | 17 | 10.8% |
| Kindergarten | 3 | 1.9% |
| Elementary School | 31 | 19.6% |
| Middle School | 57 | 36.1% |
| High School | 49 | 31.0% |
| College / Undergraduate | 1 | 0.6% |
| Graduate / Professional | 0 | 0.0% |
| Total | 158 | 100.0% |
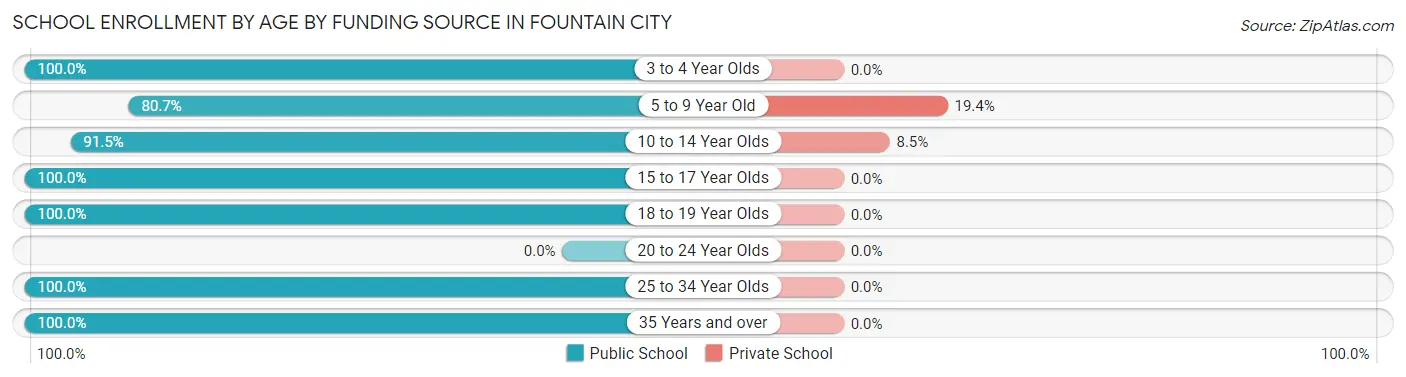
School Enrollment by Age by Funding Source in Fountain City
Out of a total of 158 students who are enrolled in schools in Fountain City, 13 (8.2%) attend a private institution, while the remaining 145 (91.8%) are enrolled in public schools. The age group of 5 to 9 year old has the highest likelihood of being enrolled in private schools, with 6 (19.4% in the age bracket) enrolled. Conversely, the age group of 3 to 4 year olds has the lowest likelihood of being enrolled in a private school, with 13 (100.0% in the age bracket) attending a public institution.
| Age Bracket | Public School | Private School |
| 3 to 4 Year Olds | 13 (100.0%) | 0 (0.0%) |
| 5 to 9 Year Old | 25 (80.6%) | 6 (19.4%) |
| 10 to 14 Year Olds | 75 (91.5%) | 7 (8.5%) |
| 15 to 17 Year Olds | 18 (100.0%) | 0 (0.0%) |
| 18 to 19 Year Olds | 10 (100.0%) | 0 (0.0%) |
| 20 to 24 Year Olds | 0 (0.0%) | 0 (0.0%) |
| 25 to 34 Year Olds | 3 (100.0%) | 0 (0.0%) |
| 35 Years and over | 1 (100.0%) | 0 (0.0%) |
| Total | 145 (91.8%) | 13 (8.2%) |
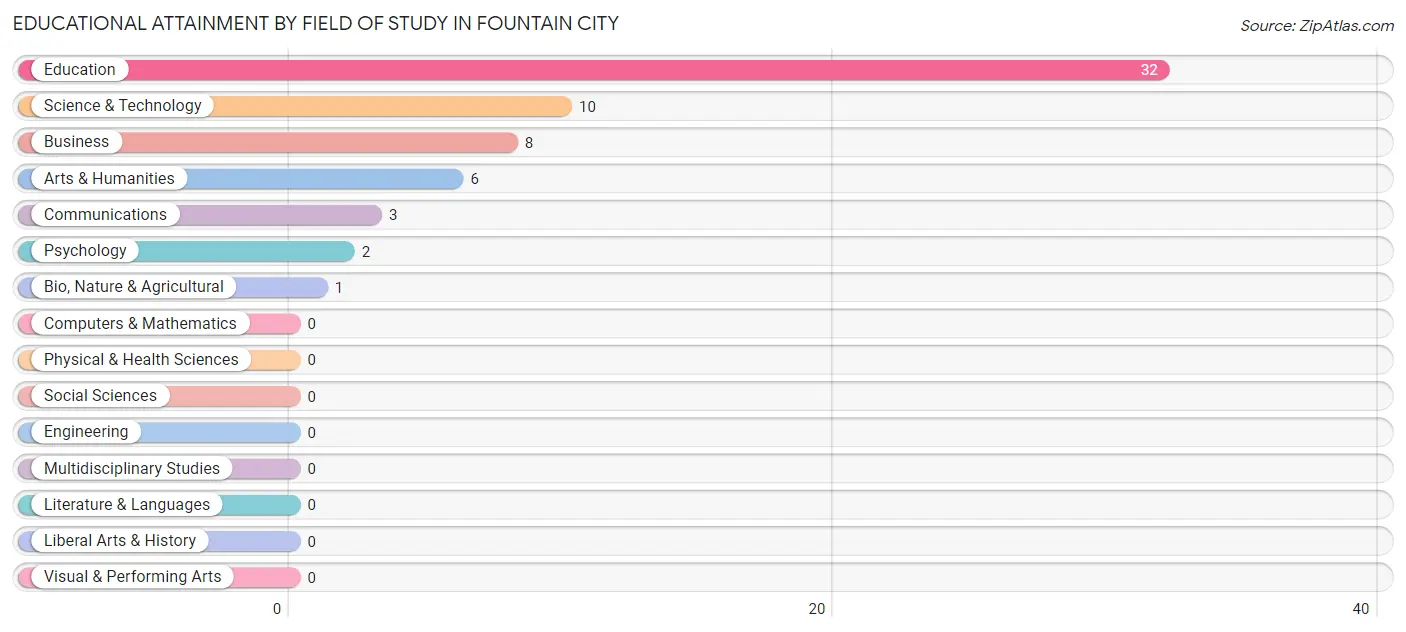
Educational Attainment by Field of Study in Fountain City
Education (32 | 51.6%), science & technology (10 | 16.1%), business (8 | 12.9%), arts & humanities (6 | 9.7%), and communications (3 | 4.8%) are the most common fields of study among 62 individuals in Fountain City who have obtained a bachelor's degree or higher.
| Field of Study | # Graduates | % Graduates |
| Computers & Mathematics | 0 | 0.0% |
| Bio, Nature & Agricultural | 1 | 1.6% |
| Physical & Health Sciences | 0 | 0.0% |
| Psychology | 2 | 3.2% |
| Social Sciences | 0 | 0.0% |
| Engineering | 0 | 0.0% |
| Multidisciplinary Studies | 0 | 0.0% |
| Science & Technology | 10 | 16.1% |
| Business | 8 | 12.9% |
| Education | 32 | 51.6% |
| Literature & Languages | 0 | 0.0% |
| Liberal Arts & History | 0 | 0.0% |
| Visual & Performing Arts | 0 | 0.0% |
| Communications | 3 | 4.8% |
| Arts & Humanities | 6 | 9.7% |
| Total | 62 | 100.0% |
Transportation & Commute in Fountain City
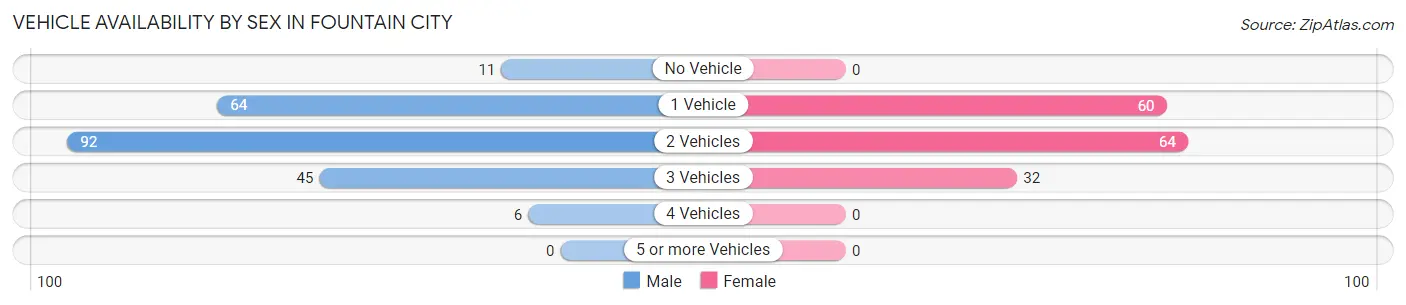
Vehicle Availability by Sex in Fountain City
The most prevalent vehicle ownership categories in Fountain City are males with 2 vehicles (92, accounting for 42.2%) and females with 2 vehicles (64, making up 59.0%).
| Vehicles Available | Male | Female |
| No Vehicle | 11 (5.1%) | 0 (0.0%) |
| 1 Vehicle | 64 (29.4%) | 60 (38.5%) |
| 2 Vehicles | 92 (42.2%) | 64 (41.0%) |
| 3 Vehicles | 45 (20.6%) | 32 (20.5%) |
| 4 Vehicles | 6 (2.8%) | 0 (0.0%) |
| 5 or more Vehicles | 0 (0.0%) | 0 (0.0%) |
| Total | 218 (100.0%) | 156 (100.0%) |
Commute Time in Fountain City
The most frequently occuring commute durations in Fountain City are 15 to 19 minutes (149 commuters, 41.6%), 20 to 24 minutes (60 commuters, 16.8%), and 10 to 14 minutes (47 commuters, 13.1%).
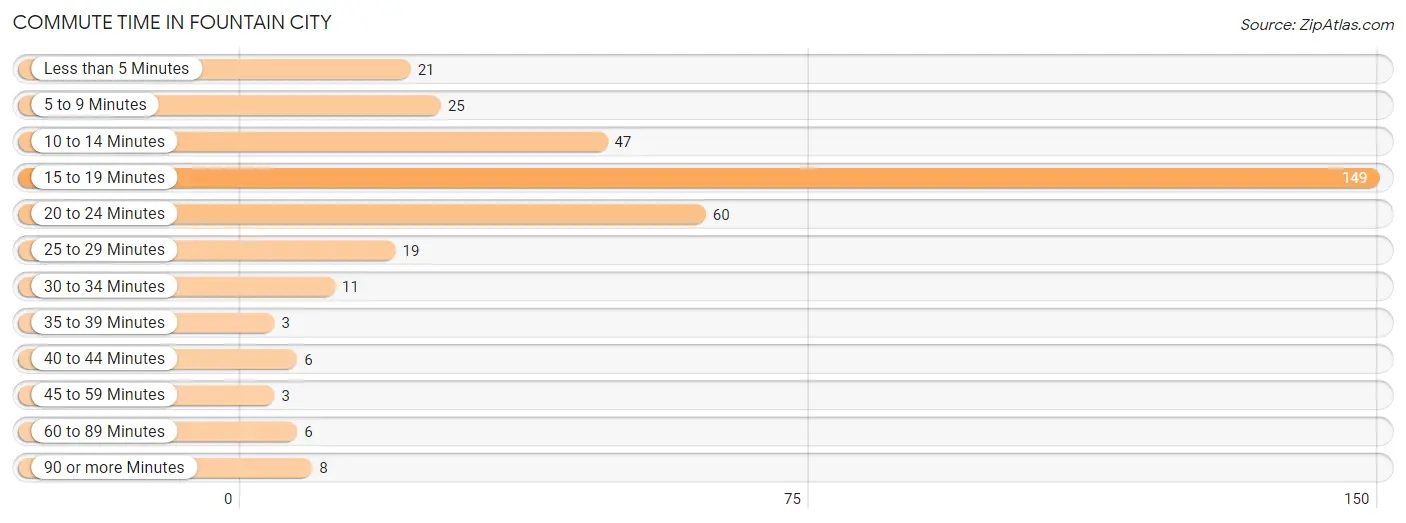
| Commute Time | # Commuters | % Commuters |
| Less than 5 Minutes | 21 | 5.9% |
| 5 to 9 Minutes | 25 | 7.0% |
| 10 to 14 Minutes | 47 | 13.1% |
| 15 to 19 Minutes | 149 | 41.6% |
| 20 to 24 Minutes | 60 | 16.8% |
| 25 to 29 Minutes | 19 | 5.3% |
| 30 to 34 Minutes | 11 | 3.1% |
| 35 to 39 Minutes | 3 | 0.8% |
| 40 to 44 Minutes | 6 | 1.7% |
| 45 to 59 Minutes | 3 | 0.8% |
| 60 to 89 Minutes | 6 | 1.7% |
| 90 or more Minutes | 8 | 2.2% |
Commute Time by Sex in Fountain City
The most common commute times in Fountain City are 15 to 19 minutes (70 commuters, 33.0%) for males and 15 to 19 minutes (79 commuters, 54.1%) for females.
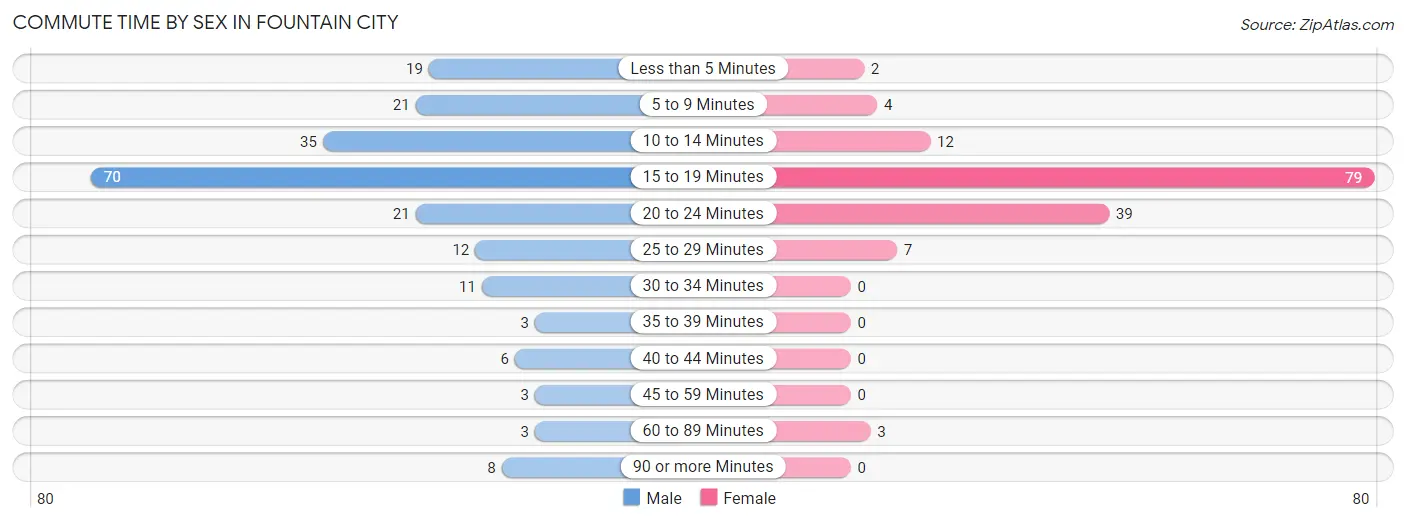
| Commute Time | Male | Female |
| Less than 5 Minutes | 19 (9.0%) | 2 (1.4%) |
| 5 to 9 Minutes | 21 (9.9%) | 4 (2.7%) |
| 10 to 14 Minutes | 35 (16.5%) | 12 (8.2%) |
| 15 to 19 Minutes | 70 (33.0%) | 79 (54.1%) |
| 20 to 24 Minutes | 21 (9.9%) | 39 (26.7%) |
| 25 to 29 Minutes | 12 (5.7%) | 7 (4.8%) |
| 30 to 34 Minutes | 11 (5.2%) | 0 (0.0%) |
| 35 to 39 Minutes | 3 (1.4%) | 0 (0.0%) |
| 40 to 44 Minutes | 6 (2.8%) | 0 (0.0%) |
| 45 to 59 Minutes | 3 (1.4%) | 0 (0.0%) |
| 60 to 89 Minutes | 3 (1.4%) | 3 (2.1%) |
| 90 or more Minutes | 8 (3.8%) | 0 (0.0%) |
Time of Departure to Work by Sex in Fountain City
The most frequent times of departure to work in Fountain City are 6:30 AM to 6:59 AM (41, 19.3%) for males and 8:30 AM to 8:59 AM (26, 17.8%) for females.
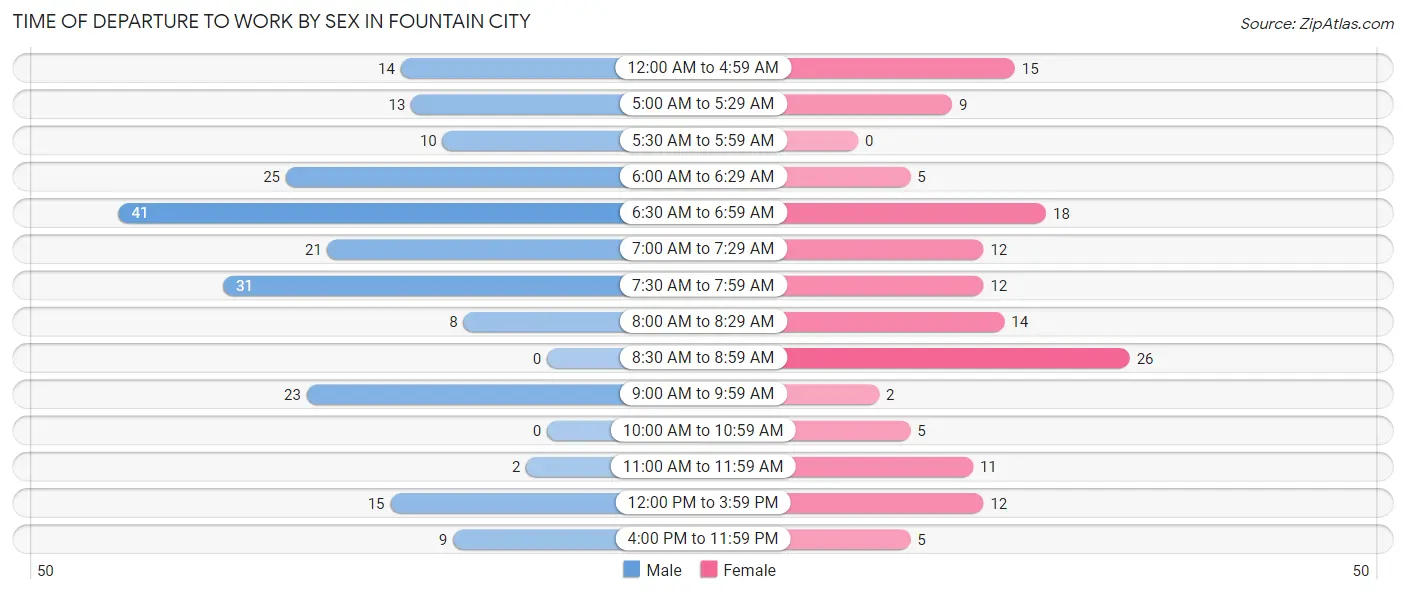
| Time of Departure | Male | Female |
| 12:00 AM to 4:59 AM | 14 (6.6%) | 15 (10.3%) |
| 5:00 AM to 5:29 AM | 13 (6.1%) | 9 (6.2%) |
| 5:30 AM to 5:59 AM | 10 (4.7%) | 0 (0.0%) |
| 6:00 AM to 6:29 AM | 25 (11.8%) | 5 (3.4%) |
| 6:30 AM to 6:59 AM | 41 (19.3%) | 18 (12.3%) |
| 7:00 AM to 7:29 AM | 21 (9.9%) | 12 (8.2%) |
| 7:30 AM to 7:59 AM | 31 (14.6%) | 12 (8.2%) |
| 8:00 AM to 8:29 AM | 8 (3.8%) | 14 (9.6%) |
| 8:30 AM to 8:59 AM | 0 (0.0%) | 26 (17.8%) |
| 9:00 AM to 9:59 AM | 23 (10.8%) | 2 (1.4%) |
| 10:00 AM to 10:59 AM | 0 (0.0%) | 5 (3.4%) |
| 11:00 AM to 11:59 AM | 2 (0.9%) | 11 (7.5%) |
| 12:00 PM to 3:59 PM | 15 (7.1%) | 12 (8.2%) |
| 4:00 PM to 11:59 PM | 9 (4.3%) | 5 (3.4%) |
| Total | 212 (100.0%) | 146 (100.0%) |
Housing Occupancy in Fountain City
Occupancy by Ownership in Fountain City
Of the total 345 dwellings in Fountain City, owner-occupied units account for 256 (74.2%), while renter-occupied units make up 89 (25.8%).
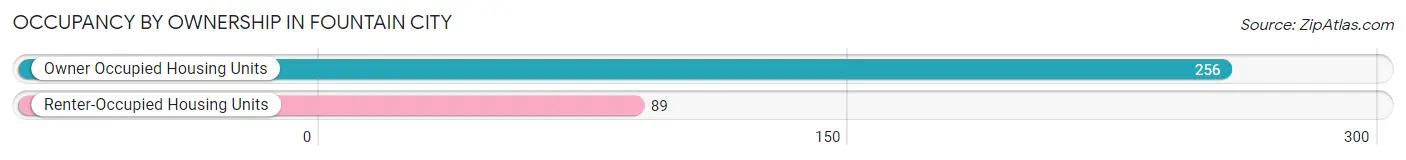
| Occupancy | # Housing Units | % Housing Units |
| Owner Occupied Housing Units | 256 | 74.2% |
| Renter-Occupied Housing Units | 89 | 25.8% |
| Total Occupied Housing Units | 345 | 100.0% |
Occupancy by Household Size in Fountain City
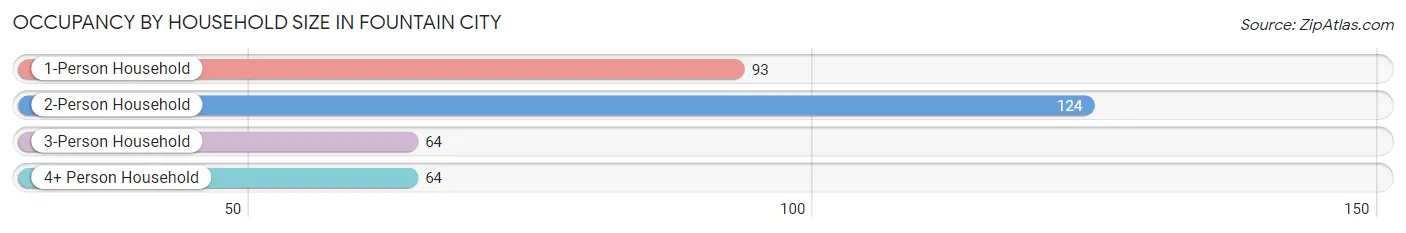
| Household Size | # Housing Units | % Housing Units |
| 1-Person Household | 93 | 27.0% |
| 2-Person Household | 124 | 35.9% |
| 3-Person Household | 64 | 18.5% |
| 4+ Person Household | 64 | 18.5% |
| Total Housing Units | 345 | 100.0% |
Occupancy by Ownership by Household Size in Fountain City
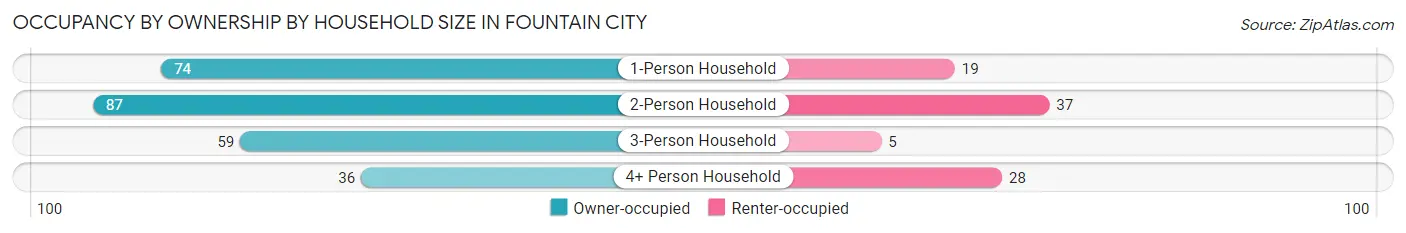
| Household Size | Owner-occupied | Renter-occupied |
| 1-Person Household | 74 (79.6%) | 19 (20.4%) |
| 2-Person Household | 87 (70.2%) | 37 (29.8%) |
| 3-Person Household | 59 (92.2%) | 5 (7.8%) |
| 4+ Person Household | 36 (56.2%) | 28 (43.8%) |
| Total Housing Units | 256 (74.2%) | 89 (25.8%) |
Occupancy by Educational Attainment in Fountain City
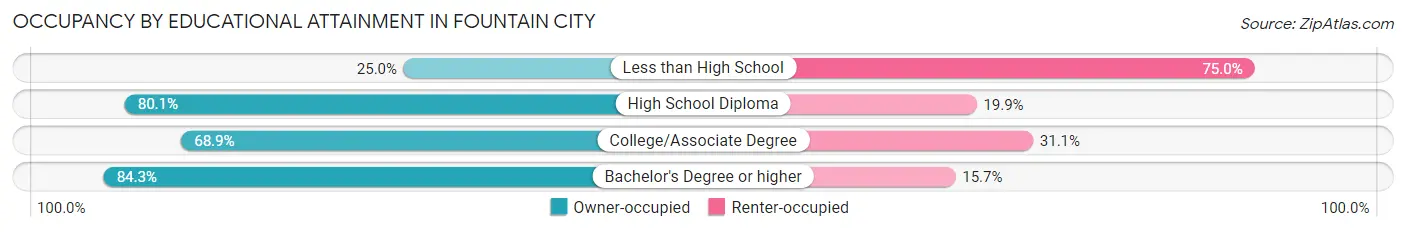
| Household Size | Owner-occupied | Renter-occupied |
| Less than High School | 5 (25.0%) | 15 (75.0%) |
| High School Diploma | 137 (80.1%) | 34 (19.9%) |
| College/Associate Degree | 71 (68.9%) | 32 (31.1%) |
| Bachelor's Degree or higher | 43 (84.3%) | 8 (15.7%) |
Occupancy by Age of Householder in Fountain City
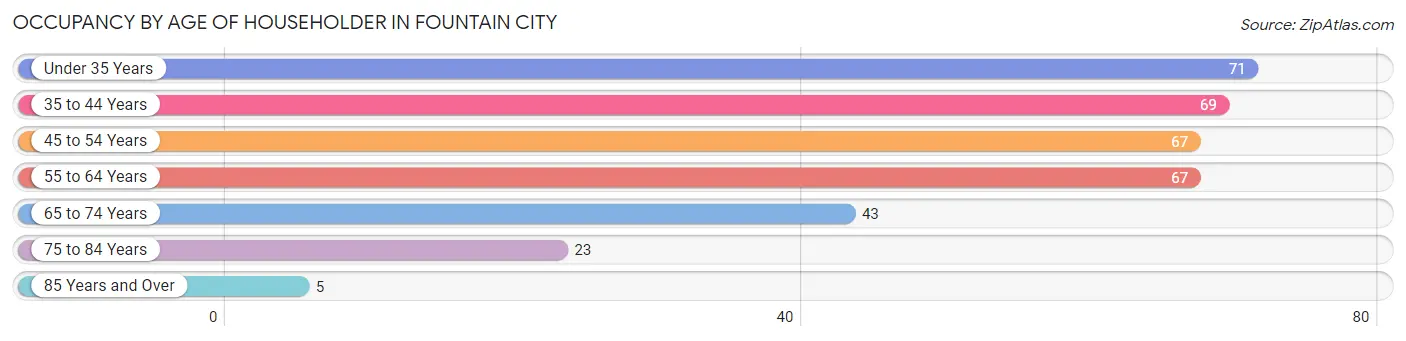
| Age Bracket | # Households | % Households |
| Under 35 Years | 71 | 20.6% |
| 35 to 44 Years | 69 | 20.0% |
| 45 to 54 Years | 67 | 19.4% |
| 55 to 64 Years | 67 | 19.4% |
| 65 to 74 Years | 43 | 12.5% |
| 75 to 84 Years | 23 | 6.7% |
| 85 Years and Over | 5 | 1.5% |
| Total | 345 | 100.0% |
Housing Finances in Fountain City
Median Income by Occupancy in Fountain City
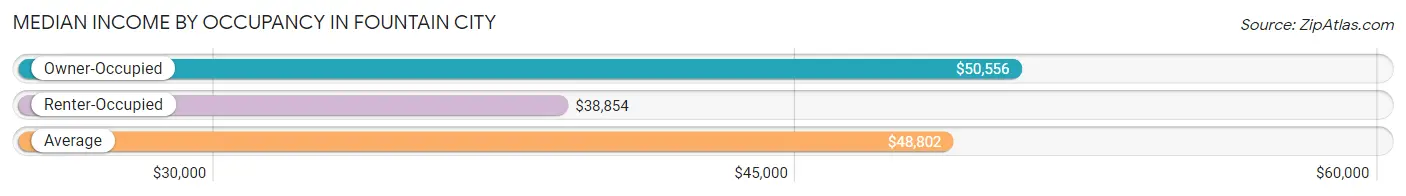
| Occupancy Type | # Households | Median Income |
| Owner-Occupied | 256 (74.2%) | $50,556 |
| Renter-Occupied | 89 (25.8%) | $38,854 |
| Average | 345 (100.0%) | $48,802 |
Occupancy by Householder Income Bracket in Fountain City
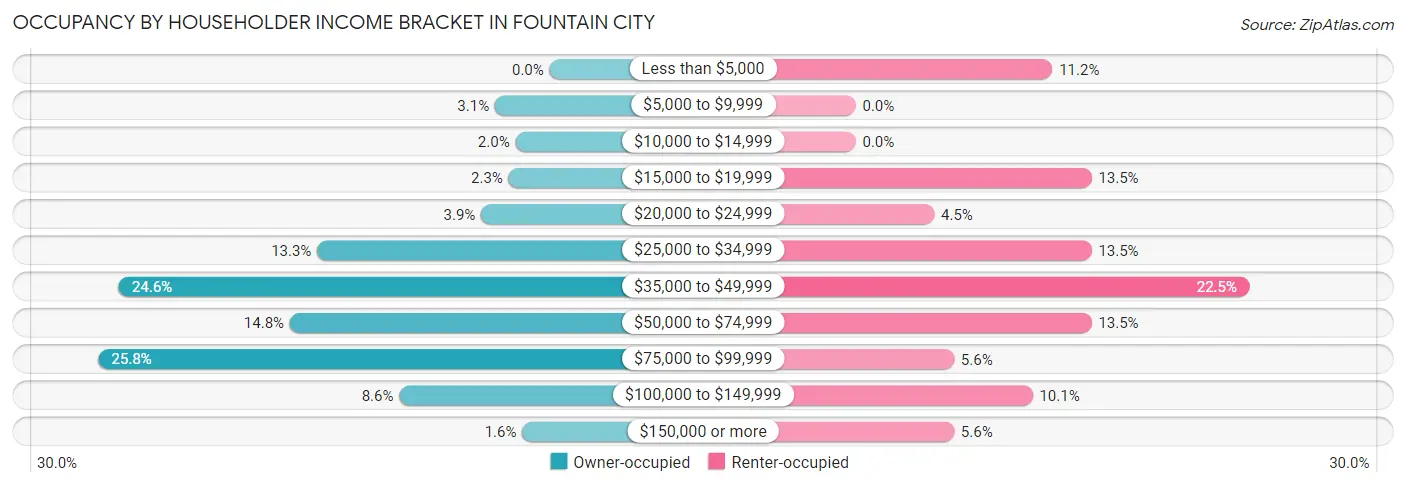
| Income Bracket | Owner-occupied | Renter-occupied |
| Less than $5,000 | 0 (0.0%) | 10 (11.2%) |
| $5,000 to $9,999 | 8 (3.1%) | 0 (0.0%) |
| $10,000 to $14,999 | 5 (1.9%) | 0 (0.0%) |
| $15,000 to $19,999 | 6 (2.3%) | 12 (13.5%) |
| $20,000 to $24,999 | 10 (3.9%) | 4 (4.5%) |
| $25,000 to $34,999 | 34 (13.3%) | 12 (13.5%) |
| $35,000 to $49,999 | 63 (24.6%) | 20 (22.5%) |
| $50,000 to $74,999 | 38 (14.8%) | 12 (13.5%) |
| $75,000 to $99,999 | 66 (25.8%) | 5 (5.6%) |
| $100,000 to $149,999 | 22 (8.6%) | 9 (10.1%) |
| $150,000 or more | 4 (1.6%) | 5 (5.6%) |
| Total | 256 (100.0%) | 89 (100.0%) |
Monthly Housing Cost Tiers in Fountain City
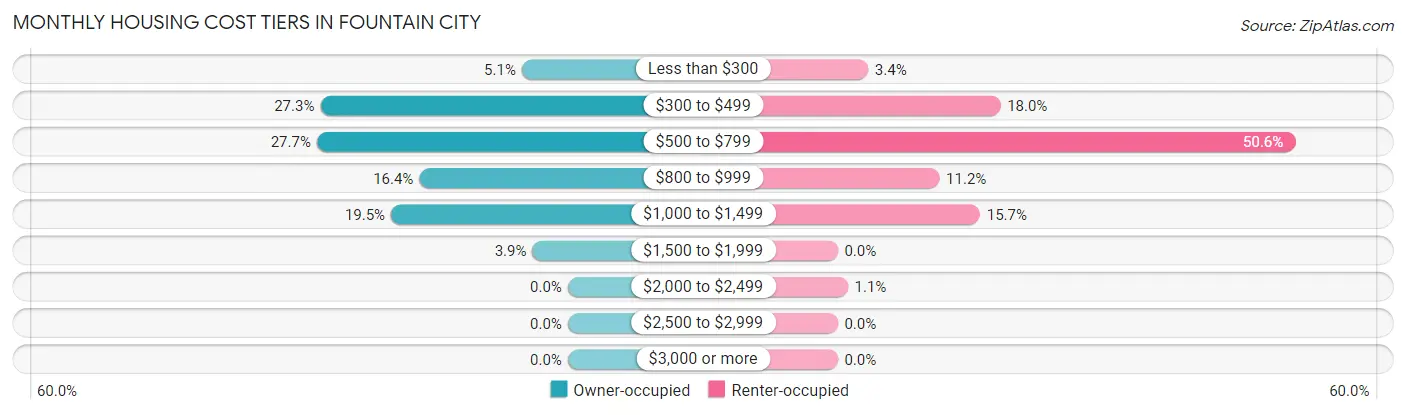
| Monthly Cost | Owner-occupied | Renter-occupied |
| Less than $300 | 13 (5.1%) | 3 (3.4%) |
| $300 to $499 | 70 (27.3%) | 16 (18.0%) |
| $500 to $799 | 71 (27.7%) | 45 (50.6%) |
| $800 to $999 | 42 (16.4%) | 10 (11.2%) |
| $1,000 to $1,499 | 50 (19.5%) | 14 (15.7%) |
| $1,500 to $1,999 | 10 (3.9%) | 0 (0.0%) |
| $2,000 to $2,499 | 0 (0.0%) | 1 (1.1%) |
| $2,500 to $2,999 | 0 (0.0%) | 0 (0.0%) |
| $3,000 or more | 0 (0.0%) | 0 (0.0%) |
| Total | 256 (100.0%) | 89 (100.0%) |
Physical Housing Characteristics in Fountain City
Housing Structures in Fountain City
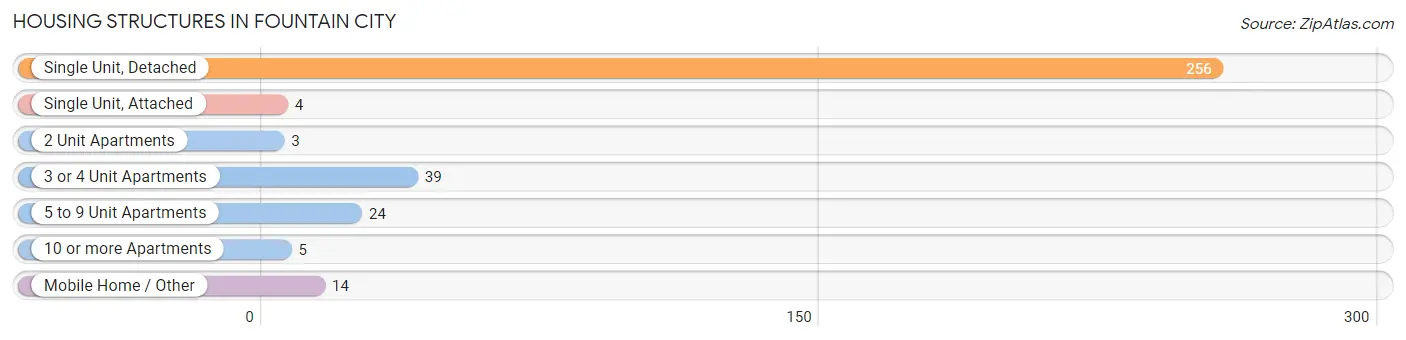
| Structure Type | # Housing Units | % Housing Units |
| Single Unit, Detached | 256 | 74.2% |
| Single Unit, Attached | 4 | 1.2% |
| 2 Unit Apartments | 3 | 0.9% |
| 3 or 4 Unit Apartments | 39 | 11.3% |
| 5 to 9 Unit Apartments | 24 | 7.0% |
| 10 or more Apartments | 5 | 1.5% |
| Mobile Home / Other | 14 | 4.1% |
| Total | 345 | 100.0% |
Housing Structures by Occupancy in Fountain City
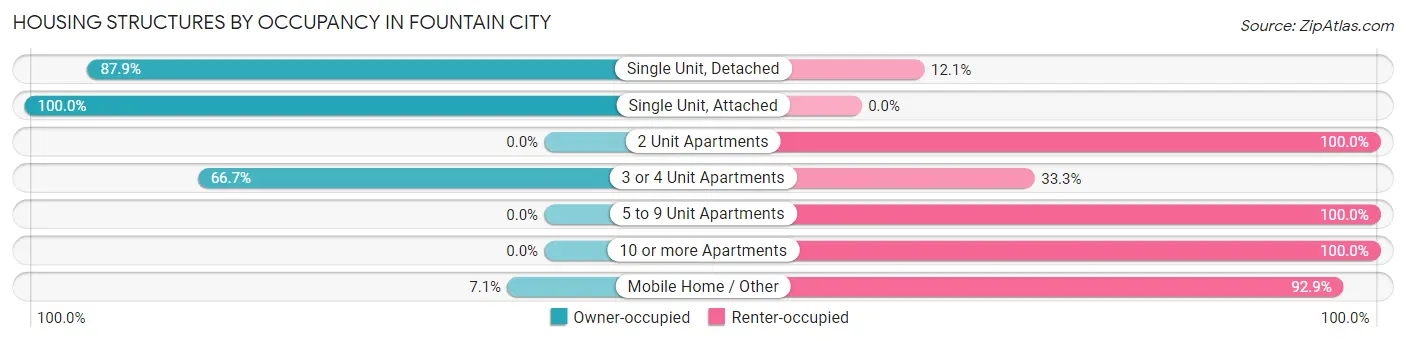
| Structure Type | Owner-occupied | Renter-occupied |
| Single Unit, Detached | 225 (87.9%) | 31 (12.1%) |
| Single Unit, Attached | 4 (100.0%) | 0 (0.0%) |
| 2 Unit Apartments | 0 (0.0%) | 3 (100.0%) |
| 3 or 4 Unit Apartments | 26 (66.7%) | 13 (33.3%) |
| 5 to 9 Unit Apartments | 0 (0.0%) | 24 (100.0%) |
| 10 or more Apartments | 0 (0.0%) | 5 (100.0%) |
| Mobile Home / Other | 1 (7.1%) | 13 (92.9%) |
| Total | 256 (74.2%) | 89 (25.8%) |
Housing Structures by Number of Rooms in Fountain City
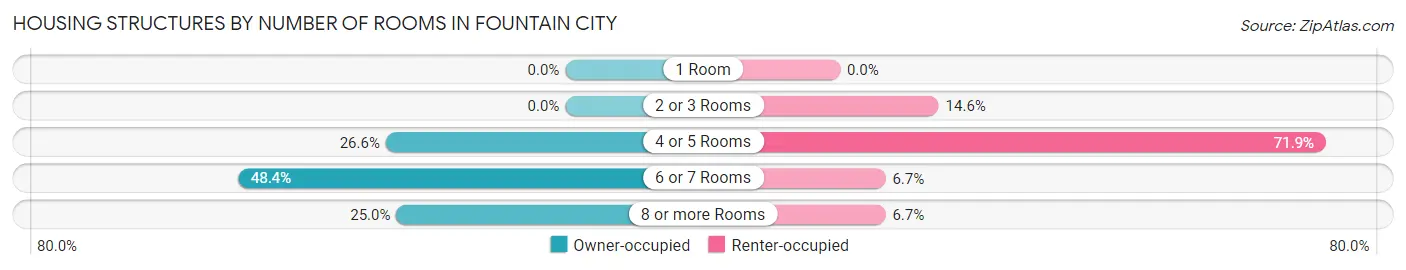
| Number of Rooms | Owner-occupied | Renter-occupied |
| 1 Room | 0 (0.0%) | 0 (0.0%) |
| 2 or 3 Rooms | 0 (0.0%) | 13 (14.6%) |
| 4 or 5 Rooms | 68 (26.6%) | 64 (71.9%) |
| 6 or 7 Rooms | 124 (48.4%) | 6 (6.7%) |
| 8 or more Rooms | 64 (25.0%) | 6 (6.7%) |
| Total | 256 (100.0%) | 89 (100.0%) |
Housing Structure by Heating Type in Fountain City
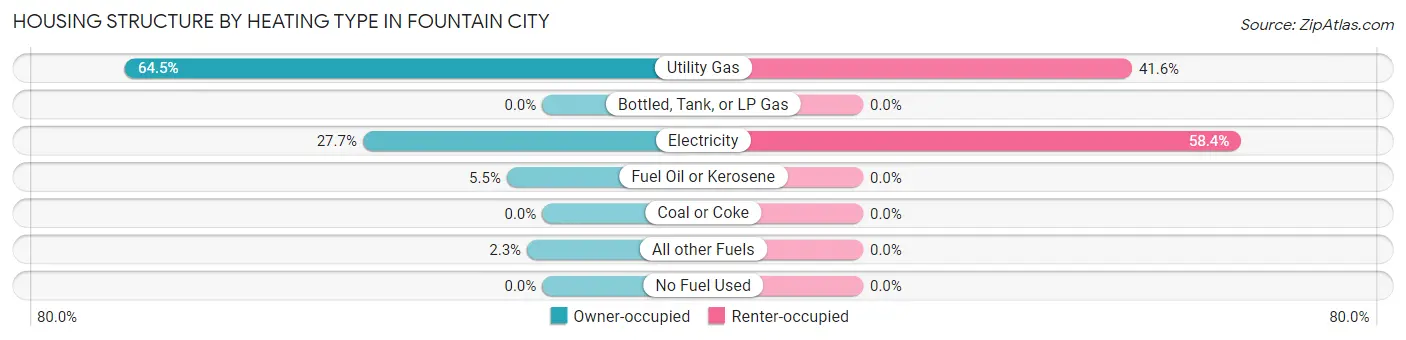
| Heating Type | Owner-occupied | Renter-occupied |
| Utility Gas | 165 (64.4%) | 37 (41.6%) |
| Bottled, Tank, or LP Gas | 0 (0.0%) | 0 (0.0%) |
| Electricity | 71 (27.7%) | 52 (58.4%) |
| Fuel Oil or Kerosene | 14 (5.5%) | 0 (0.0%) |
| Coal or Coke | 0 (0.0%) | 0 (0.0%) |
| All other Fuels | 6 (2.3%) | 0 (0.0%) |
| No Fuel Used | 0 (0.0%) | 0 (0.0%) |
| Total | 256 (100.0%) | 89 (100.0%) |
Household Vehicle Usage in Fountain City
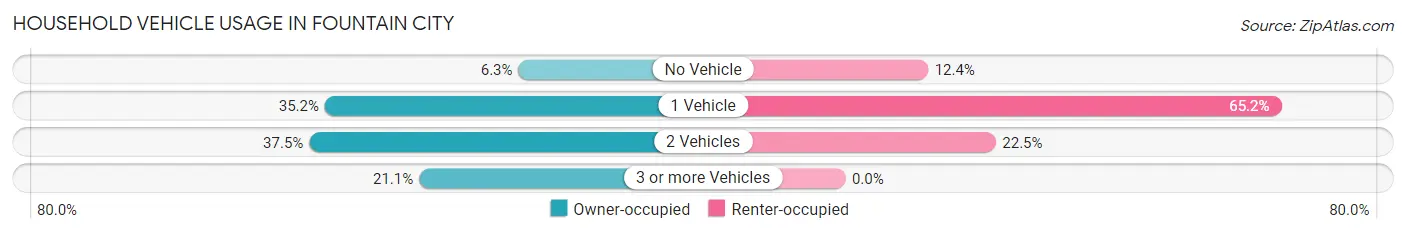
| Vehicles per Household | Owner-occupied | Renter-occupied |
| No Vehicle | 16 (6.2%) | 11 (12.4%) |
| 1 Vehicle | 90 (35.2%) | 58 (65.2%) |
| 2 Vehicles | 96 (37.5%) | 20 (22.5%) |
| 3 or more Vehicles | 54 (21.1%) | 0 (0.0%) |
| Total | 256 (100.0%) | 89 (100.0%) |
Real Estate & Mortgages in Fountain City
Real Estate and Mortgage Overview in Fountain City
| Characteristic | Without Mortgage | With Mortgage |
| Housing Units | 118 | 138 |
| Median Property Value | $82,100 | $88,800 |
| Median Household Income | $43,393 | $2 |
| Monthly Housing Costs | $425 | $0 |
| Real Estate Taxes | $716 | $5 |
Property Value by Mortgage Status in Fountain City
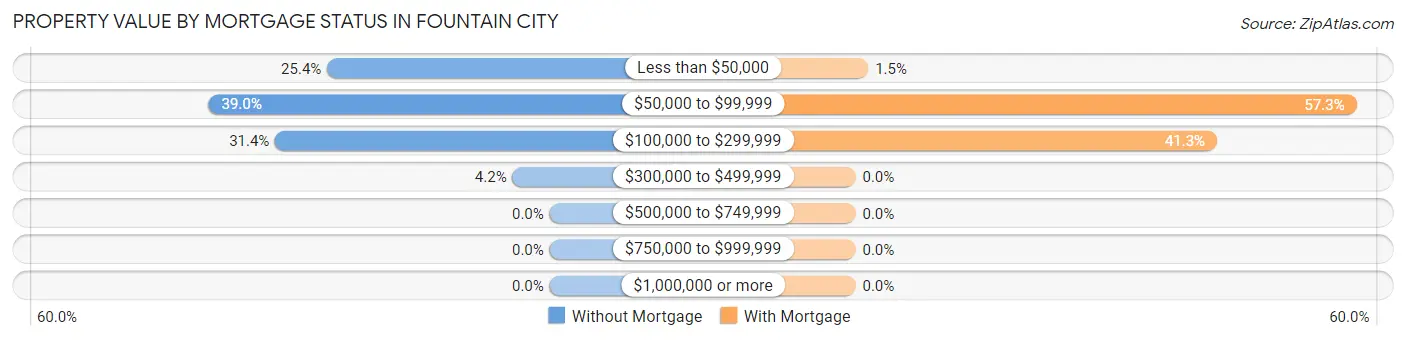
| Property Value | Without Mortgage | With Mortgage |
| Less than $50,000 | 30 (25.4%) | 2 (1.5%) |
| $50,000 to $99,999 | 46 (39.0%) | 79 (57.3%) |
| $100,000 to $299,999 | 37 (31.4%) | 57 (41.3%) |
| $300,000 to $499,999 | 5 (4.2%) | 0 (0.0%) |
| $500,000 to $749,999 | 0 (0.0%) | 0 (0.0%) |
| $750,000 to $999,999 | 0 (0.0%) | 0 (0.0%) |
| $1,000,000 or more | 0 (0.0%) | 0 (0.0%) |
| Total | 118 (100.0%) | 138 (100.0%) |
Household Income by Mortgage Status in Fountain City
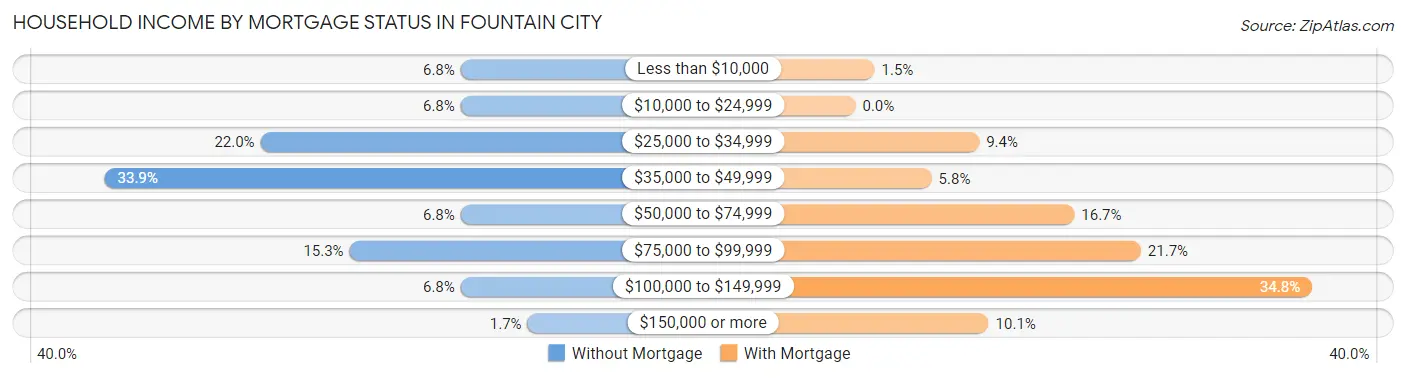
| Household Income | Without Mortgage | With Mortgage |
| Less than $10,000 | 8 (6.8%) | 2 (1.5%) |
| $10,000 to $24,999 | 8 (6.8%) | 0 (0.0%) |
| $25,000 to $34,999 | 26 (22.0%) | 13 (9.4%) |
| $35,000 to $49,999 | 40 (33.9%) | 8 (5.8%) |
| $50,000 to $74,999 | 8 (6.8%) | 23 (16.7%) |
| $75,000 to $99,999 | 18 (15.2%) | 30 (21.7%) |
| $100,000 to $149,999 | 8 (6.8%) | 48 (34.8%) |
| $150,000 or more | 2 (1.7%) | 14 (10.1%) |
| Total | 118 (100.0%) | 138 (100.0%) |
Property Value to Household Income Ratio in Fountain City
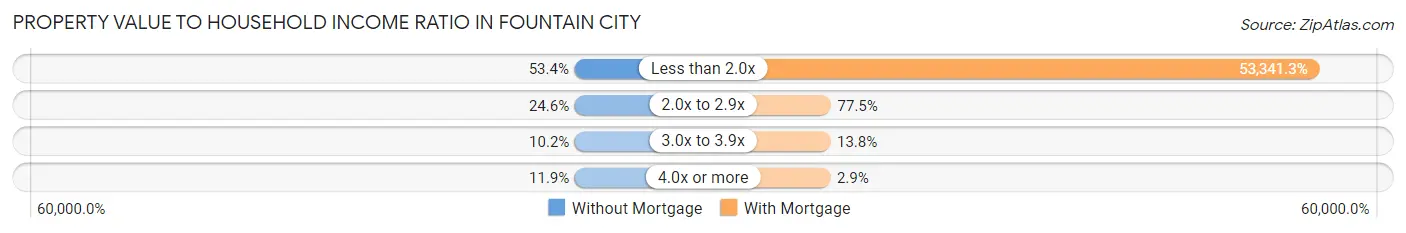
| Value-to-Income Ratio | Without Mortgage | With Mortgage |
| Less than 2.0x | 63 (53.4%) | 73,611 (53,341.3%) |
| 2.0x to 2.9x | 29 (24.6%) | 107 (77.5%) |
| 3.0x to 3.9x | 12 (10.2%) | 19 (13.8%) |
| 4.0x or more | 14 (11.9%) | 4 (2.9%) |
| Total | 118 (100.0%) | 138 (100.0%) |
Real Estate Taxes by Mortgage Status in Fountain City
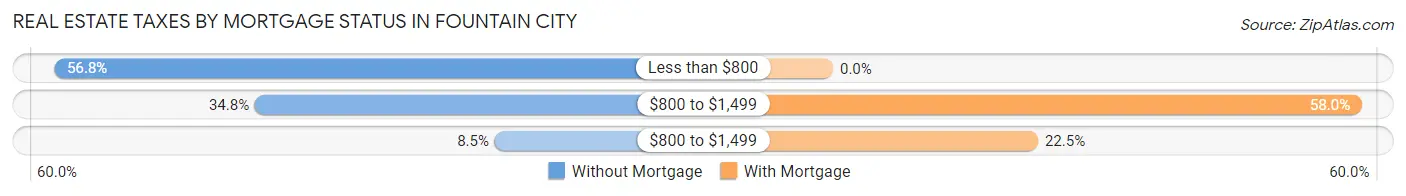
| Property Taxes | Without Mortgage | With Mortgage |
| Less than $800 | 67 (56.8%) | 0 (0.0%) |
| $800 to $1,499 | 41 (34.7%) | 80 (58.0%) |
| $800 to $1,499 | 10 (8.5%) | 31 (22.5%) |
| Total | 118 (100.0%) | 138 (100.0%) |
Health & Disability in Fountain City
Health Insurance Coverage by Age in Fountain City
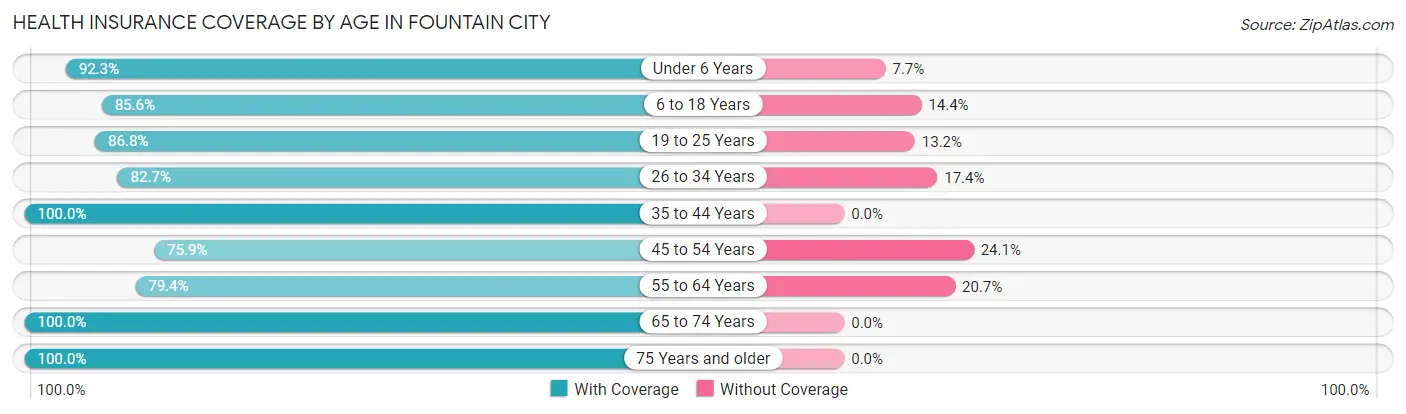
| Age Bracket | With Coverage | Without Coverage |
| Under 6 Years | 60 (92.3%) | 5 (7.7%) |
| 6 to 18 Years | 119 (85.6%) | 20 (14.4%) |
| 19 to 25 Years | 33 (86.8%) | 5 (13.2%) |
| 26 to 34 Years | 81 (82.7%) | 17 (17.3%) |
| 35 to 44 Years | 108 (100.0%) | 0 (0.0%) |
| 45 to 54 Years | 88 (75.9%) | 28 (24.1%) |
| 55 to 64 Years | 73 (79.3%) | 19 (20.6%) |
| 65 to 74 Years | 60 (100.0%) | 0 (0.0%) |
| 75 Years and older | 57 (100.0%) | 0 (0.0%) |
| Total | 679 (87.8%) | 94 (12.2%) |
Health Insurance Coverage by Citizenship Status in Fountain City
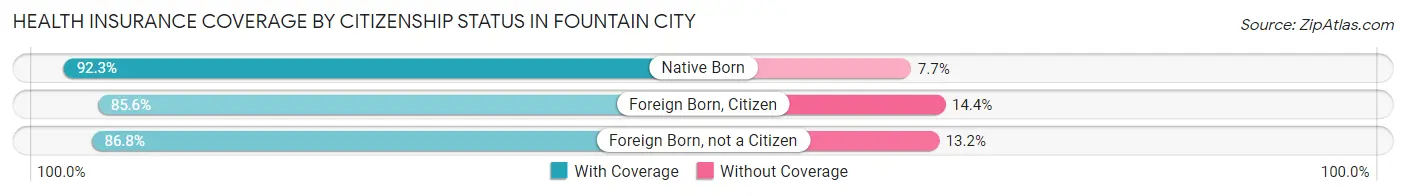
| Citizenship Status | With Coverage | Without Coverage |
| Native Born | 60 (92.3%) | 5 (7.7%) |
| Foreign Born, Citizen | 119 (85.6%) | 20 (14.4%) |
| Foreign Born, not a Citizen | 33 (86.8%) | 5 (13.2%) |
Health Insurance Coverage by Household Income in Fountain City
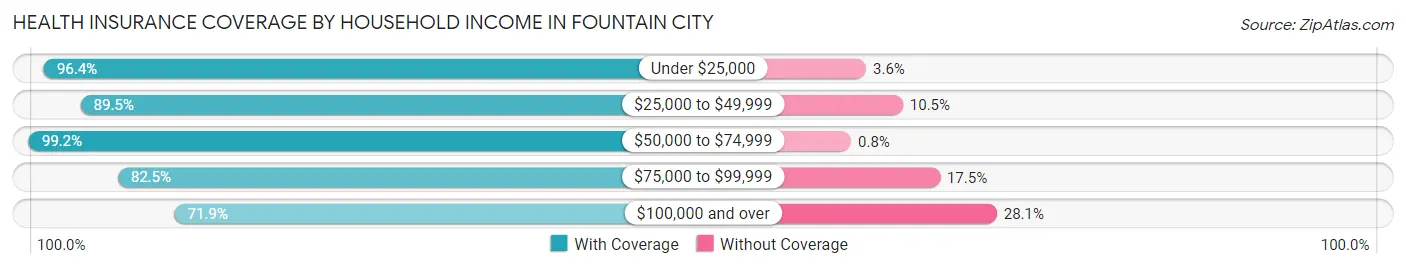
| Household Income | With Coverage | Without Coverage |
| Under $25,000 | 133 (96.4%) | 5 (3.6%) |
| $25,000 to $49,999 | 179 (89.5%) | 21 (10.5%) |
| $50,000 to $74,999 | 124 (99.2%) | 1 (0.8%) |
| $75,000 to $99,999 | 156 (82.5%) | 33 (17.5%) |
| $100,000 and over | 87 (71.9%) | 34 (28.1%) |
Public vs Private Health Insurance Coverage by Age in Fountain City
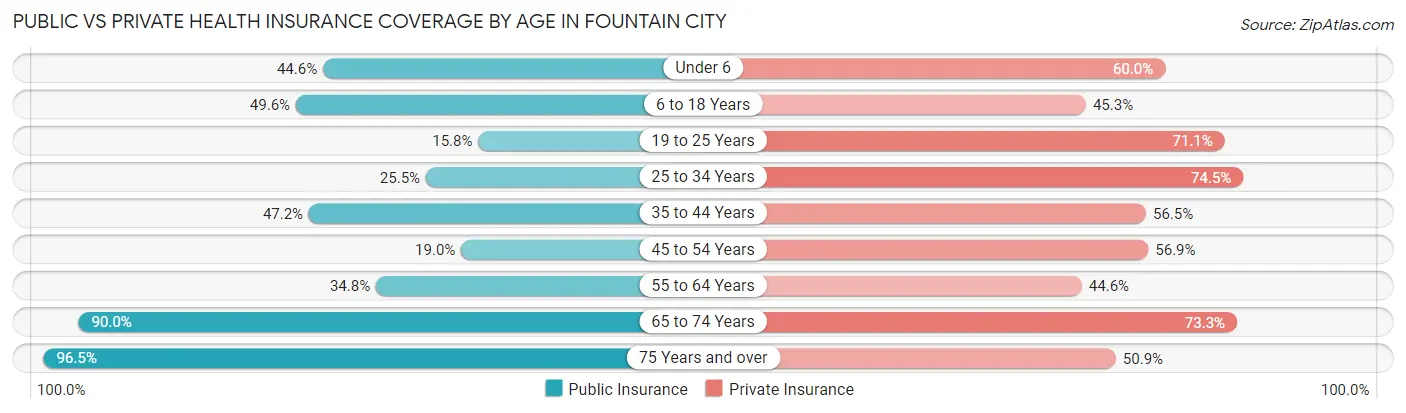
| Age Bracket | Public Insurance | Private Insurance |
| Under 6 | 29 (44.6%) | 39 (60.0%) |
| 6 to 18 Years | 69 (49.6%) | 63 (45.3%) |
| 19 to 25 Years | 6 (15.8%) | 27 (71.1%) |
| 25 to 34 Years | 25 (25.5%) | 73 (74.5%) |
| 35 to 44 Years | 51 (47.2%) | 61 (56.5%) |
| 45 to 54 Years | 22 (19.0%) | 66 (56.9%) |
| 55 to 64 Years | 32 (34.8%) | 41 (44.6%) |
| 65 to 74 Years | 54 (90.0%) | 44 (73.3%) |
| 75 Years and over | 55 (96.5%) | 29 (50.9%) |
| Total | 343 (44.4%) | 443 (57.3%) |
Disability Status by Sex by Age in Fountain City
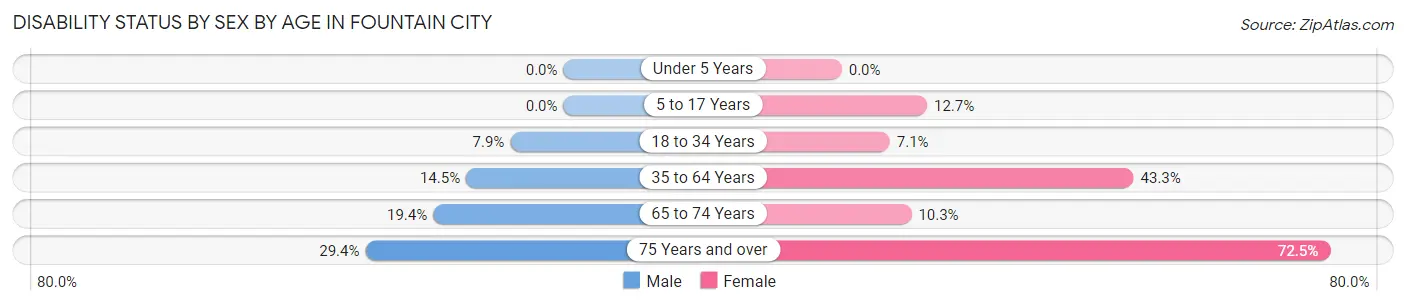
| Age Bracket | Male | Female |
| Under 5 Years | 0 (0.0%) | 0 (0.0%) |
| 5 to 17 Years | 0 (0.0%) | 10 (12.7%) |
| 18 to 34 Years | 6 (7.9%) | 5 (7.1%) |
| 35 to 64 Years | 24 (14.5%) | 65 (43.3%) |
| 65 to 74 Years | 6 (19.4%) | 3 (10.3%) |
| 75 Years and over | 5 (29.4%) | 29 (72.5%) |
Disability Class by Sex by Age in Fountain City
Disability Class: Hearing Difficulty
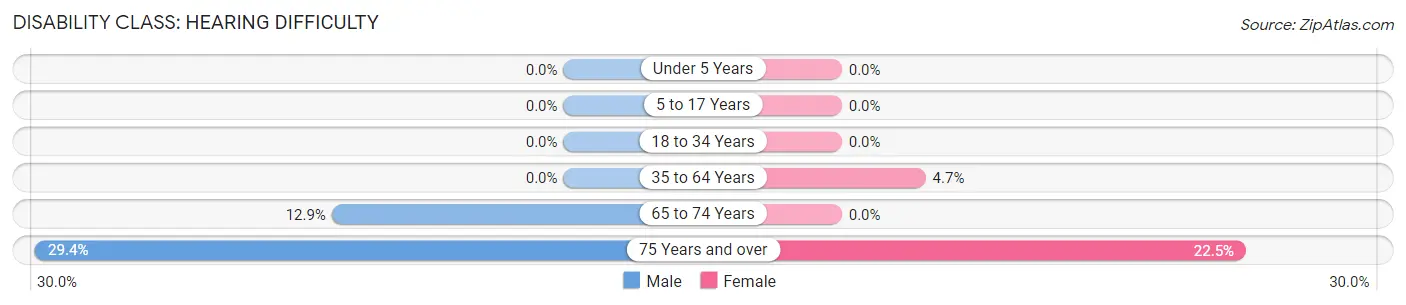
| Age Bracket | Male | Female |
| Under 5 Years | 0 (0.0%) | 0 (0.0%) |
| 5 to 17 Years | 0 (0.0%) | 0 (0.0%) |
| 18 to 34 Years | 0 (0.0%) | 0 (0.0%) |
| 35 to 64 Years | 0 (0.0%) | 7 (4.7%) |
| 65 to 74 Years | 4 (12.9%) | 0 (0.0%) |
| 75 Years and over | 5 (29.4%) | 9 (22.5%) |
Disability Class: Vision Difficulty
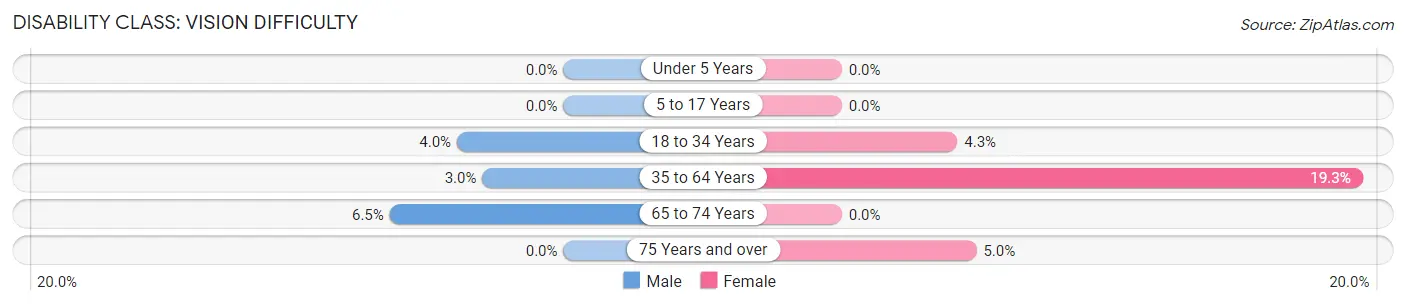
| Age Bracket | Male | Female |
| Under 5 Years | 0 (0.0%) | 0 (0.0%) |
| 5 to 17 Years | 0 (0.0%) | 0 (0.0%) |
| 18 to 34 Years | 3 (4.0%) | 3 (4.3%) |
| 35 to 64 Years | 5 (3.0%) | 29 (19.3%) |
| 65 to 74 Years | 2 (6.5%) | 0 (0.0%) |
| 75 Years and over | 0 (0.0%) | 2 (5.0%) |
Disability Class: Cognitive Difficulty
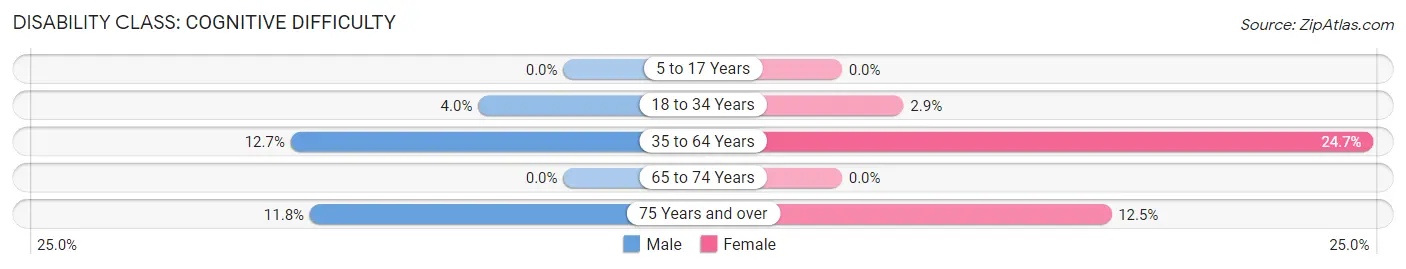
| Age Bracket | Male | Female |
| 5 to 17 Years | 0 (0.0%) | 0 (0.0%) |
| 18 to 34 Years | 3 (4.0%) | 2 (2.9%) |
| 35 to 64 Years | 21 (12.7%) | 37 (24.7%) |
| 65 to 74 Years | 0 (0.0%) | 0 (0.0%) |
| 75 Years and over | 2 (11.8%) | 5 (12.5%) |
Disability Class: Ambulatory Difficulty
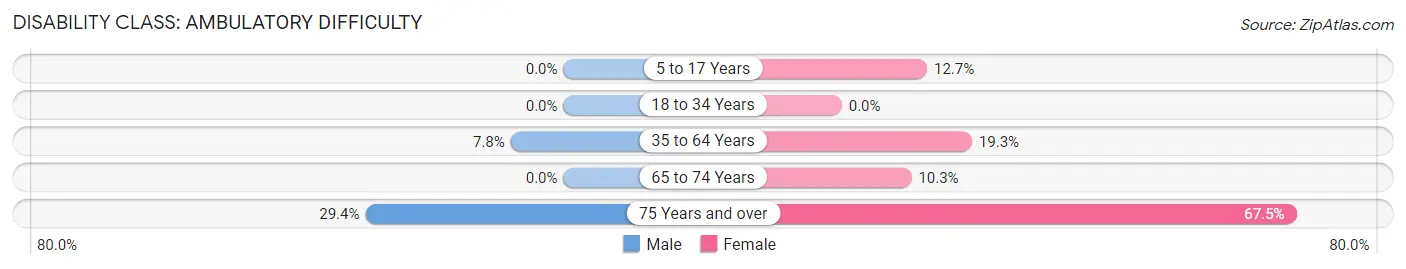
| Age Bracket | Male | Female |
| 5 to 17 Years | 0 (0.0%) | 10 (12.7%) |
| 18 to 34 Years | 0 (0.0%) | 0 (0.0%) |
| 35 to 64 Years | 13 (7.8%) | 29 (19.3%) |
| 65 to 74 Years | 0 (0.0%) | 3 (10.3%) |
| 75 Years and over | 5 (29.4%) | 27 (67.5%) |
Disability Class: Self-Care Difficulty
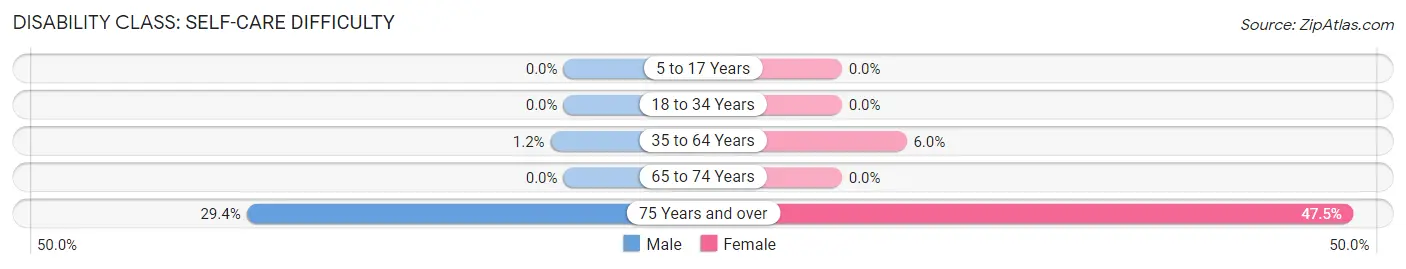
| Age Bracket | Male | Female |
| 5 to 17 Years | 0 (0.0%) | 0 (0.0%) |
| 18 to 34 Years | 0 (0.0%) | 0 (0.0%) |
| 35 to 64 Years | 2 (1.2%) | 9 (6.0%) |
| 65 to 74 Years | 0 (0.0%) | 0 (0.0%) |
| 75 Years and over | 5 (29.4%) | 19 (47.5%) |
Technology Access in Fountain City
Computing Device Access in Fountain City
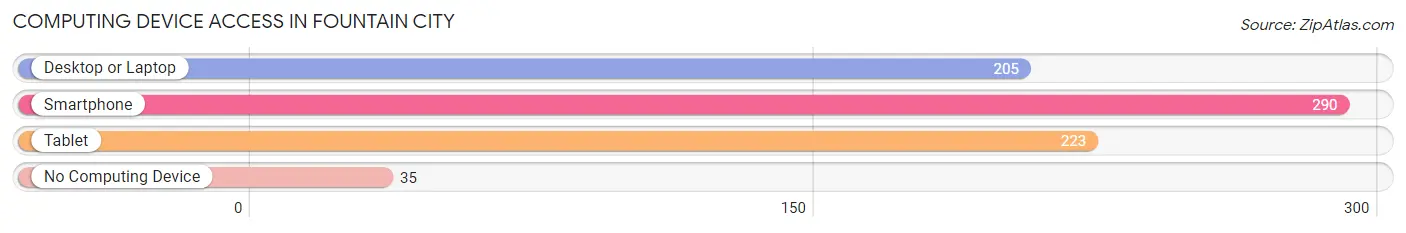
| Device Type | # Households | % Households |
| Desktop or Laptop | 205 | 59.4% |
| Smartphone | 290 | 84.1% |
| Tablet | 223 | 64.6% |
| No Computing Device | 35 | 10.1% |
| Total | 345 | 100.0% |
Internet Access in Fountain City
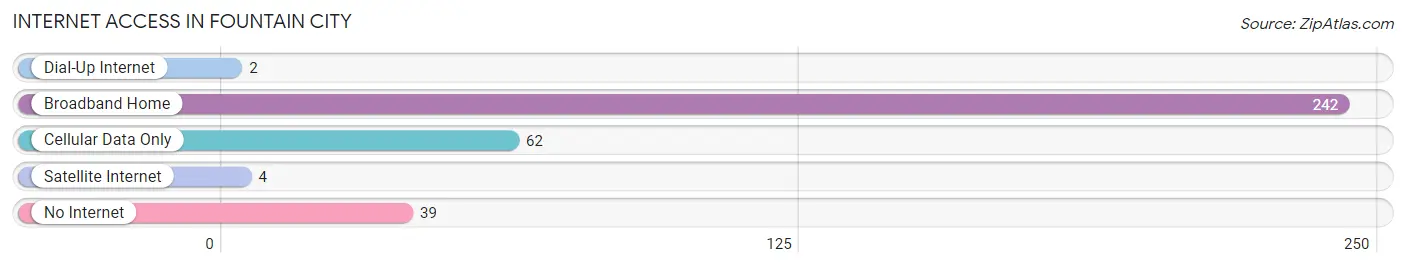
| Internet Type | # Households | % Households |
| Dial-Up Internet | 2 | 0.6% |
| Broadband Home | 242 | 70.1% |
| Cellular Data Only | 62 | 18.0% |
| Satellite Internet | 4 | 1.2% |
| No Internet | 39 | 11.3% |
| Total | 345 | 100.0% |
Fountain City Summary
Fountain City is a small town located in Wayne County, Indiana, United States. It is situated on the banks of the Whitewater River, approximately 20 miles east of Richmond. The population was 1,093 at the 2010 census.
History
Fountain City was founded in 1837 by William and Mary Ann Fountain. The town was named after the Fountains, who were among the first settlers in the area. The Fountains had come to the area from North Carolina in search of a better life. The town was originally known as Fountaintown, but the name was changed to Fountain City in 1845.
The town was an important stop on the Whitewater Canal, which was built in the early 1800s to connect the Wabash and Erie Canal to the Whitewater River. The canal was used to transport goods and people between the two rivers. The canal was eventually abandoned in the late 1800s, but the town remained an important stop on the Whitewater Valley Railroad, which was built in the late 1800s.
The town was also home to a number of businesses, including a flour mill, a sawmill, a grist mill, a blacksmith shop, a general store, and a hotel. The town also had a post office, a bank, and a school.
Geography
Fountain City is located at 39°45'25" North, 84°59'45" West (39.756944, -84.995833). The town is situated on the banks of the Whitewater River, approximately 20 miles east of Richmond. The town is located in the Whitewater Valley, which is part of the larger Great Lakes region.
The town has a total area of 0.6 square miles, all of which is land. The town is located in a rural area, with the nearest major city being Richmond, which is approximately 20 miles to the west.
Economy
Fountain City's economy is largely based on agriculture. The town is home to a number of farms, which produce a variety of crops, including corn, soybeans, wheat, and hay. The town is also home to a number of small businesses, including a grocery store, a hardware store, a restaurant, and a gas station.
Demographics
As of the 2010 census, there were 1,093 people, 441 households, and 298 families residing in the town. The population density was 1,817.3 people per square mile. The racial makeup of the town was 97.3% White, 0.7% African American, 0.2% Native American, 0.2% Asian, 0.1% from other races, and 1.5% from two or more races. Hispanic or Latino of any race were 0.7% of the population.
There were 441 households, out of which 28.2% had children under the age of 18 living with them, 51.6% were married couples living together, 10.2% had a female householder with no husband present, and 33.7% were non-families. 29.2% of all households were made up of individuals, and 14.3% had someone living alone who was 65 years of age or older. The average household size was 2.47 and the average family size was 3.04.
In the town, the population was spread out, with 25.2% under the age of 18, 8.2% from 18 to 24, 25.2% from 25 to 44, 24.2% from 45 to 64, and 17.2% who were 65 years of age or older. The median age was 38 years. For every 100 females, there were 94.2 males. For every 100 females age 18 and over, there were 91.2 males.
The median income for a household in the town was $35,000, and the median income for a family was $41,250. Males had a median income of $30,000 versus $21,250 for females. The per capita income for the town was $17,845. About 8.2% of families and 10.2% of the population were below the poverty line, including 14.3% of those under age 18 and 8.2% of those age 65 or over.
Common Questions
What is Per Capita Income in Fountain City?
Per Capita income in Fountain City is $25,848.
What is the Median Family Income in Fountain City?
Median Family Income in Fountain City is $48,295.
What is the Median Household income in Fountain City?
Median Household Income in Fountain City is $48,802.
What is Income or Wage Gap in Fountain City?
Income or Wage Gap in Fountain City is 44.7%.
Women in Fountain City earn 55.3 cents for every dollar earned by a man.
What is Inequality or Gini Index in Fountain City?
Inequality or Gini Index in Fountain City is 0.34.
What is the Total Population of Fountain City?
Total Population of Fountain City is 773.
What is the Total Male Population of Fountain City?
Total Male Population of Fountain City is 374.
What is the Total Female Population of Fountain City?
Total Female Population of Fountain City is 399.
What is the Ratio of Males per 100 Females in Fountain City?
There are 93.73 Males per 100 Females in Fountain City.
What is the Ratio of Females per 100 Males in Fountain City?
There are 106.68 Females per 100 Males in Fountain City.
What is the Median Population Age in Fountain City?
Median Population Age in Fountain City is 39.0 Years.
What is the Average Family Size in Fountain City
Average Family Size in Fountain City is 2.6 People.
What is the Average Household Size in Fountain City
Average Household Size in Fountain City is 2.2 People.
How Large is the Labor Force in Fountain City?
There are 395 People in the Labor Forcein in Fountain City.
What is the Percentage of People in the Labor Force in Fountain City?
66.5% of People are in the Labor Force in Fountain City.
What is the Unemployment Rate in Fountain City?
Unemployment Rate in Fountain City is 3.0%.