Fairmount, IN Map & Demographics
Fairmount Map
Fairmount Overview
$23,169
PER CAPITA INCOME
$55,658
AVG FAMILY INCOME
$48,235
AVG HOUSEHOLD INCOME
65.0%
WAGE / INCOME GAP [ % ]
35.0¢/ $1
WAGE / INCOME GAP [ $ ]
0.34
INEQUALITY / GINI INDEX
2,582
TOTAL POPULATION
1,358
MALE POPULATION
1,224
FEMALE POPULATION
110.95
MALES / 100 FEMALES
90.13
FEMALES / 100 MALES
40.3
MEDIAN AGE
2.8
AVG FAMILY SIZE
2.3
AVG HOUSEHOLD SIZE
1,088
LABOR FORCE [ PEOPLE ]
55.1%
PERCENT IN LABOR FORCE
7.3%
UNEMPLOYMENT RATE
Fairmount Zip Codes
Fairmount Area Codes
Income in Fairmount
Income Overview in Fairmount
Per Capita Income in Fairmount is $23,169, while median incomes of families and households are $55,658 and $48,235 respectively.
| Characteristic | Number | Measure |
| Per Capita Income | 2,582 | $23,169 |
| Median Family Income | 684 | $55,658 |
| Mean Family Income | 684 | $59,408 |
| Median Household Income | 1,112 | $48,235 |
| Mean Household Income | 1,112 | $54,365 |
| Income Deficit | 684 | $0 |
| Wage / Income Gap (%) | 2,582 | 64.99% |
| Wage / Income Gap ($) | 2,582 | 35.01¢ per $1 |
| Gini / Inequality Index | 2,582 | 0.34 |
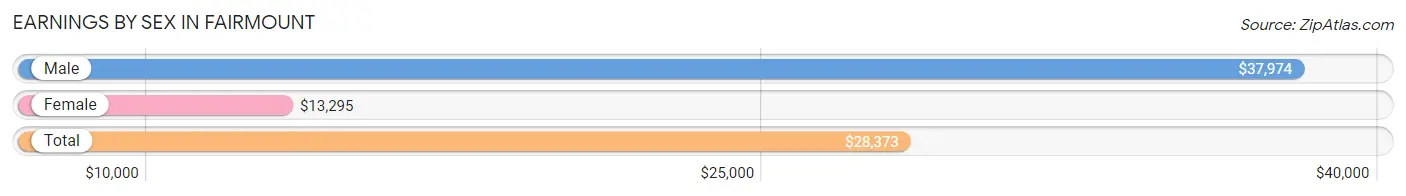
Earnings by Sex in Fairmount
Average Earnings in Fairmount are $28,373, $37,974 for men and $13,295 for women, a difference of 65.0%.
| Sex | Number | Average Earnings |
| Male | 634 (52.8%) | $37,974 |
| Female | 567 (47.2%) | $13,295 |
| Total | 1,201 (100.0%) | $28,373 |
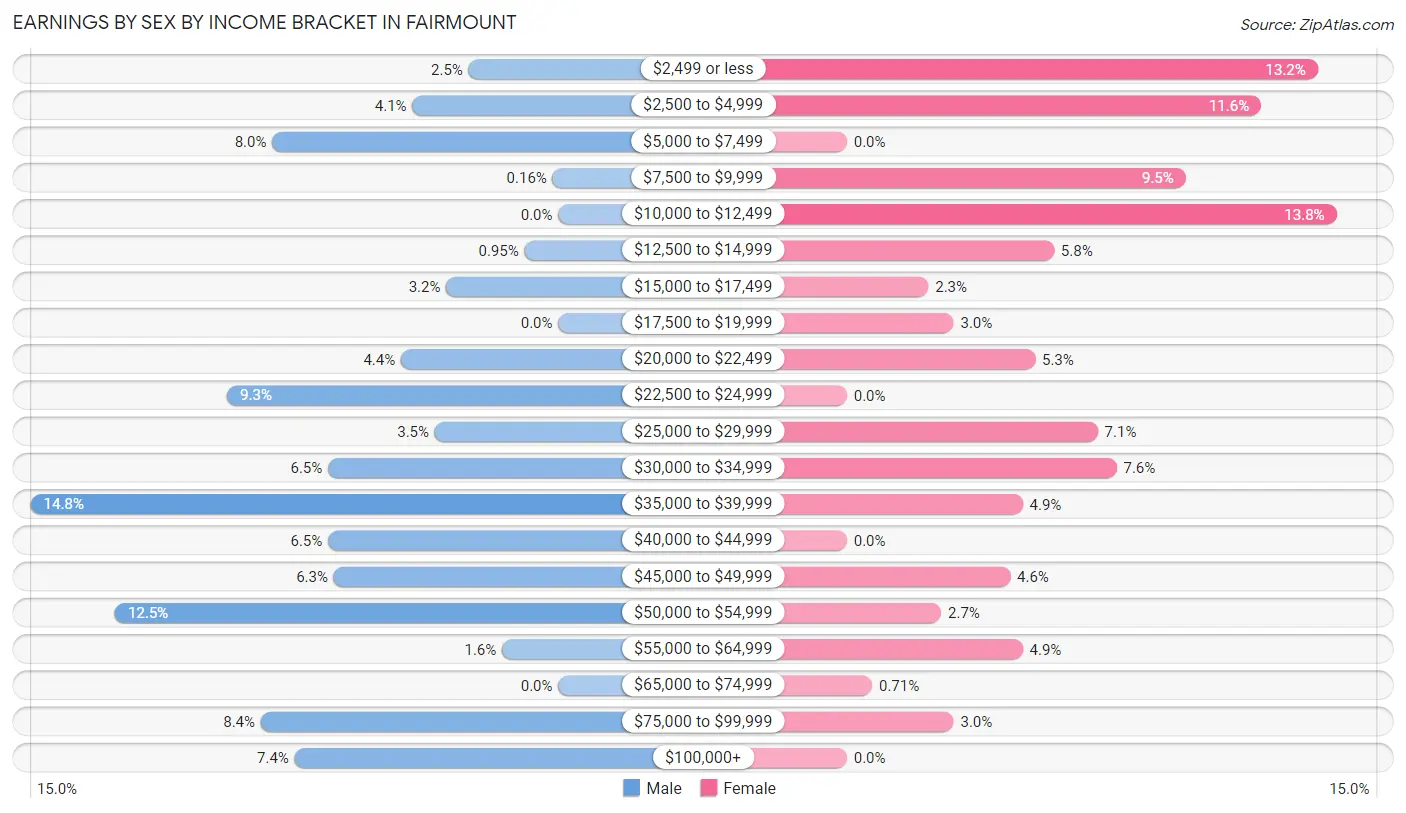
Earnings by Sex by Income Bracket in Fairmount
The most common earnings brackets in Fairmount are $35,000 to $39,999 for men (94 | 14.8%) and $10,000 to $12,499 for women (78 | 13.8%).
| Income | Male | Female |
| $2,499 or less | 16 (2.5%) | 75 (13.2%) |
| $2,500 to $4,999 | 26 (4.1%) | 66 (11.6%) |
| $5,000 to $7,499 | 51 (8.0%) | 0 (0.0%) |
| $7,500 to $9,999 | 1 (0.2%) | 54 (9.5%) |
| $10,000 to $12,499 | 0 (0.0%) | 78 (13.8%) |
| $12,500 to $14,999 | 6 (0.9%) | 33 (5.8%) |
| $15,000 to $17,499 | 20 (3.2%) | 13 (2.3%) |
| $17,500 to $19,999 | 0 (0.0%) | 17 (3.0%) |
| $20,000 to $22,499 | 28 (4.4%) | 30 (5.3%) |
| $22,500 to $24,999 | 59 (9.3%) | 0 (0.0%) |
| $25,000 to $29,999 | 22 (3.5%) | 40 (7.0%) |
| $30,000 to $34,999 | 41 (6.5%) | 43 (7.6%) |
| $35,000 to $39,999 | 94 (14.8%) | 28 (4.9%) |
| $40,000 to $44,999 | 41 (6.5%) | 0 (0.0%) |
| $45,000 to $49,999 | 40 (6.3%) | 26 (4.6%) |
| $50,000 to $54,999 | 79 (12.5%) | 15 (2.6%) |
| $55,000 to $64,999 | 10 (1.6%) | 28 (4.9%) |
| $65,000 to $74,999 | 0 (0.0%) | 4 (0.7%) |
| $75,000 to $99,999 | 53 (8.4%) | 17 (3.0%) |
| $100,000+ | 47 (7.4%) | 0 (0.0%) |
| Total | 634 (100.0%) | 567 (100.0%) |
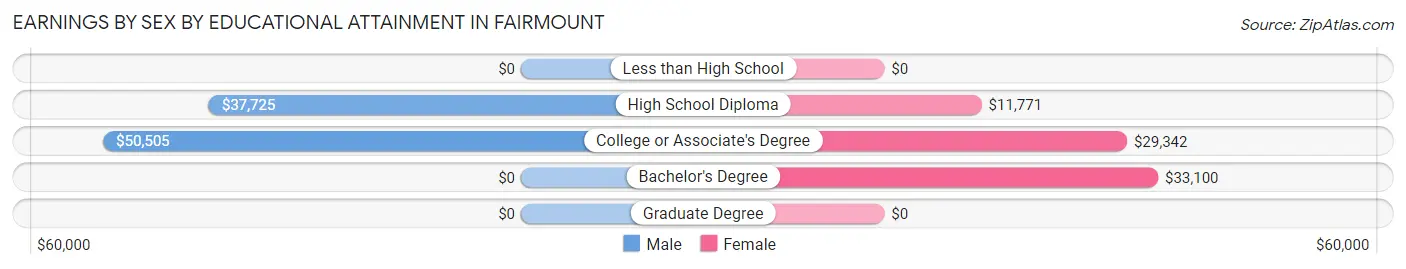
Earnings by Sex by Educational Attainment in Fairmount
Average earnings in Fairmount are $39,159 for men and $17,794 for women, a difference of 54.6%. Men with an educational attainment of college or associate's degree enjoy the highest average annual earnings of $50,505, while those with high school diploma education earn the least with $37,725. Women with an educational attainment of bachelor's degree earn the most with the average annual earnings of $33,100, while those with high school diploma education have the smallest earnings of $11,771.
| Educational Attainment | Male Income | Female Income |
| Less than High School | - | - |
| High School Diploma | $37,725 | $11,771 |
| College or Associate's Degree | $50,505 | $29,342 |
| Bachelor's Degree | - | - |
| Graduate Degree | - | - |
| Total | $39,159 | $17,794 |
Family Income in Fairmount
Family Income Brackets in Fairmount
According to the Fairmount family income data, there are 172 families falling into the $50,000 to $74,999 income range, which is the most common income bracket and makes up 25.2% of all families.
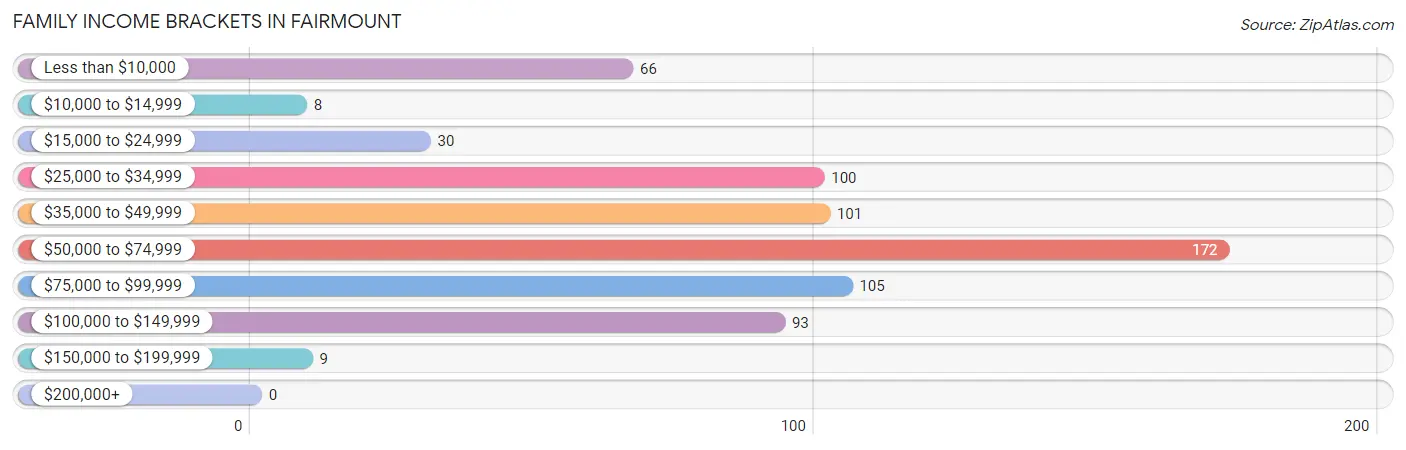
| Income Bracket | # Families | % Families |
| Less than $10,000 | 66 | 9.6% |
| $10,000 to $14,999 | 8 | 1.2% |
| $15,000 to $24,999 | 30 | 4.4% |
| $25,000 to $34,999 | 100 | 14.6% |
| $35,000 to $49,999 | 101 | 14.8% |
| $50,000 to $74,999 | 172 | 25.1% |
| $75,000 to $99,999 | 105 | 15.4% |
| $100,000 to $149,999 | 93 | 13.6% |
| $150,000 to $199,999 | 9 | 1.3% |
| $200,000+ | 0 | 0.0% |
Family Income by Famaliy Size in Fairmount
2-person families (374 | 54.7%) account for the highest median family income in Fairmount with $58,167 per family, while 2-person families (374 | 54.7%) have the highest median income of $29,084 per family member.
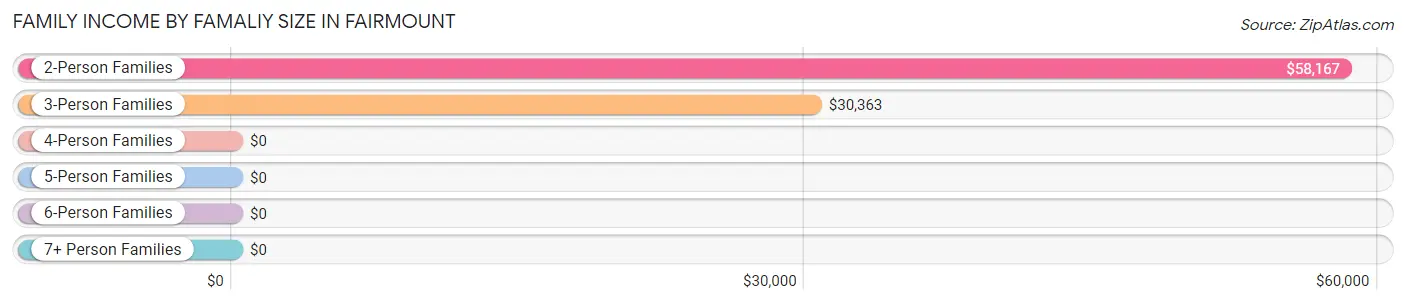
| Income Bracket | # Families | Median Income |
| 2-Person Families | 374 (54.7%) | $58,167 |
| 3-Person Families | 143 (20.9%) | $30,363 |
| 4-Person Families | 120 (17.5%) | $0 |
| 5-Person Families | 41 (6.0%) | $0 |
| 6-Person Families | 0 (0.0%) | $0 |
| 7+ Person Families | 6 (0.9%) | $0 |
| Total | 684 (100.0%) | $55,658 |
Family Income by Number of Earners in Fairmount
The median family income in Fairmount is $55,658, with families comprising 3+ earners (23) having the highest median family income of $125,208, while families with 1 earner (281) have the lowest median family income of $38,750, accounting for 3.4% and 41.1% of families, respectively.
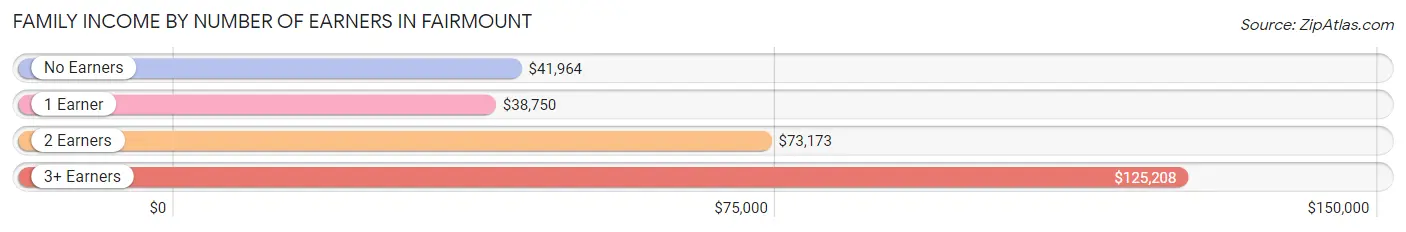
| Number of Earners | # Families | Median Income |
| No Earners | 155 (22.7%) | $41,964 |
| 1 Earner | 281 (41.1%) | $38,750 |
| 2 Earners | 225 (32.9%) | $73,173 |
| 3+ Earners | 23 (3.4%) | $125,208 |
| Total | 684 (100.0%) | $55,658 |
Household Income in Fairmount
Household Income Brackets in Fairmount
With 252 households falling in the category, the $50,000 to $74,999 income range is the most frequent in Fairmount, accounting for 22.7% of all households.
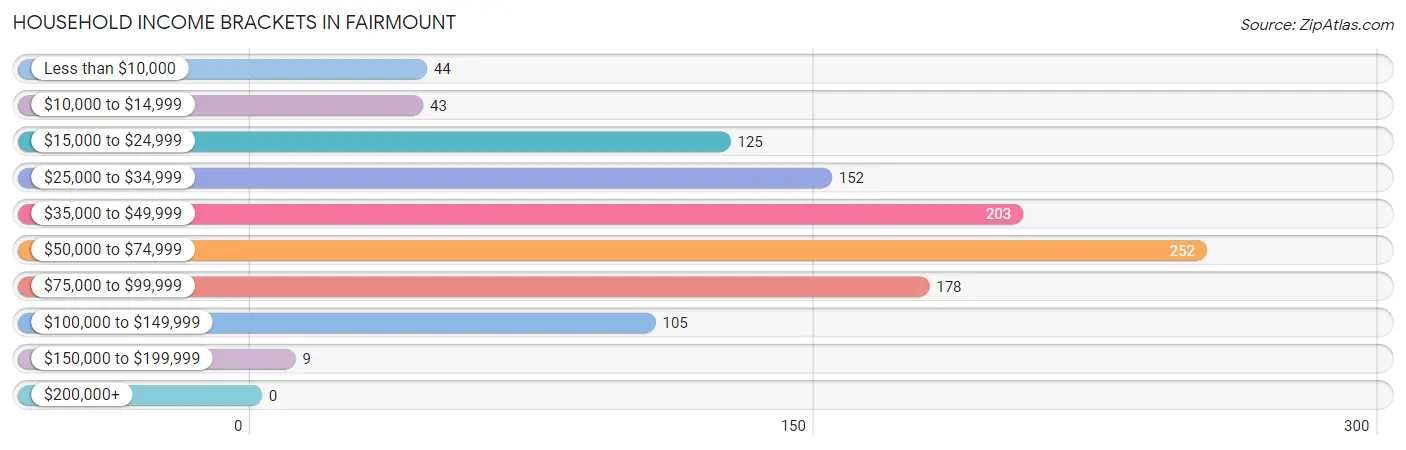
| Income Bracket | # Households | % Households |
| Less than $10,000 | 44 | 4.0% |
| $10,000 to $14,999 | 43 | 3.9% |
| $15,000 to $24,999 | 125 | 11.2% |
| $25,000 to $34,999 | 152 | 13.7% |
| $35,000 to $49,999 | 203 | 18.3% |
| $50,000 to $74,999 | 252 | 22.7% |
| $75,000 to $99,999 | 178 | 16.0% |
| $100,000 to $149,999 | 105 | 9.4% |
| $150,000 to $199,999 | 9 | 0.8% |
| $200,000+ | 0 | 0.0% |
Household Income by Householder Age in Fairmount
The median household income in Fairmount is $48,235, with the highest median household income of $60,147 found in the 45 to 64 years age bracket for the primary householder. A total of 332 households (29.9%) fall into this category. Meanwhile, the 15 to 24 years age bracket for the primary householder has the lowest median household income of $0, with 48 households (4.3%) in this group.
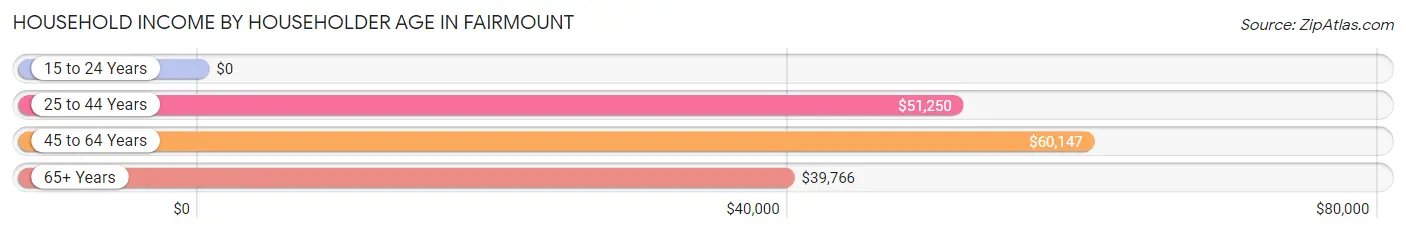
| Income Bracket | # Households | Median Income |
| 15 to 24 Years | 48 (4.3%) | $0 |
| 25 to 44 Years | 347 (31.2%) | $51,250 |
| 45 to 64 Years | 332 (29.9%) | $60,147 |
| 65+ Years | 385 (34.6%) | $39,766 |
| Total | 1,112 (100.0%) | $48,235 |
Poverty in Fairmount
Income Below Poverty by Sex and Age in Fairmount
With 22.4% poverty level for males and 24.9% for females among the residents of Fairmount, 6 to 11 year old males and 18 to 24 year old females are the most vulnerable to poverty, with 166 males (70.9%) and 27 females (84.4%) in their respective age groups living below the poverty level.
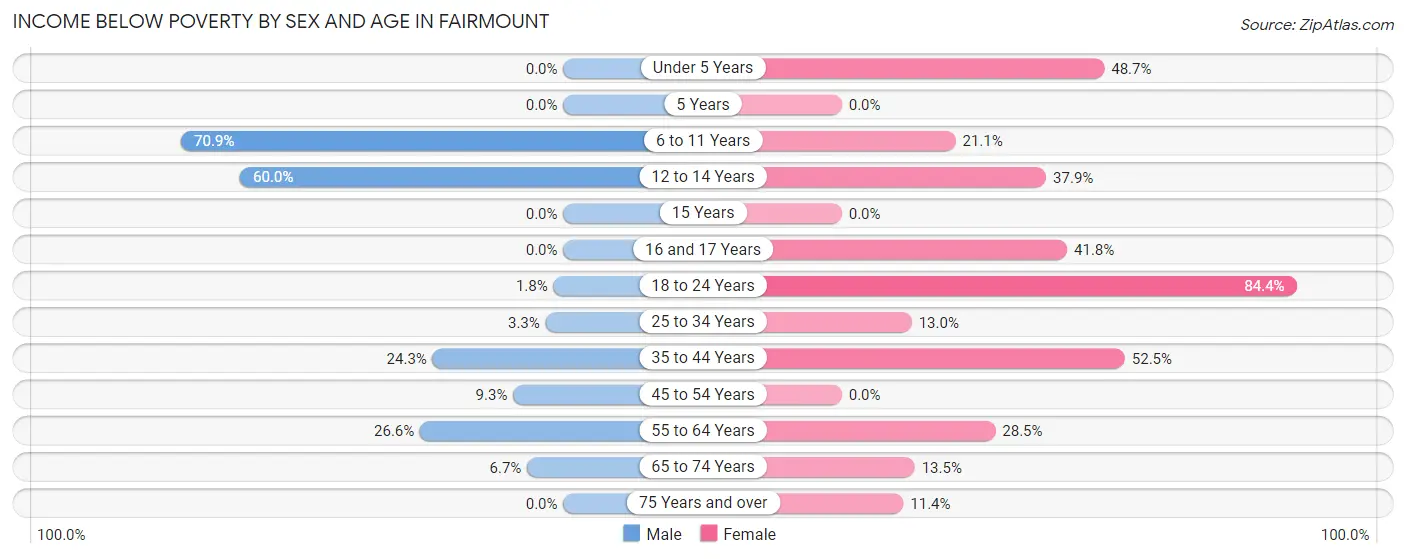
| Age Bracket | Male | Female |
| Under 5 Years | 0 (0.0%) | 38 (48.7%) |
| 5 Years | 0 (0.0%) | 0 (0.0%) |
| 6 to 11 Years | 166 (70.9%) | 19 (21.1%) |
| 12 to 14 Years | 27 (60.0%) | 11 (37.9%) |
| 15 Years | 0 (0.0%) | 0 (0.0%) |
| 16 and 17 Years | 0 (0.0%) | 23 (41.8%) |
| 18 to 24 Years | 1 (1.8%) | 27 (84.4%) |
| 25 to 34 Years | 7 (3.3%) | 27 (13.0%) |
| 35 to 44 Years | 33 (24.3%) | 62 (52.5%) |
| 45 to 54 Years | 16 (9.3%) | 0 (0.0%) |
| 55 to 64 Years | 46 (26.6%) | 59 (28.5%) |
| 65 to 74 Years | 8 (6.7%) | 31 (13.5%) |
| 75 Years and over | 0 (0.0%) | 8 (11.4%) |
| Total | 304 (22.4%) | 305 (24.9%) |
Income Above Poverty by Sex and Age in Fairmount
According to the poverty statistics in Fairmount, males aged under 5 years and females aged 15 years are the age groups that are most secure financially, with 100.0% of males and 100.0% of females in these age groups living above the poverty line.
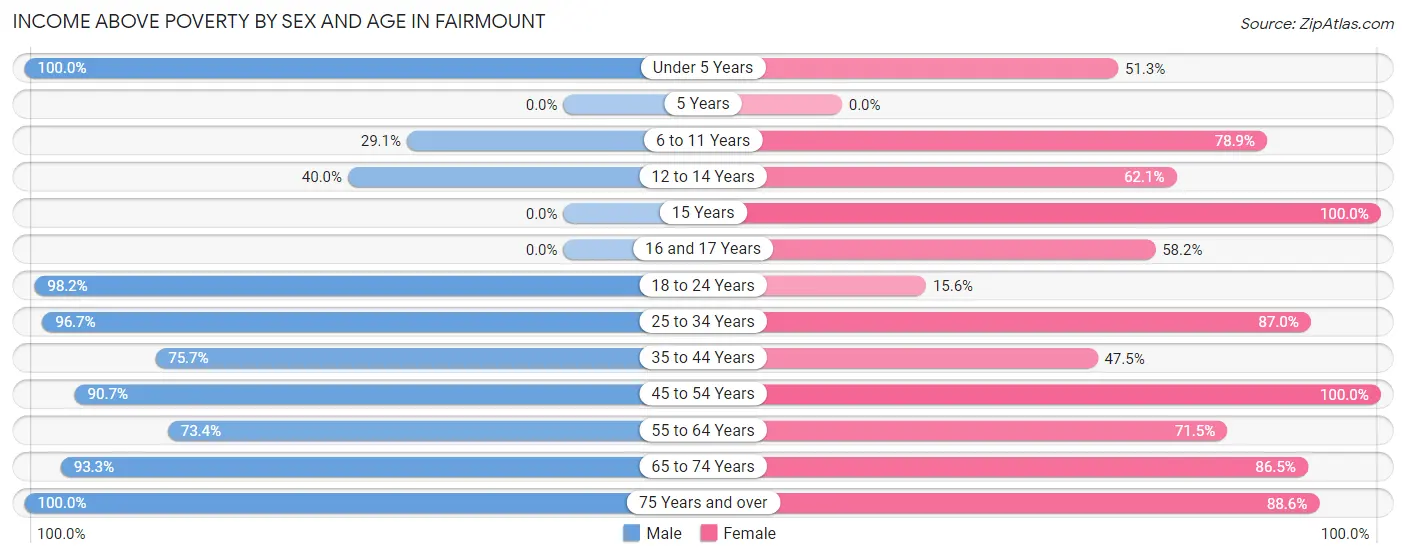
| Age Bracket | Male | Female |
| Under 5 Years | 107 (100.0%) | 40 (51.3%) |
| 5 Years | 0 (0.0%) | 0 (0.0%) |
| 6 to 11 Years | 68 (29.1%) | 71 (78.9%) |
| 12 to 14 Years | 18 (40.0%) | 18 (62.1%) |
| 15 Years | 0 (0.0%) | 25 (100.0%) |
| 16 and 17 Years | 0 (0.0%) | 32 (58.2%) |
| 18 to 24 Years | 54 (98.2%) | 5 (15.6%) |
| 25 to 34 Years | 206 (96.7%) | 181 (87.0%) |
| 35 to 44 Years | 103 (75.7%) | 56 (47.5%) |
| 45 to 54 Years | 156 (90.7%) | 83 (100.0%) |
| 55 to 64 Years | 127 (73.4%) | 148 (71.5%) |
| 65 to 74 Years | 111 (93.3%) | 198 (86.5%) |
| 75 Years and over | 104 (100.0%) | 62 (88.6%) |
| Total | 1,054 (77.6%) | 919 (75.1%) |
Income Below Poverty Among Married-Couple Families in Fairmount
The poverty statistics for married-couple families in Fairmount show that 5.4% or 21 of the total 385 families live below the poverty line. Families with 1 or 2 children have the highest poverty rate of 11.5%, comprising of 13 families. On the other hand, families with 3 or 4 children have the lowest poverty rate of 0.0%, which includes 0 families.
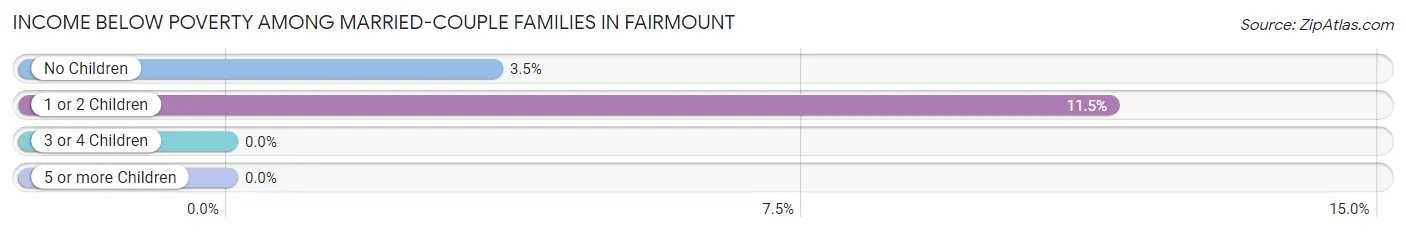
| Children | Above Poverty | Below Poverty |
| No Children | 223 (96.5%) | 8 (3.5%) |
| 1 or 2 Children | 100 (88.5%) | 13 (11.5%) |
| 3 or 4 Children | 41 (100.0%) | 0 (0.0%) |
| 5 or more Children | 0 (0.0%) | 0 (0.0%) |
| Total | 364 (94.6%) | 21 (5.4%) |
Income Below Poverty Among Single-Parent Households in Fairmount
According to the poverty data in Fairmount, 22.1% or 17 single-father households and 37.8% or 84 single-mother households are living below the poverty line. Among single-father households, those with 1 or 2 children have the highest poverty rate, with 17 households (27.9%) experiencing poverty. Likewise, among single-mother households, those with 3 or 4 children have the highest poverty rate, with 57 households (100.0%) falling below the poverty line.
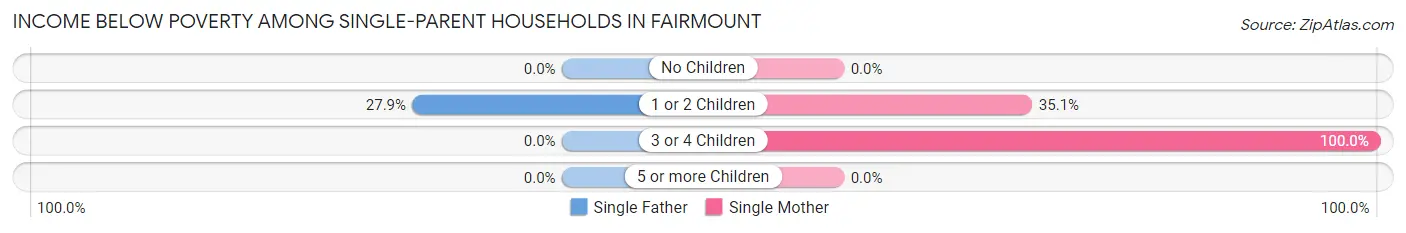
| Children | Single Father | Single Mother |
| No Children | 0 (0.0%) | 0 (0.0%) |
| 1 or 2 Children | 17 (27.9%) | 27 (35.1%) |
| 3 or 4 Children | 0 (0.0%) | 57 (100.0%) |
| 5 or more Children | 0 (0.0%) | 0 (0.0%) |
| Total | 17 (22.1%) | 84 (37.8%) |
Income Below Poverty Among Married-Couple vs Single-Parent Households in Fairmount
The poverty data for Fairmount shows that 21 of the married-couple family households (5.4%) and 101 of the single-parent households (33.8%) are living below the poverty level. Within the married-couple family households, those with 1 or 2 children have the highest poverty rate, with 13 households (11.5%) falling below the poverty line. Among the single-parent households, those with 3 or 4 children have the highest poverty rate, with 57 household (100.0%) living below poverty.
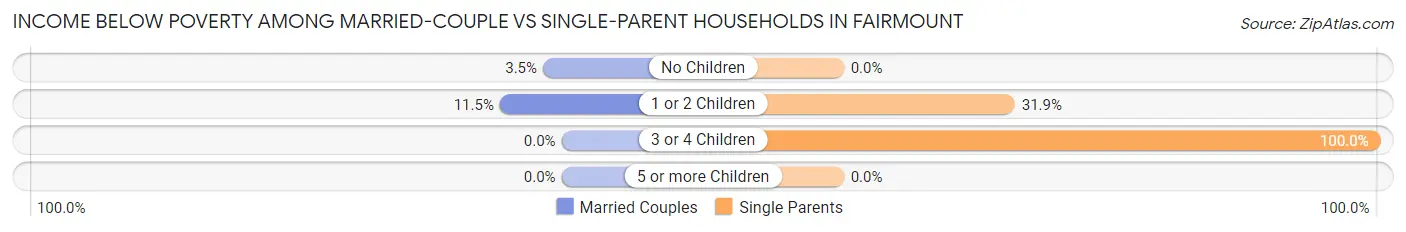
| Children | Married-Couple Families | Single-Parent Households |
| No Children | 8 (3.5%) | 0 (0.0%) |
| 1 or 2 Children | 13 (11.5%) | 44 (31.9%) |
| 3 or 4 Children | 0 (0.0%) | 57 (100.0%) |
| 5 or more Children | 0 (0.0%) | 0 (0.0%) |
| Total | 21 (5.4%) | 101 (33.8%) |
Race in Fairmount
The most populous races in Fairmount are White / Caucasian (2,431 | 94.2%), Two or more Races (118 | 4.6%), and Hispanic or Latino (31 | 1.2%).
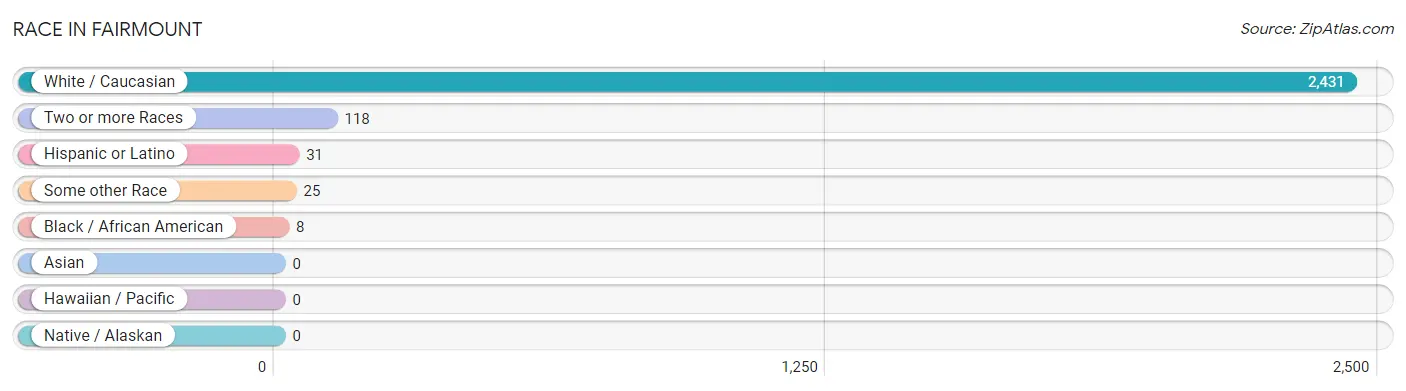
| Race | # Population | % Population |
| Asian | 0 | 0.0% |
| Black / African American | 8 | 0.3% |
| Hawaiian / Pacific | 0 | 0.0% |
| Hispanic or Latino | 31 | 1.2% |
| Native / Alaskan | 0 | 0.0% |
| White / Caucasian | 2,431 | 94.2% |
| Two or more Races | 118 | 4.6% |
| Some other Race | 25 | 1.0% |
| Total | 2,582 | 100.0% |
Ancestry in Fairmount
The most populous ancestries reported in Fairmount are German (470 | 18.2%), Irish (400 | 15.5%), American (364 | 14.1%), English (194 | 7.5%), and French (121 | 4.7%), together accounting for 60.0% of all Fairmount residents.
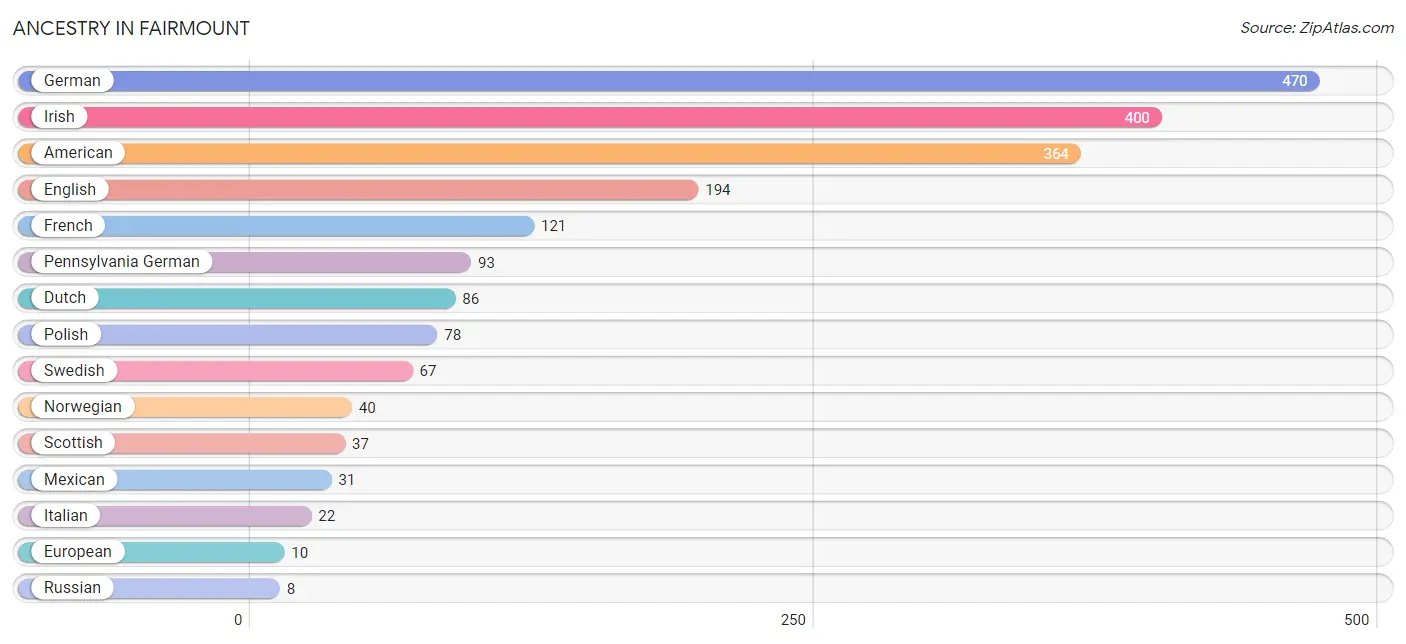
| Ancestry | # Population | % Population |
| American | 364 | 14.1% |
| Austrian | 7 | 0.3% |
| Blackfeet | 4 | 0.2% |
| Cherokee | 3 | 0.1% |
| Dutch | 86 | 3.3% |
| English | 194 | 7.5% |
| European | 10 | 0.4% |
| French | 121 | 4.7% |
| German | 470 | 18.2% |
| Irish | 400 | 15.5% |
| Italian | 22 | 0.9% |
| Mexican | 31 | 1.2% |
| Norwegian | 40 | 1.5% |
| Pennsylvania German | 93 | 3.6% |
| Polish | 78 | 3.0% |
| Russian | 8 | 0.3% |
| Scotch-Irish | 8 | 0.3% |
| Scottish | 37 | 1.4% |
| Swedish | 67 | 2.6% | View All 19 Rows |
Immigrants in Fairmount

| Immigration Origin | # Population | % Population | View All 0 Rows |
Sex and Age in Fairmount
Sex and Age in Fairmount
The most populous age groups in Fairmount are 5 to 9 Years (170 | 12.5%) for men and 70 to 74 Years (126 | 10.3%) for women.
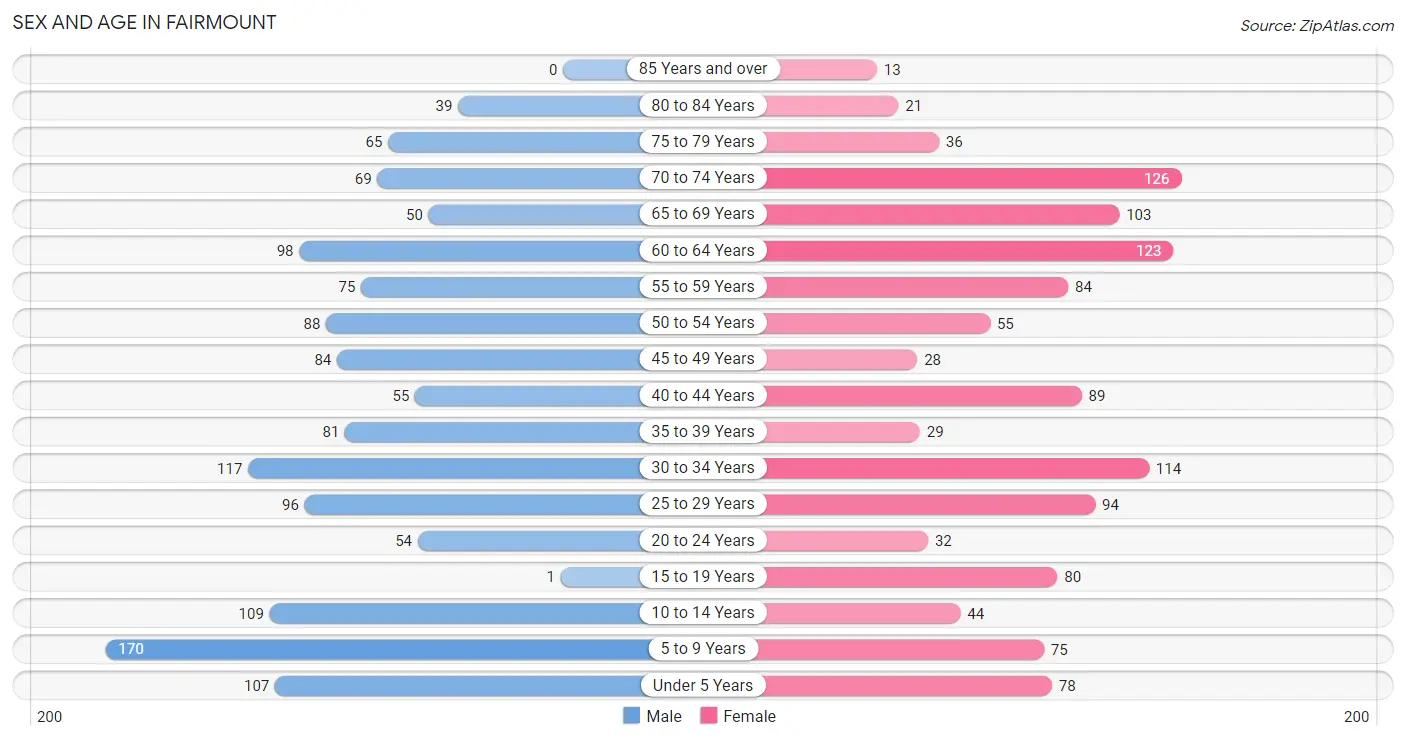
| Age Bracket | Male | Female |
| Under 5 Years | 107 (7.9%) | 78 (6.4%) |
| 5 to 9 Years | 170 (12.5%) | 75 (6.1%) |
| 10 to 14 Years | 109 (8.0%) | 44 (3.6%) |
| 15 to 19 Years | 1 (0.1%) | 80 (6.5%) |
| 20 to 24 Years | 54 (4.0%) | 32 (2.6%) |
| 25 to 29 Years | 96 (7.1%) | 94 (7.7%) |
| 30 to 34 Years | 117 (8.6%) | 114 (9.3%) |
| 35 to 39 Years | 81 (6.0%) | 29 (2.4%) |
| 40 to 44 Years | 55 (4.1%) | 89 (7.3%) |
| 45 to 49 Years | 84 (6.2%) | 28 (2.3%) |
| 50 to 54 Years | 88 (6.5%) | 55 (4.5%) |
| 55 to 59 Years | 75 (5.5%) | 84 (6.9%) |
| 60 to 64 Years | 98 (7.2%) | 123 (10.1%) |
| 65 to 69 Years | 50 (3.7%) | 103 (8.4%) |
| 70 to 74 Years | 69 (5.1%) | 126 (10.3%) |
| 75 to 79 Years | 65 (4.8%) | 36 (2.9%) |
| 80 to 84 Years | 39 (2.9%) | 21 (1.7%) |
| 85 Years and over | 0 (0.0%) | 13 (1.1%) |
| Total | 1,358 (100.0%) | 1,224 (100.0%) |
Families and Households in Fairmount
Median Family Size in Fairmount
The median family size in Fairmount is 2.80 persons per family, with married-couple families (385 | 56.3%) accounting for the largest median family size of 2.92 persons per family. On the other hand, single male/father families (77 | 11.3%) represent the smallest median family size with 2.56 persons per family.
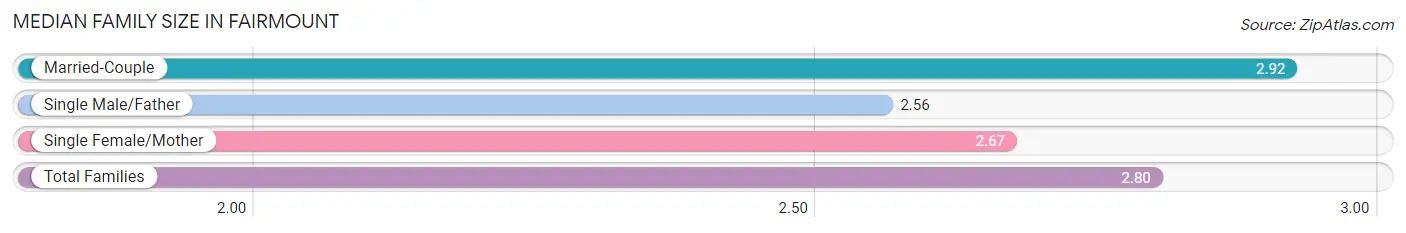
| Family Type | # Families | Family Size |
| Married-Couple | 385 (56.3%) | 2.92 |
| Single Male/Father | 77 (11.3%) | 2.56 |
| Single Female/Mother | 222 (32.5%) | 2.67 |
| Total Families | 684 (100.0%) | 2.80 |
Median Household Size in Fairmount
The median household size in Fairmount is 2.32 persons per household, with single female/mother households (222 | 20.0%) accounting for the largest median household size of 3.15 persons per household. non-family households (428 | 38.5%) represent the smallest median household size with 1.18 persons per household.
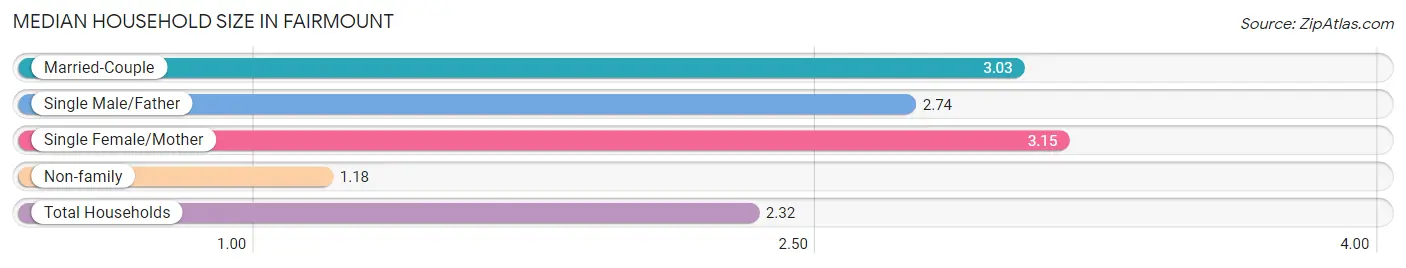
| Household Type | # Households | Household Size |
| Married-Couple | 385 (34.6%) | 3.03 |
| Single Male/Father | 77 (6.9%) | 2.74 |
| Single Female/Mother | 222 (20.0%) | 3.15 |
| Non-family | 428 (38.5%) | 1.18 |
| Total Households | 1,112 (100.0%) | 2.32 |
Household Size by Marriage Status in Fairmount
Out of a total of 1,112 households in Fairmount, 684 (61.5%) are family households, while 428 (38.5%) are nonfamily households. The most numerous type of family households are 2-person households, comprising 346, and the most common type of nonfamily households are 1-person households, comprising 326.
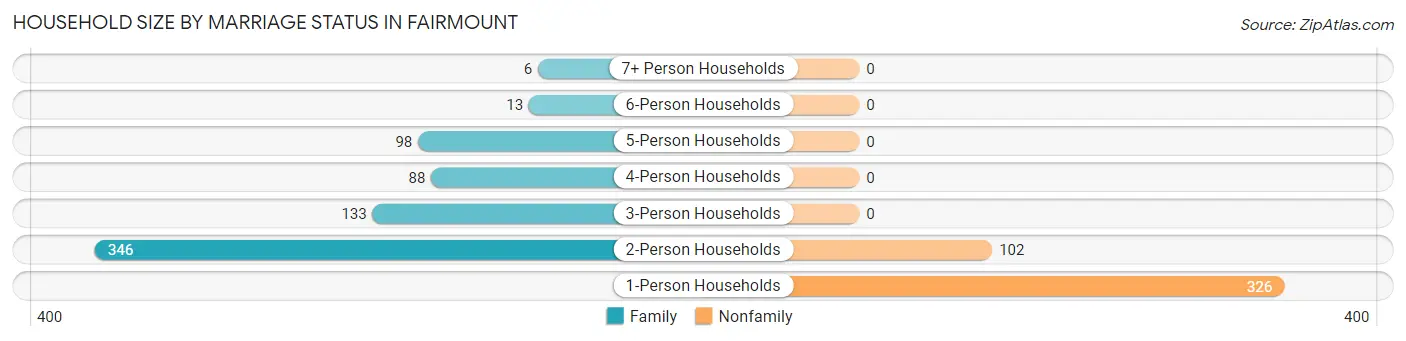
| Household Size | Family Households | Nonfamily Households |
| 1-Person Households | - | 326 (29.3%) |
| 2-Person Households | 346 (31.1%) | 102 (9.2%) |
| 3-Person Households | 133 (12.0%) | 0 (0.0%) |
| 4-Person Households | 88 (7.9%) | 0 (0.0%) |
| 5-Person Households | 98 (8.8%) | 0 (0.0%) |
| 6-Person Households | 13 (1.2%) | 0 (0.0%) |
| 7+ Person Households | 6 (0.5%) | 0 (0.0%) |
| Total | 684 (61.5%) | 428 (38.5%) |
Female Fertility in Fairmount
Fertility by Age in Fairmount
Average fertility rate in Fairmount is 97.0 births per 1,000 women. Women in the age bracket of 20 to 34 years have the highest fertility rate with 188.0 births per 1,000 women. Women in the age bracket of 20 to 34 years acount for 100.0% of all women with births.
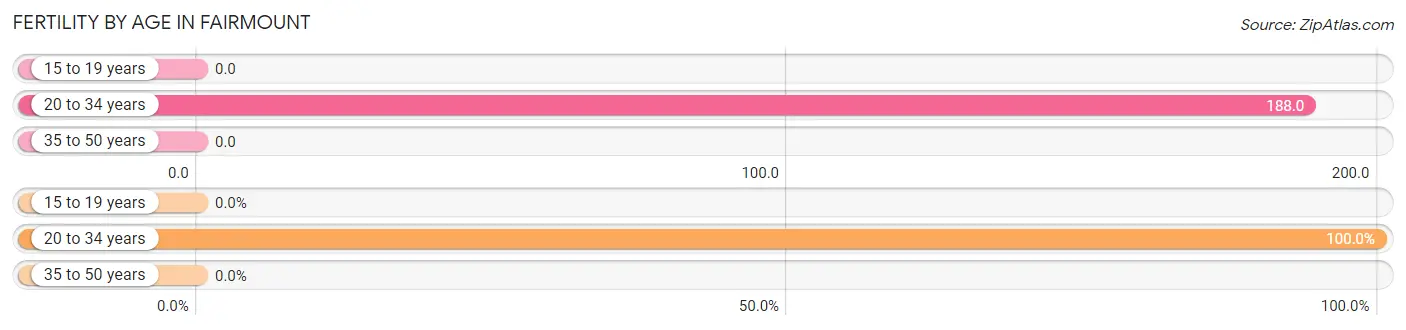
| Age Bracket | Women with Births | Births / 1,000 Women |
| 15 to 19 years | 0 (0.0%) | 0.0 |
| 20 to 34 years | 45 (100.0%) | 188.0 |
| 35 to 50 years | 0 (0.0%) | 0.0 |
| Total | 45 (100.0%) | 97.0 |
Fertility by Age by Marriage Status in Fairmount
22.2% of women with births (45) in Fairmount are married. The highest percentage of unmarried women with births falls into 20 to 34 years age bracket with 77.8% of them unmarried at the time of birth, while the lowest percentage of unmarried women with births belong to 20 to 34 years age bracket with 77.8% of them unmarried.
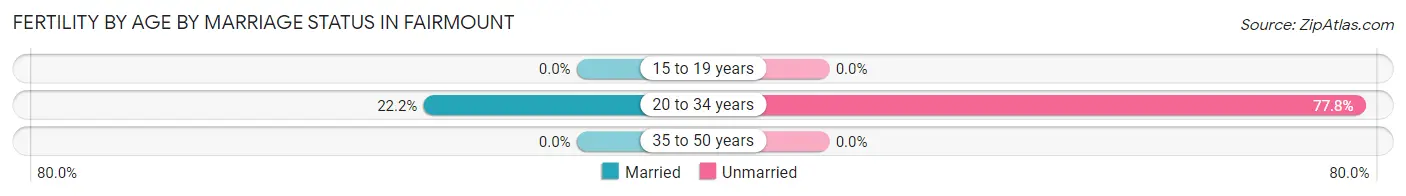
| Age Bracket | Married | Unmarried |
| 15 to 19 years | 0 (0.0%) | 0 (0.0%) |
| 20 to 34 years | 10 (22.2%) | 35 (77.8%) |
| 35 to 50 years | 0 (0.0%) | 0 (0.0%) |
| Total | 10 (22.2%) | 35 (77.8%) |
Fertility by Education in Fairmount
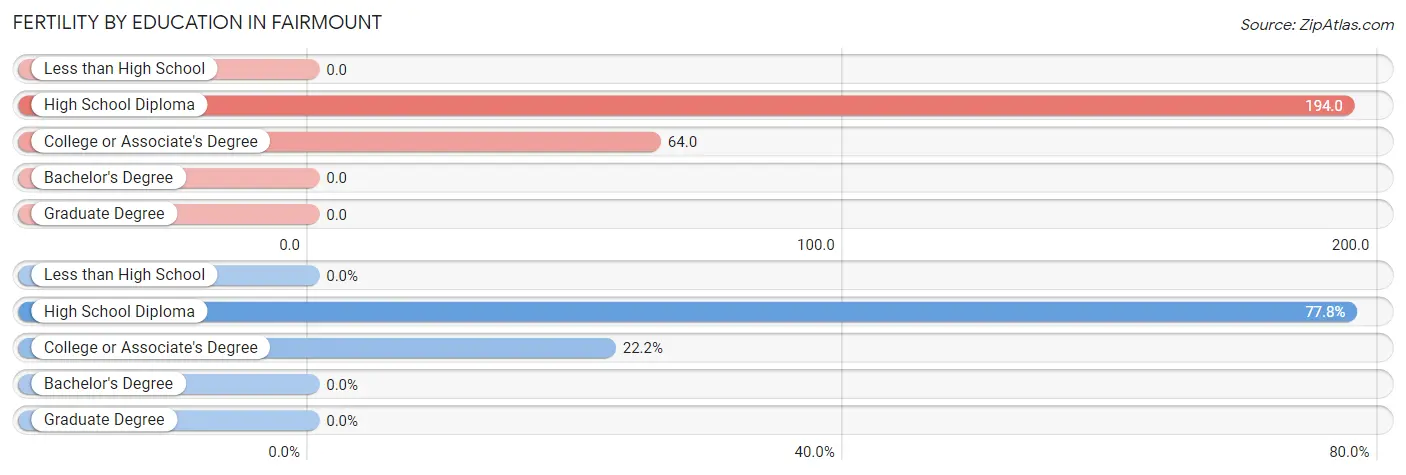
| Educational Attainment | Women with Births | Births / 1,000 Women |
| Less than High School | 0 (0.0%) | 0.0 |
| High School Diploma | 35 (77.8%) | 194.0 |
| College or Associate's Degree | 10 (22.2%) | 64.0 |
| Bachelor's Degree | 0 (0.0%) | 0.0 |
| Graduate Degree | 0 (0.0%) | 0.0 |
| Total | 45 (100.0%) | 97.0 |
Fertility by Education by Marriage Status in Fairmount
77.8% of women with births in Fairmount are unmarried. Women with the educational attainment of college or associate's degree are most likely to be married with 100.0% of them married at childbirth, while women with the educational attainment of high school diploma are least likely to be married with 100.0% of them unmarried at childbirth.
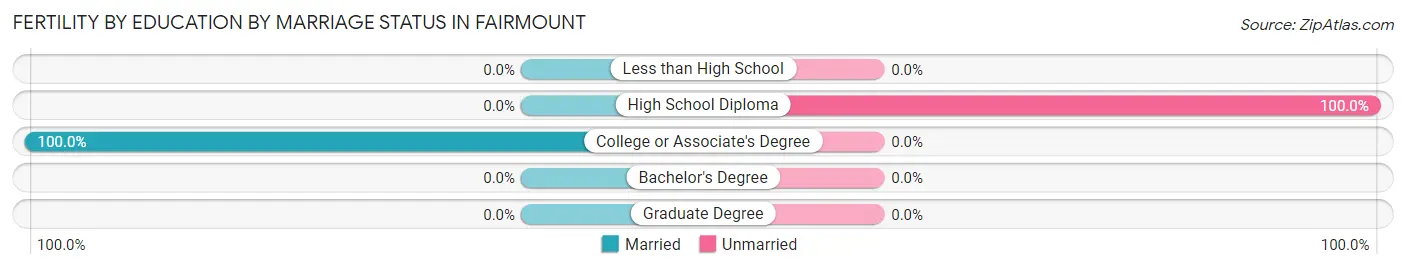
| Educational Attainment | Married | Unmarried |
| Less than High School | 0 (0.0%) | 0 (0.0%) |
| High School Diploma | 0 (0.0%) | 35 (100.0%) |
| College or Associate's Degree | 10 (100.0%) | 0 (0.0%) |
| Bachelor's Degree | 0 (0.0%) | 0 (0.0%) |
| Graduate Degree | 0 (0.0%) | 0 (0.0%) |
| Total | 10 (22.2%) | 35 (77.8%) |
Employment Characteristics in Fairmount
Employment by Class of Employer in Fairmount
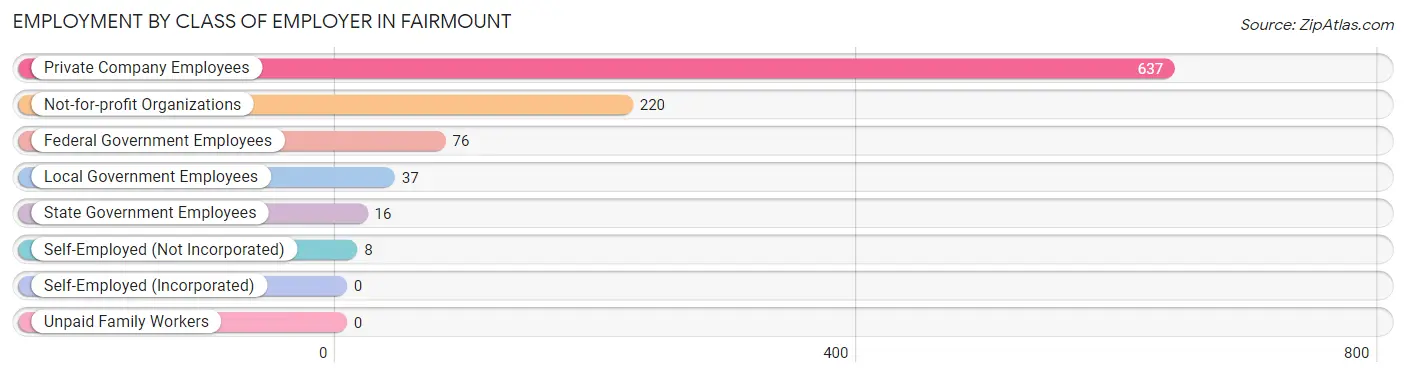
Among the 994 employed individuals in Fairmount, private company employees (637 | 64.1%), not-for-profit organizations (220 | 22.1%), and federal government employees (76 | 7.6%) make up the most common classes of employment.
| Employer Class | # Employees | % Employees |
| Private Company Employees | 637 | 64.1% |
| Self-Employed (Incorporated) | 0 | 0.0% |
| Self-Employed (Not Incorporated) | 8 | 0.8% |
| Not-for-profit Organizations | 220 | 22.1% |
| Local Government Employees | 37 | 3.7% |
| State Government Employees | 16 | 1.6% |
| Federal Government Employees | 76 | 7.6% |
| Unpaid Family Workers | 0 | 0.0% |
| Total | 994 | 100.0% |
Employment Status by Age in Fairmount
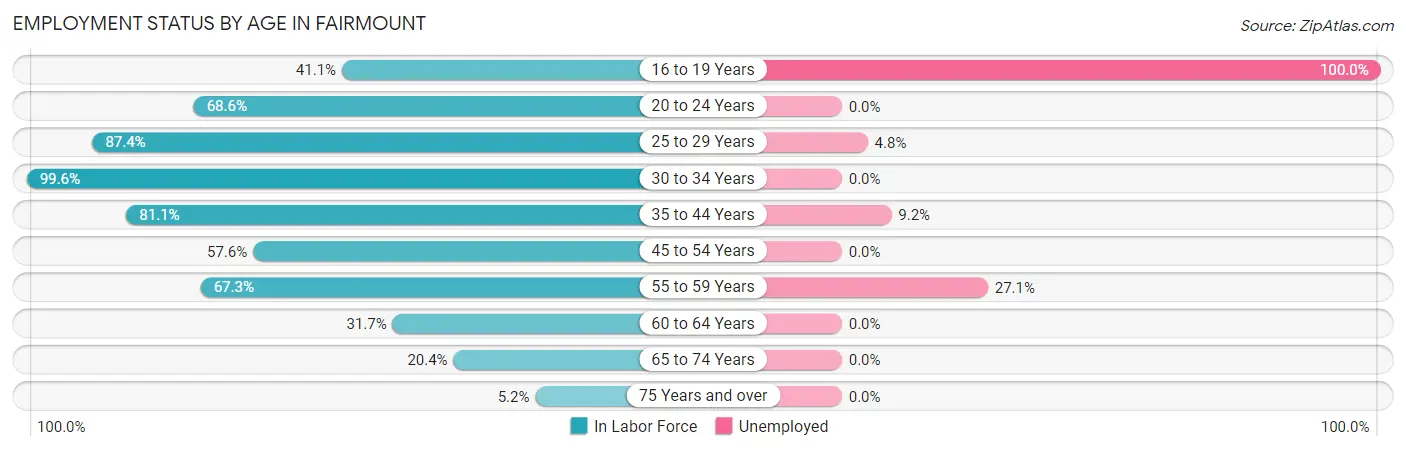
According to the labor force statistics for Fairmount, out of the total population over 16 years of age (1,974), 55.1% or 1,088 individuals are in the labor force, with 7.3% or 79 of them unemployed. The age group with the highest labor force participation rate is 30 to 34 years, with 99.6% or 230 individuals in the labor force. Within the labor force, the 16 to 19 years age range has the highest percentage of unemployed individuals, with 100.0% or 23 of them being unemployed.
| Age Bracket | In Labor Force | Unemployed |
| 16 to 19 Years | 23 (41.1%) | 23 (100.0%) |
| 20 to 24 Years | 59 (68.6%) | 0 (0.0%) |
| 25 to 29 Years | 166 (87.4%) | 8 (4.8%) |
| 30 to 34 Years | 230 (99.6%) | 0 (0.0%) |
| 35 to 44 Years | 206 (81.1%) | 19 (9.2%) |
| 45 to 54 Years | 147 (57.6%) | 0 (0.0%) |
| 55 to 59 Years | 107 (67.3%) | 29 (27.1%) |
| 60 to 64 Years | 70 (31.7%) | 0 (0.0%) |
| 65 to 74 Years | 71 (20.4%) | 0 (0.0%) |
| 75 Years and over | 9 (5.2%) | 0 (0.0%) |
| Total | 1,088 (55.1%) | 79 (7.3%) |
Employment Status by Educational Attainment in Fairmount
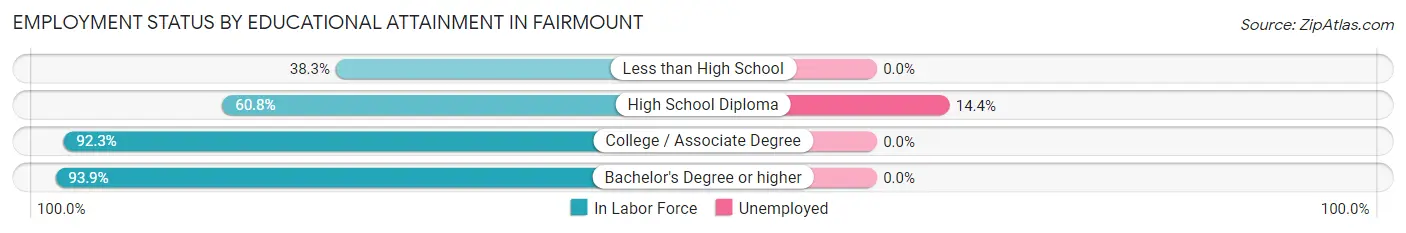
According to labor force statistics for Fairmount, 70.7% of individuals (926) out of the total population between 25 and 64 years of age (1,310) are in the labor force, with 6.0% or 56 of them being unemployed. The group with the highest labor force participation rate are those with the educational attainment of bachelor's degree or higher, with 93.9% or 107 individuals in the labor force. Within the labor force, individuals with high school diploma education have the highest percentage of unemployment, with 14.4% or 56 of them being unemployed.
| Educational Attainment | In Labor Force | Unemployed |
| Less than High School | 59 (38.3%) | 0 (0.0%) |
| High School Diploma | 389 (60.8%) | 92 (14.4%) |
| College / Associate Degree | 371 (92.3%) | 0 (0.0%) |
| Bachelor's Degree or higher | 107 (93.9%) | 0 (0.0%) |
| Total | 926 (70.7%) | 79 (6.0%) |
Employment Occupations by Sex in Fairmount
Management, Business, Science and Arts Occupations
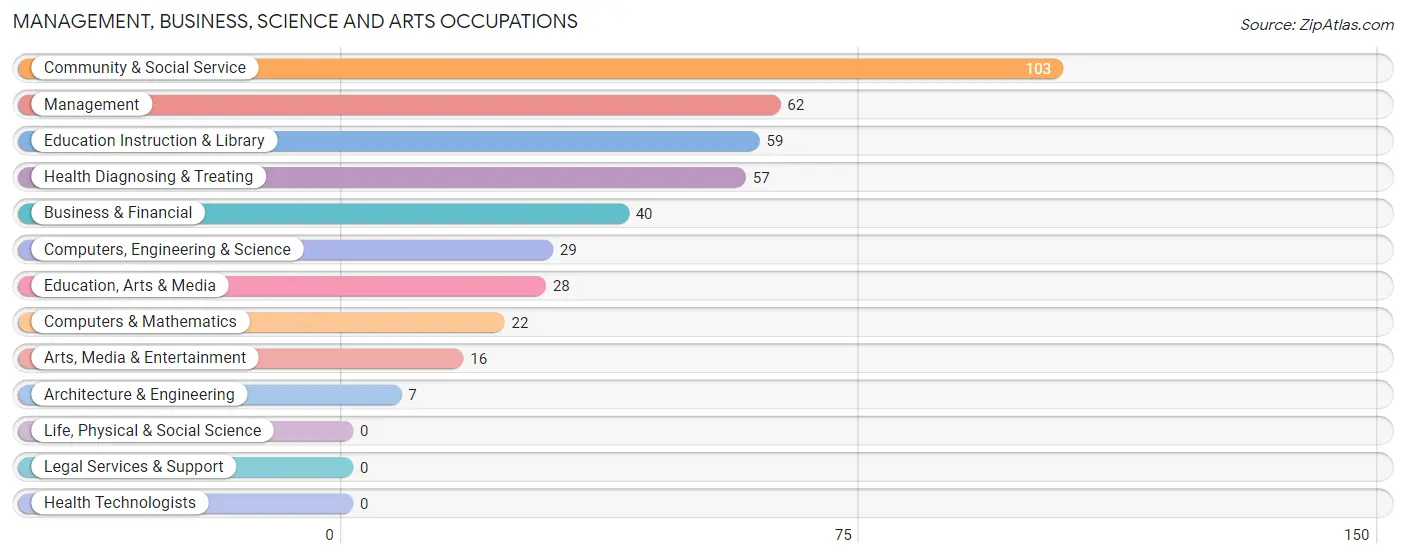
The most common Management, Business, Science and Arts occupations in Fairmount are Community & Social Service (103 | 10.2%), Management (62 | 6.1%), Education Instruction & Library (59 | 5.9%), Health Diagnosing & Treating (57 | 5.7%), and Business & Financial (40 | 4.0%).
Management, Business, Science and Arts Occupations by Sex
Within the Management, Business, Science and Arts occupations in Fairmount, the most male-oriented occupations are Computers, Engineering & Science (100.0%), Computers & Mathematics (100.0%), and Architecture & Engineering (100.0%), while the most female-oriented occupations are Education Instruction & Library (100.0%), Arts, Media & Entertainment (100.0%), and Health Diagnosing & Treating (87.7%).
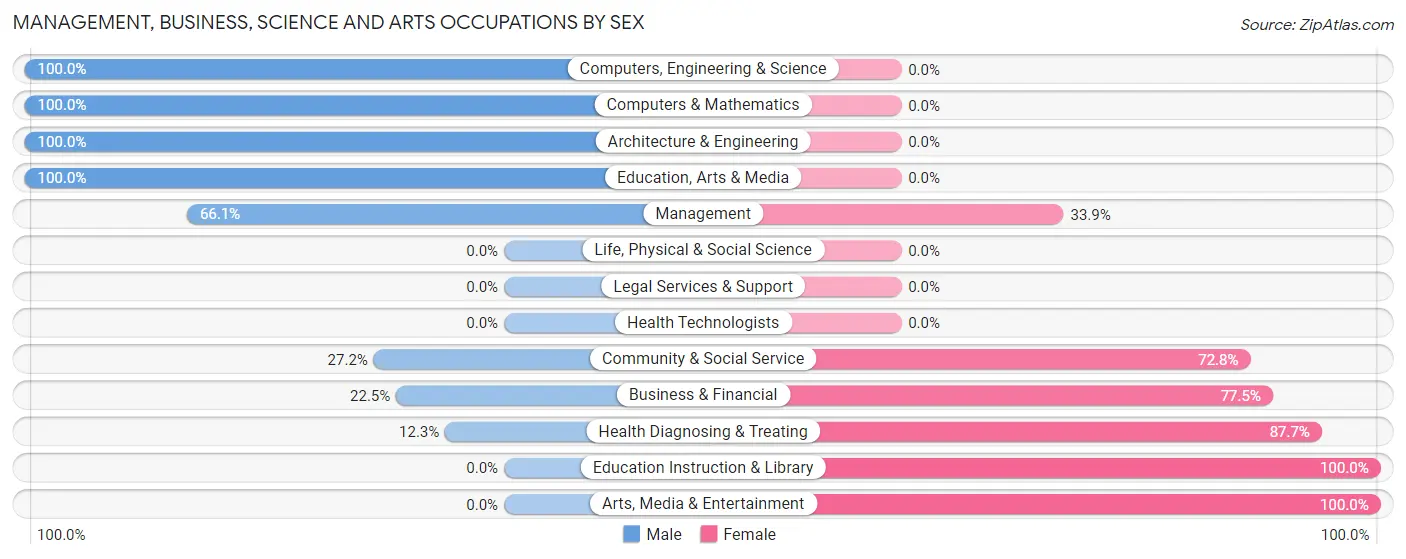
| Occupation | Male | Female |
| Management | 41 (66.1%) | 21 (33.9%) |
| Business & Financial | 9 (22.5%) | 31 (77.5%) |
| Computers, Engineering & Science | 29 (100.0%) | 0 (0.0%) |
| Computers & Mathematics | 22 (100.0%) | 0 (0.0%) |
| Architecture & Engineering | 7 (100.0%) | 0 (0.0%) |
| Life, Physical & Social Science | 0 (0.0%) | 0 (0.0%) |
| Community & Social Service | 28 (27.2%) | 75 (72.8%) |
| Education, Arts & Media | 28 (100.0%) | 0 (0.0%) |
| Legal Services & Support | 0 (0.0%) | 0 (0.0%) |
| Education Instruction & Library | 0 (0.0%) | 59 (100.0%) |
| Arts, Media & Entertainment | 0 (0.0%) | 16 (100.0%) |
| Health Diagnosing & Treating | 7 (12.3%) | 50 (87.7%) |
| Health Technologists | 0 (0.0%) | 0 (0.0%) |
| Total (Category) | 114 (39.2%) | 177 (60.8%) |
| Total (Overall) | 559 (55.4%) | 450 (44.6%) |
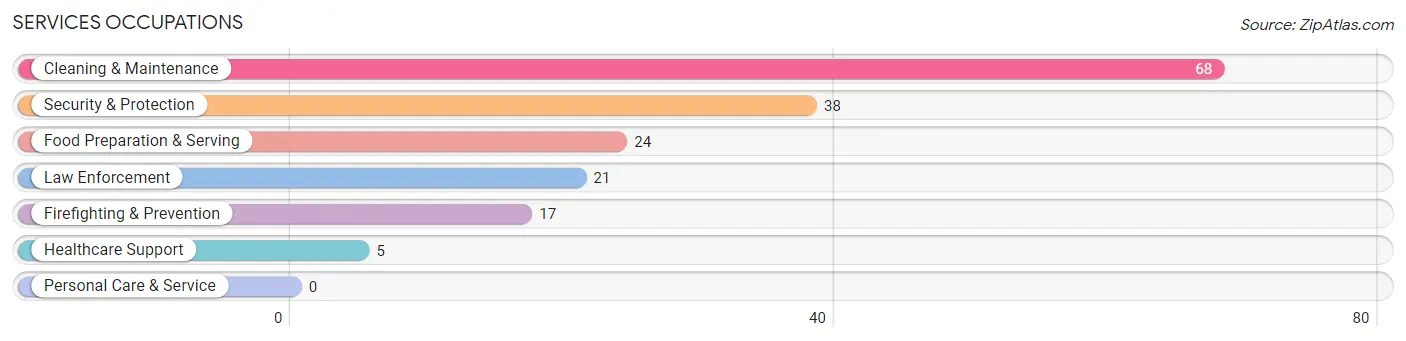
Services Occupations
The most common Services occupations in Fairmount are Cleaning & Maintenance (68 | 6.7%), Security & Protection (38 | 3.8%), Food Preparation & Serving (24 | 2.4%), Law Enforcement (21 | 2.1%), and Firefighting & Prevention (17 | 1.7%).
Services Occupations by Sex
Within the Services occupations in Fairmount, the most male-oriented occupations are Security & Protection (100.0%), Firefighting & Prevention (100.0%), and Law Enforcement (100.0%), while the most female-oriented occupations are Healthcare Support (100.0%), Food Preparation & Serving (100.0%), and Cleaning & Maintenance (14.7%).
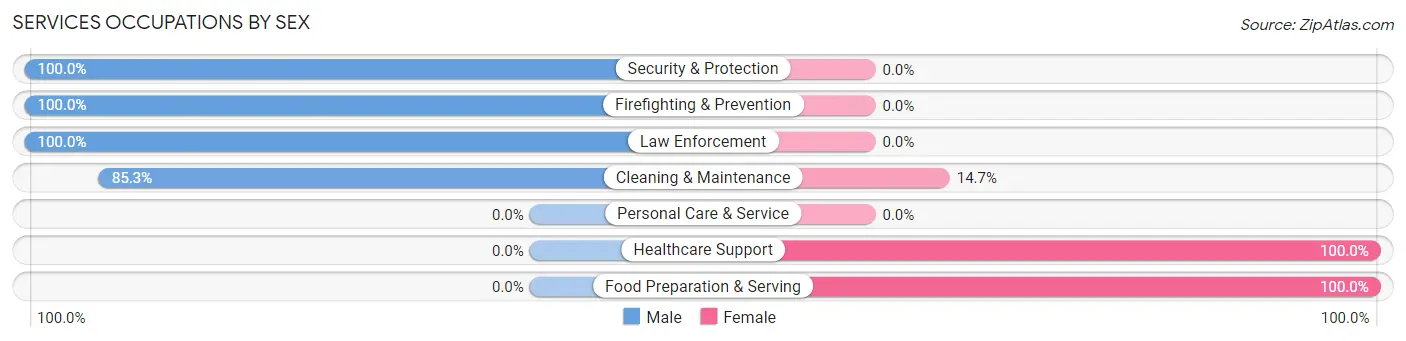
| Occupation | Male | Female |
| Healthcare Support | 0 (0.0%) | 5 (100.0%) |
| Security & Protection | 38 (100.0%) | 0 (0.0%) |
| Firefighting & Prevention | 17 (100.0%) | 0 (0.0%) |
| Law Enforcement | 21 (100.0%) | 0 (0.0%) |
| Food Preparation & Serving | 0 (0.0%) | 24 (100.0%) |
| Cleaning & Maintenance | 58 (85.3%) | 10 (14.7%) |
| Personal Care & Service | 0 (0.0%) | 0 (0.0%) |
| Total (Category) | 96 (71.1%) | 39 (28.9%) |
| Total (Overall) | 559 (55.4%) | 450 (44.6%) |
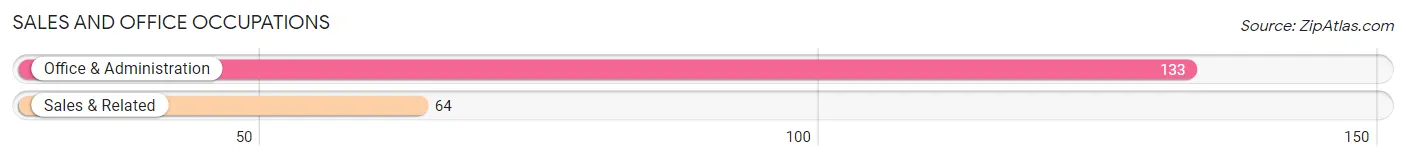
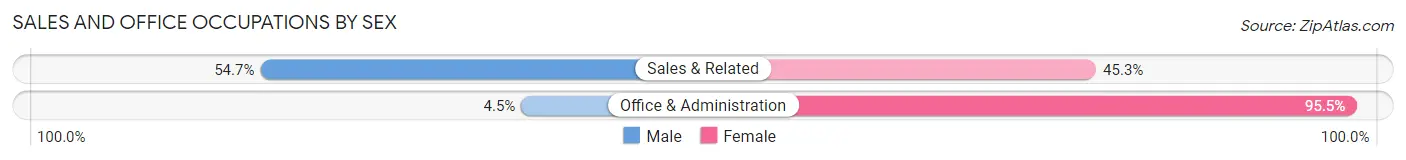
Sales and Office Occupations
The most common Sales and Office occupations in Fairmount are Office & Administration (133 | 13.2%), and Sales & Related (64 | 6.3%).
Sales and Office Occupations by Sex
| Occupation | Male | Female |
| Sales & Related | 35 (54.7%) | 29 (45.3%) |
| Office & Administration | 6 (4.5%) | 127 (95.5%) |
| Total (Category) | 41 (20.8%) | 156 (79.2%) |
| Total (Overall) | 559 (55.4%) | 450 (44.6%) |
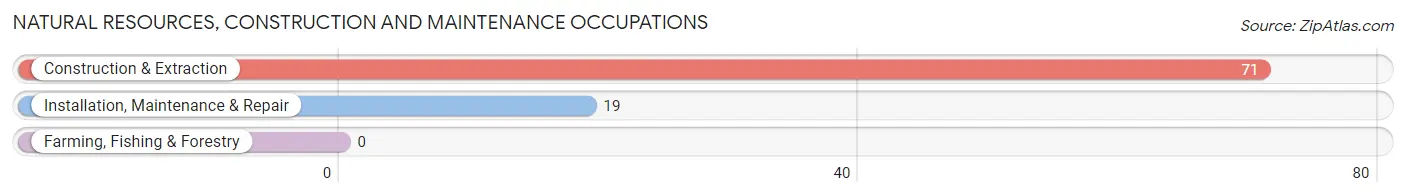
Natural Resources, Construction and Maintenance Occupations
The most common Natural Resources, Construction and Maintenance occupations in Fairmount are Construction & Extraction (71 | 7.0%), and Installation, Maintenance & Repair (19 | 1.9%).
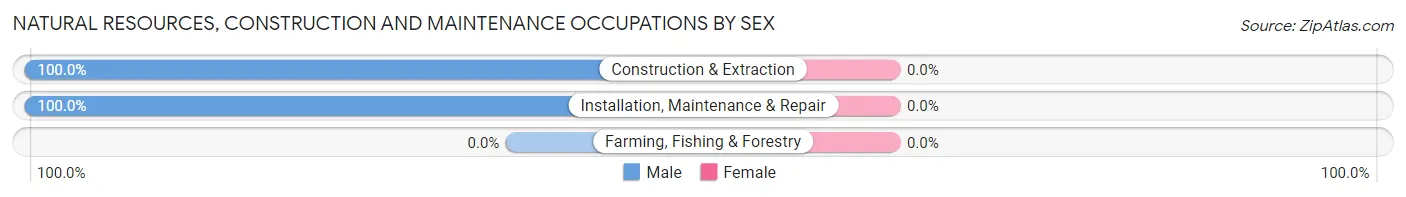
Natural Resources, Construction and Maintenance Occupations by Sex
| Occupation | Male | Female |
| Farming, Fishing & Forestry | 0 (0.0%) | 0 (0.0%) |
| Construction & Extraction | 71 (100.0%) | 0 (0.0%) |
| Installation, Maintenance & Repair | 19 (100.0%) | 0 (0.0%) |
| Total (Category) | 90 (100.0%) | 0 (0.0%) |
| Total (Overall) | 559 (55.4%) | 450 (44.6%) |
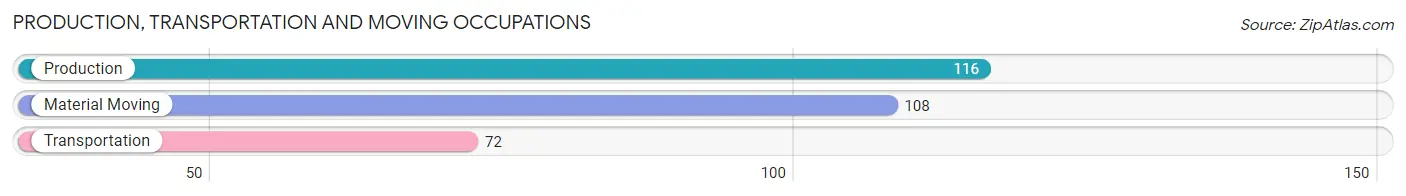
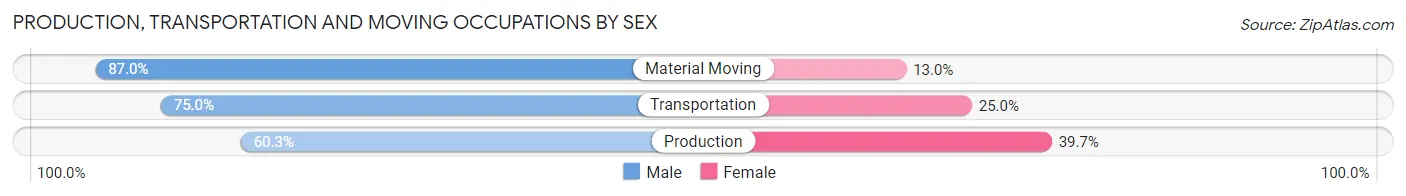
Production, Transportation and Moving Occupations
The most common Production, Transportation and Moving occupations in Fairmount are Production (116 | 11.5%), Material Moving (108 | 10.7%), and Transportation (72 | 7.1%).
Production, Transportation and Moving Occupations by Sex
| Occupation | Male | Female |
| Production | 70 (60.3%) | 46 (39.7%) |
| Transportation | 54 (75.0%) | 18 (25.0%) |
| Material Moving | 94 (87.0%) | 14 (13.0%) |
| Total (Category) | 218 (73.7%) | 78 (26.4%) |
| Total (Overall) | 559 (55.4%) | 450 (44.6%) |
Employment Industries by Sex in Fairmount
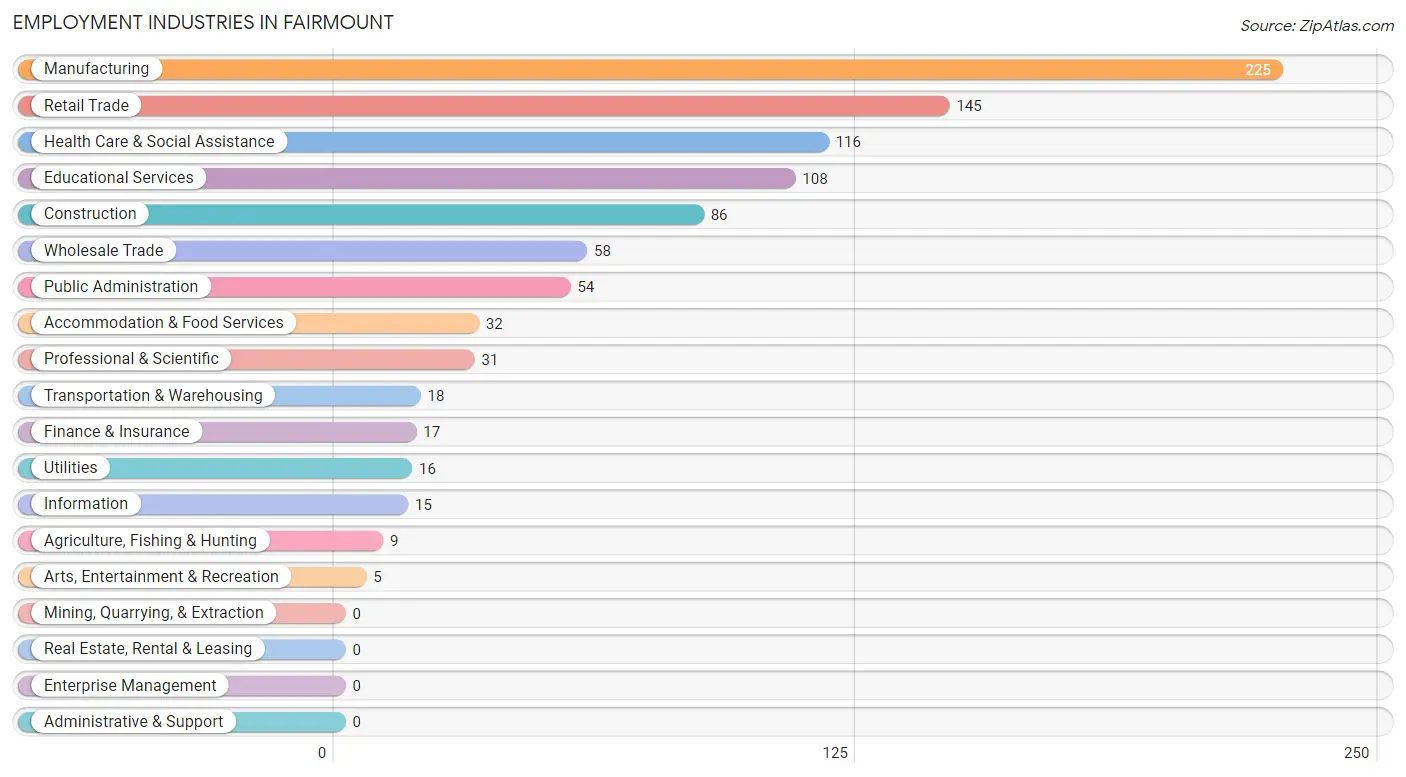
Employment Industries in Fairmount
The major employment industries in Fairmount include Manufacturing (225 | 22.3%), Retail Trade (145 | 14.4%), Health Care & Social Assistance (116 | 11.5%), Educational Services (108 | 10.7%), and Construction (86 | 8.5%).
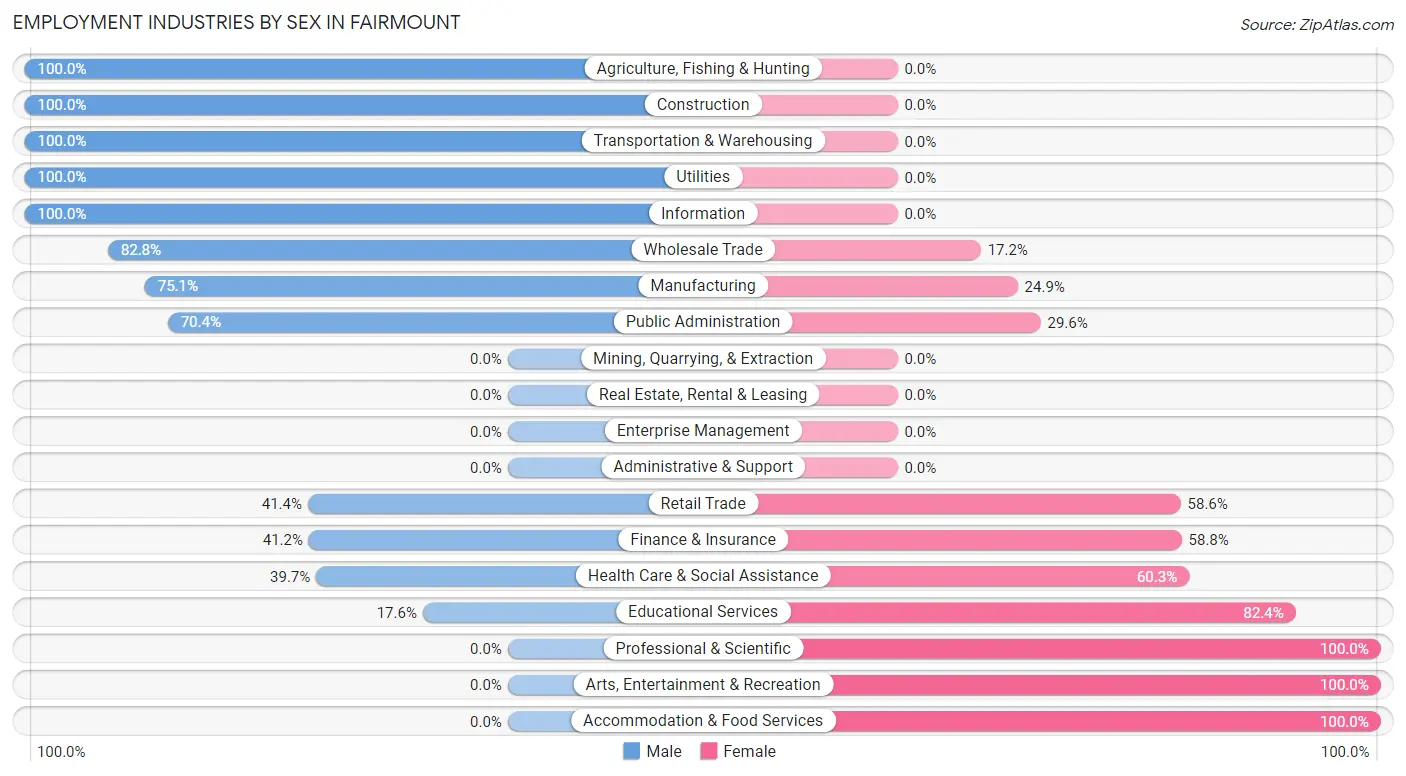
Employment Industries by Sex in Fairmount
The Fairmount industries that see more men than women are Agriculture, Fishing & Hunting (100.0%), Construction (100.0%), and Transportation & Warehousing (100.0%), whereas the industries that tend to have a higher number of women are Professional & Scientific (100.0%), Arts, Entertainment & Recreation (100.0%), and Accommodation & Food Services (100.0%).
| Industry | Male | Female |
| Agriculture, Fishing & Hunting | 9 (100.0%) | 0 (0.0%) |
| Mining, Quarrying, & Extraction | 0 (0.0%) | 0 (0.0%) |
| Construction | 86 (100.0%) | 0 (0.0%) |
| Manufacturing | 169 (75.1%) | 56 (24.9%) |
| Wholesale Trade | 48 (82.8%) | 10 (17.2%) |
| Retail Trade | 60 (41.4%) | 85 (58.6%) |
| Transportation & Warehousing | 18 (100.0%) | 0 (0.0%) |
| Utilities | 16 (100.0%) | 0 (0.0%) |
| Information | 15 (100.0%) | 0 (0.0%) |
| Finance & Insurance | 7 (41.2%) | 10 (58.8%) |
| Real Estate, Rental & Leasing | 0 (0.0%) | 0 (0.0%) |
| Professional & Scientific | 0 (0.0%) | 31 (100.0%) |
| Enterprise Management | 0 (0.0%) | 0 (0.0%) |
| Administrative & Support | 0 (0.0%) | 0 (0.0%) |
| Educational Services | 19 (17.6%) | 89 (82.4%) |
| Health Care & Social Assistance | 46 (39.7%) | 70 (60.3%) |
| Arts, Entertainment & Recreation | 0 (0.0%) | 5 (100.0%) |
| Accommodation & Food Services | 0 (0.0%) | 32 (100.0%) |
| Public Administration | 38 (70.4%) | 16 (29.6%) |
| Total | 559 (55.4%) | 450 (44.6%) |
Education in Fairmount
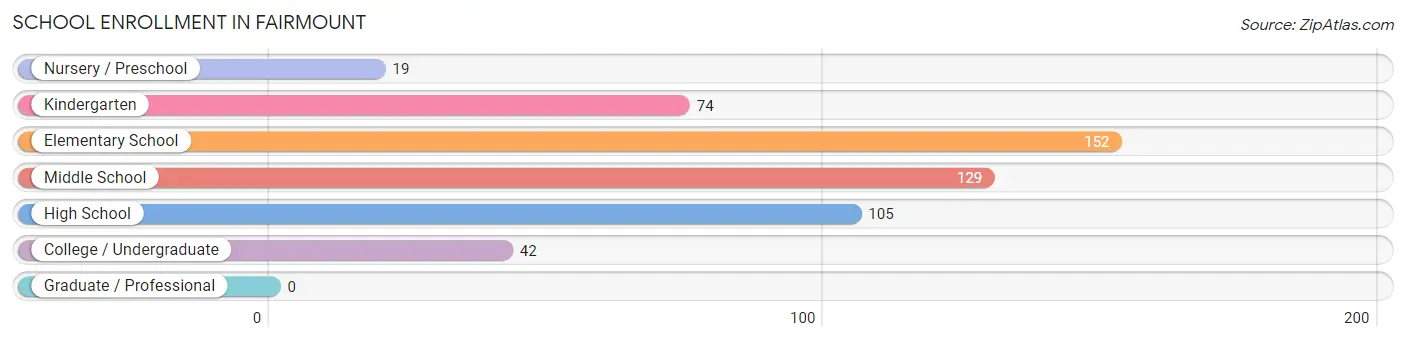
School Enrollment in Fairmount
The most common levels of schooling among the 521 students in Fairmount are elementary school (152 | 29.2%), middle school (129 | 24.8%), and high school (105 | 20.2%).
| School Level | # Students | % Students |
| Nursery / Preschool | 19 | 3.6% |
| Kindergarten | 74 | 14.2% |
| Elementary School | 152 | 29.2% |
| Middle School | 129 | 24.8% |
| High School | 105 | 20.2% |
| College / Undergraduate | 42 | 8.1% |
| Graduate / Professional | 0 | 0.0% |
| Total | 521 | 100.0% |
School Enrollment by Age by Funding Source in Fairmount
Out of a total of 521 students who are enrolled in schools in Fairmount, 33 (6.3%) attend a private institution, while the remaining 488 (93.7%) are enrolled in public schools. The age group of 10 to 14 year olds has the highest likelihood of being enrolled in private schools, with 15 (9.8% in the age bracket) enrolled. Conversely, the age group of 15 to 17 year olds has the lowest likelihood of being enrolled in a private school, with 80 (100.0% in the age bracket) attending a public institution.
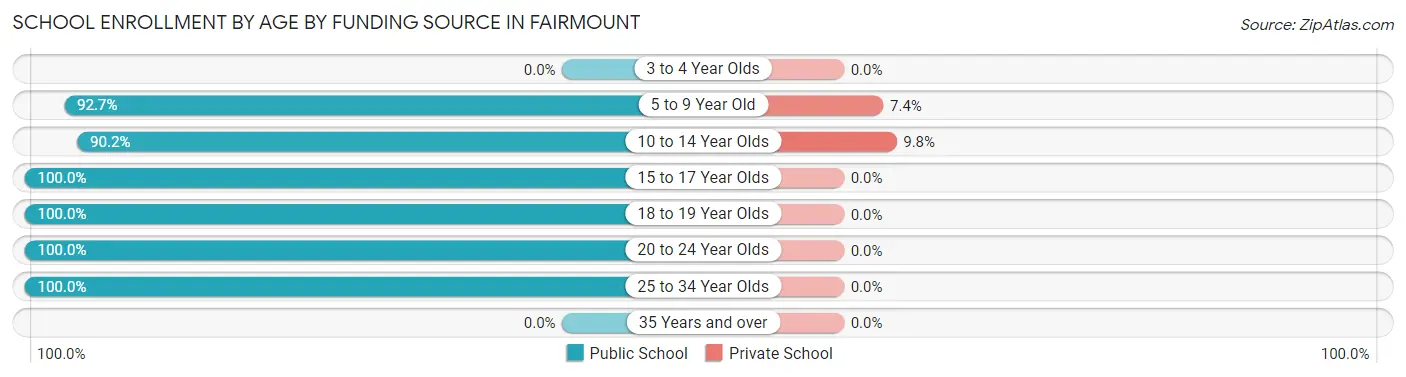
| Age Bracket | Public School | Private School |
| 3 to 4 Year Olds | 0 (0.0%) | 0 (0.0%) |
| 5 to 9 Year Old | 227 (92.6%) | 18 (7.3%) |
| 10 to 14 Year Olds | 138 (90.2%) | 15 (9.8%) |
| 15 to 17 Year Olds | 80 (100.0%) | 0 (0.0%) |
| 18 to 19 Year Olds | 1 (100.0%) | 0 (0.0%) |
| 20 to 24 Year Olds | 7 (100.0%) | 0 (0.0%) |
| 25 to 34 Year Olds | 35 (100.0%) | 0 (0.0%) |
| 35 Years and over | 0 (0.0%) | 0 (0.0%) |
| Total | 488 (93.7%) | 33 (6.3%) |
Educational Attainment by Field of Study in Fairmount
Liberal arts & history (52 | 30.4%), science & technology (37 | 21.6%), business (28 | 16.4%), education (23 | 13.5%), and social sciences (17 | 9.9%) are the most common fields of study among 171 individuals in Fairmount who have obtained a bachelor's degree or higher.
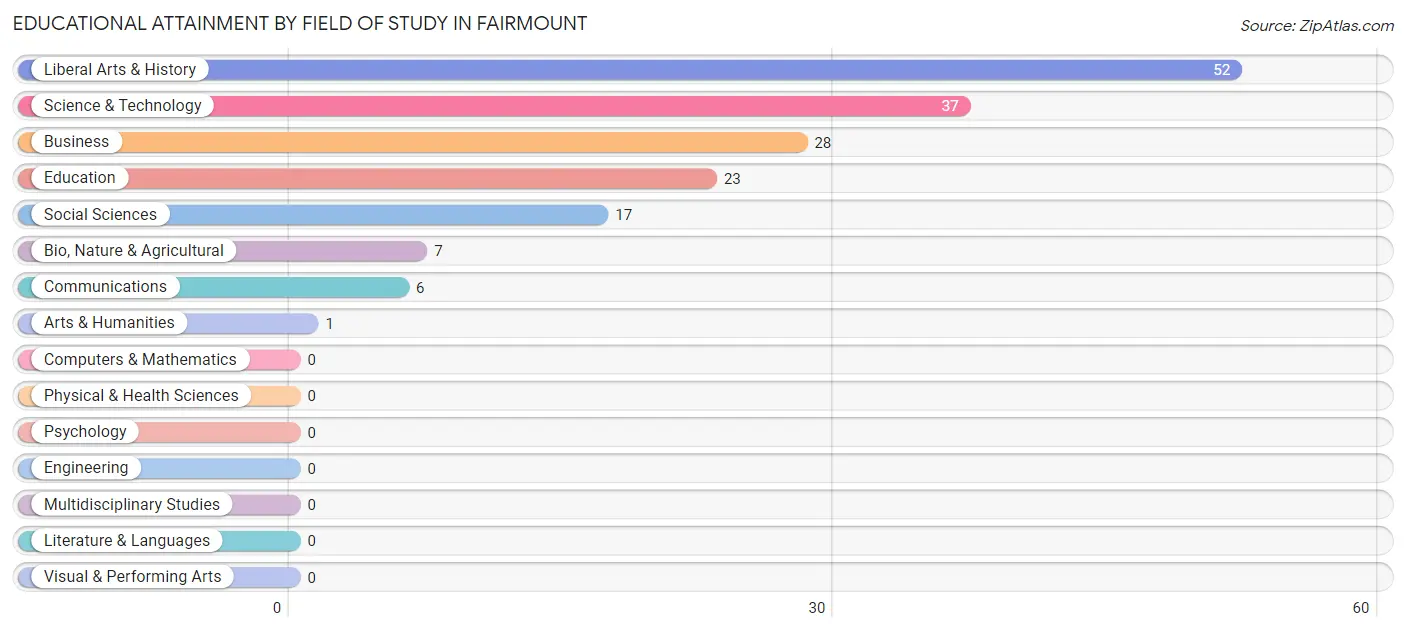
| Field of Study | # Graduates | % Graduates |
| Computers & Mathematics | 0 | 0.0% |
| Bio, Nature & Agricultural | 7 | 4.1% |
| Physical & Health Sciences | 0 | 0.0% |
| Psychology | 0 | 0.0% |
| Social Sciences | 17 | 9.9% |
| Engineering | 0 | 0.0% |
| Multidisciplinary Studies | 0 | 0.0% |
| Science & Technology | 37 | 21.6% |
| Business | 28 | 16.4% |
| Education | 23 | 13.5% |
| Literature & Languages | 0 | 0.0% |
| Liberal Arts & History | 52 | 30.4% |
| Visual & Performing Arts | 0 | 0.0% |
| Communications | 6 | 3.5% |
| Arts & Humanities | 1 | 0.6% |
| Total | 171 | 100.0% |
Transportation & Commute in Fairmount
Vehicle Availability by Sex in Fairmount
The most prevalent vehicle ownership categories in Fairmount are males with 2 vehicles (277, accounting for 50.0%) and females with 2 vehicles (212, making up 62.9%).
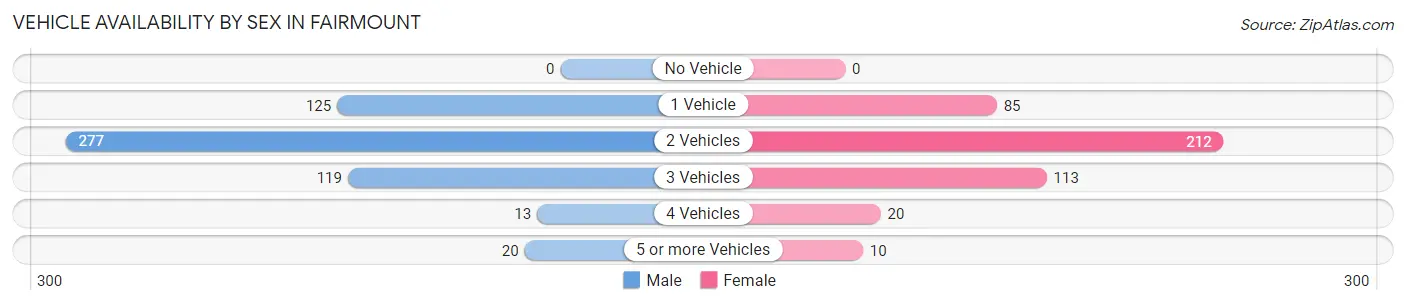
| Vehicles Available | Male | Female |
| No Vehicle | 0 (0.0%) | 0 (0.0%) |
| 1 Vehicle | 125 (22.6%) | 85 (19.3%) |
| 2 Vehicles | 277 (50.0%) | 212 (48.2%) |
| 3 Vehicles | 119 (21.5%) | 113 (25.7%) |
| 4 Vehicles | 13 (2.4%) | 20 (4.5%) |
| 5 or more Vehicles | 20 (3.6%) | 10 (2.3%) |
| Total | 554 (100.0%) | 440 (100.0%) |
Commute Time in Fairmount
The most frequently occuring commute durations in Fairmount are 15 to 19 minutes (247 commuters, 24.8%), 20 to 24 minutes (169 commuters, 17.0%), and 45 to 59 minutes (142 commuters, 14.3%).
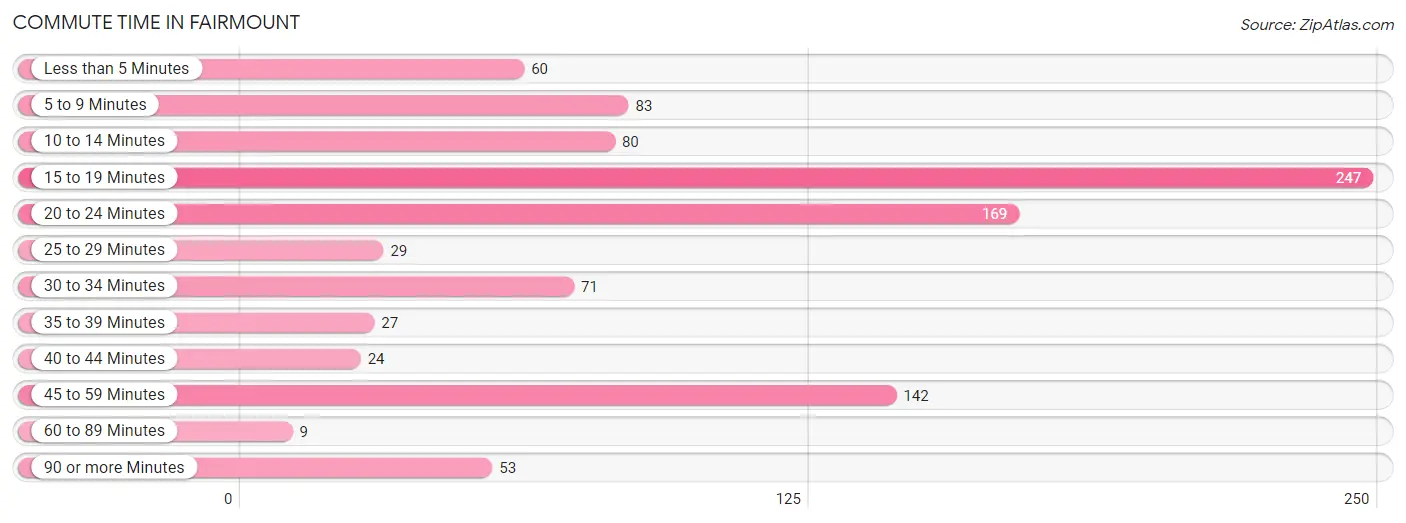
| Commute Time | # Commuters | % Commuters |
| Less than 5 Minutes | 60 | 6.0% |
| 5 to 9 Minutes | 83 | 8.4% |
| 10 to 14 Minutes | 80 | 8.1% |
| 15 to 19 Minutes | 247 | 24.8% |
| 20 to 24 Minutes | 169 | 17.0% |
| 25 to 29 Minutes | 29 | 2.9% |
| 30 to 34 Minutes | 71 | 7.1% |
| 35 to 39 Minutes | 27 | 2.7% |
| 40 to 44 Minutes | 24 | 2.4% |
| 45 to 59 Minutes | 142 | 14.3% |
| 60 to 89 Minutes | 9 | 0.9% |
| 90 or more Minutes | 53 | 5.3% |
Commute Time by Sex in Fairmount
The most common commute times in Fairmount are 15 to 19 minutes (156 commuters, 28.2%) for males and 15 to 19 minutes (91 commuters, 20.7%) for females.
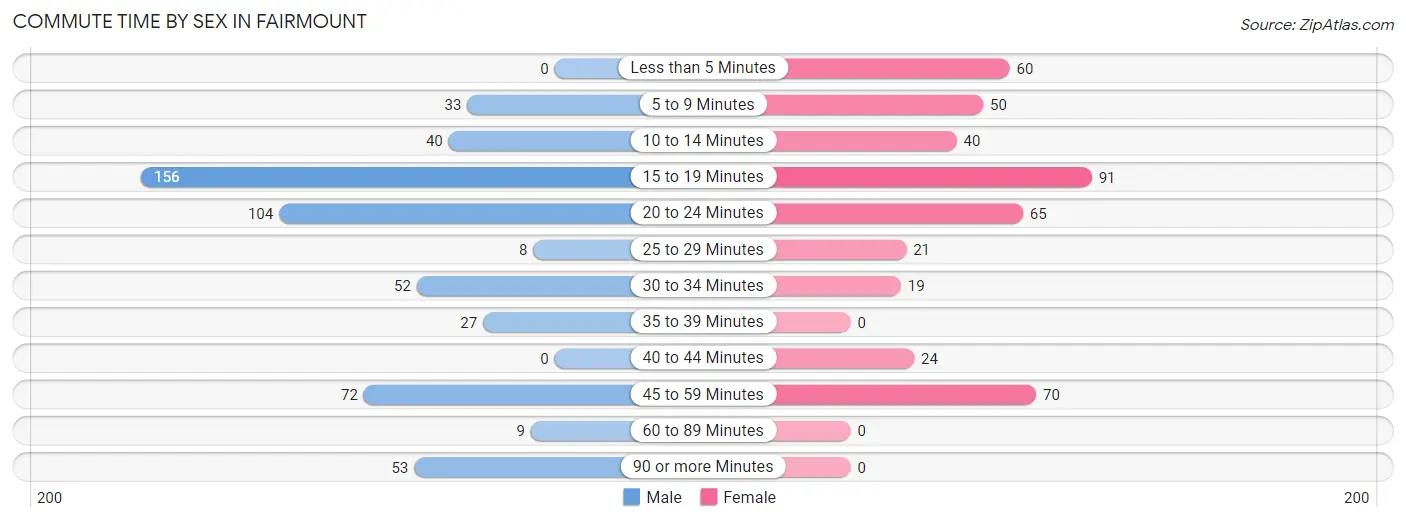
| Commute Time | Male | Female |
| Less than 5 Minutes | 0 (0.0%) | 60 (13.6%) |
| 5 to 9 Minutes | 33 (6.0%) | 50 (11.4%) |
| 10 to 14 Minutes | 40 (7.2%) | 40 (9.1%) |
| 15 to 19 Minutes | 156 (28.2%) | 91 (20.7%) |
| 20 to 24 Minutes | 104 (18.8%) | 65 (14.8%) |
| 25 to 29 Minutes | 8 (1.4%) | 21 (4.8%) |
| 30 to 34 Minutes | 52 (9.4%) | 19 (4.3%) |
| 35 to 39 Minutes | 27 (4.9%) | 0 (0.0%) |
| 40 to 44 Minutes | 0 (0.0%) | 24 (5.4%) |
| 45 to 59 Minutes | 72 (13.0%) | 70 (15.9%) |
| 60 to 89 Minutes | 9 (1.6%) | 0 (0.0%) |
| 90 or more Minutes | 53 (9.6%) | 0 (0.0%) |
Time of Departure to Work by Sex in Fairmount
The most frequent times of departure to work in Fairmount are 5:00 AM to 5:29 AM (79, 14.3%) for males and 8:00 AM to 8:29 AM (75, 17.1%) for females.
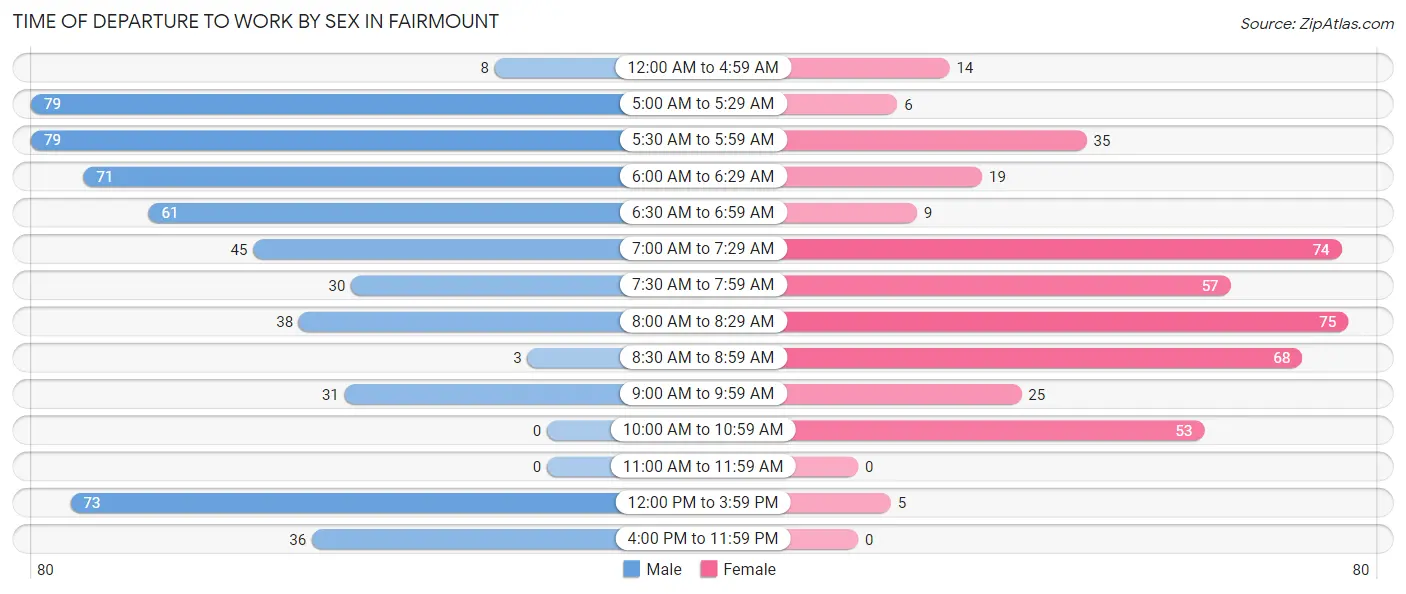
| Time of Departure | Male | Female |
| 12:00 AM to 4:59 AM | 8 (1.4%) | 14 (3.2%) |
| 5:00 AM to 5:29 AM | 79 (14.3%) | 6 (1.4%) |
| 5:30 AM to 5:59 AM | 79 (14.3%) | 35 (8.0%) |
| 6:00 AM to 6:29 AM | 71 (12.8%) | 19 (4.3%) |
| 6:30 AM to 6:59 AM | 61 (11.0%) | 9 (2.1%) |
| 7:00 AM to 7:29 AM | 45 (8.1%) | 74 (16.8%) |
| 7:30 AM to 7:59 AM | 30 (5.4%) | 57 (13.0%) |
| 8:00 AM to 8:29 AM | 38 (6.9%) | 75 (17.1%) |
| 8:30 AM to 8:59 AM | 3 (0.5%) | 68 (15.4%) |
| 9:00 AM to 9:59 AM | 31 (5.6%) | 25 (5.7%) |
| 10:00 AM to 10:59 AM | 0 (0.0%) | 53 (12.0%) |
| 11:00 AM to 11:59 AM | 0 (0.0%) | 0 (0.0%) |
| 12:00 PM to 3:59 PM | 73 (13.2%) | 5 (1.1%) |
| 4:00 PM to 11:59 PM | 36 (6.5%) | 0 (0.0%) |
| Total | 554 (100.0%) | 440 (100.0%) |
Housing Occupancy in Fairmount
Occupancy by Ownership in Fairmount
Of the total 1,112 dwellings in Fairmount, owner-occupied units account for 791 (71.1%), while renter-occupied units make up 321 (28.9%).
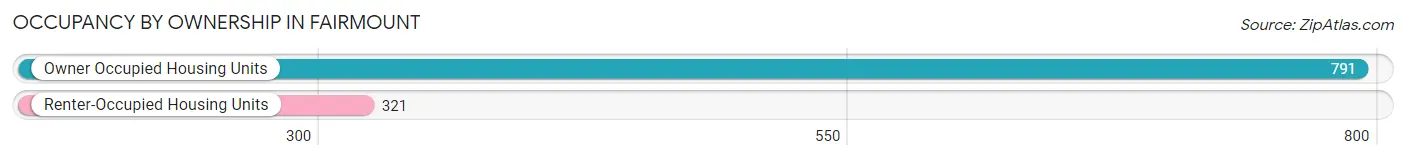
| Occupancy | # Housing Units | % Housing Units |
| Owner Occupied Housing Units | 791 | 71.1% |
| Renter-Occupied Housing Units | 321 | 28.9% |
| Total Occupied Housing Units | 1,112 | 100.0% |
Occupancy by Household Size in Fairmount
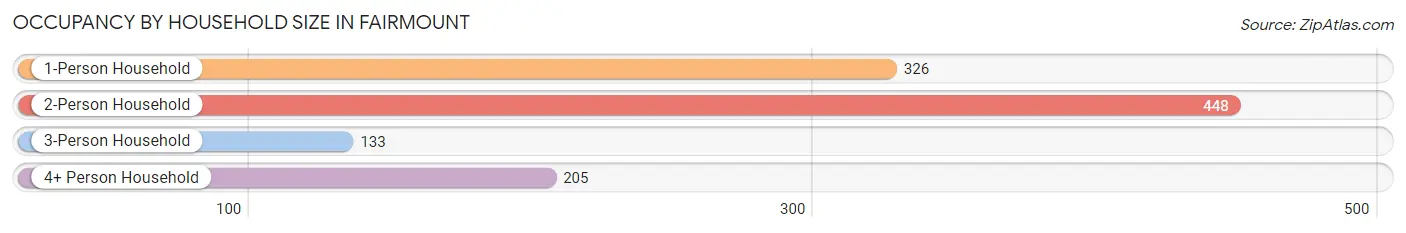
| Household Size | # Housing Units | % Housing Units |
| 1-Person Household | 326 | 29.3% |
| 2-Person Household | 448 | 40.3% |
| 3-Person Household | 133 | 12.0% |
| 4+ Person Household | 205 | 18.4% |
| Total Housing Units | 1,112 | 100.0% |
Occupancy by Ownership by Household Size in Fairmount
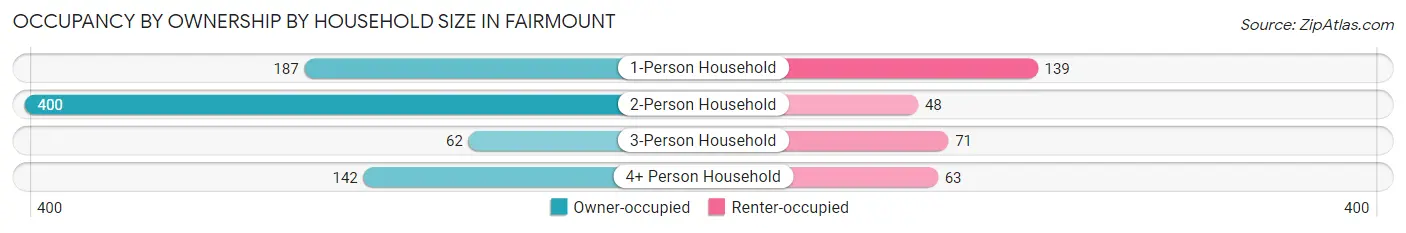
| Household Size | Owner-occupied | Renter-occupied |
| 1-Person Household | 187 (57.4%) | 139 (42.6%) |
| 2-Person Household | 400 (89.3%) | 48 (10.7%) |
| 3-Person Household | 62 (46.6%) | 71 (53.4%) |
| 4+ Person Household | 142 (69.3%) | 63 (30.7%) |
| Total Housing Units | 791 (71.1%) | 321 (28.9%) |
Occupancy by Educational Attainment in Fairmount
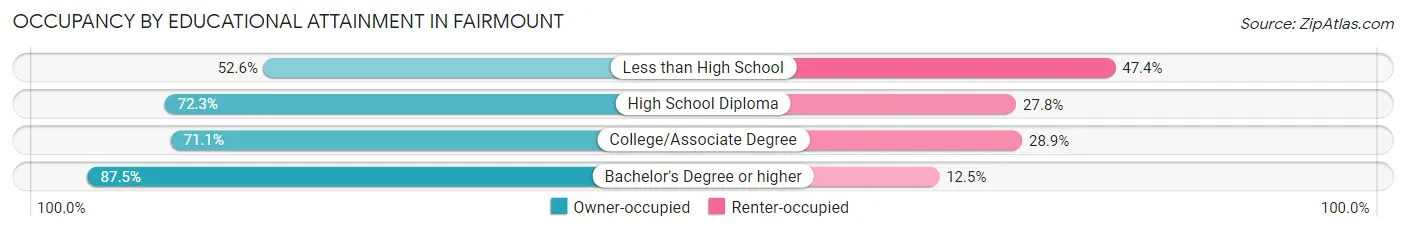
| Household Size | Owner-occupied | Renter-occupied |
| Less than High School | 61 (52.6%) | 55 (47.4%) |
| High School Diploma | 388 (72.3%) | 149 (27.8%) |
| College/Associate Degree | 258 (71.1%) | 105 (28.9%) |
| Bachelor's Degree or higher | 84 (87.5%) | 12 (12.5%) |
Occupancy by Age of Householder in Fairmount
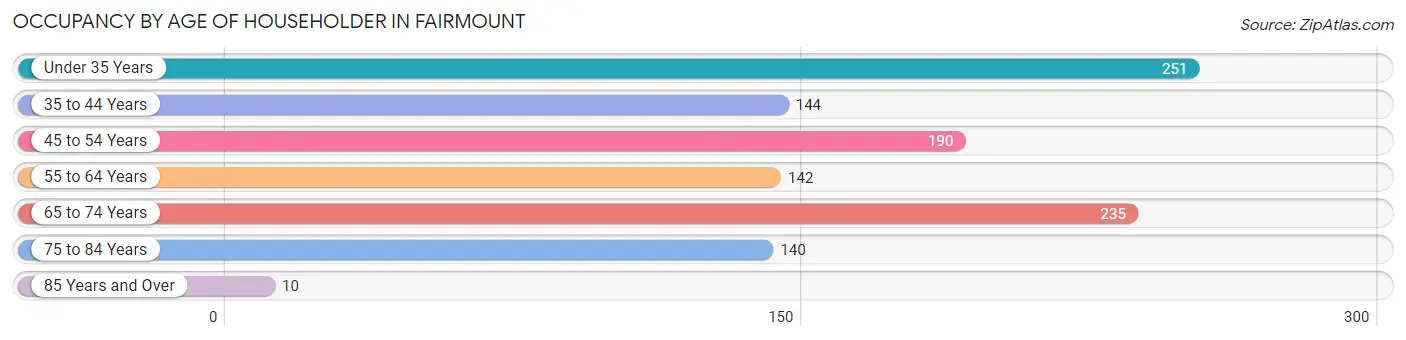
| Age Bracket | # Households | % Households |
| Under 35 Years | 251 | 22.6% |
| 35 to 44 Years | 144 | 13.0% |
| 45 to 54 Years | 190 | 17.1% |
| 55 to 64 Years | 142 | 12.8% |
| 65 to 74 Years | 235 | 21.1% |
| 75 to 84 Years | 140 | 12.6% |
| 85 Years and Over | 10 | 0.9% |
| Total | 1,112 | 100.0% |
Housing Finances in Fairmount
Median Income by Occupancy in Fairmount
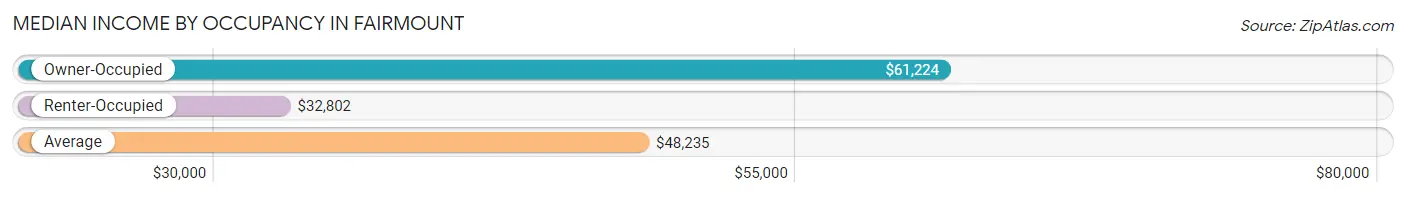
| Occupancy Type | # Households | Median Income |
| Owner-Occupied | 791 (71.1%) | $61,224 |
| Renter-Occupied | 321 (28.9%) | $32,802 |
| Average | 1,112 (100.0%) | $48,235 |
Occupancy by Householder Income Bracket in Fairmount
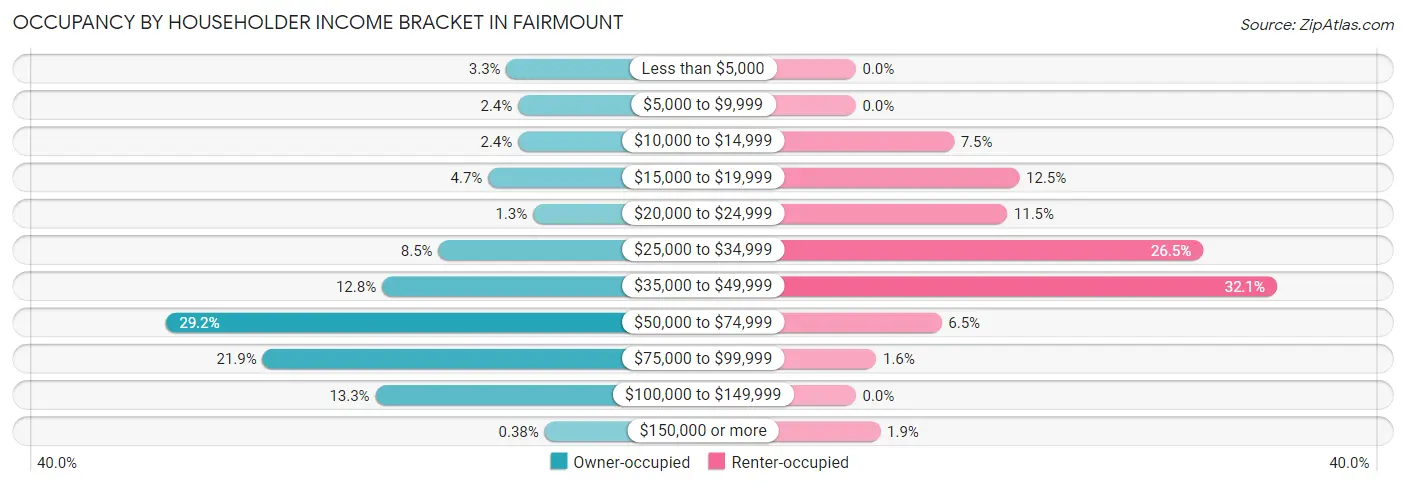
| Income Bracket | Owner-occupied | Renter-occupied |
| Less than $5,000 | 26 (3.3%) | 0 (0.0%) |
| $5,000 to $9,999 | 19 (2.4%) | 0 (0.0%) |
| $10,000 to $14,999 | 19 (2.4%) | 24 (7.5%) |
| $15,000 to $19,999 | 37 (4.7%) | 40 (12.5%) |
| $20,000 to $24,999 | 10 (1.3%) | 37 (11.5%) |
| $25,000 to $34,999 | 67 (8.5%) | 85 (26.5%) |
| $35,000 to $49,999 | 101 (12.8%) | 103 (32.1%) |
| $50,000 to $74,999 | 231 (29.2%) | 21 (6.5%) |
| $75,000 to $99,999 | 173 (21.9%) | 5 (1.6%) |
| $100,000 to $149,999 | 105 (13.3%) | 0 (0.0%) |
| $150,000 or more | 3 (0.4%) | 6 (1.9%) |
| Total | 791 (100.0%) | 321 (100.0%) |
Monthly Housing Cost Tiers in Fairmount
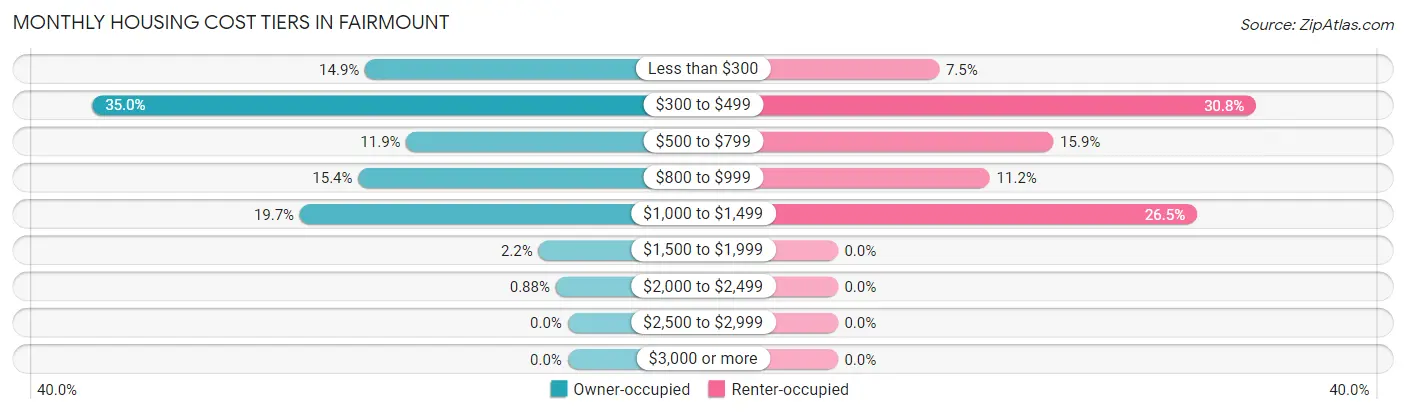
| Monthly Cost | Owner-occupied | Renter-occupied |
| Less than $300 | 118 (14.9%) | 24 (7.5%) |
| $300 to $499 | 277 (35.0%) | 99 (30.8%) |
| $500 to $799 | 94 (11.9%) | 51 (15.9%) |
| $800 to $999 | 122 (15.4%) | 36 (11.2%) |
| $1,000 to $1,499 | 156 (19.7%) | 85 (26.5%) |
| $1,500 to $1,999 | 17 (2.1%) | 0 (0.0%) |
| $2,000 to $2,499 | 7 (0.9%) | 0 (0.0%) |
| $2,500 to $2,999 | 0 (0.0%) | 0 (0.0%) |
| $3,000 or more | 0 (0.0%) | 0 (0.0%) |
| Total | 791 (100.0%) | 321 (100.0%) |
Physical Housing Characteristics in Fairmount
Housing Structures in Fairmount
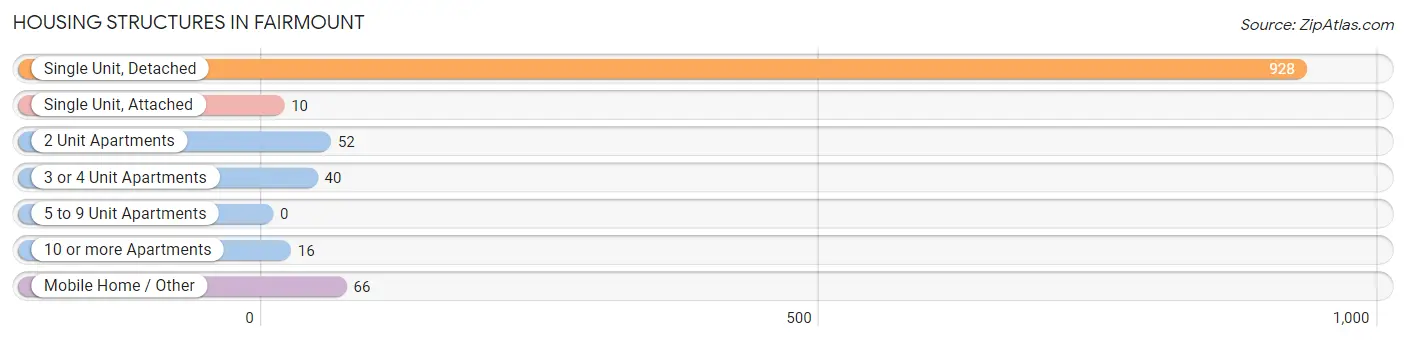
| Structure Type | # Housing Units | % Housing Units |
| Single Unit, Detached | 928 | 83.5% |
| Single Unit, Attached | 10 | 0.9% |
| 2 Unit Apartments | 52 | 4.7% |
| 3 or 4 Unit Apartments | 40 | 3.6% |
| 5 to 9 Unit Apartments | 0 | 0.0% |
| 10 or more Apartments | 16 | 1.4% |
| Mobile Home / Other | 66 | 5.9% |
| Total | 1,112 | 100.0% |
Housing Structures by Occupancy in Fairmount
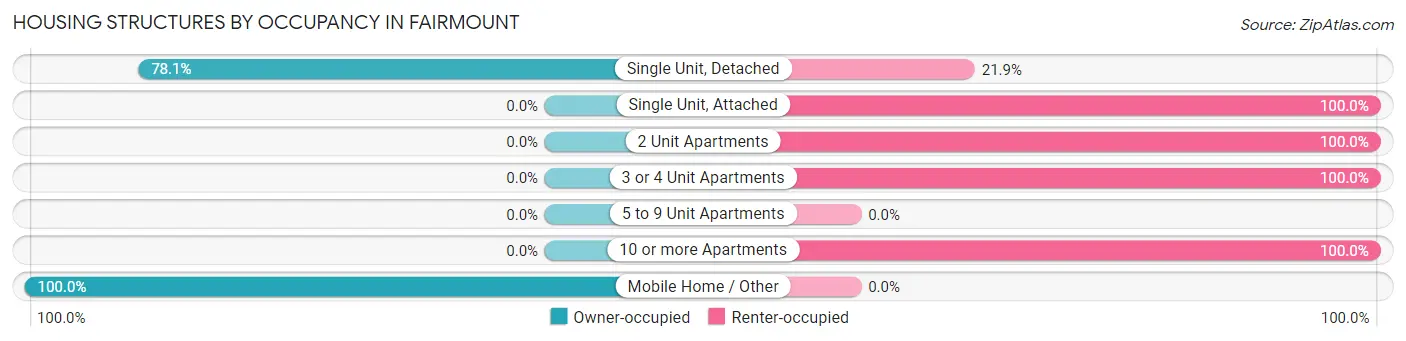
| Structure Type | Owner-occupied | Renter-occupied |
| Single Unit, Detached | 725 (78.1%) | 203 (21.9%) |
| Single Unit, Attached | 0 (0.0%) | 10 (100.0%) |
| 2 Unit Apartments | 0 (0.0%) | 52 (100.0%) |
| 3 or 4 Unit Apartments | 0 (0.0%) | 40 (100.0%) |
| 5 to 9 Unit Apartments | 0 (0.0%) | 0 (0.0%) |
| 10 or more Apartments | 0 (0.0%) | 16 (100.0%) |
| Mobile Home / Other | 66 (100.0%) | 0 (0.0%) |
| Total | 791 (71.1%) | 321 (28.9%) |
Housing Structures by Number of Rooms in Fairmount
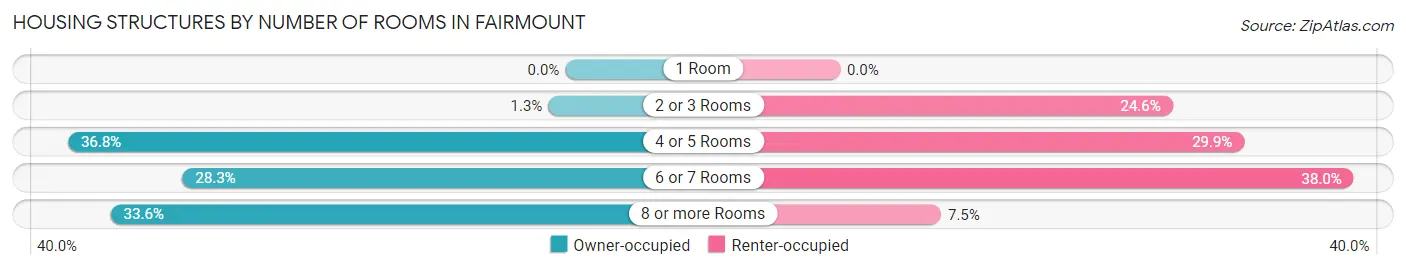
| Number of Rooms | Owner-occupied | Renter-occupied |
| 1 Room | 0 (0.0%) | 0 (0.0%) |
| 2 or 3 Rooms | 10 (1.3%) | 79 (24.6%) |
| 4 or 5 Rooms | 291 (36.8%) | 96 (29.9%) |
| 6 or 7 Rooms | 224 (28.3%) | 122 (38.0%) |
| 8 or more Rooms | 266 (33.6%) | 24 (7.5%) |
| Total | 791 (100.0%) | 321 (100.0%) |
Housing Structure by Heating Type in Fairmount
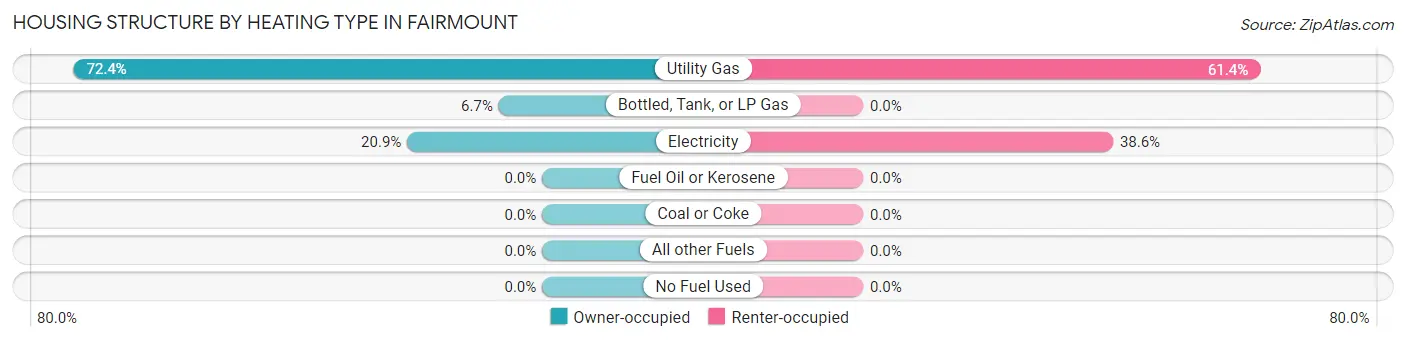
| Heating Type | Owner-occupied | Renter-occupied |
| Utility Gas | 573 (72.4%) | 197 (61.4%) |
| Bottled, Tank, or LP Gas | 53 (6.7%) | 0 (0.0%) |
| Electricity | 165 (20.9%) | 124 (38.6%) |
| Fuel Oil or Kerosene | 0 (0.0%) | 0 (0.0%) |
| Coal or Coke | 0 (0.0%) | 0 (0.0%) |
| All other Fuels | 0 (0.0%) | 0 (0.0%) |
| No Fuel Used | 0 (0.0%) | 0 (0.0%) |
| Total | 791 (100.0%) | 321 (100.0%) |
Household Vehicle Usage in Fairmount
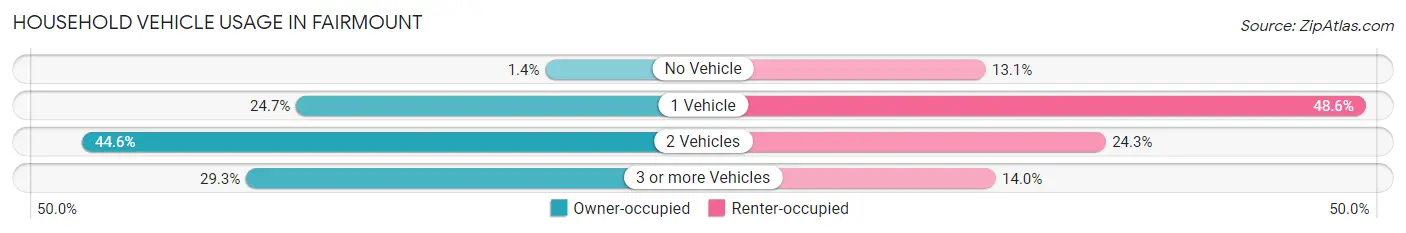
| Vehicles per Household | Owner-occupied | Renter-occupied |
| No Vehicle | 11 (1.4%) | 42 (13.1%) |
| 1 Vehicle | 195 (24.6%) | 156 (48.6%) |
| 2 Vehicles | 353 (44.6%) | 78 (24.3%) |
| 3 or more Vehicles | 232 (29.3%) | 45 (14.0%) |
| Total | 791 (100.0%) | 321 (100.0%) |
Real Estate & Mortgages in Fairmount
Real Estate and Mortgage Overview in Fairmount
| Characteristic | Without Mortgage | With Mortgage |
| Housing Units | 444 | 347 |
| Median Property Value | $89,500 | $94,600 |
| Median Household Income | $51,458 | $3 |
| Monthly Housing Costs | $396 | $0 |
| Real Estate Taxes | $602 | $37 |
Property Value by Mortgage Status in Fairmount
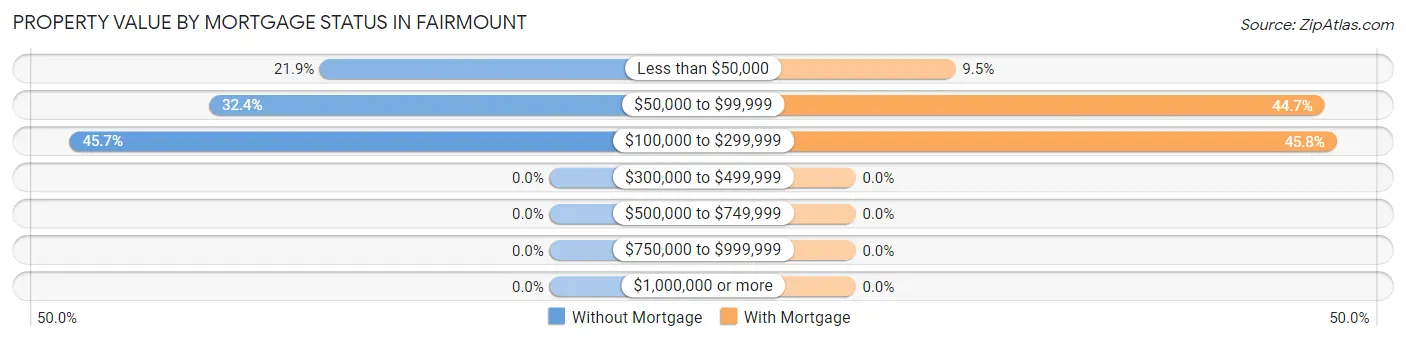
| Property Value | Without Mortgage | With Mortgage |
| Less than $50,000 | 97 (21.8%) | 33 (9.5%) |
| $50,000 to $99,999 | 144 (32.4%) | 155 (44.7%) |
| $100,000 to $299,999 | 203 (45.7%) | 159 (45.8%) |
| $300,000 to $499,999 | 0 (0.0%) | 0 (0.0%) |
| $500,000 to $749,999 | 0 (0.0%) | 0 (0.0%) |
| $750,000 to $999,999 | 0 (0.0%) | 0 (0.0%) |
| $1,000,000 or more | 0 (0.0%) | 0 (0.0%) |
| Total | 444 (100.0%) | 347 (100.0%) |
Household Income by Mortgage Status in Fairmount
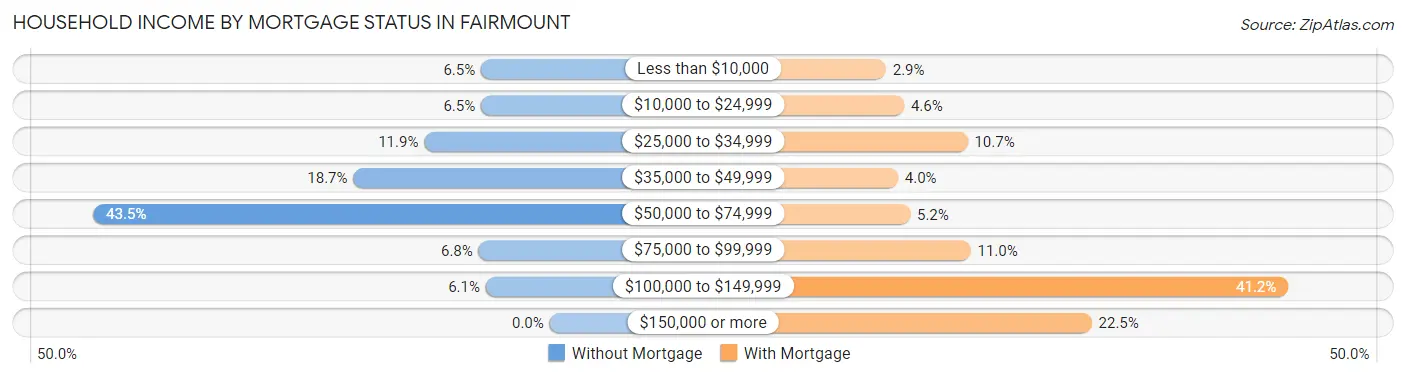
| Household Income | Without Mortgage | With Mortgage |
| Less than $10,000 | 29 (6.5%) | 10 (2.9%) |
| $10,000 to $24,999 | 29 (6.5%) | 16 (4.6%) |
| $25,000 to $34,999 | 53 (11.9%) | 37 (10.7%) |
| $35,000 to $49,999 | 83 (18.7%) | 14 (4.0%) |
| $50,000 to $74,999 | 193 (43.5%) | 18 (5.2%) |
| $75,000 to $99,999 | 30 (6.8%) | 38 (11.0%) |
| $100,000 to $149,999 | 27 (6.1%) | 143 (41.2%) |
| $150,000 or more | 0 (0.0%) | 78 (22.5%) |
| Total | 444 (100.0%) | 347 (100.0%) |
Property Value to Household Income Ratio in Fairmount
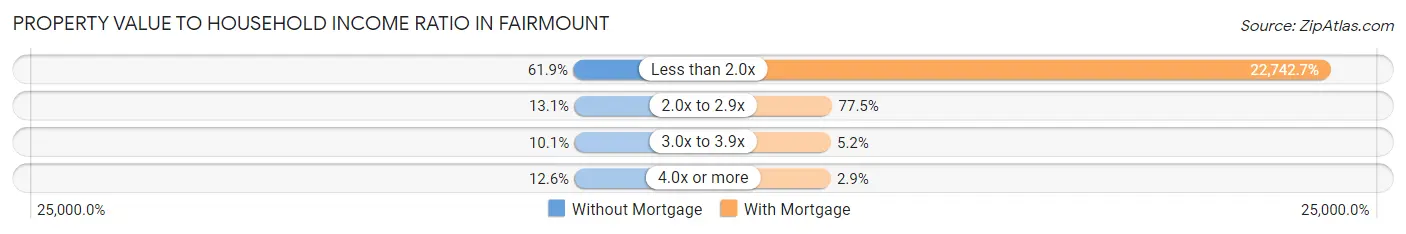
| Value-to-Income Ratio | Without Mortgage | With Mortgage |
| Less than 2.0x | 275 (61.9%) | 78,917 (22,742.7%) |
| 2.0x to 2.9x | 58 (13.1%) | 269 (77.5%) |
| 3.0x to 3.9x | 45 (10.1%) | 18 (5.2%) |
| 4.0x or more | 56 (12.6%) | 10 (2.9%) |
| Total | 444 (100.0%) | 347 (100.0%) |
Real Estate Taxes by Mortgage Status in Fairmount
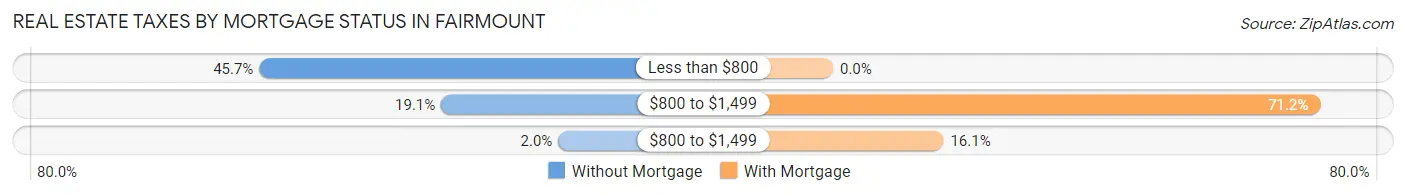
| Property Taxes | Without Mortgage | With Mortgage |
| Less than $800 | 203 (45.7%) | 0 (0.0%) |
| $800 to $1,499 | 85 (19.1%) | 247 (71.2%) |
| $800 to $1,499 | 9 (2.0%) | 56 (16.1%) |
| Total | 444 (100.0%) | 347 (100.0%) |
Health & Disability in Fairmount
Health Insurance Coverage by Age in Fairmount
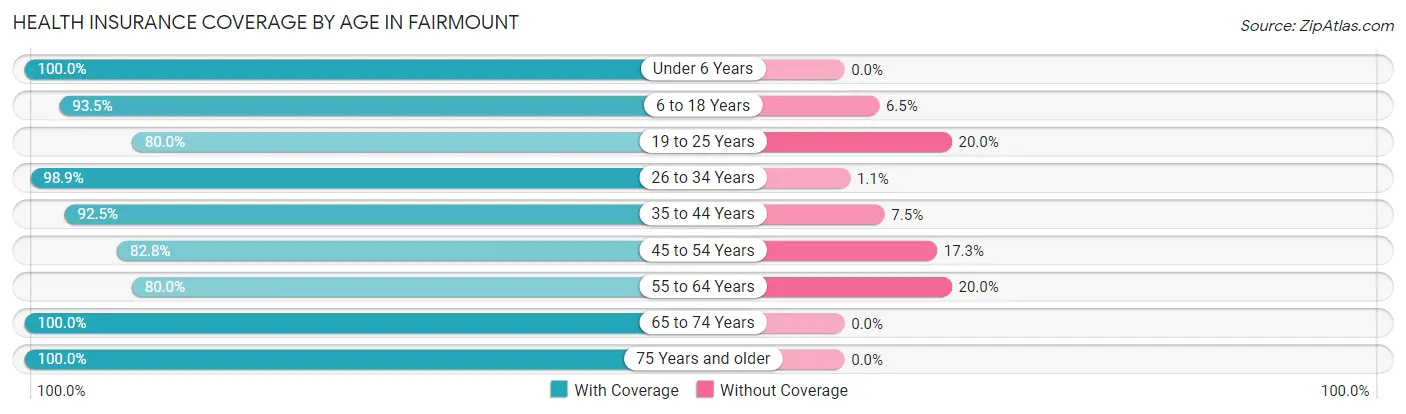
| Age Bracket | With Coverage | Without Coverage |
| Under 6 Years | 185 (100.0%) | 0 (0.0%) |
| 6 to 18 Years | 448 (93.5%) | 31 (6.5%) |
| 19 to 25 Years | 104 (80.0%) | 26 (20.0%) |
| 26 to 34 Years | 373 (98.9%) | 4 (1.1%) |
| 35 to 44 Years | 235 (92.5%) | 19 (7.5%) |
| 45 to 54 Years | 211 (82.8%) | 44 (17.2%) |
| 55 to 64 Years | 304 (80.0%) | 76 (20.0%) |
| 65 to 74 Years | 348 (100.0%) | 0 (0.0%) |
| 75 Years and older | 174 (100.0%) | 0 (0.0%) |
| Total | 2,382 (92.2%) | 200 (7.7%) |
Health Insurance Coverage by Citizenship Status in Fairmount
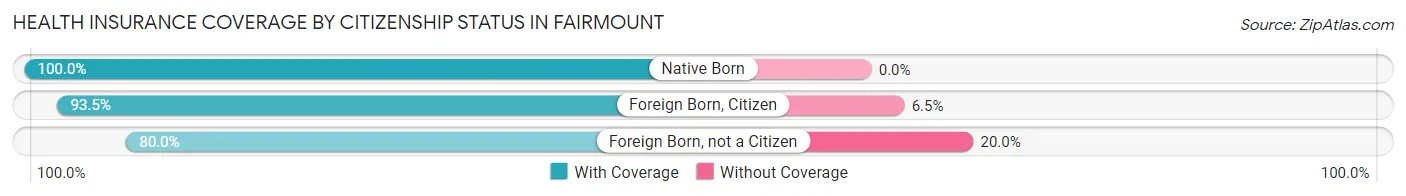
| Citizenship Status | With Coverage | Without Coverage |
| Native Born | 185 (100.0%) | 0 (0.0%) |
| Foreign Born, Citizen | 448 (93.5%) | 31 (6.5%) |
| Foreign Born, not a Citizen | 104 (80.0%) | 26 (20.0%) |
Health Insurance Coverage by Household Income in Fairmount
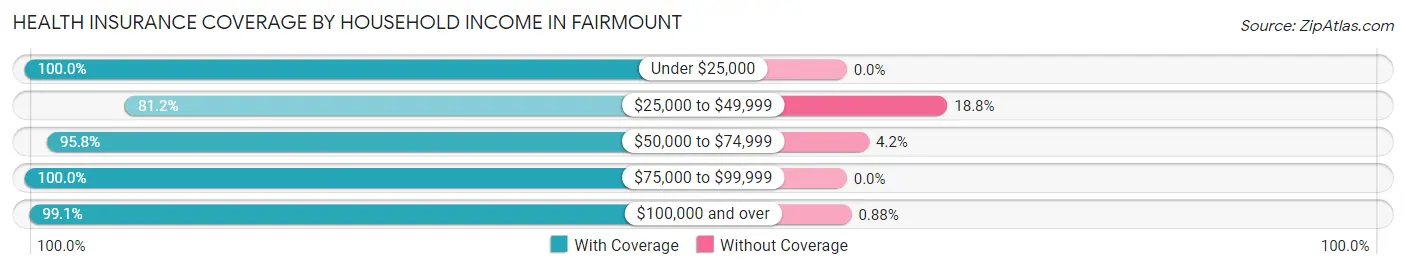
| Household Income | With Coverage | Without Coverage |
| Under $25,000 | 286 (100.0%) | 0 (0.0%) |
| $25,000 to $49,999 | 758 (81.2%) | 176 (18.8%) |
| $50,000 to $74,999 | 458 (95.8%) | 20 (4.2%) |
| $75,000 to $99,999 | 428 (100.0%) | 0 (0.0%) |
| $100,000 and over | 452 (99.1%) | 4 (0.9%) |
Public vs Private Health Insurance Coverage by Age in Fairmount
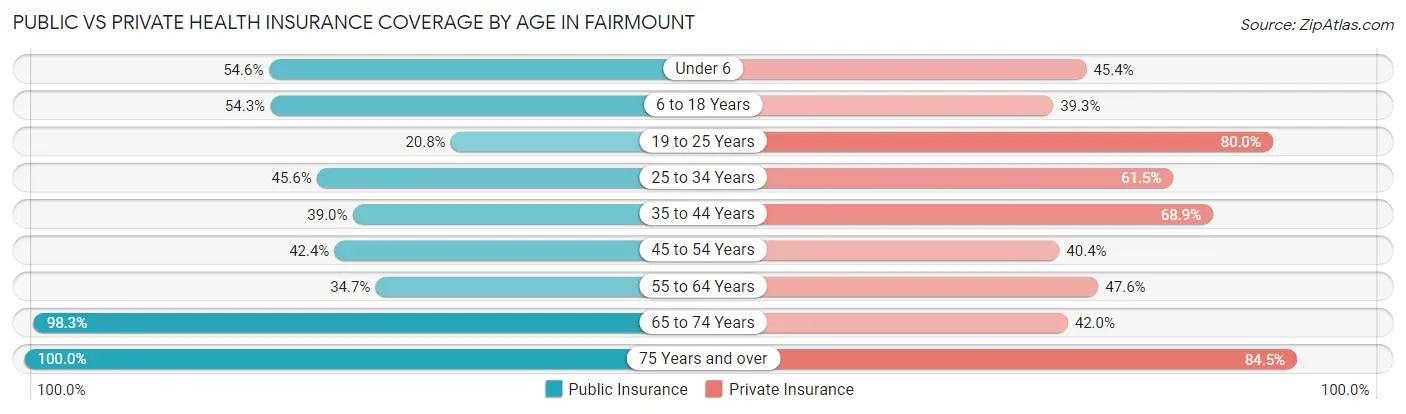
| Age Bracket | Public Insurance | Private Insurance |
| Under 6 | 101 (54.6%) | 84 (45.4%) |
| 6 to 18 Years | 260 (54.3%) | 188 (39.3%) |
| 19 to 25 Years | 27 (20.8%) | 104 (80.0%) |
| 25 to 34 Years | 172 (45.6%) | 232 (61.5%) |
| 35 to 44 Years | 99 (39.0%) | 175 (68.9%) |
| 45 to 54 Years | 108 (42.3%) | 103 (40.4%) |
| 55 to 64 Years | 132 (34.7%) | 181 (47.6%) |
| 65 to 74 Years | 342 (98.3%) | 146 (41.9%) |
| 75 Years and over | 174 (100.0%) | 147 (84.5%) |
| Total | 1,415 (54.8%) | 1,360 (52.7%) |
Disability Status by Sex by Age in Fairmount
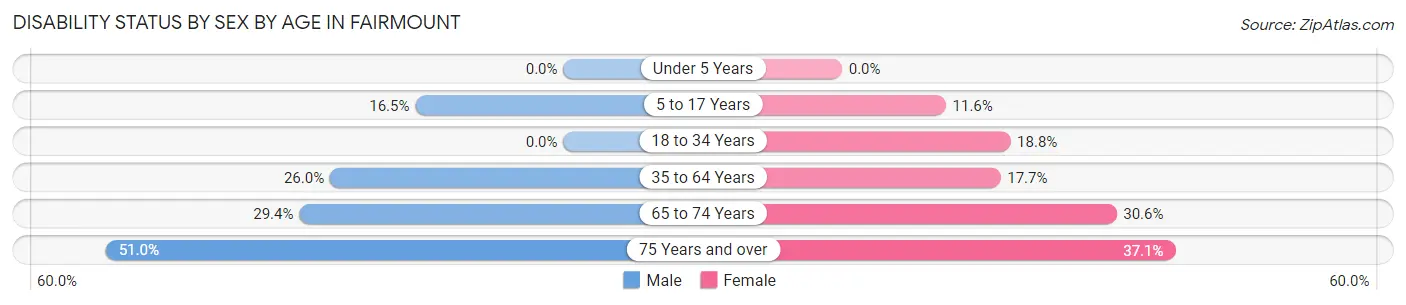
| Age Bracket | Male | Female |
| Under 5 Years | 0 (0.0%) | 0 (0.0%) |
| 5 to 17 Years | 46 (16.5%) | 23 (11.6%) |
| 18 to 34 Years | 0 (0.0%) | 45 (18.8%) |
| 35 to 64 Years | 125 (26.0%) | 72 (17.6%) |
| 65 to 74 Years | 35 (29.4%) | 70 (30.6%) |
| 75 Years and over | 53 (51.0%) | 26 (37.1%) |
Disability Class by Sex by Age in Fairmount
Disability Class: Hearing Difficulty
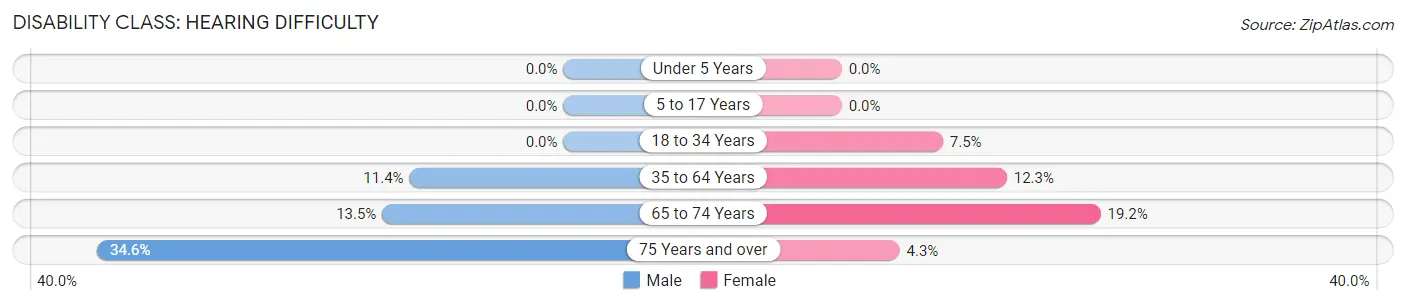
| Age Bracket | Male | Female |
| Under 5 Years | 0 (0.0%) | 0 (0.0%) |
| 5 to 17 Years | 0 (0.0%) | 0 (0.0%) |
| 18 to 34 Years | 0 (0.0%) | 18 (7.5%) |
| 35 to 64 Years | 55 (11.4%) | 50 (12.2%) |
| 65 to 74 Years | 16 (13.5%) | 44 (19.2%) |
| 75 Years and over | 36 (34.6%) | 3 (4.3%) |
Disability Class: Vision Difficulty
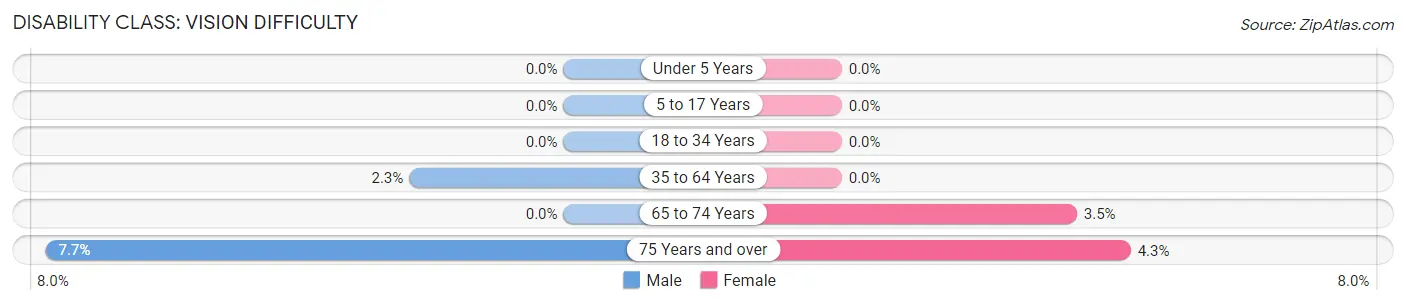
| Age Bracket | Male | Female |
| Under 5 Years | 0 (0.0%) | 0 (0.0%) |
| 5 to 17 Years | 0 (0.0%) | 0 (0.0%) |
| 18 to 34 Years | 0 (0.0%) | 0 (0.0%) |
| 35 to 64 Years | 11 (2.3%) | 0 (0.0%) |
| 65 to 74 Years | 0 (0.0%) | 8 (3.5%) |
| 75 Years and over | 8 (7.7%) | 3 (4.3%) |
Disability Class: Cognitive Difficulty
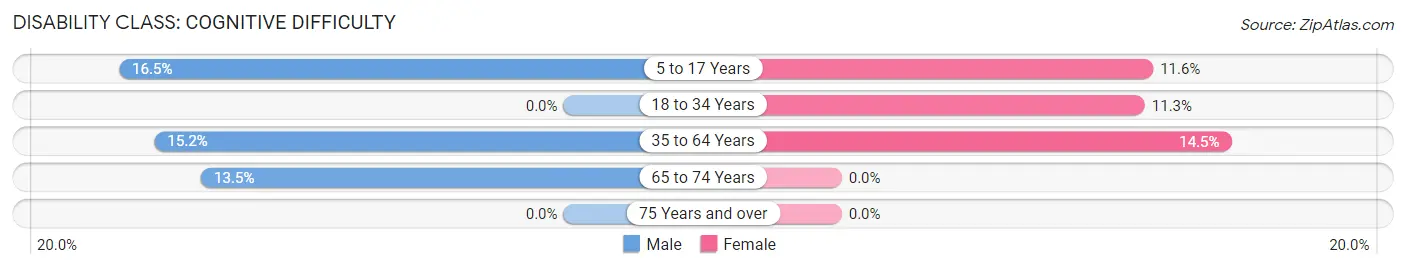
| Age Bracket | Male | Female |
| 5 to 17 Years | 46 (16.5%) | 23 (11.6%) |
| 18 to 34 Years | 0 (0.0%) | 27 (11.3%) |
| 35 to 64 Years | 73 (15.2%) | 59 (14.5%) |
| 65 to 74 Years | 16 (13.5%) | 0 (0.0%) |
| 75 Years and over | 0 (0.0%) | 0 (0.0%) |
Disability Class: Ambulatory Difficulty
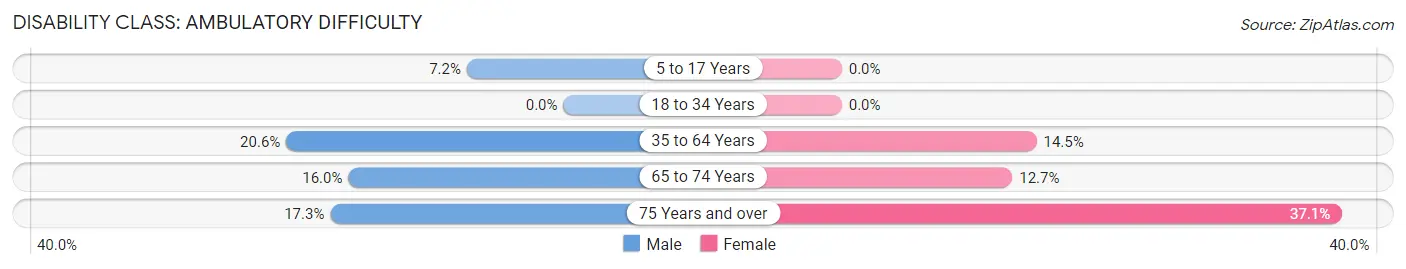
| Age Bracket | Male | Female |
| 5 to 17 Years | 20 (7.2%) | 0 (0.0%) |
| 18 to 34 Years | 0 (0.0%) | 0 (0.0%) |
| 35 to 64 Years | 99 (20.6%) | 59 (14.5%) |
| 65 to 74 Years | 19 (16.0%) | 29 (12.7%) |
| 75 Years and over | 18 (17.3%) | 26 (37.1%) |
Disability Class: Self-Care Difficulty
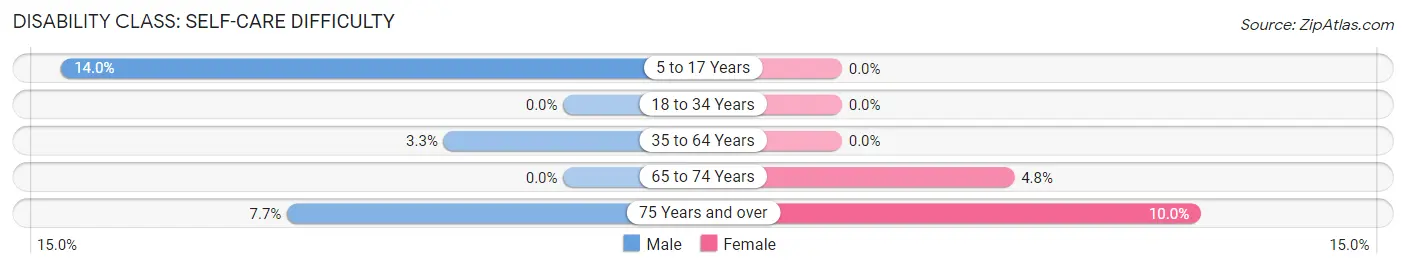
| Age Bracket | Male | Female |
| 5 to 17 Years | 39 (14.0%) | 0 (0.0%) |
| 18 to 34 Years | 0 (0.0%) | 0 (0.0%) |
| 35 to 64 Years | 16 (3.3%) | 0 (0.0%) |
| 65 to 74 Years | 0 (0.0%) | 11 (4.8%) |
| 75 Years and over | 8 (7.7%) | 7 (10.0%) |
Technology Access in Fairmount
Computing Device Access in Fairmount
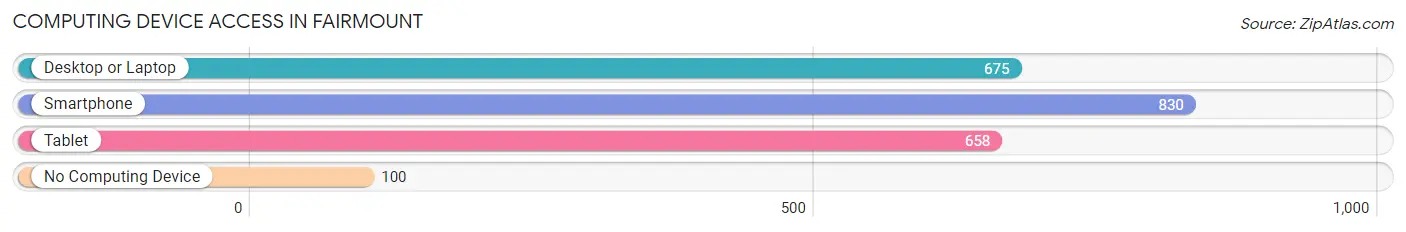
| Device Type | # Households | % Households |
| Desktop or Laptop | 675 | 60.7% |
| Smartphone | 830 | 74.6% |
| Tablet | 658 | 59.2% |
| No Computing Device | 100 | 9.0% |
| Total | 1,112 | 100.0% |
Internet Access in Fairmount
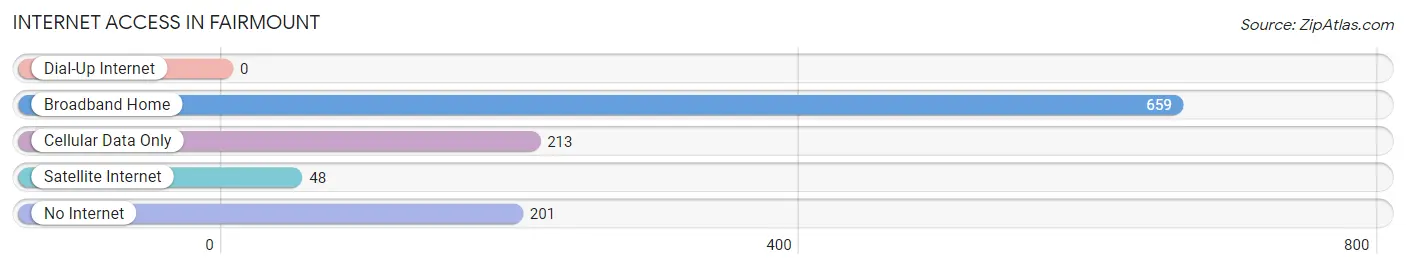
| Internet Type | # Households | % Households |
| Dial-Up Internet | 0 | 0.0% |
| Broadband Home | 659 | 59.3% |
| Cellular Data Only | 213 | 19.2% |
| Satellite Internet | 48 | 4.3% |
| No Internet | 201 | 18.1% |
| Total | 1,112 | 100.0% |
Fairmount Summary
Introduction
Fairmount, Indiana is a small town located in Grant County, Indiana. It is situated in the heart of the state, about an hour northeast of Indianapolis. The town has a population of about 2,500 people and is known for its small-town charm and friendly atmosphere. The town is home to a variety of businesses, including a few restaurants, a grocery store, and a few other small businesses. The town is also home to a few parks and recreational areas, making it a great place to live and visit.
History
Fairmount was founded in 1835 by a group of settlers from North Carolina. The town was named after Fairmount, North Carolina, the hometown of the settlers. The town was originally a farming community, but it soon grew to include a variety of businesses, including a sawmill, a gristmill, and a blacksmith shop. The town was also home to a variety of churches, including the First Presbyterian Church, which was founded in 1837.
In the late 1800s, the town began to grow and develop. The railroad came to town in 1887, and the town soon became a hub for the surrounding area. The town also became a popular tourist destination, with many people coming to visit the nearby lakes and rivers.
Geography
Fairmount is located in Grant County, Indiana, about an hour northeast of Indianapolis. The town is situated in the heart of the state, and is surrounded by a variety of small towns and rural areas. The town is located on the banks of the Mississinewa River, and is home to a variety of parks and recreational areas. The town is also home to a variety of lakes, including Lake Maxinkuckee, which is a popular spot for fishing and boating.
Economy
Fairmount is a small town, and the economy is largely based on agriculture and tourism. The town is home to a variety of small businesses, including a few restaurants, a grocery store, and a few other small businesses. The town is also home to a few manufacturing companies, including a furniture factory and a plastics factory. The town is also home to a variety of churches, and is a popular destination for tourists who come to visit the nearby lakes and rivers.
Demographics
As of the 2010 census, the population of Fairmount was 2,521. The town is predominantly white, with about 95% of the population being white. The town is also home to a variety of other ethnicities, including African American, Hispanic, and Asian. The median household income in Fairmount is $41,000, and the median home value is $90,000. The town has a low unemployment rate, and the cost of living is relatively low.
Conclusion
Fairmount, Indiana is a small town located in Grant County, Indiana. The town has a population of about 2,500 people and is known for its small-town charm and friendly atmosphere. The town is home to a variety of businesses, including a few restaurants, a grocery store, and a few other small businesses. The town is also home to a few parks and recreational areas, making it a great place to live and visit. The town is predominantly white, with about 95% of the population being white. The town is also home to a variety of other ethnicities, including African American, Hispanic, and Asian. The town has a low unemployment rate, and the cost of living is relatively low.
Common Questions
What is Per Capita Income in Fairmount?
Per Capita income in Fairmount is $23,169.
What is the Median Family Income in Fairmount?
Median Family Income in Fairmount is $55,658.
What is the Median Household income in Fairmount?
Median Household Income in Fairmount is $48,235.
What is Income or Wage Gap in Fairmount?
Income or Wage Gap in Fairmount is 65.0%.
Women in Fairmount earn 35.0 cents for every dollar earned by a man.
What is Inequality or Gini Index in Fairmount?
Inequality or Gini Index in Fairmount is 0.34.
What is the Total Population of Fairmount?
Total Population of Fairmount is 2,582.
What is the Total Male Population of Fairmount?
Total Male Population of Fairmount is 1,358.
What is the Total Female Population of Fairmount?
Total Female Population of Fairmount is 1,224.
What is the Ratio of Males per 100 Females in Fairmount?
There are 110.95 Males per 100 Females in Fairmount.
What is the Ratio of Females per 100 Males in Fairmount?
There are 90.13 Females per 100 Males in Fairmount.
What is the Median Population Age in Fairmount?
Median Population Age in Fairmount is 40.3 Years.
What is the Average Family Size in Fairmount
Average Family Size in Fairmount is 2.8 People.
What is the Average Household Size in Fairmount
Average Household Size in Fairmount is 2.3 People.
How Large is the Labor Force in Fairmount?
There are 1,088 People in the Labor Forcein in Fairmount.
What is the Percentage of People in the Labor Force in Fairmount?
55.1% of People are in the Labor Force in Fairmount.
What is the Unemployment Rate in Fairmount?
Unemployment Rate in Fairmount is 7.3%.