Economy, IN Map & Demographics
Economy Map

Economy Overview
$24,826
PER CAPITA INCOME
$53,125
AVG FAMILY INCOME
$50,000
AVG HOUSEHOLD INCOME
14.9%
WAGE / INCOME GAP [ % ]
85.1¢/ $1
WAGE / INCOME GAP [ $ ]
0.30
INEQUALITY / GINI INDEX
131
TOTAL POPULATION
68
MALE POPULATION
63
FEMALE POPULATION
107.94
MALES / 100 FEMALES
92.65
FEMALES / 100 MALES
38.3
MEDIAN AGE
2.7
AVG FAMILY SIZE
2.4
AVG HOUSEHOLD SIZE
70
LABOR FORCE [ PEOPLE ]
64.8%
PERCENT IN LABOR FORCE
5.7%
UNEMPLOYMENT RATE
Economy Zip Codes
Economy Area Codes
Income in Economy
Income Overview in Economy
Per Capita Income in Economy is $24,826, while median incomes of families and households are $53,125 and $50,000 respectively.
| Characteristic | Number | Measure |
| Per Capita Income | 131 | $24,826 |
| Median Family Income | 40 | $53,125 |
| Mean Family Income | 40 | $56,788 |
| Median Household Income | 54 | $50,000 |
| Mean Household Income | 54 | $56,500 |
| Income Deficit | 40 | $0 |
| Wage / Income Gap (%) | 131 | 14.90% |
| Wage / Income Gap ($) | 131 | 85.10¢ per $1 |
| Gini / Inequality Index | 131 | 0.30 |
Earnings by Sex in Economy
Average Earnings in Economy are $36,250, $39,167 for men and $33,333 for women, a difference of 14.9%.
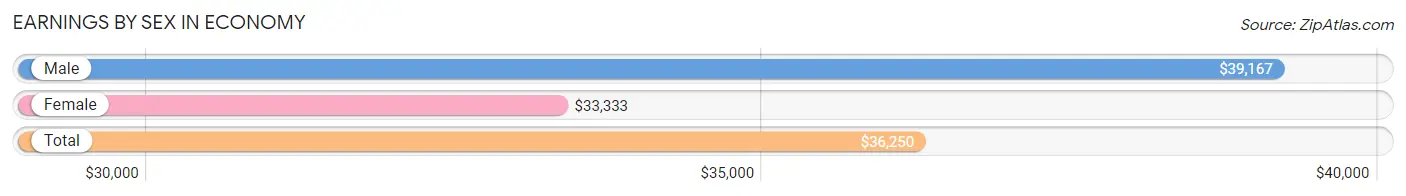
| Sex | Number | Average Earnings |
| Male | 40 (57.1%) | $39,167 |
| Female | 30 (42.9%) | $33,333 |
| Total | 70 (100.0%) | $36,250 |
Earnings by Sex by Income Bracket in Economy
The most common earnings brackets in Economy are $35,000 to $39,999 for men (8 | 20.0%) and $17,500 to $19,999 for women (6 | 20.0%).
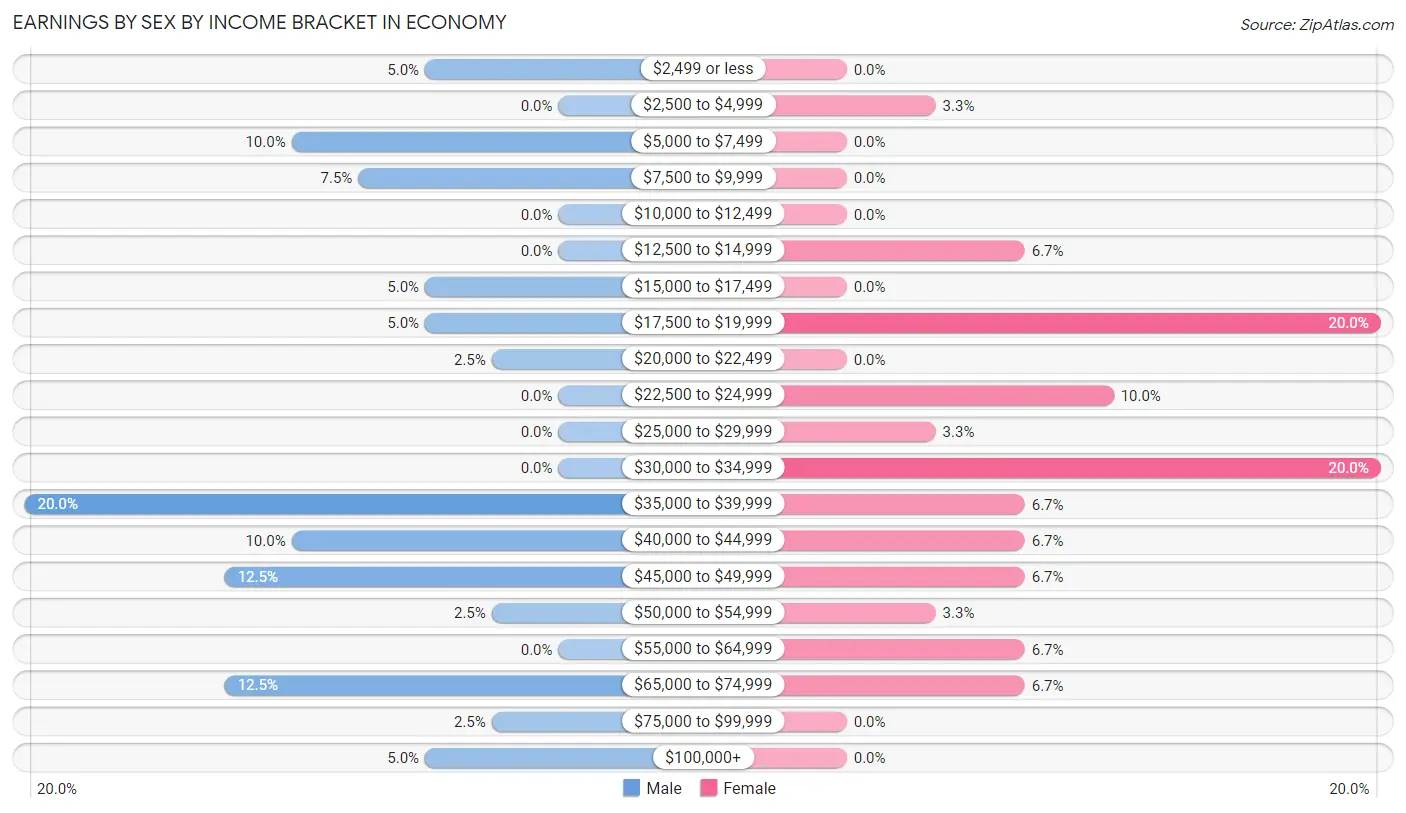
| Income | Male | Female |
| $2,499 or less | 2 (5.0%) | 0 (0.0%) |
| $2,500 to $4,999 | 0 (0.0%) | 1 (3.3%) |
| $5,000 to $7,499 | 4 (10.0%) | 0 (0.0%) |
| $7,500 to $9,999 | 3 (7.5%) | 0 (0.0%) |
| $10,000 to $12,499 | 0 (0.0%) | 0 (0.0%) |
| $12,500 to $14,999 | 0 (0.0%) | 2 (6.7%) |
| $15,000 to $17,499 | 2 (5.0%) | 0 (0.0%) |
| $17,500 to $19,999 | 2 (5.0%) | 6 (20.0%) |
| $20,000 to $22,499 | 1 (2.5%) | 0 (0.0%) |
| $22,500 to $24,999 | 0 (0.0%) | 3 (10.0%) |
| $25,000 to $29,999 | 0 (0.0%) | 1 (3.3%) |
| $30,000 to $34,999 | 0 (0.0%) | 6 (20.0%) |
| $35,000 to $39,999 | 8 (20.0%) | 2 (6.7%) |
| $40,000 to $44,999 | 4 (10.0%) | 2 (6.7%) |
| $45,000 to $49,999 | 5 (12.5%) | 2 (6.7%) |
| $50,000 to $54,999 | 1 (2.5%) | 1 (3.3%) |
| $55,000 to $64,999 | 0 (0.0%) | 2 (6.7%) |
| $65,000 to $74,999 | 5 (12.5%) | 2 (6.7%) |
| $75,000 to $99,999 | 1 (2.5%) | 0 (0.0%) |
| $100,000+ | 2 (5.0%) | 0 (0.0%) |
| Total | 40 (100.0%) | 30 (100.0%) |
Earnings by Sex by Educational Attainment in Economy
Average earnings in Economy are $39,167 for men and $34,375 for women, a difference of 12.2%. Men with an educational attainment of less than high school enjoy the highest average annual earnings of $70,313, while those with high school diploma education earn the least with $37,500. Women with an educational attainment of graduate degree earn the most with the average annual earnings of $61,250, while those with college or associate's degree education have the smallest earnings of $33,438.
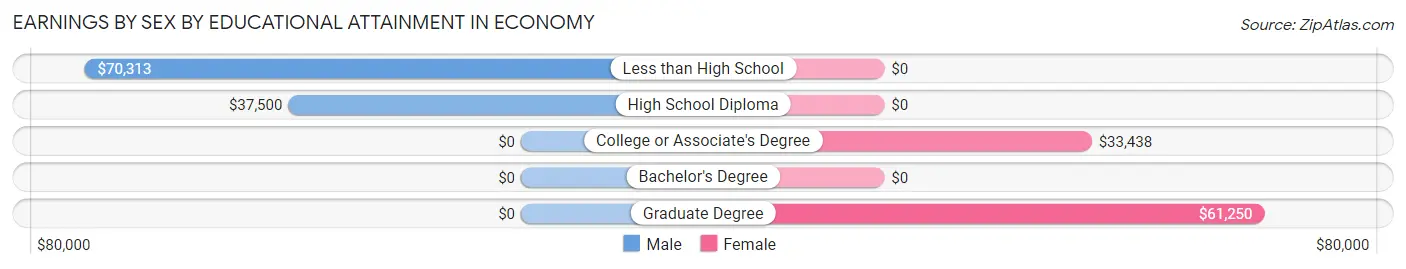
| Educational Attainment | Male Income | Female Income |
| Less than High School | $70,313 | $0 |
| High School Diploma | $37,500 | $0 |
| College or Associate's Degree | - | - |
| Bachelor's Degree | - | - |
| Graduate Degree | - | - |
| Total | $39,167 | $34,375 |
Family Income in Economy
Family Income Brackets in Economy
According to the Economy family income data, there are 14 families falling into the $35,000 to $49,999 income range, which is the most common income bracket and makes up 35.0% of all families.
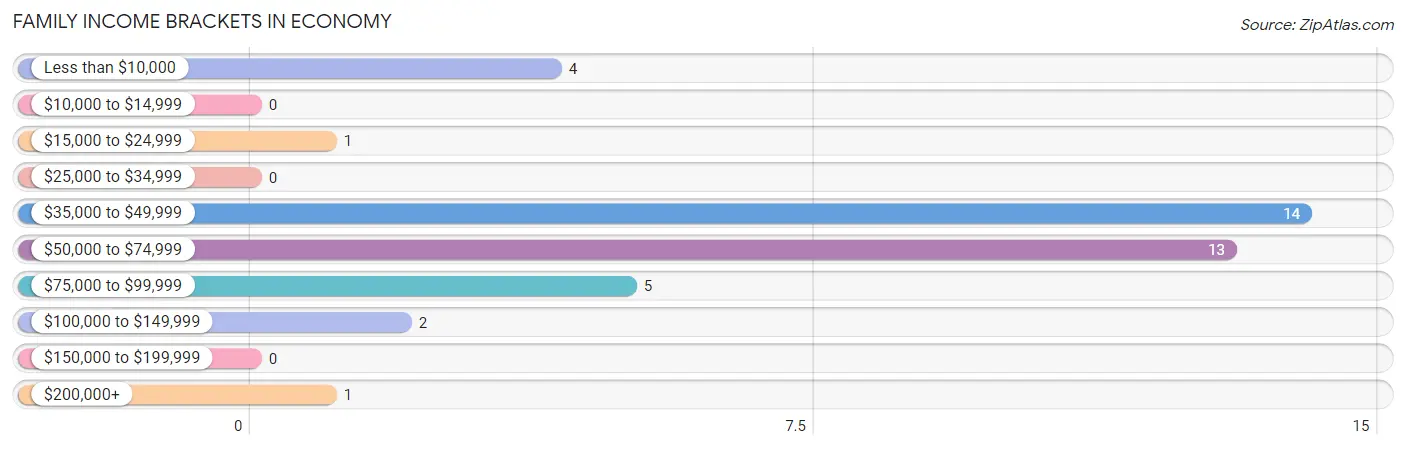
| Income Bracket | # Families | % Families |
| Less than $10,000 | 4 | 10.0% |
| $10,000 to $14,999 | 0 | 0.0% |
| $15,000 to $24,999 | 1 | 2.5% |
| $25,000 to $34,999 | 0 | 0.0% |
| $35,000 to $49,999 | 14 | 35.0% |
| $50,000 to $74,999 | 13 | 32.5% |
| $75,000 to $99,999 | 5 | 12.5% |
| $100,000 to $149,999 | 2 | 5.0% |
| $150,000 to $199,999 | 0 | 0.0% |
| $200,000+ | 1 | 2.5% |
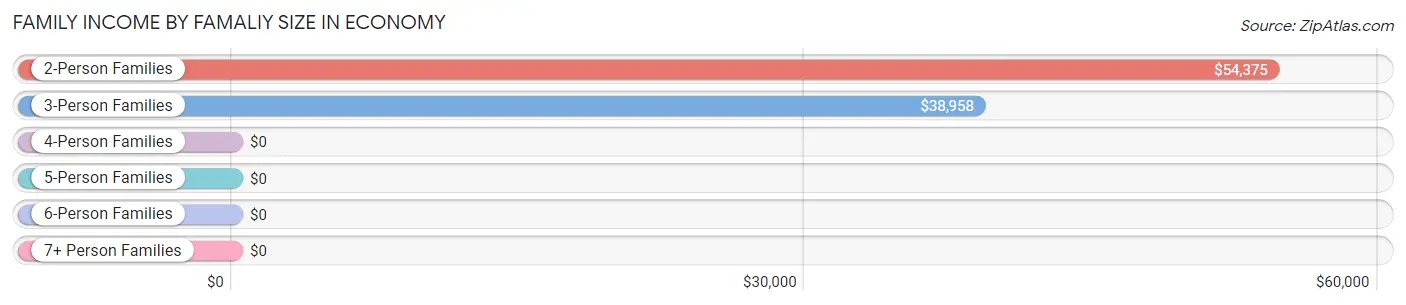
Family Income by Famaliy Size in Economy
2-person families (20 | 50.0%) account for the highest median family income in Economy with $54,375 per family, while 2-person families (20 | 50.0%) have the highest median income of $27,188 per family member.
| Income Bracket | # Families | Median Income |
| 2-Person Families | 20 (50.0%) | $54,375 |
| 3-Person Families | 15 (37.5%) | $38,958 |
| 4-Person Families | 2 (5.0%) | $0 |
| 5-Person Families | 3 (7.5%) | $0 |
| 6-Person Families | 0 (0.0%) | $0 |
| 7+ Person Families | 0 (0.0%) | $0 |
| Total | 40 (100.0%) | $53,125 |
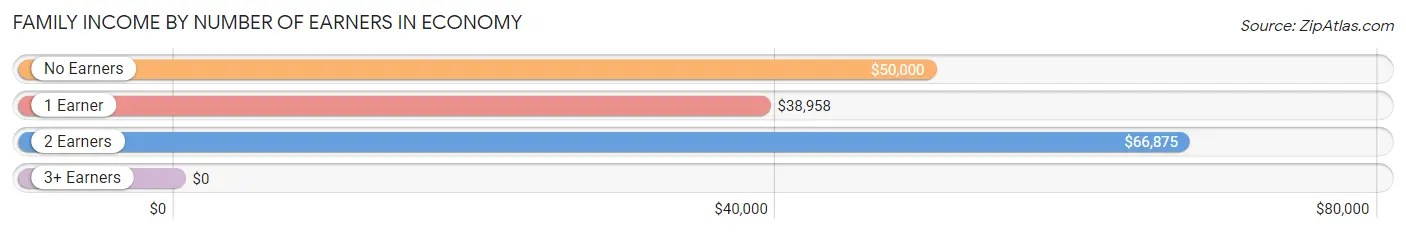
Family Income by Number of Earners in Economy
| Number of Earners | # Families | Median Income |
| No Earners | 8 (20.0%) | $50,000 |
| 1 Earner | 17 (42.5%) | $38,958 |
| 2 Earners | 11 (27.5%) | $66,875 |
| 3+ Earners | 4 (10.0%) | $0 |
| Total | 40 (100.0%) | $53,125 |
Household Income in Economy
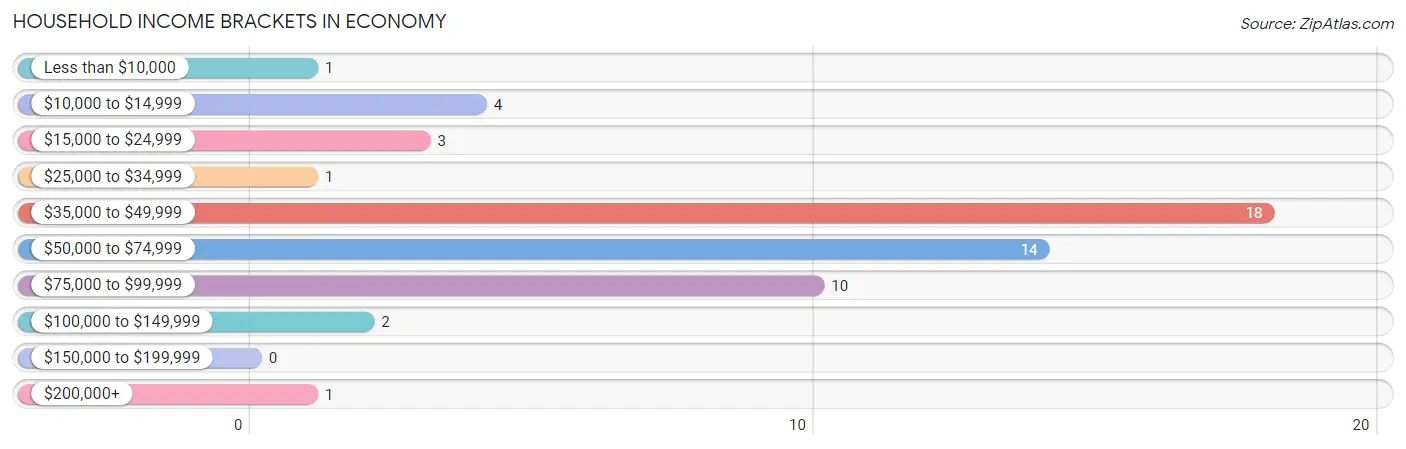
Household Income Brackets in Economy
With 18 households falling in the category, the $35,000 to $49,999 income range is the most frequent in Economy, accounting for 33.3% of all households.
| Income Bracket | # Households | % Households |
| Less than $10,000 | 1 | 1.9% |
| $10,000 to $14,999 | 4 | 7.4% |
| $15,000 to $24,999 | 3 | 5.6% |
| $25,000 to $34,999 | 1 | 1.9% |
| $35,000 to $49,999 | 18 | 33.3% |
| $50,000 to $74,999 | 14 | 25.9% |
| $75,000 to $99,999 | 10 | 18.5% |
| $100,000 to $149,999 | 2 | 3.7% |
| $150,000 to $199,999 | 0 | 0.0% |
| $200,000+ | 1 | 1.9% |
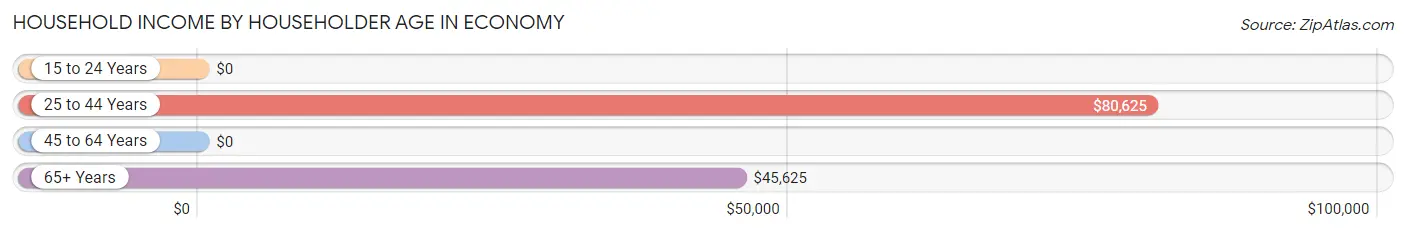
Household Income by Householder Age in Economy
The median household income in Economy is $50,000, with the highest median household income of $80,625 found in the 25 to 44 years age bracket for the primary householder. A total of 15 households (27.8%) fall into this category. Meanwhile, the 15 to 24 years age bracket for the primary householder has the lowest median household income of $0, with 5 households (9.3%) in this group.
| Income Bracket | # Households | Median Income |
| 15 to 24 Years | 5 (9.3%) | $0 |
| 25 to 44 Years | 15 (27.8%) | $80,625 |
| 45 to 64 Years | 17 (31.5%) | $0 |
| 65+ Years | 17 (31.5%) | $45,625 |
| Total | 54 (100.0%) | $50,000 |
Poverty in Economy
Income Below Poverty by Sex and Age in Economy
With 14.7% poverty level for males and 7.9% for females among the residents of Economy, 5 year old males and 12 to 14 year old females are the most vulnerable to poverty, with 2 males (100.0%) and 2 females (100.0%) in their respective age groups living below the poverty level.
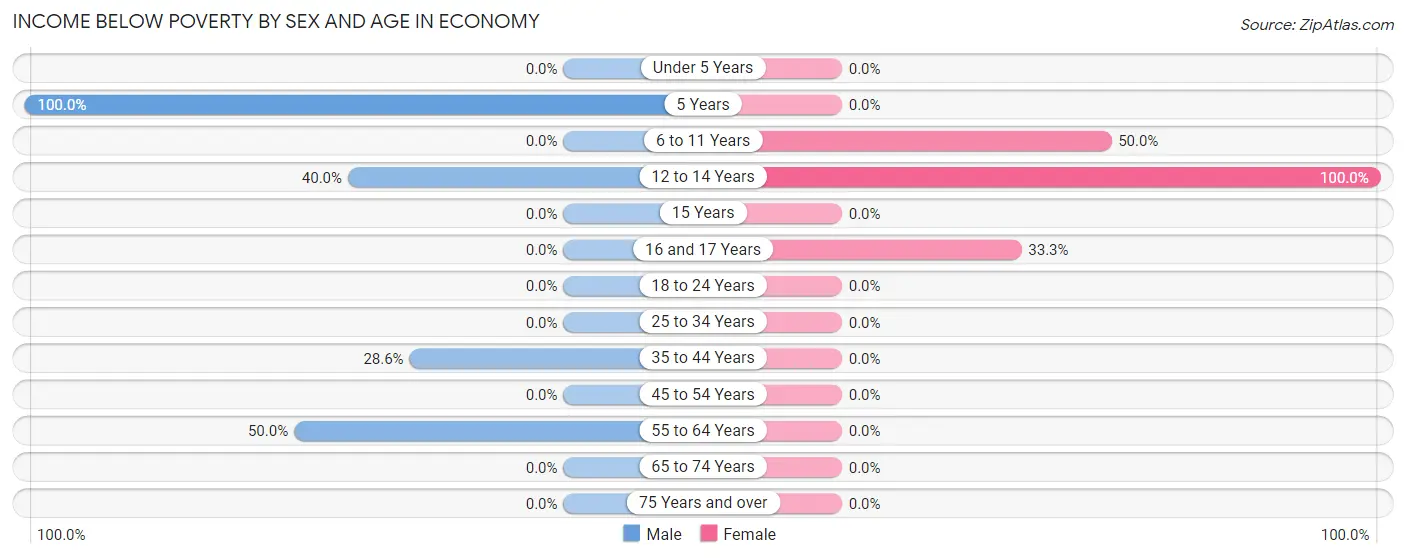
| Age Bracket | Male | Female |
| Under 5 Years | 0 (0.0%) | 0 (0.0%) |
| 5 Years | 2 (100.0%) | 0 (0.0%) |
| 6 to 11 Years | 0 (0.0%) | 1 (50.0%) |
| 12 to 14 Years | 2 (40.0%) | 2 (100.0%) |
| 15 Years | 0 (0.0%) | 0 (0.0%) |
| 16 and 17 Years | 0 (0.0%) | 2 (33.3%) |
| 18 to 24 Years | 0 (0.0%) | 0 (0.0%) |
| 25 to 34 Years | 0 (0.0%) | 0 (0.0%) |
| 35 to 44 Years | 4 (28.6%) | 0 (0.0%) |
| 45 to 54 Years | 0 (0.0%) | 0 (0.0%) |
| 55 to 64 Years | 2 (50.0%) | 0 (0.0%) |
| 65 to 74 Years | 0 (0.0%) | 0 (0.0%) |
| 75 Years and over | 0 (0.0%) | 0 (0.0%) |
| Total | 10 (14.7%) | 5 (7.9%) |
Income Above Poverty by Sex and Age in Economy
According to the poverty statistics in Economy, males aged under 5 years and females aged 5 years are the age groups that are most secure financially, with 100.0% of males and 100.0% of females in these age groups living above the poverty line.
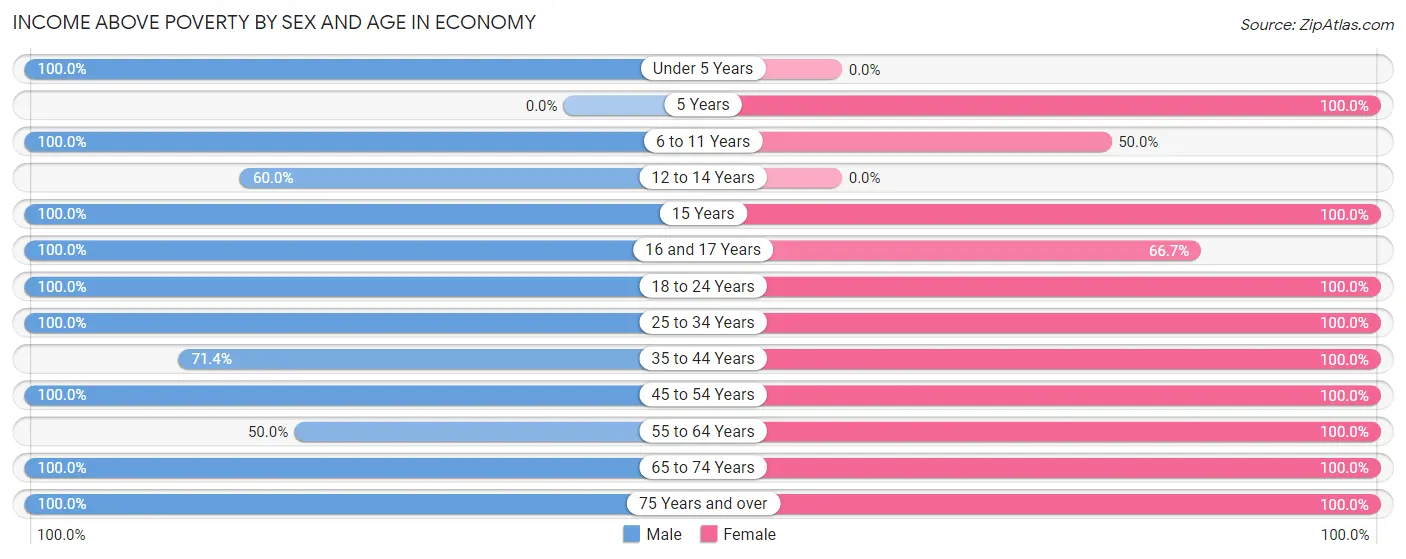
| Age Bracket | Male | Female |
| Under 5 Years | 2 (100.0%) | 0 (0.0%) |
| 5 Years | 0 (0.0%) | 2 (100.0%) |
| 6 to 11 Years | 2 (100.0%) | 1 (50.0%) |
| 12 to 14 Years | 3 (60.0%) | 0 (0.0%) |
| 15 Years | 3 (100.0%) | 3 (100.0%) |
| 16 and 17 Years | 3 (100.0%) | 4 (66.7%) |
| 18 to 24 Years | 7 (100.0%) | 5 (100.0%) |
| 25 to 34 Years | 4 (100.0%) | 10 (100.0%) |
| 35 to 44 Years | 10 (71.4%) | 7 (100.0%) |
| 45 to 54 Years | 11 (100.0%) | 5 (100.0%) |
| 55 to 64 Years | 2 (50.0%) | 4 (100.0%) |
| 65 to 74 Years | 7 (100.0%) | 9 (100.0%) |
| 75 Years and over | 4 (100.0%) | 8 (100.0%) |
| Total | 58 (85.3%) | 58 (92.1%) |
Income Below Poverty Among Married-Couple Families in Economy
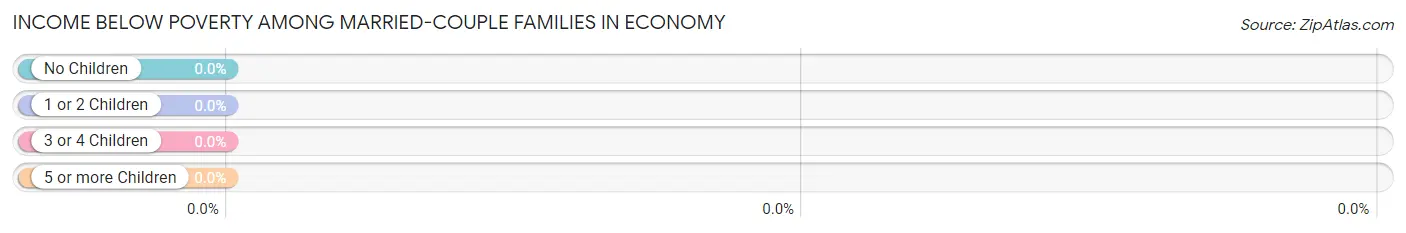
| Children | Above Poverty | Below Poverty |
| No Children | 19 (100.0%) | 0 (0.0%) |
| 1 or 2 Children | 3 (100.0%) | 0 (0.0%) |
| 3 or 4 Children | 2 (100.0%) | 0 (0.0%) |
| 5 or more Children | 0 (0.0%) | 0 (0.0%) |
| Total | 24 (100.0%) | 0 (0.0%) |
Income Below Poverty Among Single-Parent Households in Economy
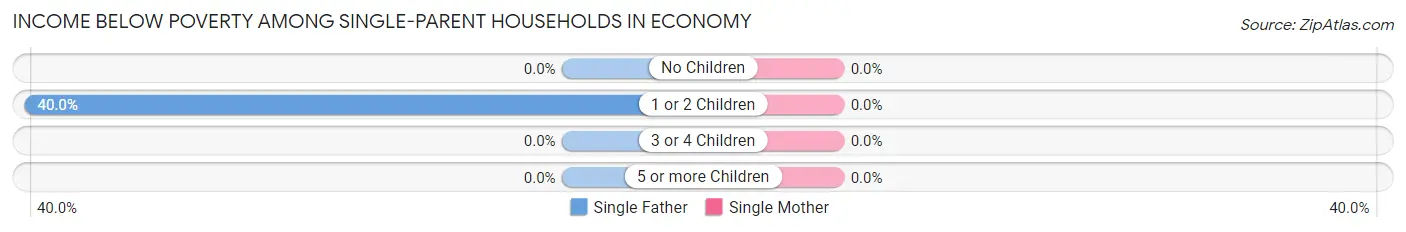
| Children | Single Father | Single Mother |
| No Children | 0 (0.0%) | 0 (0.0%) |
| 1 or 2 Children | 4 (40.0%) | 0 (0.0%) |
| 3 or 4 Children | 0 (0.0%) | 0 (0.0%) |
| 5 or more Children | 0 (0.0%) | 0 (0.0%) |
| Total | 4 (40.0%) | 0 (0.0%) |
Income Below Poverty Among Married-Couple vs Single-Parent Households in Economy
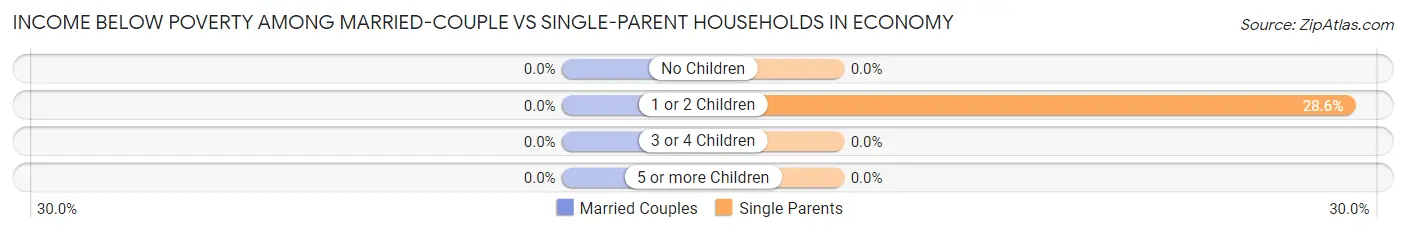
| Children | Married-Couple Families | Single-Parent Households |
| No Children | 0 (0.0%) | 0 (0.0%) |
| 1 or 2 Children | 0 (0.0%) | 4 (28.6%) |
| 3 or 4 Children | 0 (0.0%) | 0 (0.0%) |
| 5 or more Children | 0 (0.0%) | 0 (0.0%) |
| Total | 0 (0.0%) | 4 (25.0%) |
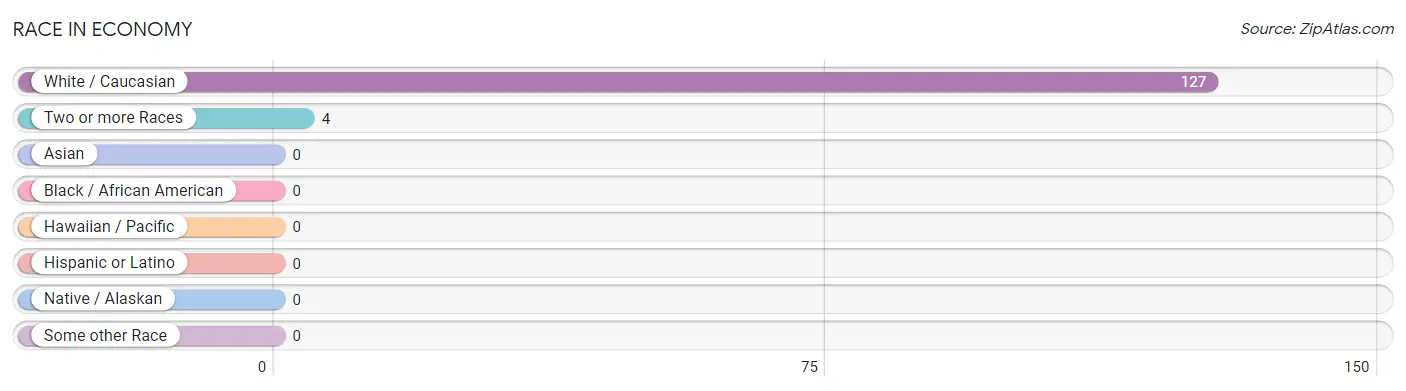
Race in Economy
The most populous races in Economy are White / Caucasian (127 | 97.0%), and Two or more Races (4 | 3.0%).
| Race | # Population | % Population |
| Asian | 0 | 0.0% |
| Black / African American | 0 | 0.0% |
| Hawaiian / Pacific | 0 | 0.0% |
| Hispanic or Latino | 0 | 0.0% |
| Native / Alaskan | 0 | 0.0% |
| White / Caucasian | 127 | 97.0% |
| Two or more Races | 4 | 3.0% |
| Some other Race | 0 | 0.0% |
| Total | 131 | 100.0% |
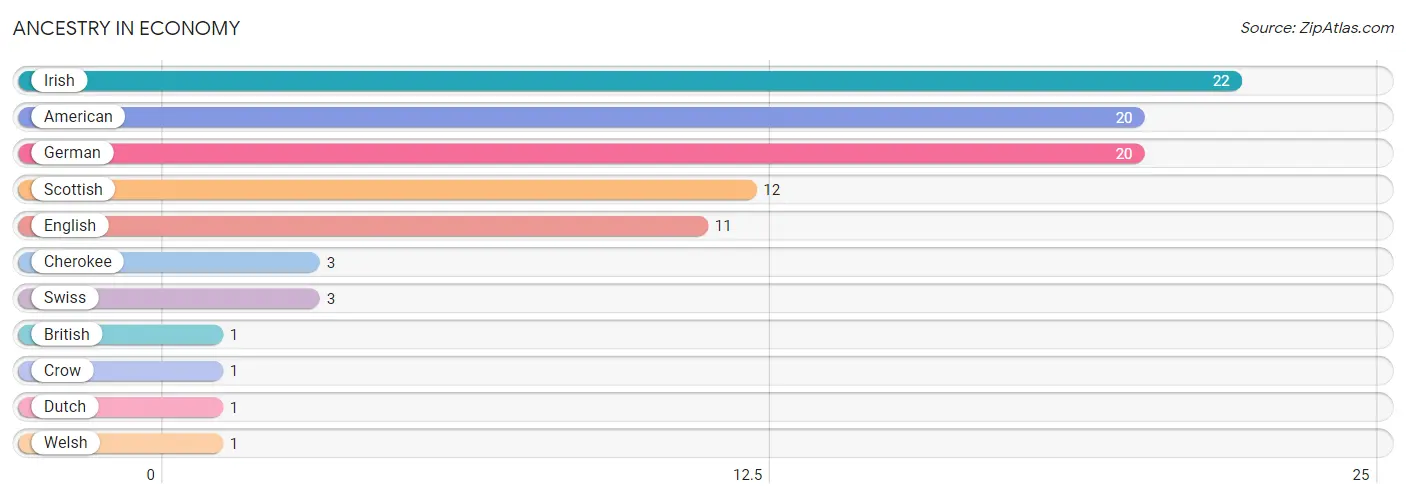
Ancestry in Economy
The most populous ancestries reported in Economy are Irish (22 | 16.8%), American (20 | 15.3%), German (20 | 15.3%), Scottish (12 | 9.2%), and English (11 | 8.4%), together accounting for 64.9% of all Economy residents.
| Ancestry | # Population | % Population |
| American | 20 | 15.3% |
| British | 1 | 0.8% |
| Cherokee | 3 | 2.3% |
| Crow | 1 | 0.8% |
| Dutch | 1 | 0.8% |
| English | 11 | 8.4% |
| German | 20 | 15.3% |
| Irish | 22 | 16.8% |
| Scottish | 12 | 9.2% |
| Swiss | 3 | 2.3% |
| Welsh | 1 | 0.8% | View All 11 Rows |
Immigrants in Economy

| Immigration Origin | # Population | % Population | View All 0 Rows |
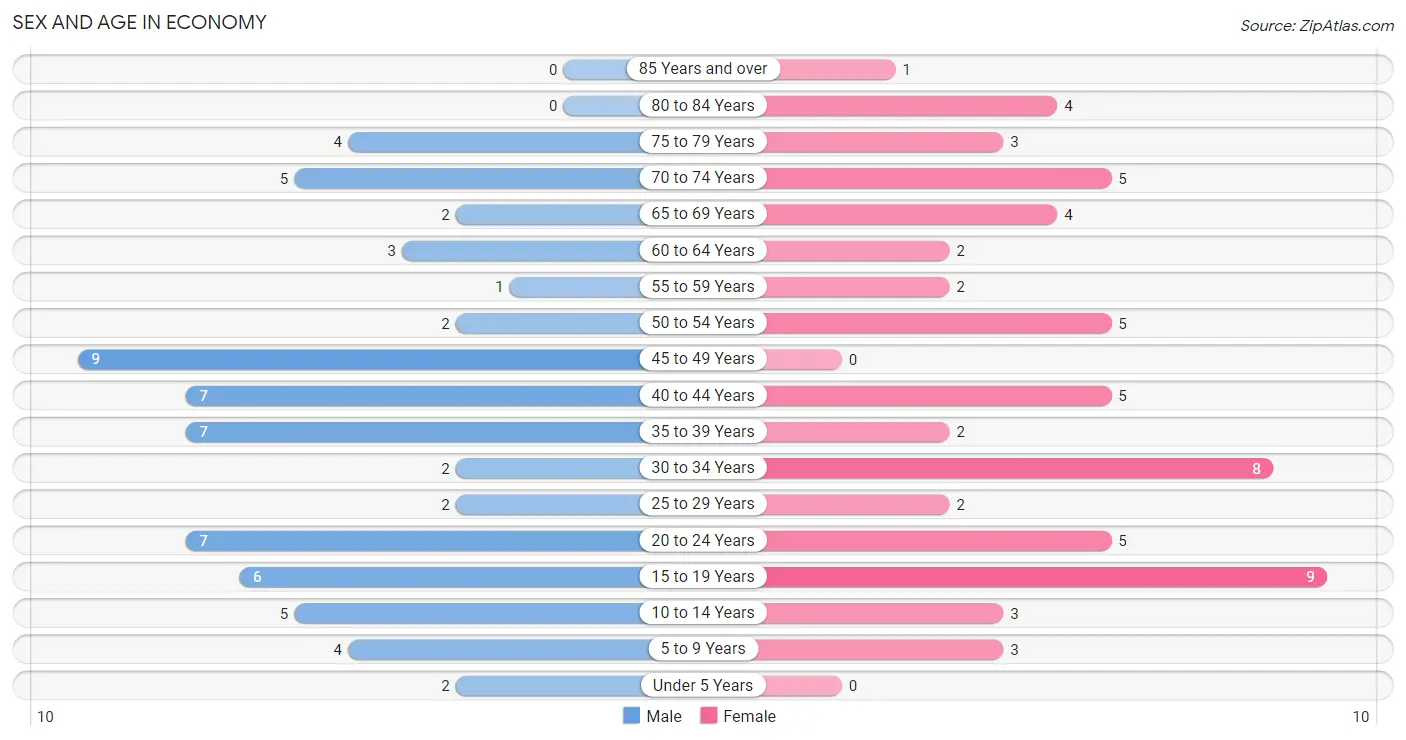
Sex and Age in Economy
Sex and Age in Economy
The most populous age groups in Economy are 45 to 49 Years (9 | 13.2%) for men and 15 to 19 Years (9 | 14.3%) for women.
| Age Bracket | Male | Female |
| Under 5 Years | 2 (2.9%) | 0 (0.0%) |
| 5 to 9 Years | 4 (5.9%) | 3 (4.8%) |
| 10 to 14 Years | 5 (7.3%) | 3 (4.8%) |
| 15 to 19 Years | 6 (8.8%) | 9 (14.3%) |
| 20 to 24 Years | 7 (10.3%) | 5 (7.9%) |
| 25 to 29 Years | 2 (2.9%) | 2 (3.2%) |
| 30 to 34 Years | 2 (2.9%) | 8 (12.7%) |
| 35 to 39 Years | 7 (10.3%) | 2 (3.2%) |
| 40 to 44 Years | 7 (10.3%) | 5 (7.9%) |
| 45 to 49 Years | 9 (13.2%) | 0 (0.0%) |
| 50 to 54 Years | 2 (2.9%) | 5 (7.9%) |
| 55 to 59 Years | 1 (1.5%) | 2 (3.2%) |
| 60 to 64 Years | 3 (4.4%) | 2 (3.2%) |
| 65 to 69 Years | 2 (2.9%) | 4 (6.4%) |
| 70 to 74 Years | 5 (7.3%) | 5 (7.9%) |
| 75 to 79 Years | 4 (5.9%) | 3 (4.8%) |
| 80 to 84 Years | 0 (0.0%) | 4 (6.4%) |
| 85 Years and over | 0 (0.0%) | 1 (1.6%) |
| Total | 68 (100.0%) | 63 (100.0%) |
Families and Households in Economy
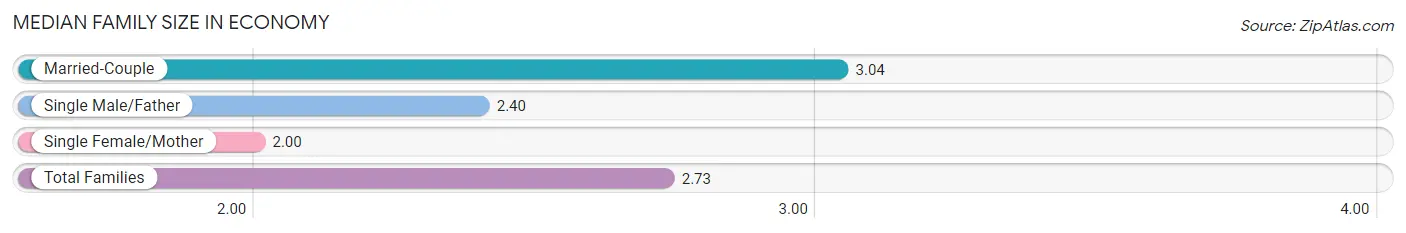
Median Family Size in Economy
The median family size in Economy is 2.73 persons per family, with married-couple families (24 | 60.0%) accounting for the largest median family size of 3.04 persons per family. On the other hand, single female/mother families (6 | 15.0%) represent the smallest median family size with 2.00 persons per family.
| Family Type | # Families | Family Size |
| Married-Couple | 24 (60.0%) | 3.04 |
| Single Male/Father | 10 (25.0%) | 2.40 |
| Single Female/Mother | 6 (15.0%) | 2.00 |
| Total Families | 40 (100.0%) | 2.73 |
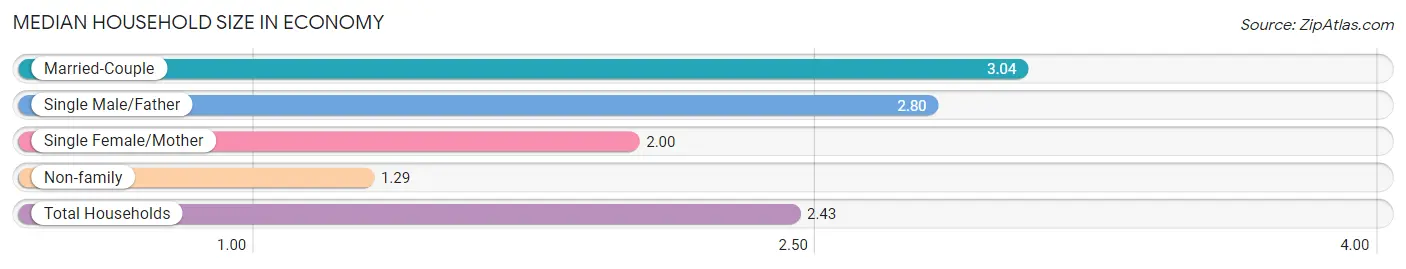
Median Household Size in Economy
The median household size in Economy is 2.43 persons per household, with married-couple households (24 | 44.4%) accounting for the largest median household size of 3.04 persons per household. non-family households (14 | 25.9%) represent the smallest median household size with 1.29 persons per household.
| Household Type | # Households | Household Size |
| Married-Couple | 24 (44.4%) | 3.04 |
| Single Male/Father | 10 (18.5%) | 2.80 |
| Single Female/Mother | 6 (11.1%) | 2.00 |
| Non-family | 14 (25.9%) | 1.29 |
| Total Households | 54 (100.0%) | 2.43 |
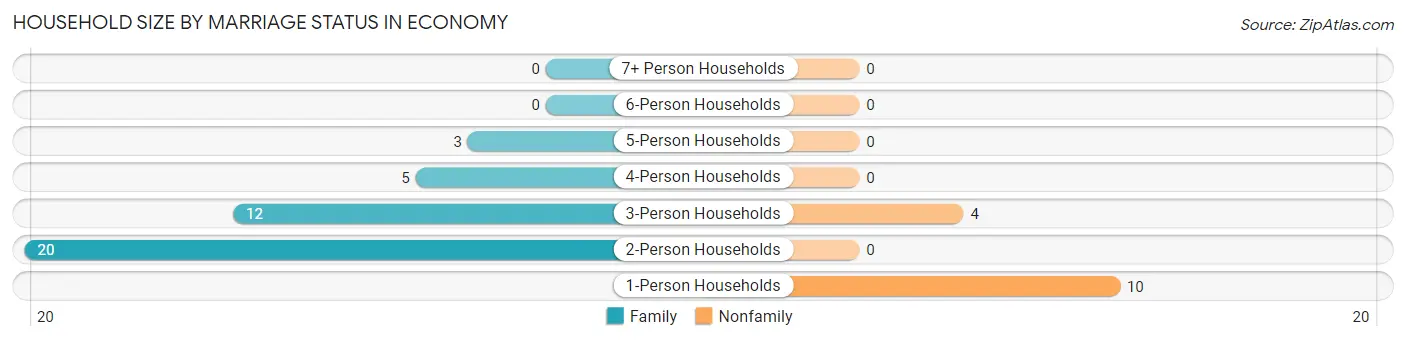
Household Size by Marriage Status in Economy
Out of a total of 54 households in Economy, 40 (74.1%) are family households, while 14 (25.9%) are nonfamily households. The most numerous type of family households are 2-person households, comprising 20, and the most common type of nonfamily households are 1-person households, comprising 10.
| Household Size | Family Households | Nonfamily Households |
| 1-Person Households | - | 10 (18.5%) |
| 2-Person Households | 20 (37.0%) | 0 (0.0%) |
| 3-Person Households | 12 (22.2%) | 4 (7.4%) |
| 4-Person Households | 5 (9.3%) | 0 (0.0%) |
| 5-Person Households | 3 (5.6%) | 0 (0.0%) |
| 6-Person Households | 0 (0.0%) | 0 (0.0%) |
| 7+ Person Households | 0 (0.0%) | 0 (0.0%) |
| Total | 40 (74.1%) | 14 (25.9%) |
Female Fertility in Economy
Fertility by Age in Economy
| Age Bracket | Women with Births | Births / 1,000 Women |
| 15 to 19 years | 0 (0.0%) | 0.0 |
| 20 to 34 years | 0 (0.0%) | 0.0 |
| 35 to 50 years | 0 (0.0%) | 0.0 |
| Total | 0 (0.0%) | 0.0 |
Fertility by Age by Marriage Status in Economy
| Age Bracket | Married | Unmarried |
| 15 to 19 years | 0 (0.0%) | 0 (0.0%) |
| 20 to 34 years | 0 (0.0%) | 0 (0.0%) |
| 35 to 50 years | 0 (0.0%) | 0 (0.0%) |
| Total | 0 (0.0%) | 0 (0.0%) |
Fertility by Education in Economy
| Educational Attainment | Women with Births | Births / 1,000 Women |
| Less than High School | 0 (0.0%) | 0.0 |
| High School Diploma | 0 (0.0%) | 0.0 |
| College or Associate's Degree | 0 (0.0%) | 0.0 |
| Bachelor's Degree | 0 (0.0%) | 0.0 |
| Graduate Degree | 0 (0.0%) | 0.0 |
| Total | 0 (0.0%) | 0.0 |
Fertility by Education by Marriage Status in Economy
| Educational Attainment | Married | Unmarried |
| Less than High School | 0 (0.0%) | 0 (0.0%) |
| High School Diploma | 0 (0.0%) | 0 (0.0%) |
| College or Associate's Degree | 0 (0.0%) | 0 (0.0%) |
| Bachelor's Degree | 0 (0.0%) | 0 (0.0%) |
| Graduate Degree | 0 (0.0%) | 0 (0.0%) |
| Total | 0 (0.0%) | 0 (0.0%) |
Employment Characteristics in Economy
Employment by Class of Employer in Economy
Among the 62 employed individuals in Economy, private company employees (41 | 66.1%), self-employed (not incorporated) (11 | 17.7%), and not-for-profit organizations (7 | 11.3%) make up the most common classes of employment.
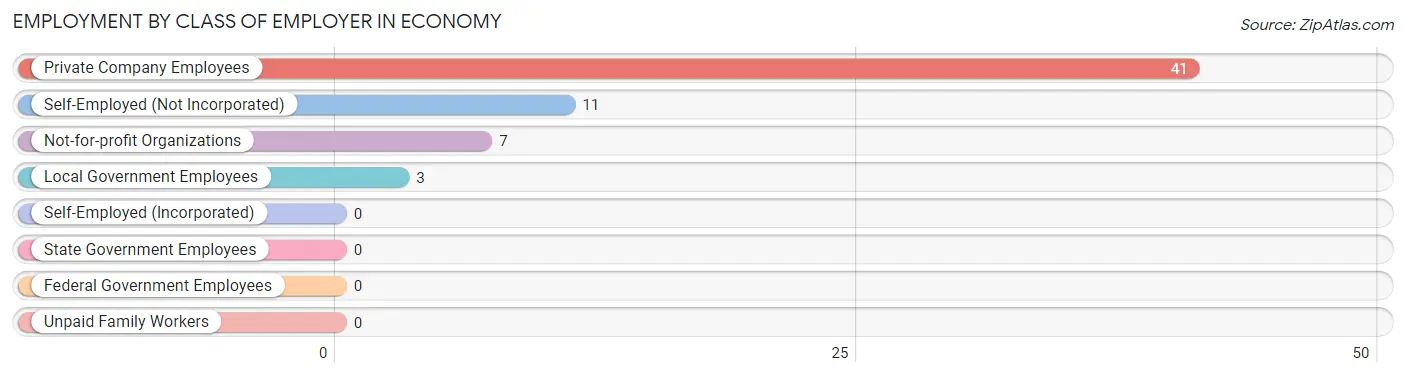
| Employer Class | # Employees | % Employees |
| Private Company Employees | 41 | 66.1% |
| Self-Employed (Incorporated) | 0 | 0.0% |
| Self-Employed (Not Incorporated) | 11 | 17.7% |
| Not-for-profit Organizations | 7 | 11.3% |
| Local Government Employees | 3 | 4.8% |
| State Government Employees | 0 | 0.0% |
| Federal Government Employees | 0 | 0.0% |
| Unpaid Family Workers | 0 | 0.0% |
| Total | 62 | 100.0% |
Employment Status by Age in Economy
According to the labor force statistics for Economy, out of the total population over 16 years of age (108), 64.8% or 70 individuals are in the labor force, with 5.7% or 4 of them unemployed. The age group with the highest labor force participation rate is 25 to 29 years, with 100.0% or 4 individuals in the labor force. Within the labor force, the 30 to 34 years age range has the highest percentage of unemployed individuals, with 20.0% or 2 of them being unemployed.
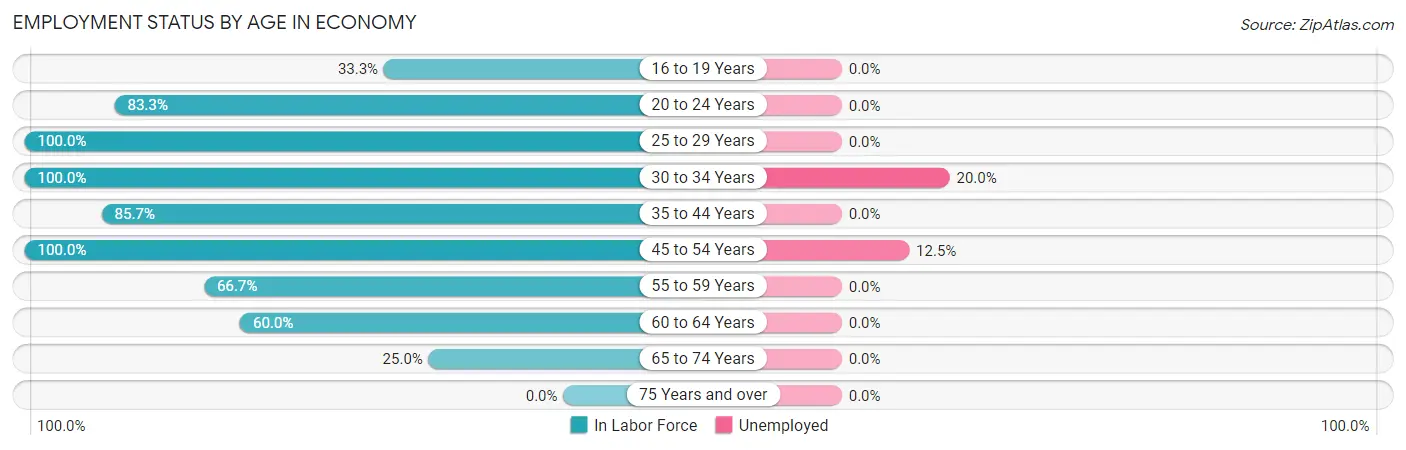
| Age Bracket | In Labor Force | Unemployed |
| 16 to 19 Years | 3 (33.3%) | 0 (0.0%) |
| 20 to 24 Years | 10 (83.3%) | 0 (0.0%) |
| 25 to 29 Years | 4 (100.0%) | 0 (0.0%) |
| 30 to 34 Years | 10 (100.0%) | 2 (20.0%) |
| 35 to 44 Years | 18 (85.7%) | 0 (0.0%) |
| 45 to 54 Years | 16 (100.0%) | 2 (12.5%) |
| 55 to 59 Years | 2 (66.7%) | 0 (0.0%) |
| 60 to 64 Years | 3 (60.0%) | 0 (0.0%) |
| 65 to 74 Years | 4 (25.0%) | 0 (0.0%) |
| 75 Years and over | 0 (0.0%) | 0 (0.0%) |
| Total | 70 (64.8%) | 4 (5.7%) |
Employment Status by Educational Attainment in Economy
According to labor force statistics for Economy, 89.8% of individuals (53) out of the total population between 25 and 64 years of age (59) are in the labor force, with 7.5% or 4 of them being unemployed. The group with the highest labor force participation rate are those with the educational attainment of less than high school, with 100.0% or 6 individuals in the labor force. Within the labor force, individuals with high school diploma education have the highest percentage of unemployment, with 12.5% or 2 of them being unemployed.
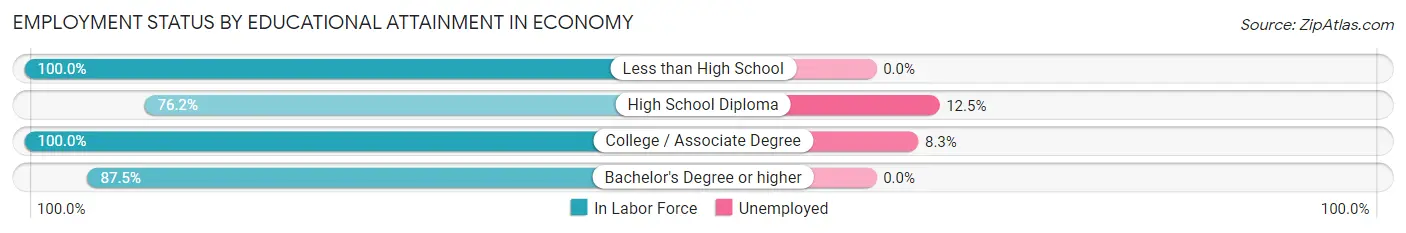
| Educational Attainment | In Labor Force | Unemployed |
| Less than High School | 6 (100.0%) | 0 (0.0%) |
| High School Diploma | 16 (76.2%) | 3 (12.5%) |
| College / Associate Degree | 24 (100.0%) | 2 (8.3%) |
| Bachelor's Degree or higher | 7 (87.5%) | 0 (0.0%) |
| Total | 53 (89.8%) | 4 (7.5%) |
Employment Occupations by Sex in Economy
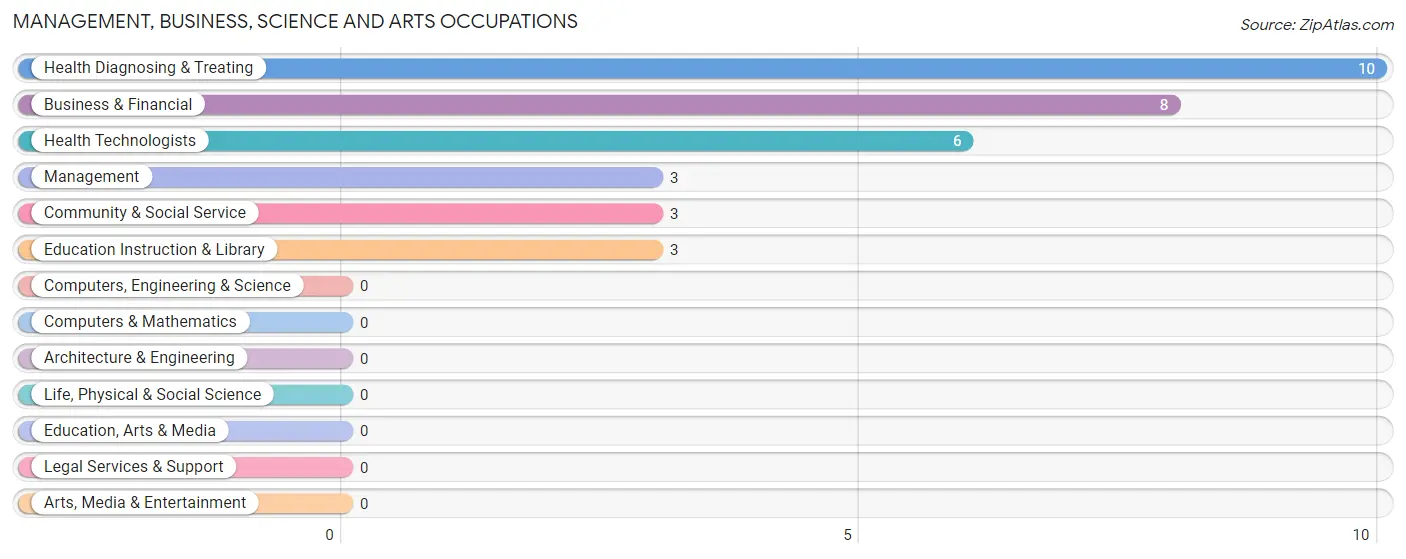
Management, Business, Science and Arts Occupations
The most common Management, Business, Science and Arts occupations in Economy are Health Diagnosing & Treating (10 | 15.1%), Business & Financial (8 | 12.1%), Health Technologists (6 | 9.1%), Management (3 | 4.5%), and Community & Social Service (3 | 4.5%).
Management, Business, Science and Arts Occupations by Sex
Within the Management, Business, Science and Arts occupations in Economy, the most male-oriented occupations are Business & Financial (37.5%), Management (33.3%), and Community & Social Service (33.3%), while the most female-oriented occupations are Health Diagnosing & Treating (100.0%), Health Technologists (100.0%), and Management (66.7%).
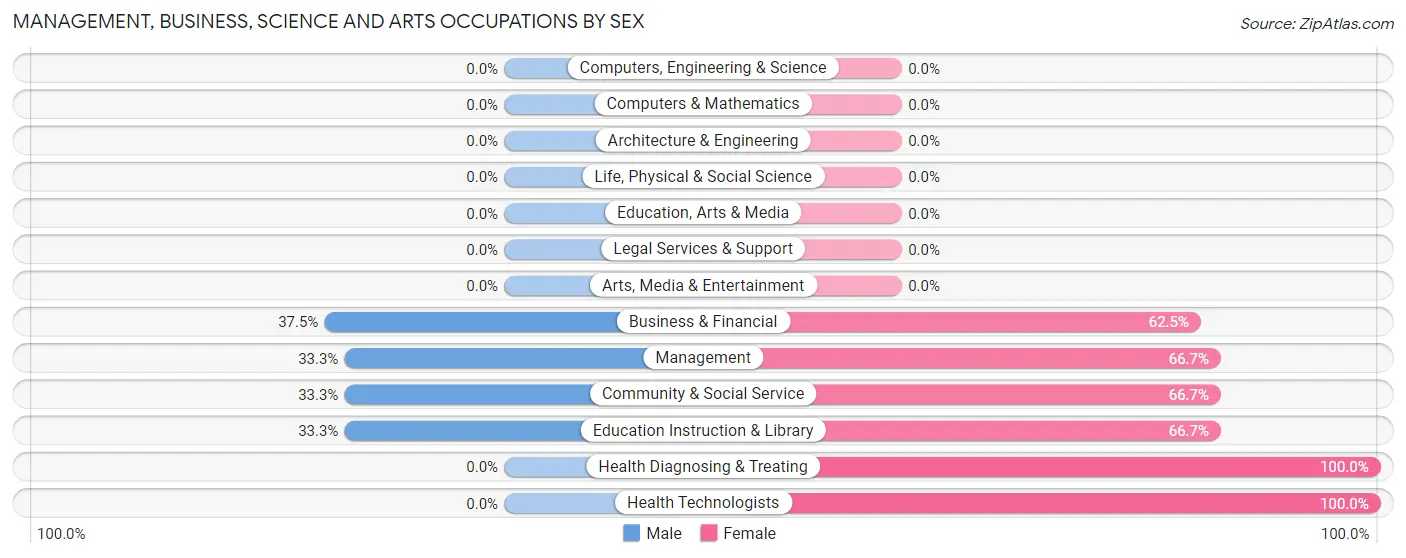
| Occupation | Male | Female |
| Management | 1 (33.3%) | 2 (66.7%) |
| Business & Financial | 3 (37.5%) | 5 (62.5%) |
| Computers, Engineering & Science | 0 (0.0%) | 0 (0.0%) |
| Computers & Mathematics | 0 (0.0%) | 0 (0.0%) |
| Architecture & Engineering | 0 (0.0%) | 0 (0.0%) |
| Life, Physical & Social Science | 0 (0.0%) | 0 (0.0%) |
| Community & Social Service | 1 (33.3%) | 2 (66.7%) |
| Education, Arts & Media | 0 (0.0%) | 0 (0.0%) |
| Legal Services & Support | 0 (0.0%) | 0 (0.0%) |
| Education Instruction & Library | 1 (33.3%) | 2 (66.7%) |
| Arts, Media & Entertainment | 0 (0.0%) | 0 (0.0%) |
| Health Diagnosing & Treating | 0 (0.0%) | 10 (100.0%) |
| Health Technologists | 0 (0.0%) | 6 (100.0%) |
| Total (Category) | 5 (20.8%) | 19 (79.2%) |
| Total (Overall) | 38 (57.6%) | 28 (42.4%) |
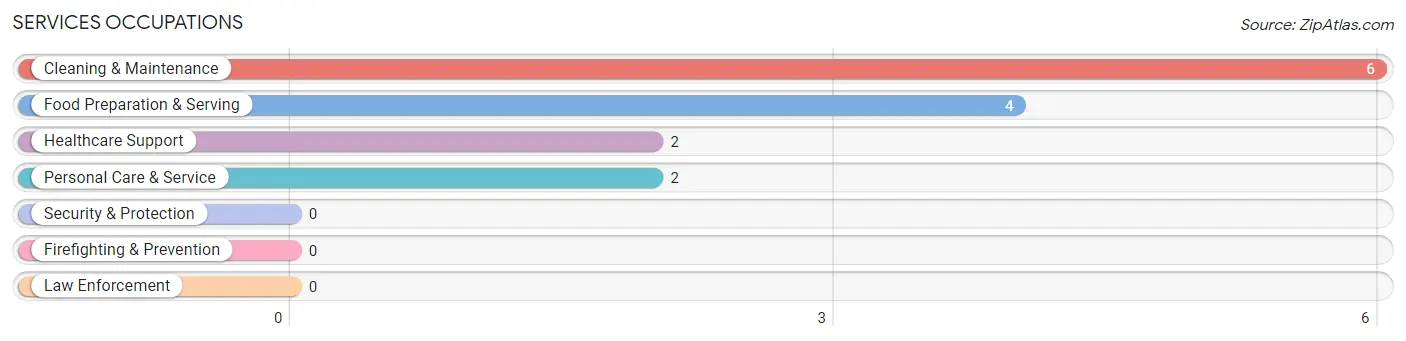
Services Occupations
The most common Services occupations in Economy are Cleaning & Maintenance (6 | 9.1%), Food Preparation & Serving (4 | 6.1%), Healthcare Support (2 | 3.0%), and Personal Care & Service (2 | 3.0%).
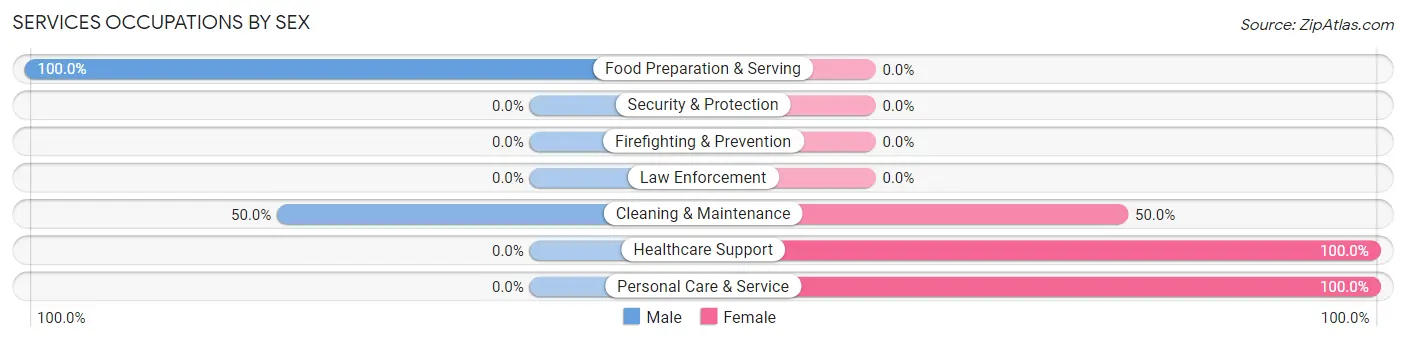
Services Occupations by Sex
Within the Services occupations in Economy, the most male-oriented occupations are Food Preparation & Serving (100.0%), and Cleaning & Maintenance (50.0%), while the most female-oriented occupations are Healthcare Support (100.0%), Personal Care & Service (100.0%), and Cleaning & Maintenance (50.0%).
| Occupation | Male | Female |
| Healthcare Support | 0 (0.0%) | 2 (100.0%) |
| Security & Protection | 0 (0.0%) | 0 (0.0%) |
| Firefighting & Prevention | 0 (0.0%) | 0 (0.0%) |
| Law Enforcement | 0 (0.0%) | 0 (0.0%) |
| Food Preparation & Serving | 4 (100.0%) | 0 (0.0%) |
| Cleaning & Maintenance | 3 (50.0%) | 3 (50.0%) |
| Personal Care & Service | 0 (0.0%) | 2 (100.0%) |
| Total (Category) | 7 (50.0%) | 7 (50.0%) |
| Total (Overall) | 38 (57.6%) | 28 (42.4%) |
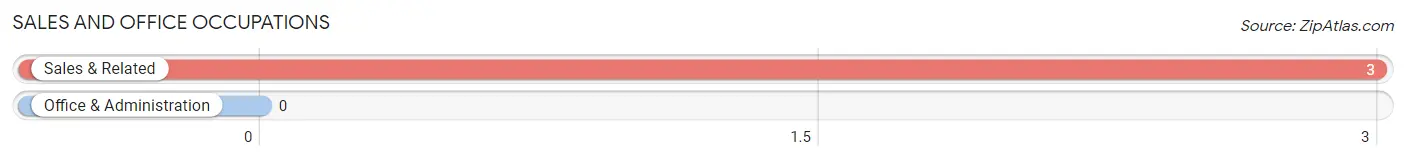
Sales and Office Occupations
The most common Sales and Office occupations in Economy are , and Sales & Related (3 | 4.5%).
Sales and Office Occupations by Sex

| Occupation | Male | Female |
| Sales & Related | 3 (100.0%) | 0 (0.0%) |
| Office & Administration | 0 (0.0%) | 0 (0.0%) |
| Total (Category) | 3 (100.0%) | 0 (0.0%) |
| Total (Overall) | 38 (57.6%) | 28 (42.4%) |
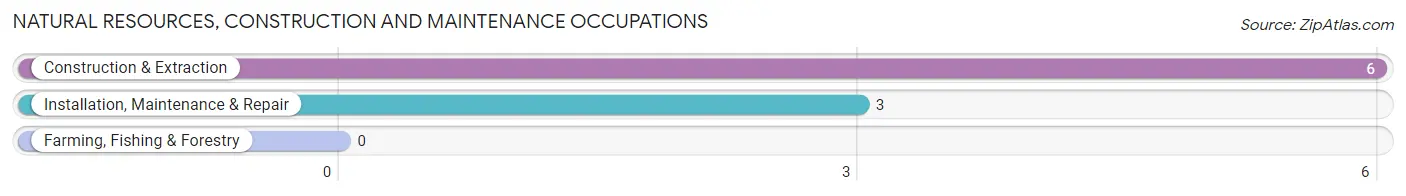
Natural Resources, Construction and Maintenance Occupations
The most common Natural Resources, Construction and Maintenance occupations in Economy are Construction & Extraction (6 | 9.1%), and Installation, Maintenance & Repair (3 | 4.5%).
Natural Resources, Construction and Maintenance Occupations by Sex
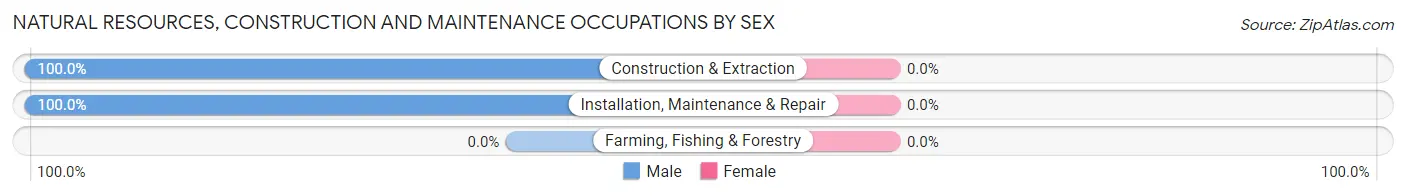
| Occupation | Male | Female |
| Farming, Fishing & Forestry | 0 (0.0%) | 0 (0.0%) |
| Construction & Extraction | 6 (100.0%) | 0 (0.0%) |
| Installation, Maintenance & Repair | 3 (100.0%) | 0 (0.0%) |
| Total (Category) | 9 (100.0%) | 0 (0.0%) |
| Total (Overall) | 38 (57.6%) | 28 (42.4%) |
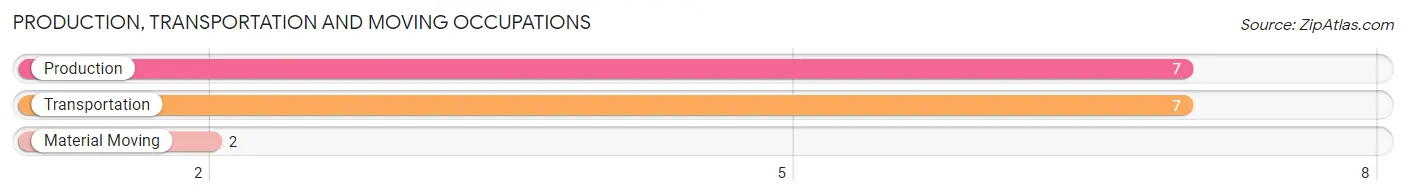
Production, Transportation and Moving Occupations
The most common Production, Transportation and Moving occupations in Economy are Production (7 | 10.6%), Transportation (7 | 10.6%), and Material Moving (2 | 3.0%).
Production, Transportation and Moving Occupations by Sex
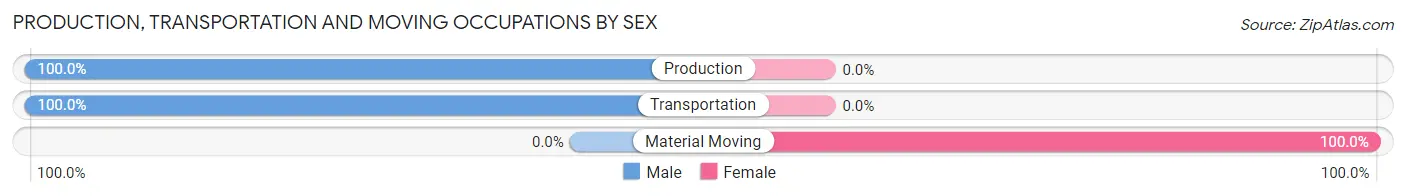
| Occupation | Male | Female |
| Production | 7 (100.0%) | 0 (0.0%) |
| Transportation | 7 (100.0%) | 0 (0.0%) |
| Material Moving | 0 (0.0%) | 2 (100.0%) |
| Total (Category) | 14 (87.5%) | 2 (12.5%) |
| Total (Overall) | 38 (57.6%) | 28 (42.4%) |
Employment Industries by Sex in Economy
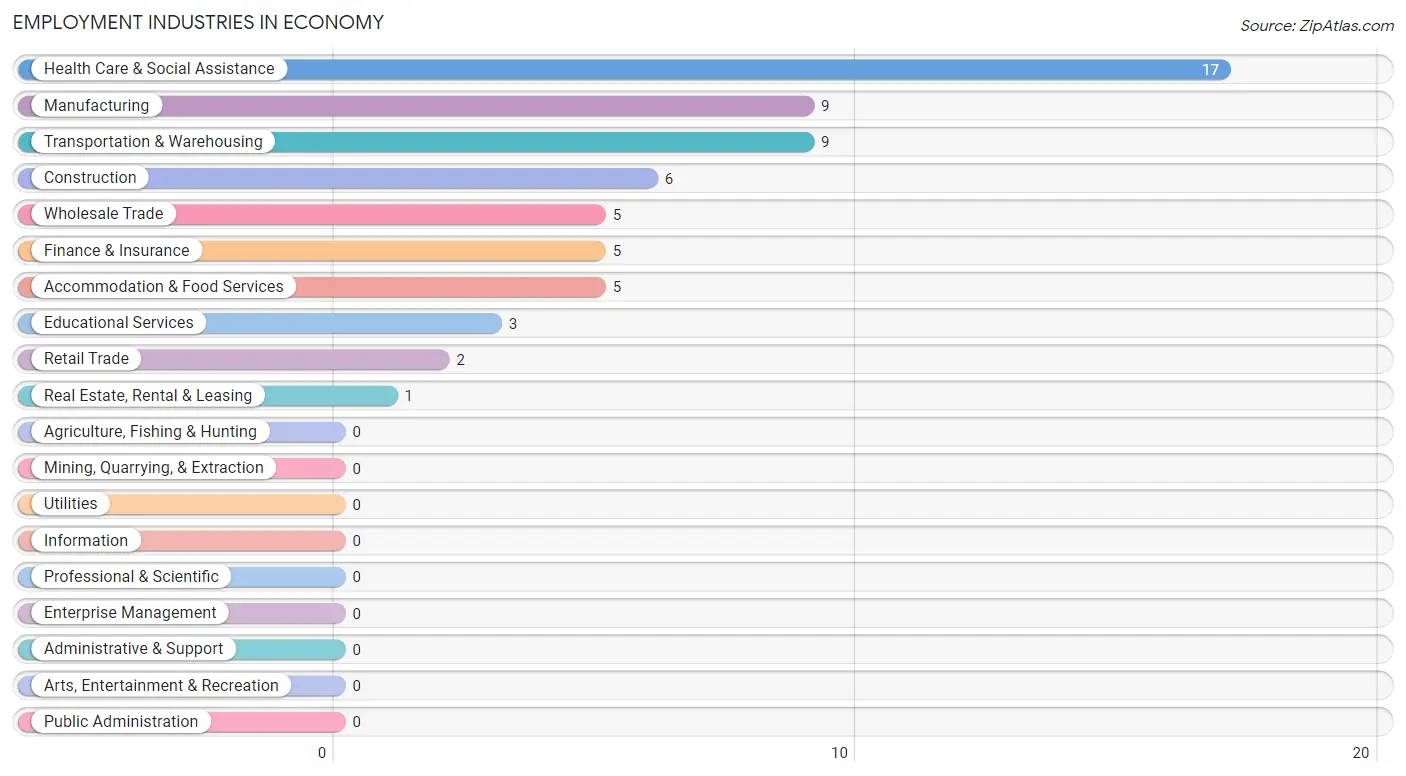
Employment Industries in Economy
The major employment industries in Economy include Health Care & Social Assistance (17 | 25.8%), Manufacturing (9 | 13.6%), Transportation & Warehousing (9 | 13.6%), Construction (6 | 9.1%), and Wholesale Trade (5 | 7.6%).
Employment Industries by Sex in Economy
The Economy industries that see more men than women are Construction (100.0%), Manufacturing (100.0%), and Retail Trade (100.0%), whereas the industries that tend to have a higher number of women are Finance & Insurance (100.0%), Health Care & Social Assistance (94.1%), and Educational Services (66.7%).
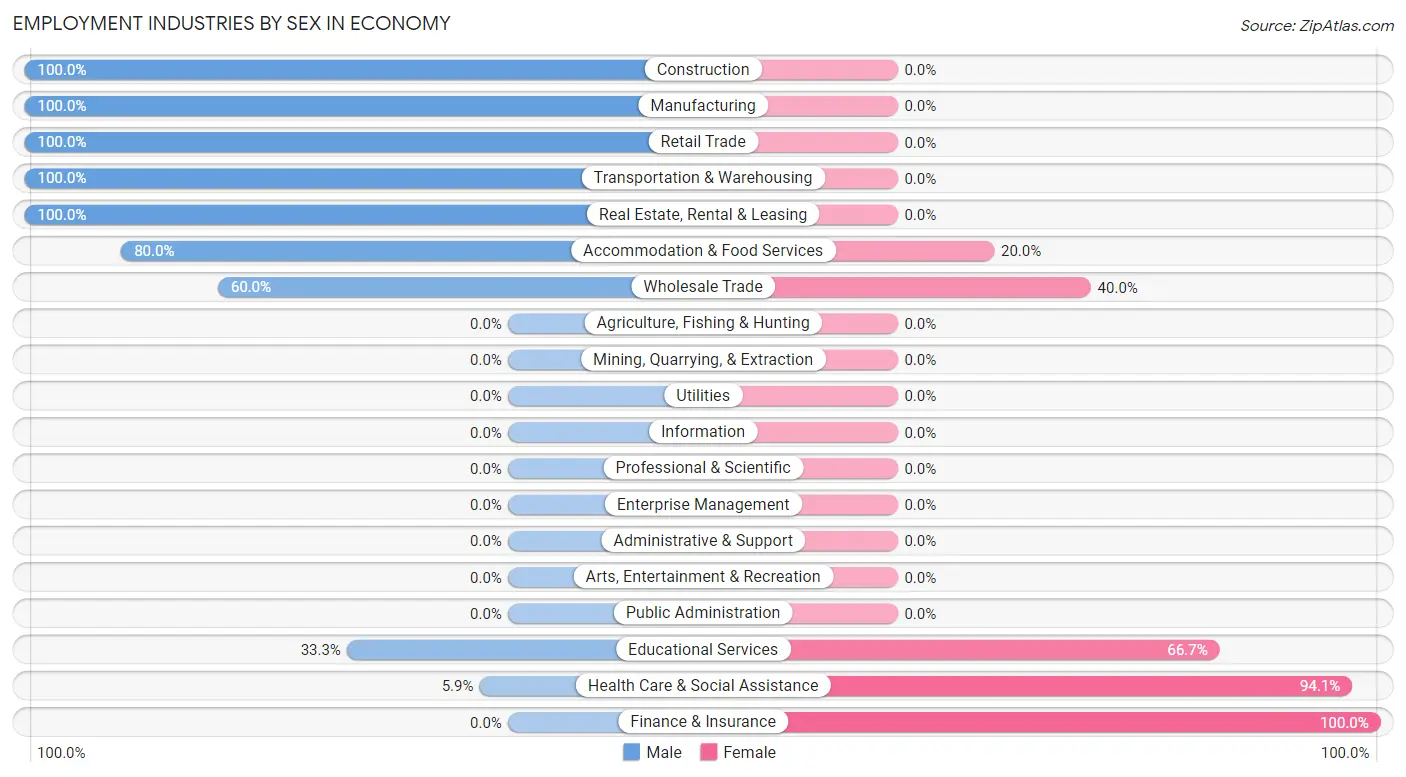
| Industry | Male | Female |
| Agriculture, Fishing & Hunting | 0 (0.0%) | 0 (0.0%) |
| Mining, Quarrying, & Extraction | 0 (0.0%) | 0 (0.0%) |
| Construction | 6 (100.0%) | 0 (0.0%) |
| Manufacturing | 9 (100.0%) | 0 (0.0%) |
| Wholesale Trade | 3 (60.0%) | 2 (40.0%) |
| Retail Trade | 2 (100.0%) | 0 (0.0%) |
| Transportation & Warehousing | 9 (100.0%) | 0 (0.0%) |
| Utilities | 0 (0.0%) | 0 (0.0%) |
| Information | 0 (0.0%) | 0 (0.0%) |
| Finance & Insurance | 0 (0.0%) | 5 (100.0%) |
| Real Estate, Rental & Leasing | 1 (100.0%) | 0 (0.0%) |
| Professional & Scientific | 0 (0.0%) | 0 (0.0%) |
| Enterprise Management | 0 (0.0%) | 0 (0.0%) |
| Administrative & Support | 0 (0.0%) | 0 (0.0%) |
| Educational Services | 1 (33.3%) | 2 (66.7%) |
| Health Care & Social Assistance | 1 (5.9%) | 16 (94.1%) |
| Arts, Entertainment & Recreation | 0 (0.0%) | 0 (0.0%) |
| Accommodation & Food Services | 4 (80.0%) | 1 (20.0%) |
| Public Administration | 0 (0.0%) | 0 (0.0%) |
| Total | 38 (57.6%) | 28 (42.4%) |
Education in Economy
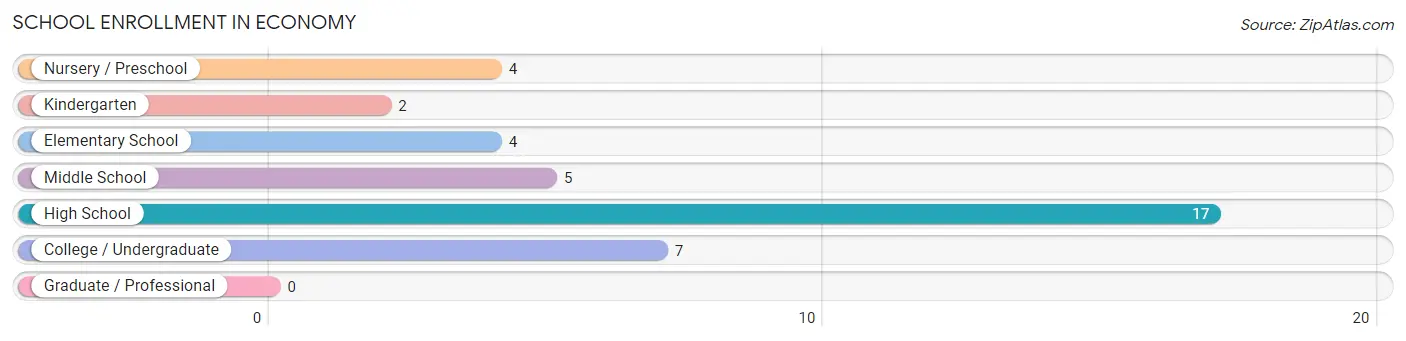
School Enrollment in Economy
The most common levels of schooling among the 39 students in Economy are high school (17 | 43.6%), college / undergraduate (7 | 17.9%), and middle school (5 | 12.8%).
| School Level | # Students | % Students |
| Nursery / Preschool | 4 | 10.3% |
| Kindergarten | 2 | 5.1% |
| Elementary School | 4 | 10.3% |
| Middle School | 5 | 12.8% |
| High School | 17 | 43.6% |
| College / Undergraduate | 7 | 17.9% |
| Graduate / Professional | 0 | 0.0% |
| Total | 39 | 100.0% |
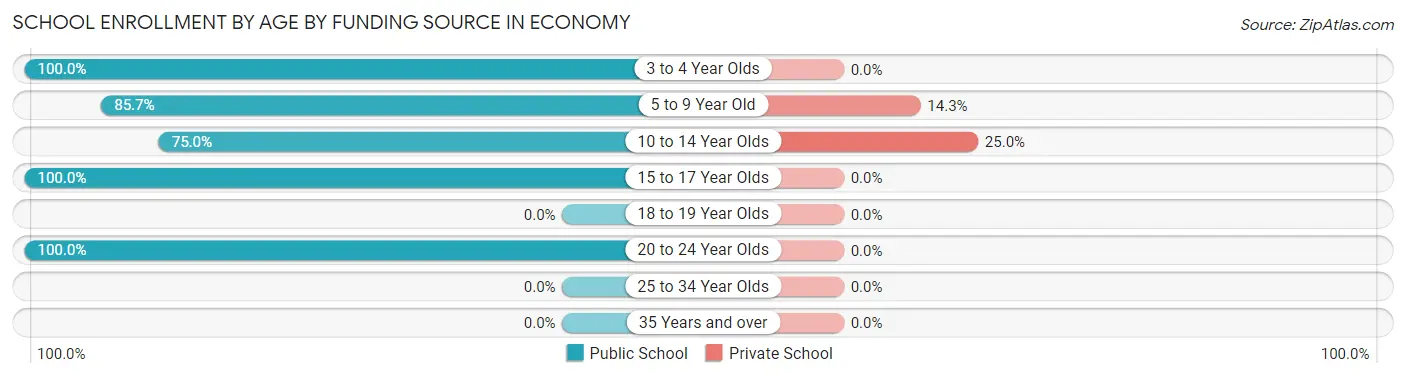
School Enrollment by Age by Funding Source in Economy
Out of a total of 39 students who are enrolled in schools in Economy, 3 (7.7%) attend a private institution, while the remaining 36 (92.3%) are enrolled in public schools. The age group of 10 to 14 year olds has the highest likelihood of being enrolled in private schools, with 2 (25.0% in the age bracket) enrolled. Conversely, the age group of 3 to 4 year olds has the lowest likelihood of being enrolled in a private school, with 2 (100.0% in the age bracket) attending a public institution.
| Age Bracket | Public School | Private School |
| 3 to 4 Year Olds | 2 (100.0%) | 0 (0.0%) |
| 5 to 9 Year Old | 6 (85.7%) | 1 (14.3%) |
| 10 to 14 Year Olds | 6 (75.0%) | 2 (25.0%) |
| 15 to 17 Year Olds | 15 (100.0%) | 0 (0.0%) |
| 18 to 19 Year Olds | 0 (0.0%) | 0 (0.0%) |
| 20 to 24 Year Olds | 7 (100.0%) | 0 (0.0%) |
| 25 to 34 Year Olds | 0 (0.0%) | 0 (0.0%) |
| 35 Years and over | 0 (0.0%) | 0 (0.0%) |
| Total | 36 (92.3%) | 3 (7.7%) |
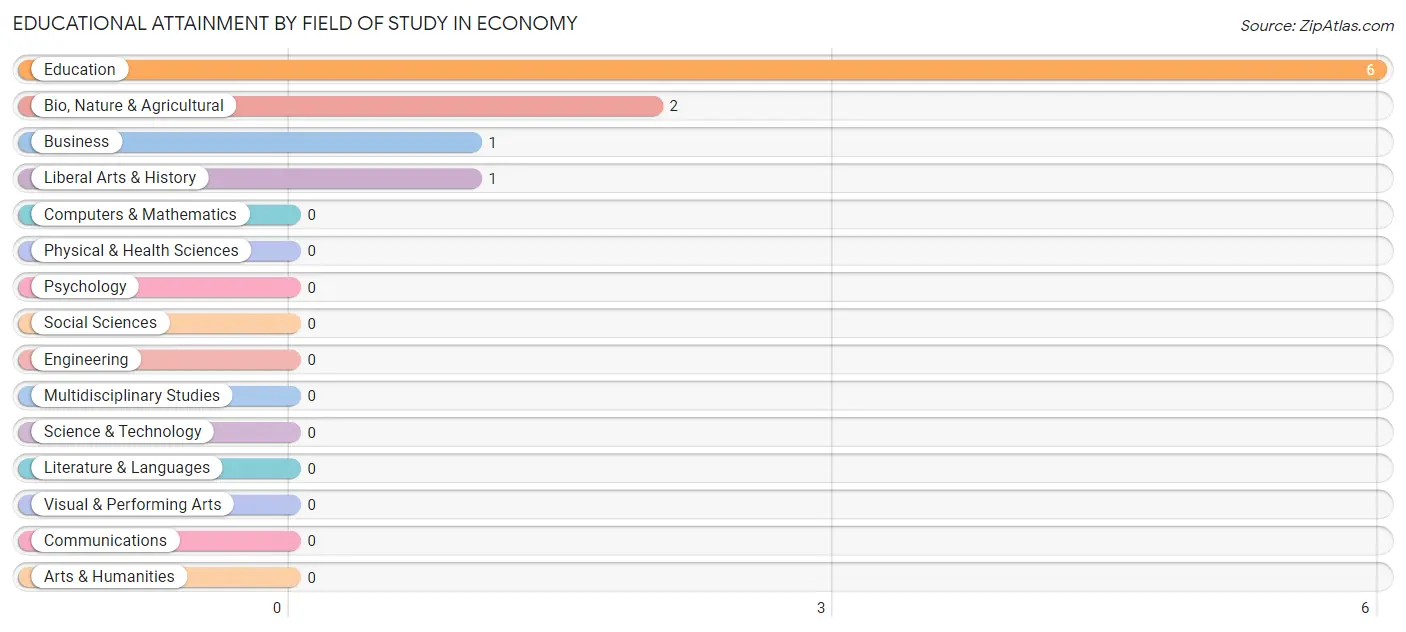
Educational Attainment by Field of Study in Economy
Education (6 | 60.0%), bio, nature & agricultural (2 | 20.0%), business (1 | 10.0%), and liberal arts & history (1 | 10.0%) are the most common fields of study among 10 individuals in Economy who have obtained a bachelor's degree or higher.
| Field of Study | # Graduates | % Graduates |
| Computers & Mathematics | 0 | 0.0% |
| Bio, Nature & Agricultural | 2 | 20.0% |
| Physical & Health Sciences | 0 | 0.0% |
| Psychology | 0 | 0.0% |
| Social Sciences | 0 | 0.0% |
| Engineering | 0 | 0.0% |
| Multidisciplinary Studies | 0 | 0.0% |
| Science & Technology | 0 | 0.0% |
| Business | 1 | 10.0% |
| Education | 6 | 60.0% |
| Literature & Languages | 0 | 0.0% |
| Liberal Arts & History | 1 | 10.0% |
| Visual & Performing Arts | 0 | 0.0% |
| Communications | 0 | 0.0% |
| Arts & Humanities | 0 | 0.0% |
| Total | 10 | 100.0% |
Transportation & Commute in Economy
Vehicle Availability by Sex in Economy
The most prevalent vehicle ownership categories in Economy are males with 3 vehicles (19, accounting for 50.0%) and females with 3 vehicles (8, making up 79.2%).
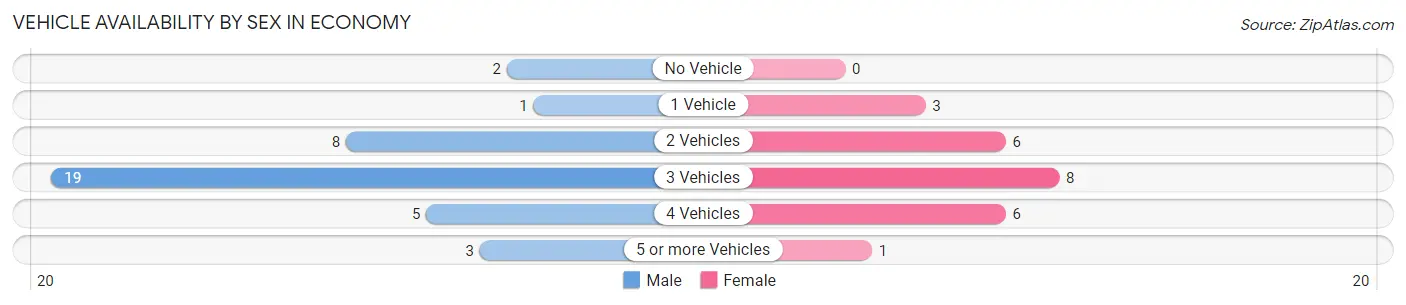
| Vehicles Available | Male | Female |
| No Vehicle | 2 (5.3%) | 0 (0.0%) |
| 1 Vehicle | 1 (2.6%) | 3 (12.5%) |
| 2 Vehicles | 8 (21.0%) | 6 (25.0%) |
| 3 Vehicles | 19 (50.0%) | 8 (33.3%) |
| 4 Vehicles | 5 (13.2%) | 6 (25.0%) |
| 5 or more Vehicles | 3 (7.9%) | 1 (4.2%) |
| Total | 38 (100.0%) | 24 (100.0%) |
Commute Time in Economy
The most frequently occuring commute durations in Economy are 25 to 29 minutes (16 commuters, 26.2%), 20 to 24 minutes (14 commuters, 23.0%), and 30 to 34 minutes (8 commuters, 13.1%).
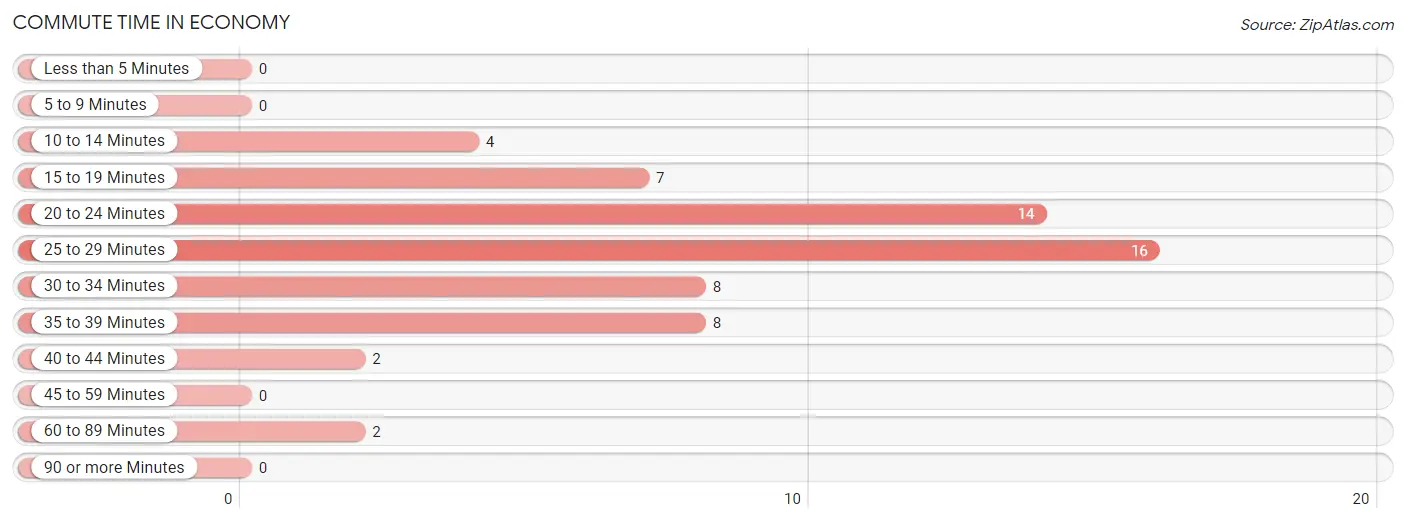
| Commute Time | # Commuters | % Commuters |
| Less than 5 Minutes | 0 | 0.0% |
| 5 to 9 Minutes | 0 | 0.0% |
| 10 to 14 Minutes | 4 | 6.6% |
| 15 to 19 Minutes | 7 | 11.5% |
| 20 to 24 Minutes | 14 | 23.0% |
| 25 to 29 Minutes | 16 | 26.2% |
| 30 to 34 Minutes | 8 | 13.1% |
| 35 to 39 Minutes | 8 | 13.1% |
| 40 to 44 Minutes | 2 | 3.3% |
| 45 to 59 Minutes | 0 | 0.0% |
| 60 to 89 Minutes | 2 | 3.3% |
| 90 or more Minutes | 0 | 0.0% |
Commute Time by Sex in Economy
The most common commute times in Economy are 20 to 24 minutes (8 commuters, 21.0%) for males and 25 to 29 minutes (10 commuters, 43.5%) for females.
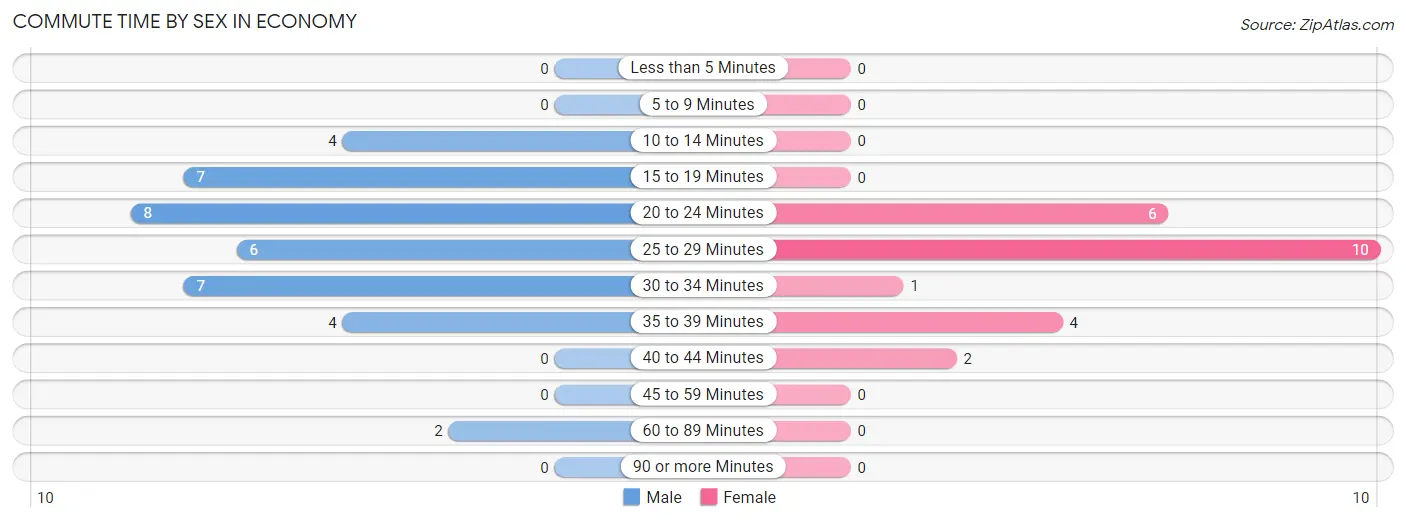
| Commute Time | Male | Female |
| Less than 5 Minutes | 0 (0.0%) | 0 (0.0%) |
| 5 to 9 Minutes | 0 (0.0%) | 0 (0.0%) |
| 10 to 14 Minutes | 4 (10.5%) | 0 (0.0%) |
| 15 to 19 Minutes | 7 (18.4%) | 0 (0.0%) |
| 20 to 24 Minutes | 8 (21.0%) | 6 (26.1%) |
| 25 to 29 Minutes | 6 (15.8%) | 10 (43.5%) |
| 30 to 34 Minutes | 7 (18.4%) | 1 (4.3%) |
| 35 to 39 Minutes | 4 (10.5%) | 4 (17.4%) |
| 40 to 44 Minutes | 0 (0.0%) | 2 (8.7%) |
| 45 to 59 Minutes | 0 (0.0%) | 0 (0.0%) |
| 60 to 89 Minutes | 2 (5.3%) | 0 (0.0%) |
| 90 or more Minutes | 0 (0.0%) | 0 (0.0%) |
Time of Departure to Work by Sex in Economy
The most frequent times of departure to work in Economy are 6:30 AM to 6:59 AM (12, 31.6%) for males and 7:30 AM to 7:59 AM (5, 21.7%) for females.
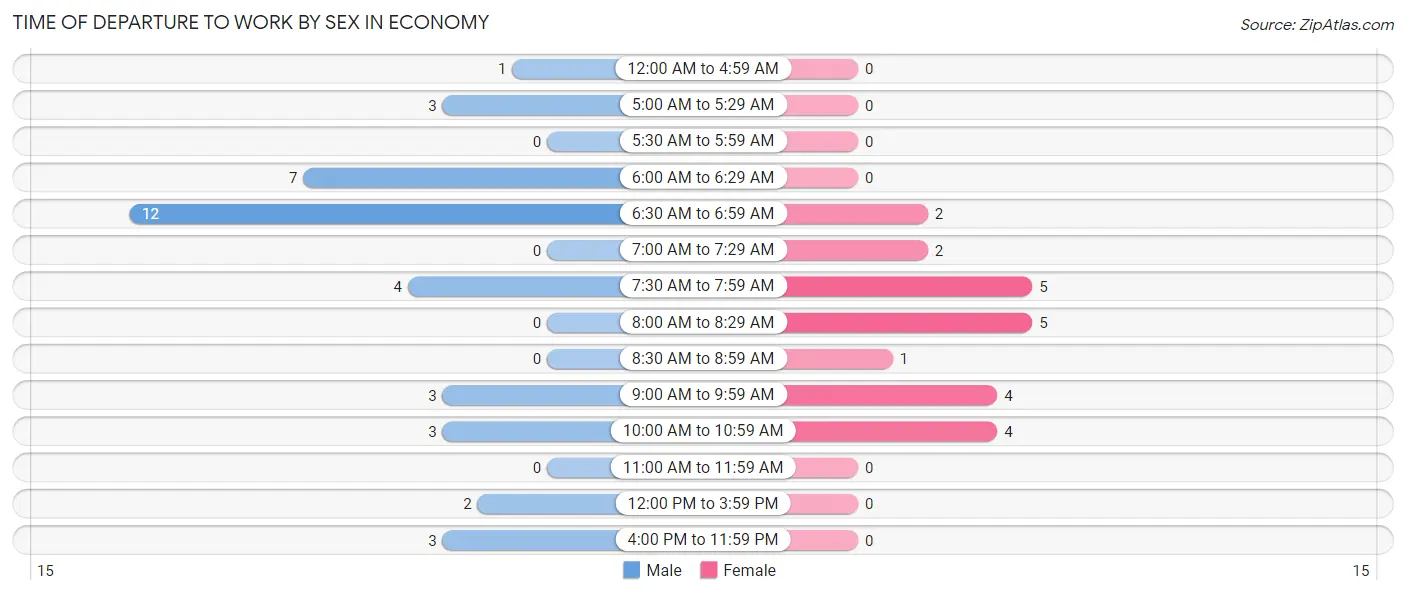
| Time of Departure | Male | Female |
| 12:00 AM to 4:59 AM | 1 (2.6%) | 0 (0.0%) |
| 5:00 AM to 5:29 AM | 3 (7.9%) | 0 (0.0%) |
| 5:30 AM to 5:59 AM | 0 (0.0%) | 0 (0.0%) |
| 6:00 AM to 6:29 AM | 7 (18.4%) | 0 (0.0%) |
| 6:30 AM to 6:59 AM | 12 (31.6%) | 2 (8.7%) |
| 7:00 AM to 7:29 AM | 0 (0.0%) | 2 (8.7%) |
| 7:30 AM to 7:59 AM | 4 (10.5%) | 5 (21.7%) |
| 8:00 AM to 8:29 AM | 0 (0.0%) | 5 (21.7%) |
| 8:30 AM to 8:59 AM | 0 (0.0%) | 1 (4.3%) |
| 9:00 AM to 9:59 AM | 3 (7.9%) | 4 (17.4%) |
| 10:00 AM to 10:59 AM | 3 (7.9%) | 4 (17.4%) |
| 11:00 AM to 11:59 AM | 0 (0.0%) | 0 (0.0%) |
| 12:00 PM to 3:59 PM | 2 (5.3%) | 0 (0.0%) |
| 4:00 PM to 11:59 PM | 3 (7.9%) | 0 (0.0%) |
| Total | 38 (100.0%) | 23 (100.0%) |
Housing Occupancy in Economy
Occupancy by Ownership in Economy
Of the total 54 dwellings in Economy, owner-occupied units account for 40 (74.1%), while renter-occupied units make up 14 (25.9%).
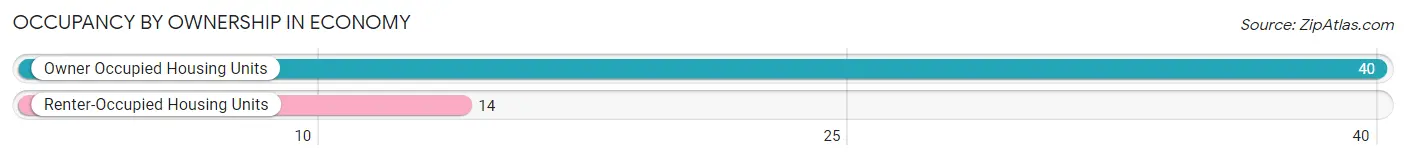
| Occupancy | # Housing Units | % Housing Units |
| Owner Occupied Housing Units | 40 | 74.1% |
| Renter-Occupied Housing Units | 14 | 25.9% |
| Total Occupied Housing Units | 54 | 100.0% |
Occupancy by Household Size in Economy
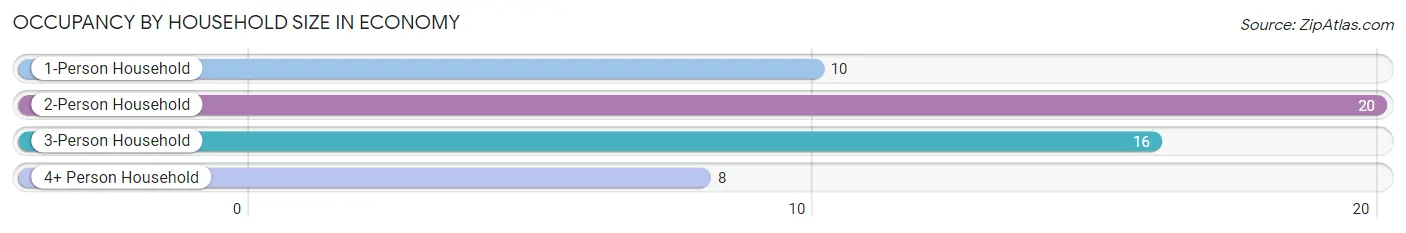
| Household Size | # Housing Units | % Housing Units |
| 1-Person Household | 10 | 18.5% |
| 2-Person Household | 20 | 37.0% |
| 3-Person Household | 16 | 29.6% |
| 4+ Person Household | 8 | 14.8% |
| Total Housing Units | 54 | 100.0% |
Occupancy by Ownership by Household Size in Economy
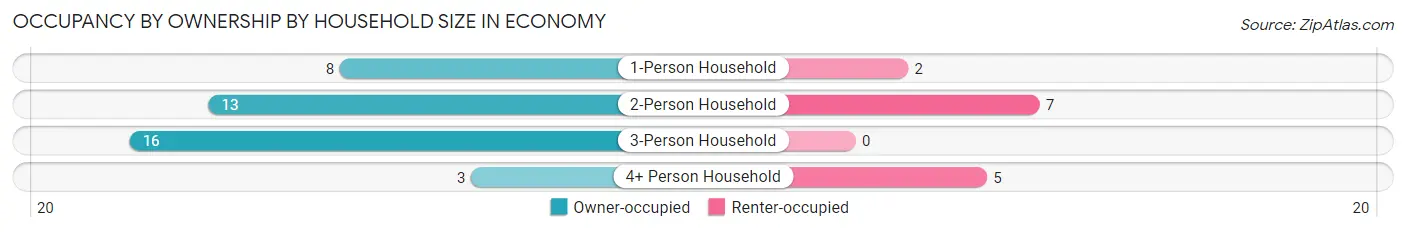
| Household Size | Owner-occupied | Renter-occupied |
| 1-Person Household | 8 (80.0%) | 2 (20.0%) |
| 2-Person Household | 13 (65.0%) | 7 (35.0%) |
| 3-Person Household | 16 (100.0%) | 0 (0.0%) |
| 4+ Person Household | 3 (37.5%) | 5 (62.5%) |
| Total Housing Units | 40 (74.1%) | 14 (25.9%) |
Occupancy by Educational Attainment in Economy
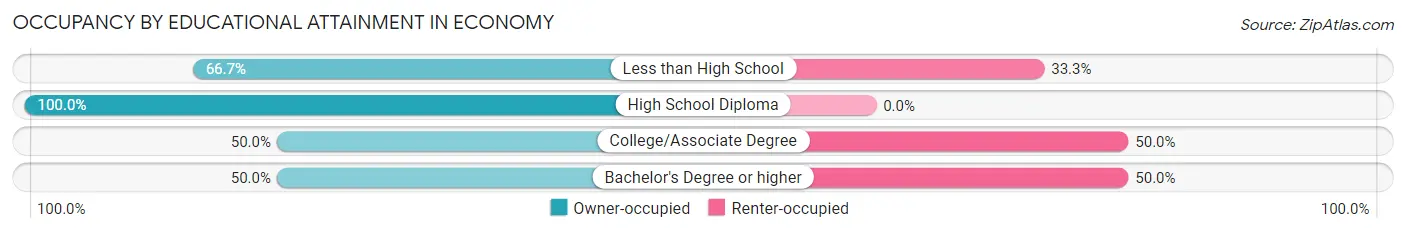
| Household Size | Owner-occupied | Renter-occupied |
| Less than High School | 4 (66.7%) | 2 (33.3%) |
| High School Diploma | 24 (100.0%) | 0 (0.0%) |
| College/Associate Degree | 7 (50.0%) | 7 (50.0%) |
| Bachelor's Degree or higher | 5 (50.0%) | 5 (50.0%) |
Occupancy by Age of Householder in Economy
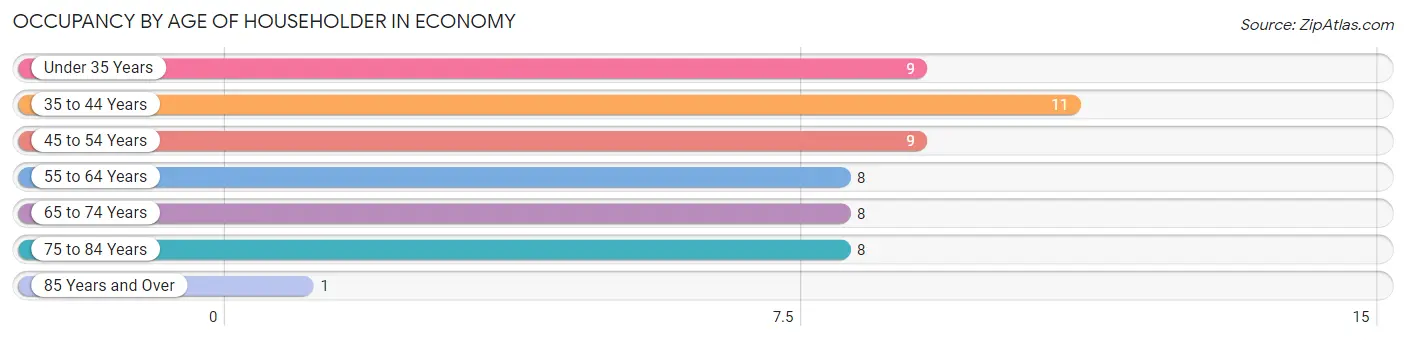
| Age Bracket | # Households | % Households |
| Under 35 Years | 9 | 16.7% |
| 35 to 44 Years | 11 | 20.4% |
| 45 to 54 Years | 9 | 16.7% |
| 55 to 64 Years | 8 | 14.8% |
| 65 to 74 Years | 8 | 14.8% |
| 75 to 84 Years | 8 | 14.8% |
| 85 Years and Over | 1 | 1.8% |
| Total | 54 | 100.0% |
Housing Finances in Economy
Median Income by Occupancy in Economy
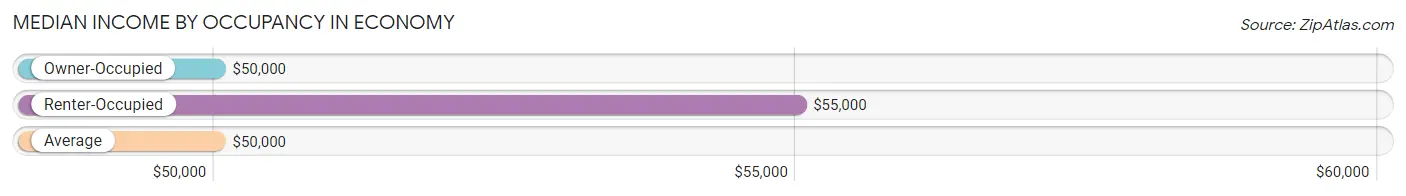
| Occupancy Type | # Households | Median Income |
| Owner-Occupied | 40 (74.1%) | $50,000 |
| Renter-Occupied | 14 (25.9%) | $55,000 |
| Average | 54 (100.0%) | $50,000 |
Occupancy by Householder Income Bracket in Economy
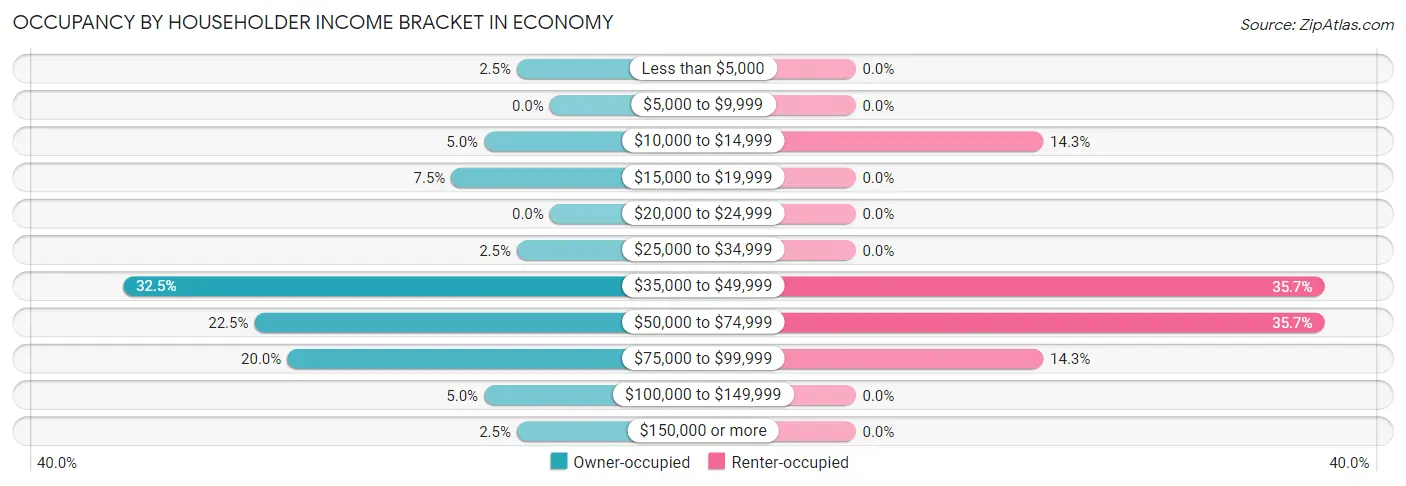
| Income Bracket | Owner-occupied | Renter-occupied |
| Less than $5,000 | 1 (2.5%) | 0 (0.0%) |
| $5,000 to $9,999 | 0 (0.0%) | 0 (0.0%) |
| $10,000 to $14,999 | 2 (5.0%) | 2 (14.3%) |
| $15,000 to $19,999 | 3 (7.5%) | 0 (0.0%) |
| $20,000 to $24,999 | 0 (0.0%) | 0 (0.0%) |
| $25,000 to $34,999 | 1 (2.5%) | 0 (0.0%) |
| $35,000 to $49,999 | 13 (32.5%) | 5 (35.7%) |
| $50,000 to $74,999 | 9 (22.5%) | 5 (35.7%) |
| $75,000 to $99,999 | 8 (20.0%) | 2 (14.3%) |
| $100,000 to $149,999 | 2 (5.0%) | 0 (0.0%) |
| $150,000 or more | 1 (2.5%) | 0 (0.0%) |
| Total | 40 (100.0%) | 14 (100.0%) |
Monthly Housing Cost Tiers in Economy
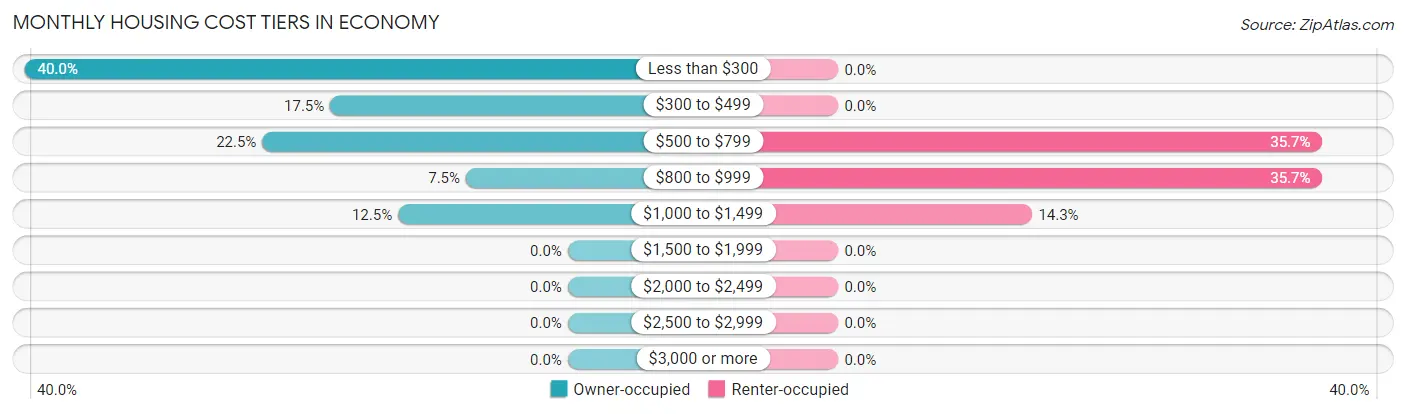
| Monthly Cost | Owner-occupied | Renter-occupied |
| Less than $300 | 16 (40.0%) | 0 (0.0%) |
| $300 to $499 | 7 (17.5%) | 0 (0.0%) |
| $500 to $799 | 9 (22.5%) | 5 (35.7%) |
| $800 to $999 | 3 (7.5%) | 5 (35.7%) |
| $1,000 to $1,499 | 5 (12.5%) | 2 (14.3%) |
| $1,500 to $1,999 | 0 (0.0%) | 0 (0.0%) |
| $2,000 to $2,499 | 0 (0.0%) | 0 (0.0%) |
| $2,500 to $2,999 | 0 (0.0%) | 0 (0.0%) |
| $3,000 or more | 0 (0.0%) | 0 (0.0%) |
| Total | 40 (100.0%) | 14 (100.0%) |
Physical Housing Characteristics in Economy
Housing Structures in Economy
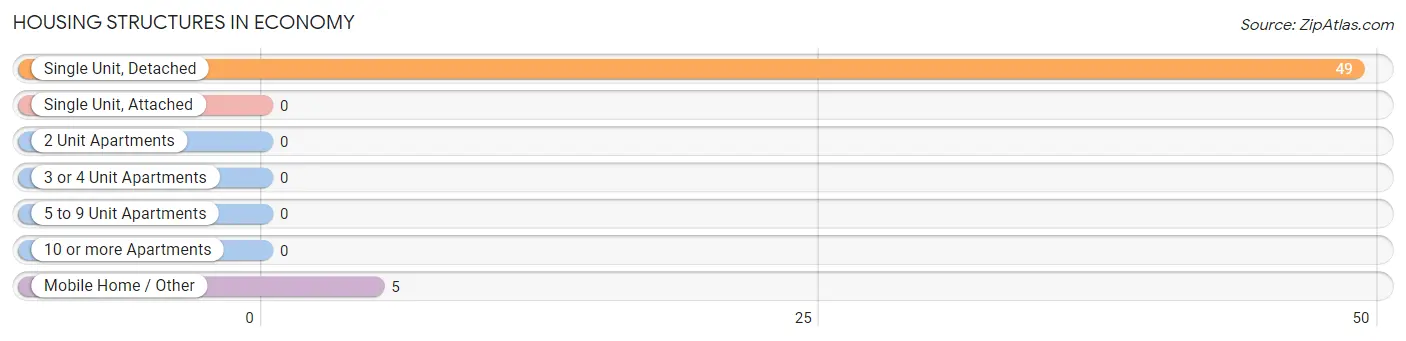
| Structure Type | # Housing Units | % Housing Units |
| Single Unit, Detached | 49 | 90.7% |
| Single Unit, Attached | 0 | 0.0% |
| 2 Unit Apartments | 0 | 0.0% |
| 3 or 4 Unit Apartments | 0 | 0.0% |
| 5 to 9 Unit Apartments | 0 | 0.0% |
| 10 or more Apartments | 0 | 0.0% |
| Mobile Home / Other | 5 | 9.3% |
| Total | 54 | 100.0% |
Housing Structures by Occupancy in Economy
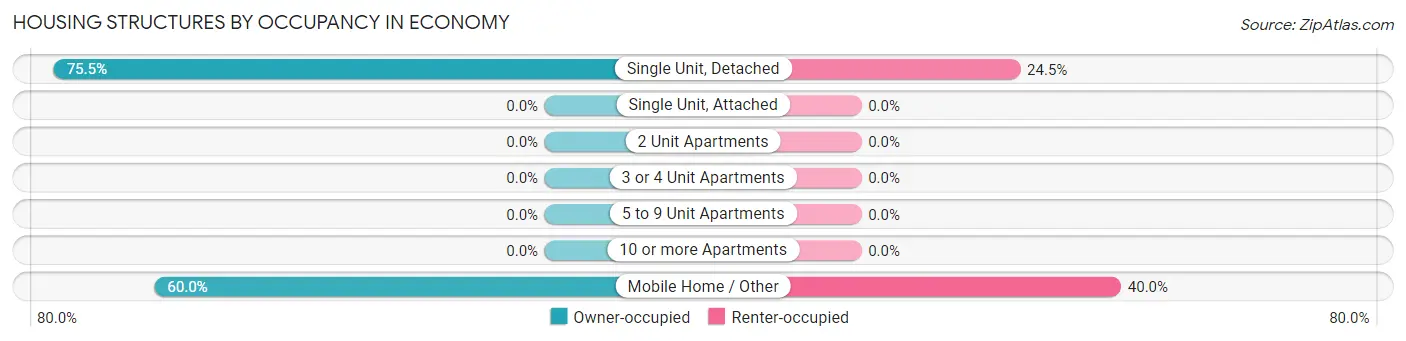
| Structure Type | Owner-occupied | Renter-occupied |
| Single Unit, Detached | 37 (75.5%) | 12 (24.5%) |
| Single Unit, Attached | 0 (0.0%) | 0 (0.0%) |
| 2 Unit Apartments | 0 (0.0%) | 0 (0.0%) |
| 3 or 4 Unit Apartments | 0 (0.0%) | 0 (0.0%) |
| 5 to 9 Unit Apartments | 0 (0.0%) | 0 (0.0%) |
| 10 or more Apartments | 0 (0.0%) | 0 (0.0%) |
| Mobile Home / Other | 3 (60.0%) | 2 (40.0%) |
| Total | 40 (74.1%) | 14 (25.9%) |
Housing Structures by Number of Rooms in Economy
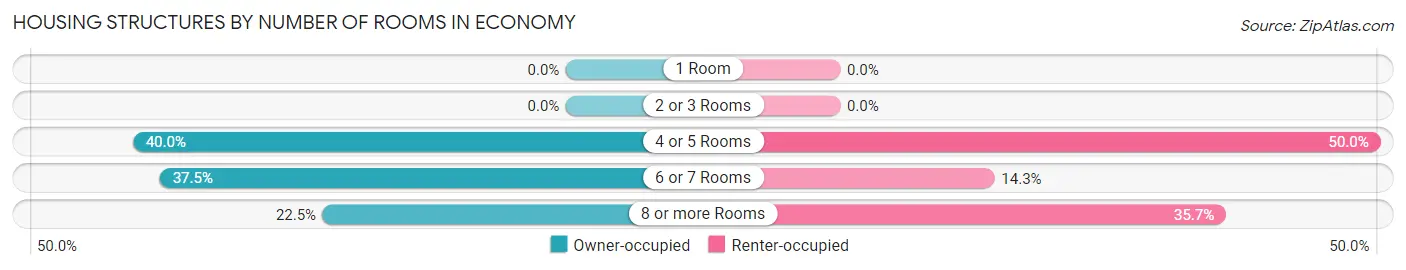
| Number of Rooms | Owner-occupied | Renter-occupied |
| 1 Room | 0 (0.0%) | 0 (0.0%) |
| 2 or 3 Rooms | 0 (0.0%) | 0 (0.0%) |
| 4 or 5 Rooms | 16 (40.0%) | 7 (50.0%) |
| 6 or 7 Rooms | 15 (37.5%) | 2 (14.3%) |
| 8 or more Rooms | 9 (22.5%) | 5 (35.7%) |
| Total | 40 (100.0%) | 14 (100.0%) |
Housing Structure by Heating Type in Economy
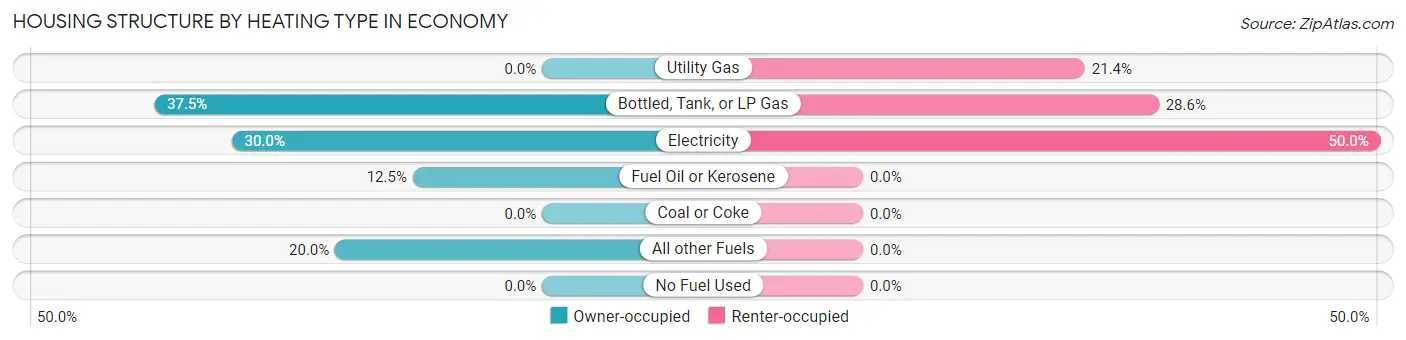
| Heating Type | Owner-occupied | Renter-occupied |
| Utility Gas | 0 (0.0%) | 3 (21.4%) |
| Bottled, Tank, or LP Gas | 15 (37.5%) | 4 (28.6%) |
| Electricity | 12 (30.0%) | 7 (50.0%) |
| Fuel Oil or Kerosene | 5 (12.5%) | 0 (0.0%) |
| Coal or Coke | 0 (0.0%) | 0 (0.0%) |
| All other Fuels | 8 (20.0%) | 0 (0.0%) |
| No Fuel Used | 0 (0.0%) | 0 (0.0%) |
| Total | 40 (100.0%) | 14 (100.0%) |
Household Vehicle Usage in Economy
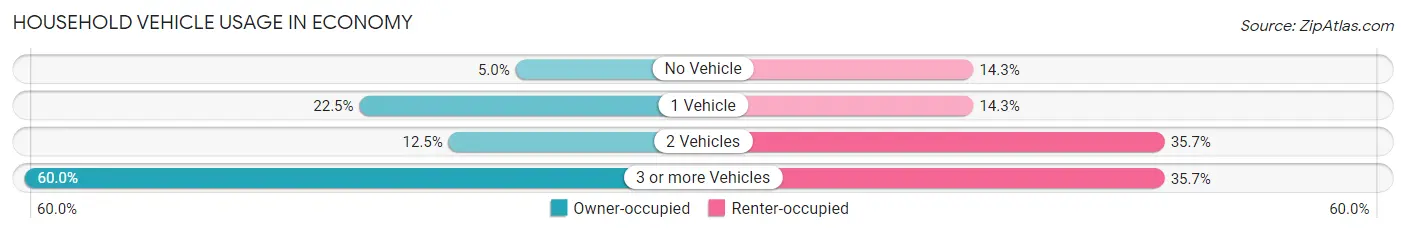
| Vehicles per Household | Owner-occupied | Renter-occupied |
| No Vehicle | 2 (5.0%) | 2 (14.3%) |
| 1 Vehicle | 9 (22.5%) | 2 (14.3%) |
| 2 Vehicles | 5 (12.5%) | 5 (35.7%) |
| 3 or more Vehicles | 24 (60.0%) | 5 (35.7%) |
| Total | 40 (100.0%) | 14 (100.0%) |
Real Estate & Mortgages in Economy
Real Estate and Mortgage Overview in Economy
| Characteristic | Without Mortgage | With Mortgage |
| Housing Units | 26 | 14 |
| Median Property Value | $55,000 | $75,000 |
| Median Household Income | $41,250 | $0 |
| Monthly Housing Costs | $275 | $0 |
| Real Estate Taxes | $514 | $3 |
Property Value by Mortgage Status in Economy
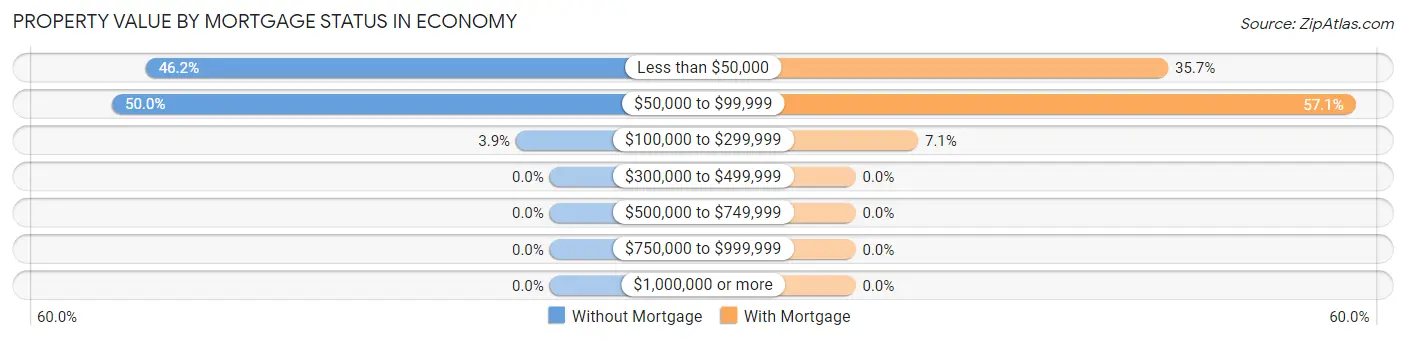
| Property Value | Without Mortgage | With Mortgage |
| Less than $50,000 | 12 (46.2%) | 5 (35.7%) |
| $50,000 to $99,999 | 13 (50.0%) | 8 (57.1%) |
| $100,000 to $299,999 | 1 (3.8%) | 1 (7.1%) |
| $300,000 to $499,999 | 0 (0.0%) | 0 (0.0%) |
| $500,000 to $749,999 | 0 (0.0%) | 0 (0.0%) |
| $750,000 to $999,999 | 0 (0.0%) | 0 (0.0%) |
| $1,000,000 or more | 0 (0.0%) | 0 (0.0%) |
| Total | 26 (100.0%) | 14 (100.0%) |
Household Income by Mortgage Status in Economy
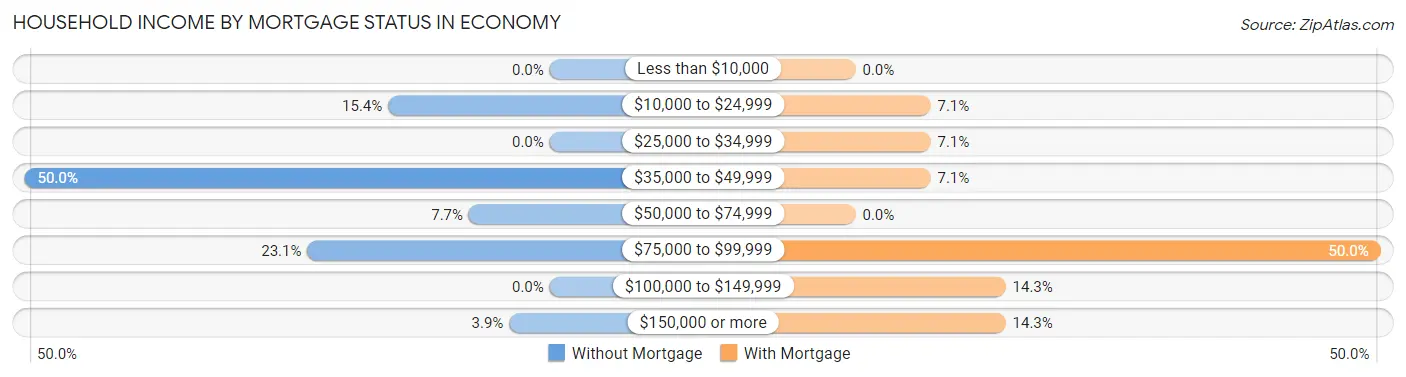
| Household Income | Without Mortgage | With Mortgage |
| Less than $10,000 | 0 (0.0%) | 0 (0.0%) |
| $10,000 to $24,999 | 4 (15.4%) | 1 (7.1%) |
| $25,000 to $34,999 | 0 (0.0%) | 1 (7.1%) |
| $35,000 to $49,999 | 13 (50.0%) | 1 (7.1%) |
| $50,000 to $74,999 | 2 (7.7%) | 0 (0.0%) |
| $75,000 to $99,999 | 6 (23.1%) | 7 (50.0%) |
| $100,000 to $149,999 | 0 (0.0%) | 2 (14.3%) |
| $150,000 or more | 1 (3.8%) | 2 (14.3%) |
| Total | 26 (100.0%) | 14 (100.0%) |
Property Value to Household Income Ratio in Economy
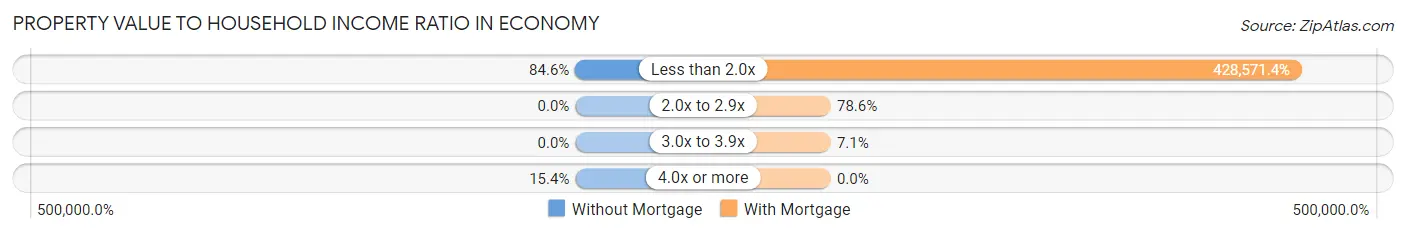
| Value-to-Income Ratio | Without Mortgage | With Mortgage |
| Less than 2.0x | 22 (84.6%) | 60,000 (428,571.4%) |
| 2.0x to 2.9x | 0 (0.0%) | 11 (78.6%) |
| 3.0x to 3.9x | 0 (0.0%) | 1 (7.1%) |
| 4.0x or more | 4 (15.4%) | 0 (0.0%) |
| Total | 26 (100.0%) | 14 (100.0%) |
Real Estate Taxes by Mortgage Status in Economy
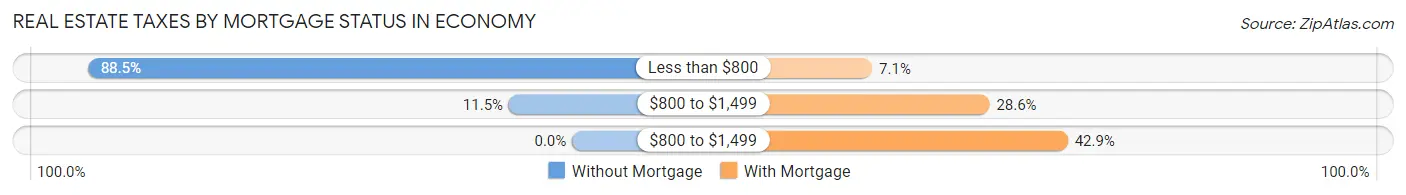
| Property Taxes | Without Mortgage | With Mortgage |
| Less than $800 | 23 (88.5%) | 1 (7.1%) |
| $800 to $1,499 | 3 (11.5%) | 4 (28.6%) |
| $800 to $1,499 | 0 (0.0%) | 6 (42.9%) |
| Total | 26 (100.0%) | 14 (100.0%) |
Health & Disability in Economy
Health Insurance Coverage by Age in Economy
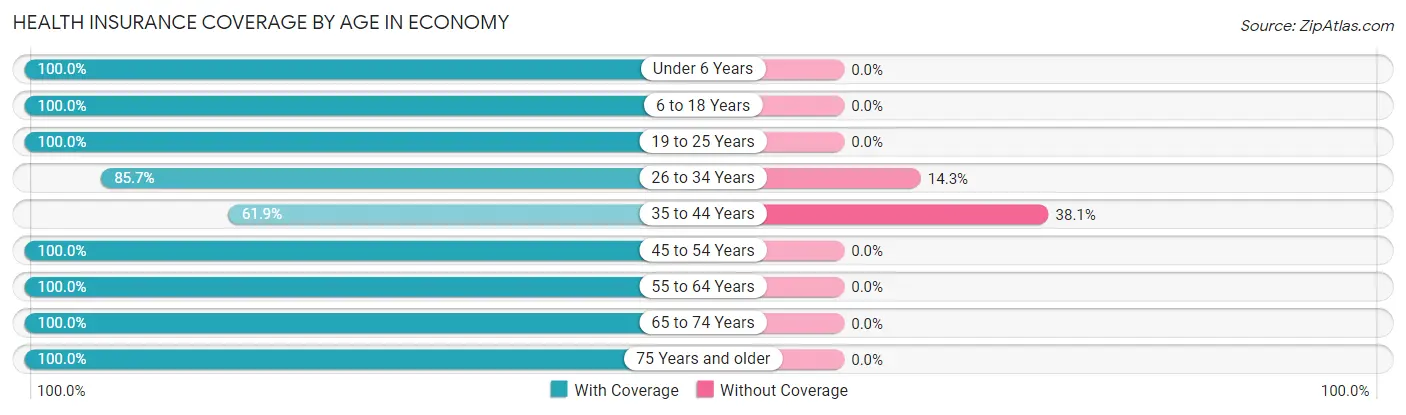
| Age Bracket | With Coverage | Without Coverage |
| Under 6 Years | 6 (100.0%) | 0 (0.0%) |
| 6 to 18 Years | 26 (100.0%) | 0 (0.0%) |
| 19 to 25 Years | 12 (100.0%) | 0 (0.0%) |
| 26 to 34 Years | 12 (85.7%) | 2 (14.3%) |
| 35 to 44 Years | 13 (61.9%) | 8 (38.1%) |
| 45 to 54 Years | 16 (100.0%) | 0 (0.0%) |
| 55 to 64 Years | 8 (100.0%) | 0 (0.0%) |
| 65 to 74 Years | 16 (100.0%) | 0 (0.0%) |
| 75 Years and older | 12 (100.0%) | 0 (0.0%) |
| Total | 121 (92.4%) | 10 (7.6%) |
Health Insurance Coverage by Citizenship Status in Economy
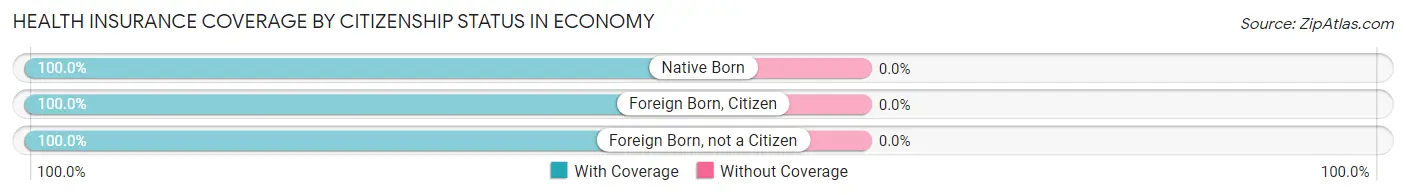
| Citizenship Status | With Coverage | Without Coverage |
| Native Born | 6 (100.0%) | 0 (0.0%) |
| Foreign Born, Citizen | 26 (100.0%) | 0 (0.0%) |
| Foreign Born, not a Citizen | 12 (100.0%) | 0 (0.0%) |
Health Insurance Coverage by Household Income in Economy
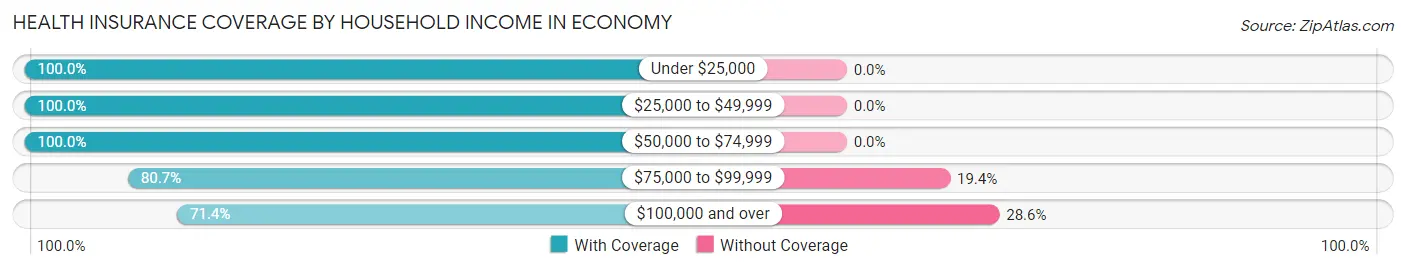
| Household Income | With Coverage | Without Coverage |
| Under $25,000 | 14 (100.0%) | 0 (0.0%) |
| $25,000 to $49,999 | 41 (100.0%) | 0 (0.0%) |
| $50,000 to $74,999 | 31 (100.0%) | 0 (0.0%) |
| $75,000 to $99,999 | 25 (80.6%) | 6 (19.4%) |
| $100,000 and over | 10 (71.4%) | 4 (28.6%) |
Public vs Private Health Insurance Coverage by Age in Economy
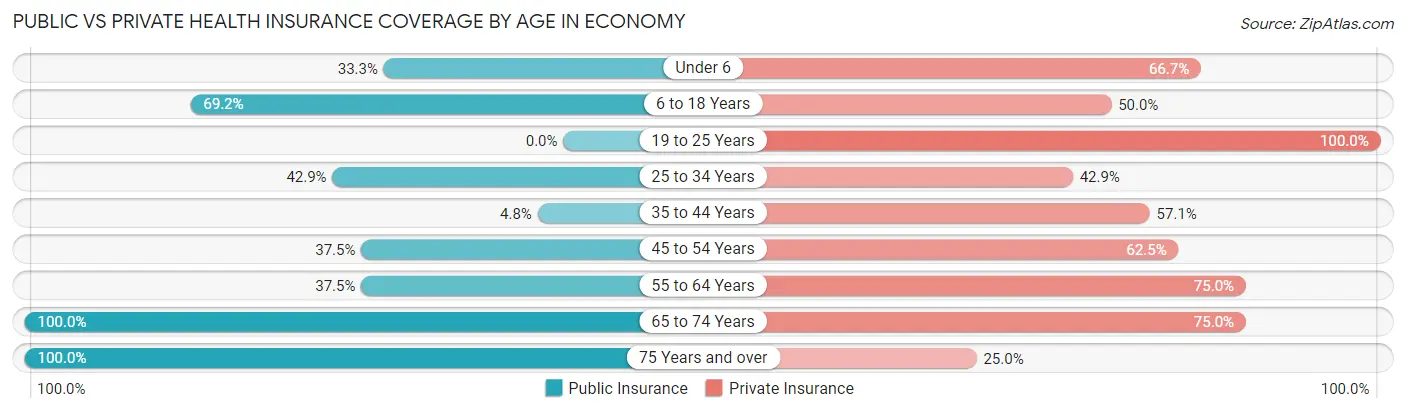
| Age Bracket | Public Insurance | Private Insurance |
| Under 6 | 2 (33.3%) | 4 (66.7%) |
| 6 to 18 Years | 18 (69.2%) | 13 (50.0%) |
| 19 to 25 Years | 0 (0.0%) | 12 (100.0%) |
| 25 to 34 Years | 6 (42.9%) | 6 (42.9%) |
| 35 to 44 Years | 1 (4.8%) | 12 (57.1%) |
| 45 to 54 Years | 6 (37.5%) | 10 (62.5%) |
| 55 to 64 Years | 3 (37.5%) | 6 (75.0%) |
| 65 to 74 Years | 16 (100.0%) | 12 (75.0%) |
| 75 Years and over | 12 (100.0%) | 3 (25.0%) |
| Total | 64 (48.8%) | 78 (59.5%) |
Disability Status by Sex by Age in Economy
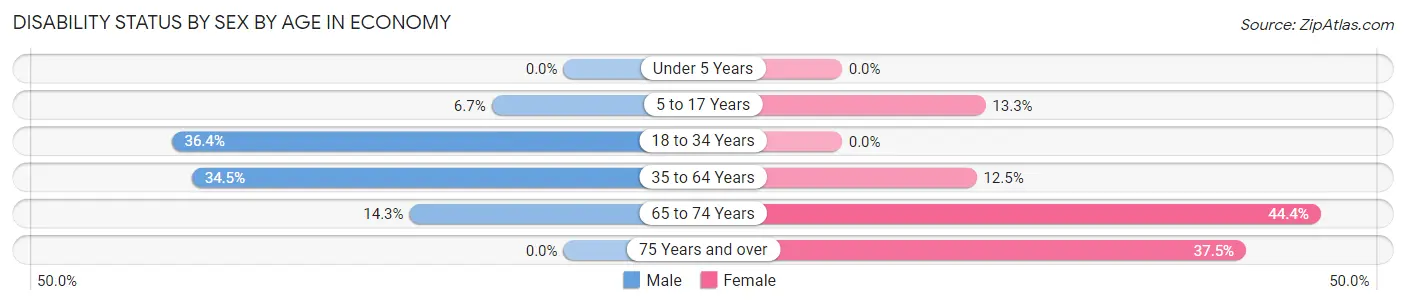
| Age Bracket | Male | Female |
| Under 5 Years | 0 (0.0%) | 0 (0.0%) |
| 5 to 17 Years | 1 (6.7%) | 2 (13.3%) |
| 18 to 34 Years | 4 (36.4%) | 0 (0.0%) |
| 35 to 64 Years | 10 (34.5%) | 2 (12.5%) |
| 65 to 74 Years | 1 (14.3%) | 4 (44.4%) |
| 75 Years and over | 0 (0.0%) | 3 (37.5%) |
Disability Class by Sex by Age in Economy
Disability Class: Hearing Difficulty

| Age Bracket | Male | Female |
| Under 5 Years | 0 (0.0%) | 0 (0.0%) |
| 5 to 17 Years | 0 (0.0%) | 0 (0.0%) |
| 18 to 34 Years | 0 (0.0%) | 0 (0.0%) |
| 35 to 64 Years | 1 (3.5%) | 2 (12.5%) |
| 65 to 74 Years | 1 (14.3%) | 0 (0.0%) |
| 75 Years and over | 0 (0.0%) | 3 (37.5%) |
Disability Class: Vision Difficulty
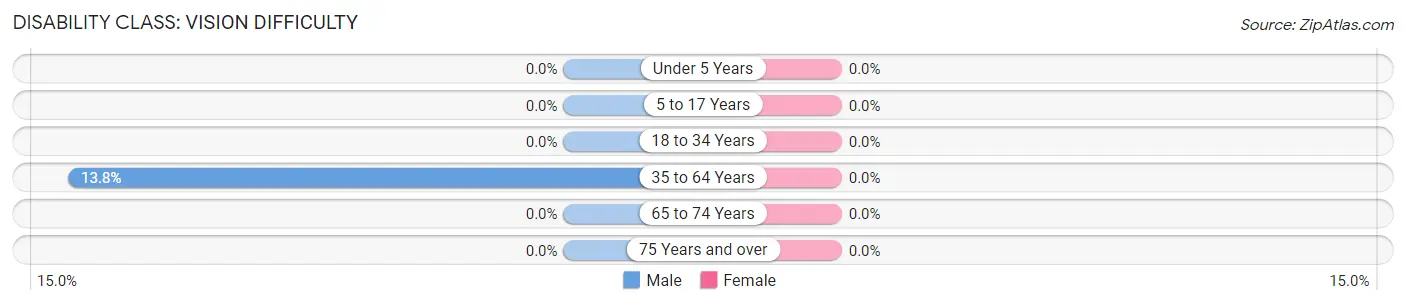
| Age Bracket | Male | Female |
| Under 5 Years | 0 (0.0%) | 0 (0.0%) |
| 5 to 17 Years | 0 (0.0%) | 0 (0.0%) |
| 18 to 34 Years | 0 (0.0%) | 0 (0.0%) |
| 35 to 64 Years | 4 (13.8%) | 0 (0.0%) |
| 65 to 74 Years | 0 (0.0%) | 0 (0.0%) |
| 75 Years and over | 0 (0.0%) | 0 (0.0%) |
Disability Class: Cognitive Difficulty
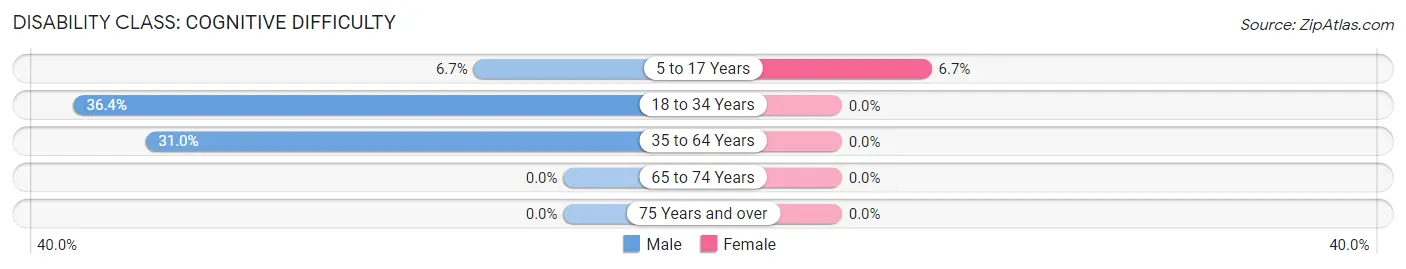
| Age Bracket | Male | Female |
| 5 to 17 Years | 1 (6.7%) | 1 (6.7%) |
| 18 to 34 Years | 4 (36.4%) | 0 (0.0%) |
| 35 to 64 Years | 9 (31.0%) | 0 (0.0%) |
| 65 to 74 Years | 0 (0.0%) | 0 (0.0%) |
| 75 Years and over | 0 (0.0%) | 0 (0.0%) |
Disability Class: Ambulatory Difficulty
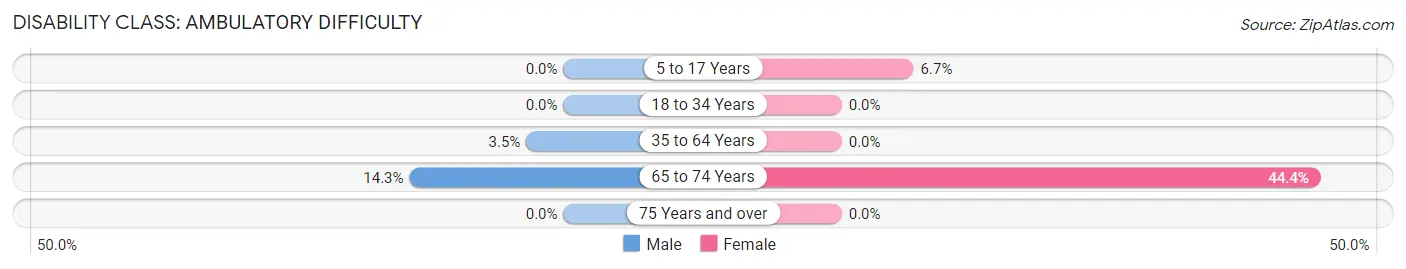
| Age Bracket | Male | Female |
| 5 to 17 Years | 0 (0.0%) | 1 (6.7%) |
| 18 to 34 Years | 0 (0.0%) | 0 (0.0%) |
| 35 to 64 Years | 1 (3.5%) | 0 (0.0%) |
| 65 to 74 Years | 1 (14.3%) | 4 (44.4%) |
| 75 Years and over | 0 (0.0%) | 0 (0.0%) |
Disability Class: Self-Care Difficulty
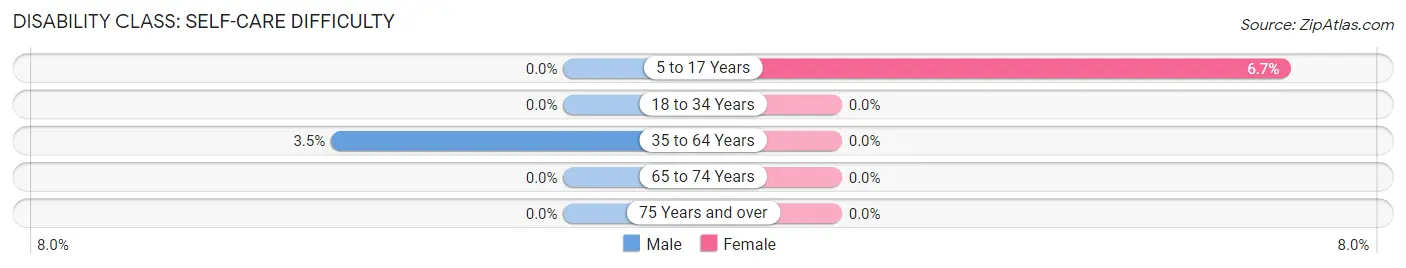
| Age Bracket | Male | Female |
| 5 to 17 Years | 0 (0.0%) | 1 (6.7%) |
| 18 to 34 Years | 0 (0.0%) | 0 (0.0%) |
| 35 to 64 Years | 1 (3.5%) | 0 (0.0%) |
| 65 to 74 Years | 0 (0.0%) | 0 (0.0%) |
| 75 Years and over | 0 (0.0%) | 0 (0.0%) |
Technology Access in Economy
Computing Device Access in Economy
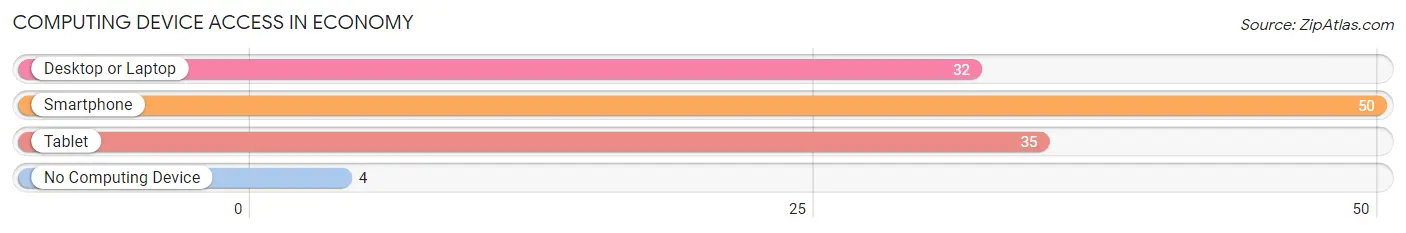
| Device Type | # Households | % Households |
| Desktop or Laptop | 32 | 59.3% |
| Smartphone | 50 | 92.6% |
| Tablet | 35 | 64.8% |
| No Computing Device | 4 | 7.4% |
| Total | 54 | 100.0% |
Internet Access in Economy
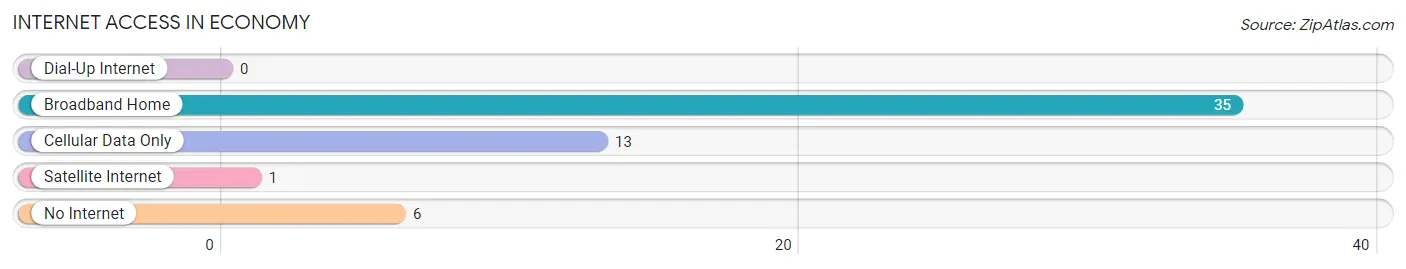
| Internet Type | # Households | % Households |
| Dial-Up Internet | 0 | 0.0% |
| Broadband Home | 35 | 64.8% |
| Cellular Data Only | 13 | 24.1% |
| Satellite Internet | 1 | 1.8% |
| No Internet | 6 | 11.1% |
| Total | 54 | 100.0% |
Economy Summary
History
The history of the Indian economy dates back to the ancient times when the country was known as the ‘Golden Bird’. India was one of the most prosperous countries in the world and was known for its rich culture and traditions. The economy of India was mainly based on agriculture and trade. The country was known for its spices, textiles, and handicrafts.
The Mughal Empire was the most powerful empire in India during the 16th and 17th centuries. The Mughals brought in a number of reforms in the economy, which included the introduction of a uniform currency, the rupee. The Mughals also encouraged the development of trade and commerce.
The British East India Company arrived in India in the 18th century and established its rule over the country. The British introduced a number of reforms in the Indian economy, which included the introduction of the zamindari system, the establishment of the railways, and the introduction of the telegraph. The British also encouraged the development of industries such as cotton and jute.
The Indian economy underwent a major transformation after independence in 1947. The government introduced a number of economic reforms, which included the nationalization of banks, the establishment of public sector enterprises, and the introduction of the Five-Year Plans. The government also encouraged the development of the private sector.
Geography
India is located in South Asia and is the seventh-largest country in the world. It is bordered by Pakistan to the west, China, Nepal, and Bhutan to the north, and Bangladesh and Myanmar to the east. India is divided into 28 states and seven union territories.
The geography of India is varied and includes the Himalayan Mountains in the north, the Thar Desert in the west, and the Deccan Plateau in the south. India has a long coastline and is home to a number of rivers, including the Ganges, the Brahmaputra, and the Yamuna.
Economy
The Indian economy is the fifth-largest in the world and is one of the fastest-growing economies. The economy is mainly driven by the services sector, which accounts for more than 60% of the GDP. The manufacturing sector is the second-largest contributor to the GDP, followed by agriculture.
The Indian economy is largely dependent on agriculture, which accounts for around 17% of the GDP. The main crops grown in India are rice, wheat, pulses, sugarcane, and cotton. The country is also a major producer of tea, coffee, and spices.
The Indian economy is also driven by the services sector, which accounts for more than 60% of the GDP. The services sector includes banking, insurance, IT, and tourism. The IT sector is one of the fastest-growing sectors in the country and is a major contributor to the economy.
Demographics
India is the second-most populous country in the world, with a population of over 1.3 billion people. The population is divided into four major ethnic groups: Indo-Aryans, Dravidians, Mongoloids, and Austro-Asiatic.
The majority of the population is Hindu, followed by Muslims, Christians, Sikhs, Buddhists, and Jains. Hindi is the official language of India, although English is also widely spoken.
India is a diverse country with a rich cultural heritage. The country is home to a number of religions, languages, and ethnicities. India is also home to a number of monuments and historical sites, which attract tourists from all over the world.
Common Questions
What is Per Capita Income in Economy?
Per Capita income in Economy is $24,826.
What is the Median Family Income in Economy?
Median Family Income in Economy is $53,125.
What is the Median Household income in Economy?
Median Household Income in Economy is $50,000.
What is Income or Wage Gap in Economy?
Income or Wage Gap in Economy is 14.9%.
Women in Economy earn 85.1 cents for every dollar earned by a man.
What is Inequality or Gini Index in Economy?
Inequality or Gini Index in Economy is 0.30.
What is the Total Population of Economy?
Total Population of Economy is 131.
What is the Total Male Population of Economy?
Total Male Population of Economy is 68.
What is the Total Female Population of Economy?
Total Female Population of Economy is 63.
What is the Ratio of Males per 100 Females in Economy?
There are 107.94 Males per 100 Females in Economy.
What is the Ratio of Females per 100 Males in Economy?
There are 92.65 Females per 100 Males in Economy.
What is the Median Population Age in Economy?
Median Population Age in Economy is 38.3 Years.
What is the Average Family Size in Economy
Average Family Size in Economy is 2.7 People.
What is the Average Household Size in Economy
Average Household Size in Economy is 2.4 People.
How Large is the Labor Force in Economy?
There are 70 People in the Labor Forcein in Economy.
What is the Percentage of People in the Labor Force in Economy?
64.8% of People are in the Labor Force in Economy.
What is the Unemployment Rate in Economy?
Unemployment Rate in Economy is 5.7%.