Dune Acres, IN Map & Demographics
Dune Acres Map
Dune Acres Overview
$135,895
PER CAPITA INCOME
$233,750
AVG FAMILY INCOME
$212,083
AVG HOUSEHOLD INCOME
0.47
INEQUALITY / GINI INDEX
293
TOTAL POPULATION
143
MALE POPULATION
150
FEMALE POPULATION
95.33
MALES / 100 FEMALES
104.90
FEMALES / 100 MALES
60.0
MEDIAN AGE
2.6
AVG FAMILY SIZE
2.0
AVG HOUSEHOLD SIZE
165
LABOR FORCE [ PEOPLE ]
58.5%
PERCENT IN LABOR FORCE
5.5%
UNEMPLOYMENT RATE
Dune Acres Area Codes
Income in Dune Acres
Income Overview in Dune Acres
Per Capita Income in Dune Acres is $135,895, while median incomes of families and households are $233,750 and $212,083 respectively.
| Characteristic | Number | Measure |
| Per Capita Income | 293 | $135,895 |
| Median Family Income | 78 | $233,750 |
| Mean Family Income | 78 | $298,541 |
| Median Household Income | 143 | $212,083 |
| Mean Household Income | 143 | $269,036 |
| Income Deficit | 78 | $0 |
| Wage / Income Gap (%) | 293 | 0.00% |
| Wage / Income Gap ($) | 293 | 100.00¢ per $1 |
| Gini / Inequality Index | 293 | 0.47 |
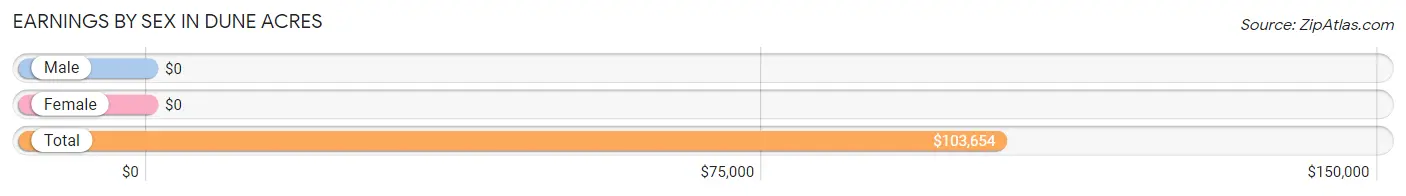
Earnings by Sex in Dune Acres
| Sex | Number | Average Earnings |
| Male | 94 (53.4%) | $0 |
| Female | 82 (46.6%) | $0 |
| Total | 176 (100.0%) | $103,654 |
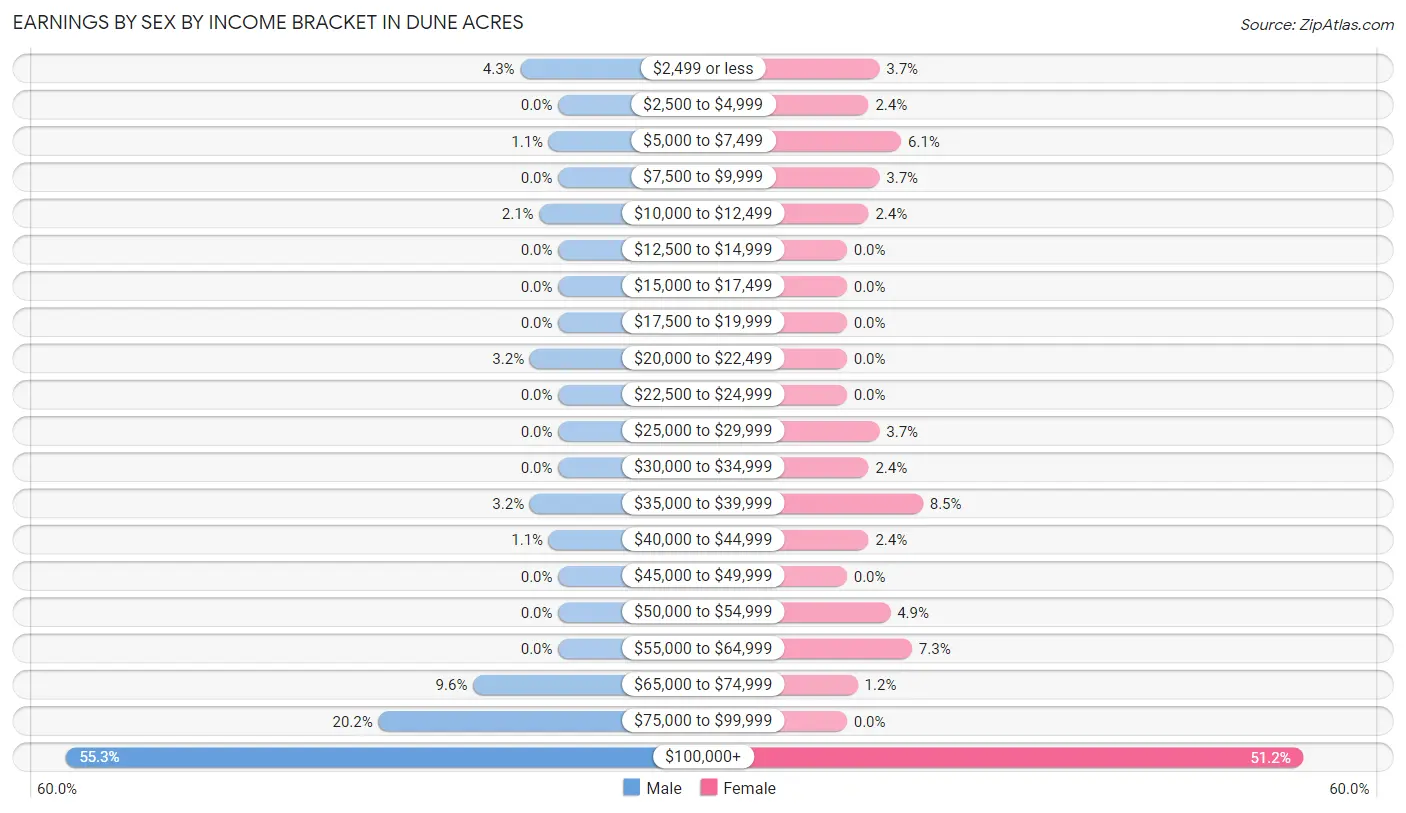
Earnings by Sex by Income Bracket in Dune Acres
The most common earnings brackets in Dune Acres are $100,000+ for men (52 | 55.3%) and $100,000+ for women (42 | 51.2%).
| Income | Male | Female |
| $2,499 or less | 4 (4.3%) | 3 (3.7%) |
| $2,500 to $4,999 | 0 (0.0%) | 2 (2.4%) |
| $5,000 to $7,499 | 1 (1.1%) | 5 (6.1%) |
| $7,500 to $9,999 | 0 (0.0%) | 3 (3.7%) |
| $10,000 to $12,499 | 2 (2.1%) | 2 (2.4%) |
| $12,500 to $14,999 | 0 (0.0%) | 0 (0.0%) |
| $15,000 to $17,499 | 0 (0.0%) | 0 (0.0%) |
| $17,500 to $19,999 | 0 (0.0%) | 0 (0.0%) |
| $20,000 to $22,499 | 3 (3.2%) | 0 (0.0%) |
| $22,500 to $24,999 | 0 (0.0%) | 0 (0.0%) |
| $25,000 to $29,999 | 0 (0.0%) | 3 (3.7%) |
| $30,000 to $34,999 | 0 (0.0%) | 2 (2.4%) |
| $35,000 to $39,999 | 3 (3.2%) | 7 (8.5%) |
| $40,000 to $44,999 | 1 (1.1%) | 2 (2.4%) |
| $45,000 to $49,999 | 0 (0.0%) | 0 (0.0%) |
| $50,000 to $54,999 | 0 (0.0%) | 4 (4.9%) |
| $55,000 to $64,999 | 0 (0.0%) | 6 (7.3%) |
| $65,000 to $74,999 | 9 (9.6%) | 1 (1.2%) |
| $75,000 to $99,999 | 19 (20.2%) | 0 (0.0%) |
| $100,000+ | 52 (55.3%) | 42 (51.2%) |
| Total | 94 (100.0%) | 82 (100.0%) |
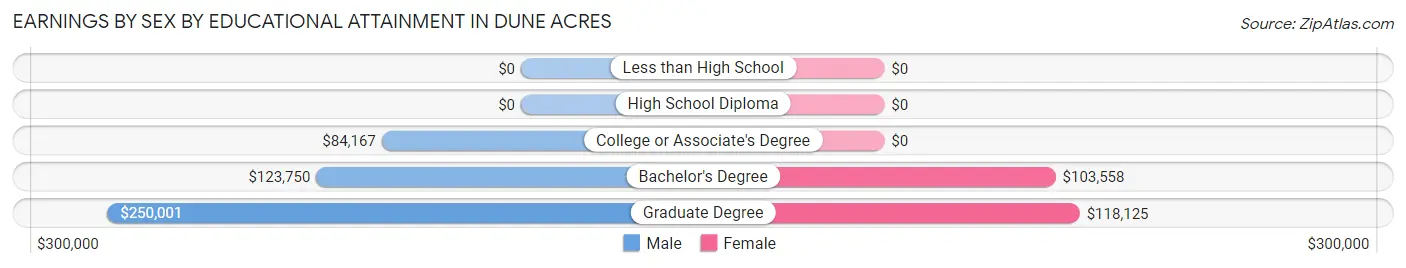
Earnings by Sex by Educational Attainment in Dune Acres
| Educational Attainment | Male Income | Female Income |
| Less than High School | - | - |
| High School Diploma | - | - |
| College or Associate's Degree | $84,167 | $0 |
| Bachelor's Degree | $123,750 | $103,558 |
| Graduate Degree | $250,001 | $118,125 |
| Total | - | - |
Family Income in Dune Acres
Family Income Brackets in Dune Acres
According to the Dune Acres family income data, there are 47 families falling into the $200,000+ income range, which is the most common income bracket and makes up 60.3% of all families.
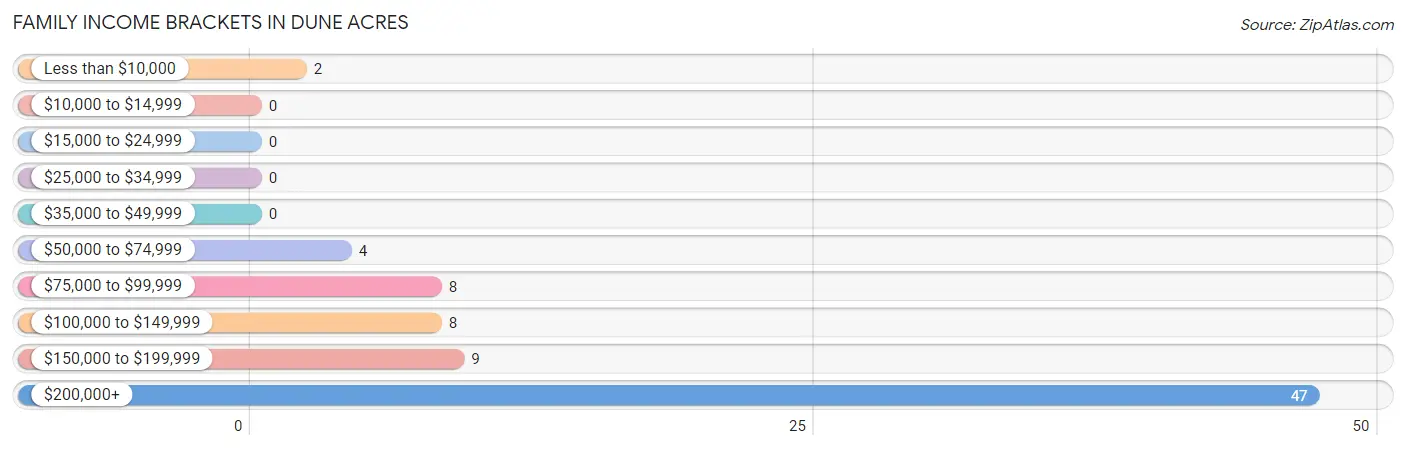
| Income Bracket | # Families | % Families |
| Less than $10,000 | 2 | 2.6% |
| $10,000 to $14,999 | 0 | 0.0% |
| $15,000 to $24,999 | 0 | 0.0% |
| $25,000 to $34,999 | 0 | 0.0% |
| $35,000 to $49,999 | 0 | 0.0% |
| $50,000 to $74,999 | 4 | 5.1% |
| $75,000 to $99,999 | 8 | 10.3% |
| $100,000 to $149,999 | 8 | 10.3% |
| $150,000 to $199,999 | 9 | 11.5% |
| $200,000+ | 47 | 60.3% |
Family Income by Famaliy Size in Dune Acres
3-person families (8 | 10.3%) account for the highest median family income in Dune Acres with $248,125 per family, while 2-person families (61 | 78.2%) have the highest median income of $117,188 per family member.
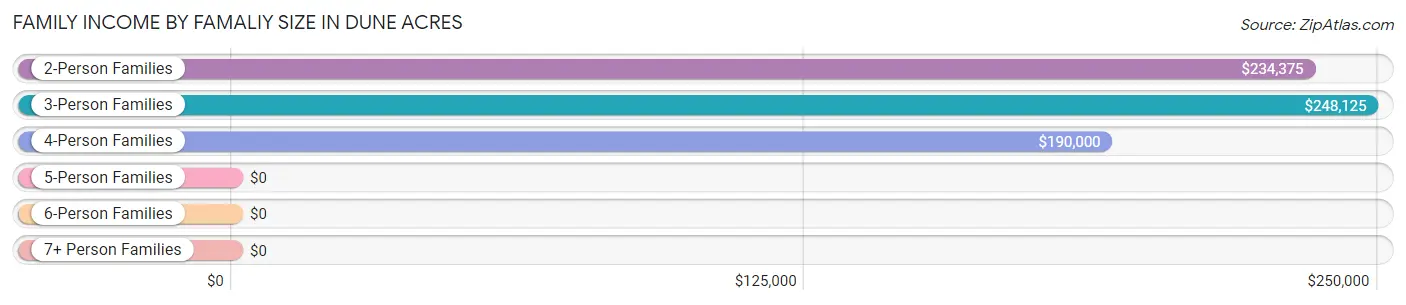
| Income Bracket | # Families | Median Income |
| 2-Person Families | 61 (78.2%) | $234,375 |
| 3-Person Families | 8 (10.3%) | $248,125 |
| 4-Person Families | 6 (7.7%) | $190,000 |
| 5-Person Families | 0 (0.0%) | $0 |
| 6-Person Families | 1 (1.3%) | $0 |
| 7+ Person Families | 2 (2.6%) | $0 |
| Total | 78 (100.0%) | $233,750 |
Family Income by Number of Earners in Dune Acres
The median family income in Dune Acres is $233,750, with families comprising 1 earner (20) having the highest median family income of $250,001, while families with no earners (18) have the lowest median family income of $146,250, accounting for 25.6% and 23.1% of families, respectively.
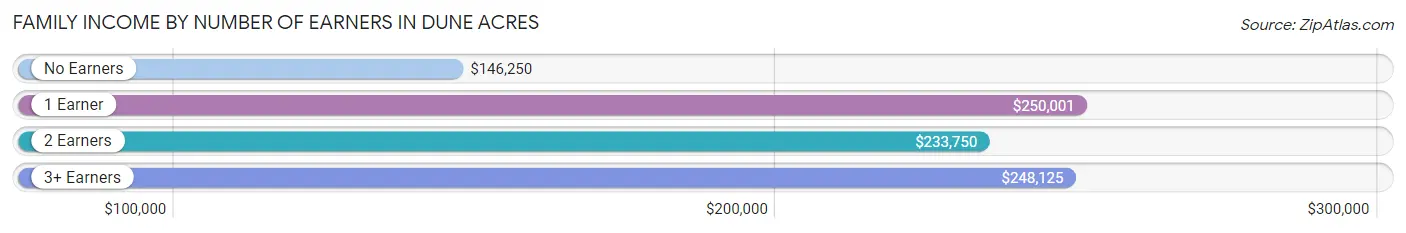
| Number of Earners | # Families | Median Income |
| No Earners | 18 (23.1%) | $146,250 |
| 1 Earner | 20 (25.6%) | $250,001 |
| 2 Earners | 32 (41.0%) | $233,750 |
| 3+ Earners | 8 (10.3%) | $248,125 |
| Total | 78 (100.0%) | $233,750 |
Household Income in Dune Acres
Household Income Brackets in Dune Acres
With 74 households falling in the category, the $200,000+ income range is the most frequent in Dune Acres, accounting for 51.7% of all households.
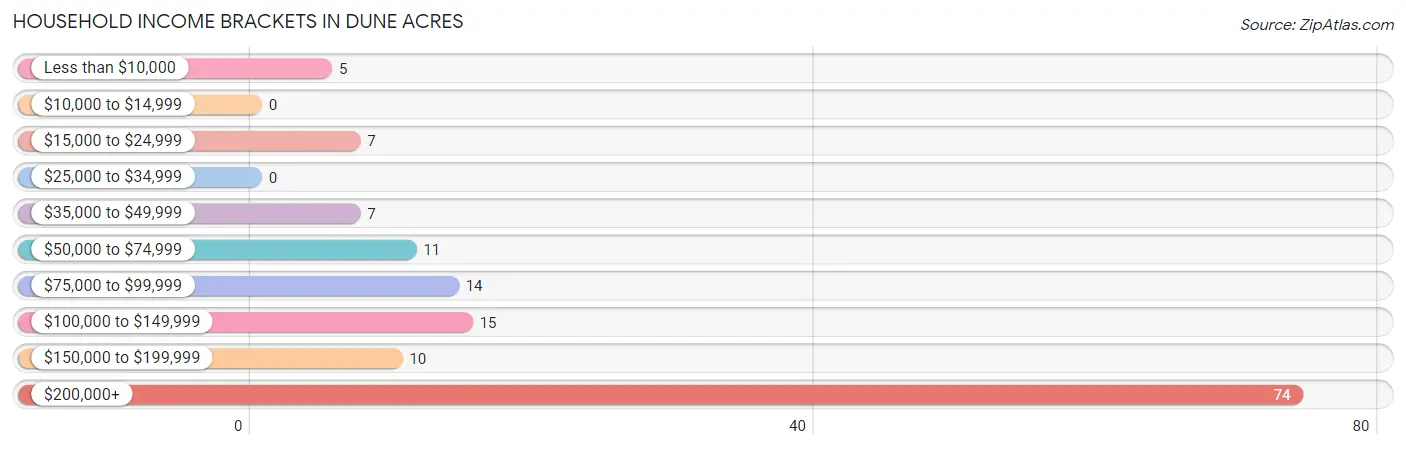
| Income Bracket | # Households | % Households |
| Less than $10,000 | 5 | 3.5% |
| $10,000 to $14,999 | 0 | 0.0% |
| $15,000 to $24,999 | 7 | 4.9% |
| $25,000 to $34,999 | 0 | 0.0% |
| $35,000 to $49,999 | 7 | 4.9% |
| $50,000 to $74,999 | 11 | 7.7% |
| $75,000 to $99,999 | 14 | 9.8% |
| $100,000 to $149,999 | 15 | 10.5% |
| $150,000 to $199,999 | 10 | 7.0% |
| $200,000+ | 74 | 51.7% |
Household Income by Householder Age in Dune Acres
The median household income in Dune Acres is $212,083, with the highest median household income of $250,001 found in the 45 to 64 years age bracket for the primary householder. A total of 65 households (45.5%) fall into this category.
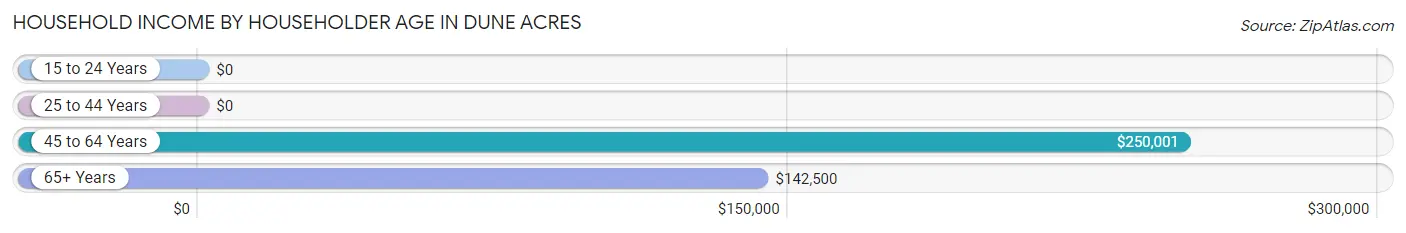
| Income Bracket | # Households | Median Income |
| 15 to 24 Years | 0 (0.0%) | $0 |
| 25 to 44 Years | 2 (1.4%) | $0 |
| 45 to 64 Years | 65 (45.5%) | $250,001 |
| 65+ Years | 76 (53.1%) | $142,500 |
| Total | 143 (100.0%) | $212,083 |
Poverty in Dune Acres
Income Below Poverty by Sex and Age in Dune Acres
With 3.5% poverty level for males and 2.0% for females among the residents of Dune Acres, 25 to 34 year old males and 25 to 34 year old females are the most vulnerable to poverty, with 1 males (25.0%) and 2 females (10.5%) in their respective age groups living below the poverty level.
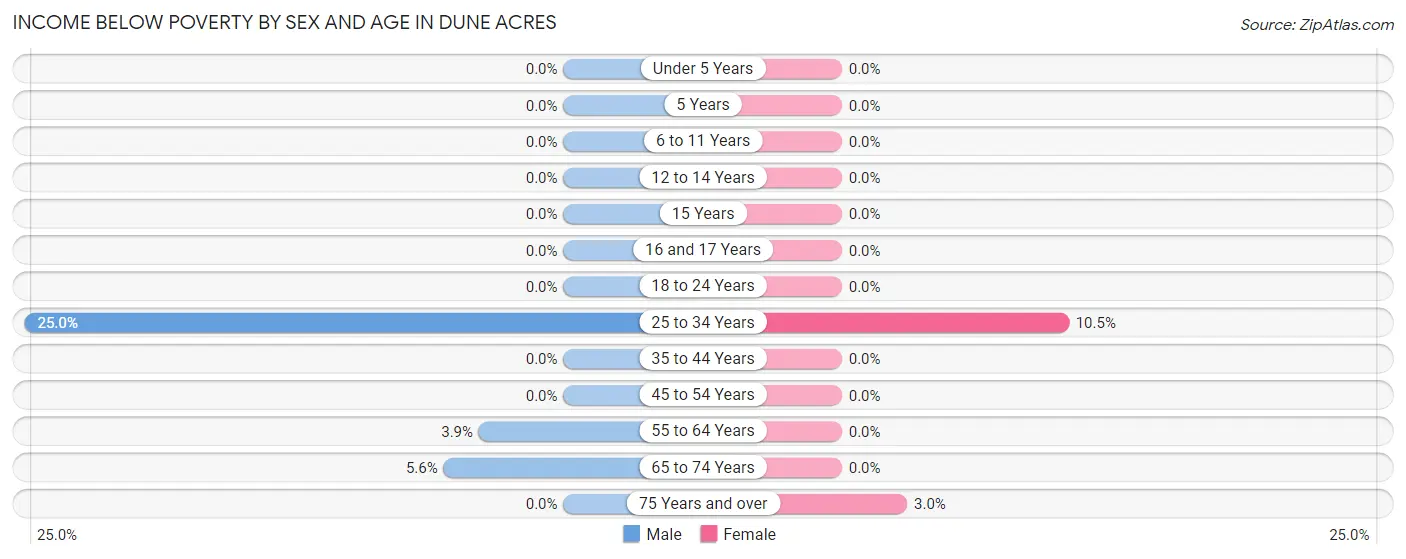
| Age Bracket | Male | Female |
| Under 5 Years | 0 (0.0%) | 0 (0.0%) |
| 5 Years | 0 (0.0%) | 0 (0.0%) |
| 6 to 11 Years | 0 (0.0%) | 0 (0.0%) |
| 12 to 14 Years | 0 (0.0%) | 0 (0.0%) |
| 15 Years | 0 (0.0%) | 0 (0.0%) |
| 16 and 17 Years | 0 (0.0%) | 0 (0.0%) |
| 18 to 24 Years | 0 (0.0%) | 0 (0.0%) |
| 25 to 34 Years | 1 (25.0%) | 2 (10.5%) |
| 35 to 44 Years | 0 (0.0%) | 0 (0.0%) |
| 45 to 54 Years | 0 (0.0%) | 0 (0.0%) |
| 55 to 64 Years | 2 (3.9%) | 0 (0.0%) |
| 65 to 74 Years | 2 (5.6%) | 0 (0.0%) |
| 75 Years and over | 0 (0.0%) | 1 (3.0%) |
| Total | 5 (3.5%) | 3 (2.0%) |
Income Above Poverty by Sex and Age in Dune Acres
According to the poverty statistics in Dune Acres, males aged under 5 years and females aged 6 to 11 years are the age groups that are most secure financially, with 100.0% of males and 100.0% of females in these age groups living above the poverty line.
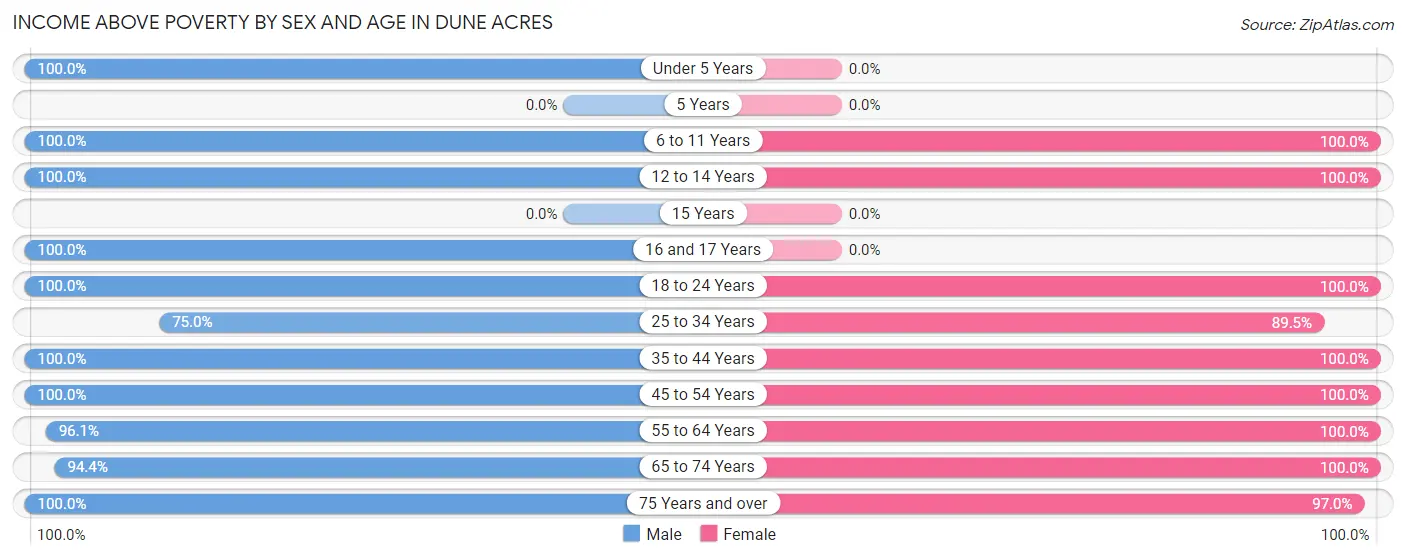
| Age Bracket | Male | Female |
| Under 5 Years | 5 (100.0%) | 0 (0.0%) |
| 5 Years | 0 (0.0%) | 0 (0.0%) |
| 6 to 11 Years | 2 (100.0%) | 2 (100.0%) |
| 12 to 14 Years | 1 (100.0%) | 1 (100.0%) |
| 15 Years | 0 (0.0%) | 0 (0.0%) |
| 16 and 17 Years | 4 (100.0%) | 0 (0.0%) |
| 18 to 24 Years | 4 (100.0%) | 5 (100.0%) |
| 25 to 34 Years | 3 (75.0%) | 17 (89.5%) |
| 35 to 44 Years | 3 (100.0%) | 3 (100.0%) |
| 45 to 54 Years | 15 (100.0%) | 28 (100.0%) |
| 55 to 64 Years | 49 (96.1%) | 39 (100.0%) |
| 65 to 74 Years | 34 (94.4%) | 20 (100.0%) |
| 75 Years and over | 18 (100.0%) | 32 (97.0%) |
| Total | 138 (96.5%) | 147 (98.0%) |
Income Below Poverty Among Married-Couple Families in Dune Acres
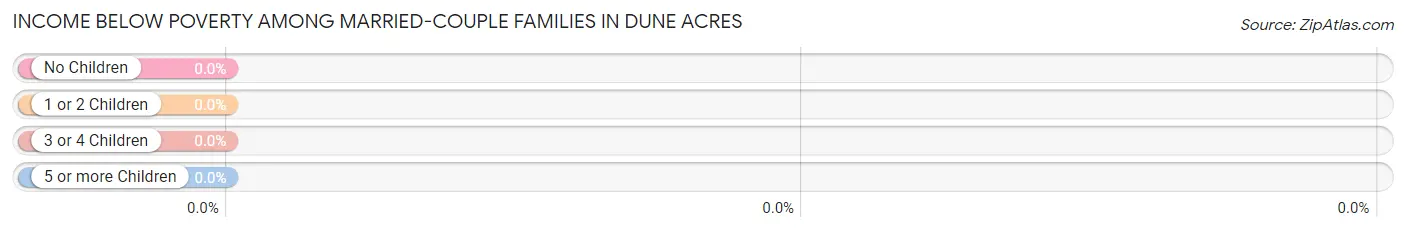
| Children | Above Poverty | Below Poverty |
| No Children | 65 (100.0%) | 0 (0.0%) |
| 1 or 2 Children | 9 (100.0%) | 0 (0.0%) |
| 3 or 4 Children | 1 (100.0%) | 0 (0.0%) |
| 5 or more Children | 0 (0.0%) | 0 (0.0%) |
| Total | 75 (100.0%) | 0 (0.0%) |
Income Below Poverty Among Single-Parent Households in Dune Acres
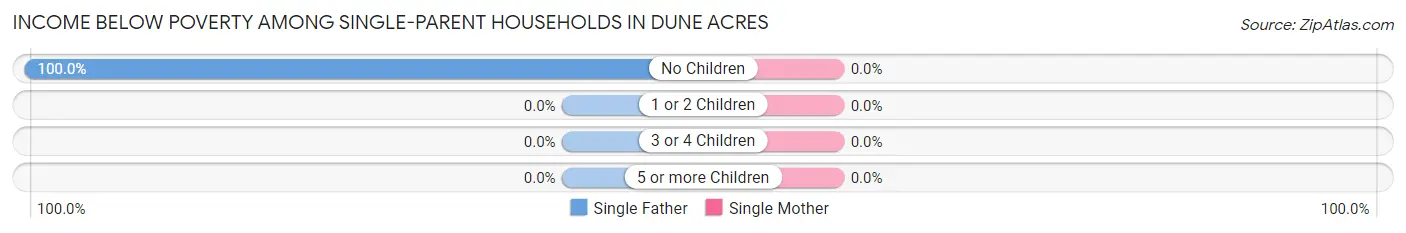
| Children | Single Father | Single Mother |
| No Children | 2 (100.0%) | 0 (0.0%) |
| 1 or 2 Children | 0 (0.0%) | 0 (0.0%) |
| 3 or 4 Children | 0 (0.0%) | 0 (0.0%) |
| 5 or more Children | 0 (0.0%) | 0 (0.0%) |
| Total | 2 (100.0%) | 0 (0.0%) |
Income Below Poverty Among Married-Couple vs Single-Parent Households in Dune Acres
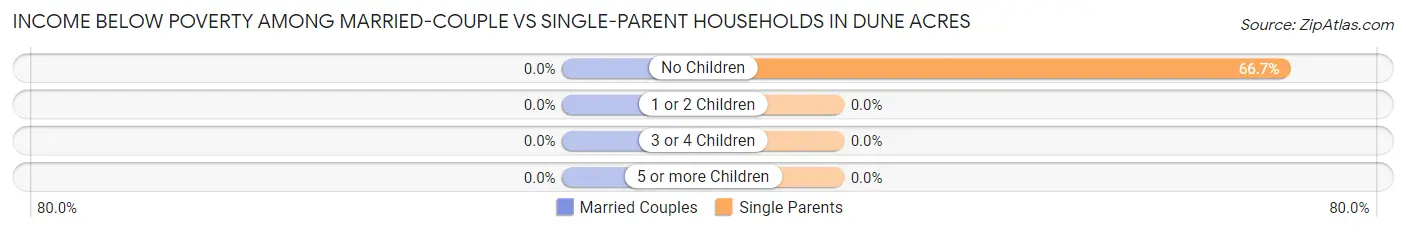
| Children | Married-Couple Families | Single-Parent Households |
| No Children | 0 (0.0%) | 2 (66.7%) |
| 1 or 2 Children | 0 (0.0%) | 0 (0.0%) |
| 3 or 4 Children | 0 (0.0%) | 0 (0.0%) |
| 5 or more Children | 0 (0.0%) | 0 (0.0%) |
| Total | 0 (0.0%) | 2 (66.7%) |
Race in Dune Acres
The most populous races in Dune Acres are White / Caucasian (254 | 86.7%), Some other Race (18 | 6.1%), and Asian (17 | 5.8%).
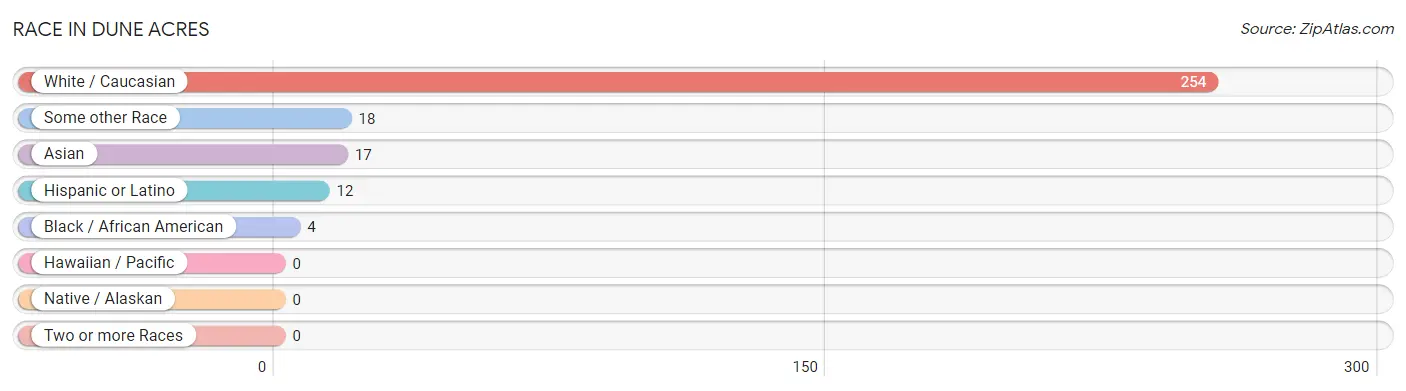
| Race | # Population | % Population |
| Asian | 17 | 5.8% |
| Black / African American | 4 | 1.4% |
| Hawaiian / Pacific | 0 | 0.0% |
| Hispanic or Latino | 12 | 4.1% |
| Native / Alaskan | 0 | 0.0% |
| White / Caucasian | 254 | 86.7% |
| Two or more Races | 0 | 0.0% |
| Some other Race | 18 | 6.1% |
| Total | 293 | 100.0% |
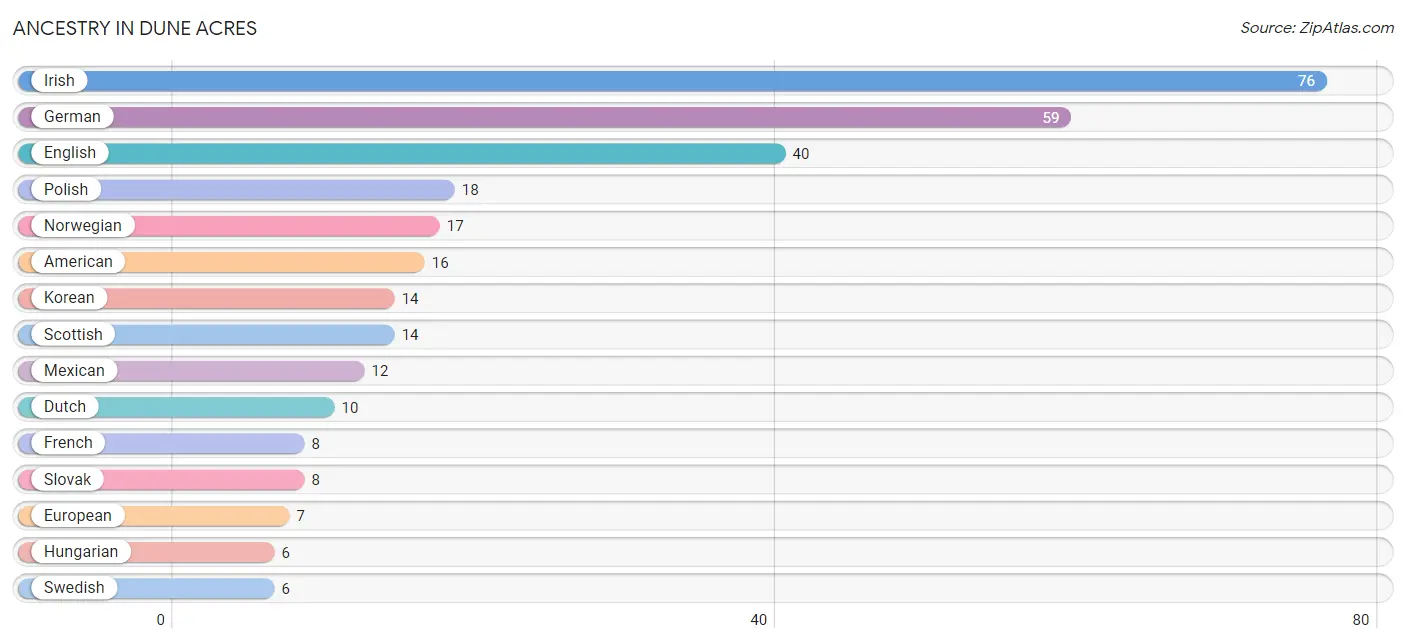
Ancestry in Dune Acres
The most populous ancestries reported in Dune Acres are Irish (76 | 25.9%), German (59 | 20.1%), English (40 | 13.7%), Polish (18 | 6.1%), and Norwegian (17 | 5.8%), together accounting for 71.7% of all Dune Acres residents.
| Ancestry | # Population | % Population |
| American | 16 | 5.5% |
| Arab | 2 | 0.7% |
| Austrian | 4 | 1.4% |
| British | 4 | 1.4% |
| Croatian | 1 | 0.3% |
| Danish | 1 | 0.3% |
| Dutch | 10 | 3.4% |
| English | 40 | 13.7% |
| European | 7 | 2.4% |
| French | 8 | 2.7% |
| French Canadian | 1 | 0.3% |
| German | 59 | 20.1% |
| Hungarian | 6 | 2.1% |
| Indian (Asian) | 3 | 1.0% |
| Irish | 76 | 25.9% |
| Italian | 3 | 1.0% |
| Korean | 14 | 4.8% |
| Lebanese | 2 | 0.7% |
| Lithuanian | 4 | 1.4% |
| Mexican | 12 | 4.1% |
| Norwegian | 17 | 5.8% |
| Polish | 18 | 6.1% |
| Romanian | 1 | 0.3% |
| Russian | 3 | 1.0% |
| Scotch-Irish | 1 | 0.3% |
| Scottish | 14 | 4.8% |
| Serbian | 2 | 0.7% |
| Slovak | 8 | 2.7% |
| Slovene | 3 | 1.0% |
| Swedish | 6 | 2.1% |
| Welsh | 2 | 0.7% | View All 31 Rows |
Immigrants in Dune Acres
The most numerous immigrant groups reported in Dune Acres came from Asia (14 | 4.8%), Philippines (14 | 4.8%), South Eastern Asia (14 | 4.8%), Europe (4 | 1.4%), and Eastern Europe (2 | 0.7%), together accounting for 16.4% of all Dune Acres residents.
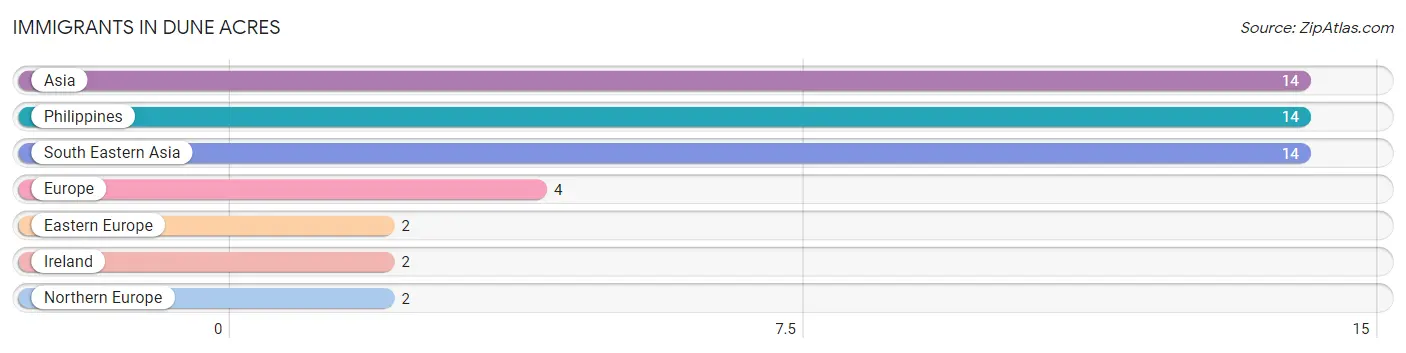
| Immigration Origin | # Population | % Population |
| Asia | 14 | 4.8% |
| Eastern Europe | 2 | 0.7% |
| Europe | 4 | 1.4% |
| Ireland | 2 | 0.7% |
| Northern Europe | 2 | 0.7% |
| Philippines | 14 | 4.8% |
| South Eastern Asia | 14 | 4.8% | View All 7 Rows |
Sex and Age in Dune Acres
Sex and Age in Dune Acres
The most populous age groups in Dune Acres are 55 to 59 Years (33 | 23.1%) for men and 60 to 64 Years (21 | 14.0%) for women.
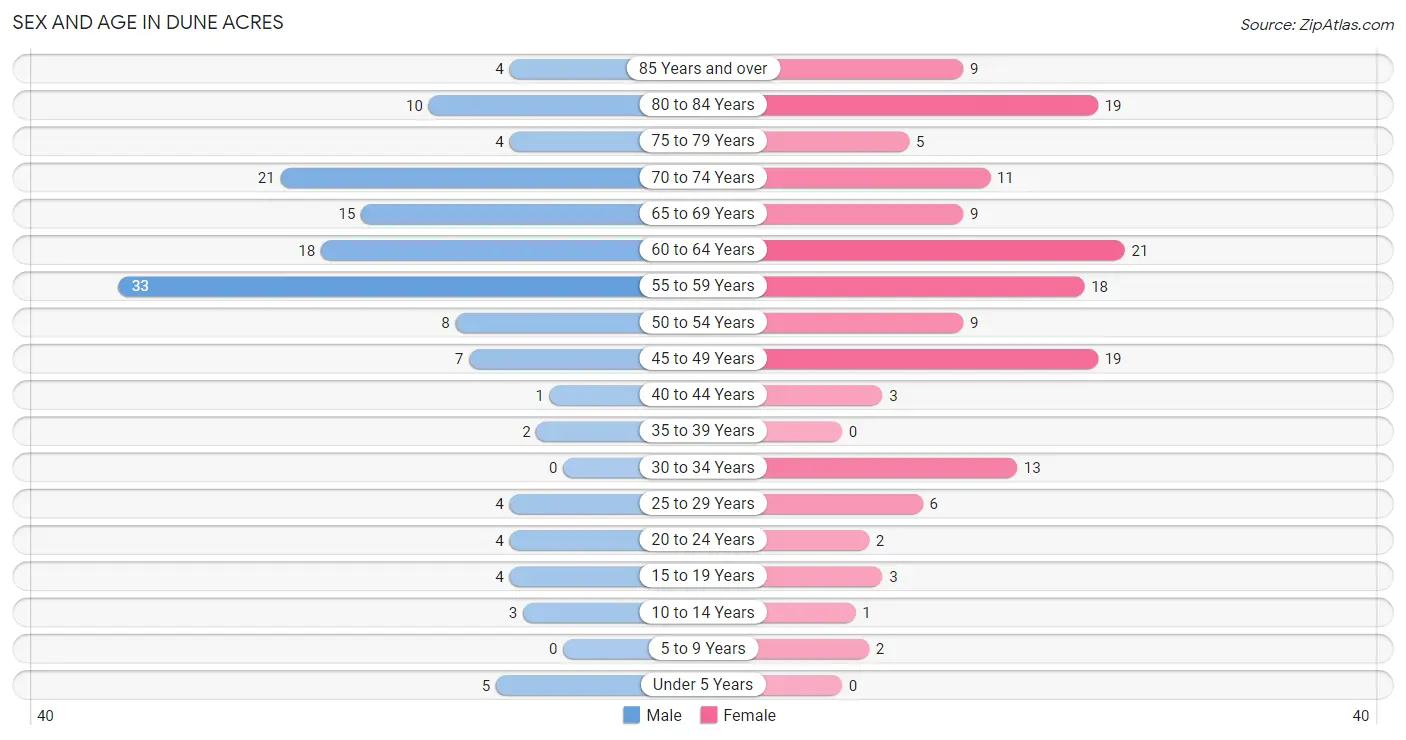
| Age Bracket | Male | Female |
| Under 5 Years | 5 (3.5%) | 0 (0.0%) |
| 5 to 9 Years | 0 (0.0%) | 2 (1.3%) |
| 10 to 14 Years | 3 (2.1%) | 1 (0.7%) |
| 15 to 19 Years | 4 (2.8%) | 3 (2.0%) |
| 20 to 24 Years | 4 (2.8%) | 2 (1.3%) |
| 25 to 29 Years | 4 (2.8%) | 6 (4.0%) |
| 30 to 34 Years | 0 (0.0%) | 13 (8.7%) |
| 35 to 39 Years | 2 (1.4%) | 0 (0.0%) |
| 40 to 44 Years | 1 (0.7%) | 3 (2.0%) |
| 45 to 49 Years | 7 (4.9%) | 19 (12.7%) |
| 50 to 54 Years | 8 (5.6%) | 9 (6.0%) |
| 55 to 59 Years | 33 (23.1%) | 18 (12.0%) |
| 60 to 64 Years | 18 (12.6%) | 21 (14.0%) |
| 65 to 69 Years | 15 (10.5%) | 9 (6.0%) |
| 70 to 74 Years | 21 (14.7%) | 11 (7.3%) |
| 75 to 79 Years | 4 (2.8%) | 5 (3.3%) |
| 80 to 84 Years | 10 (7.0%) | 19 (12.7%) |
| 85 Years and over | 4 (2.8%) | 9 (6.0%) |
| Total | 143 (100.0%) | 150 (100.0%) |
Families and Households in Dune Acres
Median Family Size in Dune Acres
The median family size in Dune Acres is 2.58 persons per family, with single female/mother families (1 | 1.3%) accounting for the largest median family size of 3 persons per family. On the other hand, single male/father families (2 | 2.6%) represent the smallest median family size with 2.00 persons per family.
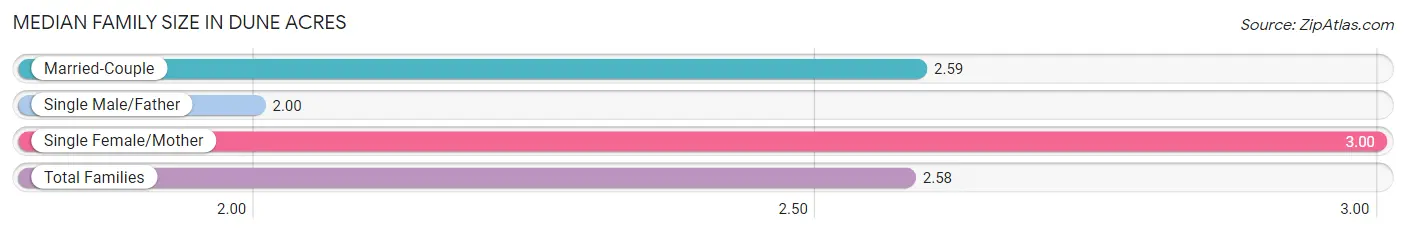
| Family Type | # Families | Family Size |
| Married-Couple | 75 (96.2%) | 2.59 |
| Single Male/Father | 2 (2.6%) | 2.00 |
| Single Female/Mother | 1 (1.3%) | 3.00 |
| Total Families | 78 (100.0%) | 2.58 |
Median Household Size in Dune Acres
The median household size in Dune Acres is 2.05 persons per household, with single female/mother households (1 | 0.7%) accounting for the largest median household size of 3 persons per household. non-family households (65 | 45.5%) represent the smallest median household size with 1.37 persons per household.
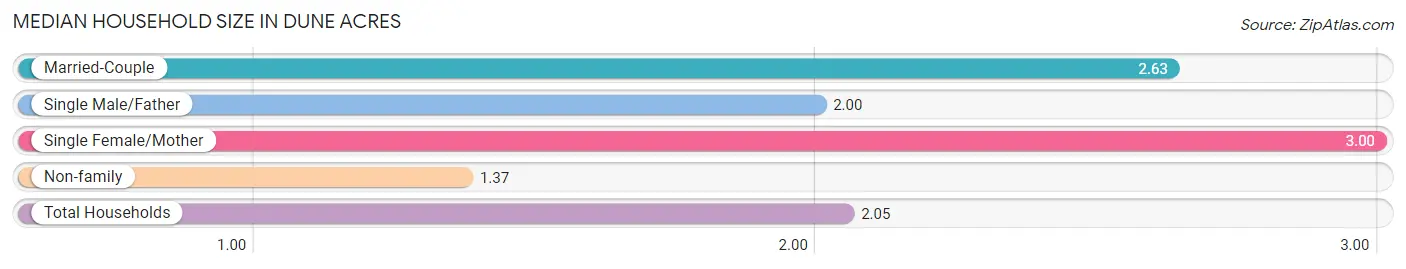
| Household Type | # Households | Household Size |
| Married-Couple | 75 (52.4%) | 2.63 |
| Single Male/Father | 2 (1.4%) | 2.00 |
| Single Female/Mother | 1 (0.7%) | 3.00 |
| Non-family | 65 (45.5%) | 1.37 |
| Total Households | 143 (100.0%) | 2.05 |
Household Size by Marriage Status in Dune Acres
Out of a total of 143 households in Dune Acres, 78 (54.5%) are family households, while 65 (45.5%) are nonfamily households. The most numerous type of family households are 2-person households, comprising 61, and the most common type of nonfamily households are 1-person households, comprising 38.
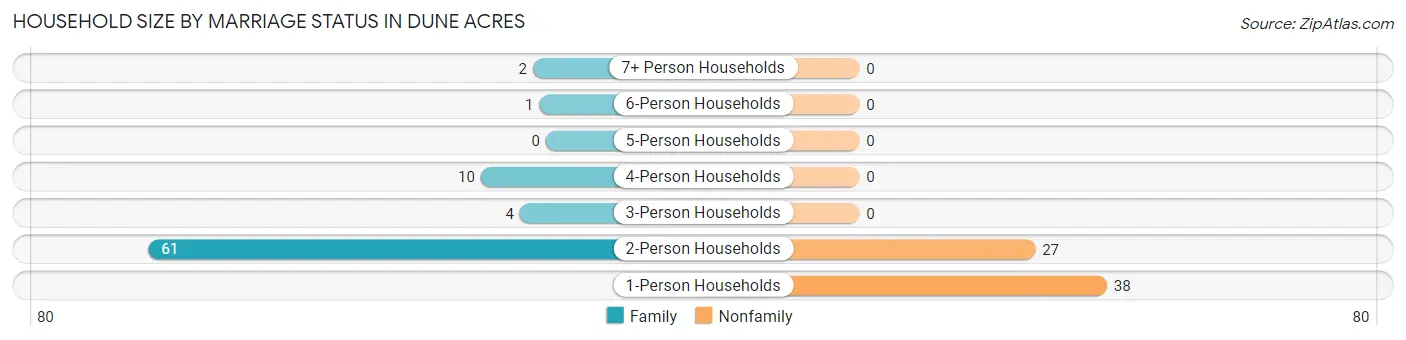
| Household Size | Family Households | Nonfamily Households |
| 1-Person Households | - | 38 (26.6%) |
| 2-Person Households | 61 (42.7%) | 27 (18.9%) |
| 3-Person Households | 4 (2.8%) | 0 (0.0%) |
| 4-Person Households | 10 (7.0%) | 0 (0.0%) |
| 5-Person Households | 0 (0.0%) | 0 (0.0%) |
| 6-Person Households | 1 (0.7%) | 0 (0.0%) |
| 7+ Person Households | 2 (1.4%) | 0 (0.0%) |
| Total | 78 (54.5%) | 65 (45.5%) |
Female Fertility in Dune Acres
Fertility by Age in Dune Acres
| Age Bracket | Women with Births | Births / 1,000 Women |
| 15 to 19 years | 0 (0.0%) | 0.0 |
| 20 to 34 years | 0 (0.0%) | 0.0 |
| 35 to 50 years | 0 (0.0%) | 0.0 |
| Total | 0 (0.0%) | 0.0 |
Fertility by Age by Marriage Status in Dune Acres
| Age Bracket | Married | Unmarried |
| 15 to 19 years | 0 (0.0%) | 0 (0.0%) |
| 20 to 34 years | 0 (0.0%) | 0 (0.0%) |
| 35 to 50 years | 0 (0.0%) | 0 (0.0%) |
| Total | 0 (0.0%) | 0 (0.0%) |
Fertility by Education in Dune Acres
| Educational Attainment | Women with Births | Births / 1,000 Women |
| Less than High School | 0 (0.0%) | 0.0 |
| High School Diploma | 0 (0.0%) | 0.0 |
| College or Associate's Degree | 0 (0.0%) | 0.0 |
| Bachelor's Degree | 0 (0.0%) | 0.0 |
| Graduate Degree | 0 (0.0%) | 0.0 |
| Total | 0 (0.0%) | 0.0 |
Fertility by Education by Marriage Status in Dune Acres
| Educational Attainment | Married | Unmarried |
| Less than High School | 0 (0.0%) | 0 (0.0%) |
| High School Diploma | 0 (0.0%) | 0 (0.0%) |
| College or Associate's Degree | 0 (0.0%) | 0 (0.0%) |
| Bachelor's Degree | 0 (0.0%) | 0 (0.0%) |
| Graduate Degree | 0 (0.0%) | 0 (0.0%) |
| Total | 0 (0.0%) | 0 (0.0%) |
Employment Characteristics in Dune Acres
Employment by Class of Employer in Dune Acres
Among the 154 employed individuals in Dune Acres, private company employees (80 | 51.9%), not-for-profit organizations (31 | 20.1%), and self-employed (incorporated) (19 | 12.3%) make up the most common classes of employment.
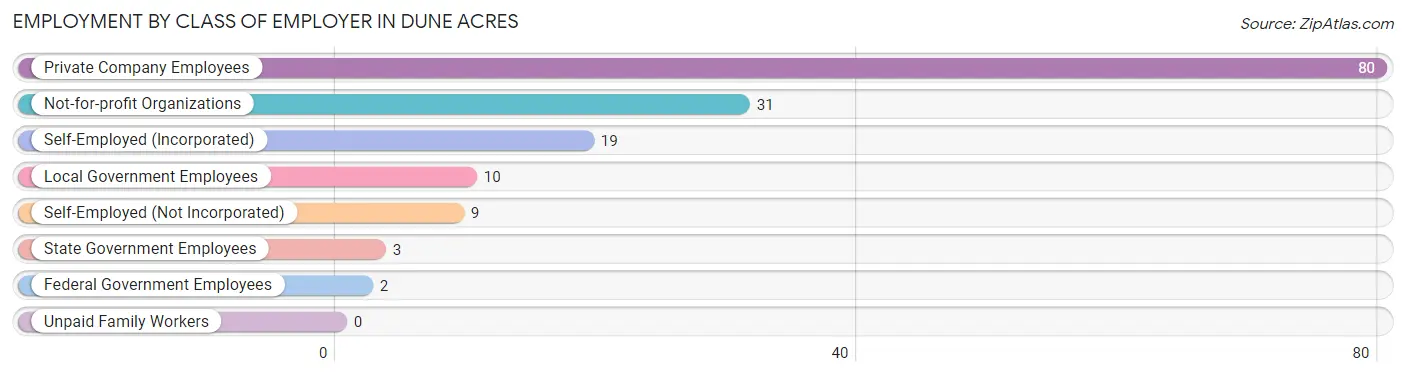
| Employer Class | # Employees | % Employees |
| Private Company Employees | 80 | 51.9% |
| Self-Employed (Incorporated) | 19 | 12.3% |
| Self-Employed (Not Incorporated) | 9 | 5.8% |
| Not-for-profit Organizations | 31 | 20.1% |
| Local Government Employees | 10 | 6.5% |
| State Government Employees | 3 | 1.9% |
| Federal Government Employees | 2 | 1.3% |
| Unpaid Family Workers | 0 | 0.0% |
| Total | 154 | 100.0% |
Employment Status by Age in Dune Acres
According to the labor force statistics for Dune Acres, out of the total population over 16 years of age (282), 58.5% or 165 individuals are in the labor force, with 5.5% or 9 of them unemployed. The age group with the highest labor force participation rate is 20 to 24 years, with 100.0% or 6 individuals in the labor force. Within the labor force, the 20 to 24 years age range has the highest percentage of unemployed individuals, with 66.7% or 4 of them being unemployed.
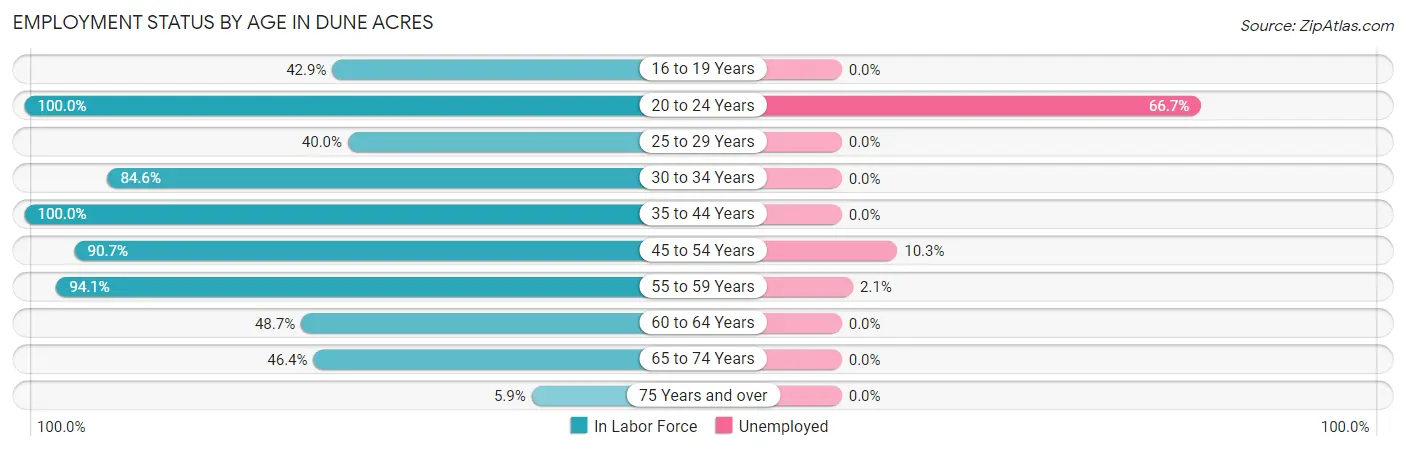
| Age Bracket | In Labor Force | Unemployed |
| 16 to 19 Years | 3 (42.9%) | 0 (0.0%) |
| 20 to 24 Years | 6 (100.0%) | 4 (66.7%) |
| 25 to 29 Years | 4 (40.0%) | 0 (0.0%) |
| 30 to 34 Years | 11 (84.6%) | 0 (0.0%) |
| 35 to 44 Years | 6 (100.0%) | 0 (0.0%) |
| 45 to 54 Years | 39 (90.7%) | 4 (10.3%) |
| 55 to 59 Years | 48 (94.1%) | 1 (2.1%) |
| 60 to 64 Years | 19 (48.7%) | 0 (0.0%) |
| 65 to 74 Years | 26 (46.4%) | 0 (0.0%) |
| 75 Years and over | 3 (5.9%) | 0 (0.0%) |
| Total | 165 (58.5%) | 9 (5.5%) |
Employment Status by Educational Attainment in Dune Acres
According to labor force statistics for Dune Acres, 78.4% of individuals (127) out of the total population between 25 and 64 years of age (162) are in the labor force, with 3.9% or 5 of them being unemployed. The group with the highest labor force participation rate are those with the educational attainment of bachelor's degree or higher, with 84.8% or 106 individuals in the labor force. Within the labor force, individuals with bachelor's degree or higher education have the highest percentage of unemployment, with 4.7% or 5 of them being unemployed.
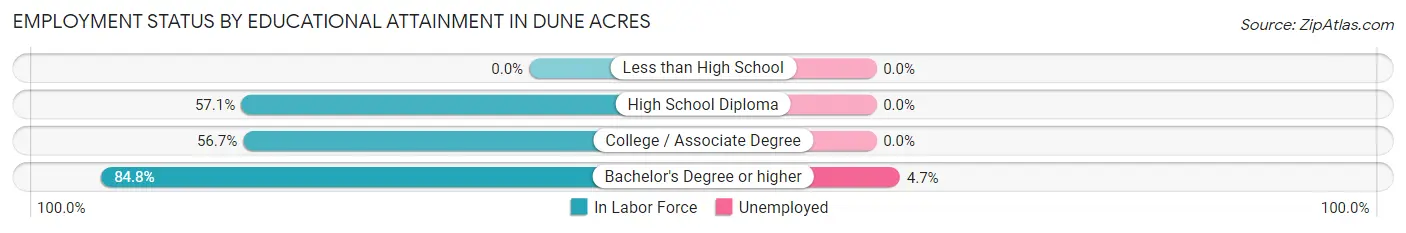
| Educational Attainment | In Labor Force | Unemployed |
| Less than High School | 0 (0.0%) | 0 (0.0%) |
| High School Diploma | 4 (57.1%) | 0 (0.0%) |
| College / Associate Degree | 17 (56.7%) | 0 (0.0%) |
| Bachelor's Degree or higher | 106 (84.8%) | 6 (4.7%) |
| Total | 127 (78.4%) | 6 (3.9%) |
Employment Occupations by Sex in Dune Acres
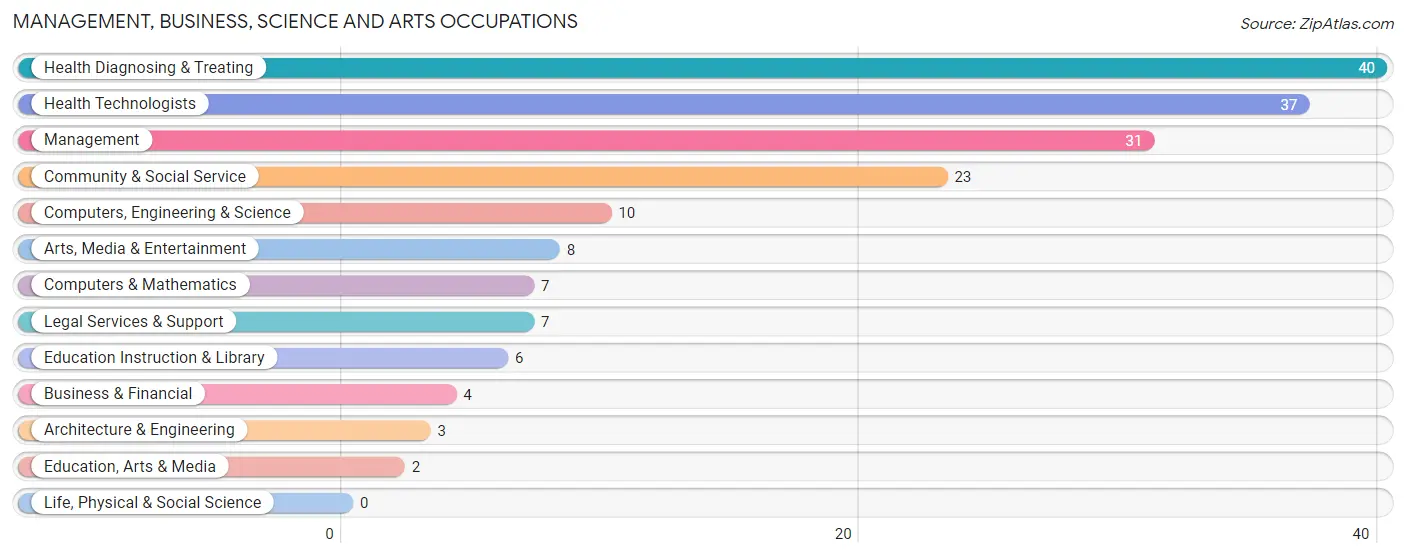
Management, Business, Science and Arts Occupations
The most common Management, Business, Science and Arts occupations in Dune Acres are Health Diagnosing & Treating (40 | 25.6%), Health Technologists (37 | 23.7%), Management (31 | 19.9%), Community & Social Service (23 | 14.7%), and Computers, Engineering & Science (10 | 6.4%).
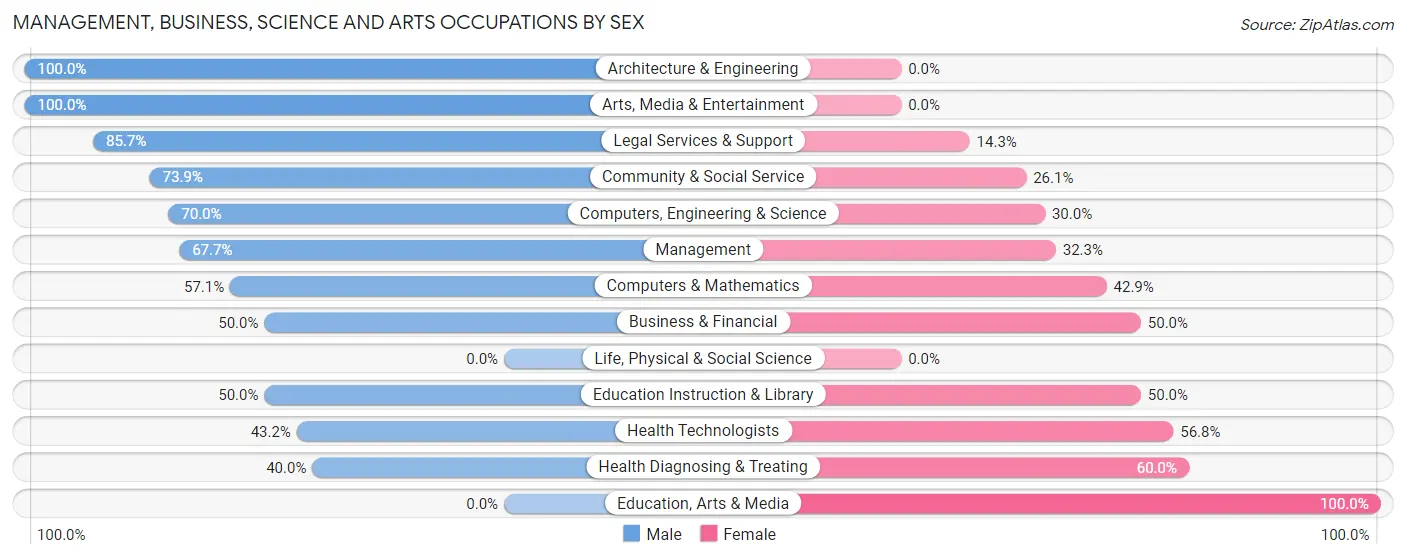
Management, Business, Science and Arts Occupations by Sex
Within the Management, Business, Science and Arts occupations in Dune Acres, the most male-oriented occupations are Architecture & Engineering (100.0%), Arts, Media & Entertainment (100.0%), and Legal Services & Support (85.7%), while the most female-oriented occupations are Education, Arts & Media (100.0%), Health Diagnosing & Treating (60.0%), and Health Technologists (56.8%).
| Occupation | Male | Female |
| Management | 21 (67.7%) | 10 (32.3%) |
| Business & Financial | 2 (50.0%) | 2 (50.0%) |
| Computers, Engineering & Science | 7 (70.0%) | 3 (30.0%) |
| Computers & Mathematics | 4 (57.1%) | 3 (42.9%) |
| Architecture & Engineering | 3 (100.0%) | 0 (0.0%) |
| Life, Physical & Social Science | 0 (0.0%) | 0 (0.0%) |
| Community & Social Service | 17 (73.9%) | 6 (26.1%) |
| Education, Arts & Media | 0 (0.0%) | 2 (100.0%) |
| Legal Services & Support | 6 (85.7%) | 1 (14.3%) |
| Education Instruction & Library | 3 (50.0%) | 3 (50.0%) |
| Arts, Media & Entertainment | 8 (100.0%) | 0 (0.0%) |
| Health Diagnosing & Treating | 16 (40.0%) | 24 (60.0%) |
| Health Technologists | 16 (43.2%) | 21 (56.8%) |
| Total (Category) | 63 (58.3%) | 45 (41.7%) |
| Total (Overall) | 90 (57.7%) | 66 (42.3%) |
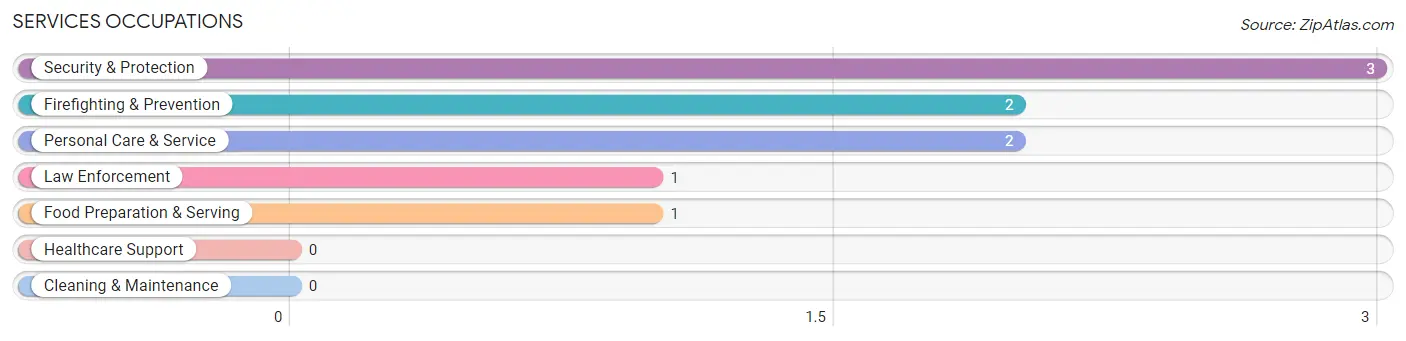
Services Occupations
The most common Services occupations in Dune Acres are Security & Protection (3 | 1.9%), Firefighting & Prevention (2 | 1.3%), Personal Care & Service (2 | 1.3%), Law Enforcement (1 | 0.6%), and Food Preparation & Serving (1 | 0.6%).
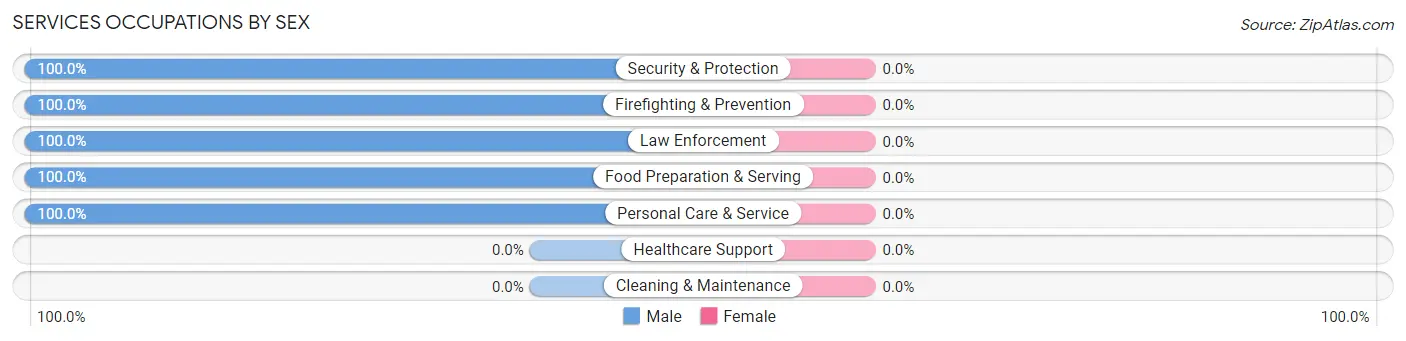
Services Occupations by Sex
| Occupation | Male | Female |
| Healthcare Support | 0 (0.0%) | 0 (0.0%) |
| Security & Protection | 3 (100.0%) | 0 (0.0%) |
| Firefighting & Prevention | 2 (100.0%) | 0 (0.0%) |
| Law Enforcement | 1 (100.0%) | 0 (0.0%) |
| Food Preparation & Serving | 1 (100.0%) | 0 (0.0%) |
| Cleaning & Maintenance | 0 (0.0%) | 0 (0.0%) |
| Personal Care & Service | 2 (100.0%) | 0 (0.0%) |
| Total (Category) | 6 (100.0%) | 0 (0.0%) |
| Total (Overall) | 90 (57.7%) | 66 (42.3%) |
Sales and Office Occupations
The most common Sales and Office occupations in Dune Acres are Sales & Related (21 | 13.5%), and Office & Administration (10 | 6.4%).

Sales and Office Occupations by Sex

| Occupation | Male | Female |
| Sales & Related | 14 (66.7%) | 7 (33.3%) |
| Office & Administration | 0 (0.0%) | 10 (100.0%) |
| Total (Category) | 14 (45.2%) | 17 (54.8%) |
| Total (Overall) | 90 (57.7%) | 66 (42.3%) |
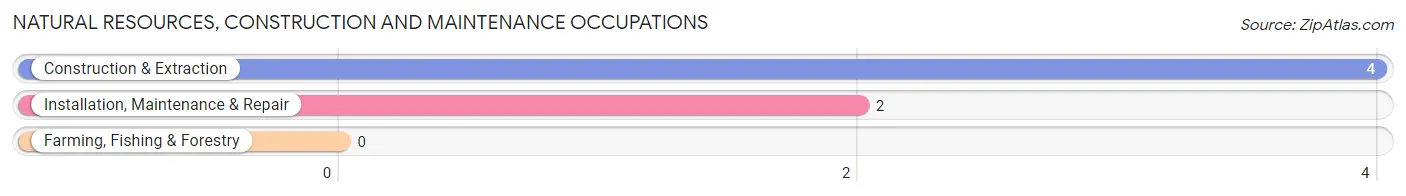
Natural Resources, Construction and Maintenance Occupations
The most common Natural Resources, Construction and Maintenance occupations in Dune Acres are Construction & Extraction (4 | 2.6%), and Installation, Maintenance & Repair (2 | 1.3%).
Natural Resources, Construction and Maintenance Occupations by Sex
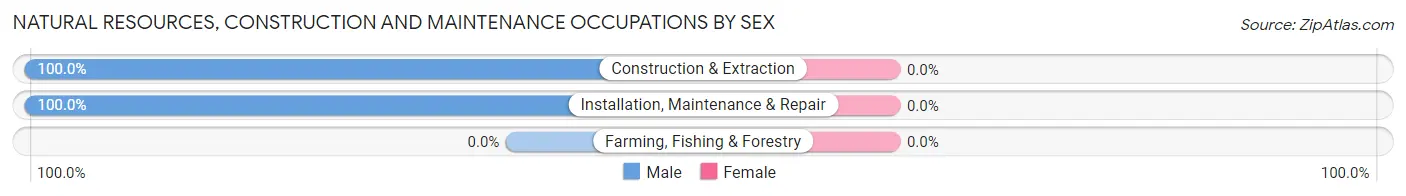
| Occupation | Male | Female |
| Farming, Fishing & Forestry | 0 (0.0%) | 0 (0.0%) |
| Construction & Extraction | 4 (100.0%) | 0 (0.0%) |
| Installation, Maintenance & Repair | 2 (100.0%) | 0 (0.0%) |
| Total (Category) | 6 (100.0%) | 0 (0.0%) |
| Total (Overall) | 90 (57.7%) | 66 (42.3%) |
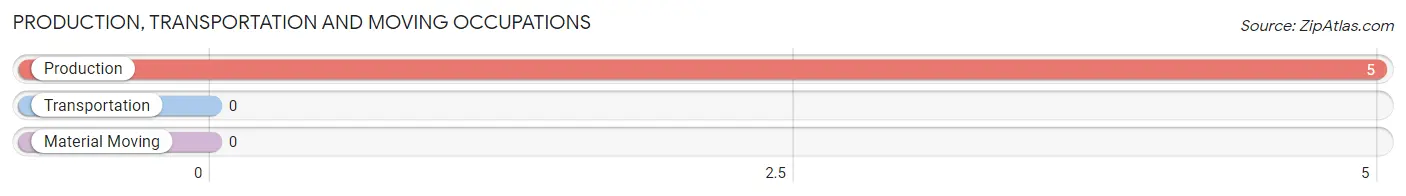
Production, Transportation and Moving Occupations
The most common Production, Transportation and Moving occupations in Dune Acres are , and Production (5 | 3.2%).
Production, Transportation and Moving Occupations by Sex
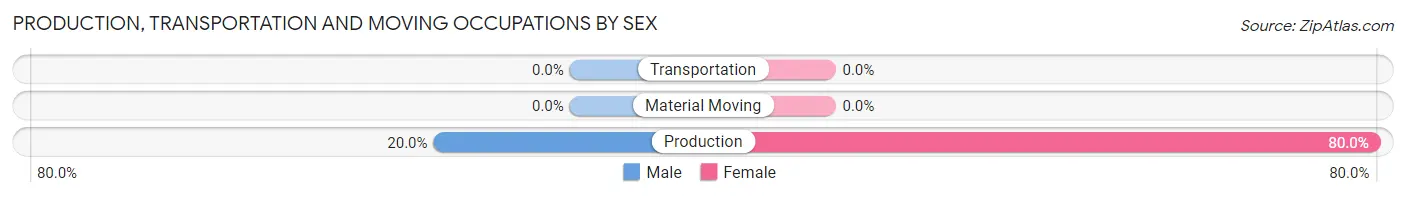
| Occupation | Male | Female |
| Production | 1 (20.0%) | 4 (80.0%) |
| Transportation | 0 (0.0%) | 0 (0.0%) |
| Material Moving | 0 (0.0%) | 0 (0.0%) |
| Total (Category) | 1 (20.0%) | 4 (80.0%) |
| Total (Overall) | 90 (57.7%) | 66 (42.3%) |
Employment Industries by Sex in Dune Acres
Employment Industries in Dune Acres
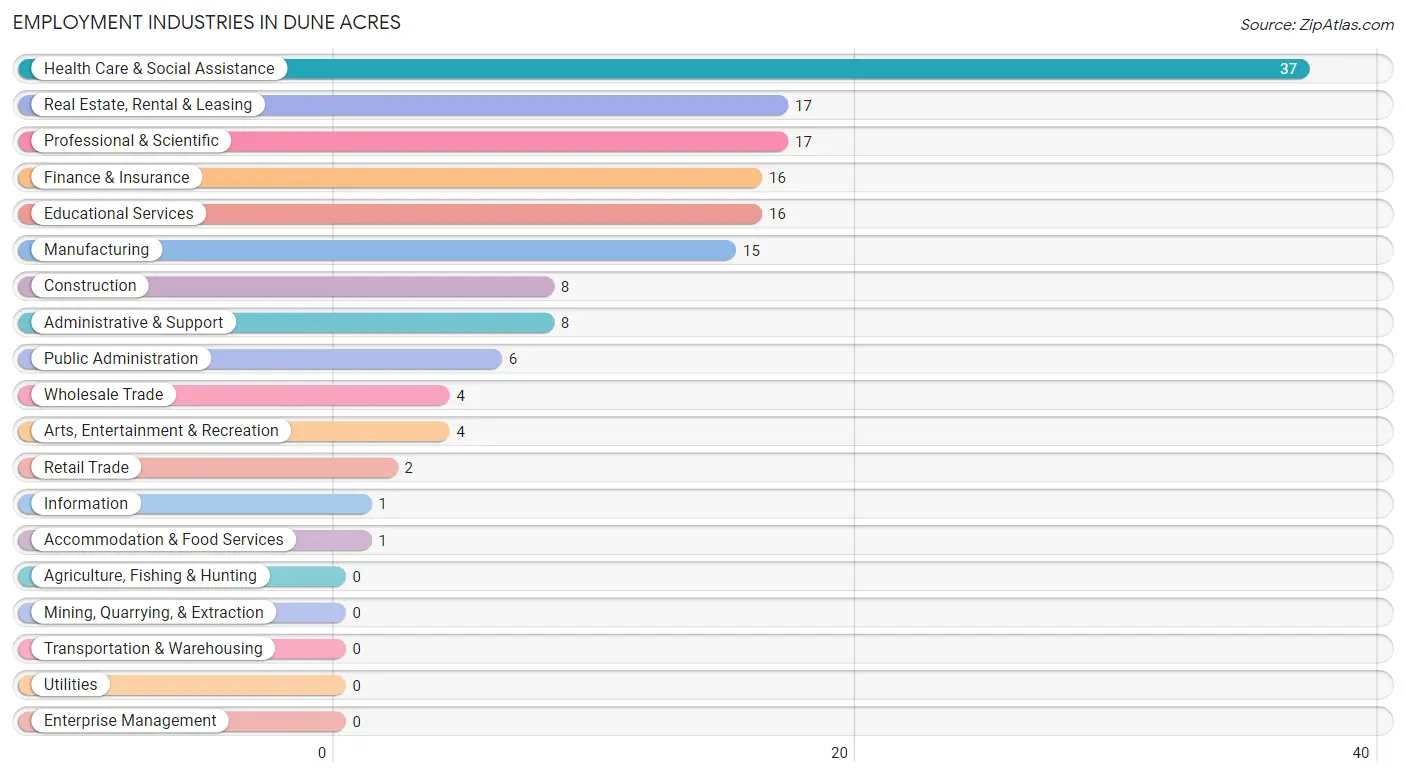
The major employment industries in Dune Acres include Health Care & Social Assistance (37 | 23.7%), Real Estate, Rental & Leasing (17 | 10.9%), Professional & Scientific (17 | 10.9%), Finance & Insurance (16 | 10.3%), and Educational Services (16 | 10.3%).
Employment Industries by Sex in Dune Acres
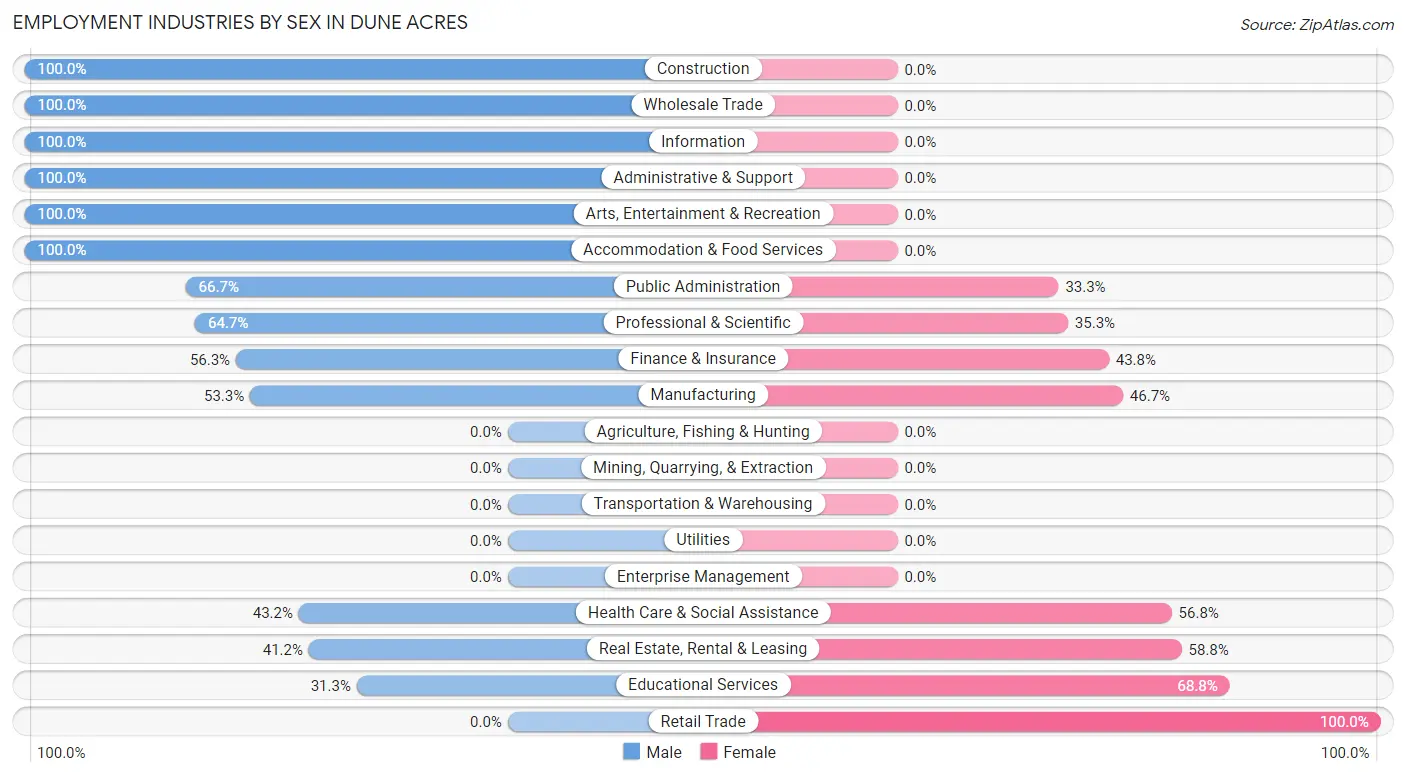
The Dune Acres industries that see more men than women are Construction (100.0%), Wholesale Trade (100.0%), and Information (100.0%), whereas the industries that tend to have a higher number of women are Retail Trade (100.0%), Educational Services (68.8%), and Real Estate, Rental & Leasing (58.8%).
| Industry | Male | Female |
| Agriculture, Fishing & Hunting | 0 (0.0%) | 0 (0.0%) |
| Mining, Quarrying, & Extraction | 0 (0.0%) | 0 (0.0%) |
| Construction | 8 (100.0%) | 0 (0.0%) |
| Manufacturing | 8 (53.3%) | 7 (46.7%) |
| Wholesale Trade | 4 (100.0%) | 0 (0.0%) |
| Retail Trade | 0 (0.0%) | 2 (100.0%) |
| Transportation & Warehousing | 0 (0.0%) | 0 (0.0%) |
| Utilities | 0 (0.0%) | 0 (0.0%) |
| Information | 1 (100.0%) | 0 (0.0%) |
| Finance & Insurance | 9 (56.2%) | 7 (43.8%) |
| Real Estate, Rental & Leasing | 7 (41.2%) | 10 (58.8%) |
| Professional & Scientific | 11 (64.7%) | 6 (35.3%) |
| Enterprise Management | 0 (0.0%) | 0 (0.0%) |
| Administrative & Support | 8 (100.0%) | 0 (0.0%) |
| Educational Services | 5 (31.2%) | 11 (68.8%) |
| Health Care & Social Assistance | 16 (43.2%) | 21 (56.8%) |
| Arts, Entertainment & Recreation | 4 (100.0%) | 0 (0.0%) |
| Accommodation & Food Services | 1 (100.0%) | 0 (0.0%) |
| Public Administration | 4 (66.7%) | 2 (33.3%) |
| Total | 90 (57.7%) | 66 (42.3%) |
Education in Dune Acres
School Enrollment in Dune Acres
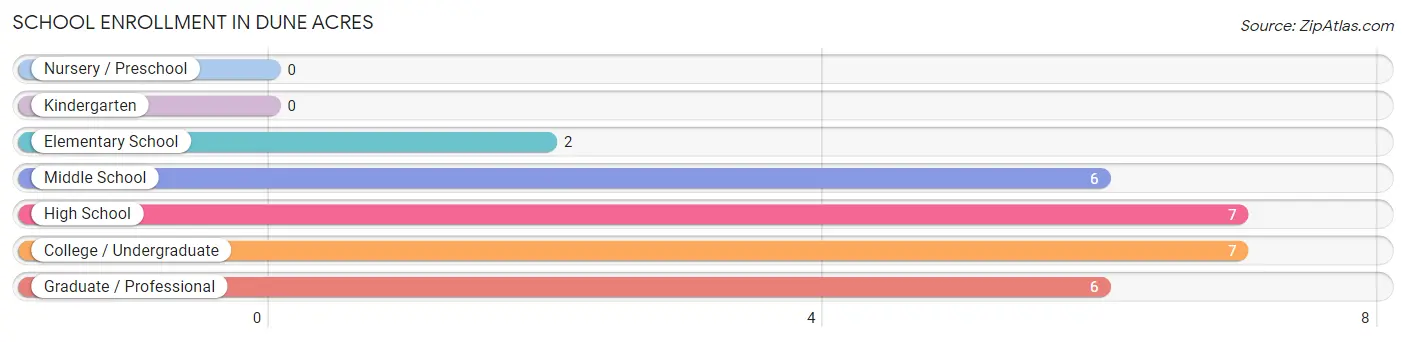
The most common levels of schooling among the 28 students in Dune Acres are high school (7 | 25.0%), college / undergraduate (7 | 25.0%), and middle school (6 | 21.4%).
| School Level | # Students | % Students |
| Nursery / Preschool | 0 | 0.0% |
| Kindergarten | 0 | 0.0% |
| Elementary School | 2 | 7.1% |
| Middle School | 6 | 21.4% |
| High School | 7 | 25.0% |
| College / Undergraduate | 7 | 25.0% |
| Graduate / Professional | 6 | 21.4% |
| Total | 28 | 100.0% |
School Enrollment by Age by Funding Source in Dune Acres
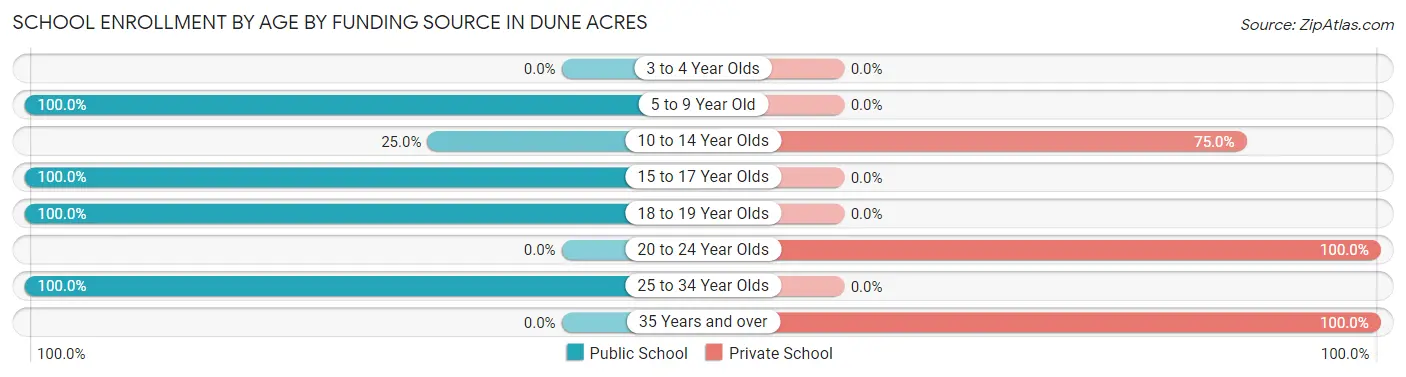
Out of a total of 28 students who are enrolled in schools in Dune Acres, 12 (42.9%) attend a private institution, while the remaining 16 (57.1%) are enrolled in public schools. The age group of 20 to 24 year olds has the highest likelihood of being enrolled in private schools, with 2 (100.0% in the age bracket) enrolled. Conversely, the age group of 5 to 9 year old has the lowest likelihood of being enrolled in a private school, with 2 (100.0% in the age bracket) attending a public institution.
| Age Bracket | Public School | Private School |
| 3 to 4 Year Olds | 0 (0.0%) | 0 (0.0%) |
| 5 to 9 Year Old | 2 (100.0%) | 0 (0.0%) |
| 10 to 14 Year Olds | 1 (25.0%) | 3 (75.0%) |
| 15 to 17 Year Olds | 4 (100.0%) | 0 (0.0%) |
| 18 to 19 Year Olds | 3 (100.0%) | 0 (0.0%) |
| 20 to 24 Year Olds | 0 (0.0%) | 2 (100.0%) |
| 25 to 34 Year Olds | 6 (100.0%) | 0 (0.0%) |
| 35 Years and over | 0 (0.0%) | 7 (100.0%) |
| Total | 16 (57.1%) | 12 (42.9%) |
Educational Attainment by Field of Study in Dune Acres
Business (40 | 18.2%), science & technology (33 | 15.0%), social sciences (27 | 12.3%), bio, nature & agricultural (24 | 10.9%), and education (21 | 9.6%) are the most common fields of study among 220 individuals in Dune Acres who have obtained a bachelor's degree or higher.
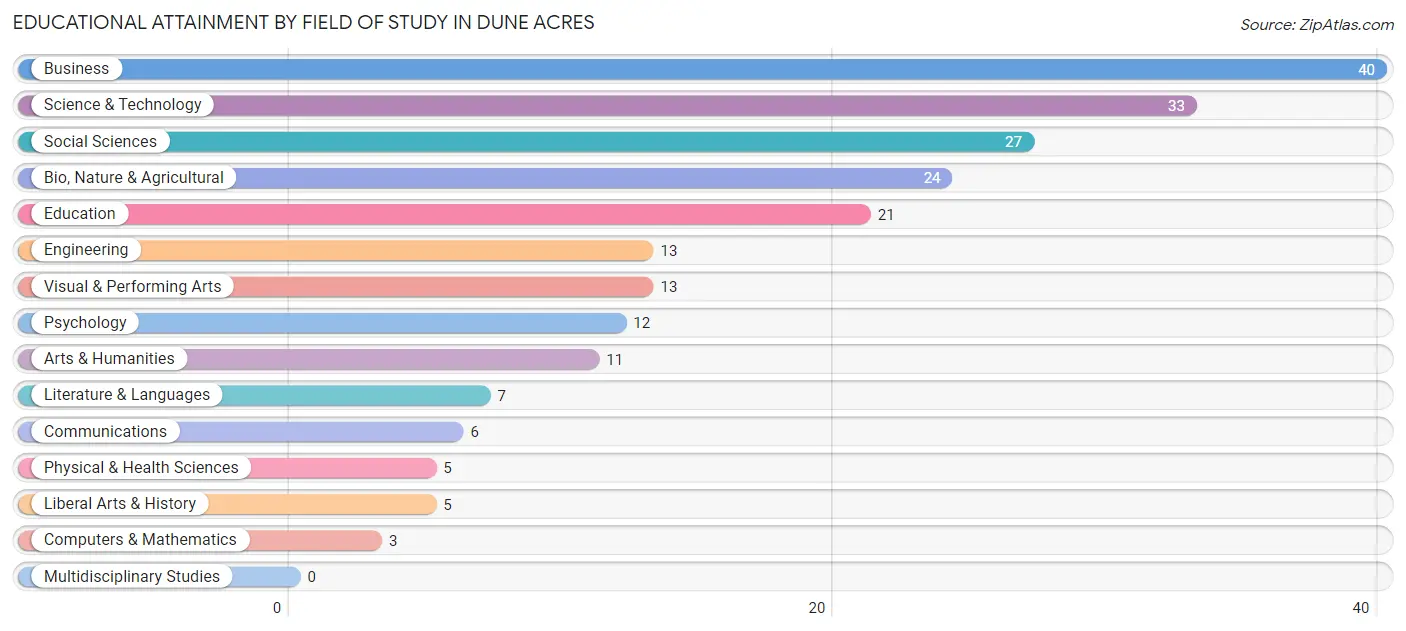
| Field of Study | # Graduates | % Graduates |
| Computers & Mathematics | 3 | 1.4% |
| Bio, Nature & Agricultural | 24 | 10.9% |
| Physical & Health Sciences | 5 | 2.3% |
| Psychology | 12 | 5.4% |
| Social Sciences | 27 | 12.3% |
| Engineering | 13 | 5.9% |
| Multidisciplinary Studies | 0 | 0.0% |
| Science & Technology | 33 | 15.0% |
| Business | 40 | 18.2% |
| Education | 21 | 9.6% |
| Literature & Languages | 7 | 3.2% |
| Liberal Arts & History | 5 | 2.3% |
| Visual & Performing Arts | 13 | 5.9% |
| Communications | 6 | 2.7% |
| Arts & Humanities | 11 | 5.0% |
| Total | 220 | 100.0% |
Transportation & Commute in Dune Acres
Vehicle Availability by Sex in Dune Acres
The most prevalent vehicle ownership categories in Dune Acres are males with 2 vehicles (49, accounting for 54.4%) and females with 2 vehicles (18, making up 76.6%).
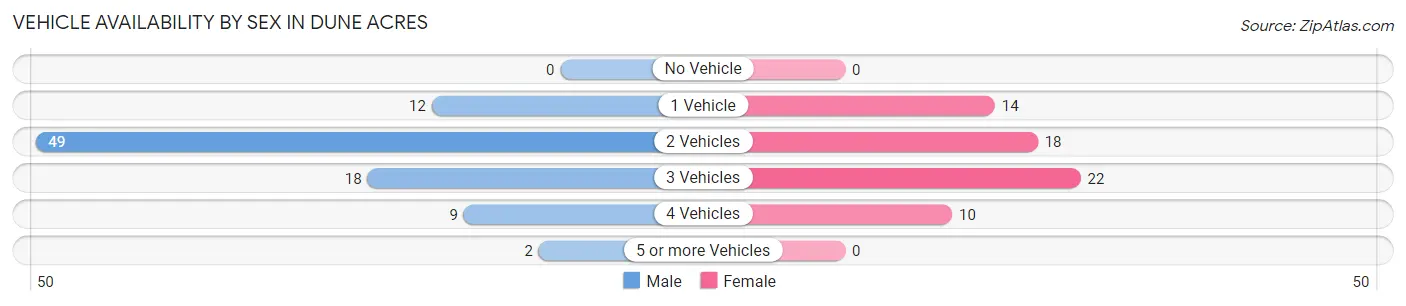
| Vehicles Available | Male | Female |
| No Vehicle | 0 (0.0%) | 0 (0.0%) |
| 1 Vehicle | 12 (13.3%) | 14 (21.9%) |
| 2 Vehicles | 49 (54.4%) | 18 (28.1%) |
| 3 Vehicles | 18 (20.0%) | 22 (34.4%) |
| 4 Vehicles | 9 (10.0%) | 10 (15.6%) |
| 5 or more Vehicles | 2 (2.2%) | 0 (0.0%) |
| Total | 90 (100.0%) | 64 (100.0%) |
Commute Time in Dune Acres
The most frequently occuring commute durations in Dune Acres are 60 to 89 minutes (30 commuters, 26.3%), 20 to 24 minutes (25 commuters, 21.9%), and 25 to 29 minutes (15 commuters, 13.2%).
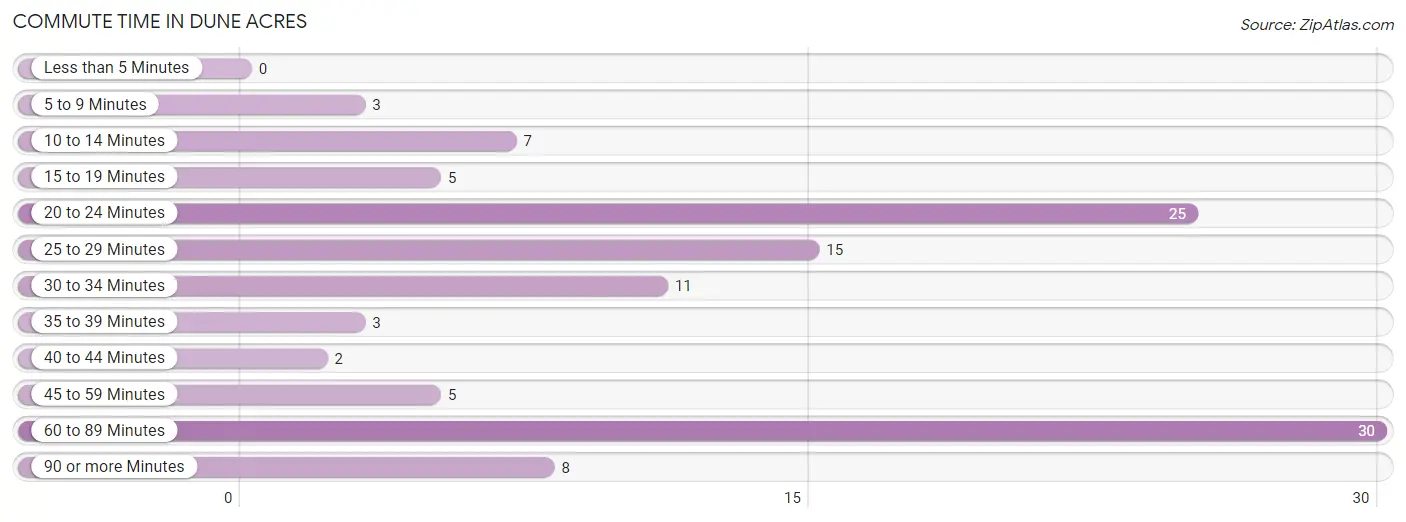
| Commute Time | # Commuters | % Commuters |
| Less than 5 Minutes | 0 | 0.0% |
| 5 to 9 Minutes | 3 | 2.6% |
| 10 to 14 Minutes | 7 | 6.1% |
| 15 to 19 Minutes | 5 | 4.4% |
| 20 to 24 Minutes | 25 | 21.9% |
| 25 to 29 Minutes | 15 | 13.2% |
| 30 to 34 Minutes | 11 | 9.7% |
| 35 to 39 Minutes | 3 | 2.6% |
| 40 to 44 Minutes | 2 | 1.8% |
| 45 to 59 Minutes | 5 | 4.4% |
| 60 to 89 Minutes | 30 | 26.3% |
| 90 or more Minutes | 8 | 7.0% |
Commute Time by Sex in Dune Acres
The most common commute times in Dune Acres are 20 to 24 minutes (15 commuters, 25.0%) for males and 60 to 89 minutes (16 commuters, 29.6%) for females.
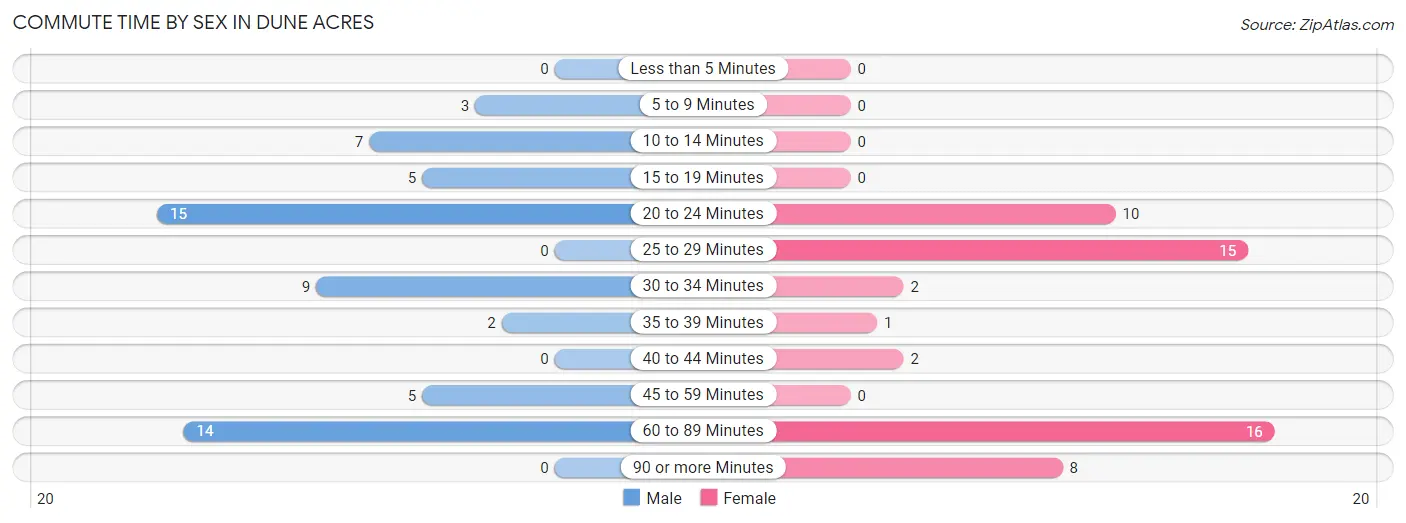
| Commute Time | Male | Female |
| Less than 5 Minutes | 0 (0.0%) | 0 (0.0%) |
| 5 to 9 Minutes | 3 (5.0%) | 0 (0.0%) |
| 10 to 14 Minutes | 7 (11.7%) | 0 (0.0%) |
| 15 to 19 Minutes | 5 (8.3%) | 0 (0.0%) |
| 20 to 24 Minutes | 15 (25.0%) | 10 (18.5%) |
| 25 to 29 Minutes | 0 (0.0%) | 15 (27.8%) |
| 30 to 34 Minutes | 9 (15.0%) | 2 (3.7%) |
| 35 to 39 Minutes | 2 (3.3%) | 1 (1.8%) |
| 40 to 44 Minutes | 0 (0.0%) | 2 (3.7%) |
| 45 to 59 Minutes | 5 (8.3%) | 0 (0.0%) |
| 60 to 89 Minutes | 14 (23.3%) | 16 (29.6%) |
| 90 or more Minutes | 0 (0.0%) | 8 (14.8%) |
Time of Departure to Work by Sex in Dune Acres
The most frequent times of departure to work in Dune Acres are 8:00 AM to 8:29 AM (16, 26.7%) for males and 6:30 AM to 6:59 AM (25, 46.3%) for females.
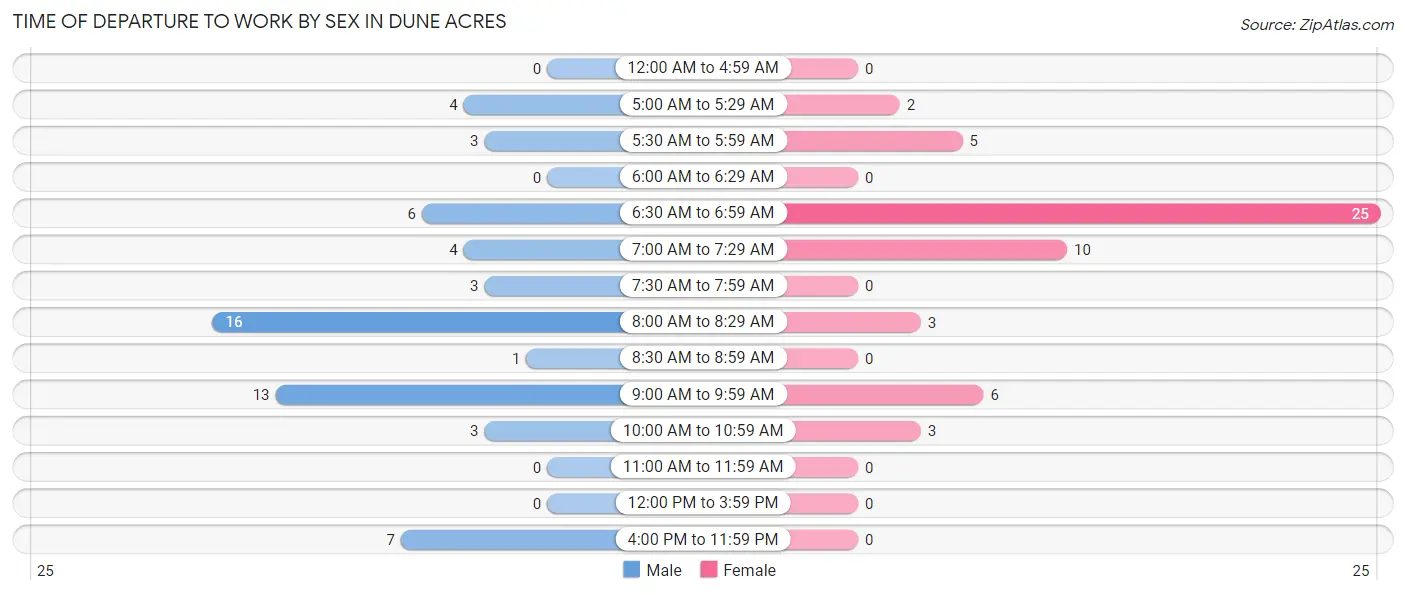
| Time of Departure | Male | Female |
| 12:00 AM to 4:59 AM | 0 (0.0%) | 0 (0.0%) |
| 5:00 AM to 5:29 AM | 4 (6.7%) | 2 (3.7%) |
| 5:30 AM to 5:59 AM | 3 (5.0%) | 5 (9.3%) |
| 6:00 AM to 6:29 AM | 0 (0.0%) | 0 (0.0%) |
| 6:30 AM to 6:59 AM | 6 (10.0%) | 25 (46.3%) |
| 7:00 AM to 7:29 AM | 4 (6.7%) | 10 (18.5%) |
| 7:30 AM to 7:59 AM | 3 (5.0%) | 0 (0.0%) |
| 8:00 AM to 8:29 AM | 16 (26.7%) | 3 (5.6%) |
| 8:30 AM to 8:59 AM | 1 (1.7%) | 0 (0.0%) |
| 9:00 AM to 9:59 AM | 13 (21.7%) | 6 (11.1%) |
| 10:00 AM to 10:59 AM | 3 (5.0%) | 3 (5.6%) |
| 11:00 AM to 11:59 AM | 0 (0.0%) | 0 (0.0%) |
| 12:00 PM to 3:59 PM | 0 (0.0%) | 0 (0.0%) |
| 4:00 PM to 11:59 PM | 7 (11.7%) | 0 (0.0%) |
| Total | 60 (100.0%) | 54 (100.0%) |
Housing Occupancy in Dune Acres
Occupancy by Ownership in Dune Acres
Of the total 143 dwellings in Dune Acres, owner-occupied units account for 134 (93.7%), while renter-occupied units make up 9 (6.3%).
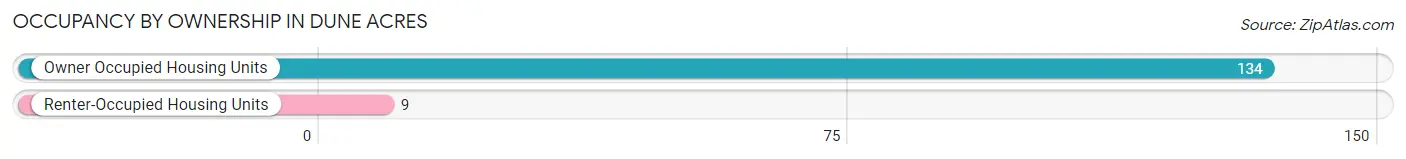
| Occupancy | # Housing Units | % Housing Units |
| Owner Occupied Housing Units | 134 | 93.7% |
| Renter-Occupied Housing Units | 9 | 6.3% |
| Total Occupied Housing Units | 143 | 100.0% |
Occupancy by Household Size in Dune Acres
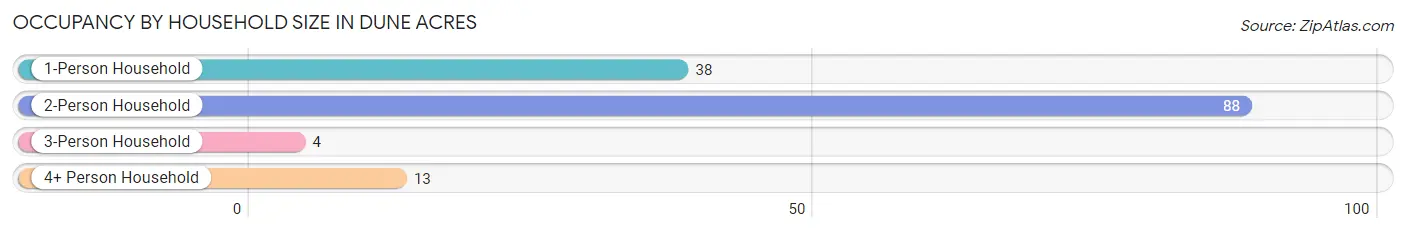
| Household Size | # Housing Units | % Housing Units |
| 1-Person Household | 38 | 26.6% |
| 2-Person Household | 88 | 61.5% |
| 3-Person Household | 4 | 2.8% |
| 4+ Person Household | 13 | 9.1% |
| Total Housing Units | 143 | 100.0% |
Occupancy by Ownership by Household Size in Dune Acres
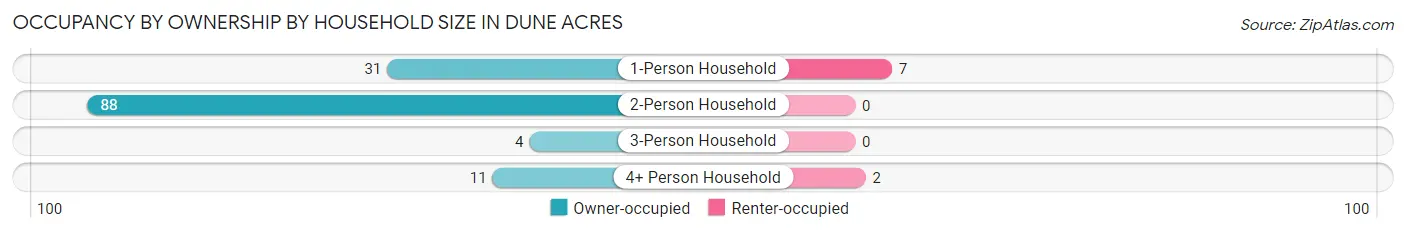
| Household Size | Owner-occupied | Renter-occupied |
| 1-Person Household | 31 (81.6%) | 7 (18.4%) |
| 2-Person Household | 88 (100.0%) | 0 (0.0%) |
| 3-Person Household | 4 (100.0%) | 0 (0.0%) |
| 4+ Person Household | 11 (84.6%) | 2 (15.4%) |
| Total Housing Units | 134 (93.7%) | 9 (6.3%) |
Occupancy by Educational Attainment in Dune Acres
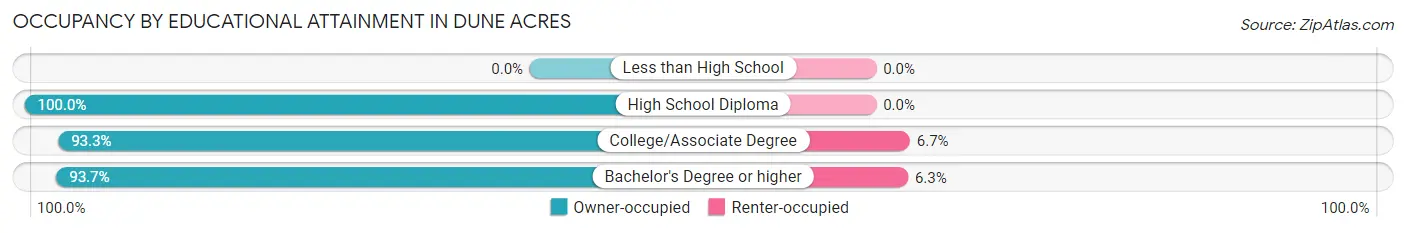
| Household Size | Owner-occupied | Renter-occupied |
| Less than High School | 0 (0.0%) | 0 (0.0%) |
| High School Diploma | 1 (100.0%) | 0 (0.0%) |
| College/Associate Degree | 14 (93.3%) | 1 (6.7%) |
| Bachelor's Degree or higher | 119 (93.7%) | 8 (6.3%) |
Occupancy by Age of Householder in Dune Acres
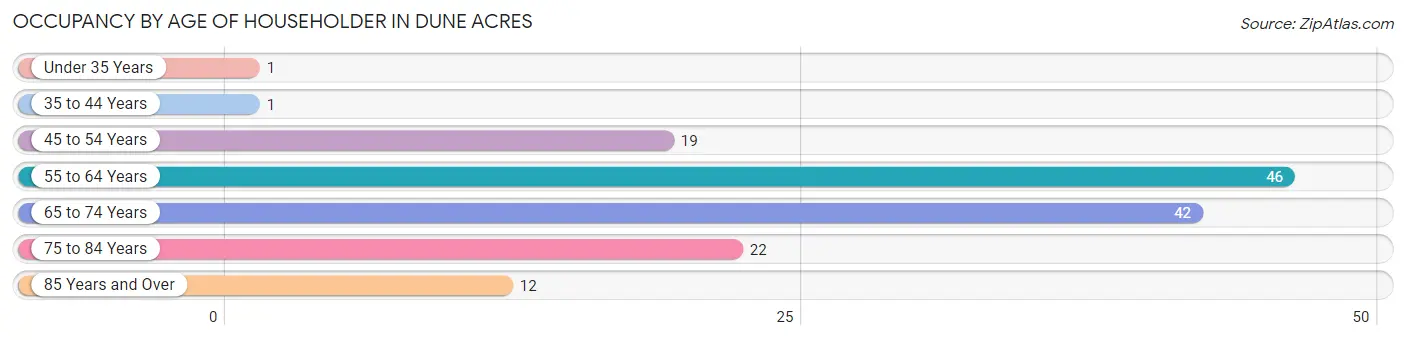
| Age Bracket | # Households | % Households |
| Under 35 Years | 1 | 0.7% |
| 35 to 44 Years | 1 | 0.7% |
| 45 to 54 Years | 19 | 13.3% |
| 55 to 64 Years | 46 | 32.2% |
| 65 to 74 Years | 42 | 29.4% |
| 75 to 84 Years | 22 | 15.4% |
| 85 Years and Over | 12 | 8.4% |
| Total | 143 | 100.0% |
Housing Finances in Dune Acres
Median Income by Occupancy in Dune Acres
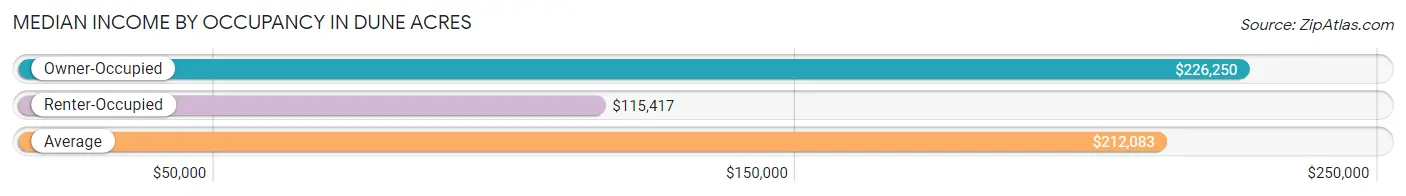
| Occupancy Type | # Households | Median Income |
| Owner-Occupied | 134 (93.7%) | $226,250 |
| Renter-Occupied | 9 (6.3%) | $115,417 |
| Average | 143 (100.0%) | $212,083 |
Occupancy by Householder Income Bracket in Dune Acres
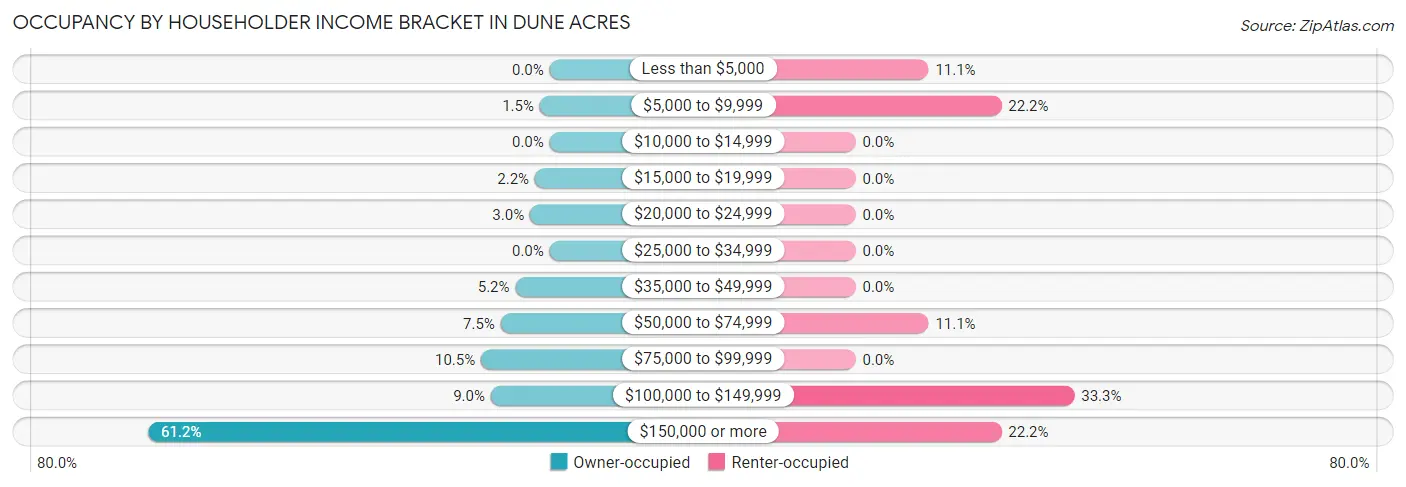
| Income Bracket | Owner-occupied | Renter-occupied |
| Less than $5,000 | 0 (0.0%) | 1 (11.1%) |
| $5,000 to $9,999 | 2 (1.5%) | 2 (22.2%) |
| $10,000 to $14,999 | 0 (0.0%) | 0 (0.0%) |
| $15,000 to $19,999 | 3 (2.2%) | 0 (0.0%) |
| $20,000 to $24,999 | 4 (3.0%) | 0 (0.0%) |
| $25,000 to $34,999 | 0 (0.0%) | 0 (0.0%) |
| $35,000 to $49,999 | 7 (5.2%) | 0 (0.0%) |
| $50,000 to $74,999 | 10 (7.5%) | 1 (11.1%) |
| $75,000 to $99,999 | 14 (10.4%) | 0 (0.0%) |
| $100,000 to $149,999 | 12 (9.0%) | 3 (33.3%) |
| $150,000 or more | 82 (61.2%) | 2 (22.2%) |
| Total | 134 (100.0%) | 9 (100.0%) |
Monthly Housing Cost Tiers in Dune Acres
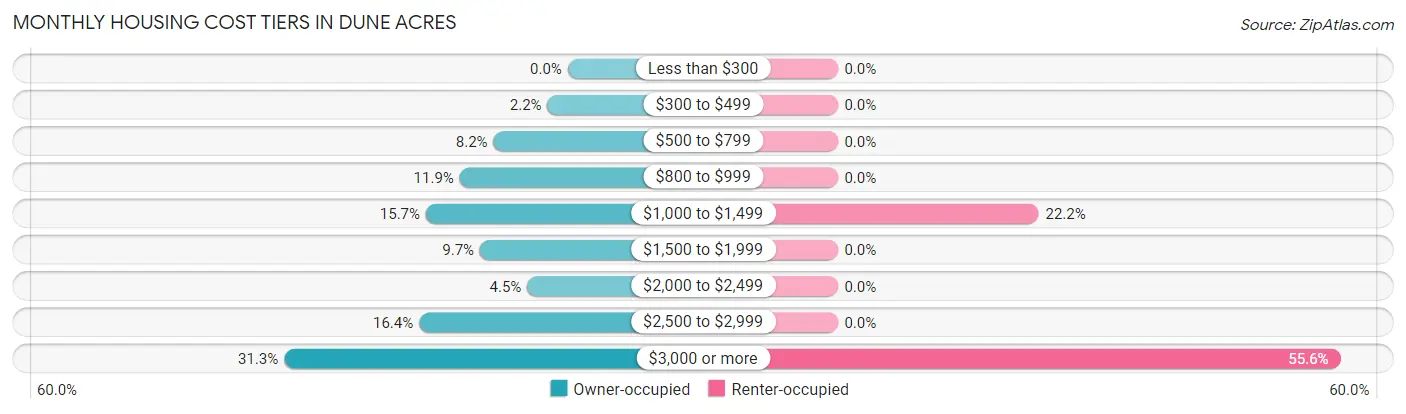
| Monthly Cost | Owner-occupied | Renter-occupied |
| Less than $300 | 0 (0.0%) | 0 (0.0%) |
| $300 to $499 | 3 (2.2%) | 0 (0.0%) |
| $500 to $799 | 11 (8.2%) | 0 (0.0%) |
| $800 to $999 | 16 (11.9%) | 0 (0.0%) |
| $1,000 to $1,499 | 21 (15.7%) | 2 (22.2%) |
| $1,500 to $1,999 | 13 (9.7%) | 0 (0.0%) |
| $2,000 to $2,499 | 6 (4.5%) | 0 (0.0%) |
| $2,500 to $2,999 | 22 (16.4%) | 0 (0.0%) |
| $3,000 or more | 42 (31.3%) | 5 (55.6%) |
| Total | 134 (100.0%) | 9 (100.0%) |
Physical Housing Characteristics in Dune Acres
Housing Structures in Dune Acres
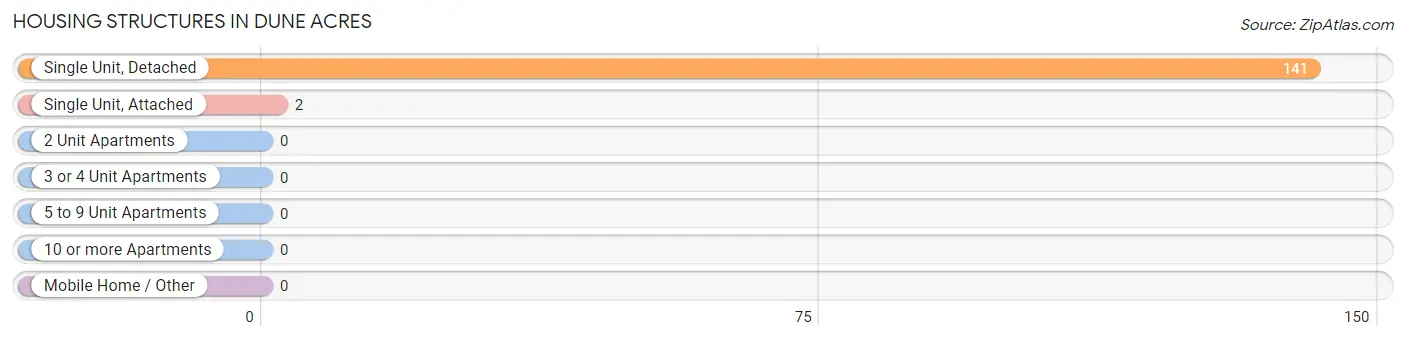
| Structure Type | # Housing Units | % Housing Units |
| Single Unit, Detached | 141 | 98.6% |
| Single Unit, Attached | 2 | 1.4% |
| 2 Unit Apartments | 0 | 0.0% |
| 3 or 4 Unit Apartments | 0 | 0.0% |
| 5 to 9 Unit Apartments | 0 | 0.0% |
| 10 or more Apartments | 0 | 0.0% |
| Mobile Home / Other | 0 | 0.0% |
| Total | 143 | 100.0% |
Housing Structures by Occupancy in Dune Acres
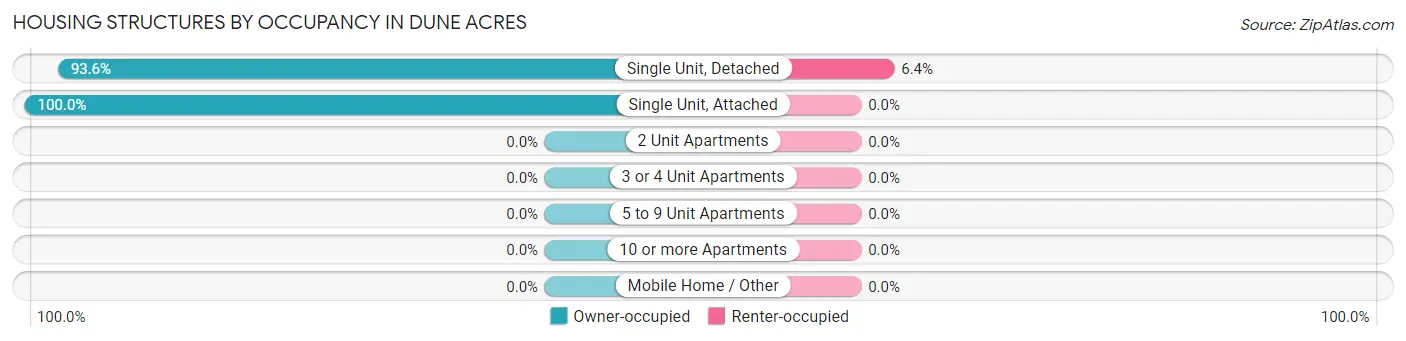
| Structure Type | Owner-occupied | Renter-occupied |
| Single Unit, Detached | 132 (93.6%) | 9 (6.4%) |
| Single Unit, Attached | 2 (100.0%) | 0 (0.0%) |
| 2 Unit Apartments | 0 (0.0%) | 0 (0.0%) |
| 3 or 4 Unit Apartments | 0 (0.0%) | 0 (0.0%) |
| 5 to 9 Unit Apartments | 0 (0.0%) | 0 (0.0%) |
| 10 or more Apartments | 0 (0.0%) | 0 (0.0%) |
| Mobile Home / Other | 0 (0.0%) | 0 (0.0%) |
| Total | 134 (93.7%) | 9 (6.3%) |
Housing Structures by Number of Rooms in Dune Acres
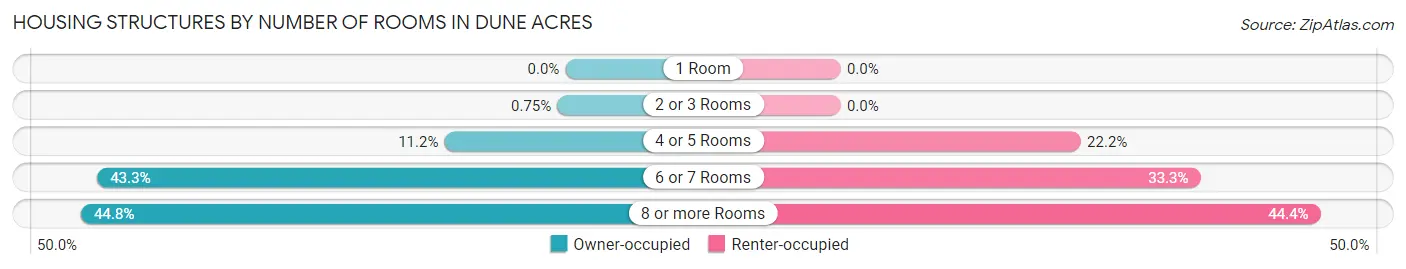
| Number of Rooms | Owner-occupied | Renter-occupied |
| 1 Room | 0 (0.0%) | 0 (0.0%) |
| 2 or 3 Rooms | 1 (0.7%) | 0 (0.0%) |
| 4 or 5 Rooms | 15 (11.2%) | 2 (22.2%) |
| 6 or 7 Rooms | 58 (43.3%) | 3 (33.3%) |
| 8 or more Rooms | 60 (44.8%) | 4 (44.4%) |
| Total | 134 (100.0%) | 9 (100.0%) |
Housing Structure by Heating Type in Dune Acres
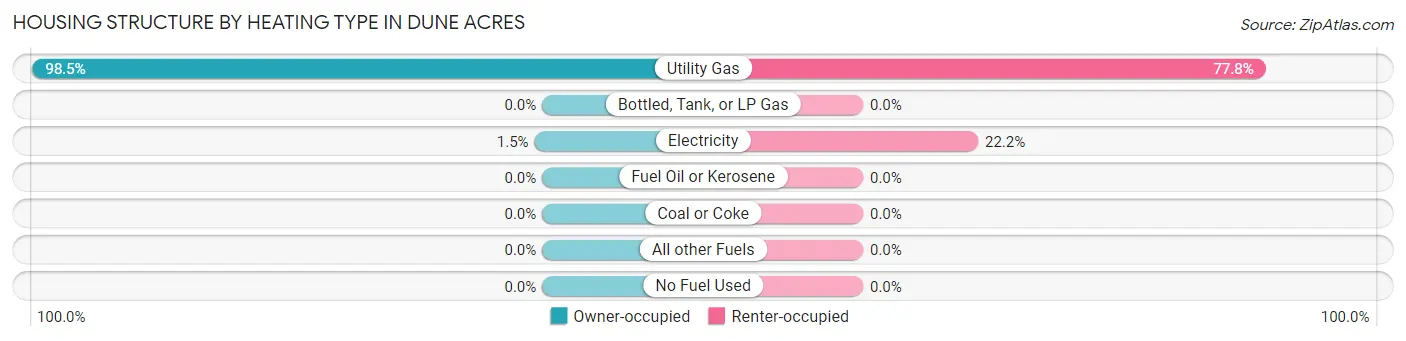
| Heating Type | Owner-occupied | Renter-occupied |
| Utility Gas | 132 (98.5%) | 7 (77.8%) |
| Bottled, Tank, or LP Gas | 0 (0.0%) | 0 (0.0%) |
| Electricity | 2 (1.5%) | 2 (22.2%) |
| Fuel Oil or Kerosene | 0 (0.0%) | 0 (0.0%) |
| Coal or Coke | 0 (0.0%) | 0 (0.0%) |
| All other Fuels | 0 (0.0%) | 0 (0.0%) |
| No Fuel Used | 0 (0.0%) | 0 (0.0%) |
| Total | 134 (100.0%) | 9 (100.0%) |
Household Vehicle Usage in Dune Acres
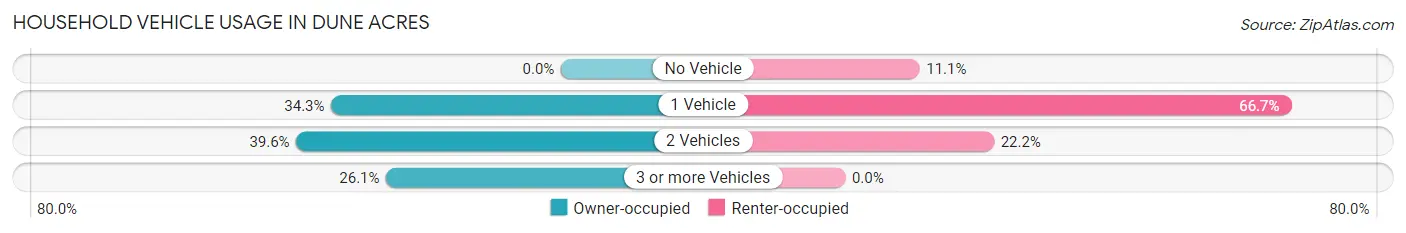
| Vehicles per Household | Owner-occupied | Renter-occupied |
| No Vehicle | 0 (0.0%) | 1 (11.1%) |
| 1 Vehicle | 46 (34.3%) | 6 (66.7%) |
| 2 Vehicles | 53 (39.6%) | 2 (22.2%) |
| 3 or more Vehicles | 35 (26.1%) | 0 (0.0%) |
| Total | 134 (100.0%) | 9 (100.0%) |
Real Estate & Mortgages in Dune Acres
Real Estate and Mortgage Overview in Dune Acres
| Characteristic | Without Mortgage | With Mortgage |
| Housing Units | 46 | 88 |
| Median Property Value | $650,000 | $666,700 |
| Median Household Income | $240,000 | $56 |
| Monthly Housing Costs | $950 | $40 |
| Real Estate Taxes | $6,607 | $2 |
Property Value by Mortgage Status in Dune Acres
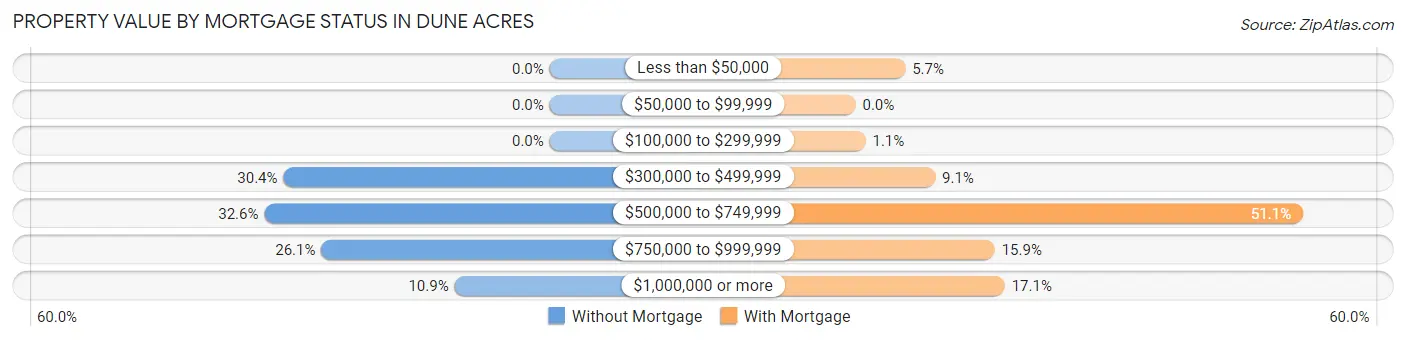
| Property Value | Without Mortgage | With Mortgage |
| Less than $50,000 | 0 (0.0%) | 5 (5.7%) |
| $50,000 to $99,999 | 0 (0.0%) | 0 (0.0%) |
| $100,000 to $299,999 | 0 (0.0%) | 1 (1.1%) |
| $300,000 to $499,999 | 14 (30.4%) | 8 (9.1%) |
| $500,000 to $749,999 | 15 (32.6%) | 45 (51.1%) |
| $750,000 to $999,999 | 12 (26.1%) | 14 (15.9%) |
| $1,000,000 or more | 5 (10.9%) | 15 (17.1%) |
| Total | 46 (100.0%) | 88 (100.0%) |
Household Income by Mortgage Status in Dune Acres
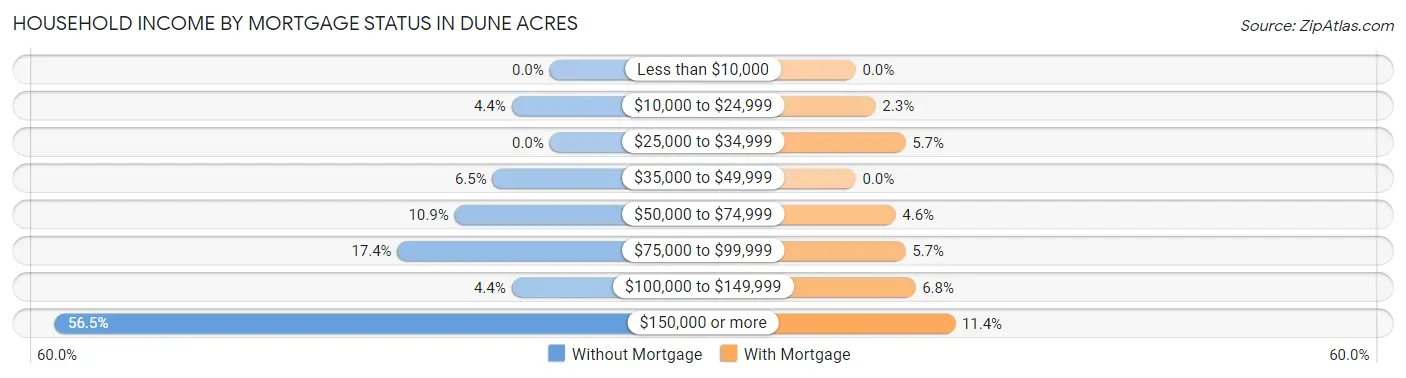
| Household Income | Without Mortgage | With Mortgage |
| Less than $10,000 | 0 (0.0%) | 0 (0.0%) |
| $10,000 to $24,999 | 2 (4.3%) | 2 (2.3%) |
| $25,000 to $34,999 | 0 (0.0%) | 5 (5.7%) |
| $35,000 to $49,999 | 3 (6.5%) | 0 (0.0%) |
| $50,000 to $74,999 | 5 (10.9%) | 4 (4.5%) |
| $75,000 to $99,999 | 8 (17.4%) | 5 (5.7%) |
| $100,000 to $149,999 | 2 (4.3%) | 6 (6.8%) |
| $150,000 or more | 26 (56.5%) | 10 (11.4%) |
| Total | 46 (100.0%) | 88 (100.0%) |
Property Value to Household Income Ratio in Dune Acres
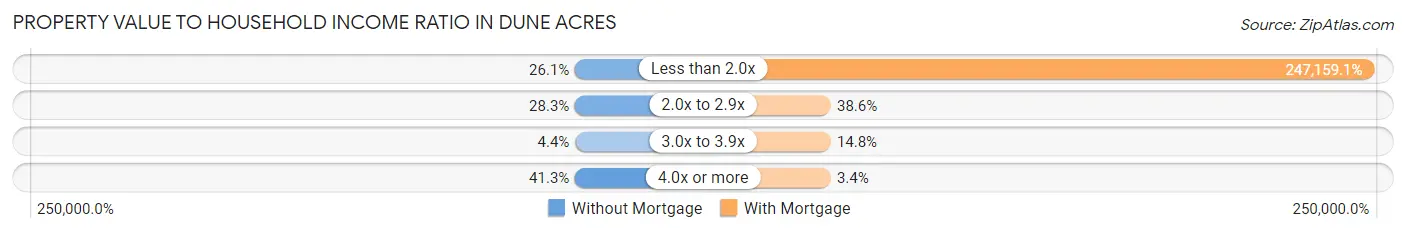
| Value-to-Income Ratio | Without Mortgage | With Mortgage |
| Less than 2.0x | 12 (26.1%) | 217,500 (247,159.1%) |
| 2.0x to 2.9x | 13 (28.3%) | 34 (38.6%) |
| 3.0x to 3.9x | 2 (4.3%) | 13 (14.8%) |
| 4.0x or more | 19 (41.3%) | 3 (3.4%) |
| Total | 46 (100.0%) | 88 (100.0%) |
Real Estate Taxes by Mortgage Status in Dune Acres
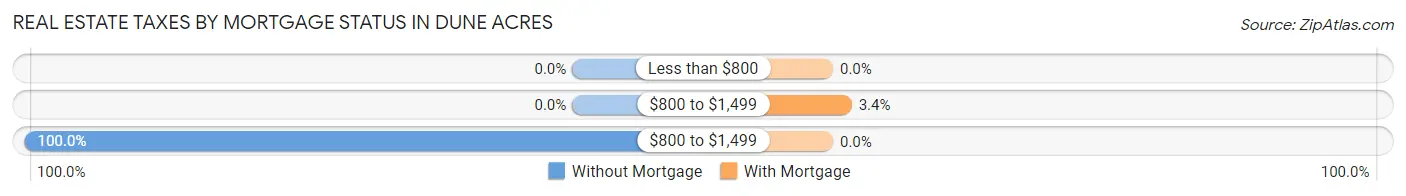
| Property Taxes | Without Mortgage | With Mortgage |
| Less than $800 | 0 (0.0%) | 0 (0.0%) |
| $800 to $1,499 | 0 (0.0%) | 3 (3.4%) |
| $800 to $1,499 | 46 (100.0%) | 0 (0.0%) |
| Total | 46 (100.0%) | 88 (100.0%) |
Health & Disability in Dune Acres
Health Insurance Coverage by Age in Dune Acres
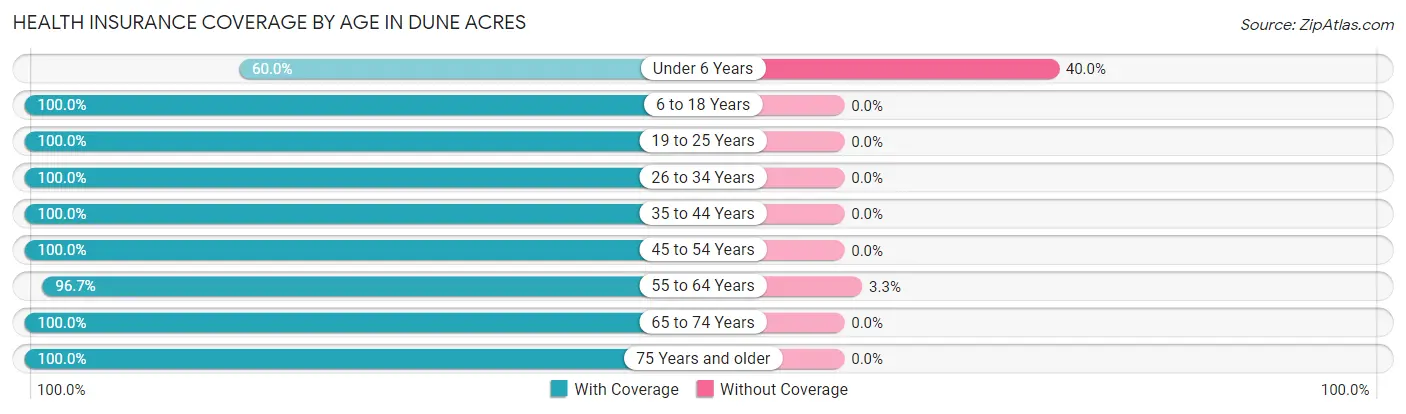
| Age Bracket | With Coverage | Without Coverage |
| Under 6 Years | 3 (60.0%) | 2 (40.0%) |
| 6 to 18 Years | 13 (100.0%) | 0 (0.0%) |
| 19 to 25 Years | 6 (100.0%) | 0 (0.0%) |
| 26 to 34 Years | 23 (100.0%) | 0 (0.0%) |
| 35 to 44 Years | 6 (100.0%) | 0 (0.0%) |
| 45 to 54 Years | 43 (100.0%) | 0 (0.0%) |
| 55 to 64 Years | 87 (96.7%) | 3 (3.3%) |
| 65 to 74 Years | 56 (100.0%) | 0 (0.0%) |
| 75 Years and older | 51 (100.0%) | 0 (0.0%) |
| Total | 288 (98.3%) | 5 (1.7%) |
Health Insurance Coverage by Citizenship Status in Dune Acres

| Citizenship Status | With Coverage | Without Coverage |
| Native Born | 3 (60.0%) | 2 (40.0%) |
| Foreign Born, Citizen | 13 (100.0%) | 0 (0.0%) |
| Foreign Born, not a Citizen | 6 (100.0%) | 0 (0.0%) |
Health Insurance Coverage by Household Income in Dune Acres
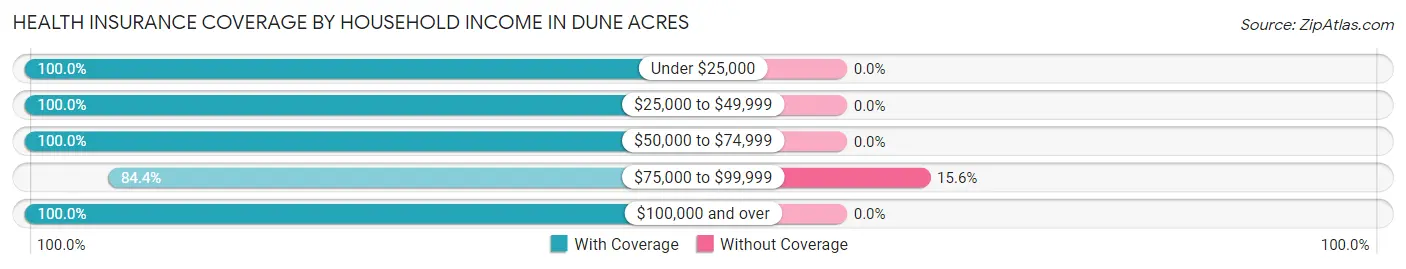
| Household Income | With Coverage | Without Coverage |
| Under $25,000 | 14 (100.0%) | 0 (0.0%) |
| $25,000 to $49,999 | 10 (100.0%) | 0 (0.0%) |
| $50,000 to $74,999 | 16 (100.0%) | 0 (0.0%) |
| $75,000 to $99,999 | 27 (84.4%) | 5 (15.6%) |
| $100,000 and over | 221 (100.0%) | 0 (0.0%) |
Public vs Private Health Insurance Coverage by Age in Dune Acres
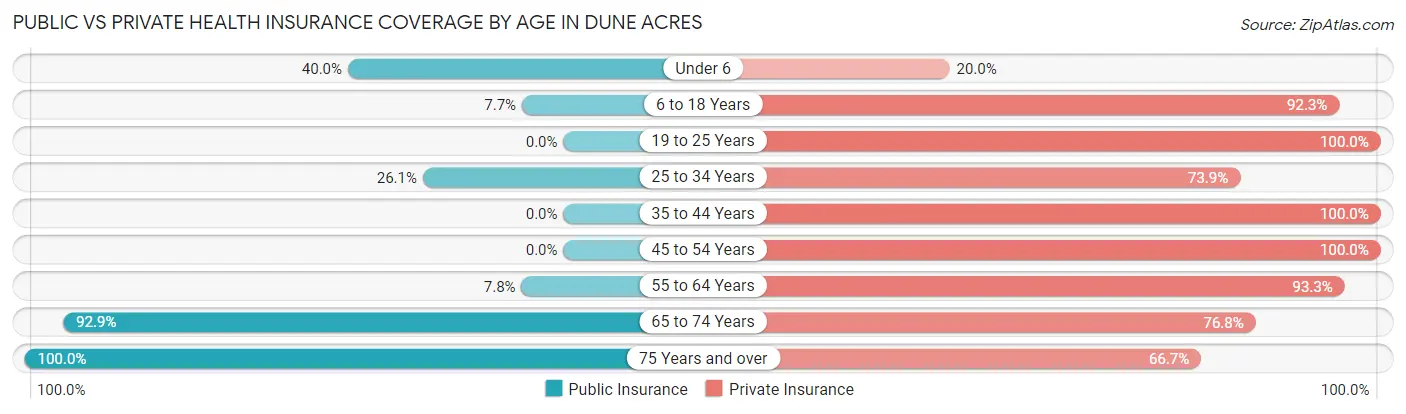
| Age Bracket | Public Insurance | Private Insurance |
| Under 6 | 2 (40.0%) | 1 (20.0%) |
| 6 to 18 Years | 1 (7.7%) | 12 (92.3%) |
| 19 to 25 Years | 0 (0.0%) | 6 (100.0%) |
| 25 to 34 Years | 6 (26.1%) | 17 (73.9%) |
| 35 to 44 Years | 0 (0.0%) | 6 (100.0%) |
| 45 to 54 Years | 0 (0.0%) | 43 (100.0%) |
| 55 to 64 Years | 7 (7.8%) | 84 (93.3%) |
| 65 to 74 Years | 52 (92.9%) | 43 (76.8%) |
| 75 Years and over | 51 (100.0%) | 34 (66.7%) |
| Total | 119 (40.6%) | 246 (84.0%) |
Disability Status by Sex by Age in Dune Acres
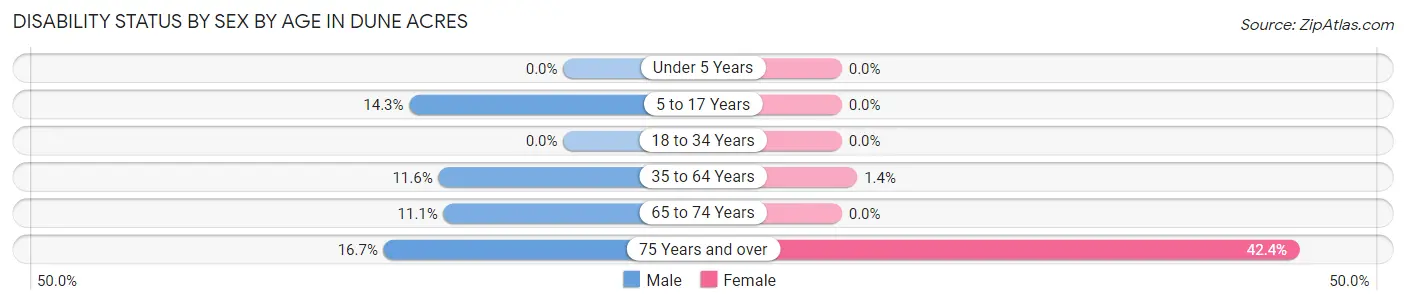
| Age Bracket | Male | Female |
| Under 5 Years | 0 (0.0%) | 0 (0.0%) |
| 5 to 17 Years | 1 (14.3%) | 0 (0.0%) |
| 18 to 34 Years | 0 (0.0%) | 0 (0.0%) |
| 35 to 64 Years | 8 (11.6%) | 1 (1.4%) |
| 65 to 74 Years | 4 (11.1%) | 0 (0.0%) |
| 75 Years and over | 3 (16.7%) | 14 (42.4%) |
Disability Class by Sex by Age in Dune Acres
Disability Class: Hearing Difficulty
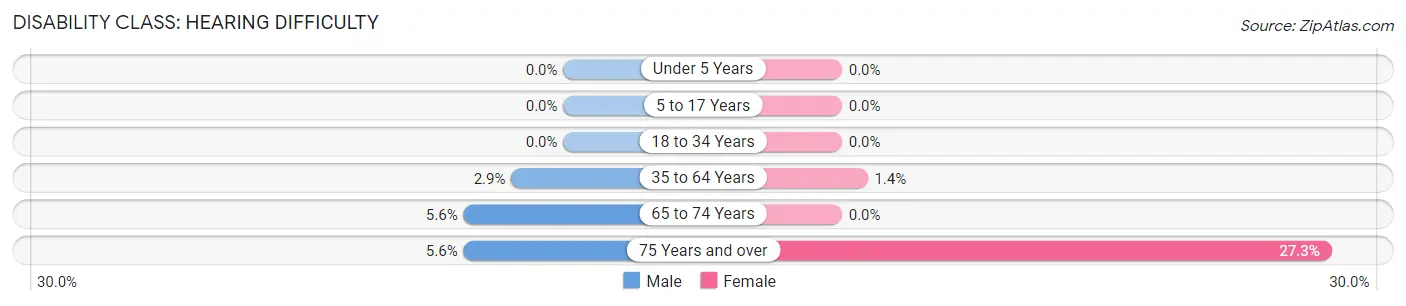
| Age Bracket | Male | Female |
| Under 5 Years | 0 (0.0%) | 0 (0.0%) |
| 5 to 17 Years | 0 (0.0%) | 0 (0.0%) |
| 18 to 34 Years | 0 (0.0%) | 0 (0.0%) |
| 35 to 64 Years | 2 (2.9%) | 1 (1.4%) |
| 65 to 74 Years | 2 (5.6%) | 0 (0.0%) |
| 75 Years and over | 1 (5.6%) | 9 (27.3%) |
Disability Class: Vision Difficulty
| Age Bracket | Male | Female |
| Under 5 Years | 0 (0.0%) | 0 (0.0%) |
| 5 to 17 Years | 0 (0.0%) | 0 (0.0%) |
| 18 to 34 Years | 0 (0.0%) | 0 (0.0%) |
| 35 to 64 Years | 0 (0.0%) | 0 (0.0%) |
| 65 to 74 Years | 0 (0.0%) | 0 (0.0%) |
| 75 Years and over | 0 (0.0%) | 0 (0.0%) |
Disability Class: Cognitive Difficulty
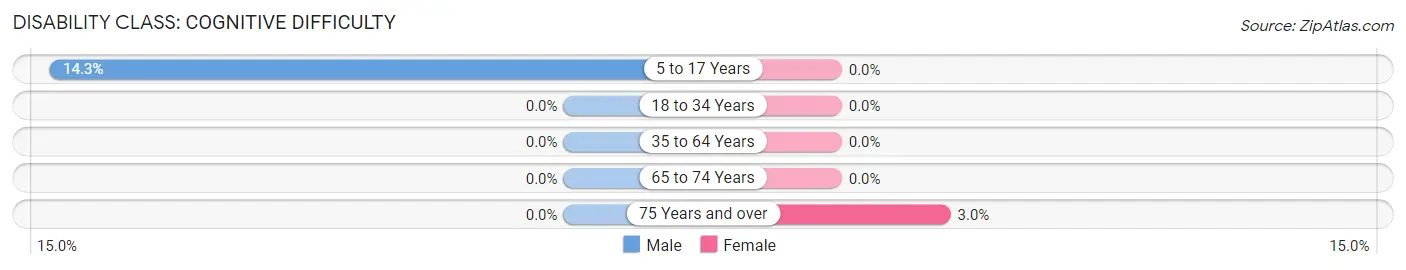
| Age Bracket | Male | Female |
| 5 to 17 Years | 1 (14.3%) | 0 (0.0%) |
| 18 to 34 Years | 0 (0.0%) | 0 (0.0%) |
| 35 to 64 Years | 0 (0.0%) | 0 (0.0%) |
| 65 to 74 Years | 0 (0.0%) | 0 (0.0%) |
| 75 Years and over | 0 (0.0%) | 1 (3.0%) |
Disability Class: Ambulatory Difficulty
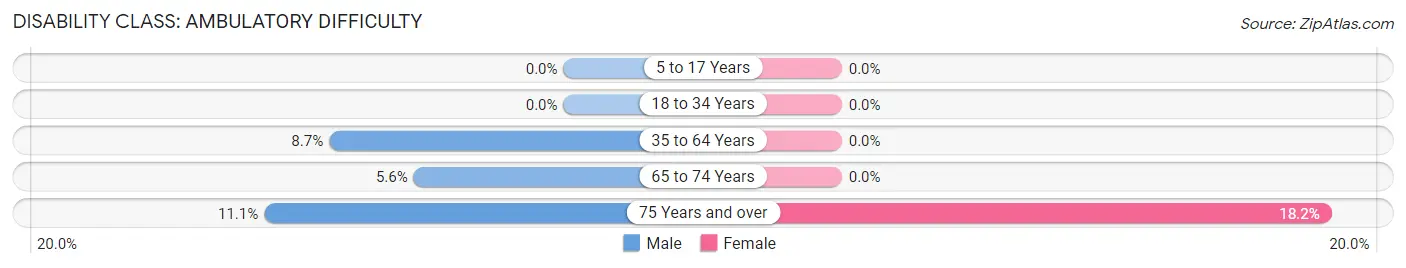
| Age Bracket | Male | Female |
| 5 to 17 Years | 0 (0.0%) | 0 (0.0%) |
| 18 to 34 Years | 0 (0.0%) | 0 (0.0%) |
| 35 to 64 Years | 6 (8.7%) | 0 (0.0%) |
| 65 to 74 Years | 2 (5.6%) | 0 (0.0%) |
| 75 Years and over | 2 (11.1%) | 6 (18.2%) |
Disability Class: Self-Care Difficulty
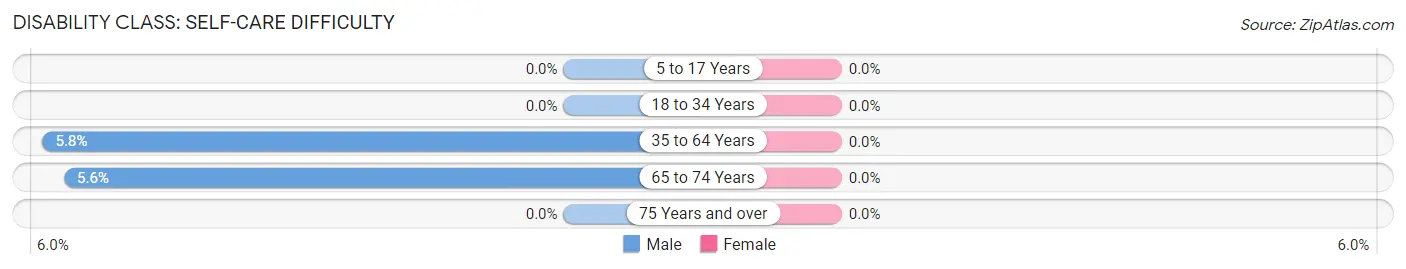
| Age Bracket | Male | Female |
| 5 to 17 Years | 0 (0.0%) | 0 (0.0%) |
| 18 to 34 Years | 0 (0.0%) | 0 (0.0%) |
| 35 to 64 Years | 4 (5.8%) | 0 (0.0%) |
| 65 to 74 Years | 2 (5.6%) | 0 (0.0%) |
| 75 Years and over | 0 (0.0%) | 0 (0.0%) |
Technology Access in Dune Acres
Computing Device Access in Dune Acres
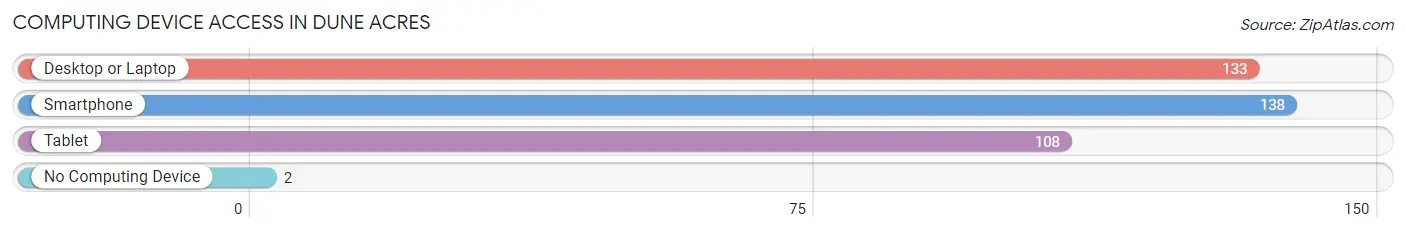
| Device Type | # Households | % Households |
| Desktop or Laptop | 133 | 93.0% |
| Smartphone | 138 | 96.5% |
| Tablet | 108 | 75.5% |
| No Computing Device | 2 | 1.4% |
| Total | 143 | 100.0% |
Internet Access in Dune Acres
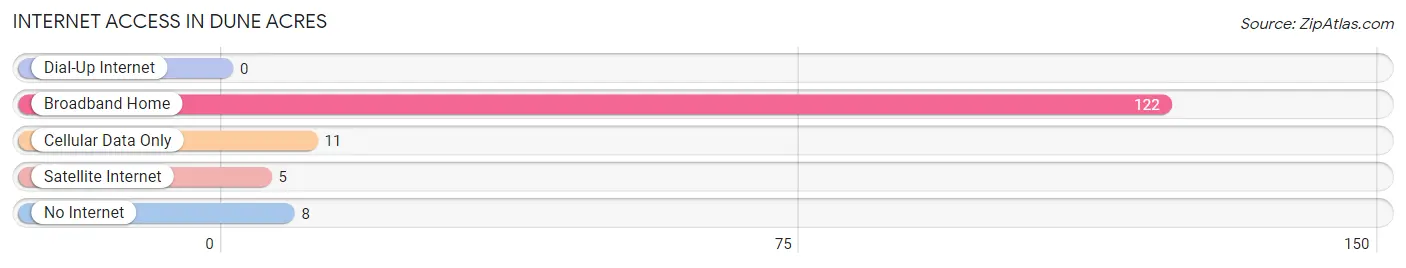
| Internet Type | # Households | % Households |
| Dial-Up Internet | 0 | 0.0% |
| Broadband Home | 122 | 85.3% |
| Cellular Data Only | 11 | 7.7% |
| Satellite Internet | 5 | 3.5% |
| No Internet | 8 | 5.6% |
| Total | 143 | 100.0% |
Dune Acres Summary
Dune Acres is a small town located in Porter County, Indiana, United States. It is situated on the southern shore of Lake Michigan, approximately 40 miles east of Chicago. The town was founded in the early 1900s and has a population of approximately 500 people.
History
Dune Acres was founded in the early 1900s by a group of wealthy Chicagoans who wanted to escape the hustle and bustle of the city. The town was originally called “Dune Park” and was intended to be a summer resort for the wealthy. The town was incorporated in 1921 and the name was changed to Dune Acres.
The town was built on the sand dunes of Lake Michigan and was designed to be a quiet, peaceful place to escape the city. The town was designed with wide streets, large lots, and plenty of green space. The town was also designed to be a self-sustaining community, with its own water and sewer systems, and a small commercial district.
Geography
Dune Acres is located in Porter County, Indiana, on the southern shore of Lake Michigan. The town is situated on a sand dune, which is part of the Indiana Dunes National Lakeshore. The town is surrounded by the Indiana Dunes State Park and the Indiana Dunes National Lakeshore. The town is approximately 40 miles east of Chicago and is accessible by car or train.
The town is located in a temperate climate, with hot summers and cold winters. The average temperature in the summer is around 75 degrees Fahrenheit, and the average temperature in the winter is around 25 degrees Fahrenheit. The town receives an average of 40 inches of precipitation per year.
Economy
The economy of Dune Acres is largely based on tourism. The town is a popular destination for visitors from Chicago and other nearby cities. The town is home to several restaurants, hotels, and other tourist attractions. The town also has a small commercial district, which includes a grocery store, a hardware store, and a few other small businesses.
The town is also home to several small businesses, such as a landscaping company, a construction company, and a few other small businesses. The town also has a few small manufacturing companies, which produce items such as furniture and clothing.
Demographics
As of the 2010 census, the population of Dune Acres was 498 people. The town is predominantly white, with 94.4% of the population being white. The town also has a small Hispanic population, with 4.2% of the population being Hispanic. The town also has a small African American population, with 1.2% of the population being African American. The median household income in the town is $50,000, and the median home value is $200,000.
Conclusion
Dune Acres is a small town located in Porter County, Indiana, on the southern shore of Lake Michigan. The town was founded in the early 1900s and has a population of approximately 500 people. The town is largely based on tourism, with several restaurants, hotels, and other tourist attractions. The town also has a small commercial district, which includes a grocery store, a hardware store, and a few other small businesses. The town is predominantly white, with 94.4% of the population being white. The median household income in the town is $50,000, and the median home value is $200,000.
Common Questions
What is Per Capita Income in Dune Acres?
Per Capita income in Dune Acres is $135,895.
What is the Median Family Income in Dune Acres?
Median Family Income in Dune Acres is $233,750.
What is the Median Household income in Dune Acres?
Median Household Income in Dune Acres is $212,083.
What is Inequality or Gini Index in Dune Acres?
Inequality or Gini Index in Dune Acres is 0.47.
What is the Total Population of Dune Acres?
Total Population of Dune Acres is 293.
What is the Total Male Population of Dune Acres?
Total Male Population of Dune Acres is 143.
What is the Total Female Population of Dune Acres?
Total Female Population of Dune Acres is 150.
What is the Ratio of Males per 100 Females in Dune Acres?
There are 95.33 Males per 100 Females in Dune Acres.
What is the Ratio of Females per 100 Males in Dune Acres?
There are 104.90 Females per 100 Males in Dune Acres.
What is the Median Population Age in Dune Acres?
Median Population Age in Dune Acres is 60.0 Years.
What is the Average Family Size in Dune Acres
Average Family Size in Dune Acres is 2.6 People.
What is the Average Household Size in Dune Acres
Average Household Size in Dune Acres is 2.0 People.
How Large is the Labor Force in Dune Acres?
There are 165 People in the Labor Forcein in Dune Acres.
What is the Percentage of People in the Labor Force in Dune Acres?
58.5% of People are in the Labor Force in Dune Acres.
What is the Unemployment Rate in Dune Acres?
Unemployment Rate in Dune Acres is 5.5%.