Delphi, IN Map & Demographics
Delphi Map
Delphi Overview
$25,015
PER CAPITA INCOME
$58,071
AVG FAMILY INCOME
$47,688
AVG HOUSEHOLD INCOME
14.8%
WAGE / INCOME GAP [ % ]
85.2¢/ $1
WAGE / INCOME GAP [ $ ]
0.48
INEQUALITY / GINI INDEX
2,985
TOTAL POPULATION
1,496
MALE POPULATION
1,489
FEMALE POPULATION
100.47
MALES / 100 FEMALES
99.53
FEMALES / 100 MALES
42.1
MEDIAN AGE
3.8
AVG FAMILY SIZE
2.7
AVG HOUSEHOLD SIZE
1,126
LABOR FORCE [ PEOPLE ]
49.1%
PERCENT IN LABOR FORCE
5.0%
UNEMPLOYMENT RATE
Delphi Zip Codes
Income in Delphi
Income Overview in Delphi
Per Capita Income in Delphi is $25,015, while median incomes of families and households are $58,071 and $47,688 respectively.
| Characteristic | Number | Measure |
| Per Capita Income | 2,985 | $25,015 |
| Median Family Income | 623 | $58,071 |
| Mean Family Income | 623 | $90,686 |
| Median Household Income | 1,067 | $47,688 |
| Mean Household Income | 1,067 | $69,683 |
| Income Deficit | 623 | $0 |
| Wage / Income Gap (%) | 2,985 | 14.80% |
| Wage / Income Gap ($) | 2,985 | 85.20¢ per $1 |
| Gini / Inequality Index | 2,985 | 0.48 |
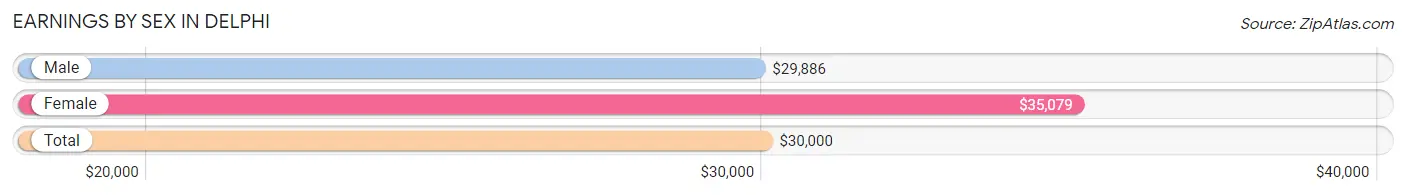
Earnings by Sex in Delphi
Average Earnings in Delphi are $30,000, $29,886 for men and $35,079 for women, a difference of 14.8%.
| Sex | Number | Average Earnings |
| Male | 708 (59.4%) | $29,886 |
| Female | 484 (40.6%) | $35,079 |
| Total | 1,192 (100.0%) | $30,000 |
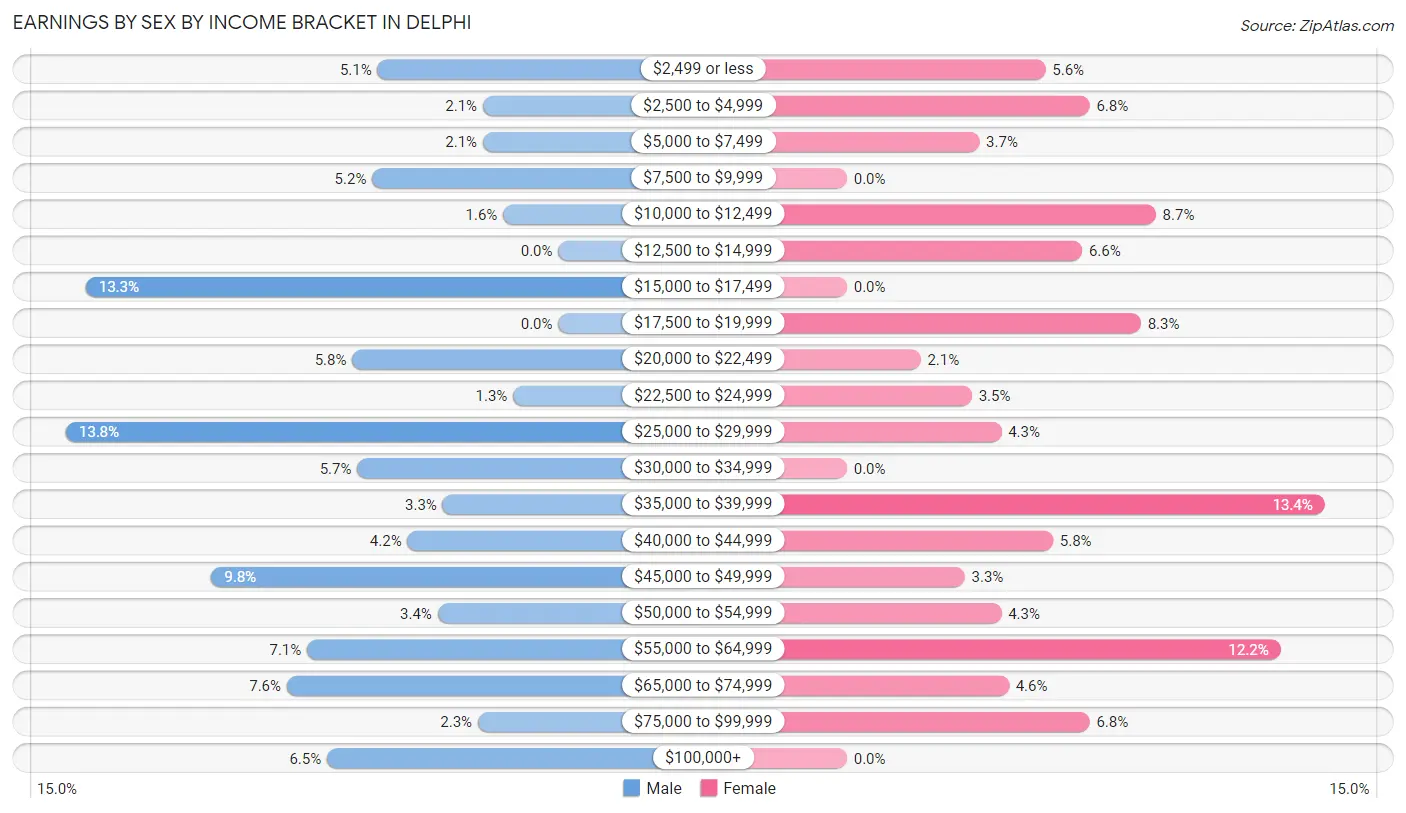
Earnings by Sex by Income Bracket in Delphi
The most common earnings brackets in Delphi are $25,000 to $29,999 for men (98 | 13.8%) and $35,000 to $39,999 for women (65 | 13.4%).
| Income | Male | Female |
| $2,499 or less | 36 (5.1%) | 27 (5.6%) |
| $2,500 to $4,999 | 15 (2.1%) | 33 (6.8%) |
| $5,000 to $7,499 | 15 (2.1%) | 18 (3.7%) |
| $7,500 to $9,999 | 37 (5.2%) | 0 (0.0%) |
| $10,000 to $12,499 | 11 (1.5%) | 42 (8.7%) |
| $12,500 to $14,999 | 0 (0.0%) | 32 (6.6%) |
| $15,000 to $17,499 | 94 (13.3%) | 0 (0.0%) |
| $17,500 to $19,999 | 0 (0.0%) | 40 (8.3%) |
| $20,000 to $22,499 | 41 (5.8%) | 10 (2.1%) |
| $22,500 to $24,999 | 9 (1.3%) | 17 (3.5%) |
| $25,000 to $29,999 | 98 (13.8%) | 21 (4.3%) |
| $30,000 to $34,999 | 40 (5.7%) | 0 (0.0%) |
| $35,000 to $39,999 | 23 (3.3%) | 65 (13.4%) |
| $40,000 to $44,999 | 30 (4.2%) | 28 (5.8%) |
| $45,000 to $49,999 | 69 (9.8%) | 16 (3.3%) |
| $50,000 to $54,999 | 24 (3.4%) | 21 (4.3%) |
| $55,000 to $64,999 | 50 (7.1%) | 59 (12.2%) |
| $65,000 to $74,999 | 54 (7.6%) | 22 (4.5%) |
| $75,000 to $99,999 | 16 (2.3%) | 33 (6.8%) |
| $100,000+ | 46 (6.5%) | 0 (0.0%) |
| Total | 708 (100.0%) | 484 (100.0%) |
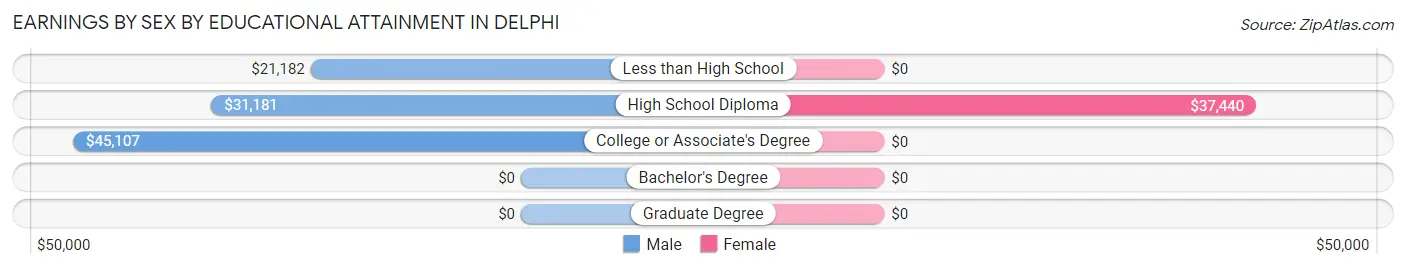
Earnings by Sex by Educational Attainment in Delphi
Average earnings in Delphi are $35,815 for men and $36,111 for women, a difference of 0.8%. Men with an educational attainment of college or associate's degree enjoy the highest average annual earnings of $45,107, while those with less than high school education earn the least with $21,182. Women with an educational attainment of high school diploma earn the most with the average annual earnings of $37,440, while those with high school diploma education have the smallest earnings of $37,440.
| Educational Attainment | Male Income | Female Income |
| Less than High School | $21,182 | $0 |
| High School Diploma | $31,181 | $37,440 |
| College or Associate's Degree | $45,107 | $0 |
| Bachelor's Degree | - | - |
| Graduate Degree | - | - |
| Total | $35,815 | $36,111 |
Family Income in Delphi
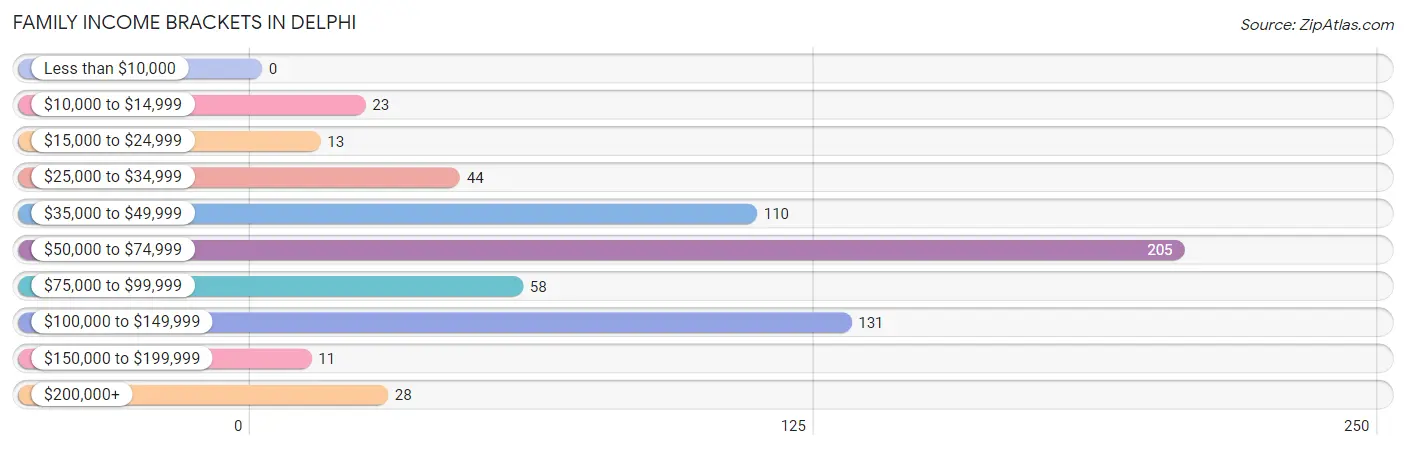
Family Income Brackets in Delphi
According to the Delphi family income data, there are 205 families falling into the $50,000 to $74,999 income range, which is the most common income bracket and makes up 32.9% of all families.
| Income Bracket | # Families | % Families |
| Less than $10,000 | 0 | 0.0% |
| $10,000 to $14,999 | 23 | 3.7% |
| $15,000 to $24,999 | 13 | 2.1% |
| $25,000 to $34,999 | 44 | 7.1% |
| $35,000 to $49,999 | 110 | 17.7% |
| $50,000 to $74,999 | 205 | 32.9% |
| $75,000 to $99,999 | 58 | 9.3% |
| $100,000 to $149,999 | 131 | 21.0% |
| $150,000 to $199,999 | 11 | 1.8% |
| $200,000+ | 28 | 4.5% |
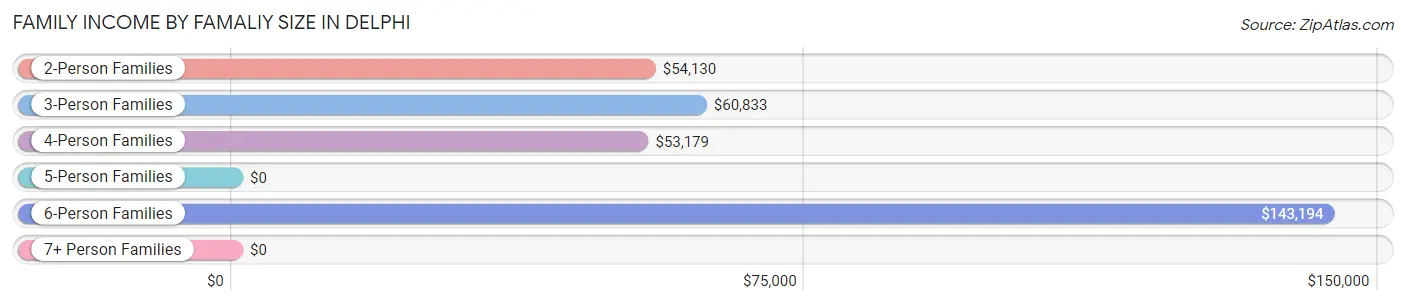
Family Income by Famaliy Size in Delphi
6-person families (77 | 12.4%) account for the highest median family income in Delphi with $143,194 per family, while 2-person families (302 | 48.5%) have the highest median income of $27,065 per family member.
| Income Bracket | # Families | Median Income |
| 2-Person Families | 302 (48.5%) | $54,130 |
| 3-Person Families | 114 (18.3%) | $60,833 |
| 4-Person Families | 81 (13.0%) | $53,179 |
| 5-Person Families | 24 (3.8%) | $0 |
| 6-Person Families | 77 (12.4%) | $143,194 |
| 7+ Person Families | 25 (4.0%) | $0 |
| Total | 623 (100.0%) | $58,071 |
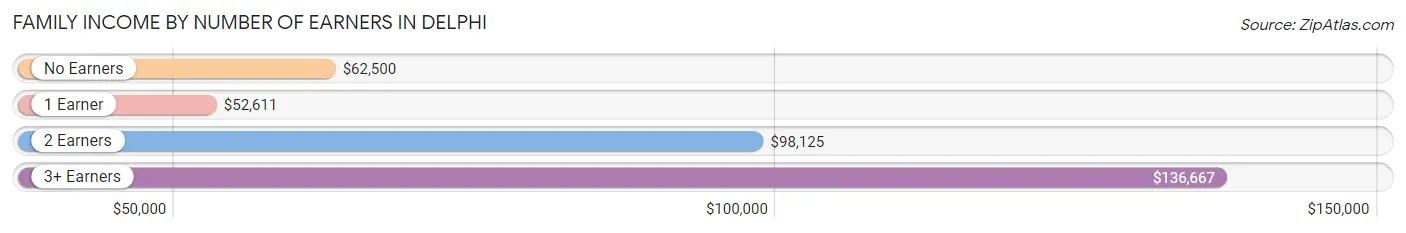
Family Income by Number of Earners in Delphi
The median family income in Delphi is $58,071, with families comprising 3+ earners (88) having the highest median family income of $136,667, while families with 1 earner (274) have the lowest median family income of $52,611, accounting for 14.1% and 44.0% of families, respectively.
| Number of Earners | # Families | Median Income |
| No Earners | 118 (18.9%) | $62,500 |
| 1 Earner | 274 (44.0%) | $52,611 |
| 2 Earners | 143 (23.0%) | $98,125 |
| 3+ Earners | 88 (14.1%) | $136,667 |
| Total | 623 (100.0%) | $58,071 |
Household Income in Delphi
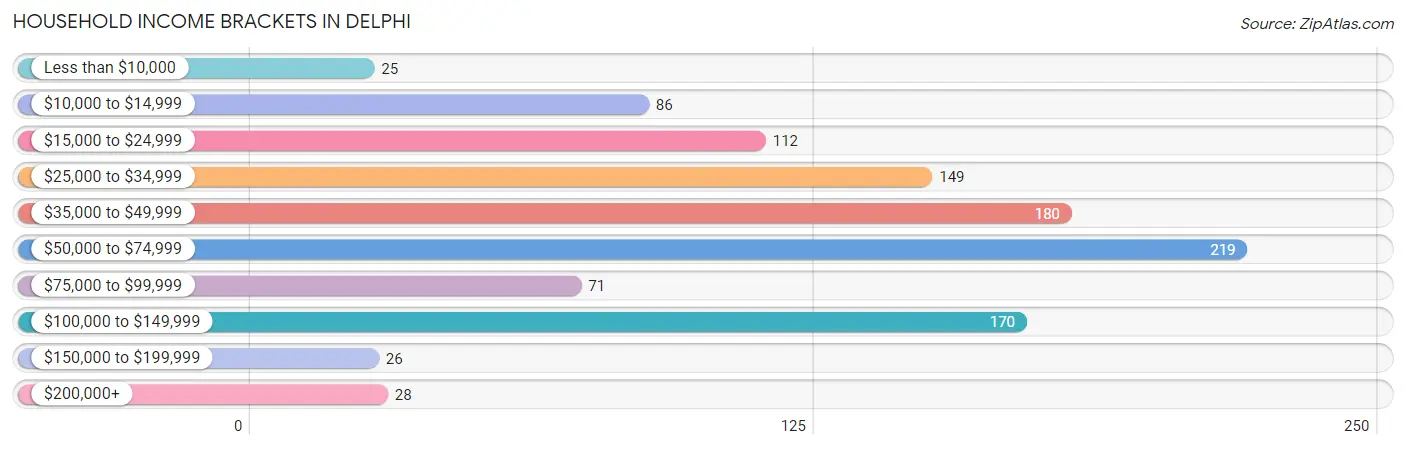
Household Income Brackets in Delphi
With 219 households falling in the category, the $50,000 to $74,999 income range is the most frequent in Delphi, accounting for 20.5% of all households. In contrast, only 25 households (2.3%) fall into the less than $10,000 income bracket, making it the least populous group.
| Income Bracket | # Households | % Households |
| Less than $10,000 | 25 | 2.3% |
| $10,000 to $14,999 | 86 | 8.1% |
| $15,000 to $24,999 | 112 | 10.5% |
| $25,000 to $34,999 | 149 | 14.0% |
| $35,000 to $49,999 | 180 | 16.9% |
| $50,000 to $74,999 | 219 | 20.5% |
| $75,000 to $99,999 | 71 | 6.7% |
| $100,000 to $149,999 | 170 | 15.9% |
| $150,000 to $199,999 | 26 | 2.4% |
| $200,000+ | 28 | 2.6% |
Household Income by Householder Age in Delphi
The median household income in Delphi is $47,688, with the highest median household income of $52,857 found in the 45 to 64 years age bracket for the primary householder. A total of 498 households (46.7%) fall into this category. Meanwhile, the 65+ years age bracket for the primary householder has the lowest median household income of $0, with 335 households (31.4%) in this group.
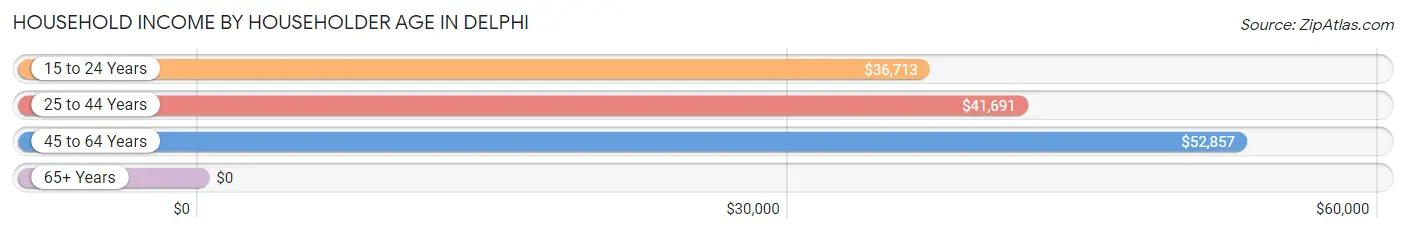
| Income Bracket | # Households | Median Income |
| 15 to 24 Years | 53 (5.0%) | $36,713 |
| 25 to 44 Years | 181 (17.0%) | $41,691 |
| 45 to 64 Years | 498 (46.7%) | $52,857 |
| 65+ Years | 335 (31.4%) | $0 |
| Total | 1,067 (100.0%) | $47,688 |
Poverty in Delphi
Income Below Poverty by Sex and Age in Delphi
With 8.4% poverty level for males and 8.8% for females among the residents of Delphi, 16 and 17 year old males and 16 and 17 year old females are the most vulnerable to poverty, with 23 males (32.4%) and 12 females (32.4%) in their respective age groups living below the poverty level.
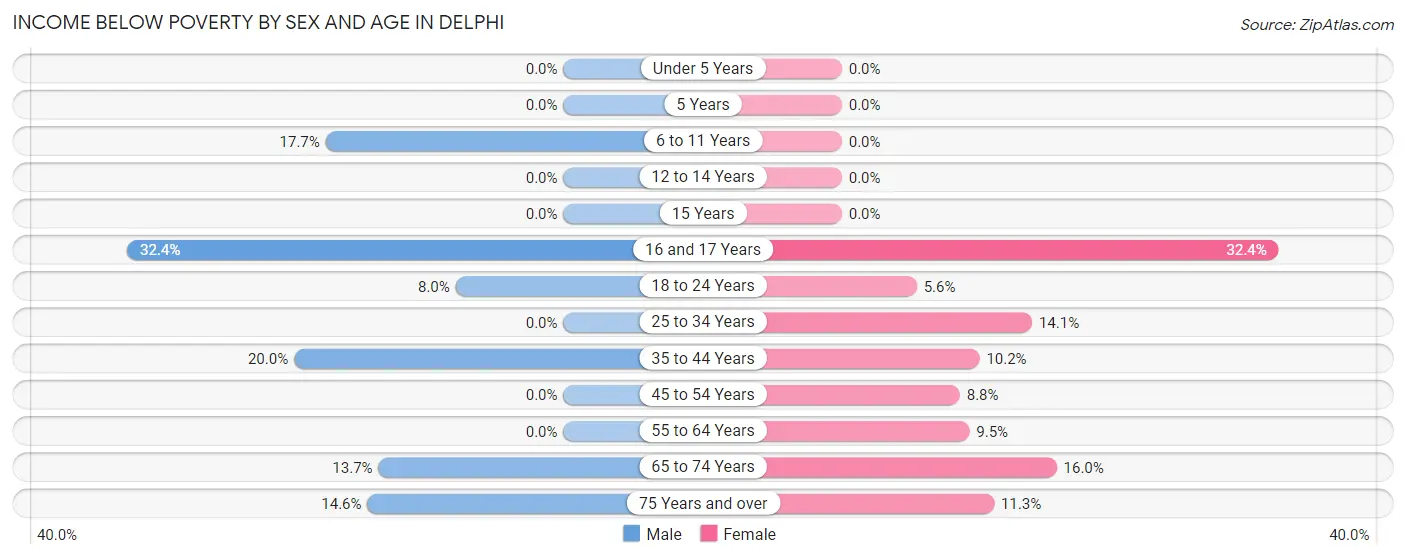
| Age Bracket | Male | Female |
| Under 5 Years | 0 (0.0%) | 0 (0.0%) |
| 5 Years | 0 (0.0%) | 0 (0.0%) |
| 6 to 11 Years | 27 (17.6%) | 0 (0.0%) |
| 12 to 14 Years | 0 (0.0%) | 0 (0.0%) |
| 15 Years | 0 (0.0%) | 0 (0.0%) |
| 16 and 17 Years | 23 (32.4%) | 12 (32.4%) |
| 18 to 24 Years | 6 (8.0%) | 6 (5.6%) |
| 25 to 34 Years | 0 (0.0%) | 12 (14.1%) |
| 35 to 44 Years | 28 (20.0%) | 23 (10.2%) |
| 45 to 54 Years | 0 (0.0%) | 19 (8.8%) |
| 55 to 64 Years | 0 (0.0%) | 16 (9.5%) |
| 65 to 74 Years | 21 (13.7%) | 26 (16.0%) |
| 75 Years and over | 16 (14.5%) | 13 (11.3%) |
| Total | 121 (8.4%) | 127 (8.8%) |
Income Above Poverty by Sex and Age in Delphi
According to the poverty statistics in Delphi, males aged under 5 years and females aged under 5 years are the age groups that are most secure financially, with 100.0% of males and 100.0% of females in these age groups living above the poverty line.
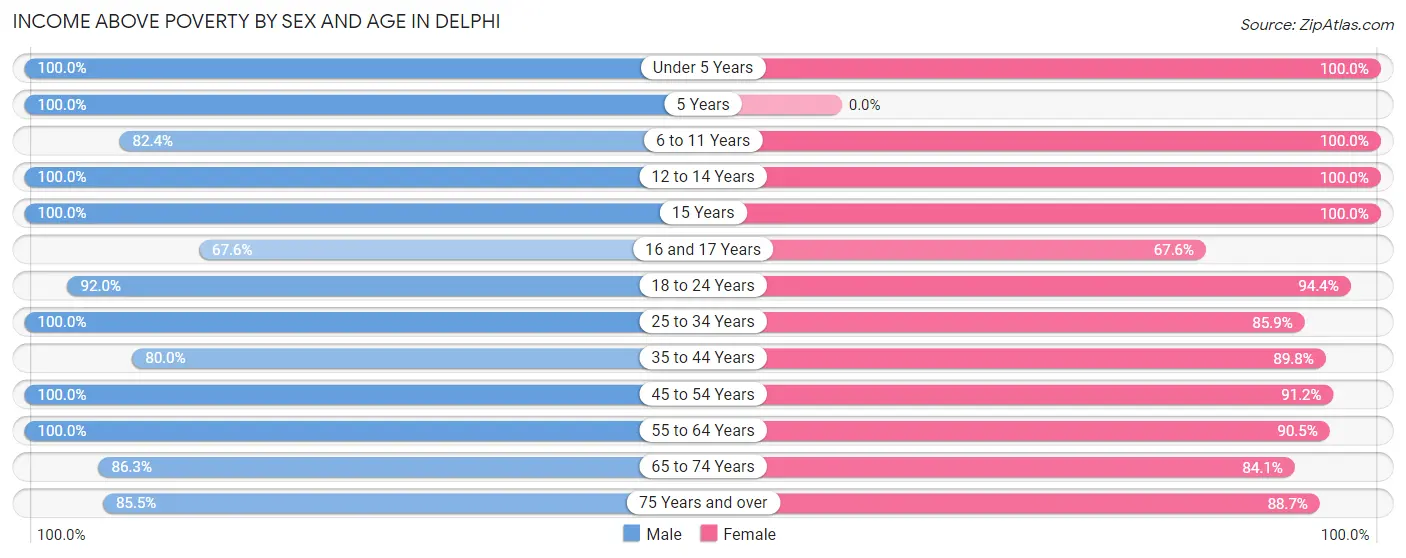
| Age Bracket | Male | Female |
| Under 5 Years | 100 (100.0%) | 41 (100.0%) |
| 5 Years | 31 (100.0%) | 0 (0.0%) |
| 6 to 11 Years | 126 (82.4%) | 48 (100.0%) |
| 12 to 14 Years | 31 (100.0%) | 134 (100.0%) |
| 15 Years | 55 (100.0%) | 99 (100.0%) |
| 16 and 17 Years | 48 (67.6%) | 25 (67.6%) |
| 18 to 24 Years | 69 (92.0%) | 102 (94.4%) |
| 25 to 34 Years | 140 (100.0%) | 73 (85.9%) |
| 35 to 44 Years | 112 (80.0%) | 202 (89.8%) |
| 45 to 54 Years | 201 (100.0%) | 198 (91.2%) |
| 55 to 64 Years | 181 (100.0%) | 153 (90.5%) |
| 65 to 74 Years | 132 (86.3%) | 137 (84.1%) |
| 75 Years and over | 94 (85.5%) | 102 (88.7%) |
| Total | 1,320 (91.6%) | 1,314 (91.2%) |
Income Below Poverty Among Married-Couple Families in Delphi
The poverty statistics for married-couple families in Delphi show that 7.4% or 36 of the total 488 families live below the poverty line. Families with 1 or 2 children have the highest poverty rate of 17.7%, comprising of 23 families. On the other hand, families with 3 or 4 children have the lowest poverty rate of 0.0%, which includes 0 families.
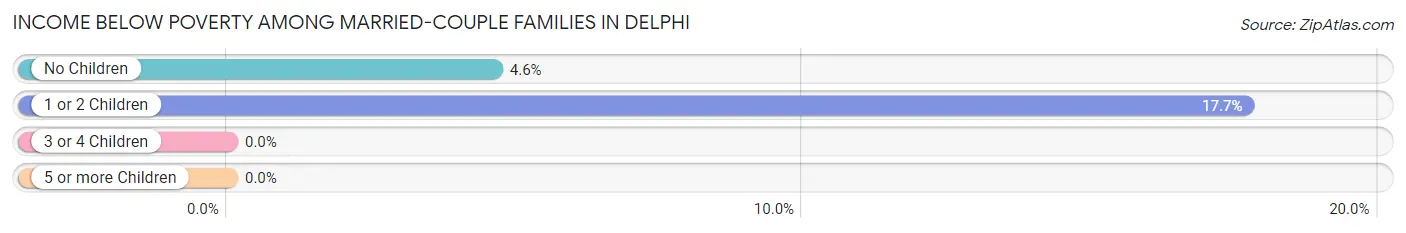
| Children | Above Poverty | Below Poverty |
| No Children | 269 (95.4%) | 13 (4.6%) |
| 1 or 2 Children | 107 (82.3%) | 23 (17.7%) |
| 3 or 4 Children | 76 (100.0%) | 0 (0.0%) |
| 5 or more Children | 0 (0.0%) | 0 (0.0%) |
| Total | 452 (92.6%) | 36 (7.4%) |
Income Below Poverty Among Single-Parent Households in Delphi
| Children | Single Father | Single Mother |
| No Children | 0 (0.0%) | 0 (0.0%) |
| 1 or 2 Children | 0 (0.0%) | 0 (0.0%) |
| 3 or 4 Children | 0 (0.0%) | 0 (0.0%) |
| 5 or more Children | 0 (0.0%) | 0 (0.0%) |
| Total | 0 (0.0%) | 0 (0.0%) |
Income Below Poverty Among Married-Couple vs Single-Parent Households in Delphi
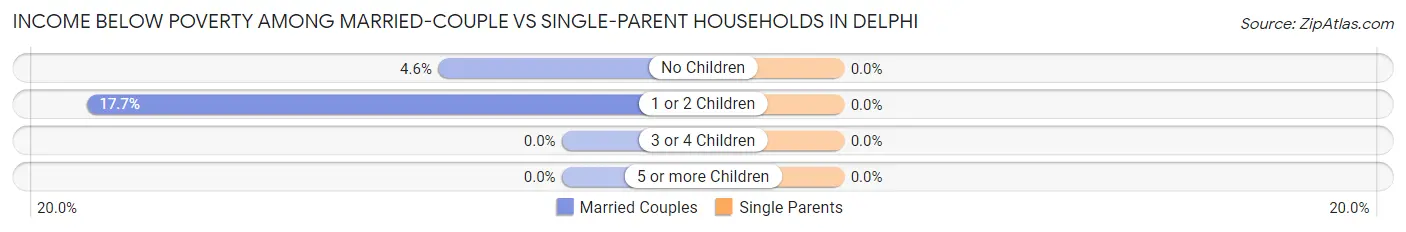
| Children | Married-Couple Families | Single-Parent Households |
| No Children | 13 (4.6%) | 0 (0.0%) |
| 1 or 2 Children | 23 (17.7%) | 0 (0.0%) |
| 3 or 4 Children | 0 (0.0%) | 0 (0.0%) |
| 5 or more Children | 0 (0.0%) | 0 (0.0%) |
| Total | 36 (7.4%) | 0 (0.0%) |
Race in Delphi
The most populous races in Delphi are White / Caucasian (2,803 | 93.9%), Hispanic or Latino (465 | 15.6%), and Two or more Races (151 | 5.1%).
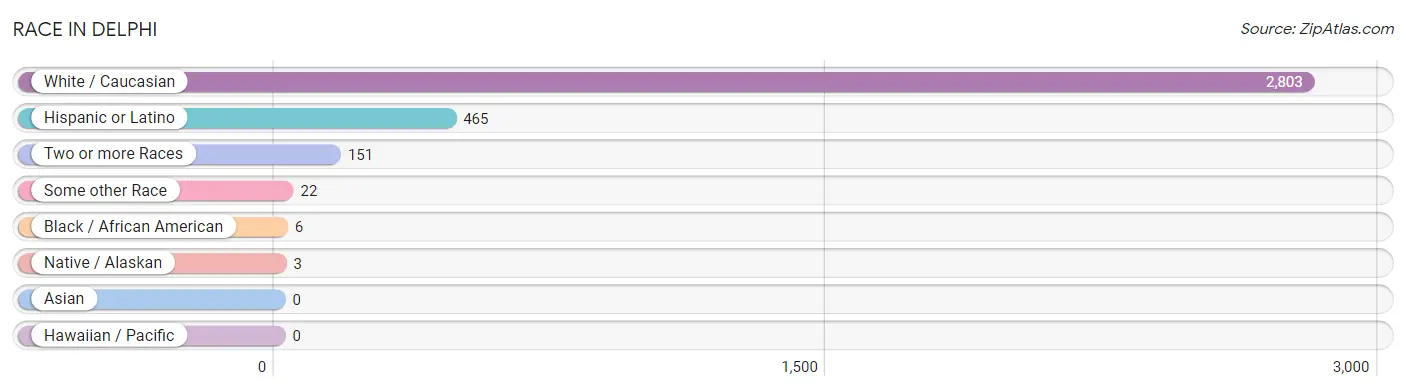
| Race | # Population | % Population |
| Asian | 0 | 0.0% |
| Black / African American | 6 | 0.2% |
| Hawaiian / Pacific | 0 | 0.0% |
| Hispanic or Latino | 465 | 15.6% |
| Native / Alaskan | 3 | 0.1% |
| White / Caucasian | 2,803 | 93.9% |
| Two or more Races | 151 | 5.1% |
| Some other Race | 22 | 0.7% |
| Total | 2,985 | 100.0% |
Ancestry in Delphi
The most populous ancestries reported in Delphi are Mexican (420 | 14.1%), German (416 | 13.9%), Irish (337 | 11.3%), English (328 | 11.0%), and American (140 | 4.7%), together accounting for 55.0% of all Delphi residents.
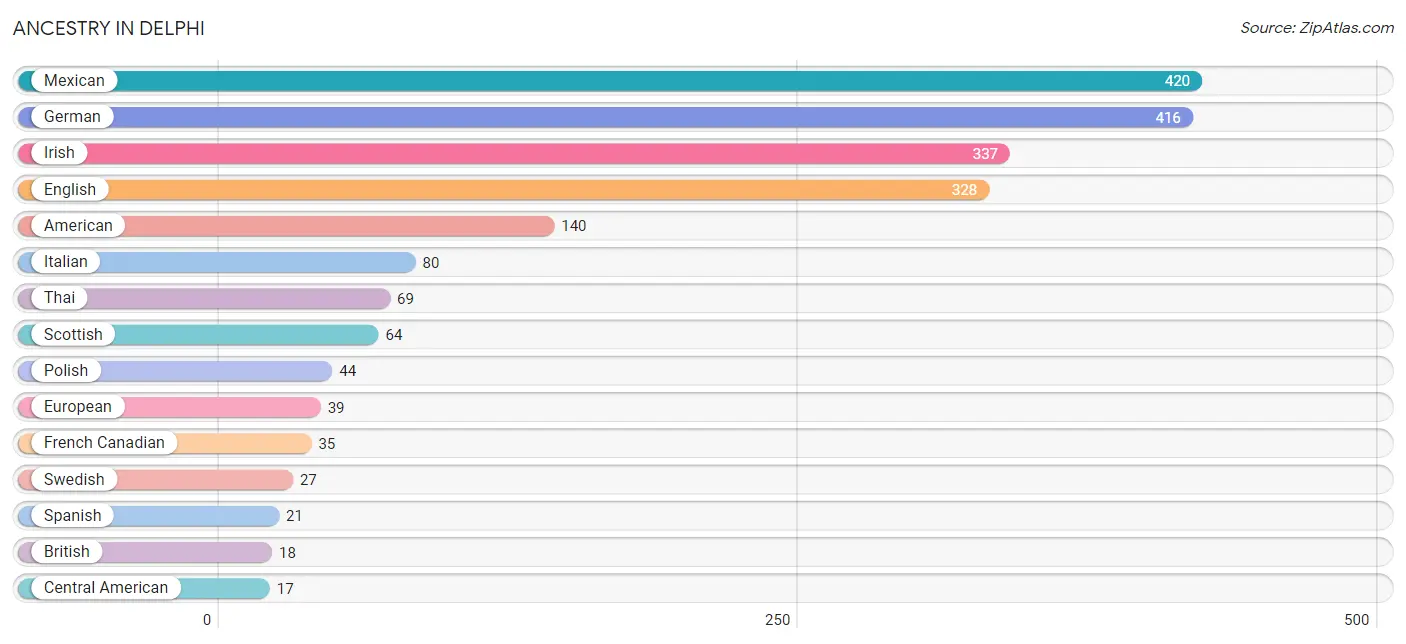
| Ancestry | # Population | % Population |
| American | 140 | 4.7% |
| British | 18 | 0.6% |
| Central American | 17 | 0.6% |
| Colombian | 7 | 0.2% |
| English | 328 | 11.0% |
| European | 39 | 1.3% |
| Finnish | 6 | 0.2% |
| French Canadian | 35 | 1.2% |
| German | 416 | 13.9% |
| Greek | 12 | 0.4% |
| Irish | 337 | 11.3% |
| Italian | 80 | 2.7% |
| Mexican | 420 | 14.1% |
| Panamanian | 11 | 0.4% |
| Polish | 44 | 1.5% |
| Salvadoran | 6 | 0.2% |
| Scotch-Irish | 6 | 0.2% |
| Scottish | 64 | 2.1% |
| South American | 7 | 0.2% |
| Spanish | 21 | 0.7% |
| Swedish | 27 | 0.9% |
| Thai | 69 | 2.3% | View All 22 Rows |
Immigrants in Delphi
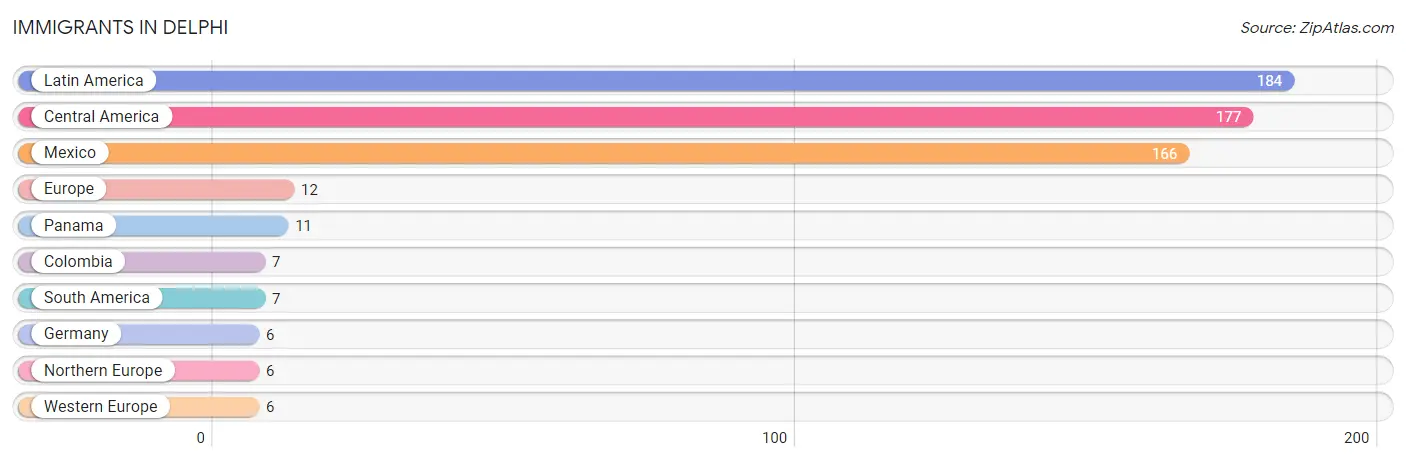
The most numerous immigrant groups reported in Delphi came from Latin America (184 | 6.2%), Central America (177 | 5.9%), Mexico (166 | 5.6%), Europe (12 | 0.4%), and Panama (11 | 0.4%), together accounting for 18.4% of all Delphi residents.
| Immigration Origin | # Population | % Population |
| Central America | 177 | 5.9% |
| Colombia | 7 | 0.2% |
| Europe | 12 | 0.4% |
| Germany | 6 | 0.2% |
| Latin America | 184 | 6.2% |
| Mexico | 166 | 5.6% |
| Northern Europe | 6 | 0.2% |
| Panama | 11 | 0.4% |
| South America | 7 | 0.2% |
| Western Europe | 6 | 0.2% | View All 10 Rows |
Sex and Age in Delphi
Sex and Age in Delphi
The most populous age groups in Delphi are 60 to 64 Years (167 | 11.2%) for men and 15 to 19 Years (174 | 11.7%) for women.
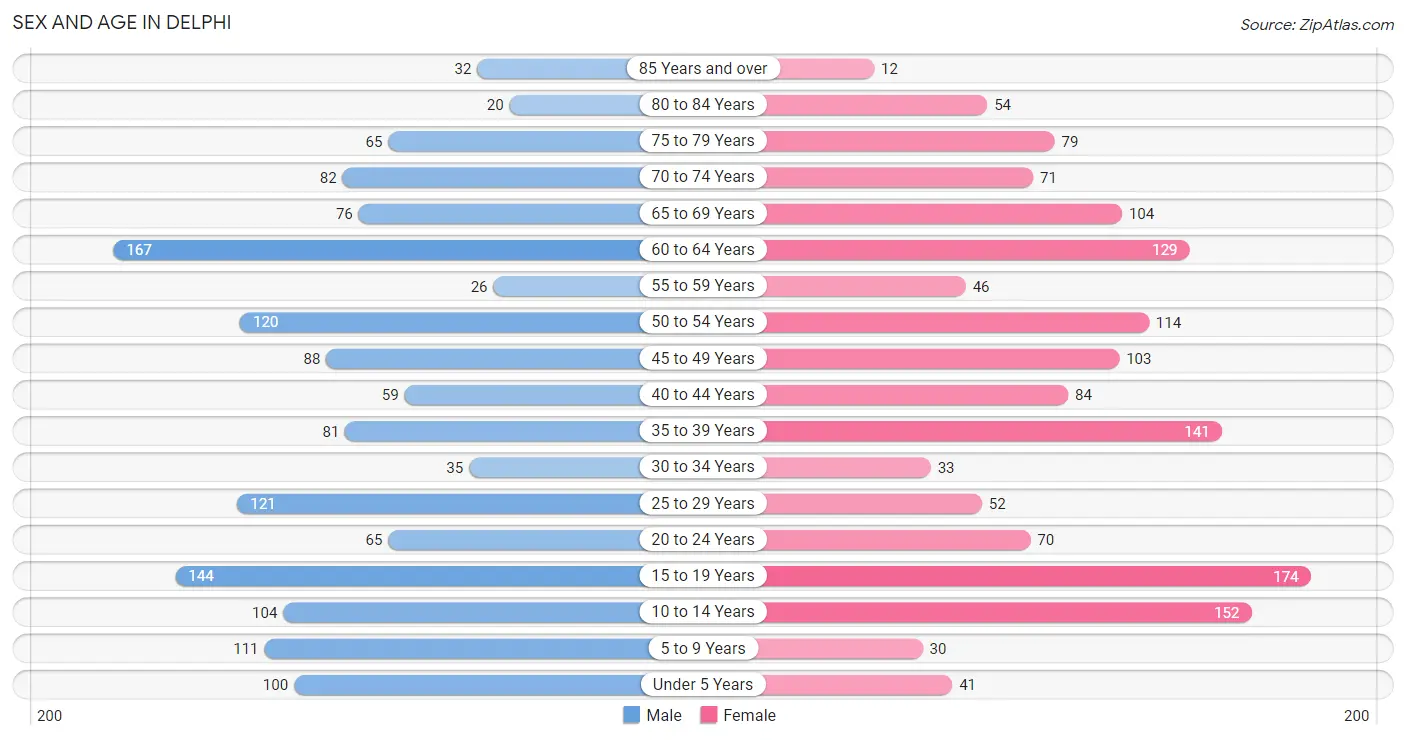
| Age Bracket | Male | Female |
| Under 5 Years | 100 (6.7%) | 41 (2.8%) |
| 5 to 9 Years | 111 (7.4%) | 30 (2.0%) |
| 10 to 14 Years | 104 (7.0%) | 152 (10.2%) |
| 15 to 19 Years | 144 (9.6%) | 174 (11.7%) |
| 20 to 24 Years | 65 (4.3%) | 70 (4.7%) |
| 25 to 29 Years | 121 (8.1%) | 52 (3.5%) |
| 30 to 34 Years | 35 (2.3%) | 33 (2.2%) |
| 35 to 39 Years | 81 (5.4%) | 141 (9.5%) |
| 40 to 44 Years | 59 (3.9%) | 84 (5.6%) |
| 45 to 49 Years | 88 (5.9%) | 103 (6.9%) |
| 50 to 54 Years | 120 (8.0%) | 114 (7.7%) |
| 55 to 59 Years | 26 (1.7%) | 46 (3.1%) |
| 60 to 64 Years | 167 (11.2%) | 129 (8.7%) |
| 65 to 69 Years | 76 (5.1%) | 104 (7.0%) |
| 70 to 74 Years | 82 (5.5%) | 71 (4.8%) |
| 75 to 79 Years | 65 (4.3%) | 79 (5.3%) |
| 80 to 84 Years | 20 (1.3%) | 54 (3.6%) |
| 85 Years and over | 32 (2.1%) | 12 (0.8%) |
| Total | 1,496 (100.0%) | 1,489 (100.0%) |
Families and Households in Delphi
Median Family Size in Delphi
The median family size in Delphi is 3.77 persons per family, with married-couple families (488 | 78.3%) accounting for the largest median family size of 4.01 persons per family. On the other hand, single male/father families (43 | 6.9%) represent the smallest median family size with 2.86 persons per family.
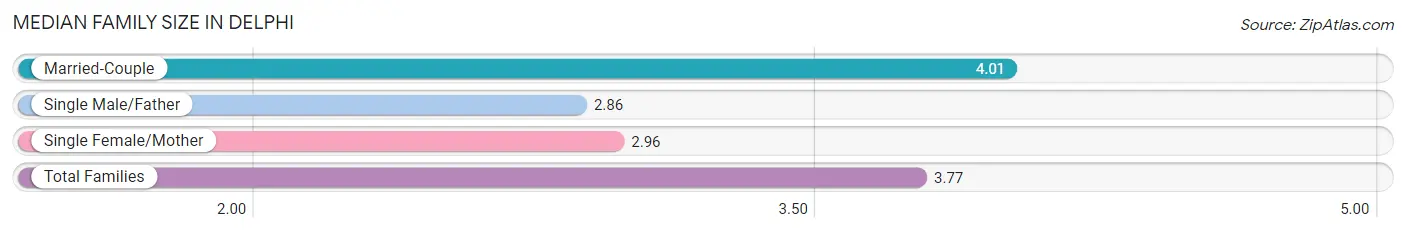
| Family Type | # Families | Family Size |
| Married-Couple | 488 (78.3%) | 4.01 |
| Single Male/Father | 43 (6.9%) | 2.86 |
| Single Female/Mother | 92 (14.8%) | 2.96 |
| Total Families | 623 (100.0%) | 3.77 |
Median Household Size in Delphi
The median household size in Delphi is 2.70 persons per household, with married-couple households (488 | 45.7%) accounting for the largest median household size of 4.08 persons per household. non-family households (444 | 41.6%) represent the smallest median household size with 1.07 persons per household.
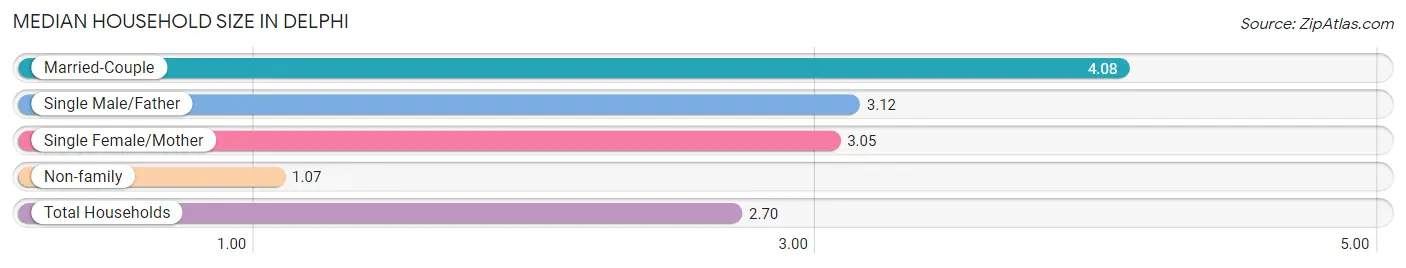
| Household Type | # Households | Household Size |
| Married-Couple | 488 (45.7%) | 4.08 |
| Single Male/Father | 43 (4.0%) | 3.12 |
| Single Female/Mother | 92 (8.6%) | 3.05 |
| Non-family | 444 (41.6%) | 1.07 |
| Total Households | 1,067 (100.0%) | 2.70 |
Household Size by Marriage Status in Delphi
Out of a total of 1,067 households in Delphi, 623 (58.4%) are family households, while 444 (41.6%) are nonfamily households. The most numerous type of family households are 2-person households, comprising 288, and the most common type of nonfamily households are 1-person households, comprising 407.
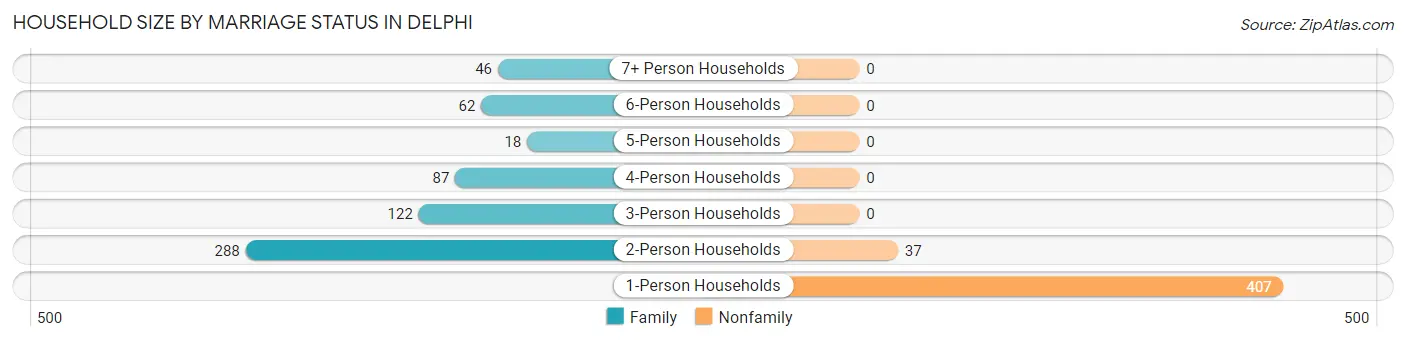
| Household Size | Family Households | Nonfamily Households |
| 1-Person Households | - | 407 (38.1%) |
| 2-Person Households | 288 (27.0%) | 37 (3.5%) |
| 3-Person Households | 122 (11.4%) | 0 (0.0%) |
| 4-Person Households | 87 (8.2%) | 0 (0.0%) |
| 5-Person Households | 18 (1.7%) | 0 (0.0%) |
| 6-Person Households | 62 (5.8%) | 0 (0.0%) |
| 7+ Person Households | 46 (4.3%) | 0 (0.0%) |
| Total | 623 (58.4%) | 444 (41.6%) |
Female Fertility in Delphi
Fertility by Age in Delphi
Average fertility rate in Delphi is 111.0 births per 1,000 women. Women in the age bracket of 20 to 34 years have the highest fertility rate with 219.0 births per 1,000 women. Women in the age bracket of 35 to 50 years acount for 55.3% of all women with births.
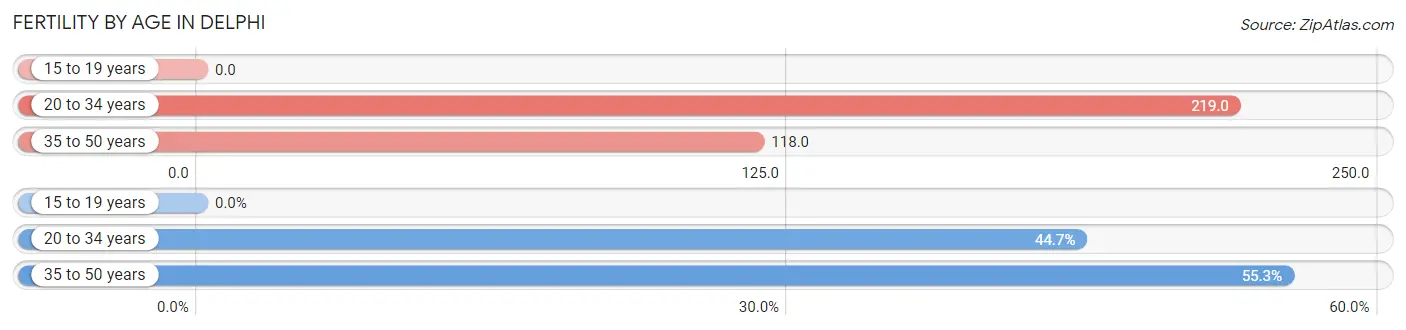
| Age Bracket | Women with Births | Births / 1,000 Women |
| 15 to 19 years | 0 (0.0%) | 0.0 |
| 20 to 34 years | 34 (44.7%) | 219.0 |
| 35 to 50 years | 42 (55.3%) | 118.0 |
| Total | 76 (100.0%) | 111.0 |
Fertility by Age by Marriage Status in Delphi
64.5% of women with births (76) in Delphi are married. The highest percentage of unmarried women with births falls into 20 to 34 years age bracket with 79.4% of them unmarried at the time of birth, while the lowest percentage of unmarried women with births belong to 35 to 50 years age bracket with 0.0% of them unmarried.
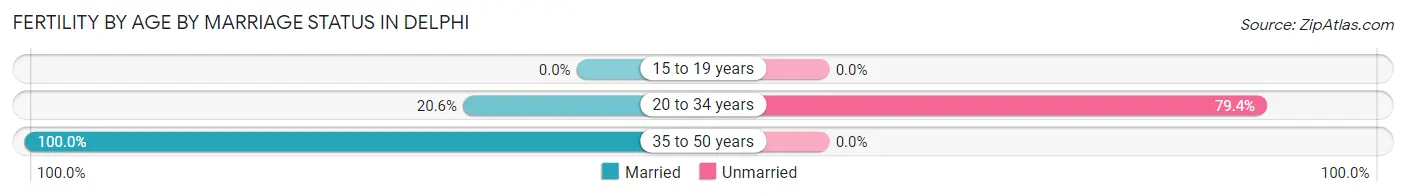
| Age Bracket | Married | Unmarried |
| 15 to 19 years | 0 (0.0%) | 0 (0.0%) |
| 20 to 34 years | 7 (20.6%) | 27 (79.4%) |
| 35 to 50 years | 42 (100.0%) | 0 (0.0%) |
| Total | 49 (64.5%) | 27 (35.5%) |
Fertility by Education in Delphi
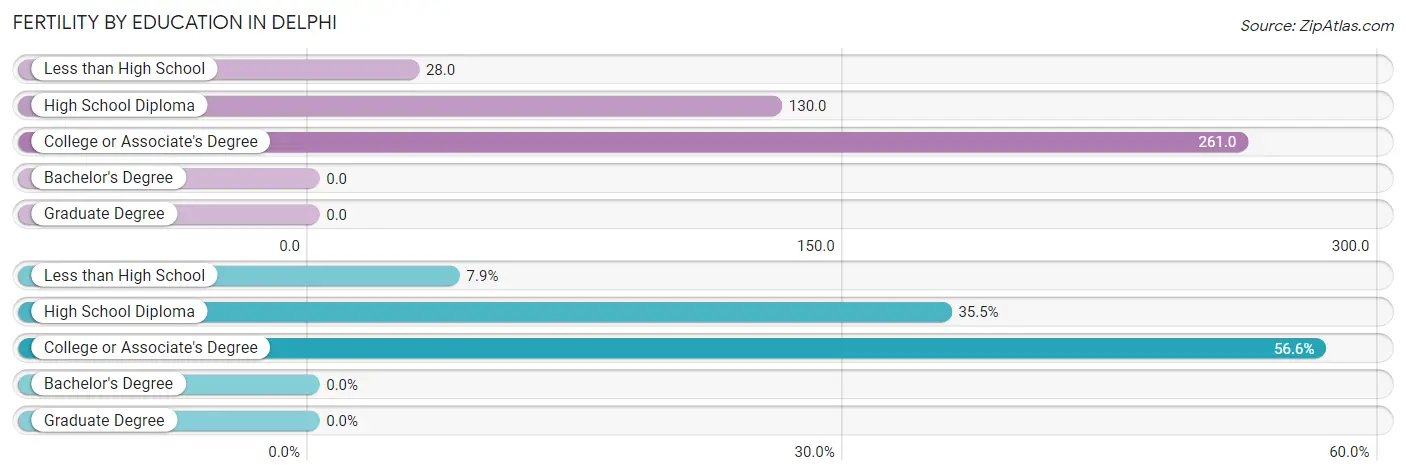
| Educational Attainment | Women with Births | Births / 1,000 Women |
| Less than High School | 6 (7.9%) | 28.0 |
| High School Diploma | 27 (35.5%) | 130.0 |
| College or Associate's Degree | 43 (56.6%) | 261.0 |
| Bachelor's Degree | 0 (0.0%) | 0.0 |
| Graduate Degree | 0 (0.0%) | 0.0 |
| Total | 76 (100.0%) | 111.0 |
Fertility by Education by Marriage Status in Delphi
35.5% of women with births in Delphi are unmarried. Women with the educational attainment of less than high school are most likely to be married with 100.0% of them married at childbirth, while women with the educational attainment of high school diploma are least likely to be married with 100.0% of them unmarried at childbirth.
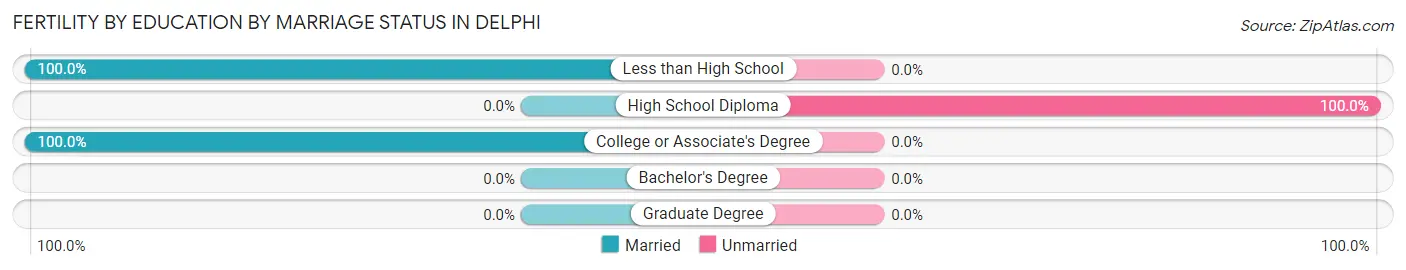
| Educational Attainment | Married | Unmarried |
| Less than High School | 6 (100.0%) | 0 (0.0%) |
| High School Diploma | 0 (0.0%) | 27 (100.0%) |
| College or Associate's Degree | 43 (100.0%) | 0 (0.0%) |
| Bachelor's Degree | 0 (0.0%) | 0 (0.0%) |
| Graduate Degree | 0 (0.0%) | 0 (0.0%) |
| Total | 49 (64.5%) | 27 (35.5%) |
Employment Characteristics in Delphi
Employment by Class of Employer in Delphi
Among the 1,045 employed individuals in Delphi, private company employees (778 | 74.5%), not-for-profit organizations (78 | 7.5%), and state government employees (68 | 6.5%) make up the most common classes of employment.
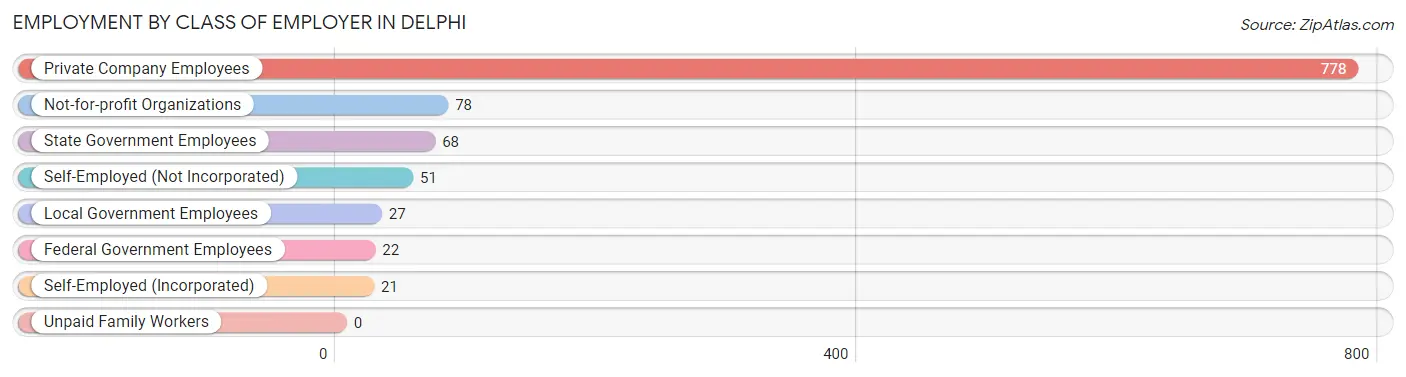
| Employer Class | # Employees | % Employees |
| Private Company Employees | 778 | 74.5% |
| Self-Employed (Incorporated) | 21 | 2.0% |
| Self-Employed (Not Incorporated) | 51 | 4.9% |
| Not-for-profit Organizations | 78 | 7.5% |
| Local Government Employees | 27 | 2.6% |
| State Government Employees | 68 | 6.5% |
| Federal Government Employees | 22 | 2.1% |
| Unpaid Family Workers | 0 | 0.0% |
| Total | 1,045 | 100.0% |
Employment Status by Age in Delphi
According to the labor force statistics for Delphi, out of the total population over 16 years of age (2,293), 49.1% or 1,126 individuals are in the labor force, with 5.0% or 56 of them unemployed. The age group with the highest labor force participation rate is 20 to 24 years, with 91.9% or 124 individuals in the labor force. Within the labor force, the 16 to 19 years age range has the highest percentage of unemployed individuals, with 26.2% or 17 of them being unemployed.
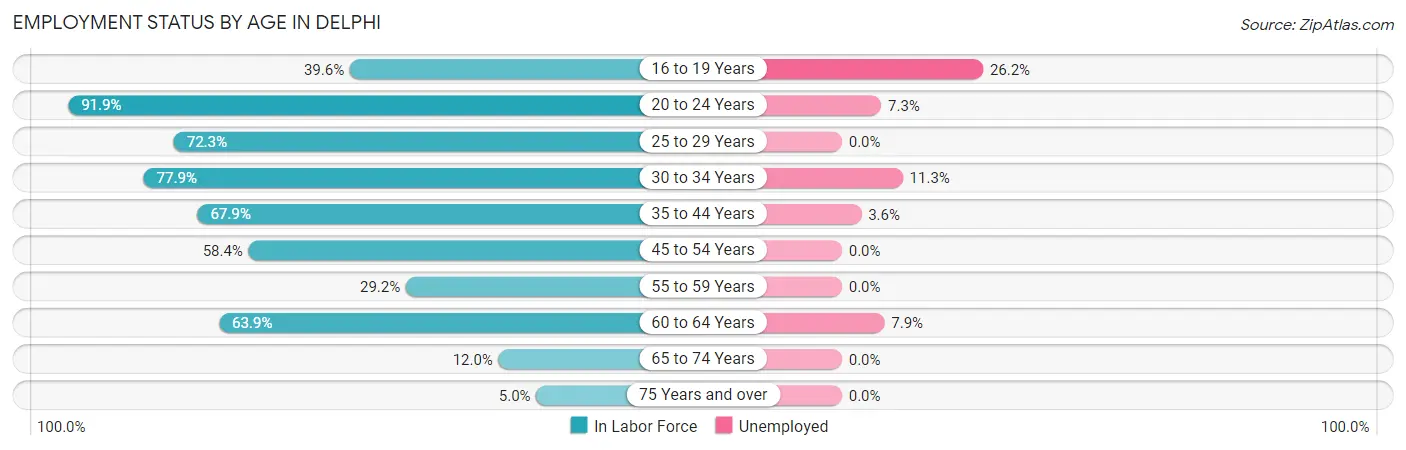
| Age Bracket | In Labor Force | Unemployed |
| 16 to 19 Years | 65 (39.6%) | 17 (26.2%) |
| 20 to 24 Years | 124 (91.9%) | 9 (7.3%) |
| 25 to 29 Years | 125 (72.3%) | 0 (0.0%) |
| 30 to 34 Years | 53 (77.9%) | 6 (11.3%) |
| 35 to 44 Years | 248 (67.9%) | 9 (3.6%) |
| 45 to 54 Years | 248 (58.4%) | 0 (0.0%) |
| 55 to 59 Years | 21 (29.2%) | 0 (0.0%) |
| 60 to 64 Years | 189 (63.9%) | 15 (7.9%) |
| 65 to 74 Years | 40 (12.0%) | 0 (0.0%) |
| 75 Years and over | 13 (5.0%) | 0 (0.0%) |
| Total | 1,126 (49.1%) | 56 (5.0%) |
Employment Status by Educational Attainment in Delphi
According to labor force statistics for Delphi, 63.2% of individuals (884) out of the total population between 25 and 64 years of age (1,399) are in the labor force, with 3.4% or 30 of them being unemployed. The group with the highest labor force participation rate are those with the educational attainment of college / associate degree, with 65.5% or 279 individuals in the labor force. Within the labor force, individuals with college / associate degree education have the highest percentage of unemployment, with 5.4% or 15 of them being unemployed.
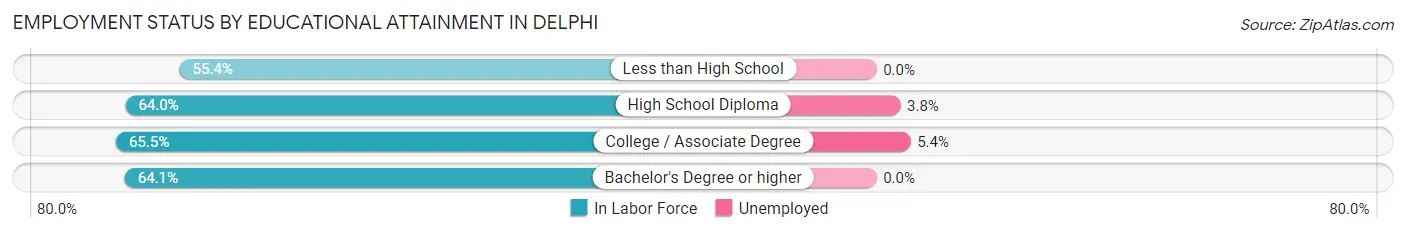
| Educational Attainment | In Labor Force | Unemployed |
| Less than High School | 113 (55.4%) | 0 (0.0%) |
| High School Diploma | 394 (64.0%) | 23 (3.8%) |
| College / Associate Degree | 279 (65.5%) | 23 (5.4%) |
| Bachelor's Degree or higher | 98 (64.1%) | 0 (0.0%) |
| Total | 884 (63.2%) | 48 (3.4%) |
Employment Occupations by Sex in Delphi
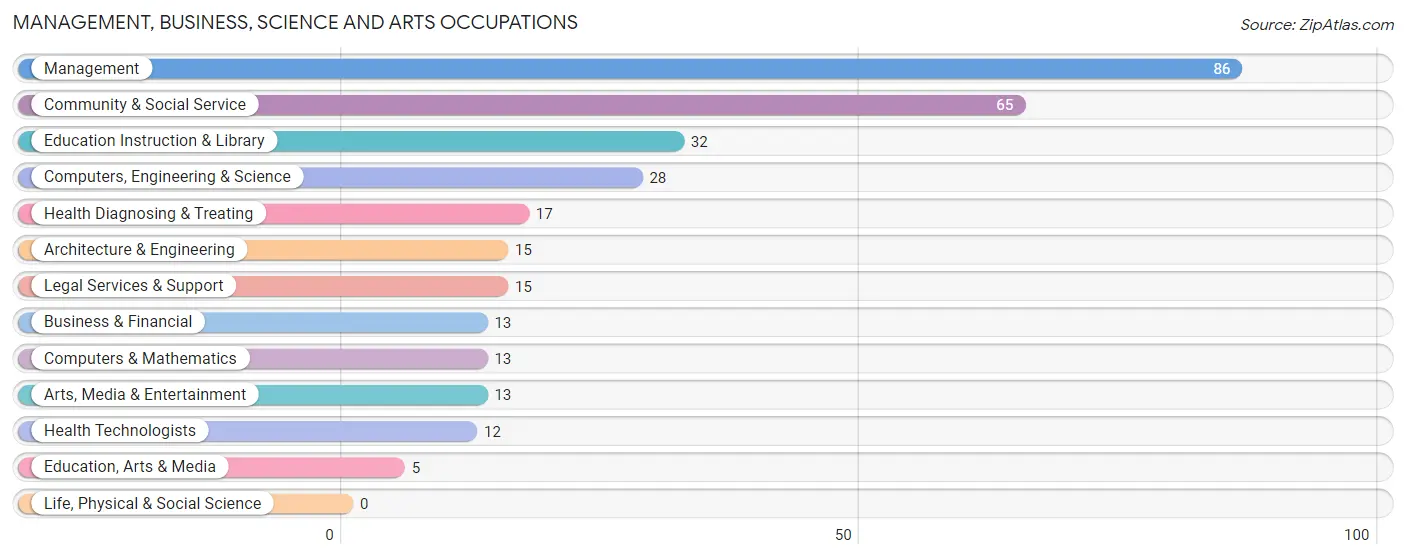
Management, Business, Science and Arts Occupations
The most common Management, Business, Science and Arts occupations in Delphi are Management (86 | 8.0%), Community & Social Service (65 | 6.1%), Education Instruction & Library (32 | 3.0%), Computers, Engineering & Science (28 | 2.6%), and Health Diagnosing & Treating (17 | 1.6%).
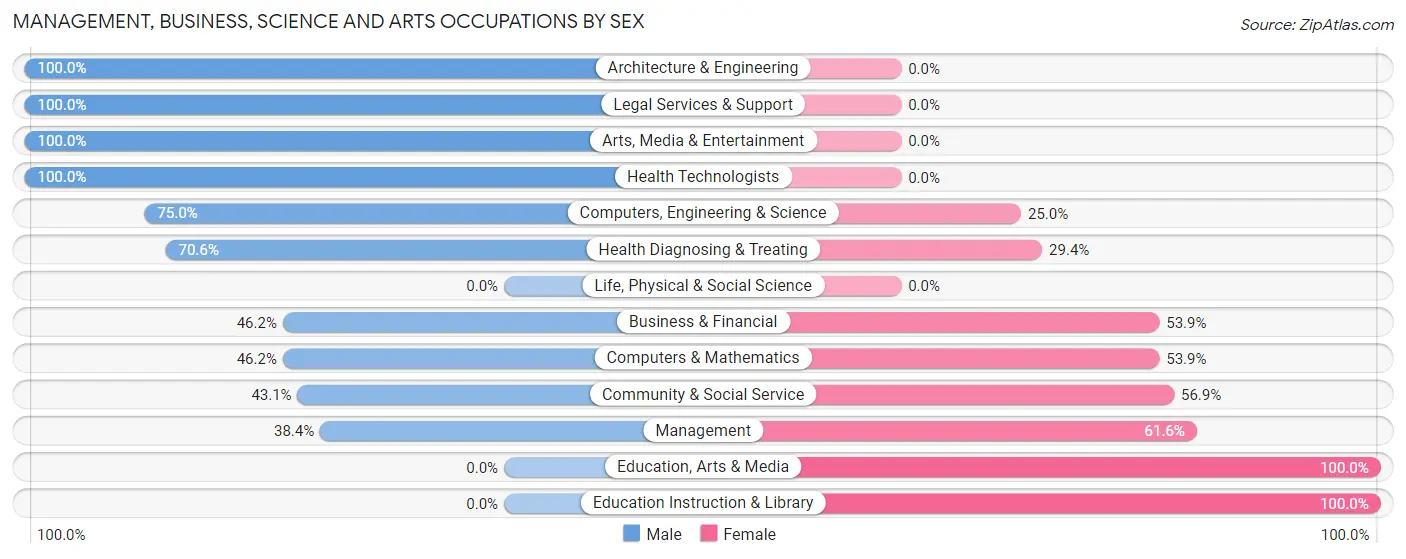
Management, Business, Science and Arts Occupations by Sex
Within the Management, Business, Science and Arts occupations in Delphi, the most male-oriented occupations are Architecture & Engineering (100.0%), Legal Services & Support (100.0%), and Arts, Media & Entertainment (100.0%), while the most female-oriented occupations are Education, Arts & Media (100.0%), Education Instruction & Library (100.0%), and Management (61.6%).
| Occupation | Male | Female |
| Management | 33 (38.4%) | 53 (61.6%) |
| Business & Financial | 6 (46.2%) | 7 (53.8%) |
| Computers, Engineering & Science | 21 (75.0%) | 7 (25.0%) |
| Computers & Mathematics | 6 (46.2%) | 7 (53.8%) |
| Architecture & Engineering | 15 (100.0%) | 0 (0.0%) |
| Life, Physical & Social Science | 0 (0.0%) | 0 (0.0%) |
| Community & Social Service | 28 (43.1%) | 37 (56.9%) |
| Education, Arts & Media | 0 (0.0%) | 5 (100.0%) |
| Legal Services & Support | 15 (100.0%) | 0 (0.0%) |
| Education Instruction & Library | 0 (0.0%) | 32 (100.0%) |
| Arts, Media & Entertainment | 13 (100.0%) | 0 (0.0%) |
| Health Diagnosing & Treating | 12 (70.6%) | 5 (29.4%) |
| Health Technologists | 12 (100.0%) | 0 (0.0%) |
| Total (Category) | 100 (47.8%) | 109 (52.1%) |
| Total (Overall) | 647 (60.5%) | 423 (39.5%) |
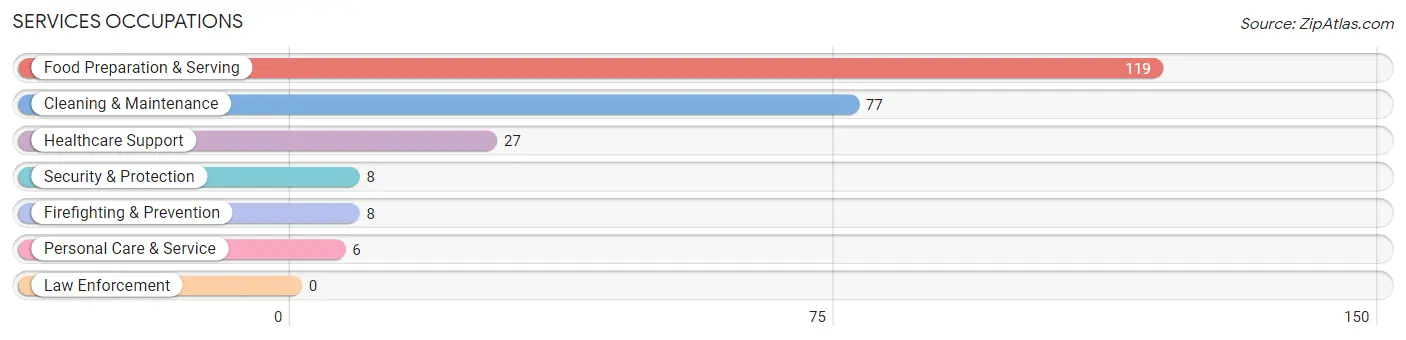
Services Occupations
The most common Services occupations in Delphi are Food Preparation & Serving (119 | 11.1%), Cleaning & Maintenance (77 | 7.2%), Healthcare Support (27 | 2.5%), Security & Protection (8 | 0.7%), and Firefighting & Prevention (8 | 0.7%).
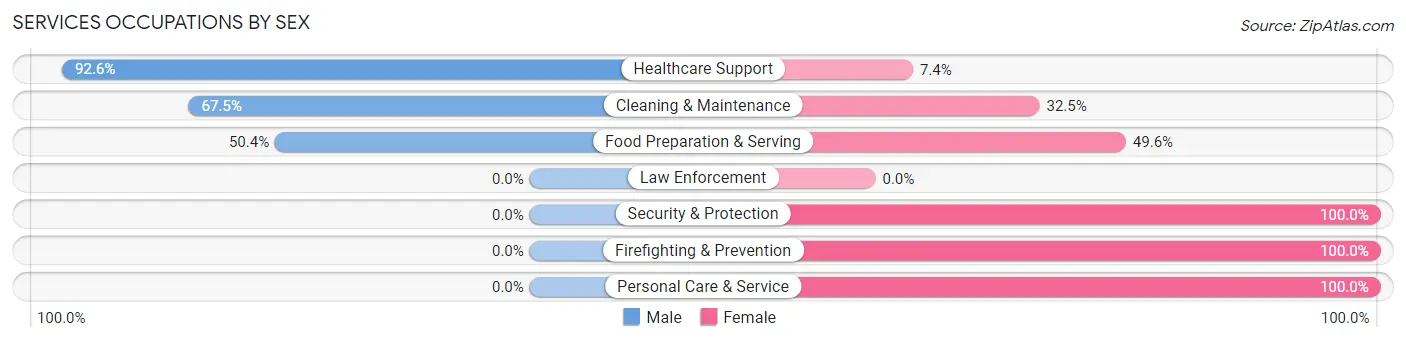
Services Occupations by Sex
Within the Services occupations in Delphi, the most male-oriented occupations are Healthcare Support (92.6%), Cleaning & Maintenance (67.5%), and Food Preparation & Serving (50.4%), while the most female-oriented occupations are Security & Protection (100.0%), Firefighting & Prevention (100.0%), and Personal Care & Service (100.0%).
| Occupation | Male | Female |
| Healthcare Support | 25 (92.6%) | 2 (7.4%) |
| Security & Protection | 0 (0.0%) | 8 (100.0%) |
| Firefighting & Prevention | 0 (0.0%) | 8 (100.0%) |
| Law Enforcement | 0 (0.0%) | 0 (0.0%) |
| Food Preparation & Serving | 60 (50.4%) | 59 (49.6%) |
| Cleaning & Maintenance | 52 (67.5%) | 25 (32.5%) |
| Personal Care & Service | 0 (0.0%) | 6 (100.0%) |
| Total (Category) | 137 (57.8%) | 100 (42.2%) |
| Total (Overall) | 647 (60.5%) | 423 (39.5%) |
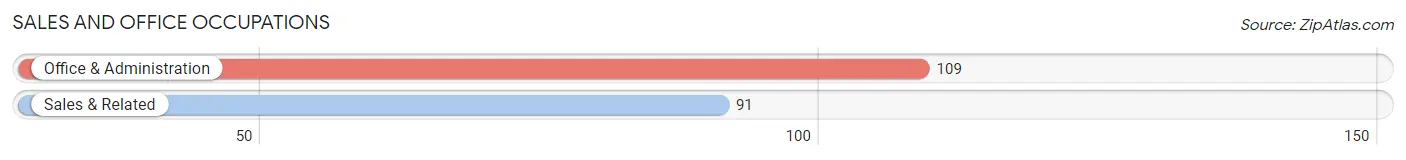
Sales and Office Occupations
The most common Sales and Office occupations in Delphi are Office & Administration (109 | 10.2%), and Sales & Related (91 | 8.5%).
Sales and Office Occupations by Sex
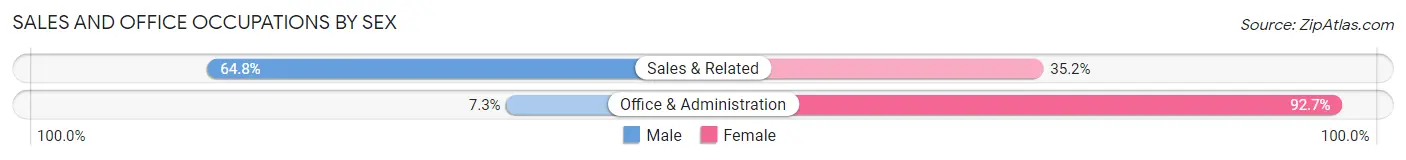
| Occupation | Male | Female |
| Sales & Related | 59 (64.8%) | 32 (35.2%) |
| Office & Administration | 8 (7.3%) | 101 (92.7%) |
| Total (Category) | 67 (33.5%) | 133 (66.5%) |
| Total (Overall) | 647 (60.5%) | 423 (39.5%) |
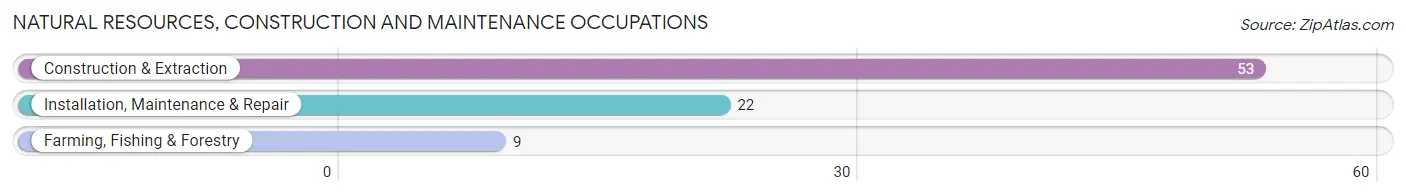
Natural Resources, Construction and Maintenance Occupations
The most common Natural Resources, Construction and Maintenance occupations in Delphi are Construction & Extraction (53 | 5.0%), Installation, Maintenance & Repair (22 | 2.1%), and Farming, Fishing & Forestry (9 | 0.8%).
Natural Resources, Construction and Maintenance Occupations by Sex
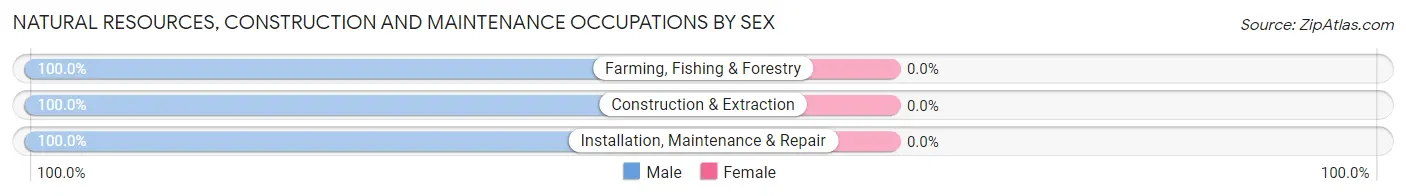
| Occupation | Male | Female |
| Farming, Fishing & Forestry | 9 (100.0%) | 0 (0.0%) |
| Construction & Extraction | 53 (100.0%) | 0 (0.0%) |
| Installation, Maintenance & Repair | 22 (100.0%) | 0 (0.0%) |
| Total (Category) | 84 (100.0%) | 0 (0.0%) |
| Total (Overall) | 647 (60.5%) | 423 (39.5%) |
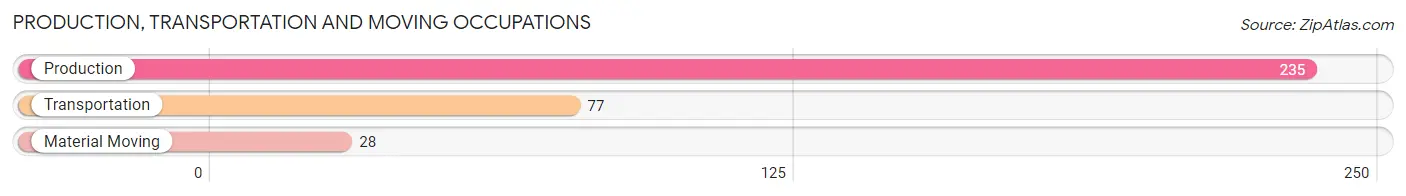
Production, Transportation and Moving Occupations
The most common Production, Transportation and Moving occupations in Delphi are Production (235 | 22.0%), Transportation (77 | 7.2%), and Material Moving (28 | 2.6%).
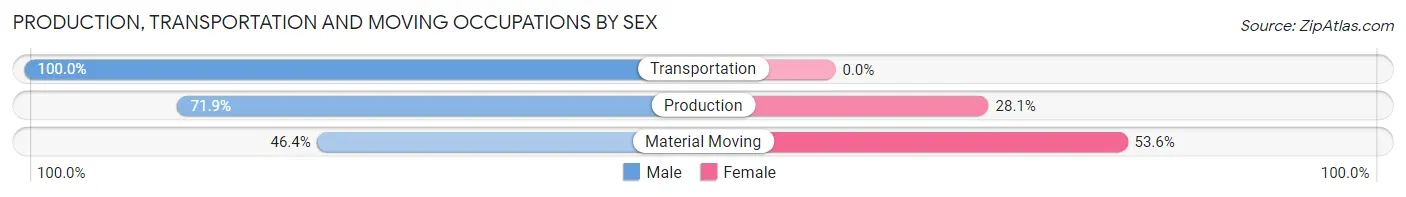
Production, Transportation and Moving Occupations by Sex
| Occupation | Male | Female |
| Production | 169 (71.9%) | 66 (28.1%) |
| Transportation | 77 (100.0%) | 0 (0.0%) |
| Material Moving | 13 (46.4%) | 15 (53.6%) |
| Total (Category) | 259 (76.2%) | 81 (23.8%) |
| Total (Overall) | 647 (60.5%) | 423 (39.5%) |
Employment Industries by Sex in Delphi
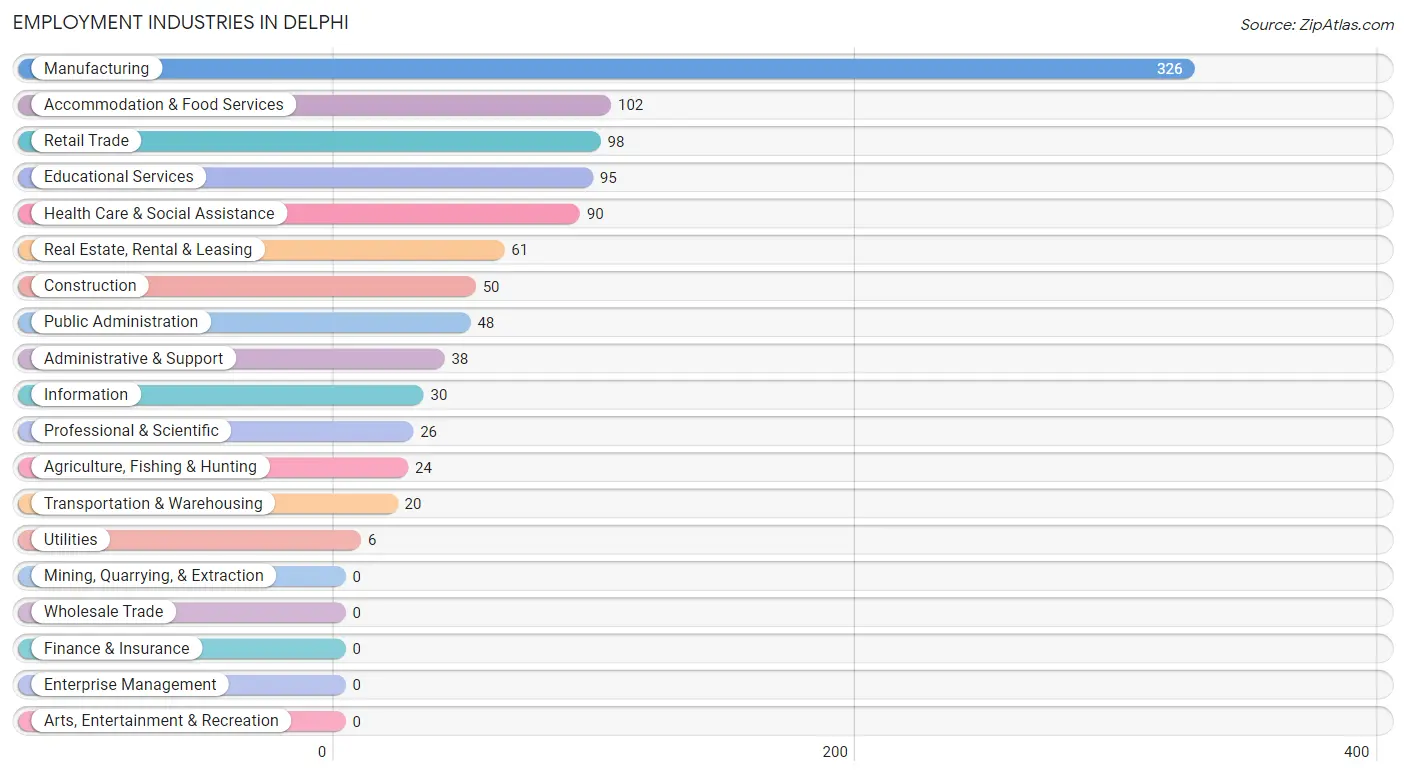
Employment Industries in Delphi
The major employment industries in Delphi include Manufacturing (326 | 30.5%), Accommodation & Food Services (102 | 9.5%), Retail Trade (98 | 9.2%), Educational Services (95 | 8.9%), and Health Care & Social Assistance (90 | 8.4%).
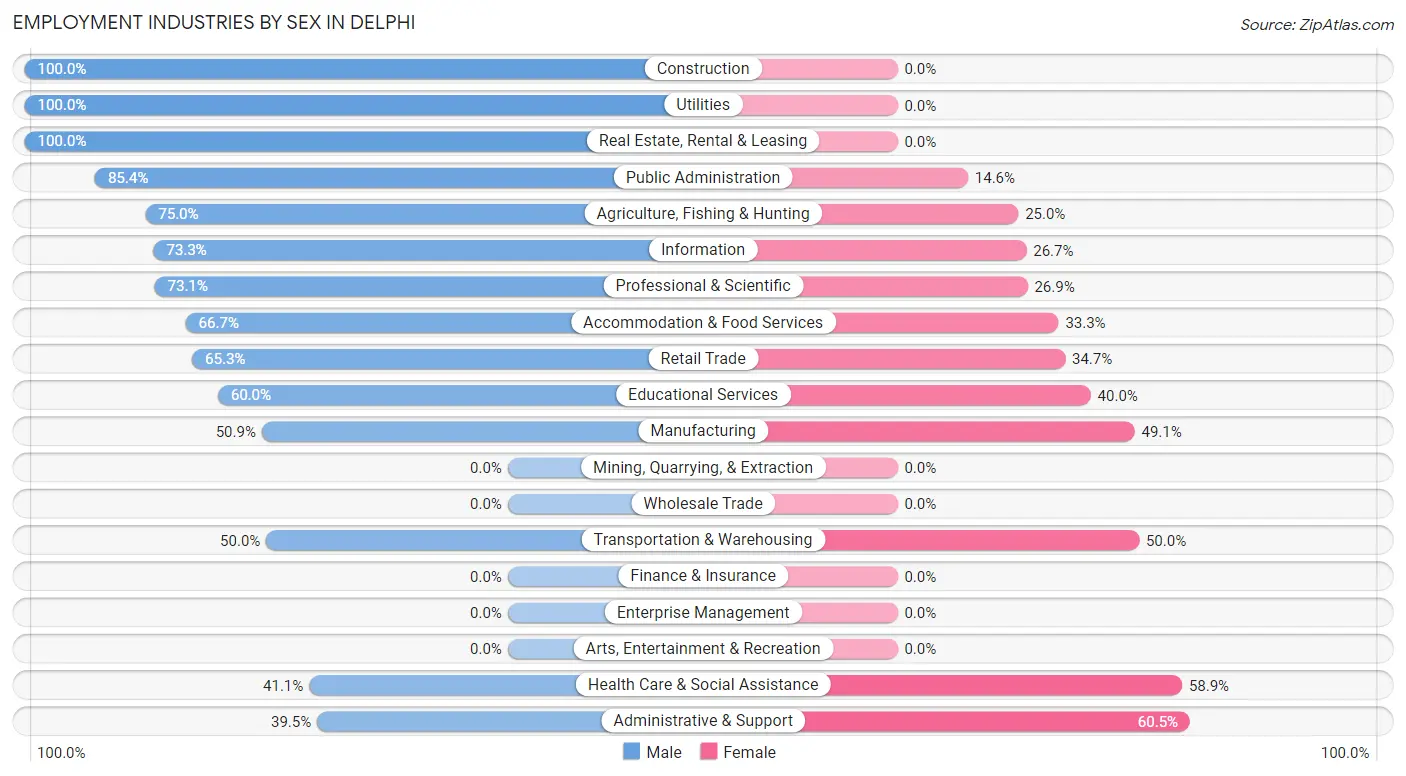
Employment Industries by Sex in Delphi
The Delphi industries that see more men than women are Construction (100.0%), Utilities (100.0%), and Real Estate, Rental & Leasing (100.0%), whereas the industries that tend to have a higher number of women are Administrative & Support (60.5%), Health Care & Social Assistance (58.9%), and Transportation & Warehousing (50.0%).
| Industry | Male | Female |
| Agriculture, Fishing & Hunting | 18 (75.0%) | 6 (25.0%) |
| Mining, Quarrying, & Extraction | 0 (0.0%) | 0 (0.0%) |
| Construction | 50 (100.0%) | 0 (0.0%) |
| Manufacturing | 166 (50.9%) | 160 (49.1%) |
| Wholesale Trade | 0 (0.0%) | 0 (0.0%) |
| Retail Trade | 64 (65.3%) | 34 (34.7%) |
| Transportation & Warehousing | 10 (50.0%) | 10 (50.0%) |
| Utilities | 6 (100.0%) | 0 (0.0%) |
| Information | 22 (73.3%) | 8 (26.7%) |
| Finance & Insurance | 0 (0.0%) | 0 (0.0%) |
| Real Estate, Rental & Leasing | 61 (100.0%) | 0 (0.0%) |
| Professional & Scientific | 19 (73.1%) | 7 (26.9%) |
| Enterprise Management | 0 (0.0%) | 0 (0.0%) |
| Administrative & Support | 15 (39.5%) | 23 (60.5%) |
| Educational Services | 57 (60.0%) | 38 (40.0%) |
| Health Care & Social Assistance | 37 (41.1%) | 53 (58.9%) |
| Arts, Entertainment & Recreation | 0 (0.0%) | 0 (0.0%) |
| Accommodation & Food Services | 68 (66.7%) | 34 (33.3%) |
| Public Administration | 41 (85.4%) | 7 (14.6%) |
| Total | 647 (60.5%) | 423 (39.5%) |
Education in Delphi
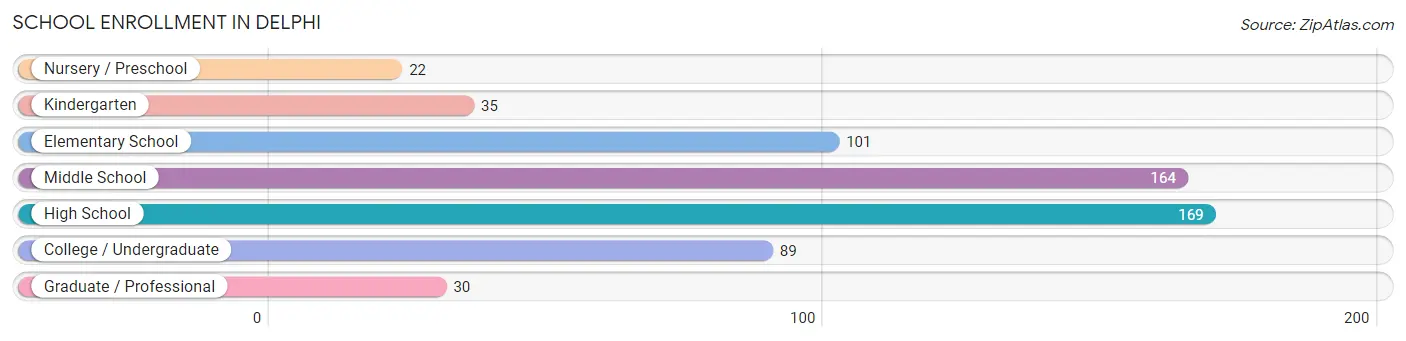
School Enrollment in Delphi
The most common levels of schooling among the 610 students in Delphi are high school (169 | 27.7%), middle school (164 | 26.9%), and elementary school (101 | 16.6%).
| School Level | # Students | % Students |
| Nursery / Preschool | 22 | 3.6% |
| Kindergarten | 35 | 5.7% |
| Elementary School | 101 | 16.6% |
| Middle School | 164 | 26.9% |
| High School | 169 | 27.7% |
| College / Undergraduate | 89 | 14.6% |
| Graduate / Professional | 30 | 4.9% |
| Total | 610 | 100.0% |
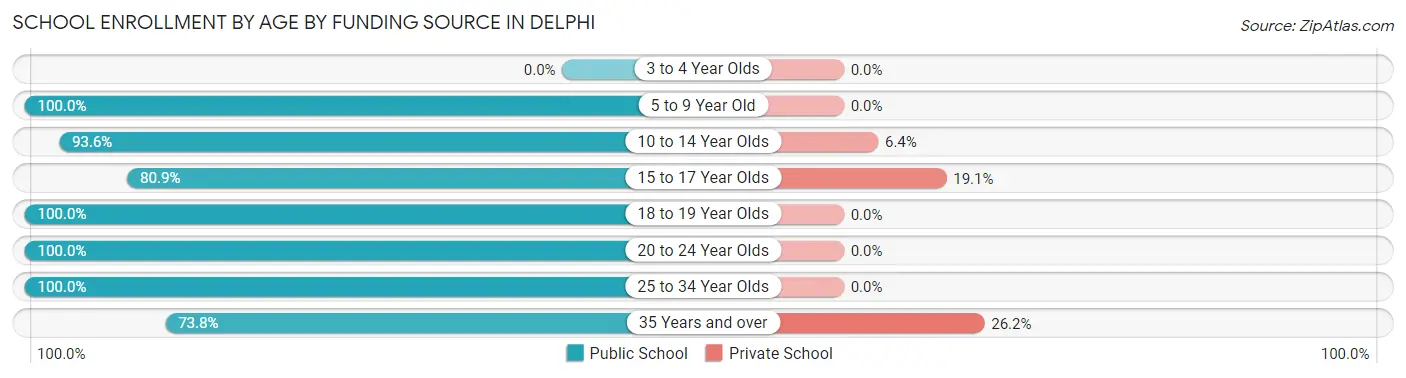
School Enrollment by Age by Funding Source in Delphi
Out of a total of 610 students who are enrolled in schools in Delphi, 63 (10.3%) attend a private institution, while the remaining 547 (89.7%) are enrolled in public schools. The age group of 35 years and over has the highest likelihood of being enrolled in private schools, with 22 (26.2% in the age bracket) enrolled. Conversely, the age group of 5 to 9 year old has the lowest likelihood of being enrolled in a private school, with 141 (100.0% in the age bracket) attending a public institution.
| Age Bracket | Public School | Private School |
| 3 to 4 Year Olds | 0 (0.0%) | 0 (0.0%) |
| 5 to 9 Year Old | 141 (100.0%) | 0 (0.0%) |
| 10 to 14 Year Olds | 161 (93.6%) | 11 (6.4%) |
| 15 to 17 Year Olds | 127 (80.9%) | 30 (19.1%) |
| 18 to 19 Year Olds | 30 (100.0%) | 0 (0.0%) |
| 20 to 24 Year Olds | 8 (100.0%) | 0 (0.0%) |
| 25 to 34 Year Olds | 18 (100.0%) | 0 (0.0%) |
| 35 Years and over | 62 (73.8%) | 22 (26.2%) |
| Total | 547 (89.7%) | 63 (10.3%) |
Educational Attainment by Field of Study in Delphi
Business (68 | 29.8%), science & technology (39 | 17.1%), education (26 | 11.4%), bio, nature & agricultural (18 | 7.9%), and liberal arts & history (18 | 7.9%) are the most common fields of study among 228 individuals in Delphi who have obtained a bachelor's degree or higher.
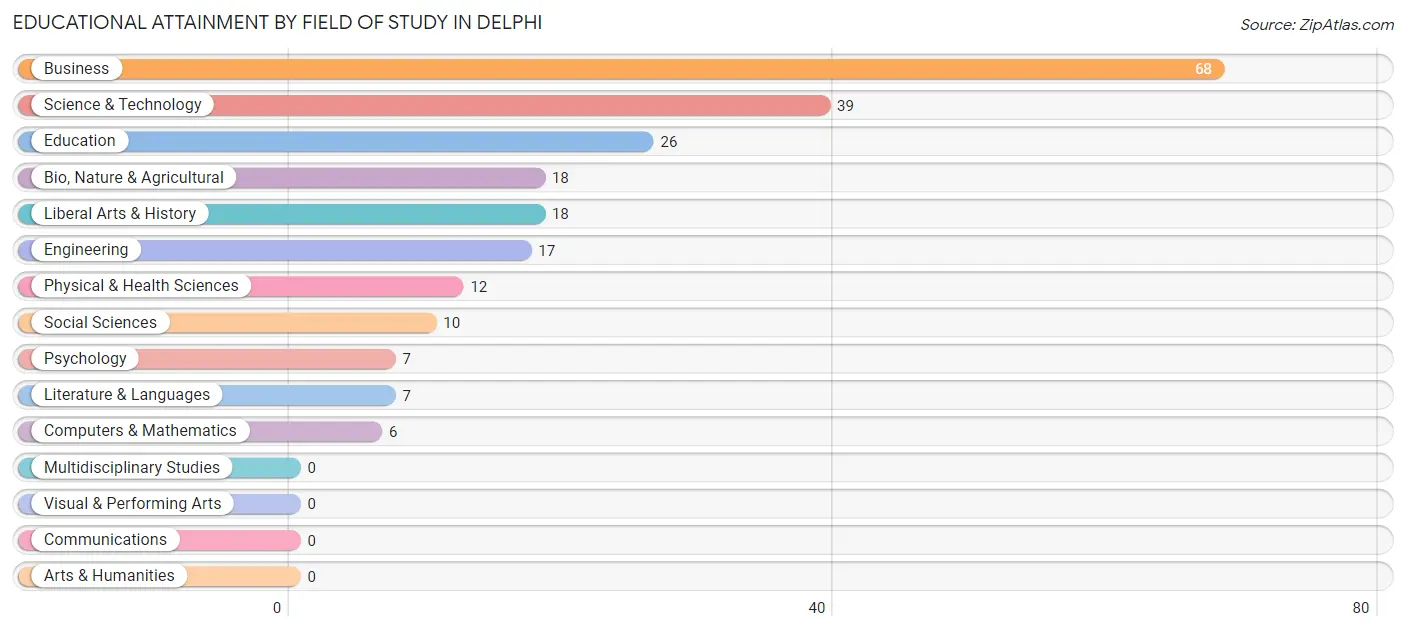
| Field of Study | # Graduates | % Graduates |
| Computers & Mathematics | 6 | 2.6% |
| Bio, Nature & Agricultural | 18 | 7.9% |
| Physical & Health Sciences | 12 | 5.3% |
| Psychology | 7 | 3.1% |
| Social Sciences | 10 | 4.4% |
| Engineering | 17 | 7.5% |
| Multidisciplinary Studies | 0 | 0.0% |
| Science & Technology | 39 | 17.1% |
| Business | 68 | 29.8% |
| Education | 26 | 11.4% |
| Literature & Languages | 7 | 3.1% |
| Liberal Arts & History | 18 | 7.9% |
| Visual & Performing Arts | 0 | 0.0% |
| Communications | 0 | 0.0% |
| Arts & Humanities | 0 | 0.0% |
| Total | 228 | 100.0% |
Transportation & Commute in Delphi
Vehicle Availability by Sex in Delphi
The most prevalent vehicle ownership categories in Delphi are males with 2 vehicles (245, accounting for 38.8%) and females with 2 vehicles (147, making up 59.3%).
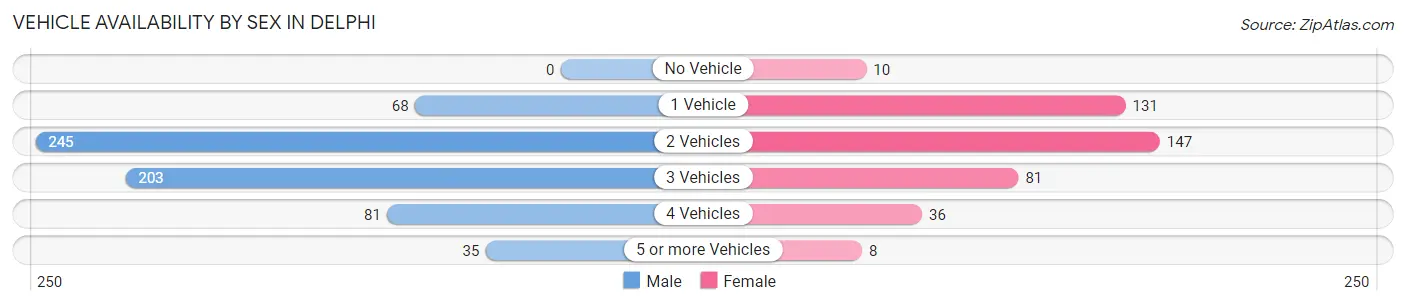
| Vehicles Available | Male | Female |
| No Vehicle | 0 (0.0%) | 10 (2.4%) |
| 1 Vehicle | 68 (10.8%) | 131 (31.7%) |
| 2 Vehicles | 245 (38.8%) | 147 (35.6%) |
| 3 Vehicles | 203 (32.1%) | 81 (19.6%) |
| 4 Vehicles | 81 (12.8%) | 36 (8.7%) |
| 5 or more Vehicles | 35 (5.5%) | 8 (1.9%) |
| Total | 632 (100.0%) | 413 (100.0%) |
Commute Time in Delphi
The most frequently occuring commute durations in Delphi are 30 to 34 minutes (251 commuters, 24.9%), 10 to 14 minutes (173 commuters, 17.2%), and 20 to 24 minutes (108 commuters, 10.7%).
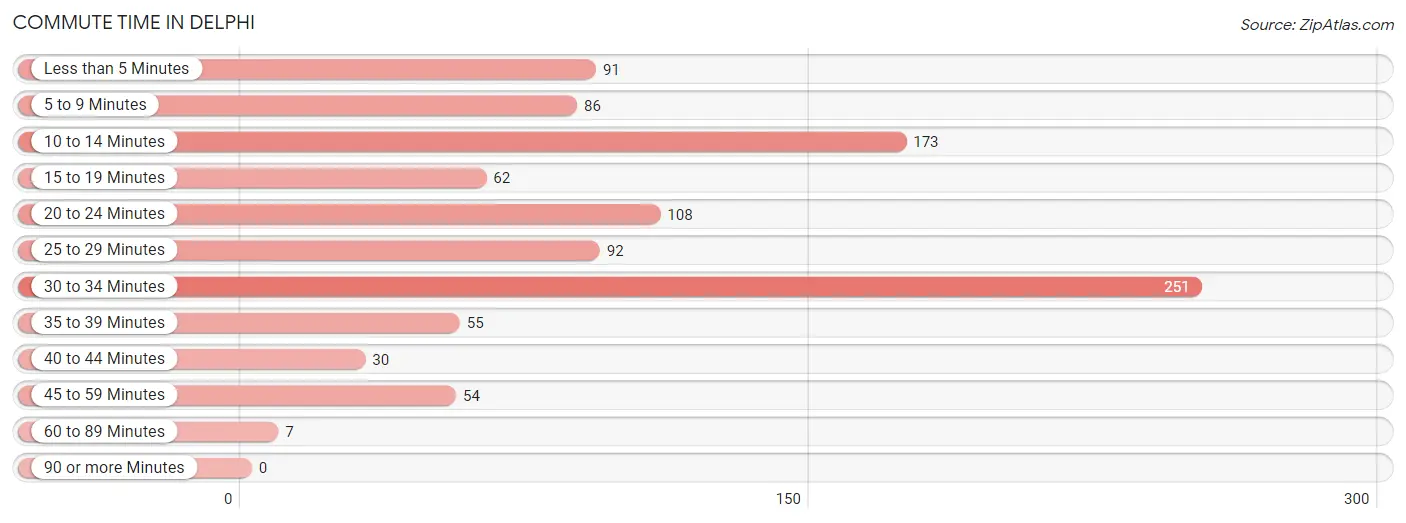
| Commute Time | # Commuters | % Commuters |
| Less than 5 Minutes | 91 | 9.0% |
| 5 to 9 Minutes | 86 | 8.5% |
| 10 to 14 Minutes | 173 | 17.2% |
| 15 to 19 Minutes | 62 | 6.1% |
| 20 to 24 Minutes | 108 | 10.7% |
| 25 to 29 Minutes | 92 | 9.1% |
| 30 to 34 Minutes | 251 | 24.9% |
| 35 to 39 Minutes | 55 | 5.4% |
| 40 to 44 Minutes | 30 | 3.0% |
| 45 to 59 Minutes | 54 | 5.3% |
| 60 to 89 Minutes | 7 | 0.7% |
| 90 or more Minutes | 0 | 0.0% |
Commute Time by Sex in Delphi
The most common commute times in Delphi are 30 to 34 minutes (134 commuters, 21.6%) for males and 30 to 34 minutes (117 commuters, 30.1%) for females.
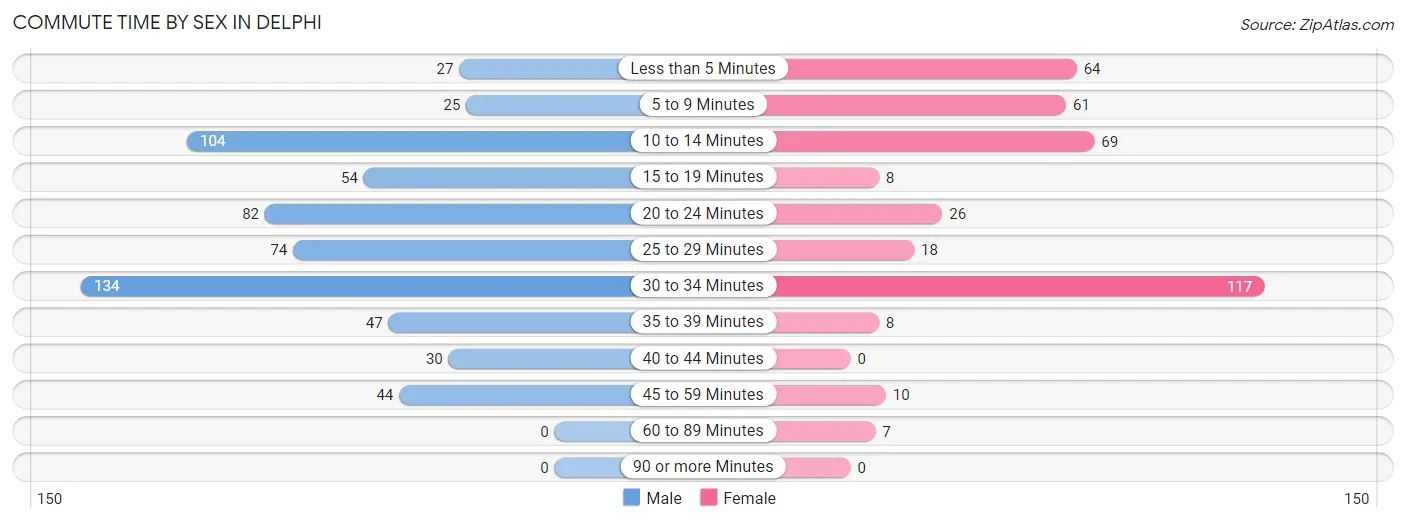
| Commute Time | Male | Female |
| Less than 5 Minutes | 27 (4.3%) | 64 (16.5%) |
| 5 to 9 Minutes | 25 (4.0%) | 61 (15.7%) |
| 10 to 14 Minutes | 104 (16.8%) | 69 (17.8%) |
| 15 to 19 Minutes | 54 (8.7%) | 8 (2.1%) |
| 20 to 24 Minutes | 82 (13.2%) | 26 (6.7%) |
| 25 to 29 Minutes | 74 (11.9%) | 18 (4.6%) |
| 30 to 34 Minutes | 134 (21.6%) | 117 (30.1%) |
| 35 to 39 Minutes | 47 (7.6%) | 8 (2.1%) |
| 40 to 44 Minutes | 30 (4.8%) | 0 (0.0%) |
| 45 to 59 Minutes | 44 (7.1%) | 10 (2.6%) |
| 60 to 89 Minutes | 0 (0.0%) | 7 (1.8%) |
| 90 or more Minutes | 0 (0.0%) | 0 (0.0%) |
Time of Departure to Work by Sex in Delphi
The most frequent times of departure to work in Delphi are 5:00 AM to 5:29 AM (108, 17.4%) for males and 12:00 PM to 3:59 PM (94, 24.2%) for females.
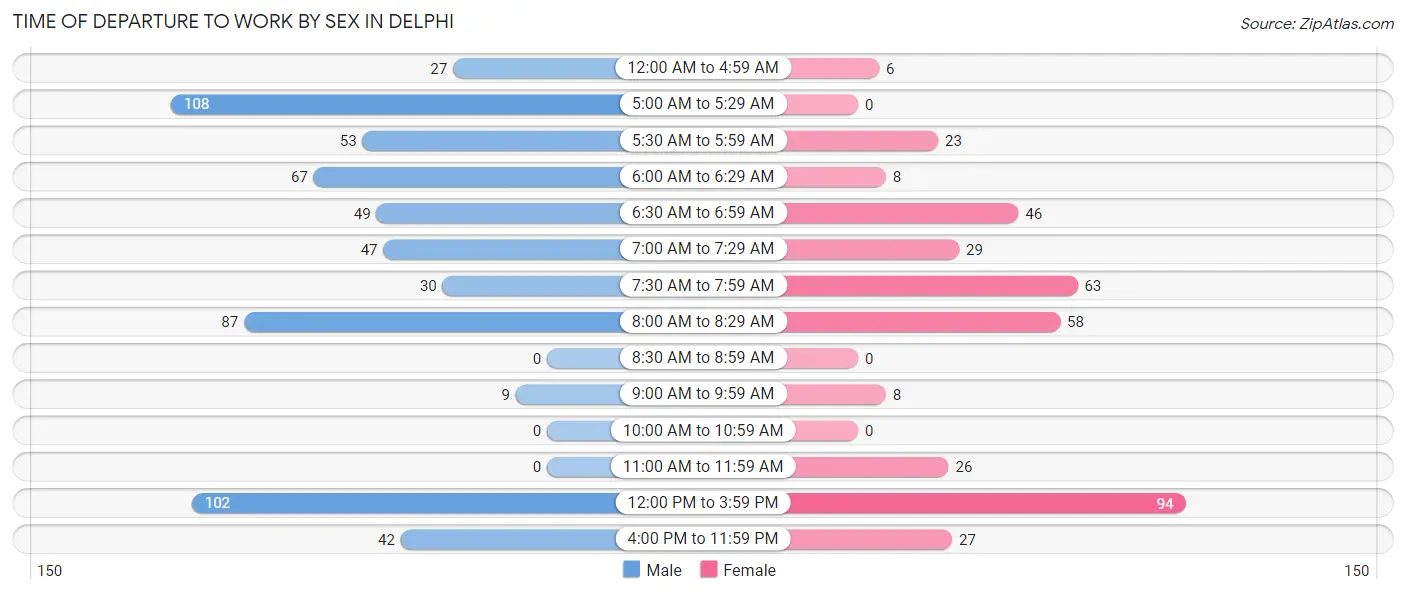
| Time of Departure | Male | Female |
| 12:00 AM to 4:59 AM | 27 (4.3%) | 6 (1.5%) |
| 5:00 AM to 5:29 AM | 108 (17.4%) | 0 (0.0%) |
| 5:30 AM to 5:59 AM | 53 (8.5%) | 23 (5.9%) |
| 6:00 AM to 6:29 AM | 67 (10.8%) | 8 (2.1%) |
| 6:30 AM to 6:59 AM | 49 (7.9%) | 46 (11.9%) |
| 7:00 AM to 7:29 AM | 47 (7.6%) | 29 (7.5%) |
| 7:30 AM to 7:59 AM | 30 (4.8%) | 63 (16.2%) |
| 8:00 AM to 8:29 AM | 87 (14.0%) | 58 (14.9%) |
| 8:30 AM to 8:59 AM | 0 (0.0%) | 0 (0.0%) |
| 9:00 AM to 9:59 AM | 9 (1.5%) | 8 (2.1%) |
| 10:00 AM to 10:59 AM | 0 (0.0%) | 0 (0.0%) |
| 11:00 AM to 11:59 AM | 0 (0.0%) | 26 (6.7%) |
| 12:00 PM to 3:59 PM | 102 (16.4%) | 94 (24.2%) |
| 4:00 PM to 11:59 PM | 42 (6.8%) | 27 (7.0%) |
| Total | 621 (100.0%) | 388 (100.0%) |
Housing Occupancy in Delphi
Occupancy by Ownership in Delphi
Of the total 1,067 dwellings in Delphi, owner-occupied units account for 655 (61.4%), while renter-occupied units make up 412 (38.6%).
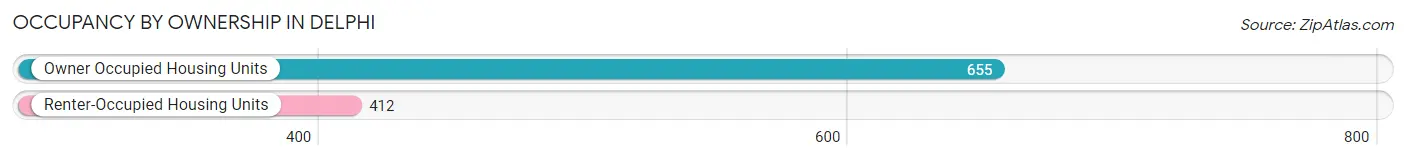
| Occupancy | # Housing Units | % Housing Units |
| Owner Occupied Housing Units | 655 | 61.4% |
| Renter-Occupied Housing Units | 412 | 38.6% |
| Total Occupied Housing Units | 1,067 | 100.0% |
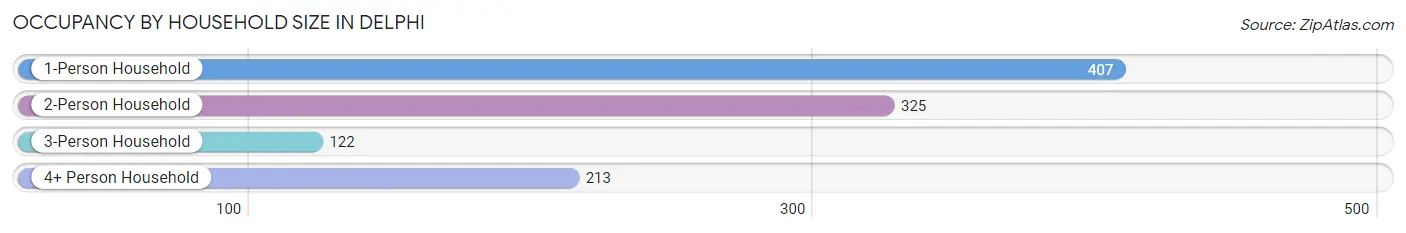
Occupancy by Household Size in Delphi
| Household Size | # Housing Units | % Housing Units |
| 1-Person Household | 407 | 38.1% |
| 2-Person Household | 325 | 30.5% |
| 3-Person Household | 122 | 11.4% |
| 4+ Person Household | 213 | 20.0% |
| Total Housing Units | 1,067 | 100.0% |
Occupancy by Ownership by Household Size in Delphi
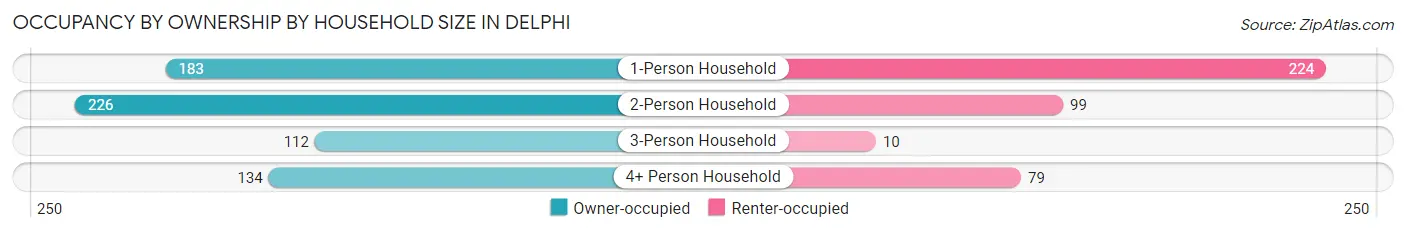
| Household Size | Owner-occupied | Renter-occupied |
| 1-Person Household | 183 (45.0%) | 224 (55.0%) |
| 2-Person Household | 226 (69.5%) | 99 (30.5%) |
| 3-Person Household | 112 (91.8%) | 10 (8.2%) |
| 4+ Person Household | 134 (62.9%) | 79 (37.1%) |
| Total Housing Units | 655 (61.4%) | 412 (38.6%) |
Occupancy by Educational Attainment in Delphi
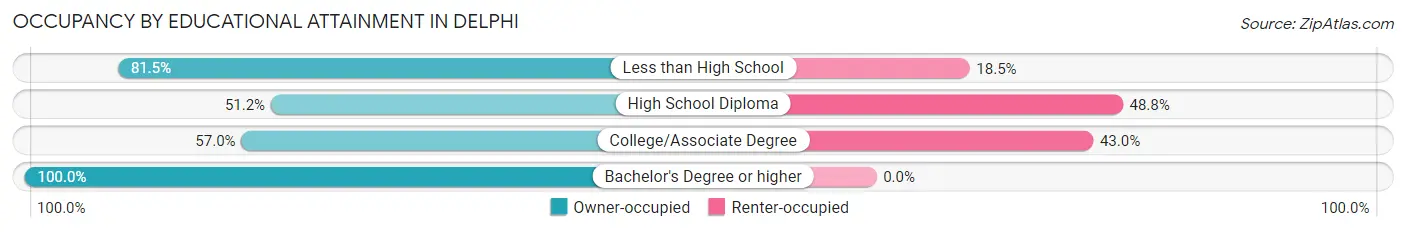
| Household Size | Owner-occupied | Renter-occupied |
| Less than High School | 97 (81.5%) | 22 (18.5%) |
| High School Diploma | 264 (51.2%) | 252 (48.8%) |
| College/Associate Degree | 183 (57.0%) | 138 (43.0%) |
| Bachelor's Degree or higher | 111 (100.0%) | 0 (0.0%) |
Occupancy by Age of Householder in Delphi
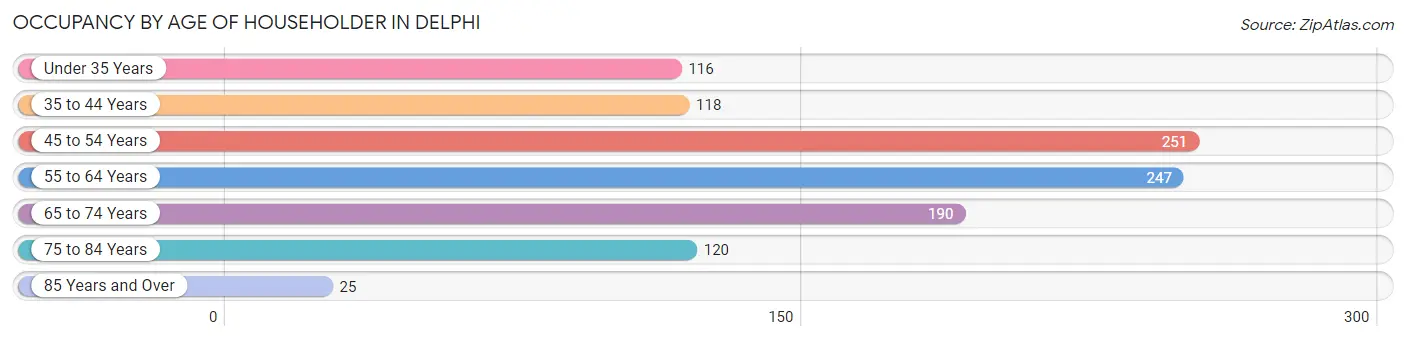
| Age Bracket | # Households | % Households |
| Under 35 Years | 116 | 10.9% |
| 35 to 44 Years | 118 | 11.1% |
| 45 to 54 Years | 251 | 23.5% |
| 55 to 64 Years | 247 | 23.2% |
| 65 to 74 Years | 190 | 17.8% |
| 75 to 84 Years | 120 | 11.3% |
| 85 Years and Over | 25 | 2.3% |
| Total | 1,067 | 100.0% |
Housing Finances in Delphi
Median Income by Occupancy in Delphi
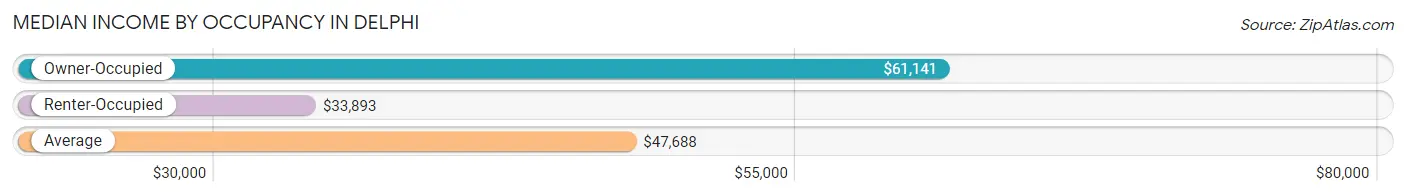
| Occupancy Type | # Households | Median Income |
| Owner-Occupied | 655 (61.4%) | $61,141 |
| Renter-Occupied | 412 (38.6%) | $33,893 |
| Average | 1,067 (100.0%) | $47,688 |
Occupancy by Householder Income Bracket in Delphi
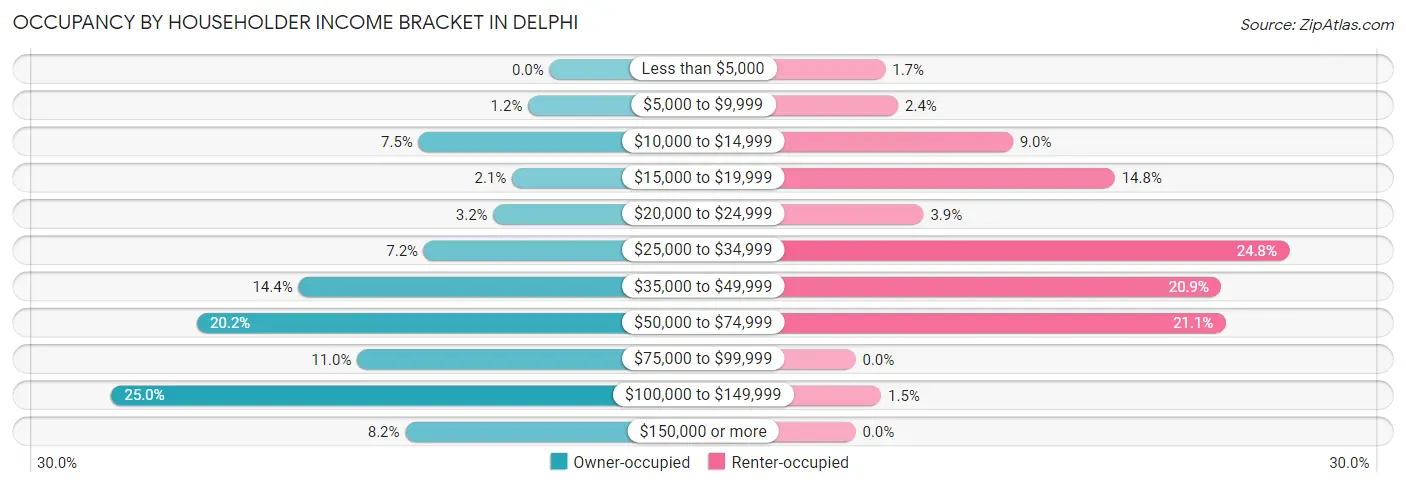
| Income Bracket | Owner-occupied | Renter-occupied |
| Less than $5,000 | 0 (0.0%) | 7 (1.7%) |
| $5,000 to $9,999 | 8 (1.2%) | 10 (2.4%) |
| $10,000 to $14,999 | 49 (7.5%) | 37 (9.0%) |
| $15,000 to $19,999 | 14 (2.1%) | 61 (14.8%) |
| $20,000 to $24,999 | 21 (3.2%) | 16 (3.9%) |
| $25,000 to $34,999 | 47 (7.2%) | 102 (24.8%) |
| $35,000 to $49,999 | 94 (14.3%) | 86 (20.9%) |
| $50,000 to $74,999 | 132 (20.2%) | 87 (21.1%) |
| $75,000 to $99,999 | 72 (11.0%) | 0 (0.0%) |
| $100,000 to $149,999 | 164 (25.0%) | 6 (1.5%) |
| $150,000 or more | 54 (8.2%) | 0 (0.0%) |
| Total | 655 (100.0%) | 412 (100.0%) |
Monthly Housing Cost Tiers in Delphi
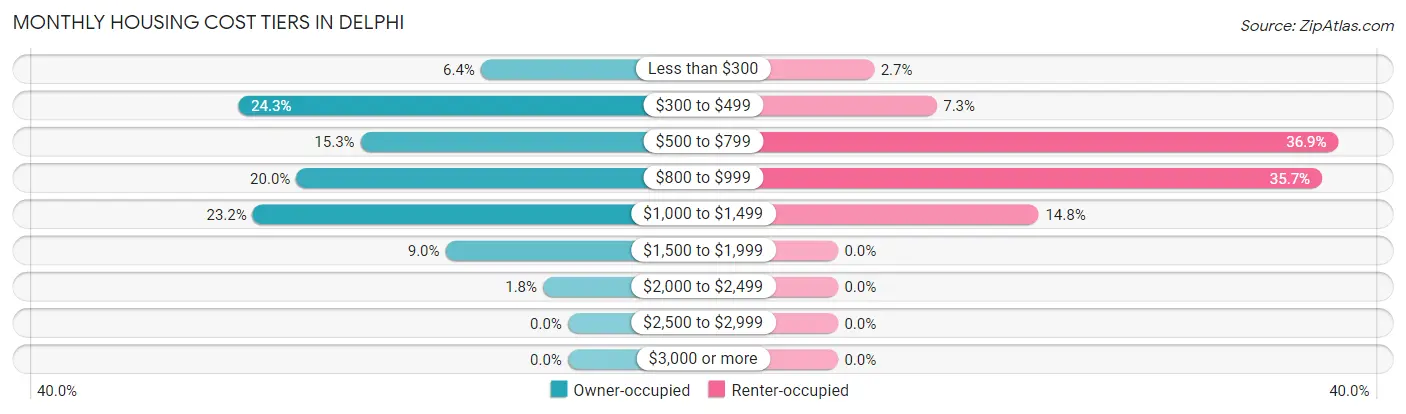
| Monthly Cost | Owner-occupied | Renter-occupied |
| Less than $300 | 42 (6.4%) | 11 (2.7%) |
| $300 to $499 | 159 (24.3%) | 30 (7.3%) |
| $500 to $799 | 100 (15.3%) | 152 (36.9%) |
| $800 to $999 | 131 (20.0%) | 147 (35.7%) |
| $1,000 to $1,499 | 152 (23.2%) | 61 (14.8%) |
| $1,500 to $1,999 | 59 (9.0%) | 0 (0.0%) |
| $2,000 to $2,499 | 12 (1.8%) | 0 (0.0%) |
| $2,500 to $2,999 | 0 (0.0%) | 0 (0.0%) |
| $3,000 or more | 0 (0.0%) | 0 (0.0%) |
| Total | 655 (100.0%) | 412 (100.0%) |
Physical Housing Characteristics in Delphi
Housing Structures in Delphi

| Structure Type | # Housing Units | % Housing Units |
| Single Unit, Detached | 693 | 64.9% |
| Single Unit, Attached | 22 | 2.1% |
| 2 Unit Apartments | 62 | 5.8% |
| 3 or 4 Unit Apartments | 23 | 2.2% |
| 5 to 9 Unit Apartments | 76 | 7.1% |
| 10 or more Apartments | 96 | 9.0% |
| Mobile Home / Other | 95 | 8.9% |
| Total | 1,067 | 100.0% |
Housing Structures by Occupancy in Delphi
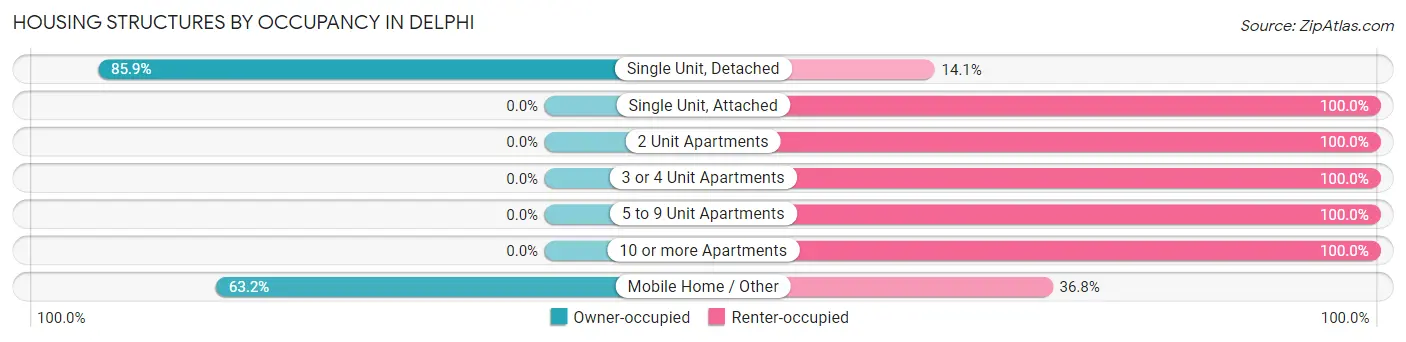
| Structure Type | Owner-occupied | Renter-occupied |
| Single Unit, Detached | 595 (85.9%) | 98 (14.1%) |
| Single Unit, Attached | 0 (0.0%) | 22 (100.0%) |
| 2 Unit Apartments | 0 (0.0%) | 62 (100.0%) |
| 3 or 4 Unit Apartments | 0 (0.0%) | 23 (100.0%) |
| 5 to 9 Unit Apartments | 0 (0.0%) | 76 (100.0%) |
| 10 or more Apartments | 0 (0.0%) | 96 (100.0%) |
| Mobile Home / Other | 60 (63.2%) | 35 (36.8%) |
| Total | 655 (61.4%) | 412 (38.6%) |
Housing Structures by Number of Rooms in Delphi
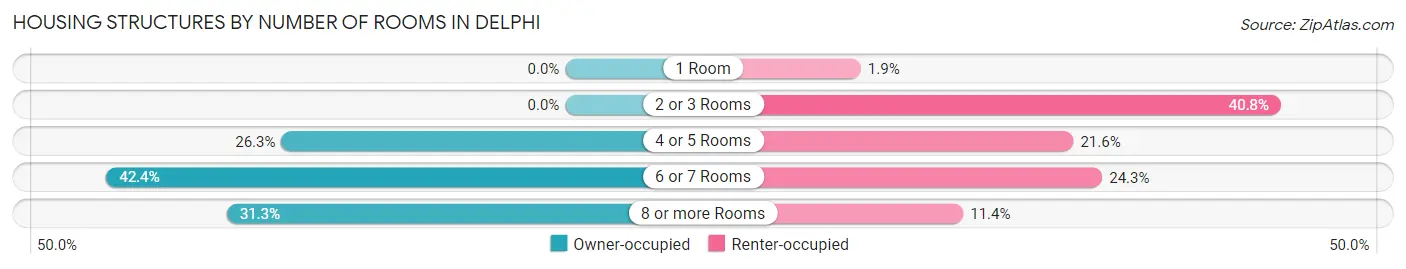
| Number of Rooms | Owner-occupied | Renter-occupied |
| 1 Room | 0 (0.0%) | 8 (1.9%) |
| 2 or 3 Rooms | 0 (0.0%) | 168 (40.8%) |
| 4 or 5 Rooms | 172 (26.3%) | 89 (21.6%) |
| 6 or 7 Rooms | 278 (42.4%) | 100 (24.3%) |
| 8 or more Rooms | 205 (31.3%) | 47 (11.4%) |
| Total | 655 (100.0%) | 412 (100.0%) |
Housing Structure by Heating Type in Delphi
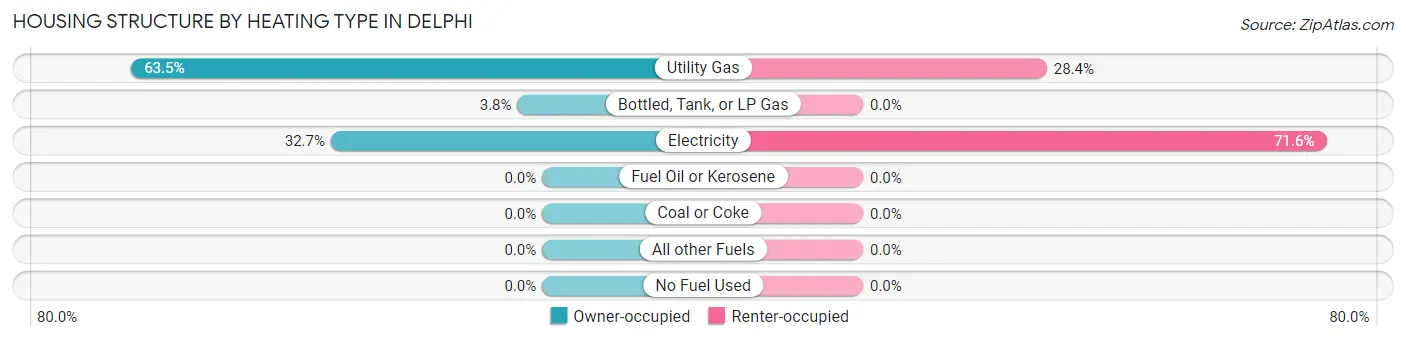
| Heating Type | Owner-occupied | Renter-occupied |
| Utility Gas | 416 (63.5%) | 117 (28.4%) |
| Bottled, Tank, or LP Gas | 25 (3.8%) | 0 (0.0%) |
| Electricity | 214 (32.7%) | 295 (71.6%) |
| Fuel Oil or Kerosene | 0 (0.0%) | 0 (0.0%) |
| Coal or Coke | 0 (0.0%) | 0 (0.0%) |
| All other Fuels | 0 (0.0%) | 0 (0.0%) |
| No Fuel Used | 0 (0.0%) | 0 (0.0%) |
| Total | 655 (100.0%) | 412 (100.0%) |
Household Vehicle Usage in Delphi
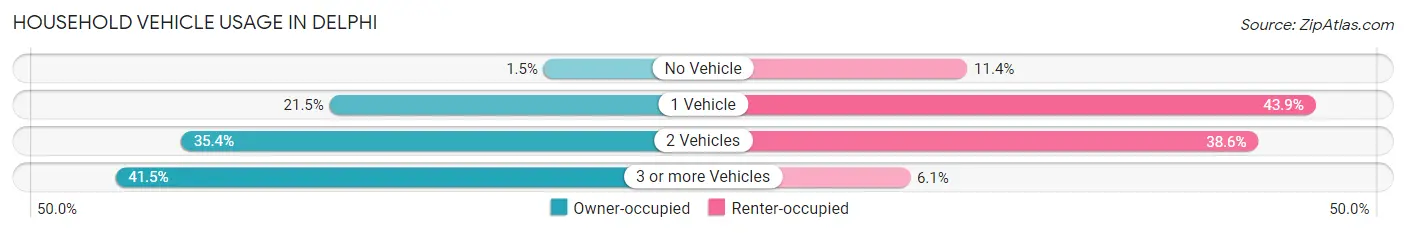
| Vehicles per Household | Owner-occupied | Renter-occupied |
| No Vehicle | 10 (1.5%) | 47 (11.4%) |
| 1 Vehicle | 141 (21.5%) | 181 (43.9%) |
| 2 Vehicles | 232 (35.4%) | 159 (38.6%) |
| 3 or more Vehicles | 272 (41.5%) | 25 (6.1%) |
| Total | 655 (100.0%) | 412 (100.0%) |
Real Estate & Mortgages in Delphi
Real Estate and Mortgage Overview in Delphi
| Characteristic | Without Mortgage | With Mortgage |
| Housing Units | 255 | 400 |
| Median Property Value | $111,300 | $127,800 |
| Median Household Income | $47,625 | $26 |
| Monthly Housing Costs | $417 | $0 |
| Real Estate Taxes | $1,168 | $24 |
Property Value by Mortgage Status in Delphi
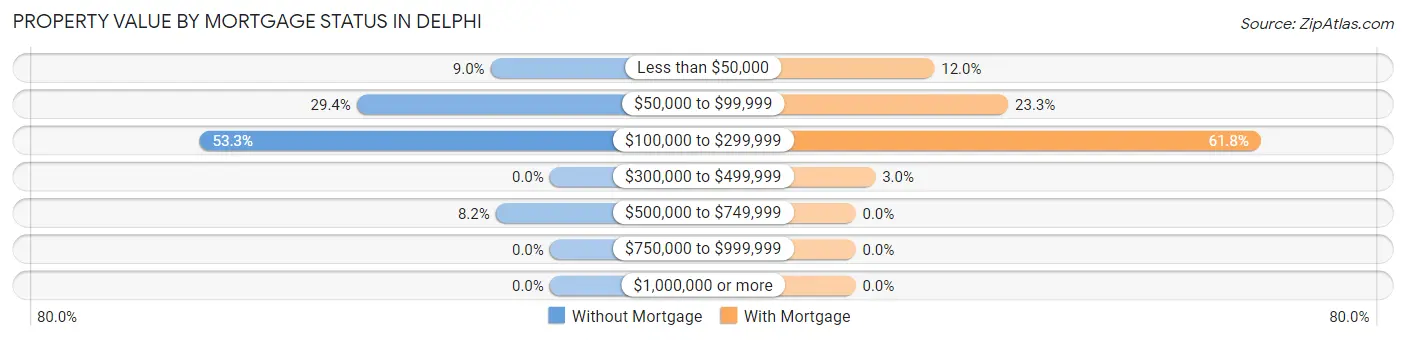
| Property Value | Without Mortgage | With Mortgage |
| Less than $50,000 | 23 (9.0%) | 48 (12.0%) |
| $50,000 to $99,999 | 75 (29.4%) | 93 (23.3%) |
| $100,000 to $299,999 | 136 (53.3%) | 247 (61.8%) |
| $300,000 to $499,999 | 0 (0.0%) | 12 (3.0%) |
| $500,000 to $749,999 | 21 (8.2%) | 0 (0.0%) |
| $750,000 to $999,999 | 0 (0.0%) | 0 (0.0%) |
| $1,000,000 or more | 0 (0.0%) | 0 (0.0%) |
| Total | 255 (100.0%) | 400 (100.0%) |
Household Income by Mortgage Status in Delphi
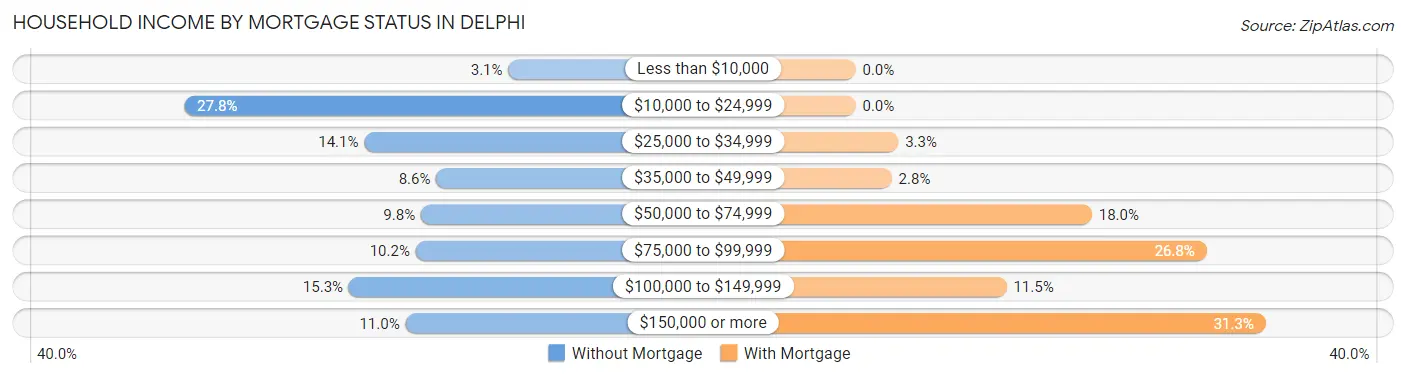
| Household Income | Without Mortgage | With Mortgage |
| Less than $10,000 | 8 (3.1%) | 0 (0.0%) |
| $10,000 to $24,999 | 71 (27.8%) | 0 (0.0%) |
| $25,000 to $34,999 | 36 (14.1%) | 13 (3.3%) |
| $35,000 to $49,999 | 22 (8.6%) | 11 (2.8%) |
| $50,000 to $74,999 | 25 (9.8%) | 72 (18.0%) |
| $75,000 to $99,999 | 26 (10.2%) | 107 (26.8%) |
| $100,000 to $149,999 | 39 (15.3%) | 46 (11.5%) |
| $150,000 or more | 28 (11.0%) | 125 (31.2%) |
| Total | 255 (100.0%) | 400 (100.0%) |
Property Value to Household Income Ratio in Delphi
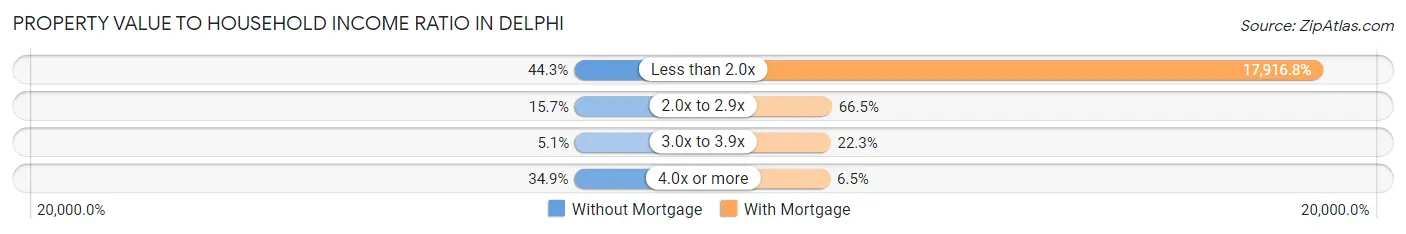
| Value-to-Income Ratio | Without Mortgage | With Mortgage |
| Less than 2.0x | 113 (44.3%) | 71,667 (17,916.7%) |
| 2.0x to 2.9x | 40 (15.7%) | 266 (66.5%) |
| 3.0x to 3.9x | 13 (5.1%) | 89 (22.3%) |
| 4.0x or more | 89 (34.9%) | 26 (6.5%) |
| Total | 255 (100.0%) | 400 (100.0%) |
Real Estate Taxes by Mortgage Status in Delphi
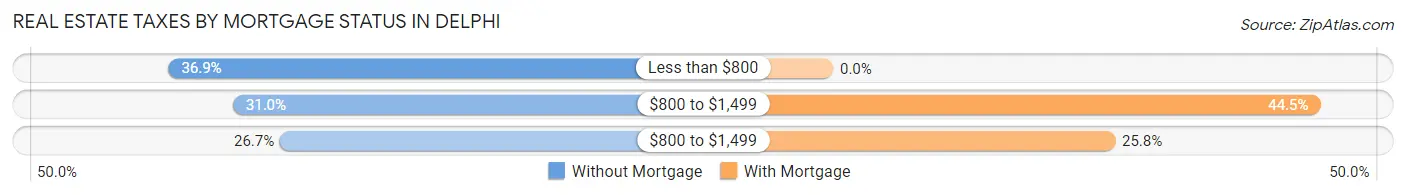
| Property Taxes | Without Mortgage | With Mortgage |
| Less than $800 | 94 (36.9%) | 0 (0.0%) |
| $800 to $1,499 | 79 (31.0%) | 178 (44.5%) |
| $800 to $1,499 | 68 (26.7%) | 103 (25.8%) |
| Total | 255 (100.0%) | 400 (100.0%) |
Health & Disability in Delphi
Health Insurance Coverage by Age in Delphi
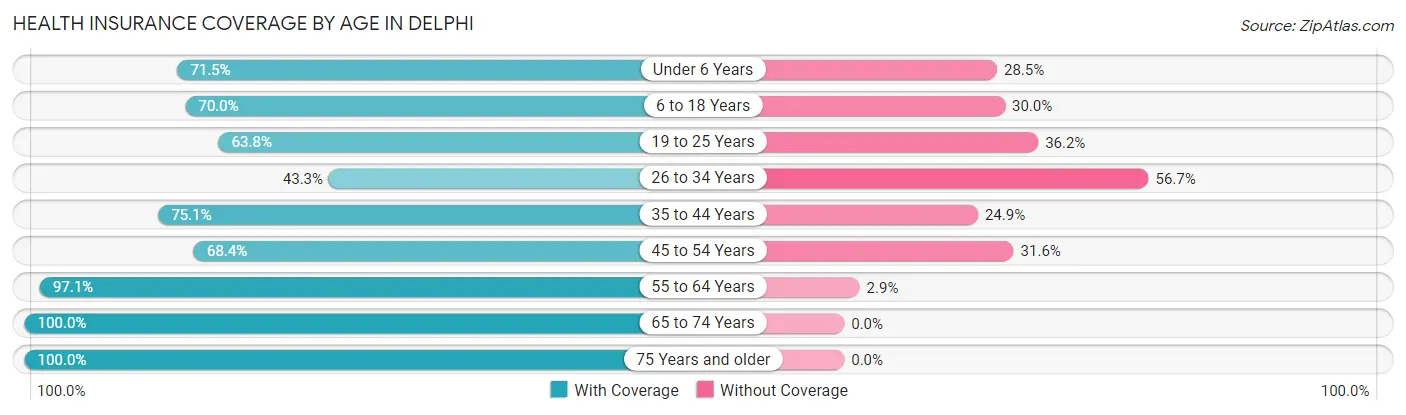
| Age Bracket | With Coverage | Without Coverage |
| Under 6 Years | 123 (71.5%) | 49 (28.5%) |
| 6 to 18 Years | 451 (70.0%) | 193 (30.0%) |
| 19 to 25 Years | 113 (63.8%) | 64 (36.2%) |
| 26 to 34 Years | 93 (43.3%) | 122 (56.7%) |
| 35 to 44 Years | 274 (75.1%) | 91 (24.9%) |
| 45 to 54 Years | 286 (68.4%) | 132 (31.6%) |
| 55 to 64 Years | 340 (97.1%) | 10 (2.9%) |
| 65 to 74 Years | 316 (100.0%) | 0 (0.0%) |
| 75 Years and older | 225 (100.0%) | 0 (0.0%) |
| Total | 2,221 (77.1%) | 661 (22.9%) |
Health Insurance Coverage by Citizenship Status in Delphi
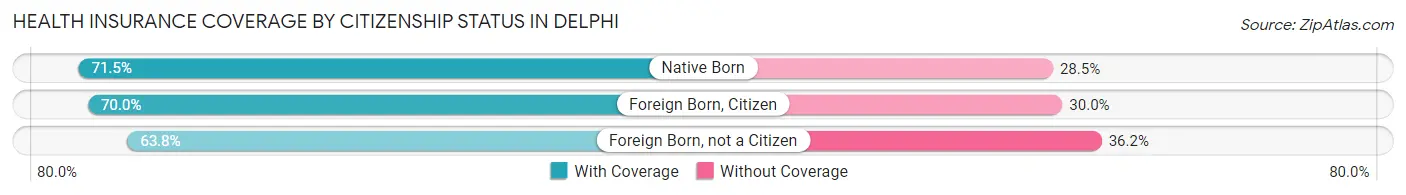
| Citizenship Status | With Coverage | Without Coverage |
| Native Born | 123 (71.5%) | 49 (28.5%) |
| Foreign Born, Citizen | 451 (70.0%) | 193 (30.0%) |
| Foreign Born, not a Citizen | 113 (63.8%) | 64 (36.2%) |
Health Insurance Coverage by Household Income in Delphi
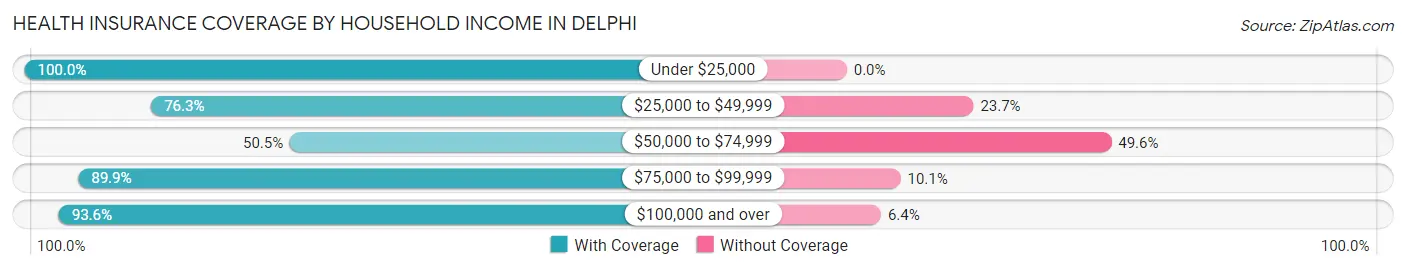
| Household Income | With Coverage | Without Coverage |
| Under $25,000 | 317 (100.0%) | 0 (0.0%) |
| $25,000 to $49,999 | 466 (76.3%) | 145 (23.7%) |
| $50,000 to $74,999 | 451 (50.4%) | 443 (49.5%) |
| $75,000 to $99,999 | 125 (89.9%) | 14 (10.1%) |
| $100,000 and over | 861 (93.6%) | 59 (6.4%) |
Public vs Private Health Insurance Coverage by Age in Delphi
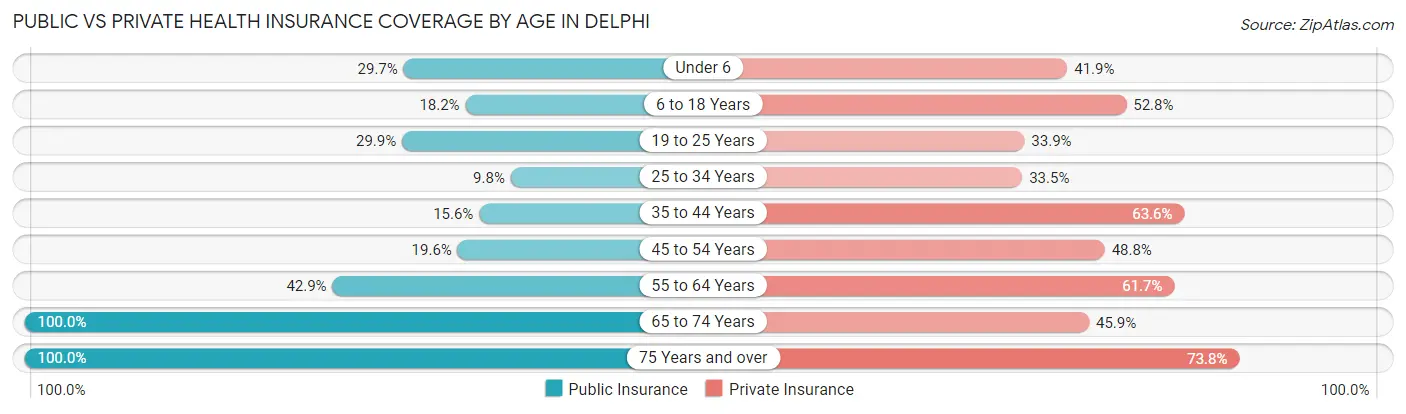
| Age Bracket | Public Insurance | Private Insurance |
| Under 6 | 51 (29.6%) | 72 (41.9%) |
| 6 to 18 Years | 117 (18.2%) | 340 (52.8%) |
| 19 to 25 Years | 53 (29.9%) | 60 (33.9%) |
| 25 to 34 Years | 21 (9.8%) | 72 (33.5%) |
| 35 to 44 Years | 57 (15.6%) | 232 (63.6%) |
| 45 to 54 Years | 82 (19.6%) | 204 (48.8%) |
| 55 to 64 Years | 150 (42.9%) | 216 (61.7%) |
| 65 to 74 Years | 316 (100.0%) | 145 (45.9%) |
| 75 Years and over | 225 (100.0%) | 166 (73.8%) |
| Total | 1,072 (37.2%) | 1,507 (52.3%) |
Disability Status by Sex by Age in Delphi
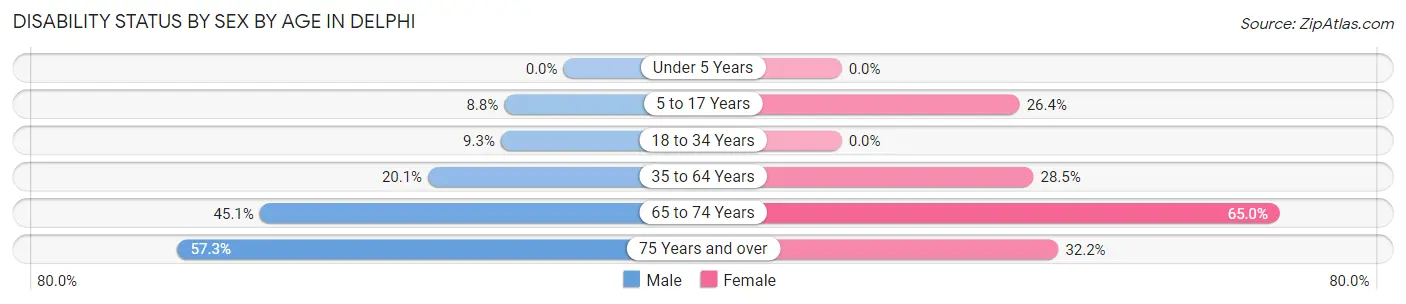
| Age Bracket | Male | Female |
| Under 5 Years | 0 (0.0%) | 0 (0.0%) |
| 5 to 17 Years | 30 (8.8%) | 84 (26.4%) |
| 18 to 34 Years | 20 (9.3%) | 0 (0.0%) |
| 35 to 64 Years | 105 (20.1%) | 174 (28.5%) |
| 65 to 74 Years | 69 (45.1%) | 106 (65.0%) |
| 75 Years and over | 63 (57.3%) | 37 (32.2%) |
Disability Class by Sex by Age in Delphi
Disability Class: Hearing Difficulty
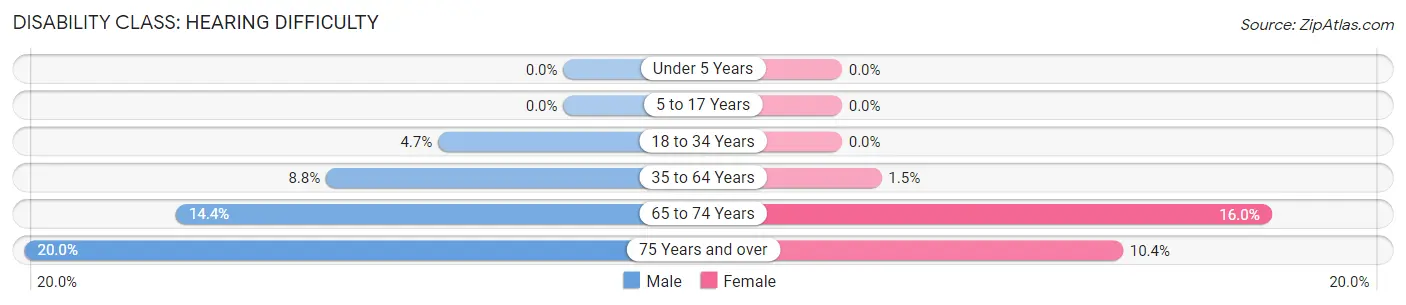
| Age Bracket | Male | Female |
| Under 5 Years | 0 (0.0%) | 0 (0.0%) |
| 5 to 17 Years | 0 (0.0%) | 0 (0.0%) |
| 18 to 34 Years | 10 (4.6%) | 0 (0.0%) |
| 35 to 64 Years | 46 (8.8%) | 9 (1.5%) |
| 65 to 74 Years | 22 (14.4%) | 26 (16.0%) |
| 75 Years and over | 22 (20.0%) | 12 (10.4%) |
Disability Class: Vision Difficulty
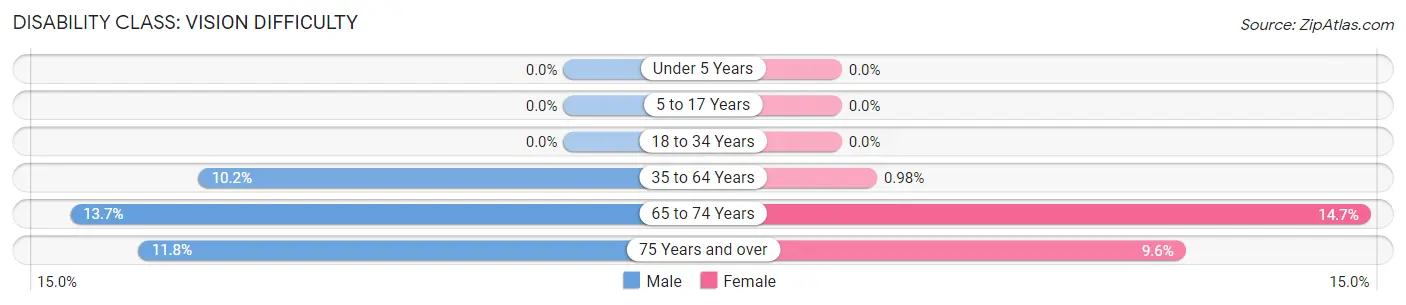
| Age Bracket | Male | Female |
| Under 5 Years | 0 (0.0%) | 0 (0.0%) |
| 5 to 17 Years | 0 (0.0%) | 0 (0.0%) |
| 18 to 34 Years | 0 (0.0%) | 0 (0.0%) |
| 35 to 64 Years | 53 (10.2%) | 6 (1.0%) |
| 65 to 74 Years | 21 (13.7%) | 24 (14.7%) |
| 75 Years and over | 13 (11.8%) | 11 (9.6%) |
Disability Class: Cognitive Difficulty
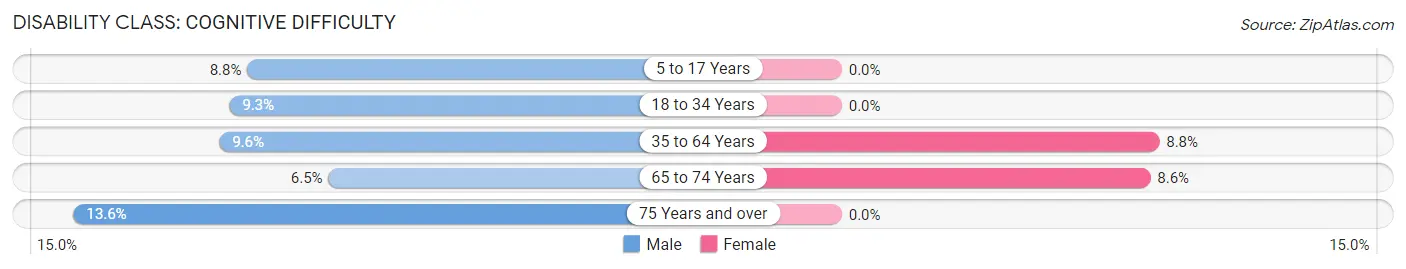
| Age Bracket | Male | Female |
| 5 to 17 Years | 30 (8.8%) | 0 (0.0%) |
| 18 to 34 Years | 20 (9.3%) | 0 (0.0%) |
| 35 to 64 Years | 50 (9.6%) | 54 (8.8%) |
| 65 to 74 Years | 10 (6.5%) | 14 (8.6%) |
| 75 Years and over | 15 (13.6%) | 0 (0.0%) |
Disability Class: Ambulatory Difficulty
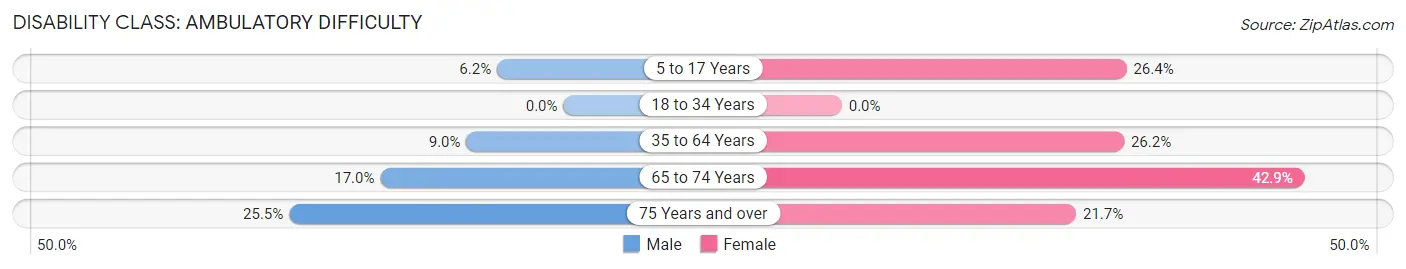
| Age Bracket | Male | Female |
| 5 to 17 Years | 21 (6.2%) | 84 (26.4%) |
| 18 to 34 Years | 0 (0.0%) | 0 (0.0%) |
| 35 to 64 Years | 47 (9.0%) | 160 (26.2%) |
| 65 to 74 Years | 26 (17.0%) | 70 (42.9%) |
| 75 Years and over | 28 (25.5%) | 25 (21.7%) |
Disability Class: Self-Care Difficulty
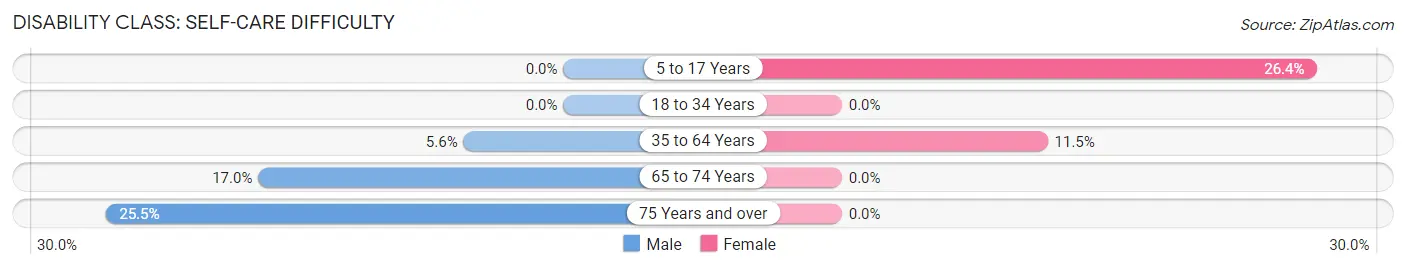
| Age Bracket | Male | Female |
| 5 to 17 Years | 0 (0.0%) | 84 (26.4%) |
| 18 to 34 Years | 0 (0.0%) | 0 (0.0%) |
| 35 to 64 Years | 29 (5.6%) | 70 (11.5%) |
| 65 to 74 Years | 26 (17.0%) | 0 (0.0%) |
| 75 Years and over | 28 (25.5%) | 0 (0.0%) |
Technology Access in Delphi
Computing Device Access in Delphi
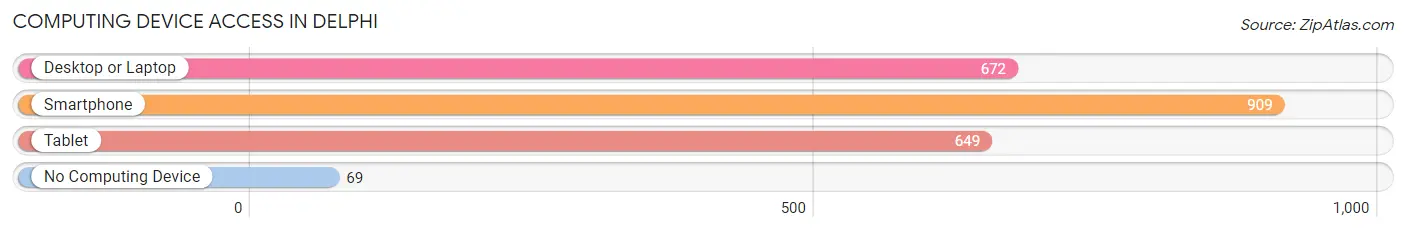
| Device Type | # Households | % Households |
| Desktop or Laptop | 672 | 63.0% |
| Smartphone | 909 | 85.2% |
| Tablet | 649 | 60.8% |
| No Computing Device | 69 | 6.5% |
| Total | 1,067 | 100.0% |
Internet Access in Delphi
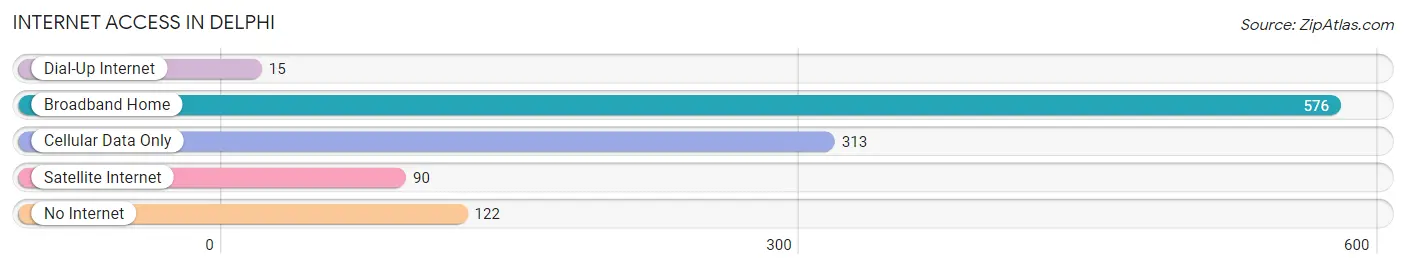
| Internet Type | # Households | % Households |
| Dial-Up Internet | 15 | 1.4% |
| Broadband Home | 576 | 54.0% |
| Cellular Data Only | 313 | 29.3% |
| Satellite Internet | 90 | 8.4% |
| No Internet | 122 | 11.4% |
| Total | 1,067 | 100.0% |
Delphi Summary
Delphi, Indiana is a small city located in the northwest corner of the state, in Carroll County. It is situated along the Wabash River, and is the county seat of Carroll County. The city has a population of approximately 3,000 people, and is part of the Lafayette, Indiana metropolitan area.
History
Delphi was founded in 1828 by General Samuel Milroy, who named the city after the ancient Greek city of Delphi. The city was incorporated in 1839, and was the first city in Carroll County. The city was an important stop on the Wabash and Erie Canal, which was built in the 1830s. The canal was a major transportation route for goods and people, and helped to spur the growth of the city.
In the late 19th century, Delphi was a major center for the production of agricultural products, such as wheat, corn, and oats. The city was also home to several manufacturing companies, including a flour mill, a woolen mill, and a furniture factory.
Geography
Delphi is located in the northwest corner of Indiana, in Carroll County. The city is situated along the Wabash River, and is approximately 40 miles northwest of Indianapolis. The city has a total area of 2.2 square miles, all of which is land.
The city is located in a hilly region of the state, and is surrounded by farmland. The climate in Delphi is humid continental, with hot summers and cold winters. The average annual temperature is around 50 degrees Fahrenheit.
Economy
The economy of Delphi is largely based on agriculture and manufacturing. The city is home to several agricultural businesses, including a grain elevator, a feed mill, and a dairy. The city is also home to several manufacturing companies, including a furniture factory, a machine shop, and a plastics factory.
The city is also home to several retail businesses, including a grocery store, a hardware store, and a clothing store. The city is also home to several restaurants, including a pizza shop, a Mexican restaurant, and a Chinese restaurant.
Demographics
As of the 2010 census, the population of Delphi was 3,003. The racial makeup of the city was 97.3% White, 0.7% African American, 0.2% Native American, 0.3% Asian, 0.1% Pacific Islander, 0.4% from other races, and 1.0% from two or more races. Hispanic or Latino of any race were 1.2% of the population.
The median household income in Delphi was $37,917, and the median family income was $45,938. The per capita income in Delphi was $18,945. About 11.3% of the population was below the poverty line.
Common Questions
What is Per Capita Income in Delphi?
Per Capita income in Delphi is $25,015.
What is the Median Family Income in Delphi?
Median Family Income in Delphi is $58,071.
What is the Median Household income in Delphi?
Median Household Income in Delphi is $47,688.
What is Income or Wage Gap in Delphi?
Income or Wage Gap in Delphi is 14.8%.
Women in Delphi earn 85.2 cents for every dollar earned by a man.
What is Inequality or Gini Index in Delphi?
Inequality or Gini Index in Delphi is 0.48.
What is the Total Population of Delphi?
Total Population of Delphi is 2,985.
What is the Total Male Population of Delphi?
Total Male Population of Delphi is 1,496.
What is the Total Female Population of Delphi?
Total Female Population of Delphi is 1,489.
What is the Ratio of Males per 100 Females in Delphi?
There are 100.47 Males per 100 Females in Delphi.
What is the Ratio of Females per 100 Males in Delphi?
There are 99.53 Females per 100 Males in Delphi.
What is the Median Population Age in Delphi?
Median Population Age in Delphi is 42.1 Years.
What is the Average Family Size in Delphi
Average Family Size in Delphi is 3.8 People.
What is the Average Household Size in Delphi
Average Household Size in Delphi is 2.7 People.
How Large is the Labor Force in Delphi?
There are 1,126 People in the Labor Forcein in Delphi.
What is the Percentage of People in the Labor Force in Delphi?
49.1% of People are in the Labor Force in Delphi.
What is the Unemployment Rate in Delphi?
Unemployment Rate in Delphi is 5.0%.