Crawfordsville, IN Map & Demographics
Crawfordsville Map
Crawfordsville Overview
$27,024
PER CAPITA INCOME
$65,486
AVG FAMILY INCOME
$46,918
AVG HOUSEHOLD INCOME
17.8%
WAGE / INCOME GAP [ % ]
82.2¢/ $1
WAGE / INCOME GAP [ $ ]
$9,910
FAMILY INCOME DEFICIT
0.45
INEQUALITY / GINI INDEX
16,335
TOTAL POPULATION
8,314
MALE POPULATION
8,021
FEMALE POPULATION
103.65
MALES / 100 FEMALES
96.48
FEMALES / 100 MALES
36.7
MEDIAN AGE
3.0
AVG FAMILY SIZE
2.3
AVG HOUSEHOLD SIZE
8,167
LABOR FORCE [ PEOPLE ]
62.2%
PERCENT IN LABOR FORCE
5.3%
UNEMPLOYMENT RATE
Crawfordsville Zip Codes
Crawfordsville Area Codes
Income in Crawfordsville
Income Overview in Crawfordsville
Per Capita Income in Crawfordsville is $27,024, while median incomes of families and households are $65,486 and $46,918 respectively.
| Characteristic | Number | Measure |
| Per Capita Income | 16,335 | $27,024 |
| Median Family Income | 3,580 | $65,486 |
| Mean Family Income | 3,580 | $78,281 |
| Median Household Income | 6,675 | $46,918 |
| Mean Household Income | 6,675 | $64,489 |
| Income Deficit | 3,580 | $9,910 |
| Wage / Income Gap (%) | 16,335 | 17.80% |
| Wage / Income Gap ($) | 16,335 | 82.20¢ per $1 |
| Gini / Inequality Index | 16,335 | 0.45 |
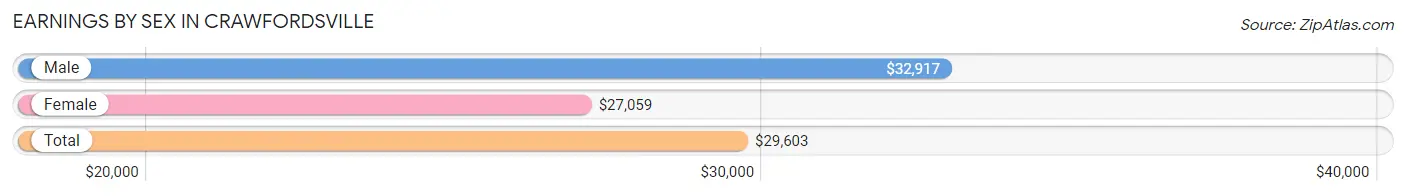
Earnings by Sex in Crawfordsville
Average Earnings in Crawfordsville are $29,603, $32,917 for men and $27,059 for women, a difference of 17.8%.
| Sex | Number | Average Earnings |
| Male | 5,023 (58.6%) | $32,917 |
| Female | 3,546 (41.4%) | $27,059 |
| Total | 8,569 (100.0%) | $29,603 |
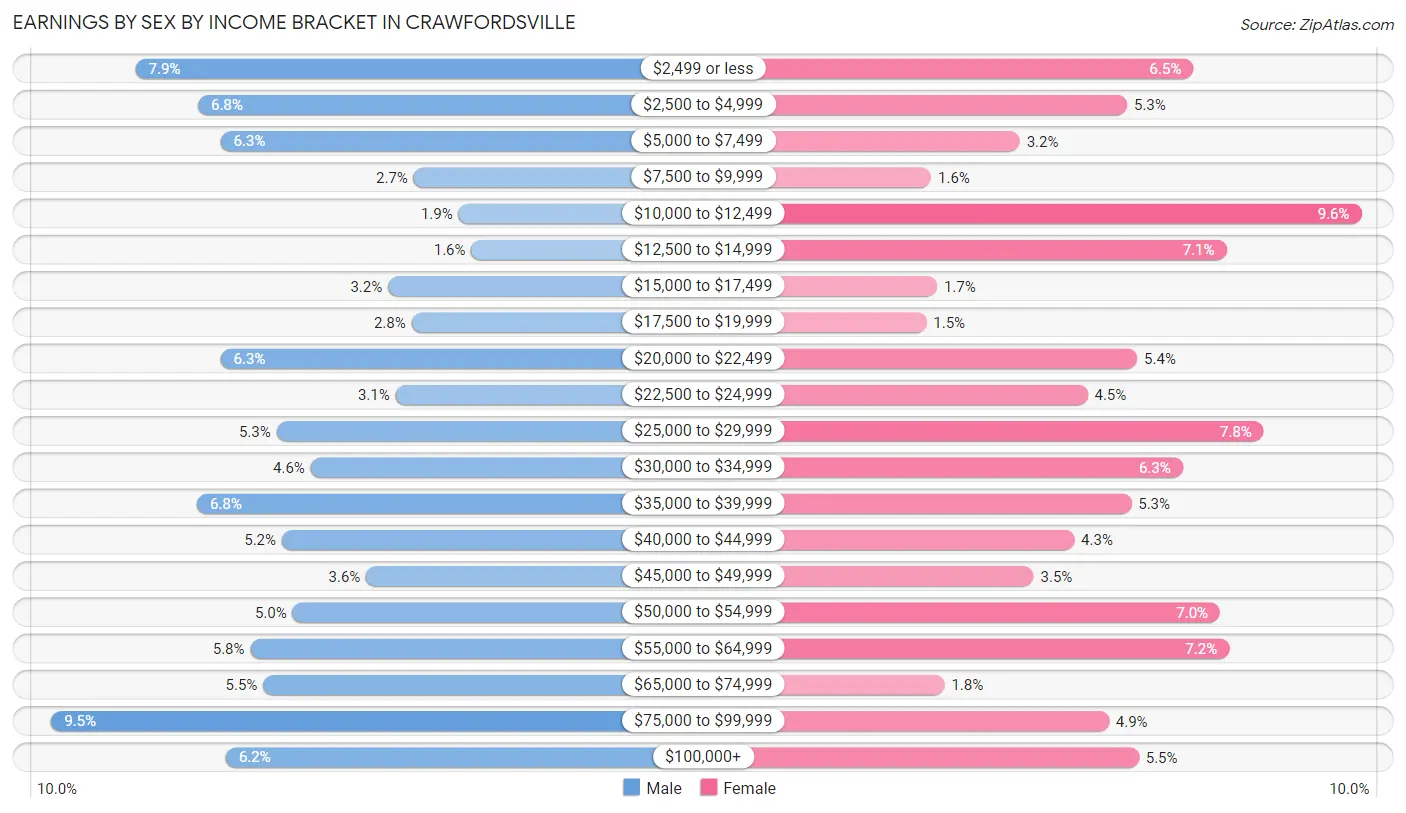
Earnings by Sex by Income Bracket in Crawfordsville
The most common earnings brackets in Crawfordsville are $75,000 to $99,999 for men (477 | 9.5%) and $10,000 to $12,499 for women (342 | 9.6%).
| Income | Male | Female |
| $2,499 or less | 398 (7.9%) | 230 (6.5%) |
| $2,500 to $4,999 | 339 (6.8%) | 186 (5.2%) |
| $5,000 to $7,499 | 318 (6.3%) | 115 (3.2%) |
| $7,500 to $9,999 | 136 (2.7%) | 56 (1.6%) |
| $10,000 to $12,499 | 94 (1.9%) | 342 (9.6%) |
| $12,500 to $14,999 | 82 (1.6%) | 252 (7.1%) |
| $15,000 to $17,499 | 160 (3.2%) | 60 (1.7%) |
| $17,500 to $19,999 | 138 (2.8%) | 53 (1.5%) |
| $20,000 to $22,499 | 318 (6.3%) | 193 (5.4%) |
| $22,500 to $24,999 | 153 (3.0%) | 160 (4.5%) |
| $25,000 to $29,999 | 265 (5.3%) | 277 (7.8%) |
| $30,000 to $34,999 | 233 (4.6%) | 223 (6.3%) |
| $35,000 to $39,999 | 340 (6.8%) | 189 (5.3%) |
| $40,000 to $44,999 | 260 (5.2%) | 151 (4.3%) |
| $45,000 to $49,999 | 181 (3.6%) | 124 (3.5%) |
| $50,000 to $54,999 | 250 (5.0%) | 248 (7.0%) |
| $55,000 to $64,999 | 290 (5.8%) | 254 (7.2%) |
| $65,000 to $74,999 | 278 (5.5%) | 65 (1.8%) |
| $75,000 to $99,999 | 477 (9.5%) | 174 (4.9%) |
| $100,000+ | 313 (6.2%) | 194 (5.5%) |
| Total | 5,023 (100.0%) | 3,546 (100.0%) |
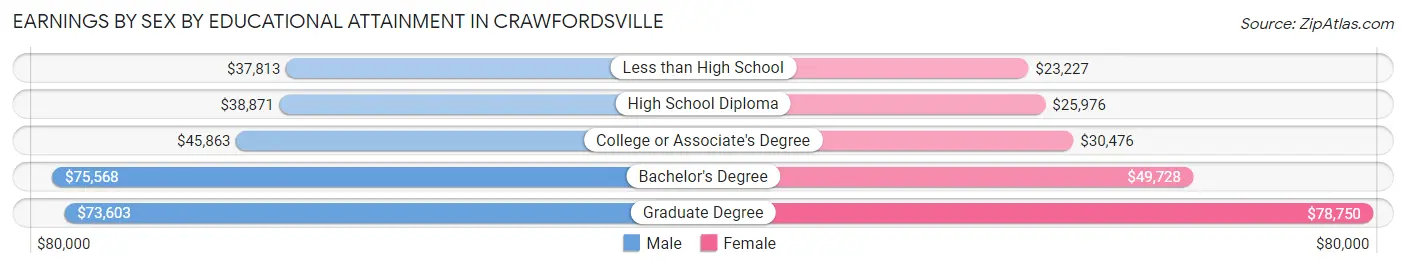
Earnings by Sex by Educational Attainment in Crawfordsville
Average earnings in Crawfordsville are $43,510 for men and $34,872 for women, a difference of 19.9%. Men with an educational attainment of bachelor's degree enjoy the highest average annual earnings of $75,568, while those with less than high school education earn the least with $37,813. Women with an educational attainment of graduate degree earn the most with the average annual earnings of $78,750, while those with less than high school education have the smallest earnings of $23,227.
| Educational Attainment | Male Income | Female Income |
| Less than High School | $37,813 | $23,227 |
| High School Diploma | $38,871 | $25,976 |
| College or Associate's Degree | $45,863 | $30,476 |
| Bachelor's Degree | $75,568 | $49,728 |
| Graduate Degree | $73,603 | $78,750 |
| Total | $43,510 | $34,872 |
Family Income in Crawfordsville
Family Income Brackets in Crawfordsville
According to the Crawfordsville family income data, there are 831 families falling into the $50,000 to $74,999 income range, which is the most common income bracket and makes up 23.2% of all families. Conversely, the $10,000 to $14,999 income bracket is the least frequent group with only 82 families (2.3%) belonging to this category.
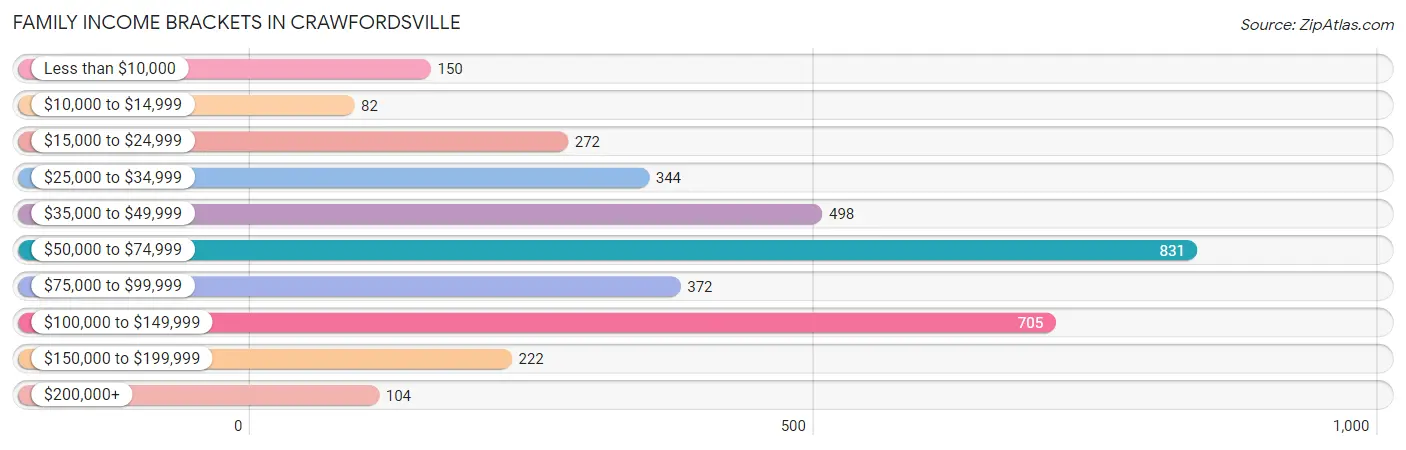
| Income Bracket | # Families | % Families |
| Less than $10,000 | 150 | 4.2% |
| $10,000 to $14,999 | 82 | 2.3% |
| $15,000 to $24,999 | 272 | 7.6% |
| $25,000 to $34,999 | 344 | 9.6% |
| $35,000 to $49,999 | 498 | 13.9% |
| $50,000 to $74,999 | 831 | 23.2% |
| $75,000 to $99,999 | 372 | 10.4% |
| $100,000 to $149,999 | 705 | 19.7% |
| $150,000 to $199,999 | 222 | 6.2% |
| $200,000+ | 104 | 2.9% |
Family Income by Famaliy Size in Crawfordsville
6-person families (122 | 3.4%) account for the highest median family income in Crawfordsville with $97,778 per family, while 2-person families (1,601 | 44.7%) have the highest median income of $31,982 per family member.
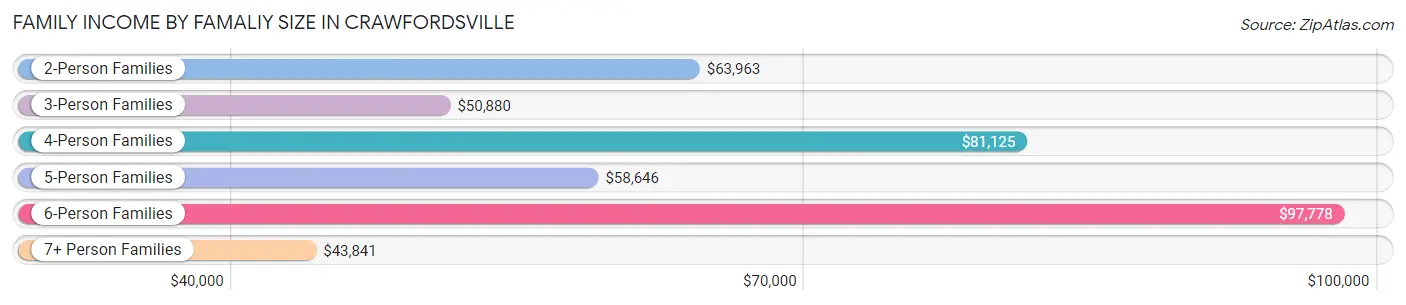
| Income Bracket | # Families | Median Income |
| 2-Person Families | 1,601 (44.7%) | $63,963 |
| 3-Person Families | 887 (24.8%) | $50,880 |
| 4-Person Families | 563 (15.7%) | $81,125 |
| 5-Person Families | 351 (9.8%) | $58,646 |
| 6-Person Families | 122 (3.4%) | $97,778 |
| 7+ Person Families | 56 (1.6%) | $43,841 |
| Total | 3,580 (100.0%) | $65,486 |
Family Income by Number of Earners in Crawfordsville
The median family income in Crawfordsville is $65,486, with families comprising 3+ earners (423) having the highest median family income of $116,625, while families with 1 earner (1,170) have the lowest median family income of $36,789, accounting for 11.8% and 32.7% of families, respectively.
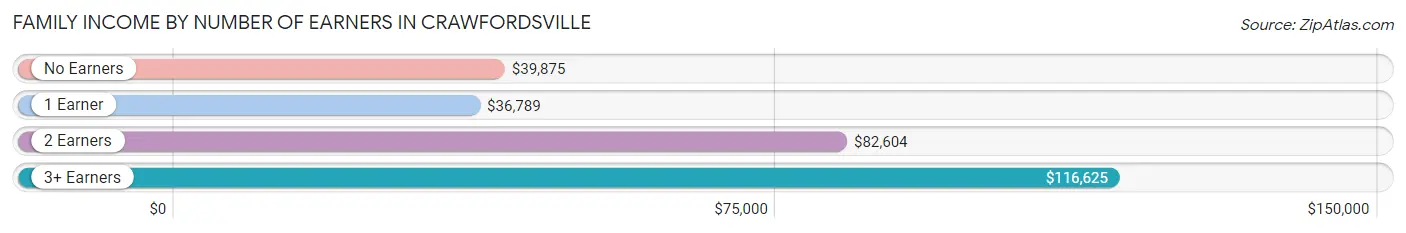
| Number of Earners | # Families | Median Income |
| No Earners | 585 (16.3%) | $39,875 |
| 1 Earner | 1,170 (32.7%) | $36,789 |
| 2 Earners | 1,402 (39.2%) | $82,604 |
| 3+ Earners | 423 (11.8%) | $116,625 |
| Total | 3,580 (100.0%) | $65,486 |
Household Income in Crawfordsville
Household Income Brackets in Crawfordsville
With 1,108 households falling in the category, the $50,000 to $74,999 income range is the most frequent in Crawfordsville, accounting for 16.6% of all households. In contrast, only 194 households (2.9%) fall into the $200,000+ income bracket, making it the least populous group.
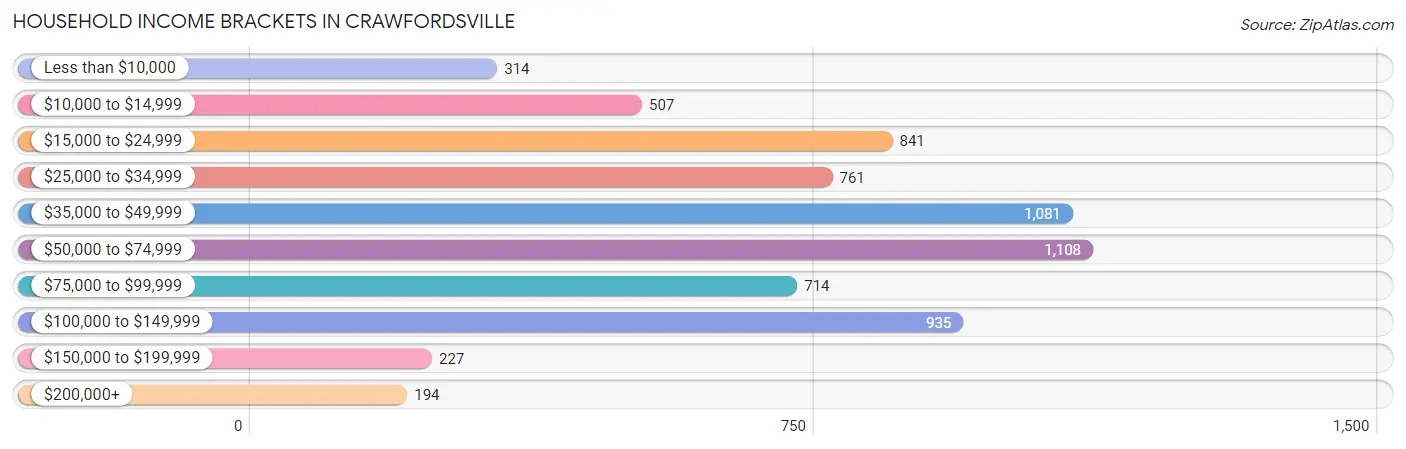
| Income Bracket | # Households | % Households |
| Less than $10,000 | 314 | 4.7% |
| $10,000 to $14,999 | 507 | 7.6% |
| $15,000 to $24,999 | 841 | 12.6% |
| $25,000 to $34,999 | 761 | 11.4% |
| $35,000 to $49,999 | 1,081 | 16.2% |
| $50,000 to $74,999 | 1,108 | 16.6% |
| $75,000 to $99,999 | 714 | 10.7% |
| $100,000 to $149,999 | 935 | 14.0% |
| $150,000 to $199,999 | 227 | 3.4% |
| $200,000+ | 194 | 2.9% |
Household Income by Householder Age in Crawfordsville
The median household income in Crawfordsville is $46,918, with the highest median household income of $64,762 found in the 25 to 44 years age bracket for the primary householder. A total of 2,010 households (30.1%) fall into this category. Meanwhile, the 15 to 24 years age bracket for the primary householder has the lowest median household income of $26,905, with 462 households (6.9%) in this group.
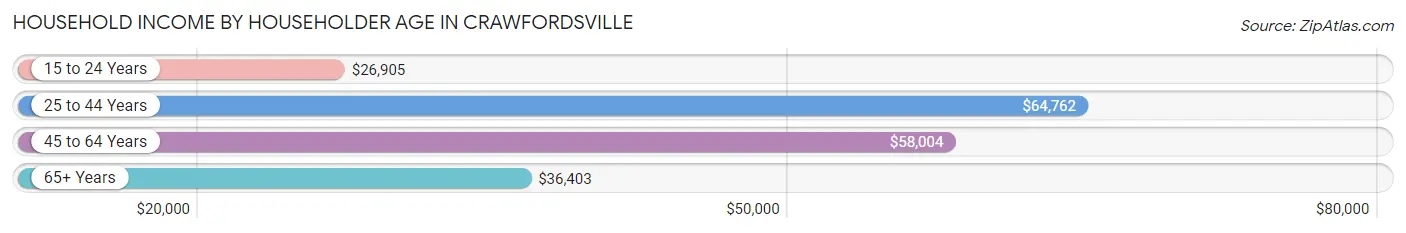
| Income Bracket | # Households | Median Income |
| 15 to 24 Years | 462 (6.9%) | $26,905 |
| 25 to 44 Years | 2,010 (30.1%) | $64,762 |
| 45 to 64 Years | 2,372 (35.5%) | $58,004 |
| 65+ Years | 1,831 (27.4%) | $36,403 |
| Total | 6,675 (100.0%) | $46,918 |
Poverty in Crawfordsville
Income Below Poverty by Sex and Age in Crawfordsville
With 16.3% poverty level for males and 24.9% for females among the residents of Crawfordsville, 12 to 14 year old males and 18 to 24 year old females are the most vulnerable to poverty, with 115 males (44.1%) and 334 females (47.3%) in their respective age groups living below the poverty level.
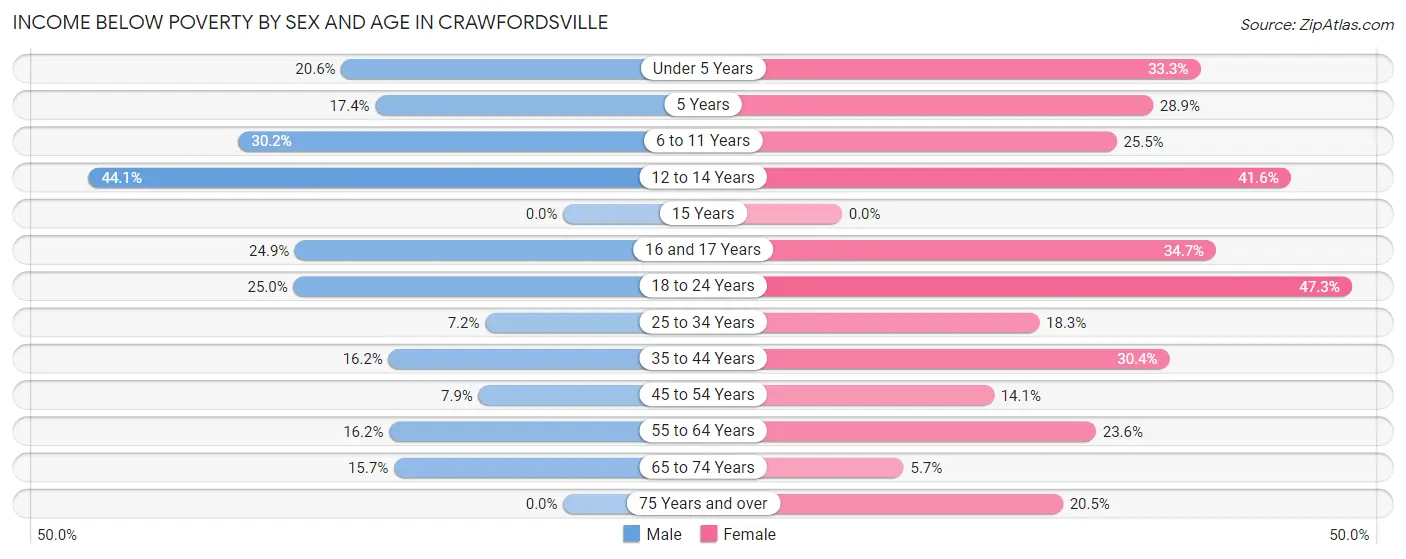
| Age Bracket | Male | Female |
| Under 5 Years | 110 (20.6%) | 142 (33.3%) |
| 5 Years | 15 (17.4%) | 58 (28.9%) |
| 6 to 11 Years | 155 (30.2%) | 129 (25.5%) |
| 12 to 14 Years | 115 (44.1%) | 122 (41.6%) |
| 15 Years | 0 (0.0%) | 0 (0.0%) |
| 16 and 17 Years | 57 (24.9%) | 100 (34.7%) |
| 18 to 24 Years | 158 (25.0%) | 334 (47.3%) |
| 25 to 34 Years | 69 (7.2%) | 197 (18.3%) |
| 35 to 44 Years | 154 (16.2%) | 242 (30.4%) |
| 45 to 54 Years | 66 (7.9%) | 99 (14.1%) |
| 55 to 64 Years | 180 (16.2%) | 248 (23.6%) |
| 65 to 74 Years | 114 (15.7%) | 37 (5.7%) |
| 75 Years and over | 0 (0.0%) | 181 (20.5%) |
| Total | 1,193 (16.3%) | 1,889 (24.9%) |
Income Above Poverty by Sex and Age in Crawfordsville
According to the poverty statistics in Crawfordsville, males aged 15 years and females aged 15 years are the age groups that are most secure financially, with 100.0% of males and 100.0% of females in these age groups living above the poverty line.
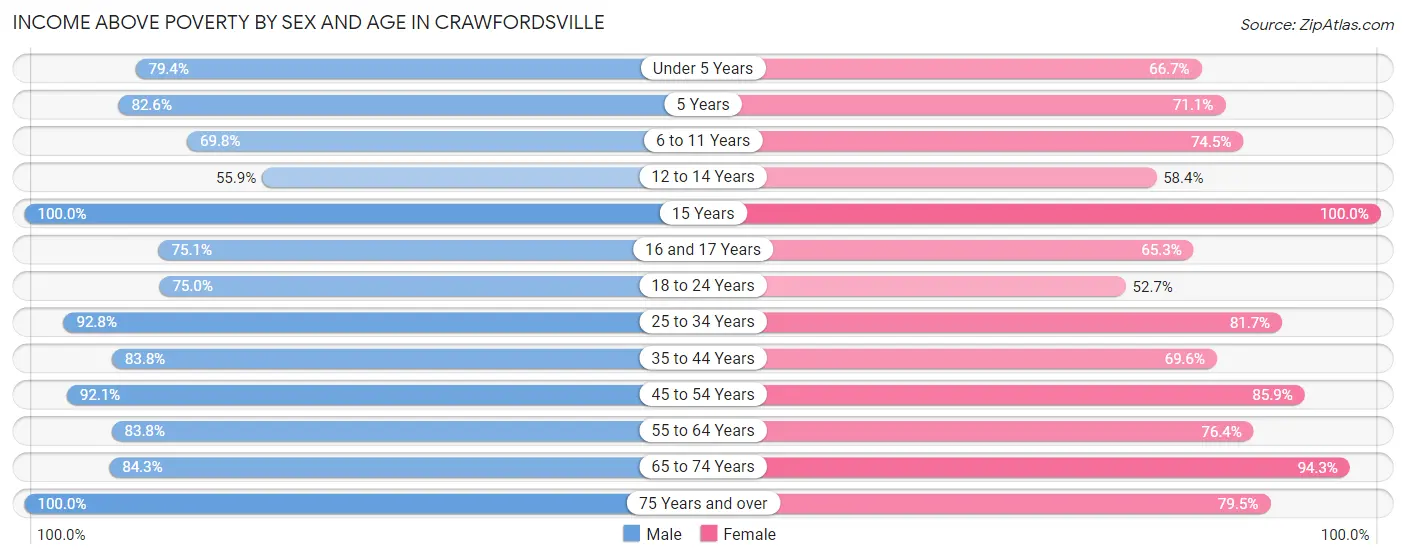
| Age Bracket | Male | Female |
| Under 5 Years | 424 (79.4%) | 285 (66.7%) |
| 5 Years | 71 (82.6%) | 143 (71.1%) |
| 6 to 11 Years | 359 (69.8%) | 377 (74.5%) |
| 12 to 14 Years | 146 (55.9%) | 171 (58.4%) |
| 15 Years | 113 (100.0%) | 11 (100.0%) |
| 16 and 17 Years | 172 (75.1%) | 188 (65.3%) |
| 18 to 24 Years | 473 (75.0%) | 372 (52.7%) |
| 25 to 34 Years | 884 (92.8%) | 879 (81.7%) |
| 35 to 44 Years | 796 (83.8%) | 554 (69.6%) |
| 45 to 54 Years | 774 (92.1%) | 603 (85.9%) |
| 55 to 64 Years | 934 (83.8%) | 804 (76.4%) |
| 65 to 74 Years | 611 (84.3%) | 609 (94.3%) |
| 75 Years and over | 366 (100.0%) | 702 (79.5%) |
| Total | 6,123 (83.7%) | 5,698 (75.1%) |
Income Below Poverty Among Married-Couple Families in Crawfordsville
The poverty statistics for married-couple families in Crawfordsville show that 6.4% or 155 of the total 2,428 families live below the poverty line. Families with 3 or 4 children have the highest poverty rate of 24.2%, comprising of 79 families. On the other hand, families with 5 or more children have the lowest poverty rate of 0.0%, which includes 0 families.
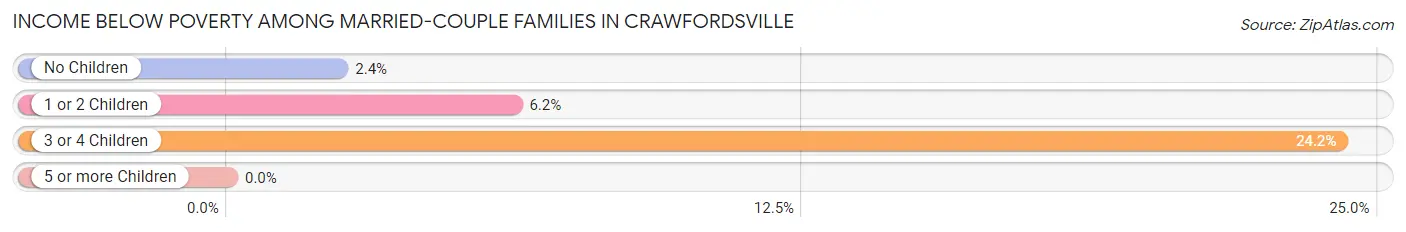
| Children | Above Poverty | Below Poverty |
| No Children | 1,380 (97.6%) | 34 (2.4%) |
| 1 or 2 Children | 636 (93.8%) | 42 (6.2%) |
| 3 or 4 Children | 248 (75.8%) | 79 (24.2%) |
| 5 or more Children | 9 (100.0%) | 0 (0.0%) |
| Total | 2,273 (93.6%) | 155 (6.4%) |
Income Below Poverty Among Single-Parent Households in Crawfordsville
According to the poverty data in Crawfordsville, 24.5% or 86 single-father households and 35.6% or 285 single-mother households are living below the poverty line. Among single-father households, those with 1 or 2 children have the highest poverty rate, with 74 households (34.4%) experiencing poverty. Likewise, among single-mother households, those with 5 or more children have the highest poverty rate, with 6 households (100.0%) falling below the poverty line.
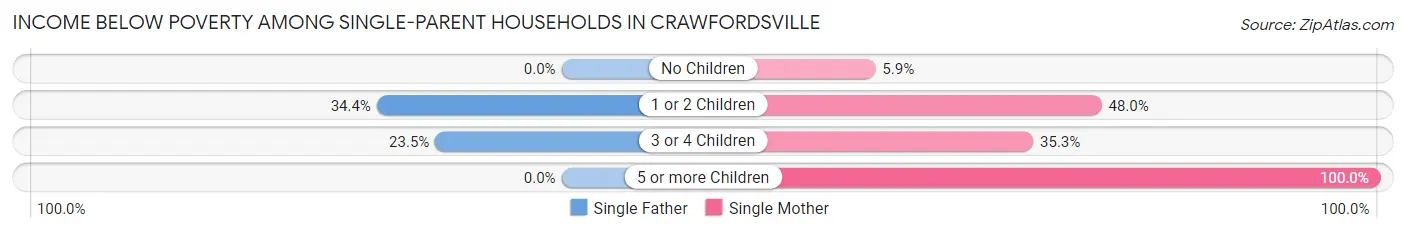
| Children | Single Father | Single Mother |
| No Children | 0 (0.0%) | 12 (5.9%) |
| 1 or 2 Children | 74 (34.4%) | 219 (48.0%) |
| 3 or 4 Children | 12 (23.5%) | 48 (35.3%) |
| 5 or more Children | 0 (0.0%) | 6 (100.0%) |
| Total | 86 (24.5%) | 285 (35.6%) |
Income Below Poverty Among Married-Couple vs Single-Parent Households in Crawfordsville
The poverty data for Crawfordsville shows that 155 of the married-couple family households (6.4%) and 371 of the single-parent households (32.2%) are living below the poverty level. Within the married-couple family households, those with 3 or 4 children have the highest poverty rate, with 79 households (24.2%) falling below the poverty line. Among the single-parent households, those with 5 or more children have the highest poverty rate, with 6 household (100.0%) living below poverty.
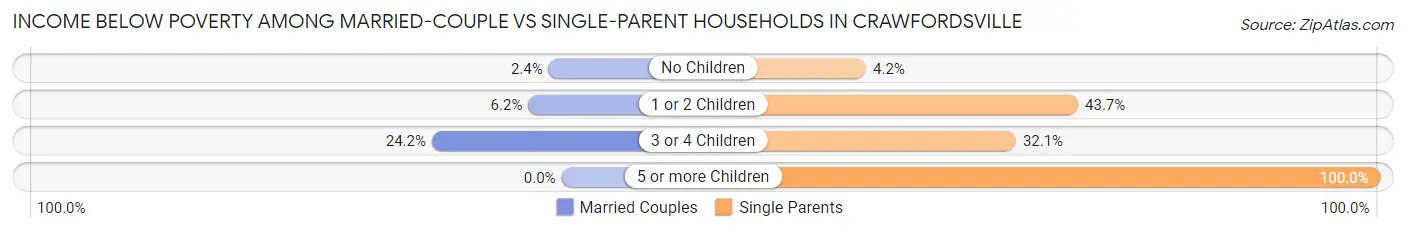
| Children | Married-Couple Families | Single-Parent Households |
| No Children | 34 (2.4%) | 12 (4.2%) |
| 1 or 2 Children | 42 (6.2%) | 293 (43.7%) |
| 3 or 4 Children | 79 (24.2%) | 60 (32.1%) |
| 5 or more Children | 0 (0.0%) | 6 (100.0%) |
| Total | 155 (6.4%) | 371 (32.2%) |
Race in Crawfordsville
The most populous races in Crawfordsville are White / Caucasian (14,548 | 89.1%), Hispanic or Latino (1,348 | 8.3%), and Two or more Races (958 | 5.9%).
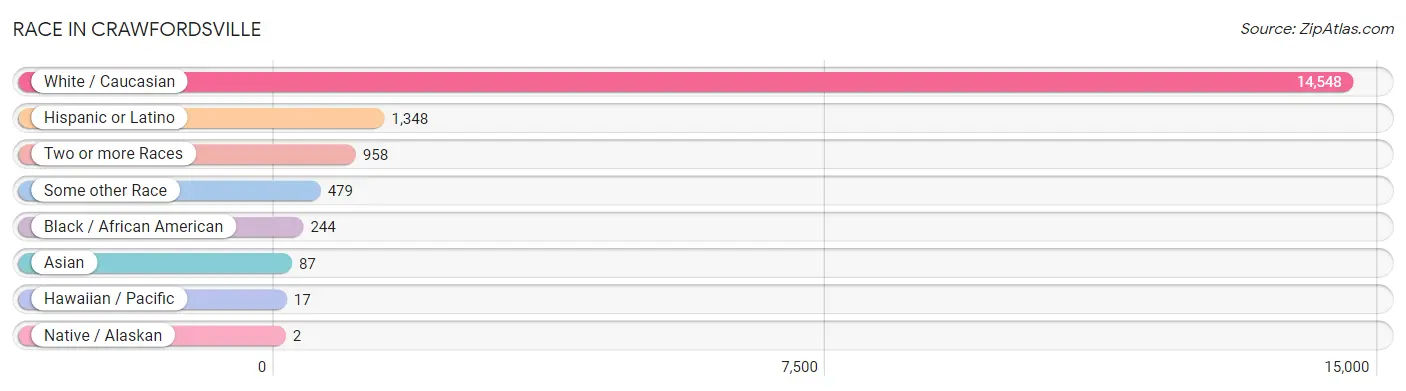
| Race | # Population | % Population |
| Asian | 87 | 0.5% |
| Black / African American | 244 | 1.5% |
| Hawaiian / Pacific | 17 | 0.1% |
| Hispanic or Latino | 1,348 | 8.3% |
| Native / Alaskan | 2 | 0.0% |
| White / Caucasian | 14,548 | 89.1% |
| Two or more Races | 958 | 5.9% |
| Some other Race | 479 | 2.9% |
| Total | 16,335 | 100.0% |
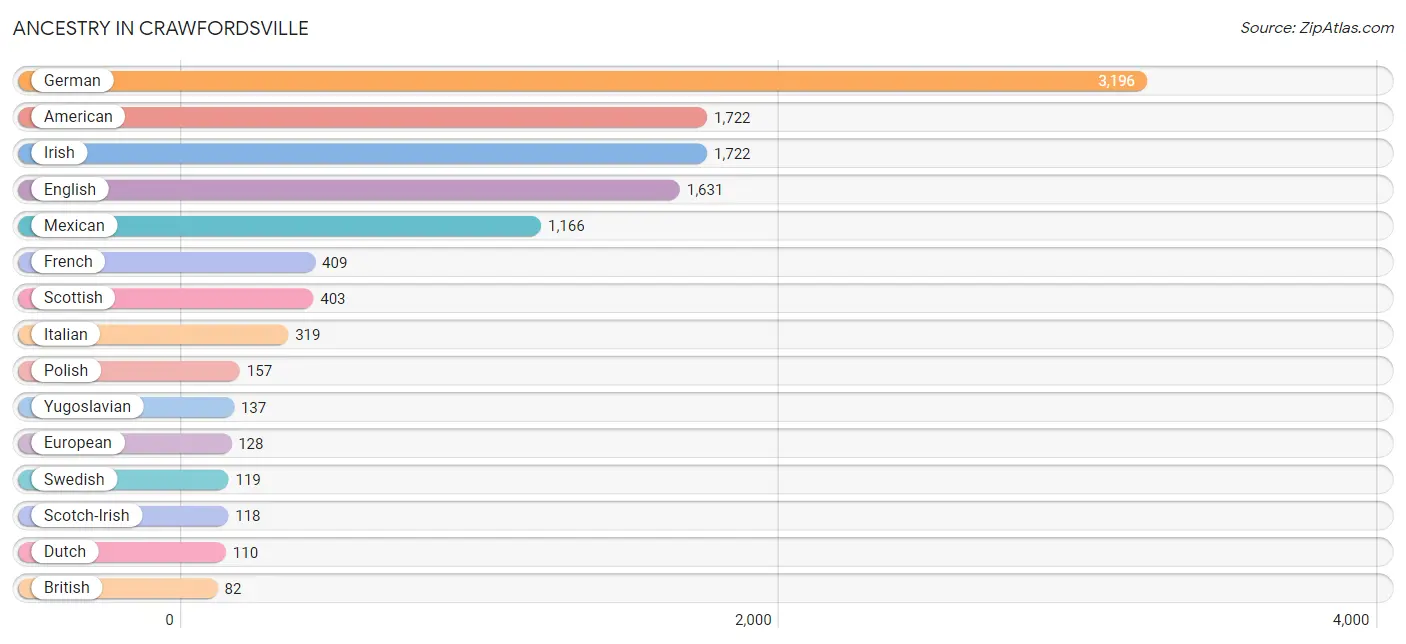
Ancestry in Crawfordsville
The most populous ancestries reported in Crawfordsville are German (3,196 | 19.6%), American (1,722 | 10.5%), Irish (1,722 | 10.5%), English (1,631 | 10.0%), and Mexican (1,166 | 7.1%), together accounting for 57.8% of all Crawfordsville residents.
| Ancestry | # Population | % Population |
| African | 6 | 0.0% |
| Albanian | 30 | 0.2% |
| American | 1,722 | 10.5% |
| Apache | 53 | 0.3% |
| Armenian | 12 | 0.1% |
| Bhutanese | 3 | 0.0% |
| Blackfeet | 31 | 0.2% |
| British | 82 | 0.5% |
| Burmese | 29 | 0.2% |
| Central American | 17 | 0.1% |
| Cherokee | 64 | 0.4% |
| Croatian | 6 | 0.0% |
| Cuban | 25 | 0.2% |
| Czech | 55 | 0.3% |
| Danish | 48 | 0.3% |
| Dutch | 110 | 0.7% |
| English | 1,631 | 10.0% |
| European | 128 | 0.8% |
| French | 409 | 2.5% |
| French Canadian | 31 | 0.2% |
| German | 3,196 | 19.6% |
| Greek | 3 | 0.0% |
| Honduran | 17 | 0.1% |
| Houma | 16 | 0.1% |
| Hungarian | 14 | 0.1% |
| Indian (Asian) | 14 | 0.1% |
| Irish | 1,722 | 10.5% |
| Italian | 319 | 1.9% |
| Japanese | 16 | 0.1% |
| Korean | 43 | 0.3% |
| Laotian | 15 | 0.1% |
| Lithuanian | 3 | 0.0% |
| Mexican | 1,166 | 7.1% |
| Native Hawaiian | 17 | 0.1% |
| Norwegian | 31 | 0.2% |
| Polish | 157 | 1.0% |
| Puerto Rican | 21 | 0.1% |
| Romanian | 10 | 0.1% |
| Russian | 13 | 0.1% |
| Scandinavian | 46 | 0.3% |
| Scotch-Irish | 118 | 0.7% |
| Scottish | 403 | 2.5% |
| Sioux | 2 | 0.0% |
| Spaniard | 34 | 0.2% |
| Spanish | 65 | 0.4% |
| Subsaharan African | 6 | 0.0% |
| Swedish | 119 | 0.7% |
| Swiss | 42 | 0.3% |
| Thai | 34 | 0.2% |
| Turkish | 2 | 0.0% |
| Welsh | 56 | 0.3% |
| Yugoslavian | 137 | 0.8% | View All 52 Rows |
Immigrants in Crawfordsville
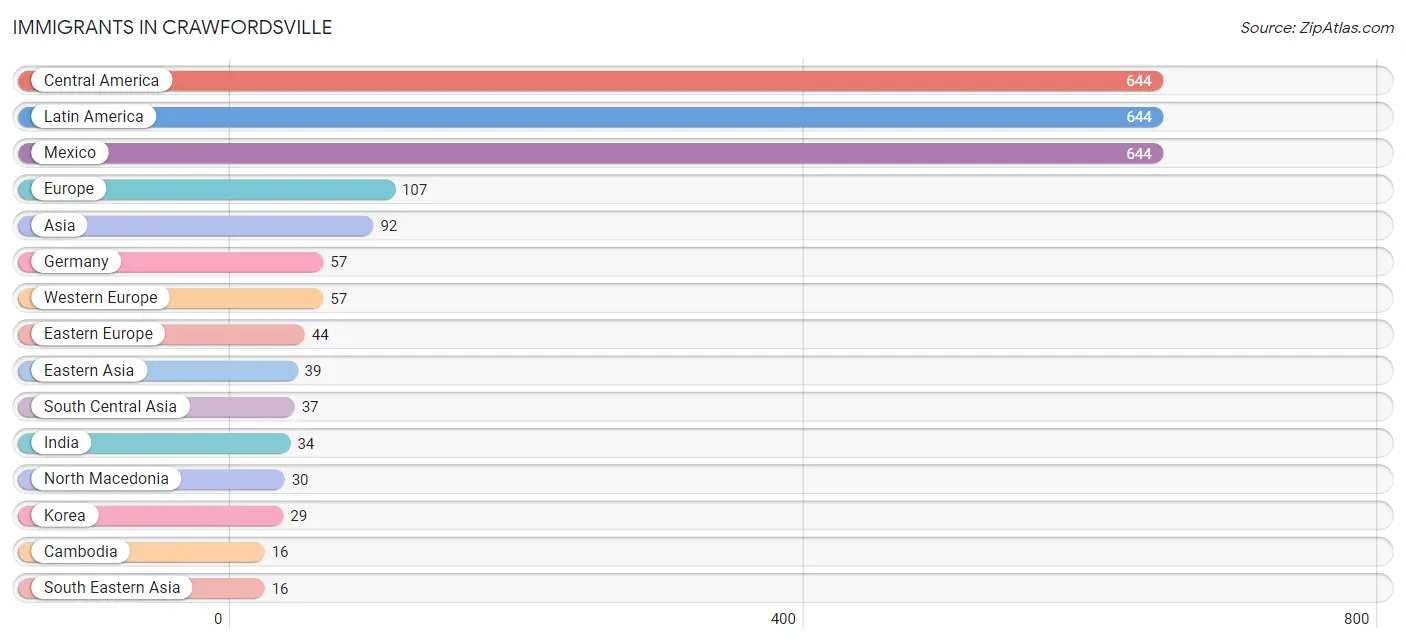
The most numerous immigrant groups reported in Crawfordsville came from Central America (644 | 3.9%), Latin America (644 | 3.9%), Mexico (644 | 3.9%), Europe (107 | 0.7%), and Asia (92 | 0.6%), together accounting for 13.0% of all Crawfordsville residents.
| Immigration Origin | # Population | % Population |
| Asia | 92 | 0.6% |
| Cambodia | 16 | 0.1% |
| Central America | 644 | 3.9% |
| China | 2 | 0.0% |
| Croatia | 4 | 0.0% |
| Eastern Asia | 39 | 0.2% |
| Eastern Europe | 44 | 0.3% |
| England | 6 | 0.0% |
| Europe | 107 | 0.7% |
| Germany | 57 | 0.4% |
| India | 34 | 0.2% |
| Japan | 8 | 0.1% |
| Korea | 29 | 0.2% |
| Latin America | 644 | 3.9% |
| Mexico | 644 | 3.9% |
| North Macedonia | 30 | 0.2% |
| Northern Europe | 6 | 0.0% |
| Pakistan | 3 | 0.0% |
| Romania | 10 | 0.1% |
| South Central Asia | 37 | 0.2% |
| South Eastern Asia | 16 | 0.1% |
| Western Europe | 57 | 0.4% | View All 22 Rows |
Sex and Age in Crawfordsville
Sex and Age in Crawfordsville
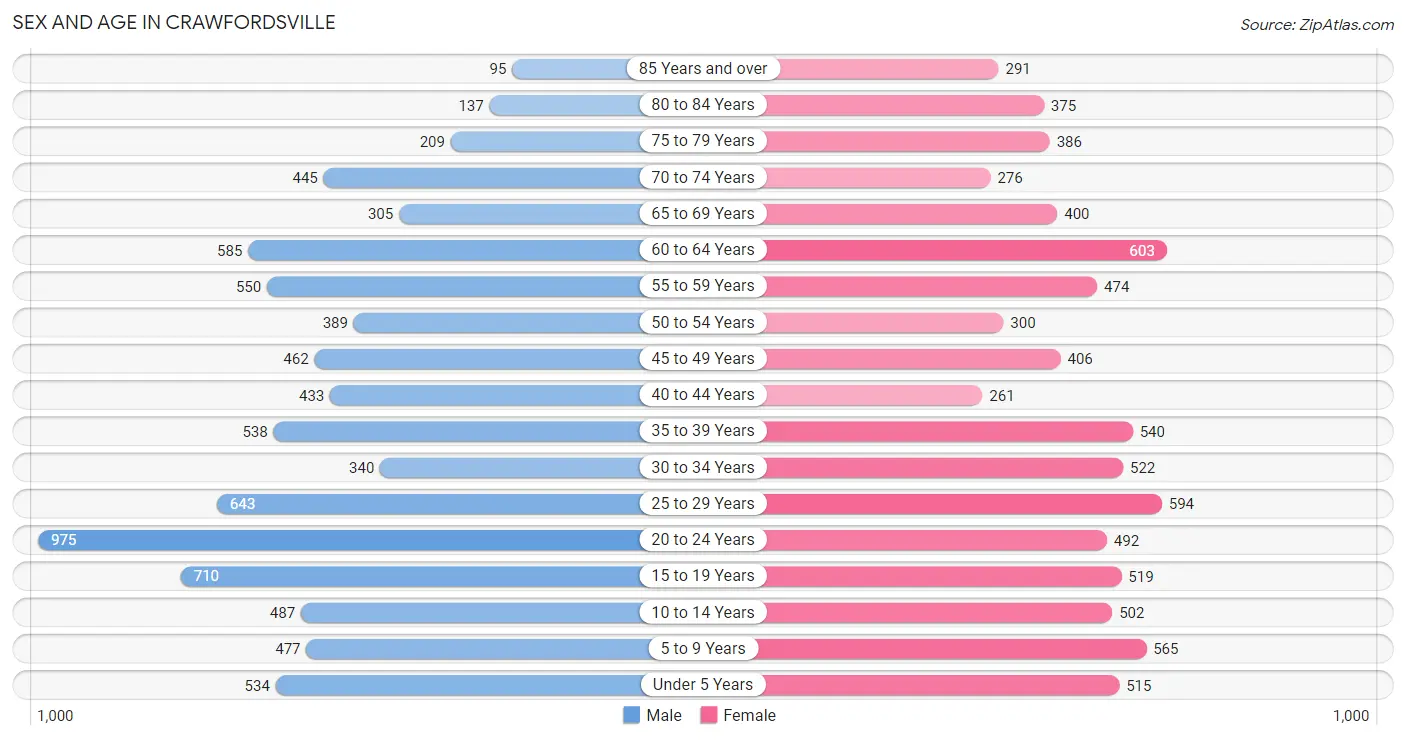
The most populous age groups in Crawfordsville are 20 to 24 Years (975 | 11.7%) for men and 60 to 64 Years (603 | 7.5%) for women.
| Age Bracket | Male | Female |
| Under 5 Years | 534 (6.4%) | 515 (6.4%) |
| 5 to 9 Years | 477 (5.7%) | 565 (7.0%) |
| 10 to 14 Years | 487 (5.9%) | 502 (6.3%) |
| 15 to 19 Years | 710 (8.5%) | 519 (6.5%) |
| 20 to 24 Years | 975 (11.7%) | 492 (6.1%) |
| 25 to 29 Years | 643 (7.7%) | 594 (7.4%) |
| 30 to 34 Years | 340 (4.1%) | 522 (6.5%) |
| 35 to 39 Years | 538 (6.5%) | 540 (6.7%) |
| 40 to 44 Years | 433 (5.2%) | 261 (3.3%) |
| 45 to 49 Years | 462 (5.6%) | 406 (5.1%) |
| 50 to 54 Years | 389 (4.7%) | 300 (3.7%) |
| 55 to 59 Years | 550 (6.6%) | 474 (5.9%) |
| 60 to 64 Years | 585 (7.0%) | 603 (7.5%) |
| 65 to 69 Years | 305 (3.7%) | 400 (5.0%) |
| 70 to 74 Years | 445 (5.3%) | 276 (3.4%) |
| 75 to 79 Years | 209 (2.5%) | 386 (4.8%) |
| 80 to 84 Years | 137 (1.7%) | 375 (4.7%) |
| 85 Years and over | 95 (1.1%) | 291 (3.6%) |
| Total | 8,314 (100.0%) | 8,021 (100.0%) |
Families and Households in Crawfordsville
Median Family Size in Crawfordsville
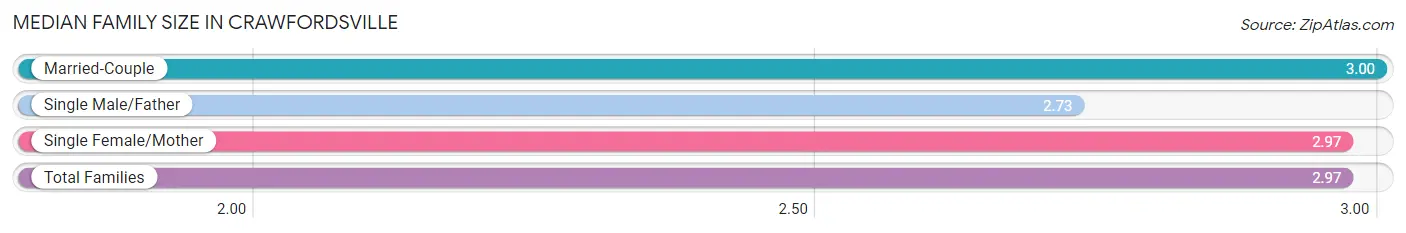
The median family size in Crawfordsville is 2.97 persons per family, with married-couple families (2,428 | 67.8%) accounting for the largest median family size of 3 persons per family. On the other hand, single male/father families (351 | 9.8%) represent the smallest median family size with 2.73 persons per family.
| Family Type | # Families | Family Size |
| Married-Couple | 2,428 (67.8%) | 3.00 |
| Single Male/Father | 351 (9.8%) | 2.73 |
| Single Female/Mother | 801 (22.4%) | 2.97 |
| Total Families | 3,580 (100.0%) | 2.97 |
Median Household Size in Crawfordsville
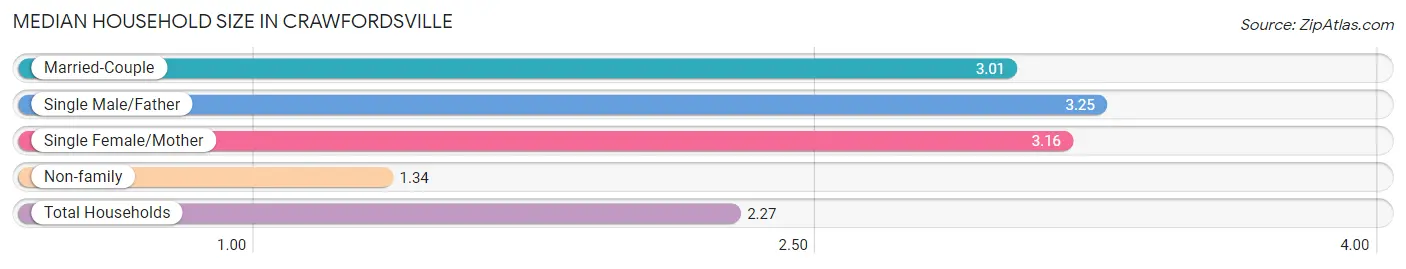
The median household size in Crawfordsville is 2.27 persons per household, with single male/father households (351 | 5.3%) accounting for the largest median household size of 3.25 persons per household. non-family households (3,095 | 46.4%) represent the smallest median household size with 1.34 persons per household.
| Household Type | # Households | Household Size |
| Married-Couple | 2,428 (36.4%) | 3.01 |
| Single Male/Father | 351 (5.3%) | 3.25 |
| Single Female/Mother | 801 (12.0%) | 3.16 |
| Non-family | 3,095 (46.4%) | 1.34 |
| Total Households | 6,675 (100.0%) | 2.27 |
Household Size by Marriage Status in Crawfordsville
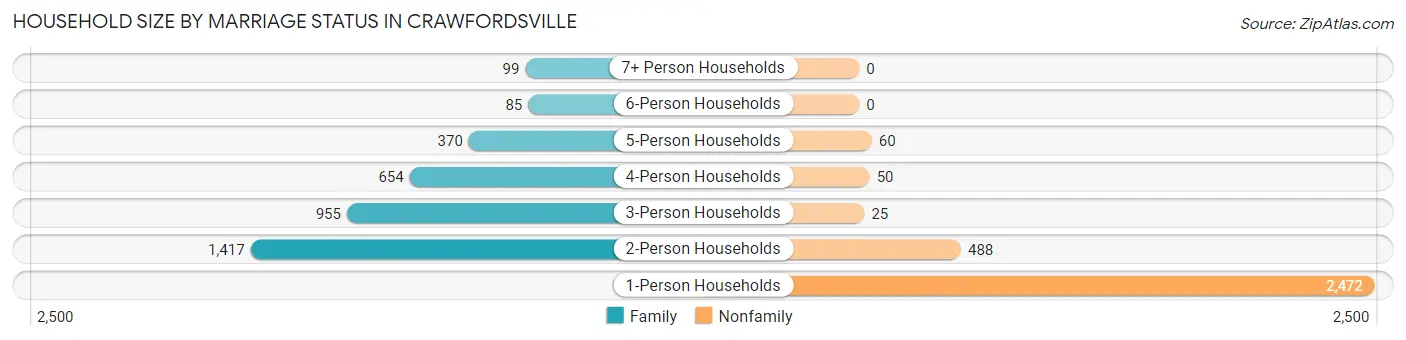
Out of a total of 6,675 households in Crawfordsville, 3,580 (53.6%) are family households, while 3,095 (46.4%) are nonfamily households. The most numerous type of family households are 2-person households, comprising 1,417, and the most common type of nonfamily households are 1-person households, comprising 2,472.
| Household Size | Family Households | Nonfamily Households |
| 1-Person Households | - | 2,472 (37.0%) |
| 2-Person Households | 1,417 (21.2%) | 488 (7.3%) |
| 3-Person Households | 955 (14.3%) | 25 (0.4%) |
| 4-Person Households | 654 (9.8%) | 50 (0.7%) |
| 5-Person Households | 370 (5.5%) | 60 (0.9%) |
| 6-Person Households | 85 (1.3%) | 0 (0.0%) |
| 7+ Person Households | 99 (1.5%) | 0 (0.0%) |
| Total | 3,580 (53.6%) | 3,095 (46.4%) |
Female Fertility in Crawfordsville
Fertility by Age in Crawfordsville
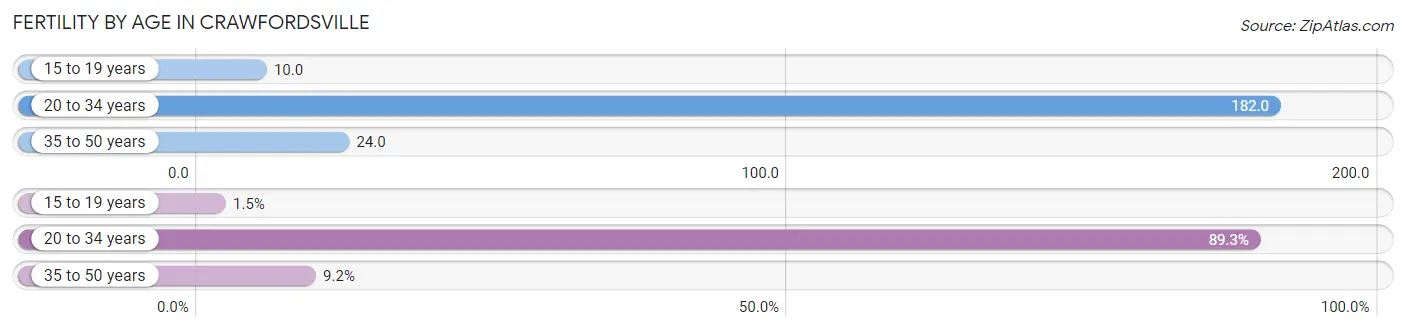
Average fertility rate in Crawfordsville is 97.0 births per 1,000 women. Women in the age bracket of 20 to 34 years have the highest fertility rate with 182.0 births per 1,000 women. Women in the age bracket of 20 to 34 years acount for 89.3% of all women with births.
| Age Bracket | Women with Births | Births / 1,000 Women |
| 15 to 19 years | 5 (1.5%) | 10.0 |
| 20 to 34 years | 292 (89.3%) | 182.0 |
| 35 to 50 years | 30 (9.2%) | 24.0 |
| Total | 327 (100.0%) | 97.0 |
Fertility by Age by Marriage Status in Crawfordsville
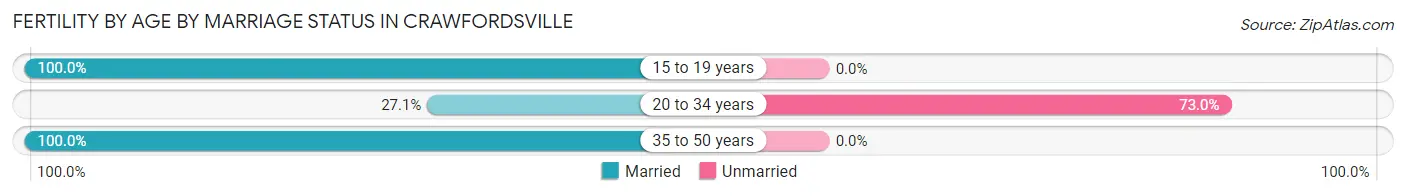
34.9% of women with births (327) in Crawfordsville are married. The highest percentage of unmarried women with births falls into 20 to 34 years age bracket with 73.0% of them unmarried at the time of birth, while the lowest percentage of unmarried women with births belong to 15 to 19 years age bracket with 0.0% of them unmarried.
| Age Bracket | Married | Unmarried |
| 15 to 19 years | 5 (100.0%) | 0 (0.0%) |
| 20 to 34 years | 79 (27.1%) | 213 (73.0%) |
| 35 to 50 years | 30 (100.0%) | 0 (0.0%) |
| Total | 114 (34.9%) | 213 (65.1%) |
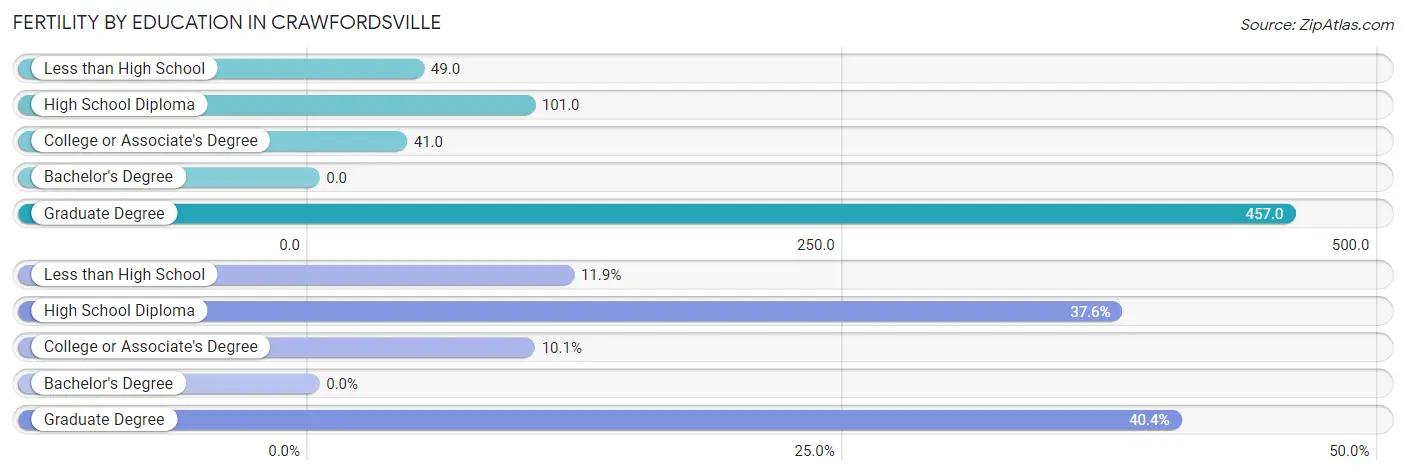
Fertility by Education in Crawfordsville
| Educational Attainment | Women with Births | Births / 1,000 Women |
| Less than High School | 39 (11.9%) | 49.0 |
| High School Diploma | 123 (37.6%) | 101.0 |
| College or Associate's Degree | 33 (10.1%) | 41.0 |
| Bachelor's Degree | 0 (0.0%) | 0.0 |
| Graduate Degree | 132 (40.4%) | 457.0 |
| Total | 327 (100.0%) | 97.0 |
Fertility by Education by Marriage Status in Crawfordsville
65.1% of women with births in Crawfordsville are unmarried. Women with the educational attainment of college or associate's degree are most likely to be married with 100.0% of them married at childbirth, while women with the educational attainment of graduate degree are least likely to be married with 100.0% of them unmarried at childbirth.
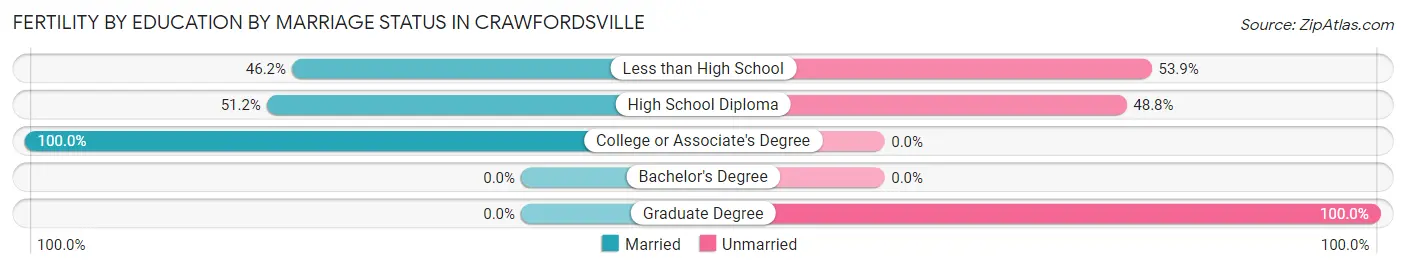
| Educational Attainment | Married | Unmarried |
| Less than High School | 18 (46.2%) | 21 (53.8%) |
| High School Diploma | 63 (51.2%) | 60 (48.8%) |
| College or Associate's Degree | 33 (100.0%) | 0 (0.0%) |
| Bachelor's Degree | 0 (0.0%) | 0 (0.0%) |
| Graduate Degree | 0 (0.0%) | 132 (100.0%) |
| Total | 114 (34.9%) | 213 (65.1%) |
Employment Characteristics in Crawfordsville
Employment by Class of Employer in Crawfordsville
Among the 7,298 employed individuals in Crawfordsville, private company employees (5,370 | 73.6%), not-for-profit organizations (642 | 8.8%), and local government employees (369 | 5.1%) make up the most common classes of employment.
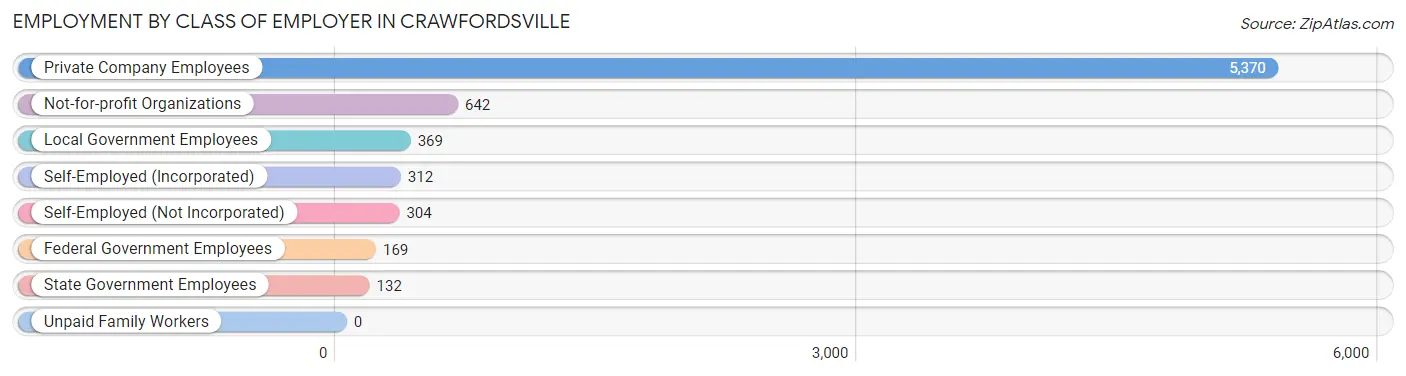
| Employer Class | # Employees | % Employees |
| Private Company Employees | 5,370 | 73.6% |
| Self-Employed (Incorporated) | 312 | 4.3% |
| Self-Employed (Not Incorporated) | 304 | 4.2% |
| Not-for-profit Organizations | 642 | 8.8% |
| Local Government Employees | 369 | 5.1% |
| State Government Employees | 132 | 1.8% |
| Federal Government Employees | 169 | 2.3% |
| Unpaid Family Workers | 0 | 0.0% |
| Total | 7,298 | 100.0% |
Employment Status by Age in Crawfordsville
According to the labor force statistics for Crawfordsville, out of the total population over 16 years of age (13,131), 62.2% or 8,167 individuals are in the labor force, with 5.3% or 433 of them unemployed. The age group with the highest labor force participation rate is 45 to 54 years, with 87.3% or 1,359 individuals in the labor force. Within the labor force, the 16 to 19 years age range has the highest percentage of unemployed individuals, with 13.2% or 102 of them being unemployed.
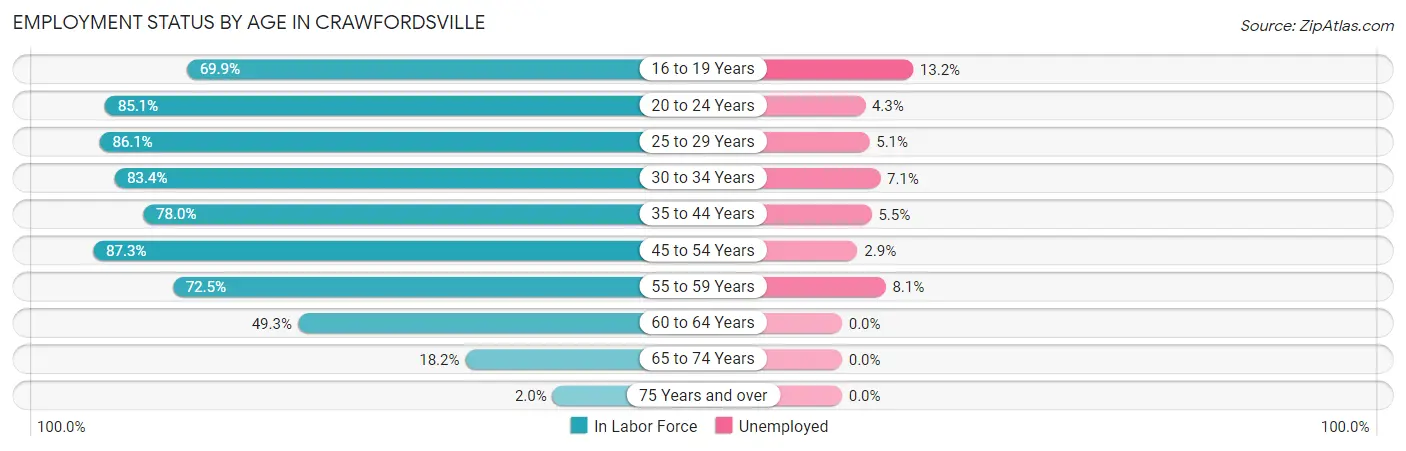
| Age Bracket | In Labor Force | Unemployed |
| 16 to 19 Years | 772 (69.9%) | 102 (13.2%) |
| 20 to 24 Years | 1,248 (85.1%) | 54 (4.3%) |
| 25 to 29 Years | 1,065 (86.1%) | 54 (5.1%) |
| 30 to 34 Years | 719 (83.4%) | 51 (7.1%) |
| 35 to 44 Years | 1,382 (78.0%) | 76 (5.5%) |
| 45 to 54 Years | 1,359 (87.3%) | 39 (2.9%) |
| 55 to 59 Years | 742 (72.5%) | 60 (8.1%) |
| 60 to 64 Years | 586 (49.3%) | 0 (0.0%) |
| 65 to 74 Years | 260 (18.2%) | 0 (0.0%) |
| 75 Years and over | 30 (2.0%) | 0 (0.0%) |
| Total | 8,167 (62.2%) | 433 (5.3%) |
Employment Status by Educational Attainment in Crawfordsville
According to labor force statistics for Crawfordsville, 76.6% of individuals (5,852) out of the total population between 25 and 64 years of age (7,640) are in the labor force, with 4.8% or 281 of them being unemployed. The group with the highest labor force participation rate are those with the educational attainment of bachelor's degree or higher, with 94.2% or 1,178 individuals in the labor force. Within the labor force, individuals with less than high school education have the highest percentage of unemployment, with 11.3% or 69 of them being unemployed.
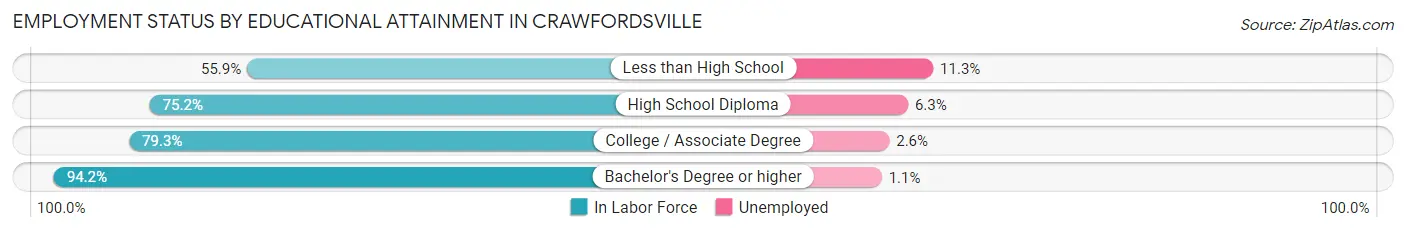
| Educational Attainment | In Labor Force | Unemployed |
| Less than High School | 613 (55.9%) | 124 (11.3%) |
| High School Diploma | 2,477 (75.2%) | 208 (6.3%) |
| College / Associate Degree | 1,585 (79.3%) | 52 (2.6%) |
| Bachelor's Degree or higher | 1,178 (94.2%) | 14 (1.1%) |
| Total | 5,852 (76.6%) | 367 (4.8%) |
Employment Occupations by Sex in Crawfordsville
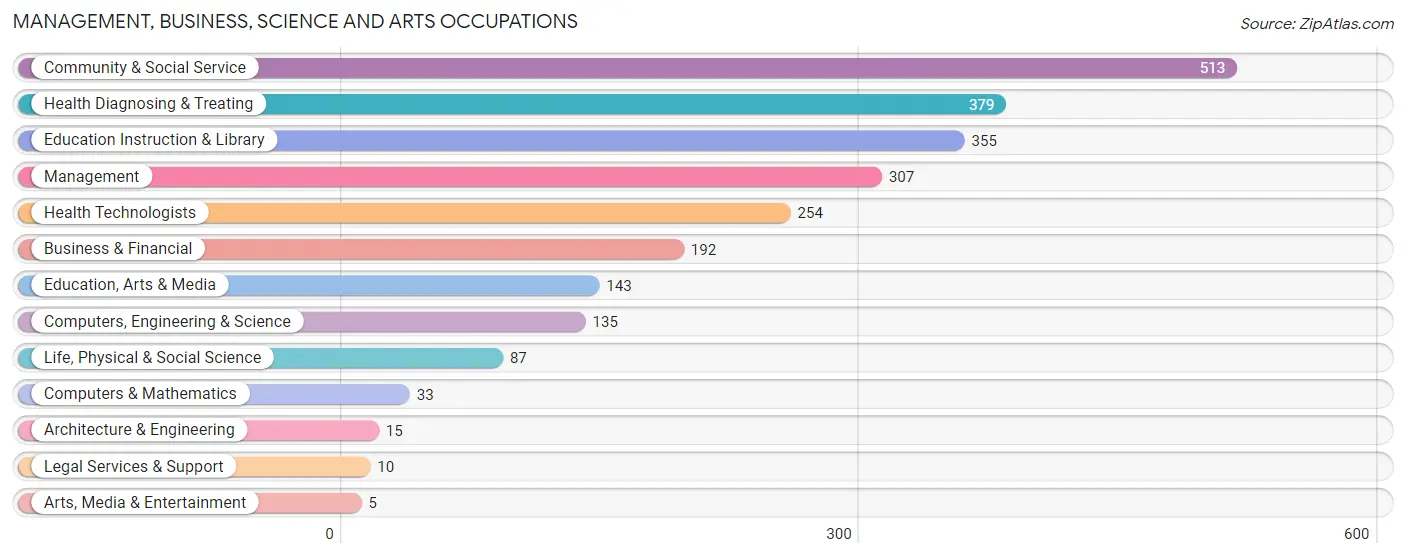
Management, Business, Science and Arts Occupations
The most common Management, Business, Science and Arts occupations in Crawfordsville are Community & Social Service (513 | 6.6%), Health Diagnosing & Treating (379 | 4.9%), Education Instruction & Library (355 | 4.6%), Management (307 | 4.0%), and Health Technologists (254 | 3.3%).
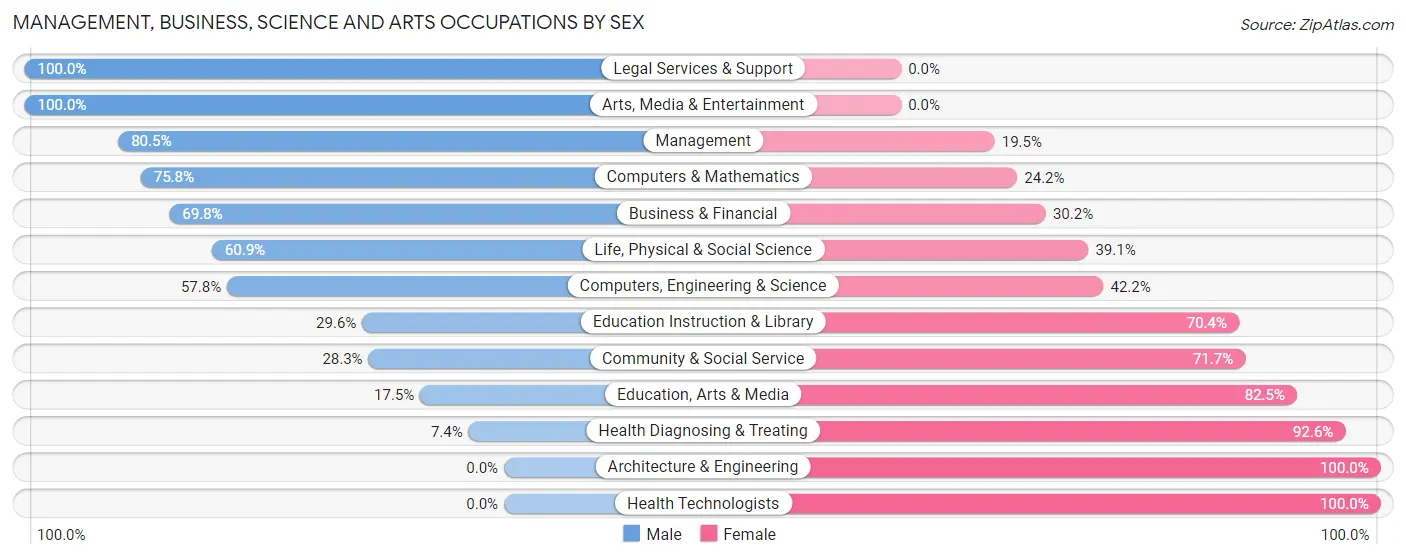
Management, Business, Science and Arts Occupations by Sex
Within the Management, Business, Science and Arts occupations in Crawfordsville, the most male-oriented occupations are Legal Services & Support (100.0%), Arts, Media & Entertainment (100.0%), and Management (80.5%), while the most female-oriented occupations are Architecture & Engineering (100.0%), Health Technologists (100.0%), and Health Diagnosing & Treating (92.6%).
| Occupation | Male | Female |
| Management | 247 (80.5%) | 60 (19.5%) |
| Business & Financial | 134 (69.8%) | 58 (30.2%) |
| Computers, Engineering & Science | 78 (57.8%) | 57 (42.2%) |
| Computers & Mathematics | 25 (75.8%) | 8 (24.2%) |
| Architecture & Engineering | 0 (0.0%) | 15 (100.0%) |
| Life, Physical & Social Science | 53 (60.9%) | 34 (39.1%) |
| Community & Social Service | 145 (28.3%) | 368 (71.7%) |
| Education, Arts & Media | 25 (17.5%) | 118 (82.5%) |
| Legal Services & Support | 10 (100.0%) | 0 (0.0%) |
| Education Instruction & Library | 105 (29.6%) | 250 (70.4%) |
| Arts, Media & Entertainment | 5 (100.0%) | 0 (0.0%) |
| Health Diagnosing & Treating | 28 (7.4%) | 351 (92.6%) |
| Health Technologists | 0 (0.0%) | 254 (100.0%) |
| Total (Category) | 632 (41.4%) | 894 (58.6%) |
| Total (Overall) | 4,471 (57.9%) | 3,257 (42.1%) |
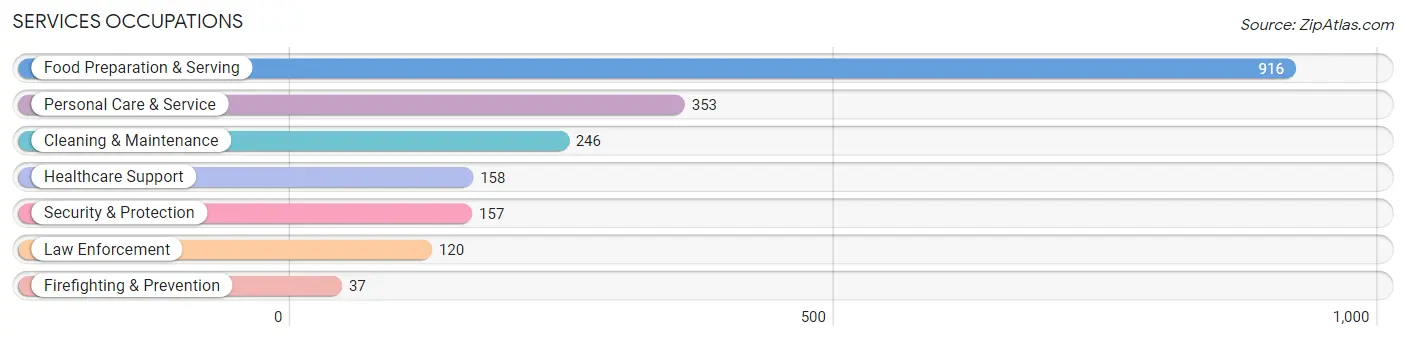
Services Occupations
The most common Services occupations in Crawfordsville are Food Preparation & Serving (916 | 11.8%), Personal Care & Service (353 | 4.6%), Cleaning & Maintenance (246 | 3.2%), Healthcare Support (158 | 2.0%), and Security & Protection (157 | 2.0%).
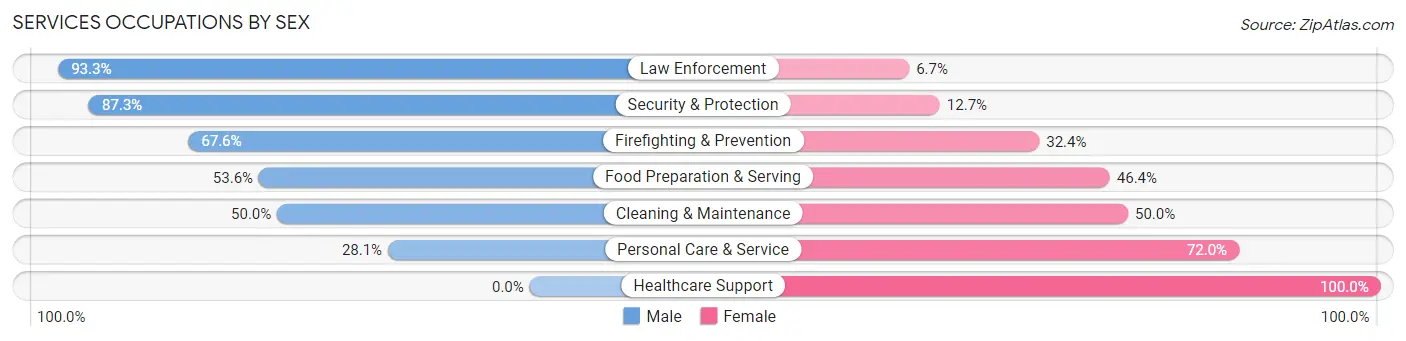
Services Occupations by Sex
Within the Services occupations in Crawfordsville, the most male-oriented occupations are Law Enforcement (93.3%), Security & Protection (87.3%), and Firefighting & Prevention (67.6%), while the most female-oriented occupations are Healthcare Support (100.0%), Personal Care & Service (72.0%), and Cleaning & Maintenance (50.0%).
| Occupation | Male | Female |
| Healthcare Support | 0 (0.0%) | 158 (100.0%) |
| Security & Protection | 137 (87.3%) | 20 (12.7%) |
| Firefighting & Prevention | 25 (67.6%) | 12 (32.4%) |
| Law Enforcement | 112 (93.3%) | 8 (6.7%) |
| Food Preparation & Serving | 491 (53.6%) | 425 (46.4%) |
| Cleaning & Maintenance | 123 (50.0%) | 123 (50.0%) |
| Personal Care & Service | 99 (28.1%) | 254 (72.0%) |
| Total (Category) | 850 (46.5%) | 980 (53.5%) |
| Total (Overall) | 4,471 (57.9%) | 3,257 (42.1%) |
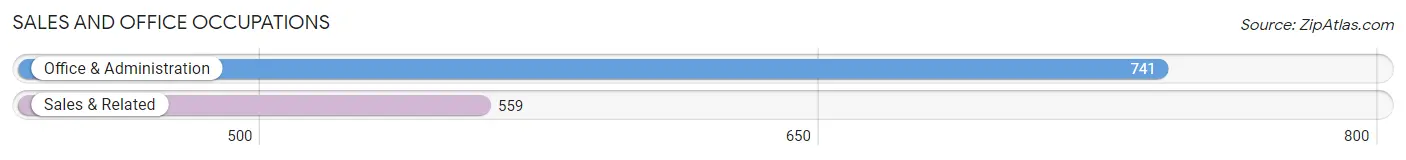
Sales and Office Occupations
The most common Sales and Office occupations in Crawfordsville are Office & Administration (741 | 9.6%), and Sales & Related (559 | 7.2%).
Sales and Office Occupations by Sex
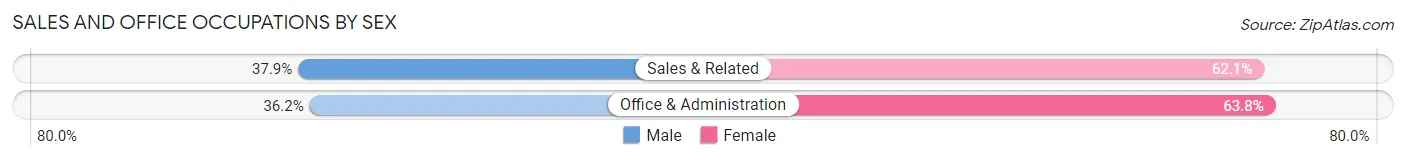
| Occupation | Male | Female |
| Sales & Related | 212 (37.9%) | 347 (62.1%) |
| Office & Administration | 268 (36.2%) | 473 (63.8%) |
| Total (Category) | 480 (36.9%) | 820 (63.1%) |
| Total (Overall) | 4,471 (57.9%) | 3,257 (42.1%) |
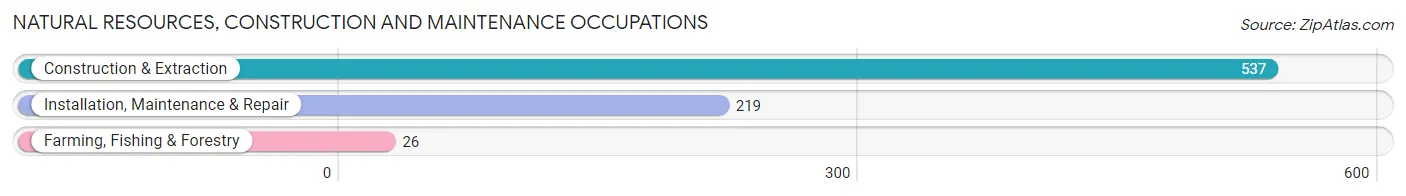
Natural Resources, Construction and Maintenance Occupations
The most common Natural Resources, Construction and Maintenance occupations in Crawfordsville are Construction & Extraction (537 | 7.0%), Installation, Maintenance & Repair (219 | 2.8%), and Farming, Fishing & Forestry (26 | 0.3%).
Natural Resources, Construction and Maintenance Occupations by Sex
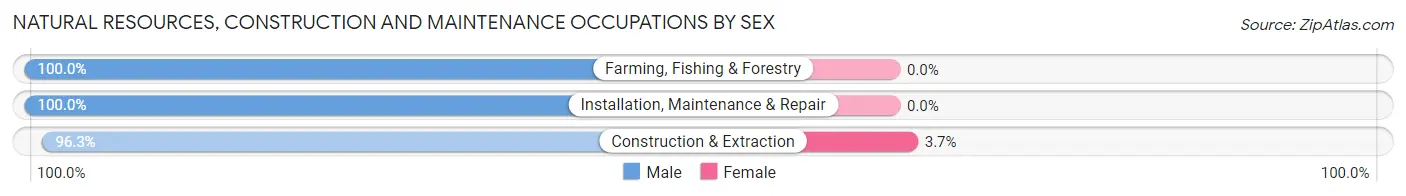
| Occupation | Male | Female |
| Farming, Fishing & Forestry | 26 (100.0%) | 0 (0.0%) |
| Construction & Extraction | 517 (96.3%) | 20 (3.7%) |
| Installation, Maintenance & Repair | 219 (100.0%) | 0 (0.0%) |
| Total (Category) | 762 (97.4%) | 20 (2.6%) |
| Total (Overall) | 4,471 (57.9%) | 3,257 (42.1%) |
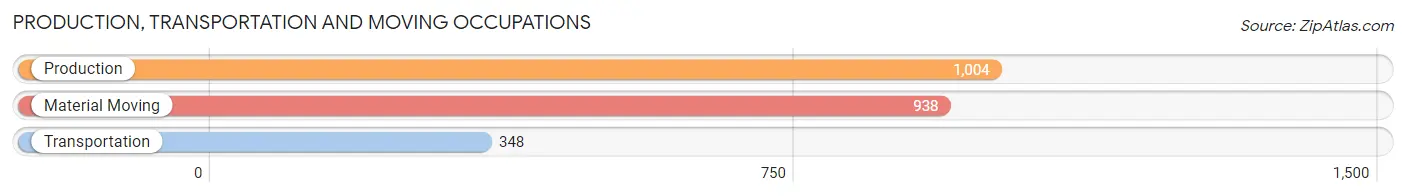
Production, Transportation and Moving Occupations
The most common Production, Transportation and Moving occupations in Crawfordsville are Production (1,004 | 13.0%), Material Moving (938 | 12.1%), and Transportation (348 | 4.5%).
Production, Transportation and Moving Occupations by Sex
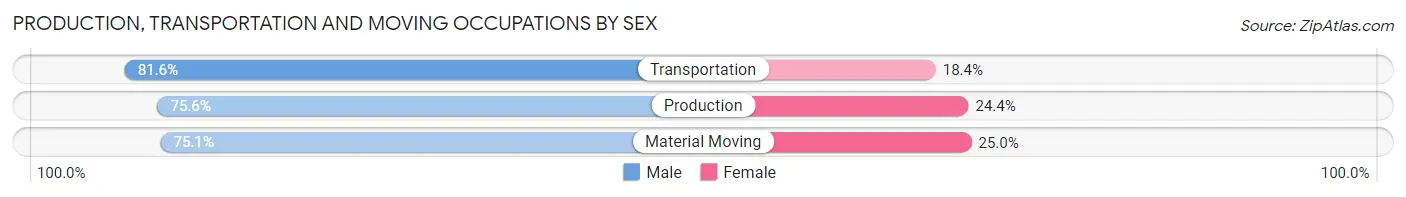
| Occupation | Male | Female |
| Production | 759 (75.6%) | 245 (24.4%) |
| Transportation | 284 (81.6%) | 64 (18.4%) |
| Material Moving | 704 (75.0%) | 234 (24.9%) |
| Total (Category) | 1,747 (76.3%) | 543 (23.7%) |
| Total (Overall) | 4,471 (57.9%) | 3,257 (42.1%) |
Employment Industries by Sex in Crawfordsville
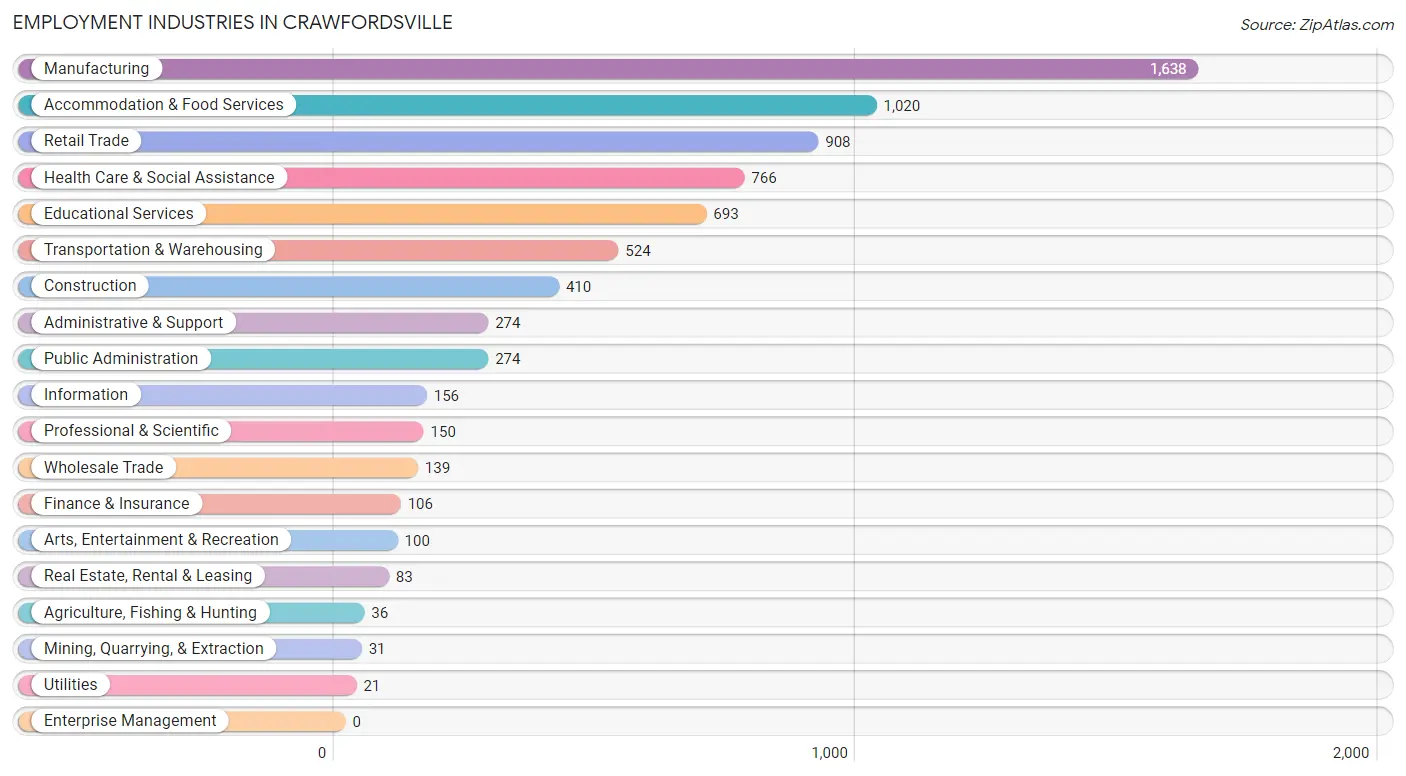
Employment Industries in Crawfordsville
The major employment industries in Crawfordsville include Manufacturing (1,638 | 21.2%), Accommodation & Food Services (1,020 | 13.2%), Retail Trade (908 | 11.7%), Health Care & Social Assistance (766 | 9.9%), and Educational Services (693 | 9.0%).
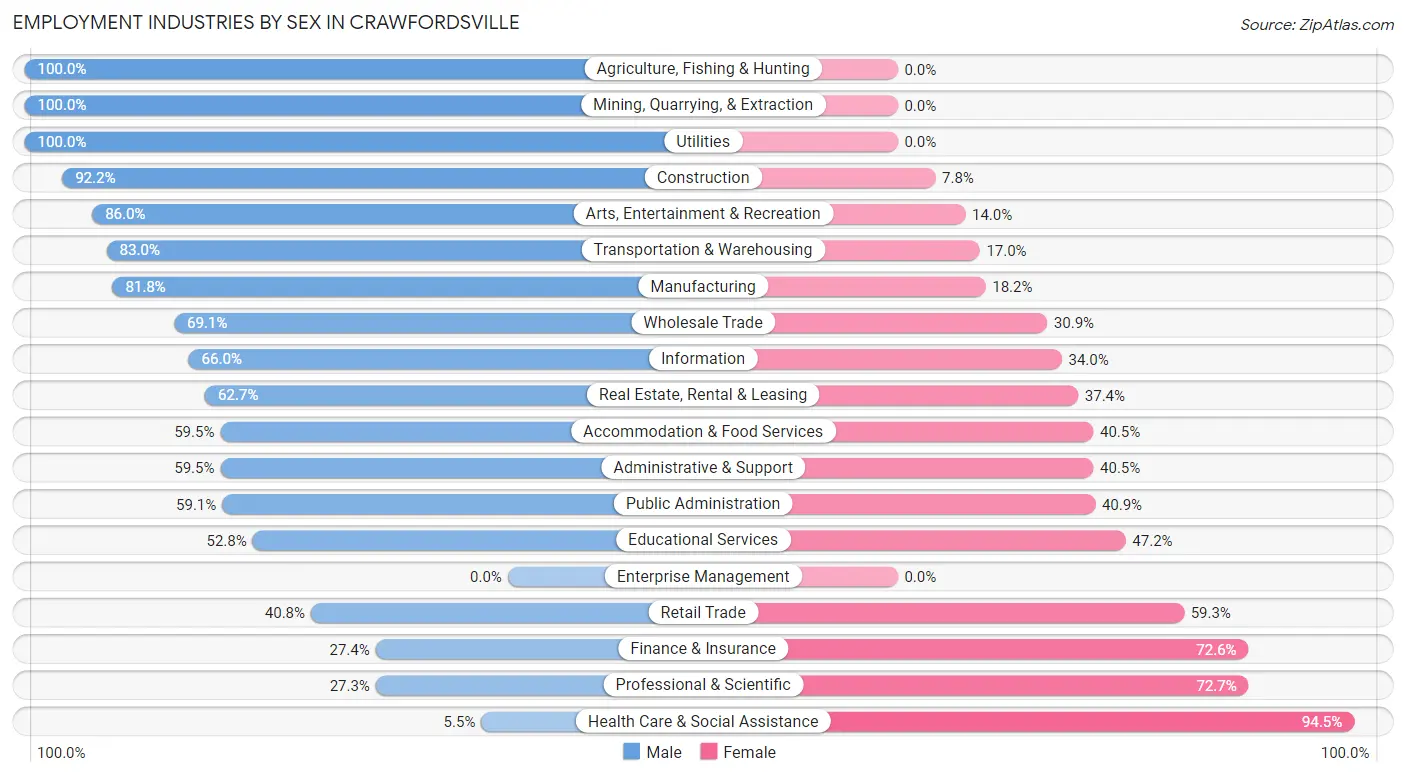
Employment Industries by Sex in Crawfordsville
The Crawfordsville industries that see more men than women are Agriculture, Fishing & Hunting (100.0%), Mining, Quarrying, & Extraction (100.0%), and Utilities (100.0%), whereas the industries that tend to have a higher number of women are Health Care & Social Assistance (94.5%), Professional & Scientific (72.7%), and Finance & Insurance (72.6%).
| Industry | Male | Female |
| Agriculture, Fishing & Hunting | 36 (100.0%) | 0 (0.0%) |
| Mining, Quarrying, & Extraction | 31 (100.0%) | 0 (0.0%) |
| Construction | 378 (92.2%) | 32 (7.8%) |
| Manufacturing | 1,340 (81.8%) | 298 (18.2%) |
| Wholesale Trade | 96 (69.1%) | 43 (30.9%) |
| Retail Trade | 370 (40.7%) | 538 (59.3%) |
| Transportation & Warehousing | 435 (83.0%) | 89 (17.0%) |
| Utilities | 21 (100.0%) | 0 (0.0%) |
| Information | 103 (66.0%) | 53 (34.0%) |
| Finance & Insurance | 29 (27.4%) | 77 (72.6%) |
| Real Estate, Rental & Leasing | 52 (62.6%) | 31 (37.3%) |
| Professional & Scientific | 41 (27.3%) | 109 (72.7%) |
| Enterprise Management | 0 (0.0%) | 0 (0.0%) |
| Administrative & Support | 163 (59.5%) | 111 (40.5%) |
| Educational Services | 366 (52.8%) | 327 (47.2%) |
| Health Care & Social Assistance | 42 (5.5%) | 724 (94.5%) |
| Arts, Entertainment & Recreation | 86 (86.0%) | 14 (14.0%) |
| Accommodation & Food Services | 607 (59.5%) | 413 (40.5%) |
| Public Administration | 162 (59.1%) | 112 (40.9%) |
| Total | 4,471 (57.9%) | 3,257 (42.1%) |
Education in Crawfordsville
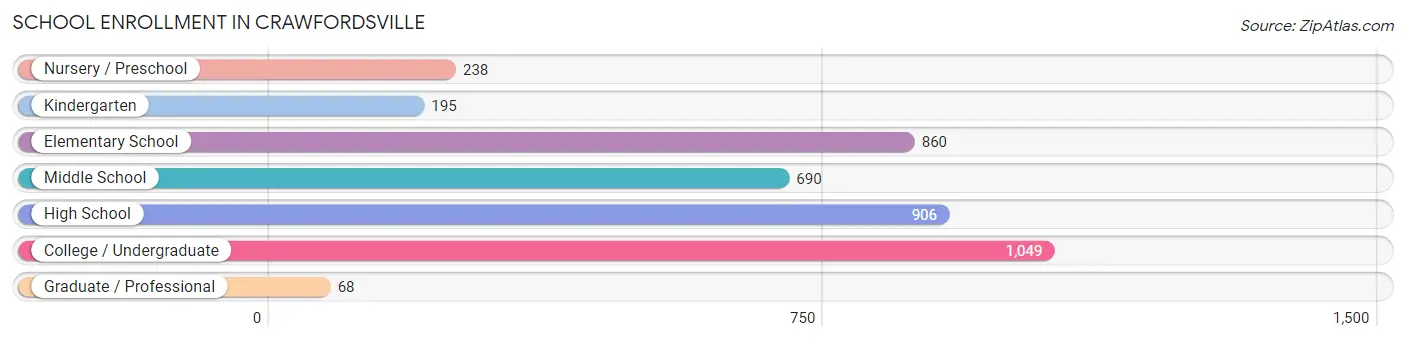
School Enrollment in Crawfordsville
The most common levels of schooling among the 4,006 students in Crawfordsville are college / undergraduate (1,049 | 26.2%), high school (906 | 22.6%), and elementary school (860 | 21.5%).
| School Level | # Students | % Students |
| Nursery / Preschool | 238 | 5.9% |
| Kindergarten | 195 | 4.9% |
| Elementary School | 860 | 21.5% |
| Middle School | 690 | 17.2% |
| High School | 906 | 22.6% |
| College / Undergraduate | 1,049 | 26.2% |
| Graduate / Professional | 68 | 1.7% |
| Total | 4,006 | 100.0% |
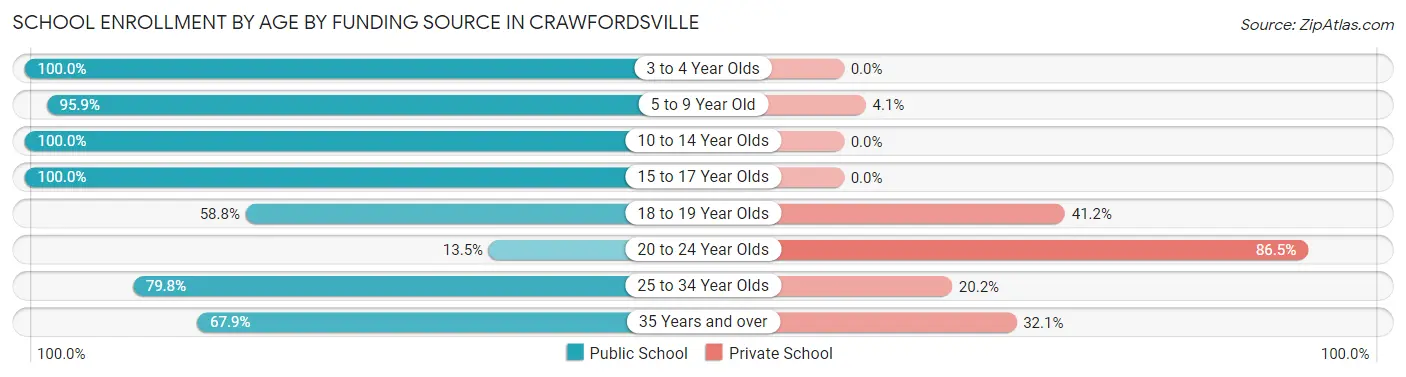
School Enrollment by Age by Funding Source in Crawfordsville
Out of a total of 4,006 students who are enrolled in schools in Crawfordsville, 837 (20.9%) attend a private institution, while the remaining 3,169 (79.1%) are enrolled in public schools. The age group of 20 to 24 year olds has the highest likelihood of being enrolled in private schools, with 582 (86.5% in the age bracket) enrolled. Conversely, the age group of 3 to 4 year olds has the lowest likelihood of being enrolled in a private school, with 177 (100.0% in the age bracket) attending a public institution.
| Age Bracket | Public School | Private School |
| 3 to 4 Year Olds | 177 (100.0%) | 0 (0.0%) |
| 5 to 9 Year Old | 892 (95.9%) | 38 (4.1%) |
| 10 to 14 Year Olds | 963 (100.0%) | 0 (0.0%) |
| 15 to 17 Year Olds | 596 (100.0%) | 0 (0.0%) |
| 18 to 19 Year Olds | 227 (58.8%) | 159 (41.2%) |
| 20 to 24 Year Olds | 91 (13.5%) | 582 (86.5%) |
| 25 to 34 Year Olds | 202 (79.8%) | 51 (20.2%) |
| 35 Years and over | 19 (67.9%) | 9 (32.1%) |
| Total | 3,169 (79.1%) | 837 (20.9%) |
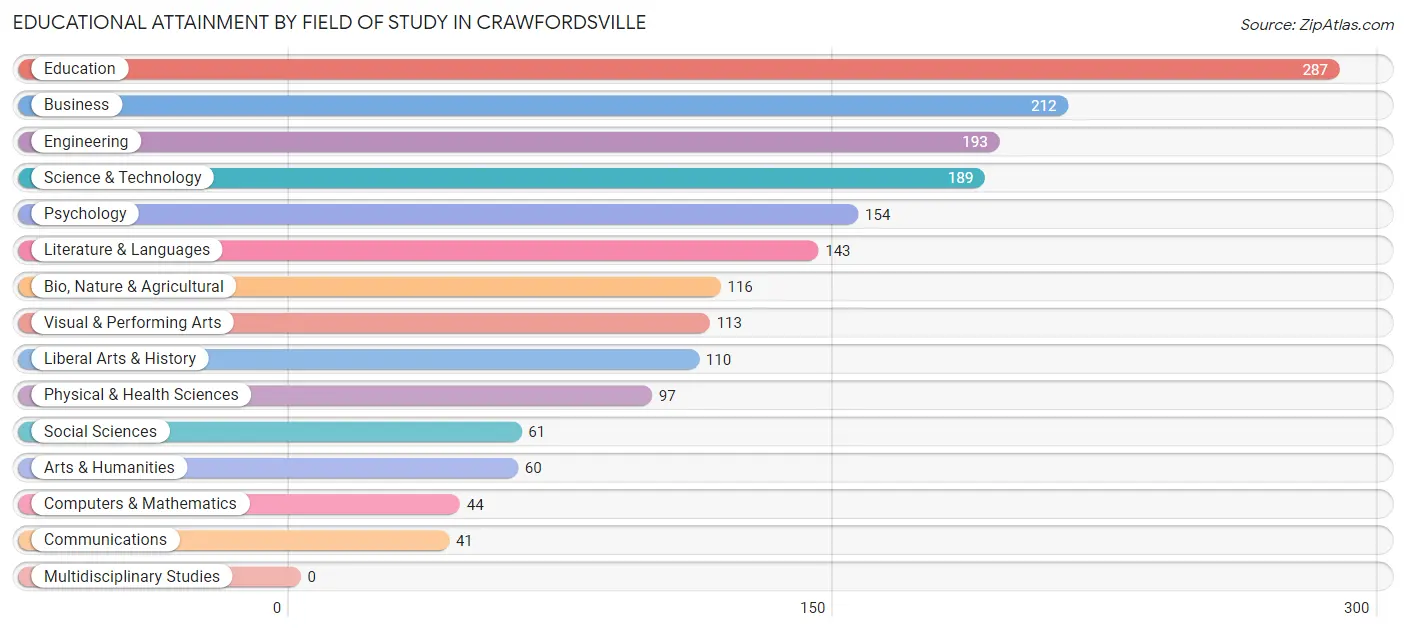
Educational Attainment by Field of Study in Crawfordsville
Education (287 | 15.8%), business (212 | 11.7%), engineering (193 | 10.6%), science & technology (189 | 10.4%), and psychology (154 | 8.5%) are the most common fields of study among 1,820 individuals in Crawfordsville who have obtained a bachelor's degree or higher.
| Field of Study | # Graduates | % Graduates |
| Computers & Mathematics | 44 | 2.4% |
| Bio, Nature & Agricultural | 116 | 6.4% |
| Physical & Health Sciences | 97 | 5.3% |
| Psychology | 154 | 8.5% |
| Social Sciences | 61 | 3.4% |
| Engineering | 193 | 10.6% |
| Multidisciplinary Studies | 0 | 0.0% |
| Science & Technology | 189 | 10.4% |
| Business | 212 | 11.7% |
| Education | 287 | 15.8% |
| Literature & Languages | 143 | 7.9% |
| Liberal Arts & History | 110 | 6.0% |
| Visual & Performing Arts | 113 | 6.2% |
| Communications | 41 | 2.2% |
| Arts & Humanities | 60 | 3.3% |
| Total | 1,820 | 100.0% |
Transportation & Commute in Crawfordsville
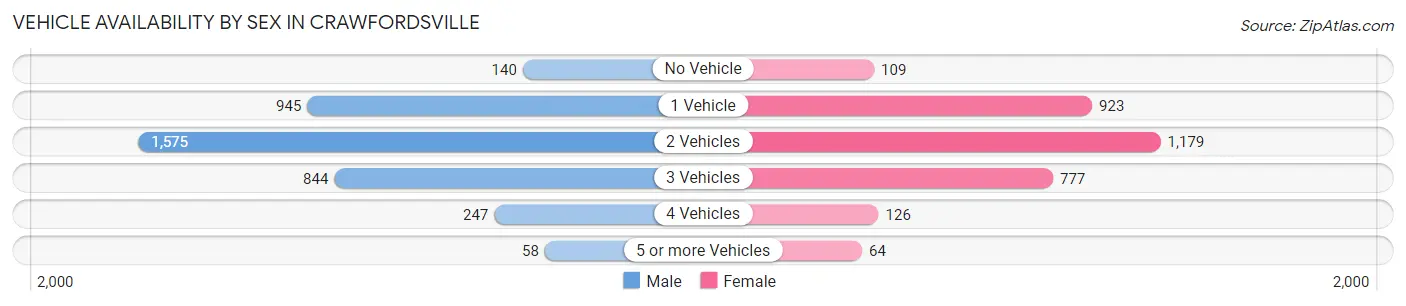
Vehicle Availability by Sex in Crawfordsville
The most prevalent vehicle ownership categories in Crawfordsville are males with 2 vehicles (1,575, accounting for 41.3%) and females with 2 vehicles (1,179, making up 49.6%).
| Vehicles Available | Male | Female |
| No Vehicle | 140 (3.7%) | 109 (3.4%) |
| 1 Vehicle | 945 (24.8%) | 923 (29.0%) |
| 2 Vehicles | 1,575 (41.3%) | 1,179 (37.1%) |
| 3 Vehicles | 844 (22.2%) | 777 (24.4%) |
| 4 Vehicles | 247 (6.5%) | 126 (4.0%) |
| 5 or more Vehicles | 58 (1.5%) | 64 (2.0%) |
| Total | 3,809 (100.0%) | 3,178 (100.0%) |
Commute Time in Crawfordsville
The most frequently occuring commute durations in Crawfordsville are 5 to 9 minutes (2,069 commuters, 29.5%), 10 to 14 minutes (1,704 commuters, 24.3%), and less than 5 minutes (750 commuters, 10.7%).
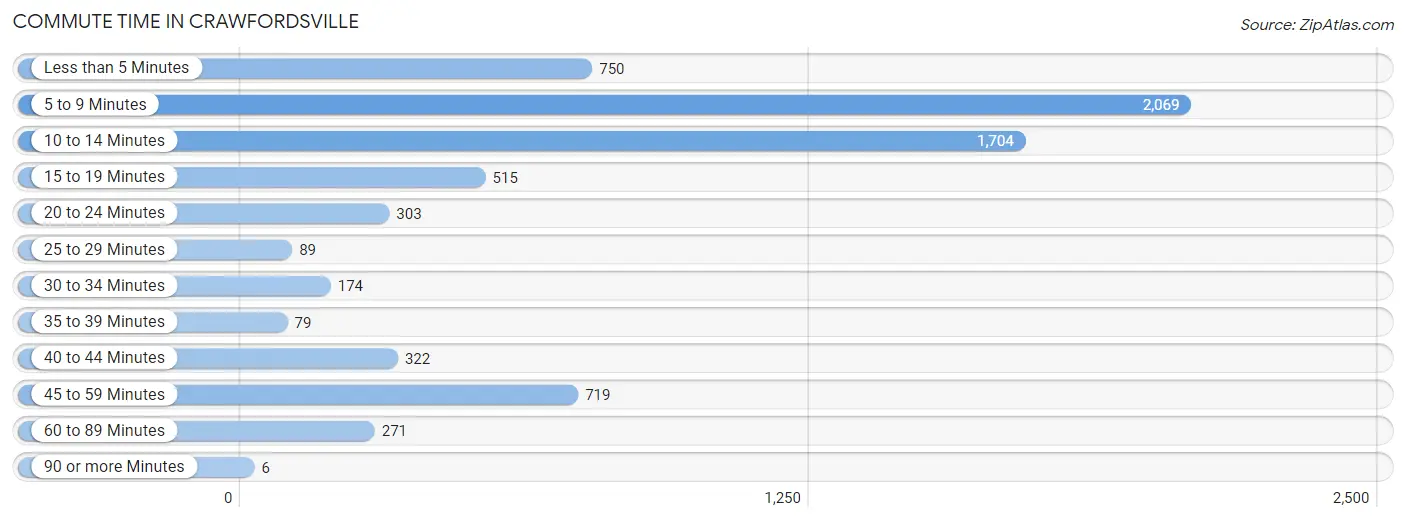
| Commute Time | # Commuters | % Commuters |
| Less than 5 Minutes | 750 | 10.7% |
| 5 to 9 Minutes | 2,069 | 29.5% |
| 10 to 14 Minutes | 1,704 | 24.3% |
| 15 to 19 Minutes | 515 | 7.4% |
| 20 to 24 Minutes | 303 | 4.3% |
| 25 to 29 Minutes | 89 | 1.3% |
| 30 to 34 Minutes | 174 | 2.5% |
| 35 to 39 Minutes | 79 | 1.1% |
| 40 to 44 Minutes | 322 | 4.6% |
| 45 to 59 Minutes | 719 | 10.3% |
| 60 to 89 Minutes | 271 | 3.9% |
| 90 or more Minutes | 6 | 0.1% |
Commute Time by Sex in Crawfordsville
The most common commute times in Crawfordsville are 5 to 9 minutes (1,125 commuters, 28.8%) for males and 5 to 9 minutes (944 commuters, 30.5%) for females.
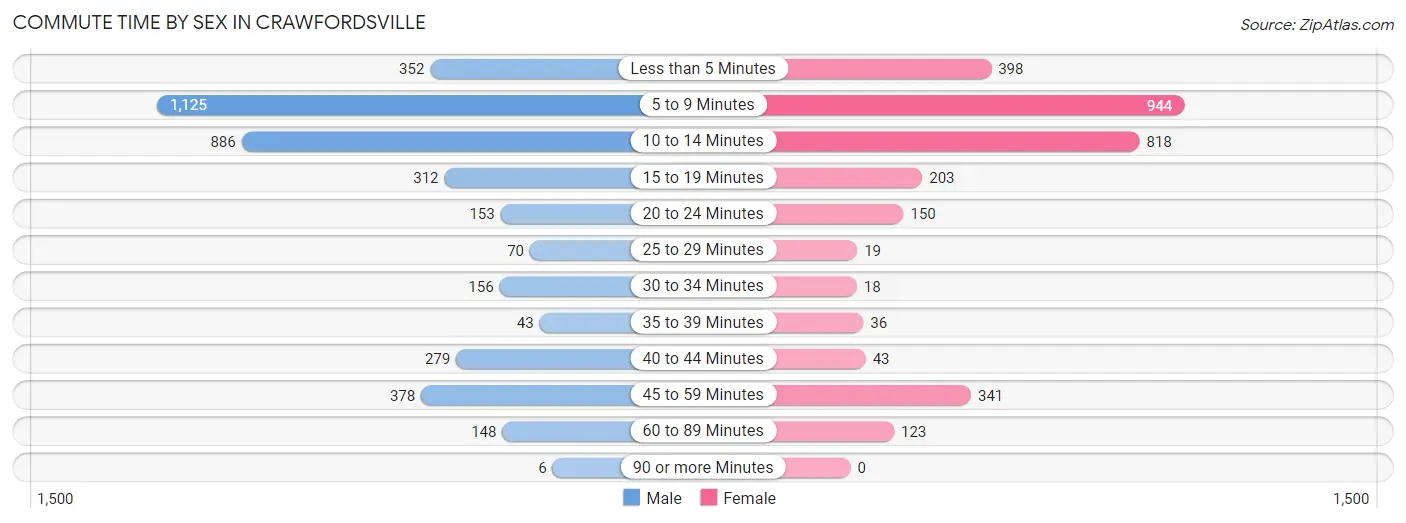
| Commute Time | Male | Female |
| Less than 5 Minutes | 352 (9.0%) | 398 (12.9%) |
| 5 to 9 Minutes | 1,125 (28.8%) | 944 (30.5%) |
| 10 to 14 Minutes | 886 (22.7%) | 818 (26.5%) |
| 15 to 19 Minutes | 312 (8.0%) | 203 (6.6%) |
| 20 to 24 Minutes | 153 (3.9%) | 150 (4.9%) |
| 25 to 29 Minutes | 70 (1.8%) | 19 (0.6%) |
| 30 to 34 Minutes | 156 (4.0%) | 18 (0.6%) |
| 35 to 39 Minutes | 43 (1.1%) | 36 (1.2%) |
| 40 to 44 Minutes | 279 (7.1%) | 43 (1.4%) |
| 45 to 59 Minutes | 378 (9.7%) | 341 (11.0%) |
| 60 to 89 Minutes | 148 (3.8%) | 123 (4.0%) |
| 90 or more Minutes | 6 (0.2%) | 0 (0.0%) |
Time of Departure to Work by Sex in Crawfordsville
The most frequent times of departure to work in Crawfordsville are 4:00 PM to 11:59 PM (698, 17.9%) for males and 4:00 PM to 11:59 PM (498, 16.1%) for females.
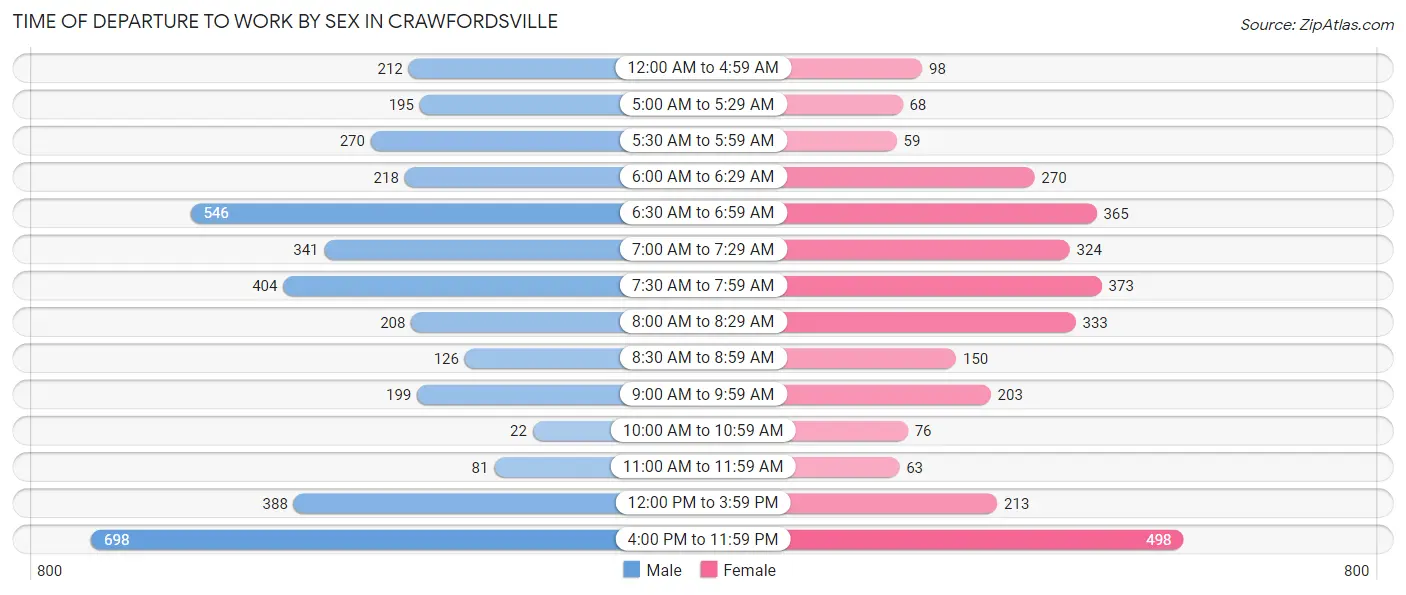
| Time of Departure | Male | Female |
| 12:00 AM to 4:59 AM | 212 (5.4%) | 98 (3.2%) |
| 5:00 AM to 5:29 AM | 195 (5.0%) | 68 (2.2%) |
| 5:30 AM to 5:59 AM | 270 (6.9%) | 59 (1.9%) |
| 6:00 AM to 6:29 AM | 218 (5.6%) | 270 (8.7%) |
| 6:30 AM to 6:59 AM | 546 (14.0%) | 365 (11.8%) |
| 7:00 AM to 7:29 AM | 341 (8.7%) | 324 (10.5%) |
| 7:30 AM to 7:59 AM | 404 (10.3%) | 373 (12.1%) |
| 8:00 AM to 8:29 AM | 208 (5.3%) | 333 (10.8%) |
| 8:30 AM to 8:59 AM | 126 (3.2%) | 150 (4.9%) |
| 9:00 AM to 9:59 AM | 199 (5.1%) | 203 (6.6%) |
| 10:00 AM to 10:59 AM | 22 (0.6%) | 76 (2.5%) |
| 11:00 AM to 11:59 AM | 81 (2.1%) | 63 (2.0%) |
| 12:00 PM to 3:59 PM | 388 (9.9%) | 213 (6.9%) |
| 4:00 PM to 11:59 PM | 698 (17.9%) | 498 (16.1%) |
| Total | 3,908 (100.0%) | 3,093 (100.0%) |
Housing Occupancy in Crawfordsville
Occupancy by Ownership in Crawfordsville
Of the total 6,675 dwellings in Crawfordsville, owner-occupied units account for 3,999 (59.9%), while renter-occupied units make up 2,676 (40.1%).
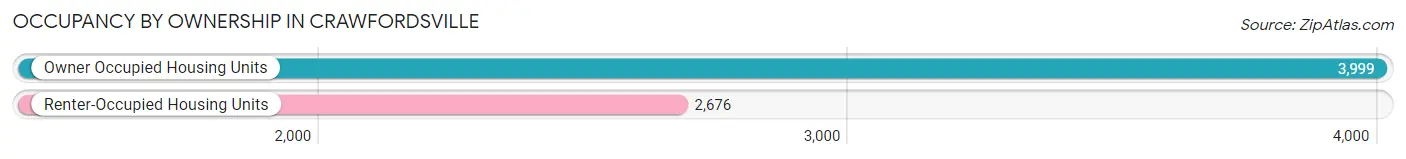
| Occupancy | # Housing Units | % Housing Units |
| Owner Occupied Housing Units | 3,999 | 59.9% |
| Renter-Occupied Housing Units | 2,676 | 40.1% |
| Total Occupied Housing Units | 6,675 | 100.0% |
Occupancy by Household Size in Crawfordsville
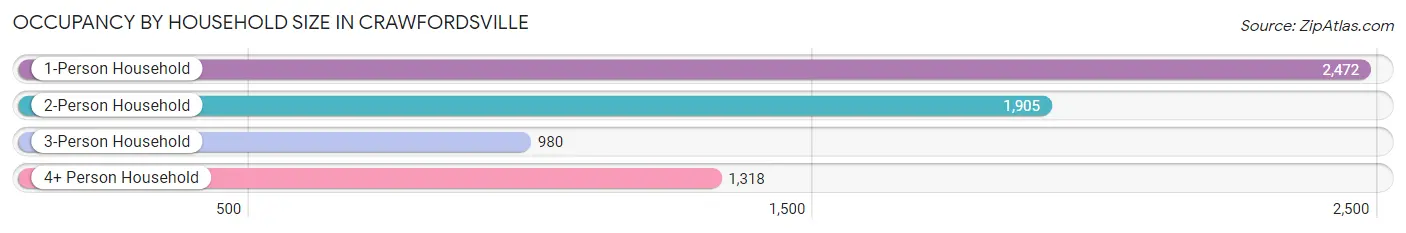
| Household Size | # Housing Units | % Housing Units |
| 1-Person Household | 2,472 | 37.0% |
| 2-Person Household | 1,905 | 28.5% |
| 3-Person Household | 980 | 14.7% |
| 4+ Person Household | 1,318 | 19.8% |
| Total Housing Units | 6,675 | 100.0% |
Occupancy by Ownership by Household Size in Crawfordsville
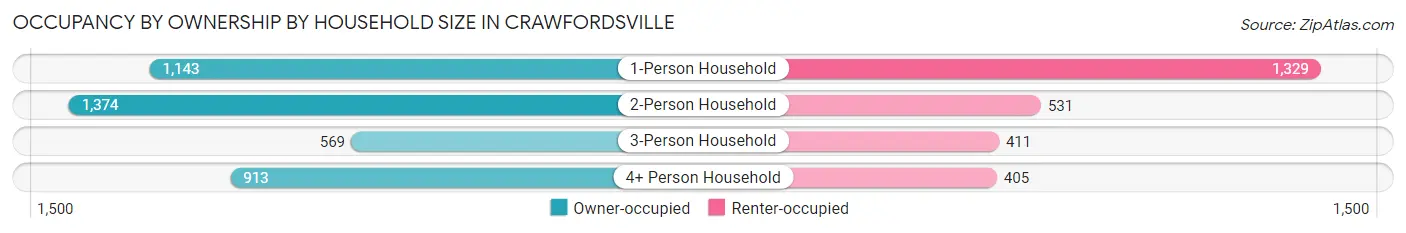
| Household Size | Owner-occupied | Renter-occupied |
| 1-Person Household | 1,143 (46.2%) | 1,329 (53.8%) |
| 2-Person Household | 1,374 (72.1%) | 531 (27.9%) |
| 3-Person Household | 569 (58.1%) | 411 (41.9%) |
| 4+ Person Household | 913 (69.3%) | 405 (30.7%) |
| Total Housing Units | 3,999 (59.9%) | 2,676 (40.1%) |
Occupancy by Educational Attainment in Crawfordsville
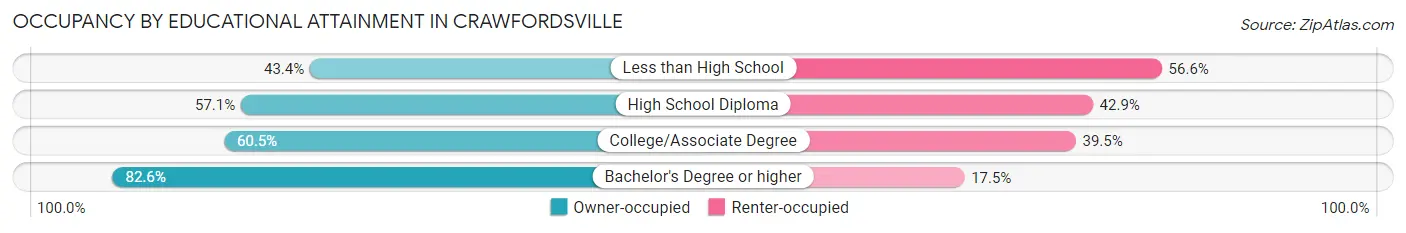
| Household Size | Owner-occupied | Renter-occupied |
| Less than High School | 421 (43.4%) | 549 (56.6%) |
| High School Diploma | 1,694 (57.1%) | 1,274 (42.9%) |
| College/Associate Degree | 1,028 (60.5%) | 672 (39.5%) |
| Bachelor's Degree or higher | 856 (82.6%) | 181 (17.4%) |
Occupancy by Age of Householder in Crawfordsville
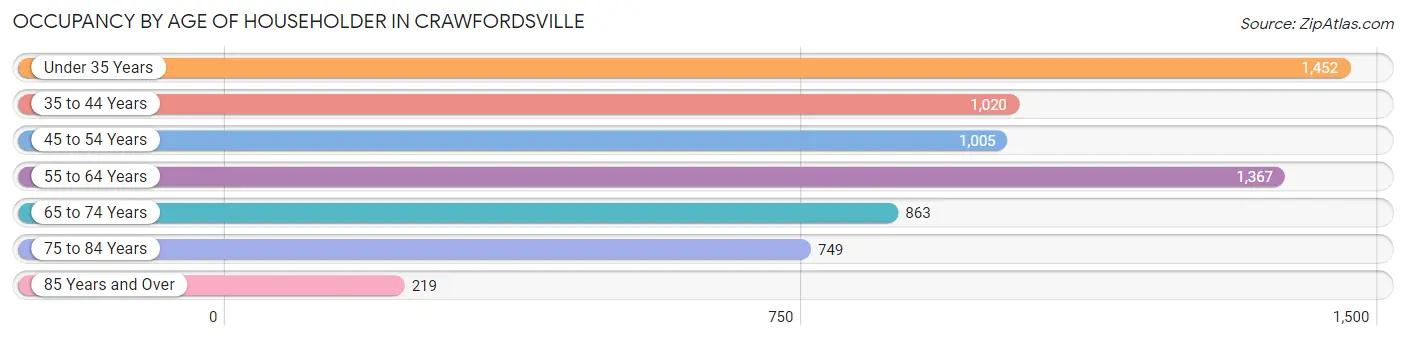
| Age Bracket | # Households | % Households |
| Under 35 Years | 1,452 | 21.7% |
| 35 to 44 Years | 1,020 | 15.3% |
| 45 to 54 Years | 1,005 | 15.1% |
| 55 to 64 Years | 1,367 | 20.5% |
| 65 to 74 Years | 863 | 12.9% |
| 75 to 84 Years | 749 | 11.2% |
| 85 Years and Over | 219 | 3.3% |
| Total | 6,675 | 100.0% |
Housing Finances in Crawfordsville
Median Income by Occupancy in Crawfordsville
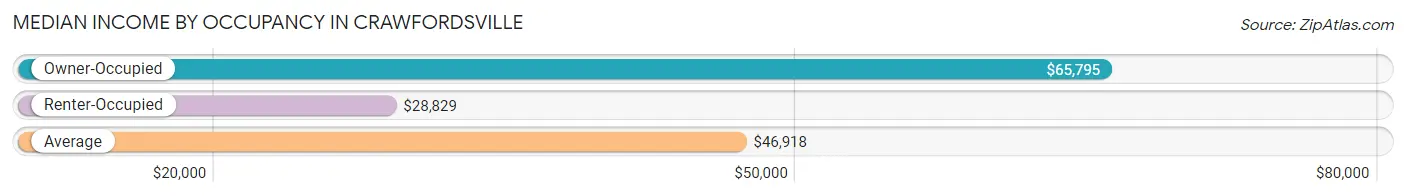
| Occupancy Type | # Households | Median Income |
| Owner-Occupied | 3,999 (59.9%) | $65,795 |
| Renter-Occupied | 2,676 (40.1%) | $28,829 |
| Average | 6,675 (100.0%) | $46,918 |
Occupancy by Householder Income Bracket in Crawfordsville
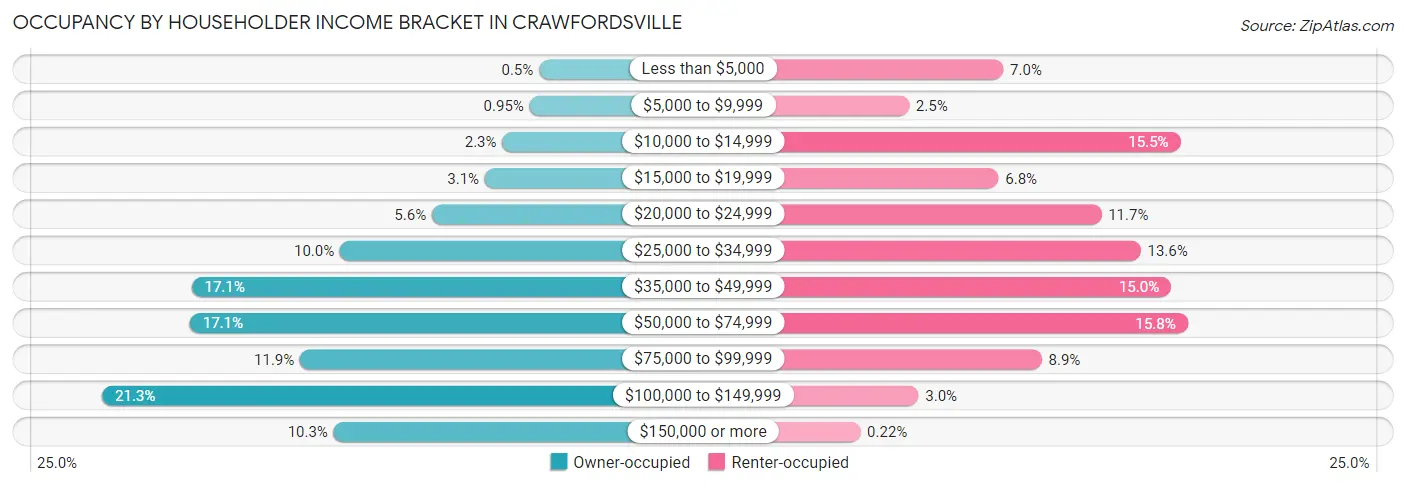
| Income Bracket | Owner-occupied | Renter-occupied |
| Less than $5,000 | 20 (0.5%) | 188 (7.0%) |
| $5,000 to $9,999 | 38 (0.9%) | 68 (2.5%) |
| $10,000 to $14,999 | 90 (2.2%) | 414 (15.5%) |
| $15,000 to $19,999 | 123 (3.1%) | 182 (6.8%) |
| $20,000 to $24,999 | 224 (5.6%) | 313 (11.7%) |
| $25,000 to $34,999 | 399 (10.0%) | 363 (13.6%) |
| $35,000 to $49,999 | 682 (17.1%) | 402 (15.0%) |
| $50,000 to $74,999 | 685 (17.1%) | 423 (15.8%) |
| $75,000 to $99,999 | 475 (11.9%) | 237 (8.9%) |
| $100,000 to $149,999 | 852 (21.3%) | 80 (3.0%) |
| $150,000 or more | 411 (10.3%) | 6 (0.2%) |
| Total | 3,999 (100.0%) | 2,676 (100.0%) |
Monthly Housing Cost Tiers in Crawfordsville
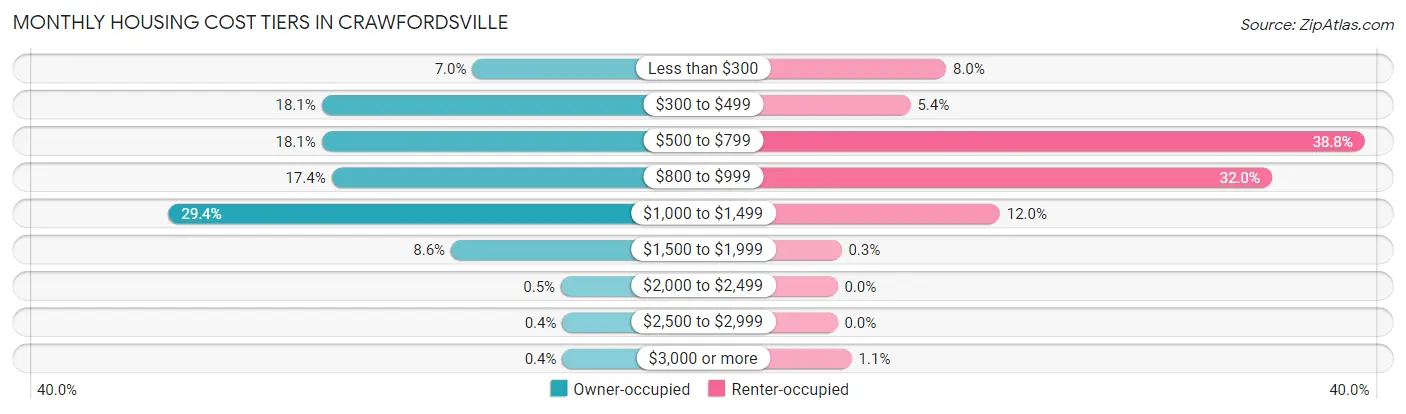
| Monthly Cost | Owner-occupied | Renter-occupied |
| Less than $300 | 281 (7.0%) | 214 (8.0%) |
| $300 to $499 | 725 (18.1%) | 144 (5.4%) |
| $500 to $799 | 725 (18.1%) | 1,039 (38.8%) |
| $800 to $999 | 696 (17.4%) | 856 (32.0%) |
| $1,000 to $1,499 | 1,176 (29.4%) | 320 (12.0%) |
| $1,500 to $1,999 | 344 (8.6%) | 8 (0.3%) |
| $2,000 to $2,499 | 20 (0.5%) | 0 (0.0%) |
| $2,500 to $2,999 | 16 (0.4%) | 0 (0.0%) |
| $3,000 or more | 16 (0.4%) | 28 (1.1%) |
| Total | 3,999 (100.0%) | 2,676 (100.0%) |
Physical Housing Characteristics in Crawfordsville
Housing Structures in Crawfordsville
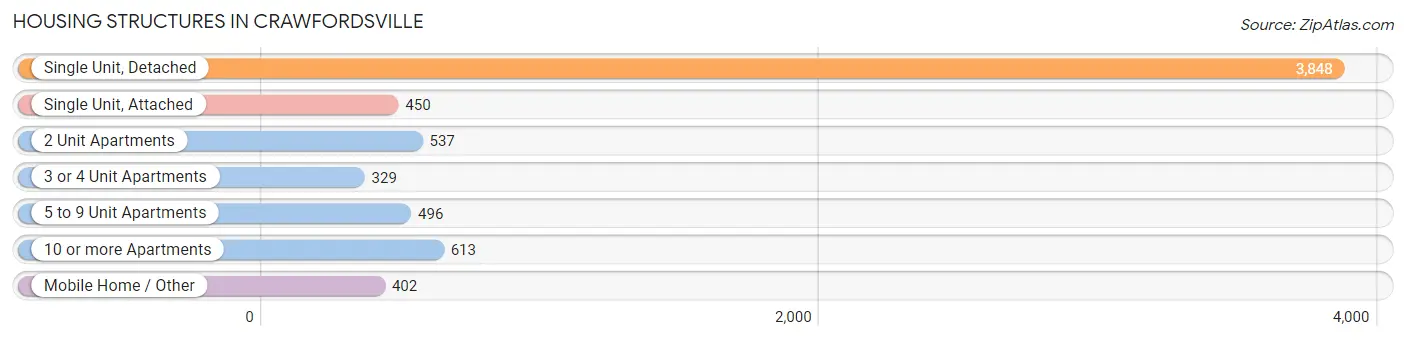
| Structure Type | # Housing Units | % Housing Units |
| Single Unit, Detached | 3,848 | 57.7% |
| Single Unit, Attached | 450 | 6.7% |
| 2 Unit Apartments | 537 | 8.0% |
| 3 or 4 Unit Apartments | 329 | 4.9% |
| 5 to 9 Unit Apartments | 496 | 7.4% |
| 10 or more Apartments | 613 | 9.2% |
| Mobile Home / Other | 402 | 6.0% |
| Total | 6,675 | 100.0% |
Housing Structures by Occupancy in Crawfordsville
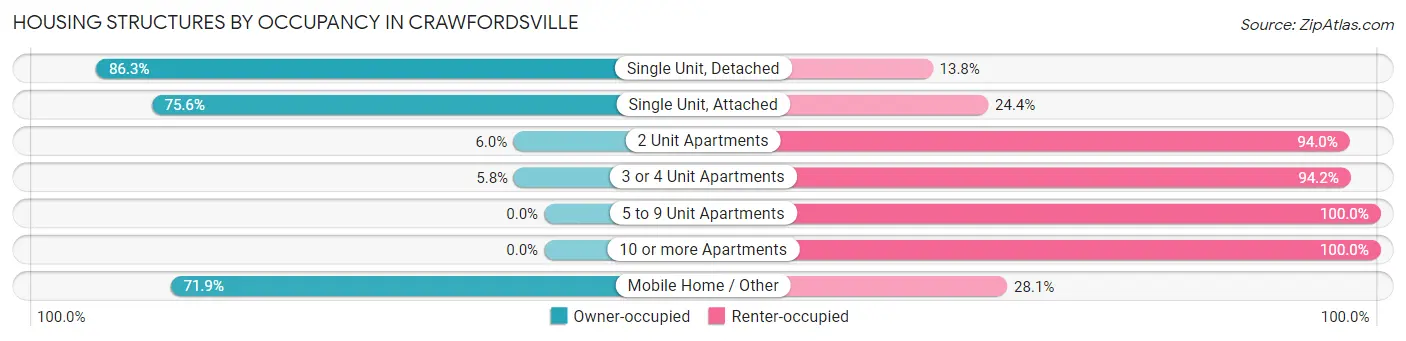
| Structure Type | Owner-occupied | Renter-occupied |
| Single Unit, Detached | 3,319 (86.3%) | 529 (13.8%) |
| Single Unit, Attached | 340 (75.6%) | 110 (24.4%) |
| 2 Unit Apartments | 32 (6.0%) | 505 (94.0%) |
| 3 or 4 Unit Apartments | 19 (5.8%) | 310 (94.2%) |
| 5 to 9 Unit Apartments | 0 (0.0%) | 496 (100.0%) |
| 10 or more Apartments | 0 (0.0%) | 613 (100.0%) |
| Mobile Home / Other | 289 (71.9%) | 113 (28.1%) |
| Total | 3,999 (59.9%) | 2,676 (40.1%) |
Housing Structures by Number of Rooms in Crawfordsville
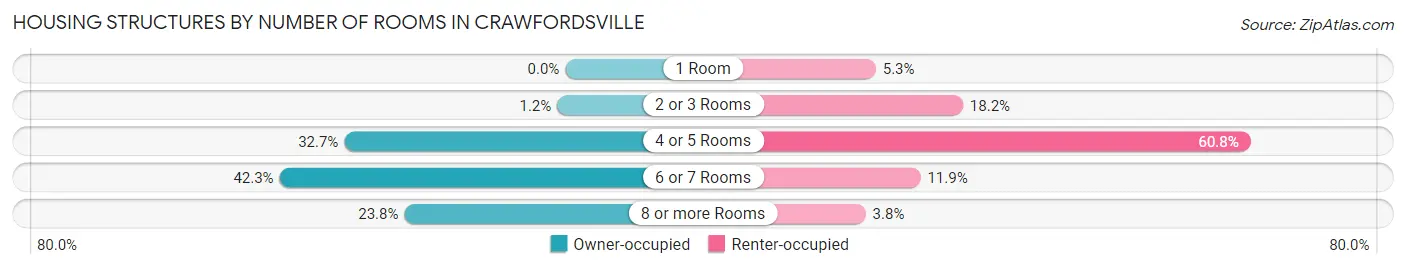
| Number of Rooms | Owner-occupied | Renter-occupied |
| 1 Room | 0 (0.0%) | 142 (5.3%) |
| 2 or 3 Rooms | 48 (1.2%) | 487 (18.2%) |
| 4 or 5 Rooms | 1,308 (32.7%) | 1,626 (60.8%) |
| 6 or 7 Rooms | 1,691 (42.3%) | 319 (11.9%) |
| 8 or more Rooms | 952 (23.8%) | 102 (3.8%) |
| Total | 3,999 (100.0%) | 2,676 (100.0%) |
Housing Structure by Heating Type in Crawfordsville
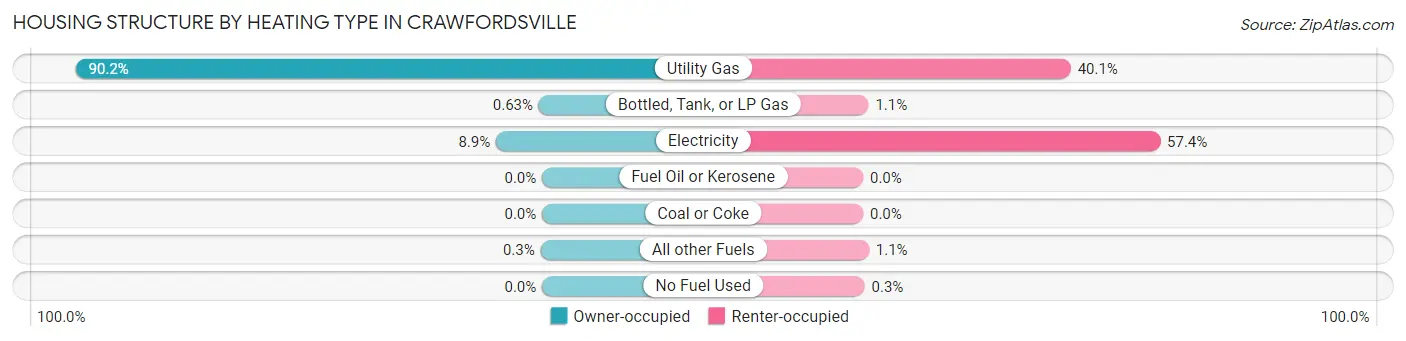
| Heating Type | Owner-occupied | Renter-occupied |
| Utility Gas | 3,606 (90.2%) | 1,074 (40.1%) |
| Bottled, Tank, or LP Gas | 25 (0.6%) | 28 (1.1%) |
| Electricity | 356 (8.9%) | 1,536 (57.4%) |
| Fuel Oil or Kerosene | 0 (0.0%) | 0 (0.0%) |
| Coal or Coke | 0 (0.0%) | 0 (0.0%) |
| All other Fuels | 12 (0.3%) | 30 (1.1%) |
| No Fuel Used | 0 (0.0%) | 8 (0.3%) |
| Total | 3,999 (100.0%) | 2,676 (100.0%) |
Household Vehicle Usage in Crawfordsville
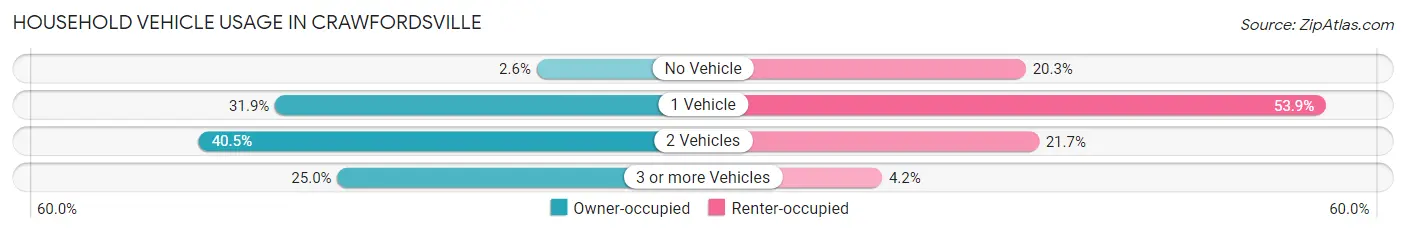
| Vehicles per Household | Owner-occupied | Renter-occupied |
| No Vehicle | 105 (2.6%) | 542 (20.3%) |
| 1 Vehicle | 1,277 (31.9%) | 1,442 (53.9%) |
| 2 Vehicles | 1,619 (40.5%) | 581 (21.7%) |
| 3 or more Vehicles | 998 (25.0%) | 111 (4.2%) |
| Total | 3,999 (100.0%) | 2,676 (100.0%) |
Real Estate & Mortgages in Crawfordsville
Real Estate and Mortgage Overview in Crawfordsville
| Characteristic | Without Mortgage | With Mortgage |
| Housing Units | 1,405 | 2,594 |
| Median Property Value | $112,100 | $136,600 |
| Median Household Income | $47,140 | $314 |
| Monthly Housing Costs | $414 | $10 |
| Real Estate Taxes | $1,071 | $14 |
Property Value by Mortgage Status in Crawfordsville
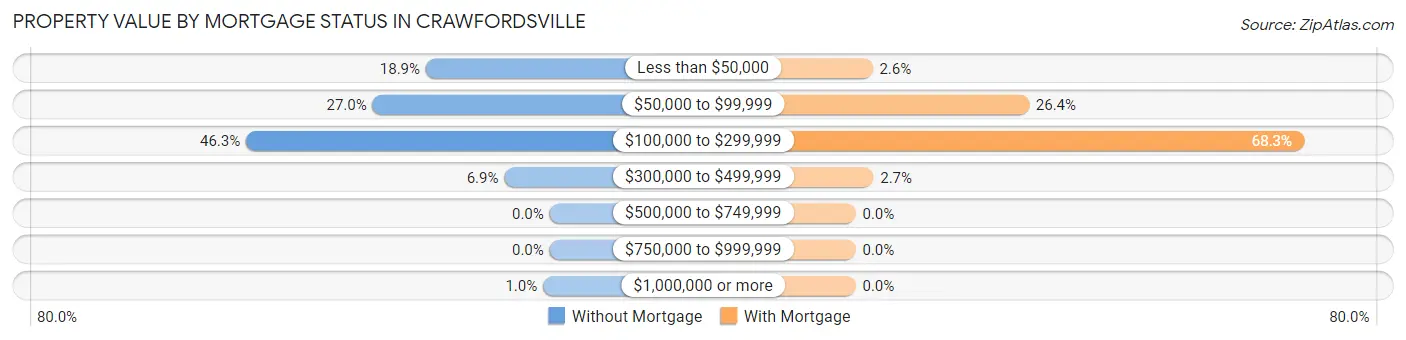
| Property Value | Without Mortgage | With Mortgage |
| Less than $50,000 | 265 (18.9%) | 67 (2.6%) |
| $50,000 to $99,999 | 379 (27.0%) | 685 (26.4%) |
| $100,000 to $299,999 | 650 (46.3%) | 1,772 (68.3%) |
| $300,000 to $499,999 | 97 (6.9%) | 70 (2.7%) |
| $500,000 to $749,999 | 0 (0.0%) | 0 (0.0%) |
| $750,000 to $999,999 | 0 (0.0%) | 0 (0.0%) |
| $1,000,000 or more | 14 (1.0%) | 0 (0.0%) |
| Total | 1,405 (100.0%) | 2,594 (100.0%) |
Household Income by Mortgage Status in Crawfordsville
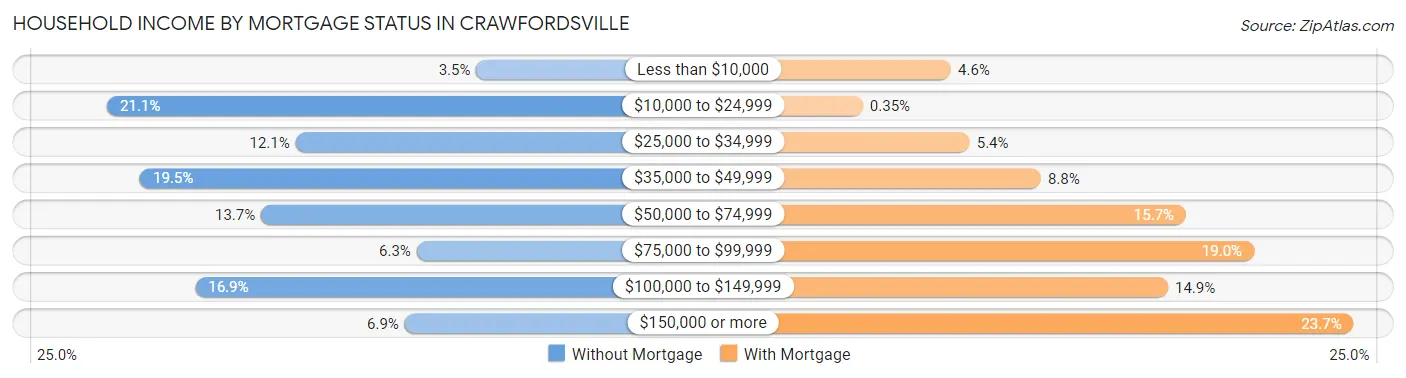
| Household Income | Without Mortgage | With Mortgage |
| Less than $10,000 | 49 (3.5%) | 118 (4.5%) |
| $10,000 to $24,999 | 296 (21.1%) | 9 (0.4%) |
| $25,000 to $34,999 | 170 (12.1%) | 141 (5.4%) |
| $35,000 to $49,999 | 274 (19.5%) | 229 (8.8%) |
| $50,000 to $74,999 | 193 (13.7%) | 408 (15.7%) |
| $75,000 to $99,999 | 89 (6.3%) | 492 (19.0%) |
| $100,000 to $149,999 | 237 (16.9%) | 386 (14.9%) |
| $150,000 or more | 97 (6.9%) | 615 (23.7%) |
| Total | 1,405 (100.0%) | 2,594 (100.0%) |
Property Value to Household Income Ratio in Crawfordsville
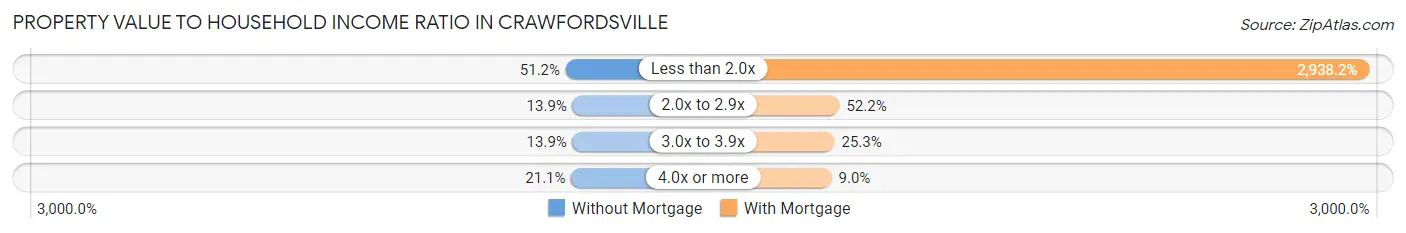
| Value-to-Income Ratio | Without Mortgage | With Mortgage |
| Less than 2.0x | 719 (51.2%) | 76,216 (2,938.2%) |
| 2.0x to 2.9x | 195 (13.9%) | 1,355 (52.2%) |
| 3.0x to 3.9x | 195 (13.9%) | 656 (25.3%) |
| 4.0x or more | 296 (21.1%) | 234 (9.0%) |
| Total | 1,405 (100.0%) | 2,594 (100.0%) |
Real Estate Taxes by Mortgage Status in Crawfordsville
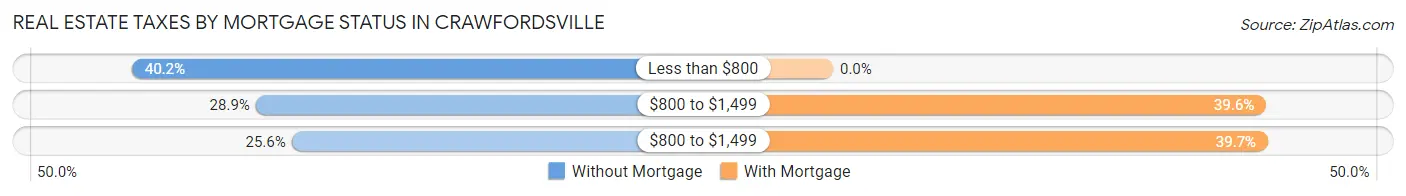
| Property Taxes | Without Mortgage | With Mortgage |
| Less than $800 | 565 (40.2%) | 0 (0.0%) |
| $800 to $1,499 | 406 (28.9%) | 1,026 (39.6%) |
| $800 to $1,499 | 360 (25.6%) | 1,030 (39.7%) |
| Total | 1,405 (100.0%) | 2,594 (100.0%) |
Health & Disability in Crawfordsville
Health Insurance Coverage by Age in Crawfordsville
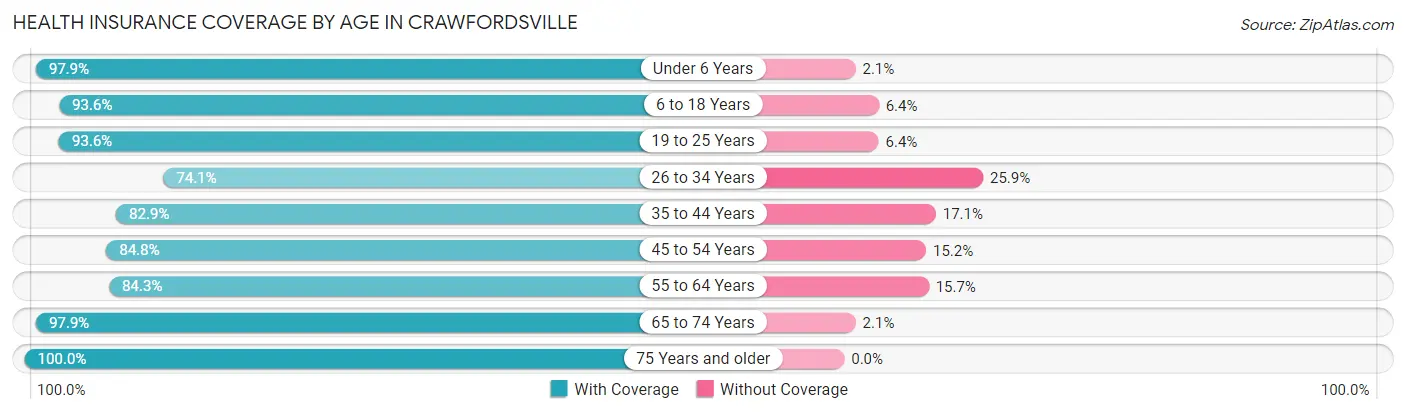
| Age Bracket | With Coverage | Without Coverage |
| Under 6 Years | 1,308 (97.9%) | 28 (2.1%) |
| 6 to 18 Years | 2,535 (93.6%) | 174 (6.4%) |
| 19 to 25 Years | 1,755 (93.6%) | 120 (6.4%) |
| 26 to 34 Years | 1,369 (74.1%) | 478 (25.9%) |
| 35 to 44 Years | 1,448 (82.9%) | 298 (17.1%) |
| 45 to 54 Years | 1,307 (84.8%) | 235 (15.2%) |
| 55 to 64 Years | 1,825 (84.3%) | 341 (15.7%) |
| 65 to 74 Years | 1,342 (97.9%) | 29 (2.1%) |
| 75 Years and older | 1,249 (100.0%) | 0 (0.0%) |
| Total | 14,138 (89.2%) | 1,703 (10.7%) |
Health Insurance Coverage by Citizenship Status in Crawfordsville
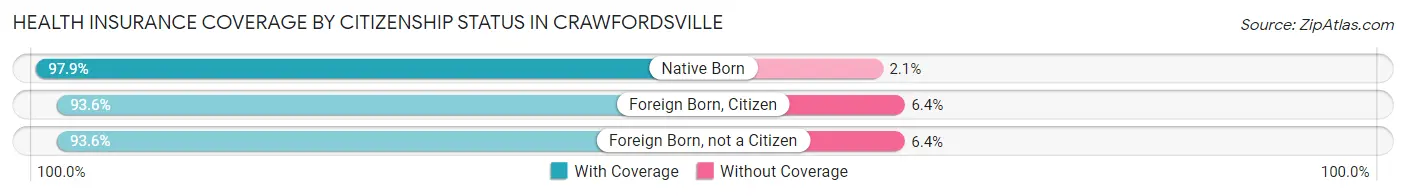
| Citizenship Status | With Coverage | Without Coverage |
| Native Born | 1,308 (97.9%) | 28 (2.1%) |
| Foreign Born, Citizen | 2,535 (93.6%) | 174 (6.4%) |
| Foreign Born, not a Citizen | 1,755 (93.6%) | 120 (6.4%) |
Health Insurance Coverage by Household Income in Crawfordsville
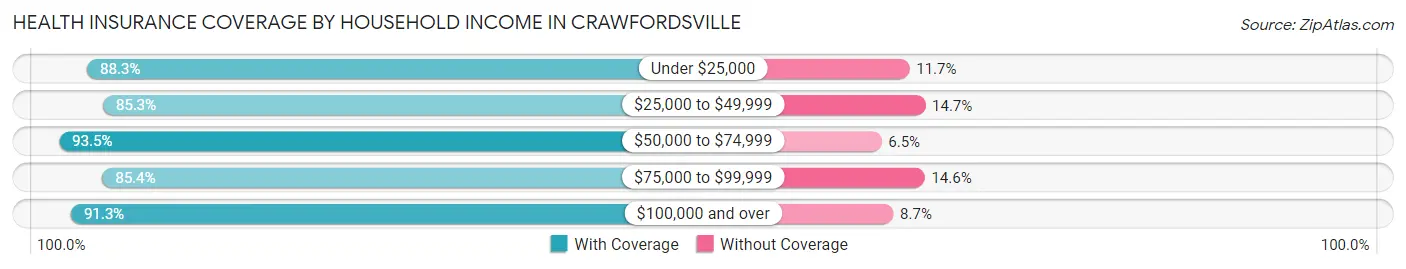
| Household Income | With Coverage | Without Coverage |
| Under $25,000 | 2,126 (88.3%) | 282 (11.7%) |
| $25,000 to $49,999 | 3,427 (85.3%) | 589 (14.7%) |
| $50,000 to $74,999 | 2,409 (93.5%) | 167 (6.5%) |
| $75,000 to $99,999 | 1,807 (85.4%) | 308 (14.6%) |
| $100,000 and over | 3,656 (91.3%) | 348 (8.7%) |
Public vs Private Health Insurance Coverage by Age in Crawfordsville
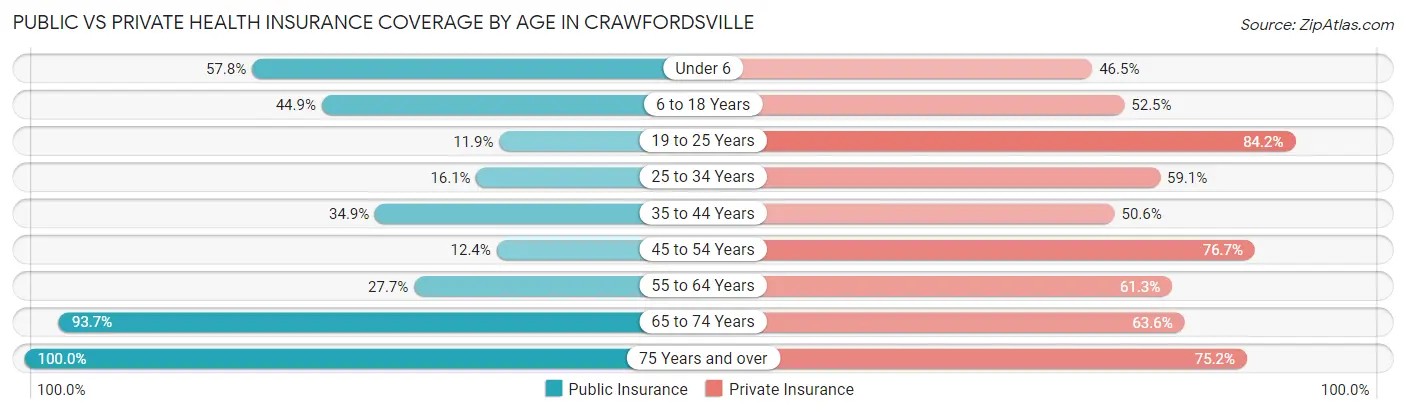
| Age Bracket | Public Insurance | Private Insurance |
| Under 6 | 772 (57.8%) | 621 (46.5%) |
| 6 to 18 Years | 1,215 (44.9%) | 1,421 (52.4%) |
| 19 to 25 Years | 223 (11.9%) | 1,578 (84.2%) |
| 25 to 34 Years | 298 (16.1%) | 1,091 (59.1%) |
| 35 to 44 Years | 610 (34.9%) | 884 (50.6%) |
| 45 to 54 Years | 191 (12.4%) | 1,182 (76.6%) |
| 55 to 64 Years | 600 (27.7%) | 1,328 (61.3%) |
| 65 to 74 Years | 1,284 (93.6%) | 872 (63.6%) |
| 75 Years and over | 1,249 (100.0%) | 939 (75.2%) |
| Total | 6,442 (40.7%) | 9,916 (62.6%) |
Disability Status by Sex by Age in Crawfordsville
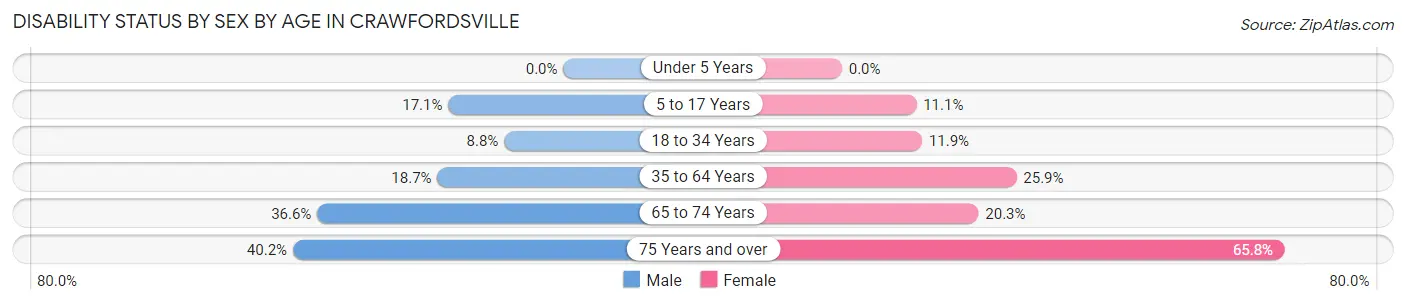
| Age Bracket | Male | Female |
| Under 5 Years | 0 (0.0%) | 0 (0.0%) |
| 5 to 17 Years | 223 (17.1%) | 151 (11.1%) |
| 18 to 34 Years | 199 (8.8%) | 212 (11.9%) |
| 35 to 64 Years | 543 (18.7%) | 661 (25.9%) |
| 65 to 74 Years | 265 (36.5%) | 131 (20.3%) |
| 75 Years and over | 147 (40.2%) | 581 (65.8%) |
Disability Class by Sex by Age in Crawfordsville
Disability Class: Hearing Difficulty
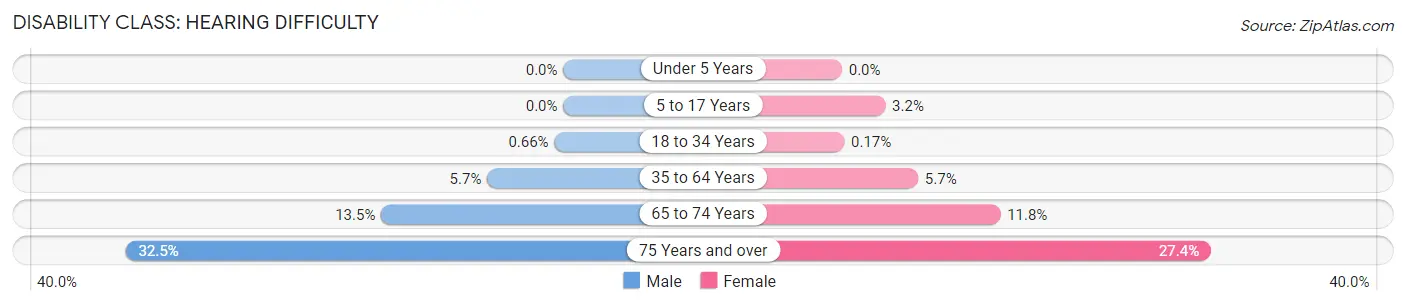
| Age Bracket | Male | Female |
| Under 5 Years | 0 (0.0%) | 0 (0.0%) |
| 5 to 17 Years | 0 (0.0%) | 44 (3.2%) |
| 18 to 34 Years | 15 (0.7%) | 3 (0.2%) |
| 35 to 64 Years | 164 (5.7%) | 144 (5.7%) |
| 65 to 74 Years | 98 (13.5%) | 76 (11.8%) |
| 75 Years and over | 119 (32.5%) | 242 (27.4%) |
Disability Class: Vision Difficulty
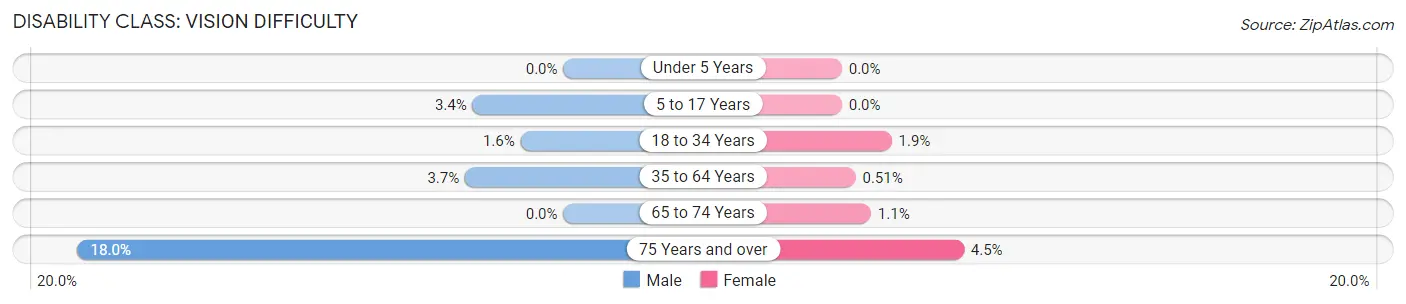
| Age Bracket | Male | Female |
| Under 5 Years | 0 (0.0%) | 0 (0.0%) |
| 5 to 17 Years | 44 (3.4%) | 0 (0.0%) |
| 18 to 34 Years | 36 (1.6%) | 33 (1.8%) |
| 35 to 64 Years | 106 (3.6%) | 13 (0.5%) |
| 65 to 74 Years | 0 (0.0%) | 7 (1.1%) |
| 75 Years and over | 66 (18.0%) | 40 (4.5%) |
Disability Class: Cognitive Difficulty
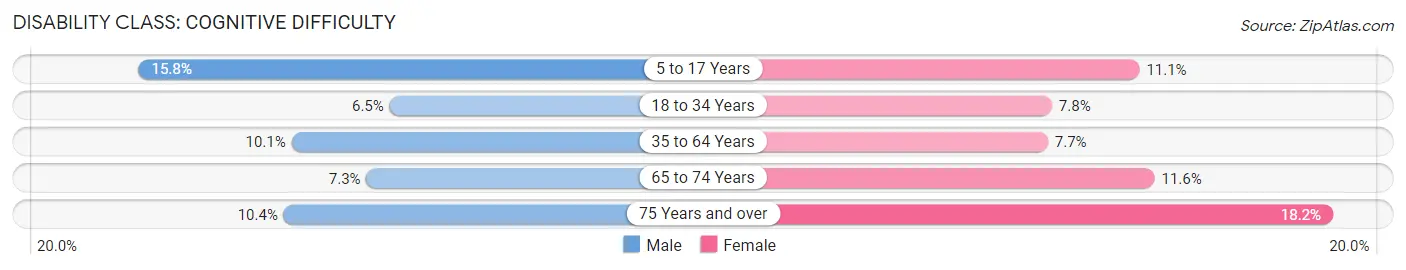
| Age Bracket | Male | Female |
| 5 to 17 Years | 206 (15.8%) | 151 (11.1%) |
| 18 to 34 Years | 146 (6.5%) | 139 (7.8%) |
| 35 to 64 Years | 293 (10.1%) | 195 (7.6%) |
| 65 to 74 Years | 53 (7.3%) | 75 (11.6%) |
| 75 Years and over | 38 (10.4%) | 161 (18.2%) |
Disability Class: Ambulatory Difficulty
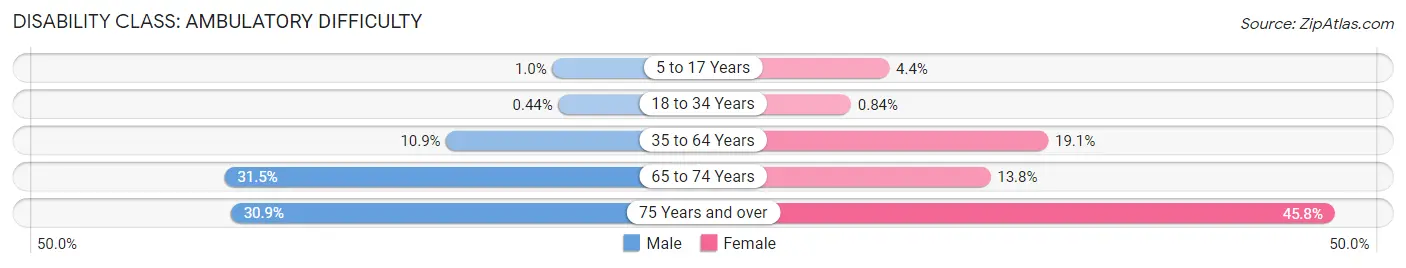
| Age Bracket | Male | Female |
| 5 to 17 Years | 13 (1.0%) | 60 (4.4%) |
| 18 to 34 Years | 10 (0.4%) | 15 (0.8%) |
| 35 to 64 Years | 315 (10.8%) | 488 (19.1%) |
| 65 to 74 Years | 228 (31.5%) | 89 (13.8%) |
| 75 Years and over | 113 (30.9%) | 404 (45.8%) |
Disability Class: Self-Care Difficulty
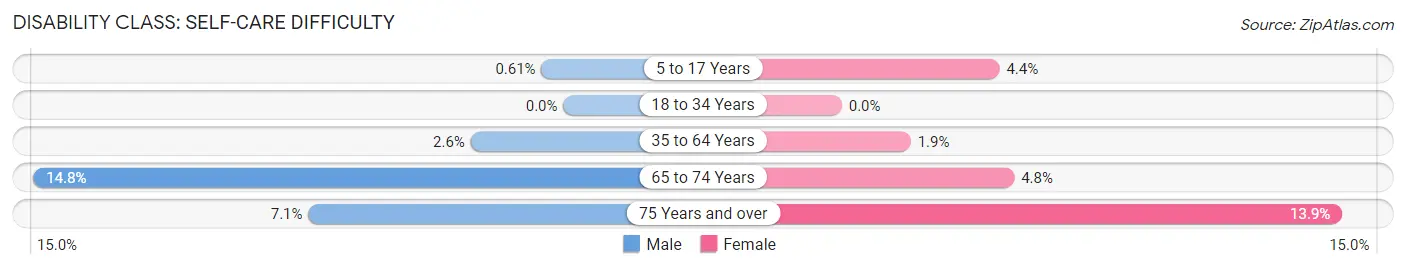
| Age Bracket | Male | Female |
| 5 to 17 Years | 8 (0.6%) | 60 (4.4%) |
| 18 to 34 Years | 0 (0.0%) | 0 (0.0%) |
| 35 to 64 Years | 75 (2.6%) | 49 (1.9%) |
| 65 to 74 Years | 107 (14.8%) | 31 (4.8%) |
| 75 Years and over | 26 (7.1%) | 123 (13.9%) |
Technology Access in Crawfordsville
Computing Device Access in Crawfordsville
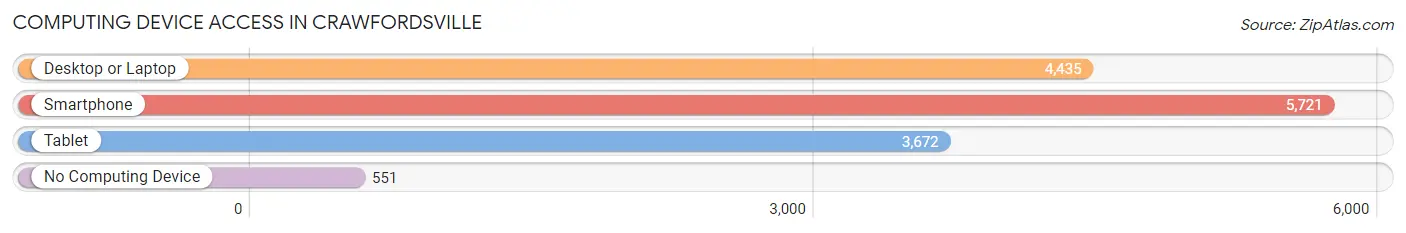
| Device Type | # Households | % Households |
| Desktop or Laptop | 4,435 | 66.4% |
| Smartphone | 5,721 | 85.7% |
| Tablet | 3,672 | 55.0% |
| No Computing Device | 551 | 8.3% |
| Total | 6,675 | 100.0% |
Internet Access in Crawfordsville
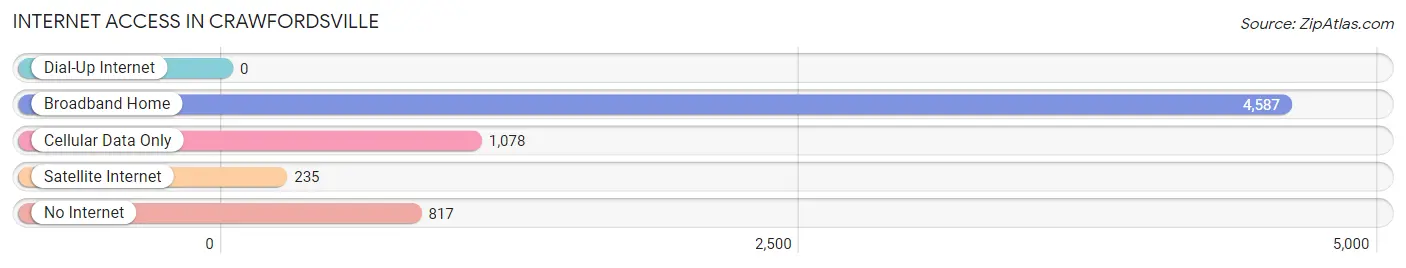
| Internet Type | # Households | % Households |
| Dial-Up Internet | 0 | 0.0% |
| Broadband Home | 4,587 | 68.7% |
| Cellular Data Only | 1,078 | 16.2% |
| Satellite Internet | 235 | 3.5% |
| No Internet | 817 | 12.2% |
| Total | 6,675 | 100.0% |
Crawfordsville Summary
Crawfordsville is a city located in Montgomery County, Indiana, United States. The population was 15,915 at the 2010 census. It is the county seat of Montgomery County. The city is home to Wabash College, which was ranked by Forbes as #12 in the United States for undergraduate studies in 2008.
History
Crawfordsville was founded in 1823 by William and Jennie Crawford. The city was named after William Crawford, a Revolutionary War veteran and local landowner. The Crawfordsville post office was established in 1824.
In 1832, Wabash College was founded in Crawfordsville, making it the oldest college in Indiana. The college's first building was the Wabash Building, which is now a National Historic Landmark.
In 1851, the Crawfordsville and Indianapolis Railroad was built, connecting Crawfordsville to Indianapolis. This allowed for the growth of the city and the development of industry.
In 1866 the first public library in Indiana was established in Crawfordsville
In 1877, the Crawfordsville Commercial Club was founded, which was the first chamber of commerce in Indiana.
In 1883, the Crawfordsville Electric Light and Power Company was established, making Crawfordsville the first city in Indiana to have electric lights.
In 1887, the Crawfordsville Water Works was established, providing the city with a reliable source of water.
In 1895, the Crawfordsville Public Library was established, making it the first public library in Indiana.
In 1898, the Crawfordsville Telephone Company was established, providing the city with telephone service.
In 1901, the Crawfordsville Fire Department was established, providing the city with fire protection.
In 1902 the Crawfordsville Gas Company was established providing the city with natural gas
In 1903 the Crawfordsville Electric Company was established providing the city with electricity
In 1904, the Crawfordsville Sanitary Sewer System was established, providing the city with a reliable source of sewage disposal.
In 1906, the Crawfordsville Street Railway Company was established, providing the city with public transportation.
In 1908, the Crawfordsville Public School System was established, providing the city with public education.
In 1910, the Crawfordsville Public Library was expanded, making it the largest public library in Indiana.
In 1911, the Crawfordsville Public Park System was established, providing the city with public parks and recreation.
In 1912, the Crawfordsville Public Library was expanded again, making it the largest public library in the state.
In 1913, the Crawfordsville Public Library was expanded yet again, making it the largest public library in the Midwest.
In 1914, the Crawfordsville Public Library was expanded yet again, making it the largest public library in the United States.
Geography
Crawfordsville is located at 39°59′N 86°53′W (39.983, -86.878). According to the 2010 census, Crawfordsville has a total area of 8.9 square miles (23.1 km2), of which 8.8 square miles (22.8 km2) is land and 0.1 square miles (0.3 km2) is water.
Economy
Crawfordsville is home to a variety of businesses and industries. The city is home to several manufacturing companies, including Wabash National Corporation, which produces semi-trailers and truck bodies, and the Crawfordsville Foundry, which produces castings for the automotive and agricultural industries. The city is also home to several retail stores, including Walmart, Kroger, and Meijer.
Demographics
As of the 2010 census, there were 15,915 people, 6,541 households, and 3,845 families residing in the city. The population density was 1,811.3 people per square mile (699.7/km2). There were 7,093 housing units at an average density of 803.3 per square mile (310.2/km2). The racial makeup of the city was 92.2% White, 4.2% African American, 0.3% Native American, 0.7% Asian, 0.7% from other races, and 1.9% from two or more races. Hispanic or Latino of any race were 2.2% of the population.
There were 6,541 households, out of which 25.2% had children under the age of 18 living with them, 43.2% were married couples living together, 12.2% had a female householder with no husband present, and 40.3% were non-families. 33.7% of all households were made up of individuals, and 14.2% had someone living alone who was 65 years of age or older. The average household size was 2.27 and the average family size was 2.90.
In the city, the population was spread out, with 21.2% under the age of 18, 15.7% from 18 to 24, 24.2% from 25 to 44, 22.2% from 45 to 64, and 16.7% who were 65 years of age or older. The median age was 36 years. For every 100 females, there were 87.7 males. For every 100 females age 18 and over, there were 84.2 males.
The median income for a household in the city was $35,945, and the median income for a family was $45,945. Males had a median income of $31,945 versus $22,945 for females. The per capita income for the city was $18,945. About 8.2% of families and 11.2% of the population were below the poverty line, including 15.2% of those under age 18 and 8.2% of those age 65 or over.
Common Questions
What is Per Capita Income in Crawfordsville?
Per Capita income in Crawfordsville is $27,024.
What is the Median Family Income in Crawfordsville?
Median Family Income in Crawfordsville is $65,486.
What is the Median Household income in Crawfordsville?
Median Household Income in Crawfordsville is $46,918.
What is Income or Wage Gap in Crawfordsville?
Income or Wage Gap in Crawfordsville is 17.8%.
Women in Crawfordsville earn 82.2 cents for every dollar earned by a man.
What is Family Income Deficit in Crawfordsville?
Family Income Deficit in Crawfordsville is $9,910.
Families that are below poverty line in Crawfordsville earn $9,910 less on average than the poverty threshold level.
What is Inequality or Gini Index in Crawfordsville?
Inequality or Gini Index in Crawfordsville is 0.45.
What is the Total Population of Crawfordsville?
Total Population of Crawfordsville is 16,335.
What is the Total Male Population of Crawfordsville?
Total Male Population of Crawfordsville is 8,314.
What is the Total Female Population of Crawfordsville?
Total Female Population of Crawfordsville is 8,021.
What is the Ratio of Males per 100 Females in Crawfordsville?
There are 103.65 Males per 100 Females in Crawfordsville.
What is the Ratio of Females per 100 Males in Crawfordsville?
There are 96.48 Females per 100 Males in Crawfordsville.
What is the Median Population Age in Crawfordsville?
Median Population Age in Crawfordsville is 36.7 Years.
What is the Average Family Size in Crawfordsville
Average Family Size in Crawfordsville is 3.0 People.
What is the Average Household Size in Crawfordsville
Average Household Size in Crawfordsville is 2.3 People.
How Large is the Labor Force in Crawfordsville?
There are 8,167 People in the Labor Forcein in Crawfordsville.
What is the Percentage of People in the Labor Force in Crawfordsville?
62.2% of People are in the Labor Force in Crawfordsville.
What is the Unemployment Rate in Crawfordsville?
Unemployment Rate in Crawfordsville is 5.3%.