Converse, IN Map & Demographics
Converse Map
Converse Overview
$26,901
PER CAPITA INCOME
$57,274
AVG FAMILY INCOME
$54,479
AVG HOUSEHOLD INCOME
26.5%
WAGE / INCOME GAP [ % ]
73.5¢/ $1
WAGE / INCOME GAP [ $ ]
0.41
INEQUALITY / GINI INDEX
967
TOTAL POPULATION
485
MALE POPULATION
482
FEMALE POPULATION
100.62
MALES / 100 FEMALES
99.38
FEMALES / 100 MALES
35.3
MEDIAN AGE
2.5
AVG FAMILY SIZE
2.1
AVG HOUSEHOLD SIZE
443
LABOR FORCE [ PEOPLE ]
55.8%
PERCENT IN LABOR FORCE
0.9%
UNEMPLOYMENT RATE
Converse Zip Codes
Converse Area Codes
Income in Converse
Income Overview in Converse
Per Capita Income in Converse is $26,901, while median incomes of families and households are $57,274 and $54,479 respectively.
| Characteristic | Number | Measure |
| Per Capita Income | 967 | $26,901 |
| Median Family Income | 287 | $57,274 |
| Mean Family Income | 287 | $73,990 |
| Median Household Income | 453 | $54,479 |
| Mean Household Income | 453 | $62,244 |
| Income Deficit | 287 | $0 |
| Wage / Income Gap (%) | 967 | 26.51% |
| Wage / Income Gap ($) | 967 | 73.49¢ per $1 |
| Gini / Inequality Index | 967 | 0.41 |
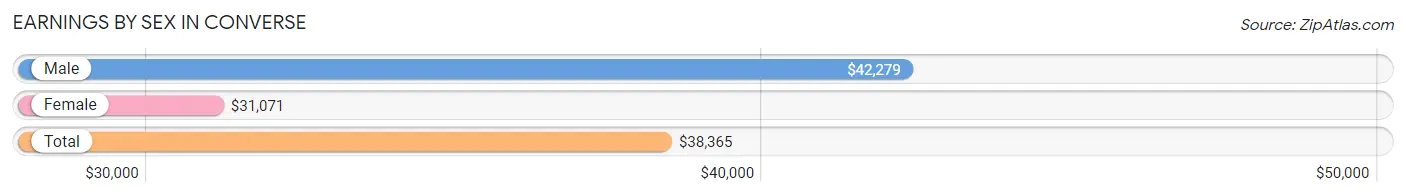
Earnings by Sex in Converse
Average Earnings in Converse are $38,365, $42,279 for men and $31,071 for women, a difference of 26.5%.
| Sex | Number | Average Earnings |
| Male | 285 (58.8%) | $42,279 |
| Female | 200 (41.2%) | $31,071 |
| Total | 485 (100.0%) | $38,365 |
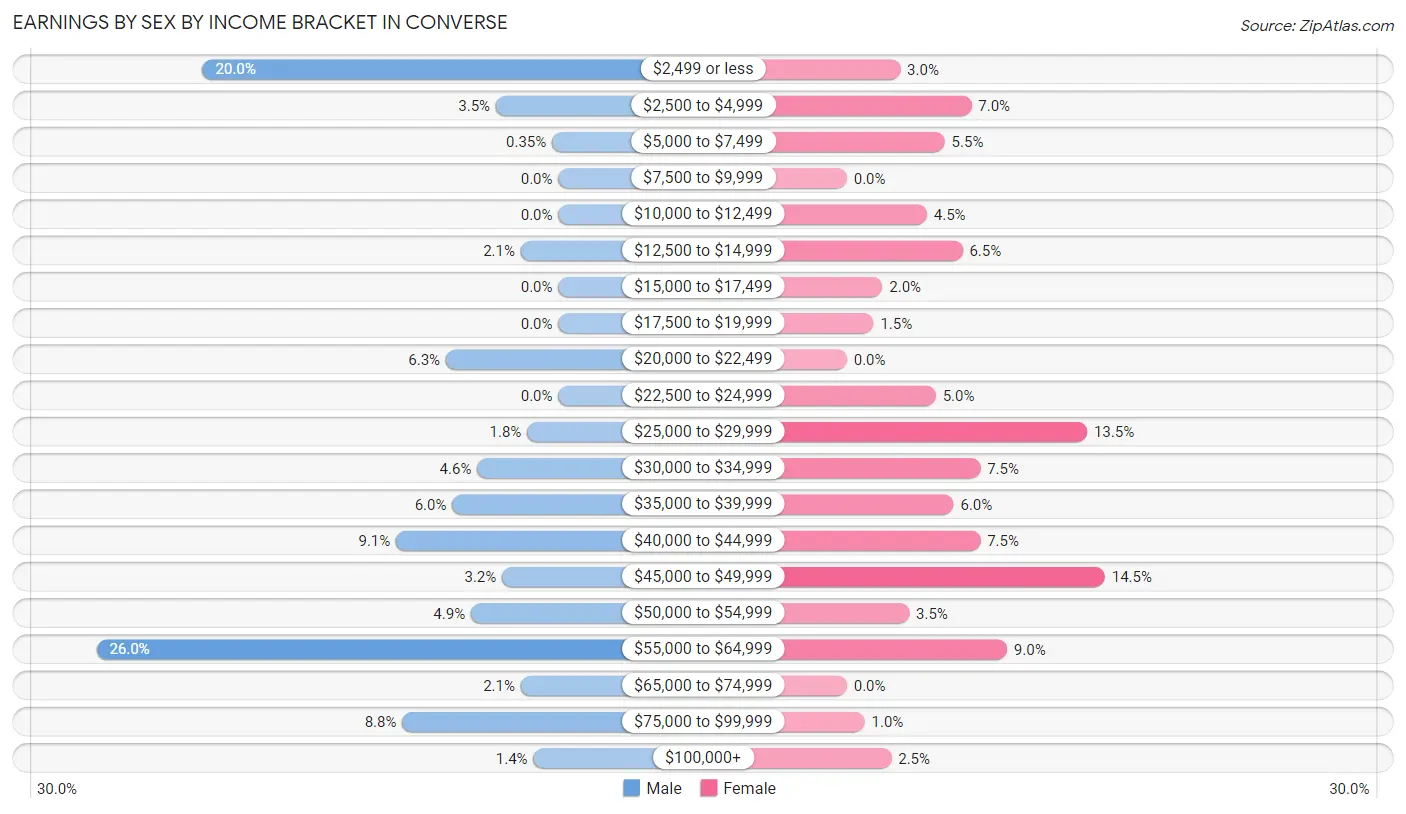
Earnings by Sex by Income Bracket in Converse
The most common earnings brackets in Converse are $55,000 to $64,999 for men (74 | 26.0%) and $45,000 to $49,999 for women (29 | 14.5%).
| Income | Male | Female |
| $2,499 or less | 57 (20.0%) | 6 (3.0%) |
| $2,500 to $4,999 | 10 (3.5%) | 14 (7.0%) |
| $5,000 to $7,499 | 1 (0.4%) | 11 (5.5%) |
| $7,500 to $9,999 | 0 (0.0%) | 0 (0.0%) |
| $10,000 to $12,499 | 0 (0.0%) | 9 (4.5%) |
| $12,500 to $14,999 | 6 (2.1%) | 13 (6.5%) |
| $15,000 to $17,499 | 0 (0.0%) | 4 (2.0%) |
| $17,500 to $19,999 | 0 (0.0%) | 3 (1.5%) |
| $20,000 to $22,499 | 18 (6.3%) | 0 (0.0%) |
| $22,500 to $24,999 | 0 (0.0%) | 10 (5.0%) |
| $25,000 to $29,999 | 5 (1.8%) | 27 (13.5%) |
| $30,000 to $34,999 | 13 (4.6%) | 15 (7.5%) |
| $35,000 to $39,999 | 17 (6.0%) | 12 (6.0%) |
| $40,000 to $44,999 | 26 (9.1%) | 15 (7.5%) |
| $45,000 to $49,999 | 9 (3.2%) | 29 (14.5%) |
| $50,000 to $54,999 | 14 (4.9%) | 7 (3.5%) |
| $55,000 to $64,999 | 74 (26.0%) | 18 (9.0%) |
| $65,000 to $74,999 | 6 (2.1%) | 0 (0.0%) |
| $75,000 to $99,999 | 25 (8.8%) | 2 (1.0%) |
| $100,000+ | 4 (1.4%) | 5 (2.5%) |
| Total | 285 (100.0%) | 200 (100.0%) |
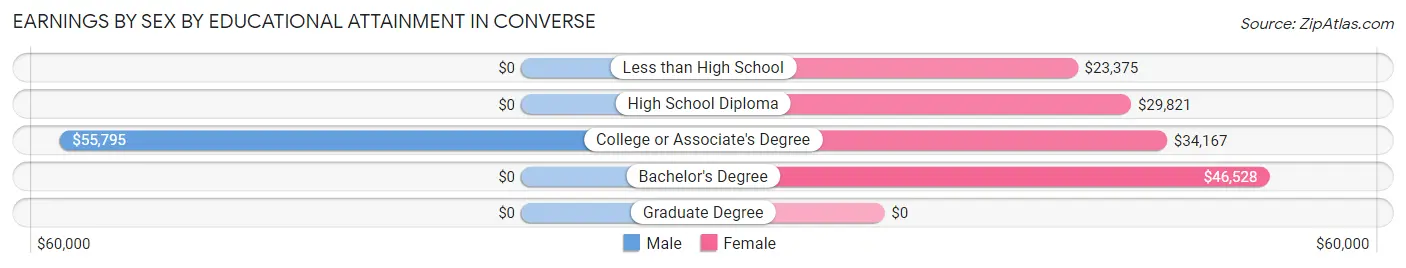
Earnings by Sex by Educational Attainment in Converse
Average earnings in Converse are $51,750 for men and $35,000 for women, a difference of 32.4%. Men with an educational attainment of college or associate's degree enjoy the highest average annual earnings of $55,795, while those with college or associate's degree education earn the least with $55,795. Women with an educational attainment of bachelor's degree earn the most with the average annual earnings of $46,528, while those with less than high school education have the smallest earnings of $23,375.
| Educational Attainment | Male Income | Female Income |
| Less than High School | - | - |
| High School Diploma | - | - |
| College or Associate's Degree | $55,795 | $34,167 |
| Bachelor's Degree | - | - |
| Graduate Degree | - | - |
| Total | $51,750 | $35,000 |
Family Income in Converse
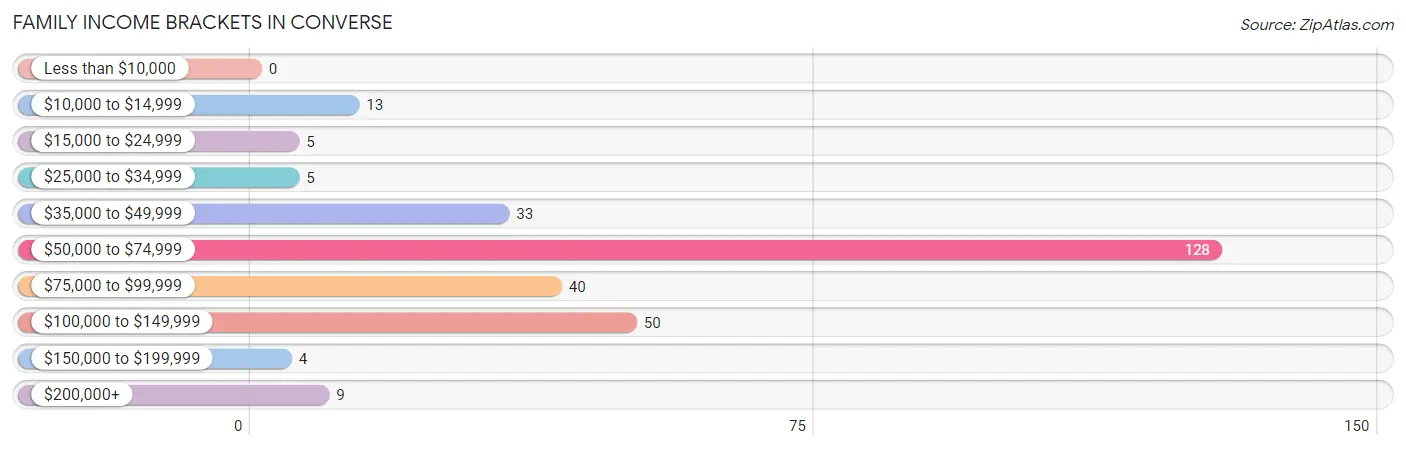
Family Income Brackets in Converse
According to the Converse family income data, there are 128 families falling into the $50,000 to $74,999 income range, which is the most common income bracket and makes up 44.6% of all families.
| Income Bracket | # Families | % Families |
| Less than $10,000 | 0 | 0.0% |
| $10,000 to $14,999 | 13 | 4.5% |
| $15,000 to $24,999 | 5 | 1.7% |
| $25,000 to $34,999 | 5 | 1.7% |
| $35,000 to $49,999 | 33 | 11.5% |
| $50,000 to $74,999 | 128 | 44.6% |
| $75,000 to $99,999 | 40 | 13.9% |
| $100,000 to $149,999 | 50 | 17.4% |
| $150,000 to $199,999 | 4 | 1.4% |
| $200,000+ | 9 | 3.1% |
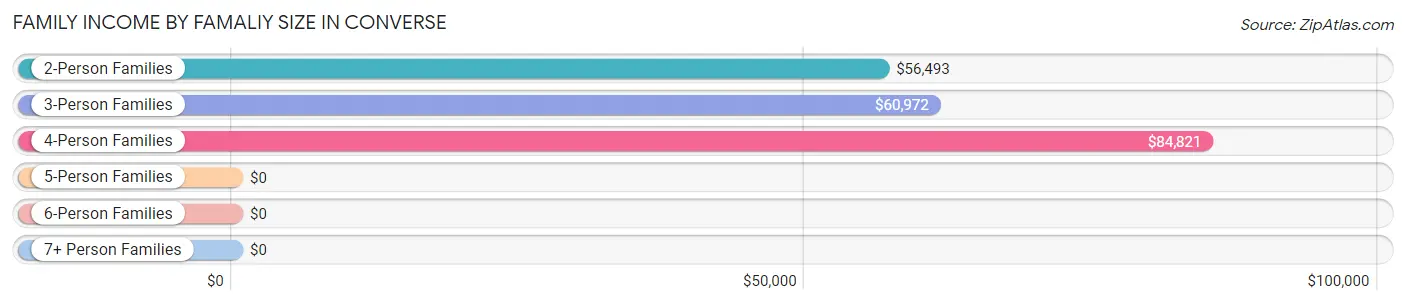
Family Income by Famaliy Size in Converse
4-person families (51 | 17.8%) account for the highest median family income in Converse with $84,821 per family, while 2-person families (166 | 57.8%) have the highest median income of $28,246 per family member.
| Income Bracket | # Families | Median Income |
| 2-Person Families | 166 (57.8%) | $56,493 |
| 3-Person Families | 57 (19.9%) | $60,972 |
| 4-Person Families | 51 (17.8%) | $84,821 |
| 5-Person Families | 4 (1.4%) | $0 |
| 6-Person Families | 9 (3.1%) | $0 |
| 7+ Person Families | 0 (0.0%) | $0 |
| Total | 287 (100.0%) | $57,274 |
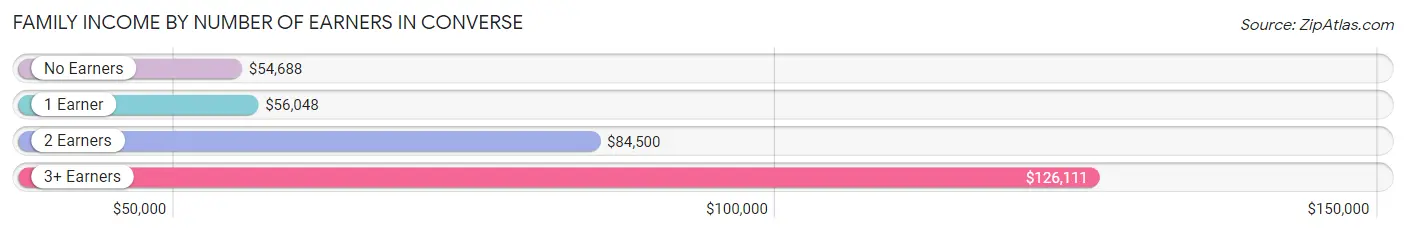
Family Income by Number of Earners in Converse
The median family income in Converse is $57,274, with families comprising 3+ earners (18) having the highest median family income of $126,111, while families with no earners (55) have the lowest median family income of $54,688, accounting for 6.3% and 19.2% of families, respectively.
| Number of Earners | # Families | Median Income |
| No Earners | 55 (19.2%) | $54,688 |
| 1 Earner | 124 (43.2%) | $56,048 |
| 2 Earners | 90 (31.4%) | $84,500 |
| 3+ Earners | 18 (6.3%) | $126,111 |
| Total | 287 (100.0%) | $57,274 |
Household Income in Converse
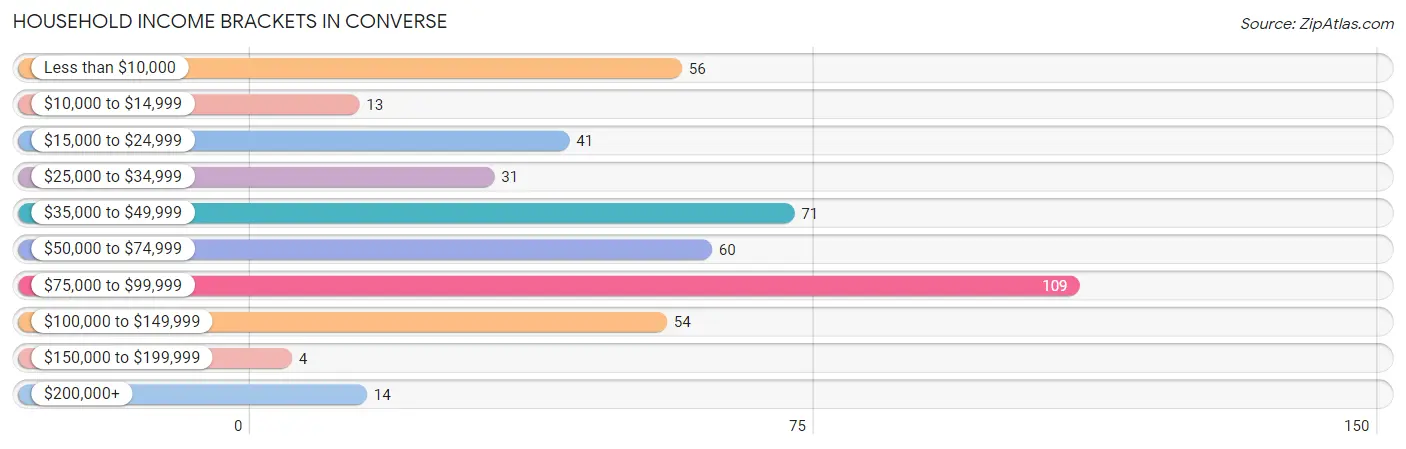
Household Income Brackets in Converse
With 109 households falling in the category, the $75,000 to $99,999 income range is the most frequent in Converse, accounting for 24.1% of all households. In contrast, only 4 households (0.9%) fall into the $150,000 to $199,999 income bracket, making it the least populous group.
| Income Bracket | # Households | % Households |
| Less than $10,000 | 56 | 12.4% |
| $10,000 to $14,999 | 13 | 2.9% |
| $15,000 to $24,999 | 41 | 9.1% |
| $25,000 to $34,999 | 31 | 6.8% |
| $35,000 to $49,999 | 71 | 15.7% |
| $50,000 to $74,999 | 60 | 13.2% |
| $75,000 to $99,999 | 109 | 24.1% |
| $100,000 to $149,999 | 54 | 11.9% |
| $150,000 to $199,999 | 4 | 0.9% |
| $200,000+ | 14 | 3.1% |
Household Income by Householder Age in Converse
The median household income in Converse is $54,479, with the highest median household income of $92,083 found in the 45 to 64 years age bracket for the primary householder. A total of 78 households (17.2%) fall into this category. Meanwhile, the 15 to 24 years age bracket for the primary householder has the lowest median household income of $30,125, with 33 households (7.3%) in this group.
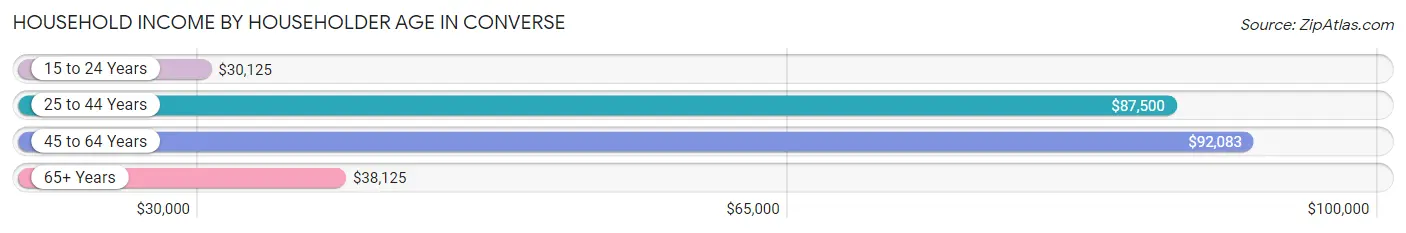
| Income Bracket | # Households | Median Income |
| 15 to 24 Years | 33 (7.3%) | $30,125 |
| 25 to 44 Years | 174 (38.4%) | $87,500 |
| 45 to 64 Years | 78 (17.2%) | $92,083 |
| 65+ Years | 168 (37.1%) | $38,125 |
| Total | 453 (100.0%) | $54,479 |
Poverty in Converse
Income Below Poverty by Sex and Age in Converse
With 15.0% poverty level for males and 18.3% for females among the residents of Converse, 16 and 17 year old males and 15 year old females are the most vulnerable to poverty, with 13 males (68.4%) and 19 females (100.0%) in their respective age groups living below the poverty level.
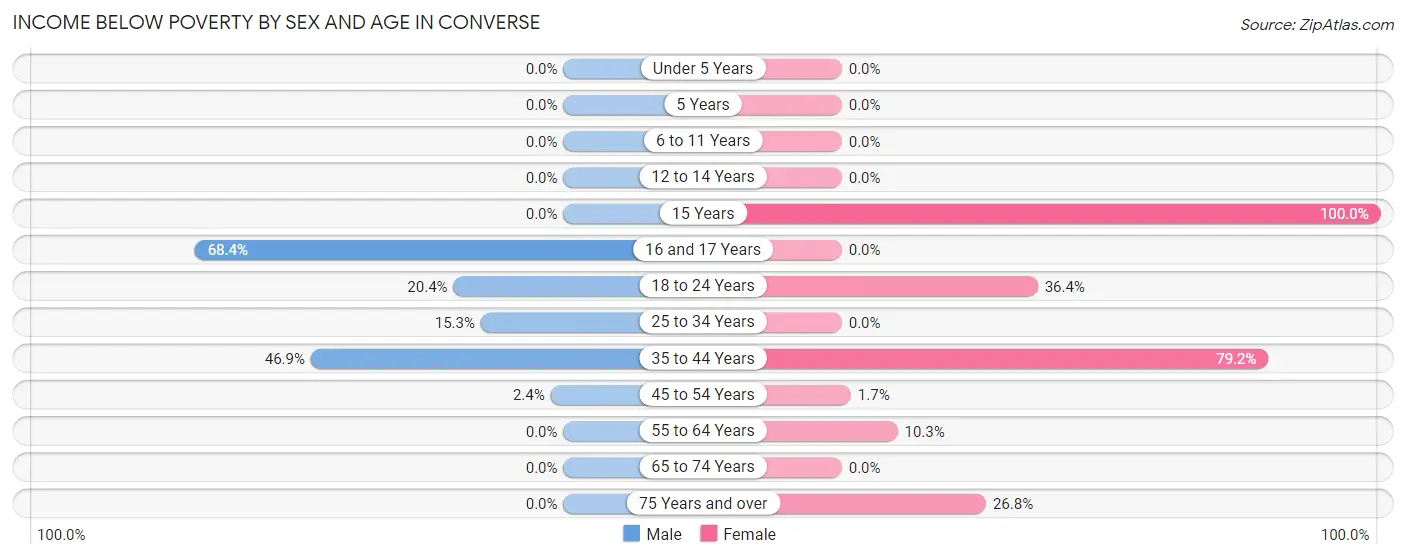
| Age Bracket | Male | Female |
| Under 5 Years | 0 (0.0%) | 0 (0.0%) |
| 5 Years | 0 (0.0%) | 0 (0.0%) |
| 6 to 11 Years | 0 (0.0%) | 0 (0.0%) |
| 12 to 14 Years | 0 (0.0%) | 0 (0.0%) |
| 15 Years | 0 (0.0%) | 19 (100.0%) |
| 16 and 17 Years | 13 (68.4%) | 0 (0.0%) |
| 18 to 24 Years | 10 (20.4%) | 8 (36.4%) |
| 25 to 34 Years | 19 (15.3%) | 0 (0.0%) |
| 35 to 44 Years | 30 (46.9%) | 38 (79.2%) |
| 45 to 54 Years | 1 (2.4%) | 1 (1.7%) |
| 55 to 64 Years | 0 (0.0%) | 3 (10.3%) |
| 65 to 74 Years | 0 (0.0%) | 0 (0.0%) |
| 75 Years and over | 0 (0.0%) | 19 (26.8%) |
| Total | 73 (15.0%) | 88 (18.3%) |
Income Above Poverty by Sex and Age in Converse
According to the poverty statistics in Converse, males aged under 5 years and females aged under 5 years are the age groups that are most secure financially, with 100.0% of males and 100.0% of females in these age groups living above the poverty line.
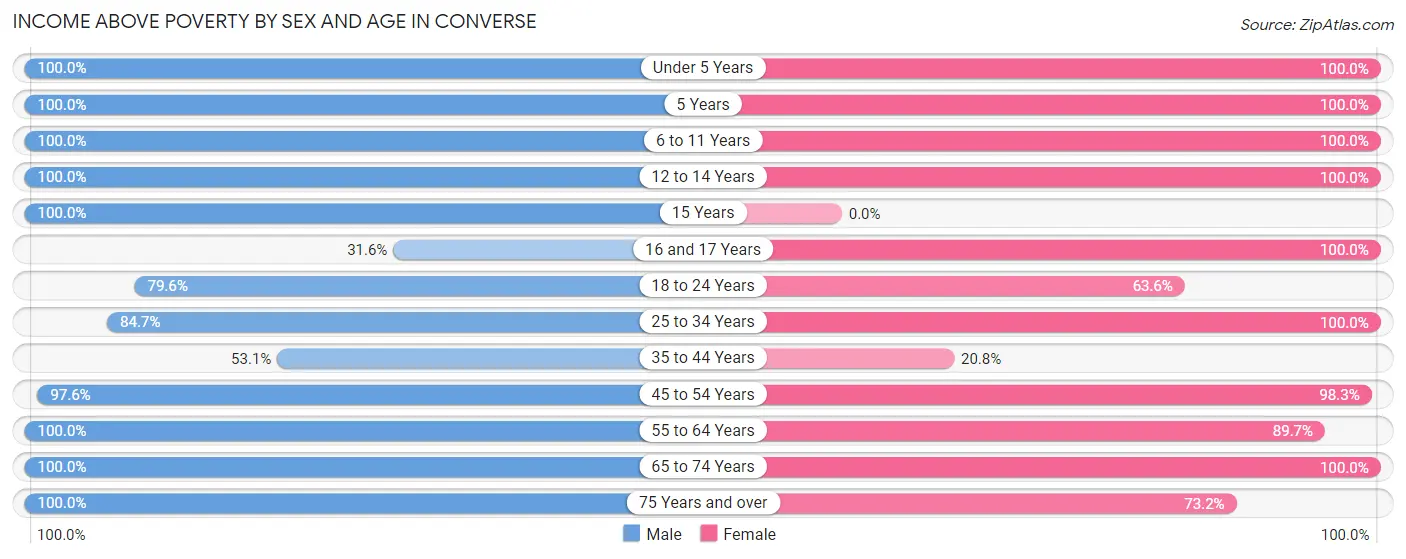
| Age Bracket | Male | Female |
| Under 5 Years | 29 (100.0%) | 29 (100.0%) |
| 5 Years | 7 (100.0%) | 17 (100.0%) |
| 6 to 11 Years | 35 (100.0%) | 19 (100.0%) |
| 12 to 14 Years | 5 (100.0%) | 7 (100.0%) |
| 15 Years | 6 (100.0%) | 0 (0.0%) |
| 16 and 17 Years | 6 (31.6%) | 14 (100.0%) |
| 18 to 24 Years | 39 (79.6%) | 14 (63.6%) |
| 25 to 34 Years | 105 (84.7%) | 69 (100.0%) |
| 35 to 44 Years | 34 (53.1%) | 10 (20.8%) |
| 45 to 54 Years | 41 (97.6%) | 58 (98.3%) |
| 55 to 64 Years | 16 (100.0%) | 26 (89.7%) |
| 65 to 74 Years | 36 (100.0%) | 79 (100.0%) |
| 75 Years and over | 53 (100.0%) | 52 (73.2%) |
| Total | 412 (85.0%) | 394 (81.7%) |
Income Below Poverty Among Married-Couple Families in Converse
The poverty statistics for married-couple families in Converse show that 0.5% or 1 of the total 185 families live below the poverty line. Families with 1 or 2 children have the highest poverty rate of 1.3%, comprising of 1 families. On the other hand, families with no children have the lowest poverty rate of 0.0%, which includes 0 families.
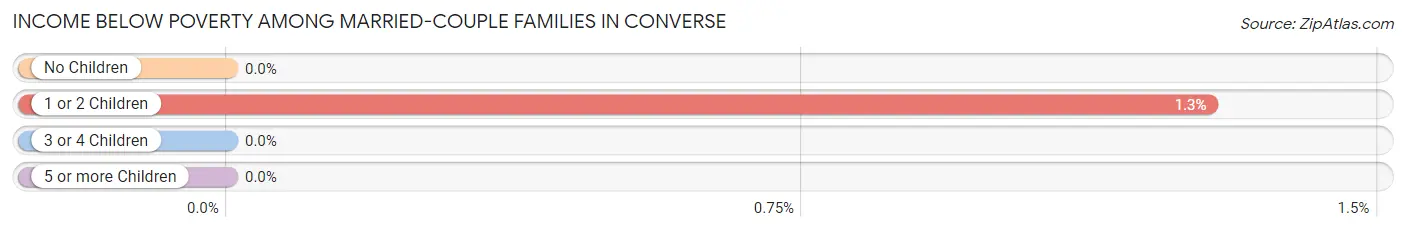
| Children | Above Poverty | Below Poverty |
| No Children | 103 (100.0%) | 0 (0.0%) |
| 1 or 2 Children | 77 (98.7%) | 1 (1.3%) |
| 3 or 4 Children | 4 (100.0%) | 0 (0.0%) |
| 5 or more Children | 0 (0.0%) | 0 (0.0%) |
| Total | 184 (99.5%) | 1 (0.5%) |
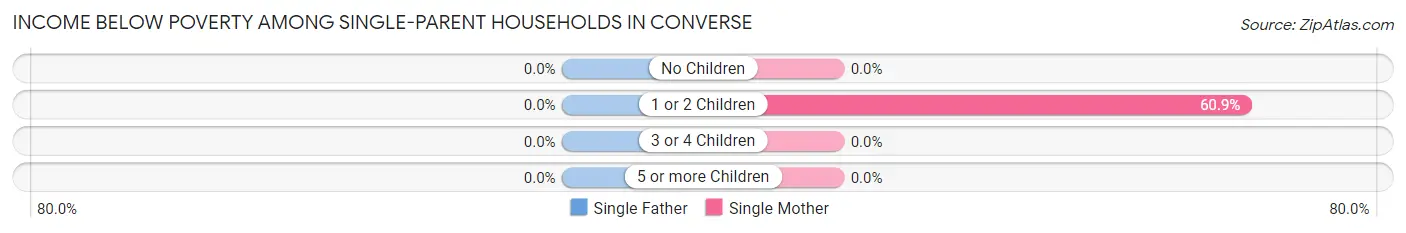
Income Below Poverty Among Single-Parent Households in Converse
| Children | Single Father | Single Mother |
| No Children | 0 (0.0%) | 0 (0.0%) |
| 1 or 2 Children | 0 (0.0%) | 14 (60.9%) |
| 3 or 4 Children | 0 (0.0%) | 0 (0.0%) |
| 5 or more Children | 0 (0.0%) | 0 (0.0%) |
| Total | 0 (0.0%) | 14 (42.4%) |
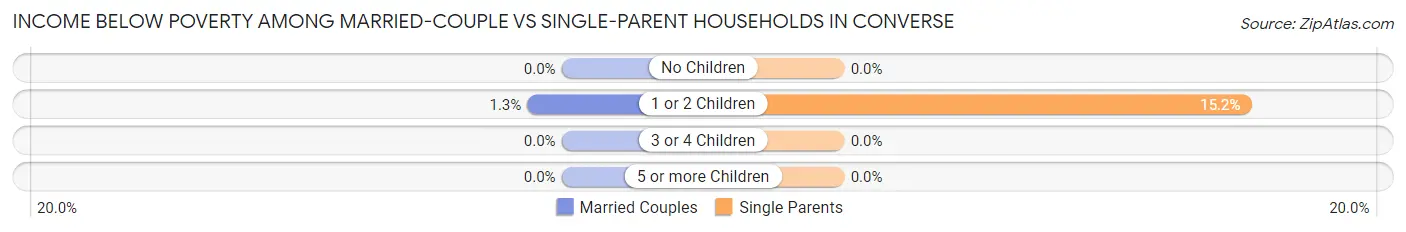
Income Below Poverty Among Married-Couple vs Single-Parent Households in Converse
The poverty data for Converse shows that 1 of the married-couple family households (0.5%) and 14 of the single-parent households (13.7%) are living below the poverty level. Within the married-couple family households, those with 1 or 2 children have the highest poverty rate, with 1 households (1.3%) falling below the poverty line. Among the single-parent households, those with 1 or 2 children have the highest poverty rate, with 14 household (15.2%) living below poverty.
| Children | Married-Couple Families | Single-Parent Households |
| No Children | 0 (0.0%) | 0 (0.0%) |
| 1 or 2 Children | 1 (1.3%) | 14 (15.2%) |
| 3 or 4 Children | 0 (0.0%) | 0 (0.0%) |
| 5 or more Children | 0 (0.0%) | 0 (0.0%) |
| Total | 1 (0.5%) | 14 (13.7%) |
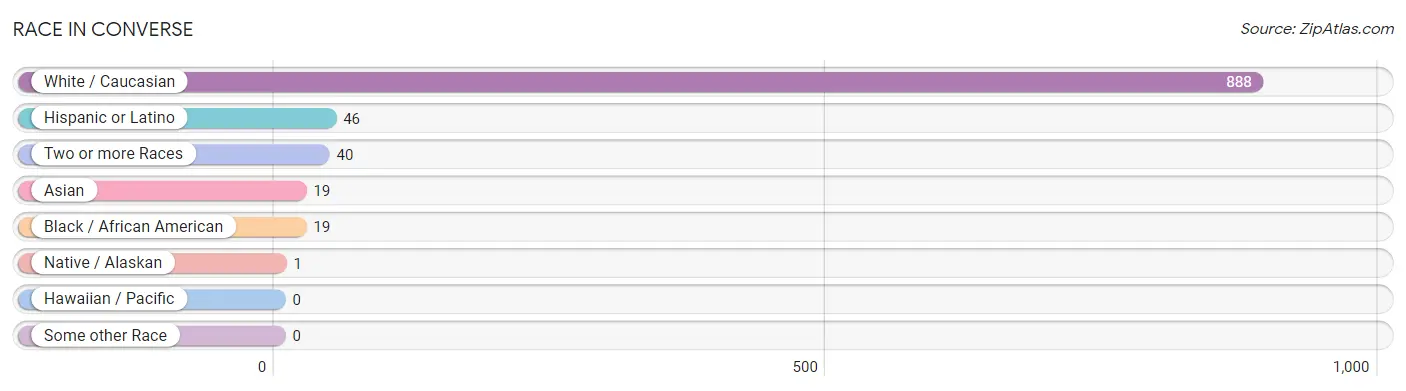
Race in Converse
The most populous races in Converse are White / Caucasian (888 | 91.8%), Hispanic or Latino (46 | 4.8%), and Two or more Races (40 | 4.1%).
| Race | # Population | % Population |
| Asian | 19 | 2.0% |
| Black / African American | 19 | 2.0% |
| Hawaiian / Pacific | 0 | 0.0% |
| Hispanic or Latino | 46 | 4.8% |
| Native / Alaskan | 1 | 0.1% |
| White / Caucasian | 888 | 91.8% |
| Two or more Races | 40 | 4.1% |
| Some other Race | 0 | 0.0% |
| Total | 967 | 100.0% |
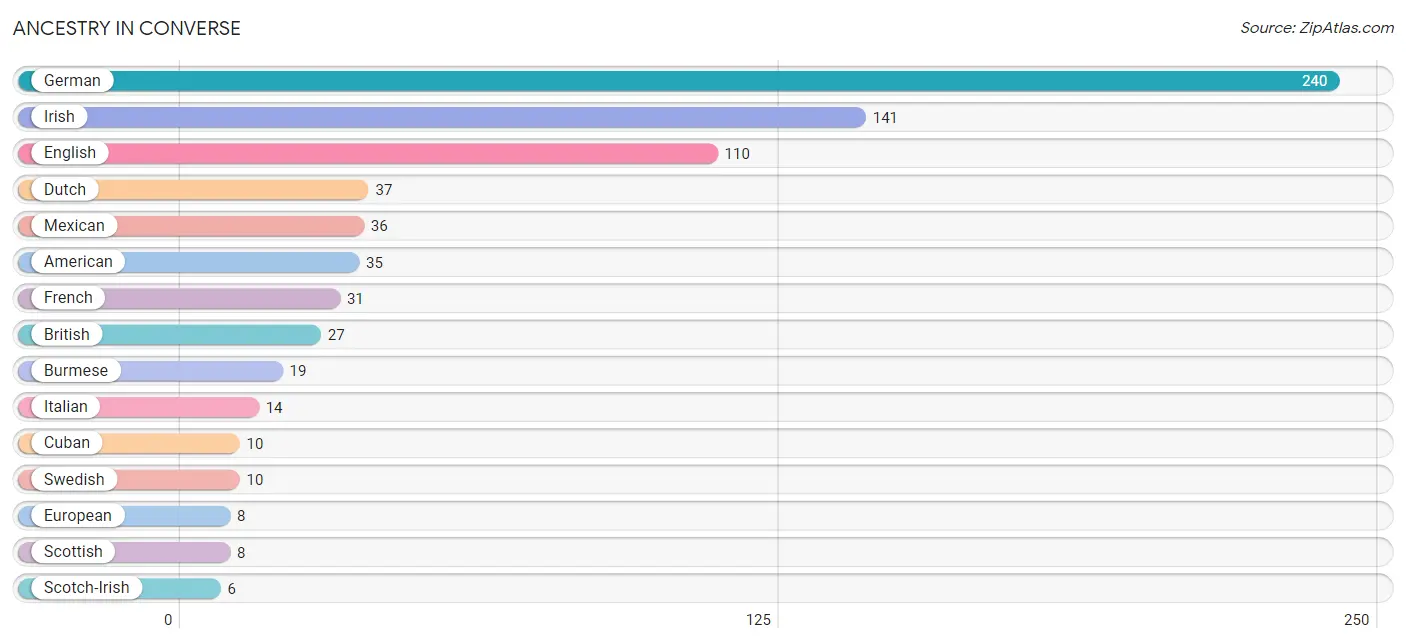
Ancestry in Converse
The most populous ancestries reported in Converse are German (240 | 24.8%), Irish (141 | 14.6%), English (110 | 11.4%), Dutch (37 | 3.8%), and Mexican (36 | 3.7%), together accounting for 58.3% of all Converse residents.
| Ancestry | # Population | % Population |
| American | 35 | 3.6% |
| British | 27 | 2.8% |
| Burmese | 19 | 2.0% |
| Cherokee | 2 | 0.2% |
| Cuban | 10 | 1.0% |
| Dutch | 37 | 3.8% |
| English | 110 | 11.4% |
| European | 8 | 0.8% |
| French | 31 | 3.2% |
| German | 240 | 24.8% |
| Irish | 141 | 14.6% |
| Italian | 14 | 1.5% |
| Mexican | 36 | 3.7% |
| Scotch-Irish | 6 | 0.6% |
| Scottish | 8 | 0.8% |
| Swedish | 10 | 1.0% |
| Swiss | 4 | 0.4% | View All 17 Rows |
Immigrants in Converse
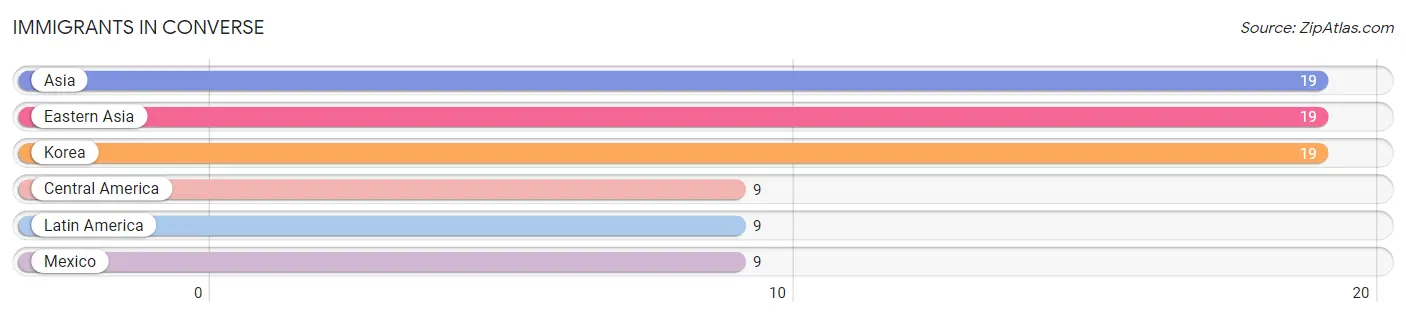
The most numerous immigrant groups reported in Converse came from Asia (19 | 2.0%), Eastern Asia (19 | 2.0%), Korea (19 | 2.0%), Central America (9 | 0.9%), and Latin America (9 | 0.9%), together accounting for 7.7% of all Converse residents.
| Immigration Origin | # Population | % Population |
| Asia | 19 | 2.0% |
| Central America | 9 | 0.9% |
| Eastern Asia | 19 | 2.0% |
| Korea | 19 | 2.0% |
| Latin America | 9 | 0.9% |
| Mexico | 9 | 0.9% | View All 6 Rows |
Sex and Age in Converse
Sex and Age in Converse
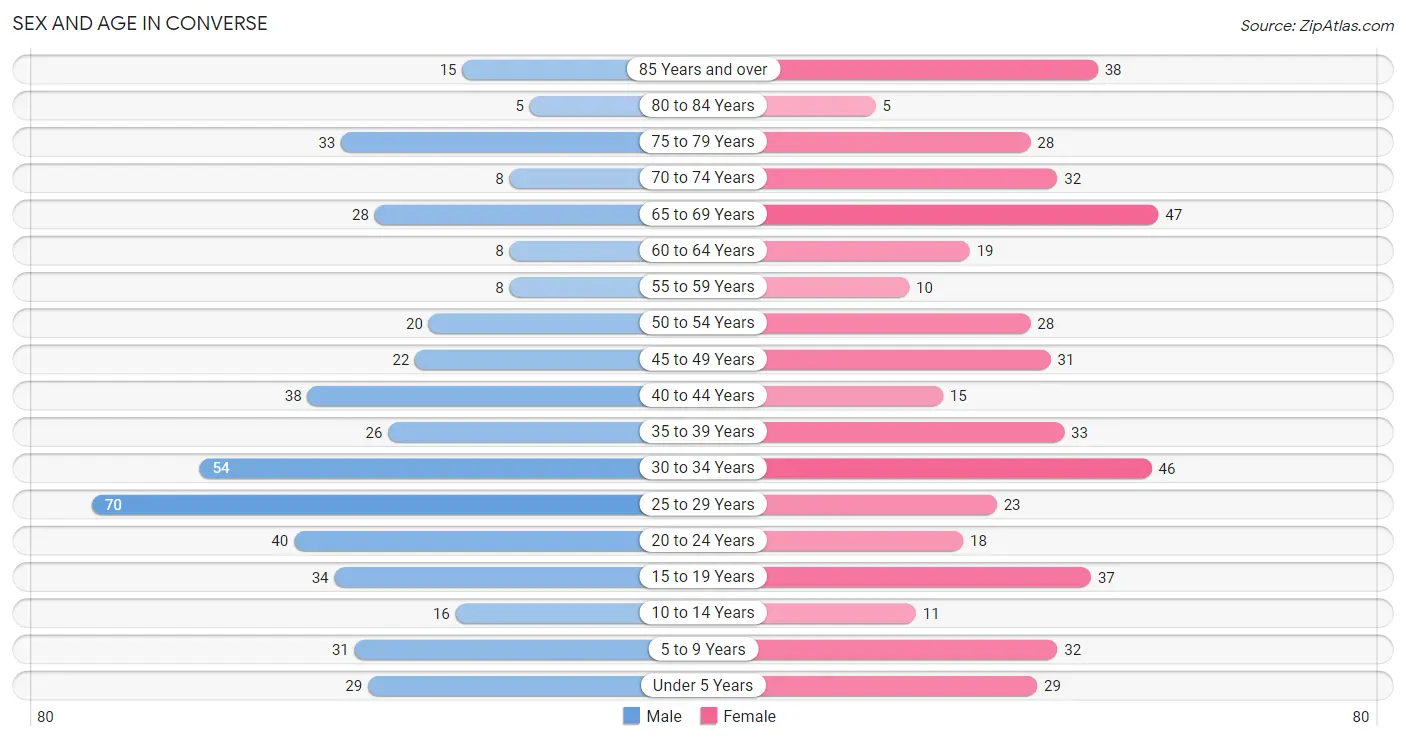
The most populous age groups in Converse are 25 to 29 Years (70 | 14.4%) for men and 65 to 69 Years (47 | 9.8%) for women.
| Age Bracket | Male | Female |
| Under 5 Years | 29 (6.0%) | 29 (6.0%) |
| 5 to 9 Years | 31 (6.4%) | 32 (6.6%) |
| 10 to 14 Years | 16 (3.3%) | 11 (2.3%) |
| 15 to 19 Years | 34 (7.0%) | 37 (7.7%) |
| 20 to 24 Years | 40 (8.3%) | 18 (3.7%) |
| 25 to 29 Years | 70 (14.4%) | 23 (4.8%) |
| 30 to 34 Years | 54 (11.1%) | 46 (9.5%) |
| 35 to 39 Years | 26 (5.4%) | 33 (6.9%) |
| 40 to 44 Years | 38 (7.8%) | 15 (3.1%) |
| 45 to 49 Years | 22 (4.5%) | 31 (6.4%) |
| 50 to 54 Years | 20 (4.1%) | 28 (5.8%) |
| 55 to 59 Years | 8 (1.7%) | 10 (2.1%) |
| 60 to 64 Years | 8 (1.7%) | 19 (3.9%) |
| 65 to 69 Years | 28 (5.8%) | 47 (9.8%) |
| 70 to 74 Years | 8 (1.7%) | 32 (6.6%) |
| 75 to 79 Years | 33 (6.8%) | 28 (5.8%) |
| 80 to 84 Years | 5 (1.0%) | 5 (1.0%) |
| 85 Years and over | 15 (3.1%) | 38 (7.9%) |
| Total | 485 (100.0%) | 482 (100.0%) |
Families and Households in Converse
Median Family Size in Converse
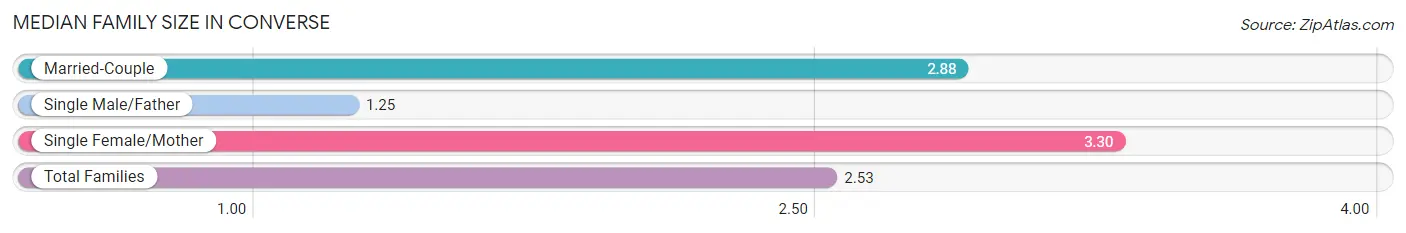
The median family size in Converse is 2.53 persons per family, with single female/mother families (33 | 11.5%) accounting for the largest median family size of 3.3 persons per family. On the other hand, single male/father families (69 | 24.0%) represent the smallest median family size with 1.25 persons per family.
| Family Type | # Families | Family Size |
| Married-Couple | 185 (64.5%) | 2.88 |
| Single Male/Father | 69 (24.0%) | 1.25 |
| Single Female/Mother | 33 (11.5%) | 3.30 |
| Total Families | 287 (100.0%) | 2.53 |
Median Household Size in Converse
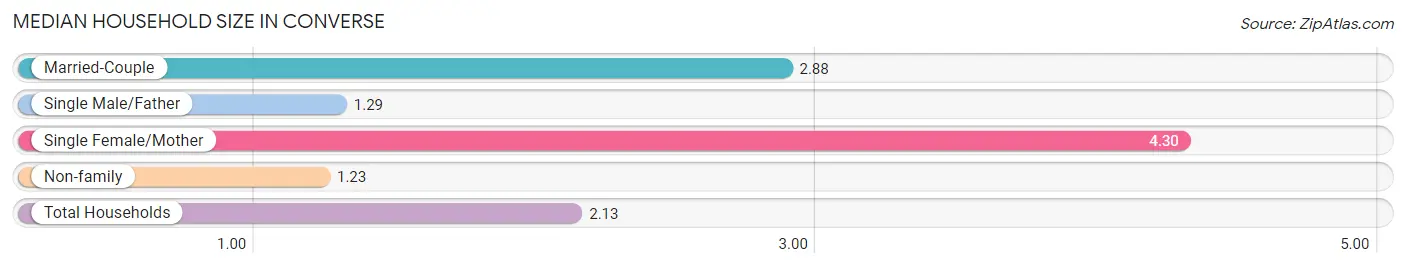
The median household size in Converse is 2.13 persons per household, with single female/mother households (33 | 7.3%) accounting for the largest median household size of 4.3 persons per household. non-family households (166 | 36.6%) represent the smallest median household size with 1.23 persons per household.
| Household Type | # Households | Household Size |
| Married-Couple | 185 (40.8%) | 2.88 |
| Single Male/Father | 69 (15.2%) | 1.29 |
| Single Female/Mother | 33 (7.3%) | 4.30 |
| Non-family | 166 (36.6%) | 1.23 |
| Total Households | 453 (100.0%) | 2.13 |
Household Size by Marriage Status in Converse
Out of a total of 453 households in Converse, 287 (63.4%) are family households, while 166 (36.6%) are nonfamily households. The most numerous type of family households are 3-person households, comprising 123, and the most common type of nonfamily households are 1-person households, comprising 123.
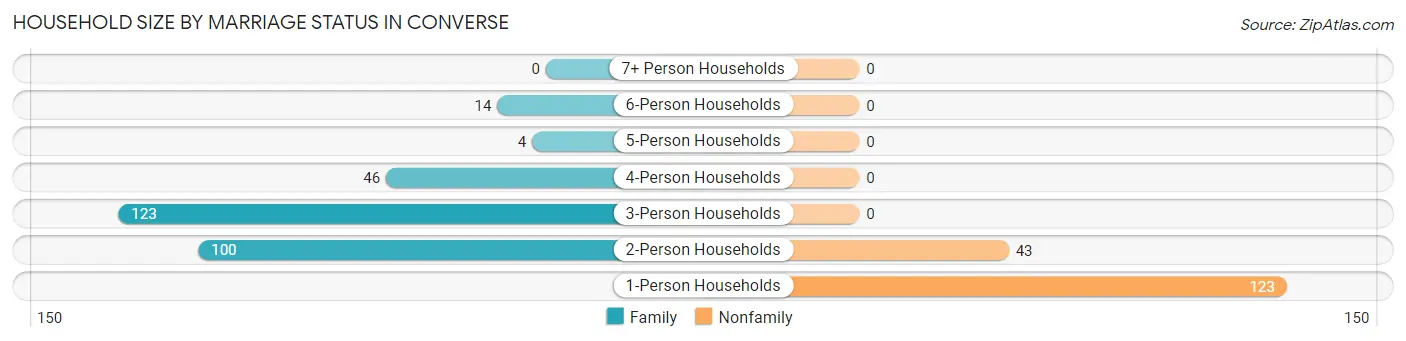
| Household Size | Family Households | Nonfamily Households |
| 1-Person Households | - | 123 (27.2%) |
| 2-Person Households | 100 (22.1%) | 43 (9.5%) |
| 3-Person Households | 123 (27.2%) | 0 (0.0%) |
| 4-Person Households | 46 (10.2%) | 0 (0.0%) |
| 5-Person Households | 4 (0.9%) | 0 (0.0%) |
| 6-Person Households | 14 (3.1%) | 0 (0.0%) |
| 7+ Person Households | 0 (0.0%) | 0 (0.0%) |
| Total | 287 (63.4%) | 166 (36.6%) |
Female Fertility in Converse
Fertility by Age in Converse
Average fertility rate in Converse is 20.0 births per 1,000 women. Women in the age bracket of 20 to 34 years have the highest fertility rate with 46.0 births per 1,000 women. Women in the age bracket of 20 to 34 years acount for 100.0% of all women with births.
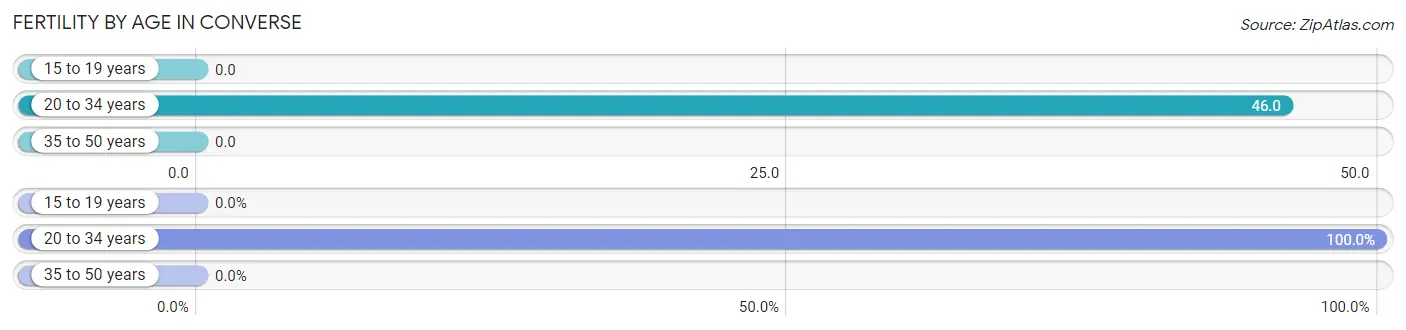
| Age Bracket | Women with Births | Births / 1,000 Women |
| 15 to 19 years | 0 (0.0%) | 0.0 |
| 20 to 34 years | 4 (100.0%) | 46.0 |
| 35 to 50 years | 0 (0.0%) | 0.0 |
| Total | 4 (100.0%) | 20.0 |
Fertility by Age by Marriage Status in Converse
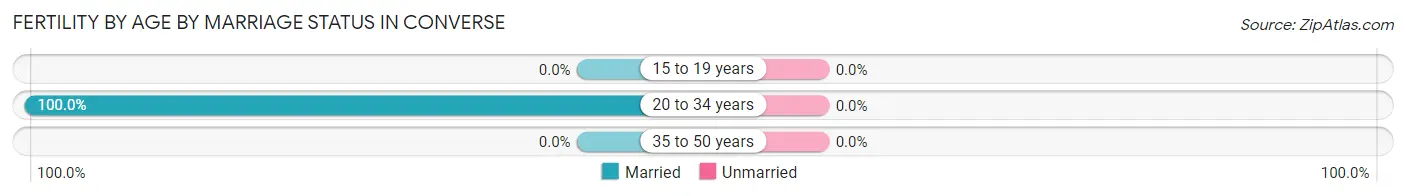
| Age Bracket | Married | Unmarried |
| 15 to 19 years | 0 (0.0%) | 0 (0.0%) |
| 20 to 34 years | 4 (100.0%) | 0 (0.0%) |
| 35 to 50 years | 0 (0.0%) | 0 (0.0%) |
| Total | 4 (100.0%) | 0 (0.0%) |
Fertility by Education in Converse
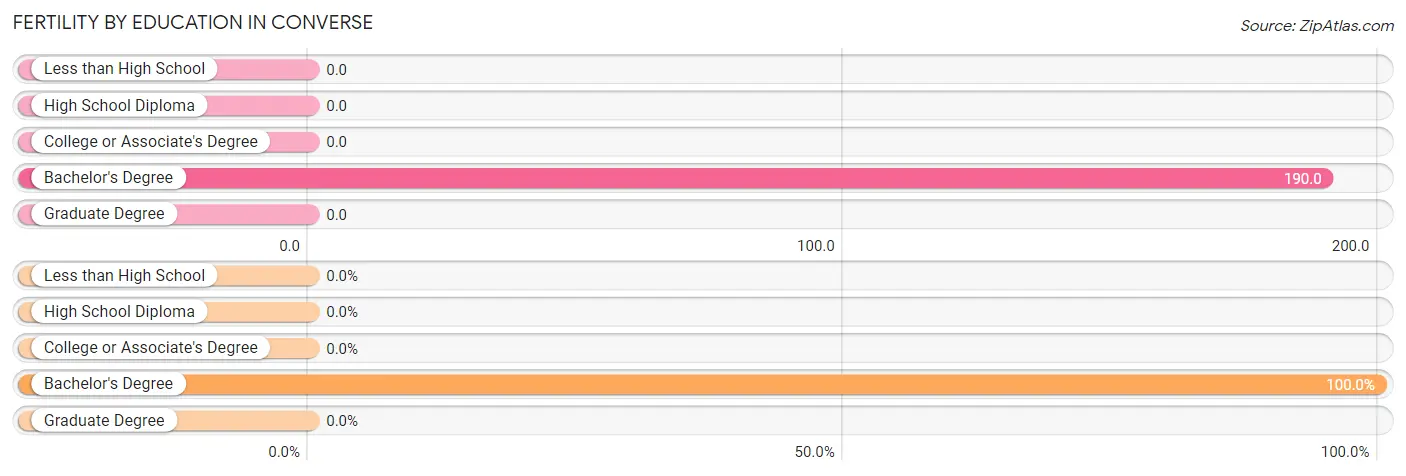
| Educational Attainment | Women with Births | Births / 1,000 Women |
| Less than High School | 0 (0.0%) | 0.0 |
| High School Diploma | 0 (0.0%) | 0.0 |
| College or Associate's Degree | 0 (0.0%) | 0.0 |
| Bachelor's Degree | 4 (100.0%) | 190.0 |
| Graduate Degree | 0 (0.0%) | 0.0 |
| Total | 4 (100.0%) | 20.0 |
Fertility by Education by Marriage Status in Converse
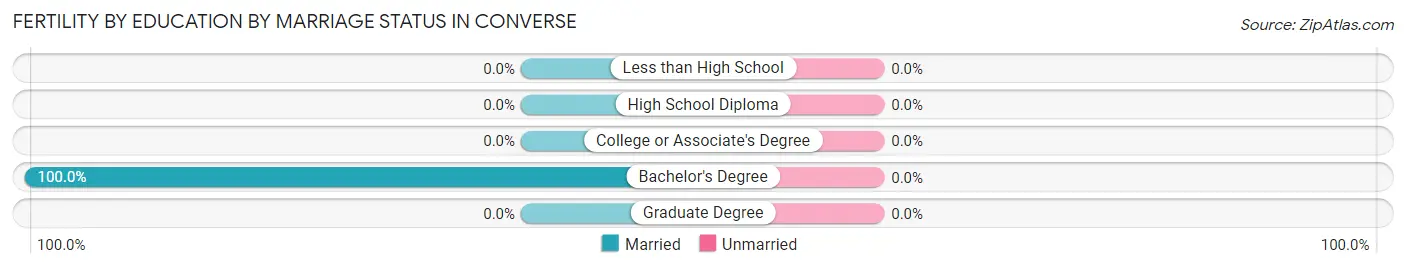
| Educational Attainment | Married | Unmarried |
| Less than High School | 0 (0.0%) | 0 (0.0%) |
| High School Diploma | 0 (0.0%) | 0 (0.0%) |
| College or Associate's Degree | 0 (0.0%) | 0 (0.0%) |
| Bachelor's Degree | 4 (100.0%) | 0 (0.0%) |
| Graduate Degree | 0 (0.0%) | 0 (0.0%) |
| Total | 4 (100.0%) | 0 (0.0%) |
Employment Characteristics in Converse
Employment by Class of Employer in Converse
Among the 439 employed individuals in Converse, private company employees (354 | 80.6%), not-for-profit organizations (29 | 6.6%), and local government employees (21 | 4.8%) make up the most common classes of employment.
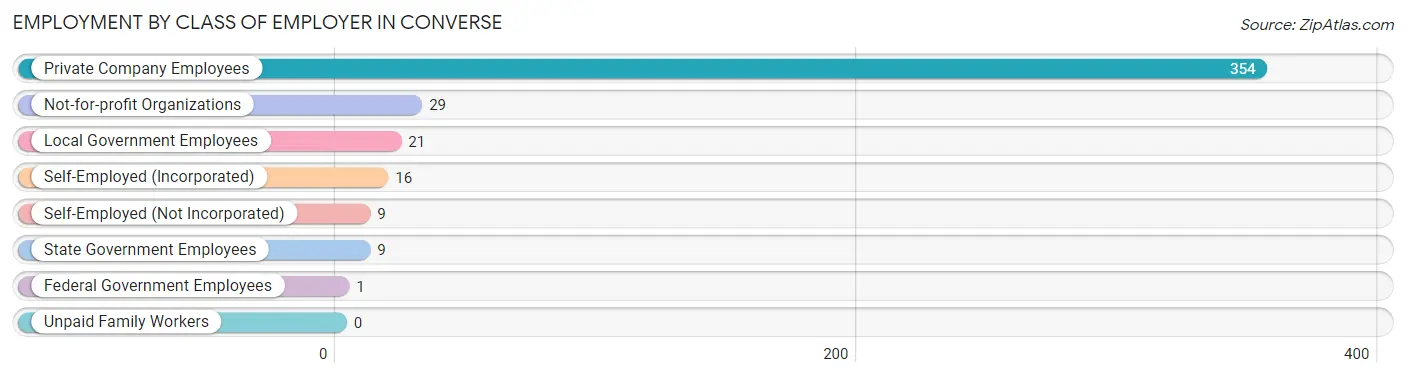
| Employer Class | # Employees | % Employees |
| Private Company Employees | 354 | 80.6% |
| Self-Employed (Incorporated) | 16 | 3.6% |
| Self-Employed (Not Incorporated) | 9 | 2.1% |
| Not-for-profit Organizations | 29 | 6.6% |
| Local Government Employees | 21 | 4.8% |
| State Government Employees | 9 | 2.1% |
| Federal Government Employees | 1 | 0.2% |
| Unpaid Family Workers | 0 | 0.0% |
| Total | 439 | 100.0% |
Employment Status by Age in Converse
According to the labor force statistics for Converse, out of the total population over 16 years of age (794), 55.8% or 443 individuals are in the labor force, with 0.9% or 4 of them unemployed. The age group with the highest labor force participation rate is 20 to 24 years, with 100.0% or 58 individuals in the labor force. Within the labor force, the 55 to 59 years age range has the highest percentage of unemployed individuals, with 5.6% or 1 of them being unemployed.
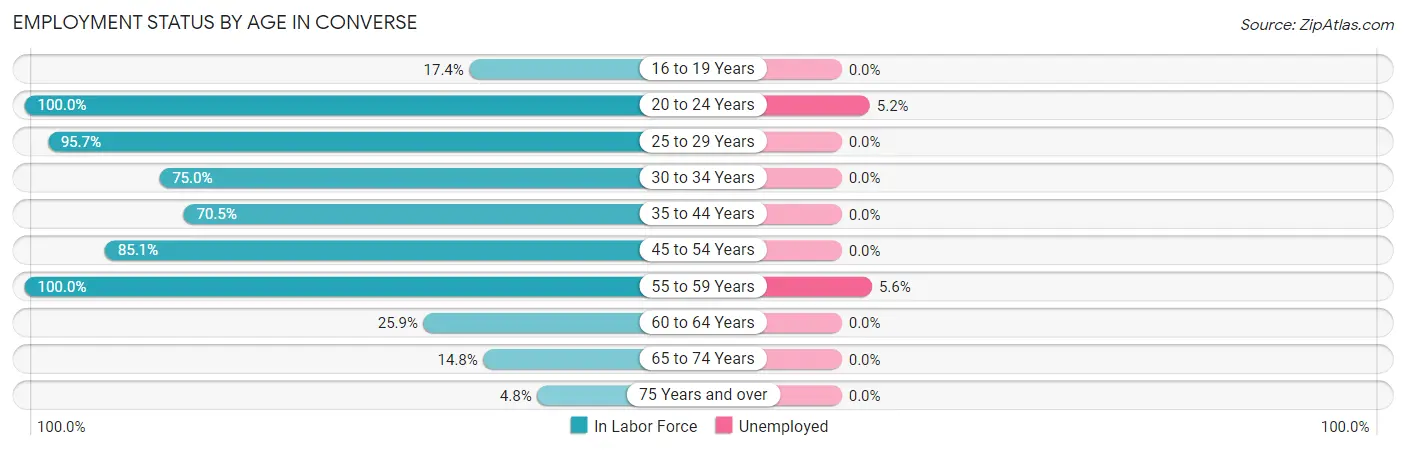
| Age Bracket | In Labor Force | Unemployed |
| 16 to 19 Years | 8 (17.4%) | 0 (0.0%) |
| 20 to 24 Years | 58 (100.0%) | 3 (5.2%) |
| 25 to 29 Years | 89 (95.7%) | 0 (0.0%) |
| 30 to 34 Years | 75 (75.0%) | 0 (0.0%) |
| 35 to 44 Years | 79 (70.5%) | 0 (0.0%) |
| 45 to 54 Years | 86 (85.1%) | 0 (0.0%) |
| 55 to 59 Years | 18 (100.0%) | 1 (5.6%) |
| 60 to 64 Years | 7 (25.9%) | 0 (0.0%) |
| 65 to 74 Years | 17 (14.8%) | 0 (0.0%) |
| 75 Years and over | 6 (4.8%) | 0 (0.0%) |
| Total | 443 (55.8%) | 4 (0.9%) |
Employment Status by Educational Attainment in Converse
According to labor force statistics for Converse, 78.5% of individuals (354) out of the total population between 25 and 64 years of age (451) are in the labor force, with 0.3% or 1 of them being unemployed. The group with the highest labor force participation rate are those with the educational attainment of bachelor's degree or higher, with 100.0% or 54 individuals in the labor force. Within the labor force, individuals with bachelor's degree or higher education have the highest percentage of unemployment, with 1.9% or 1 of them being unemployed.
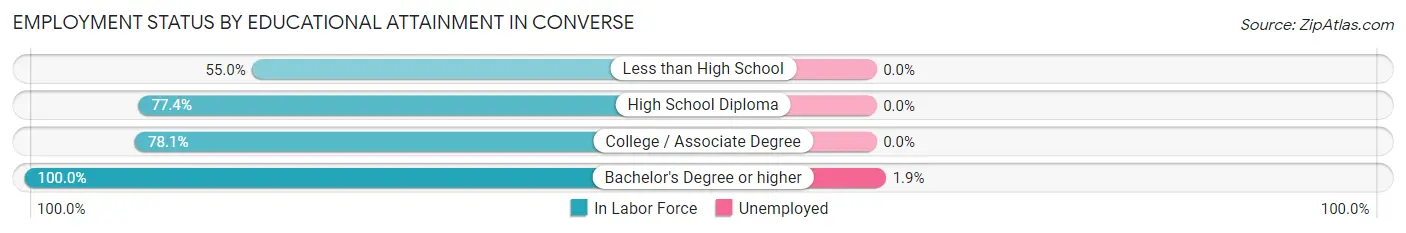
| Educational Attainment | In Labor Force | Unemployed |
| Less than High School | 22 (55.0%) | 0 (0.0%) |
| High School Diploma | 103 (77.4%) | 0 (0.0%) |
| College / Associate Degree | 175 (78.1%) | 0 (0.0%) |
| Bachelor's Degree or higher | 54 (100.0%) | 1 (1.9%) |
| Total | 354 (78.5%) | 1 (0.3%) |
Employment Occupations by Sex in Converse
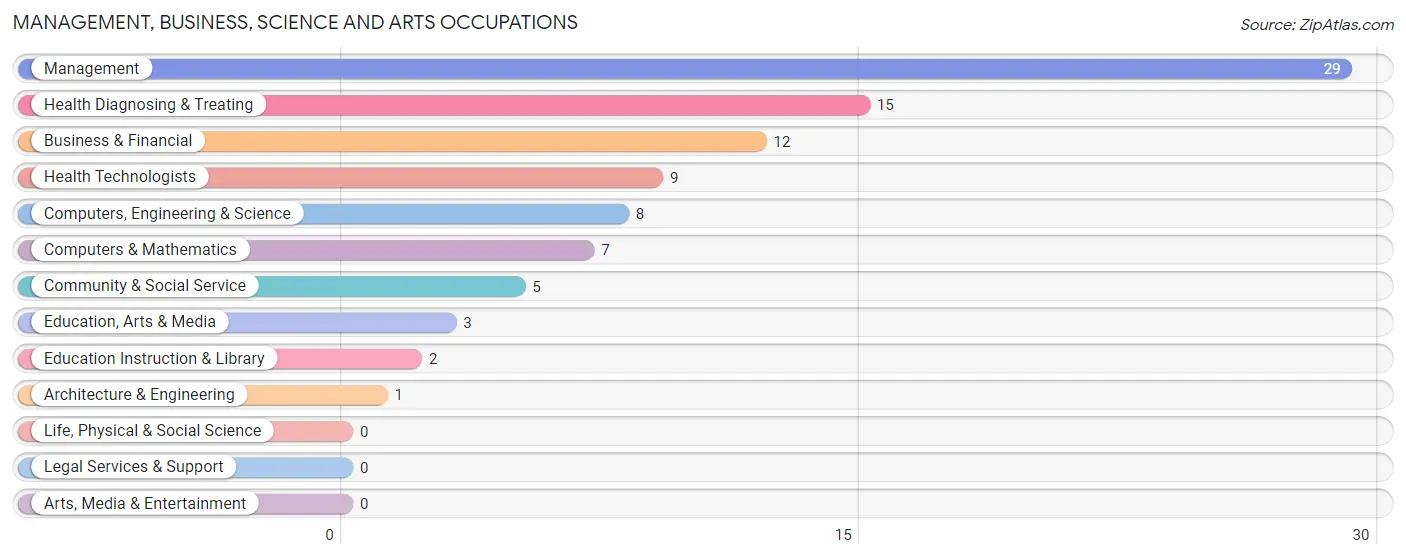
Management, Business, Science and Arts Occupations
The most common Management, Business, Science and Arts occupations in Converse are Management (29 | 6.6%), Health Diagnosing & Treating (15 | 3.4%), Business & Financial (12 | 2.7%), Health Technologists (9 | 2.1%), and Computers, Engineering & Science (8 | 1.8%).
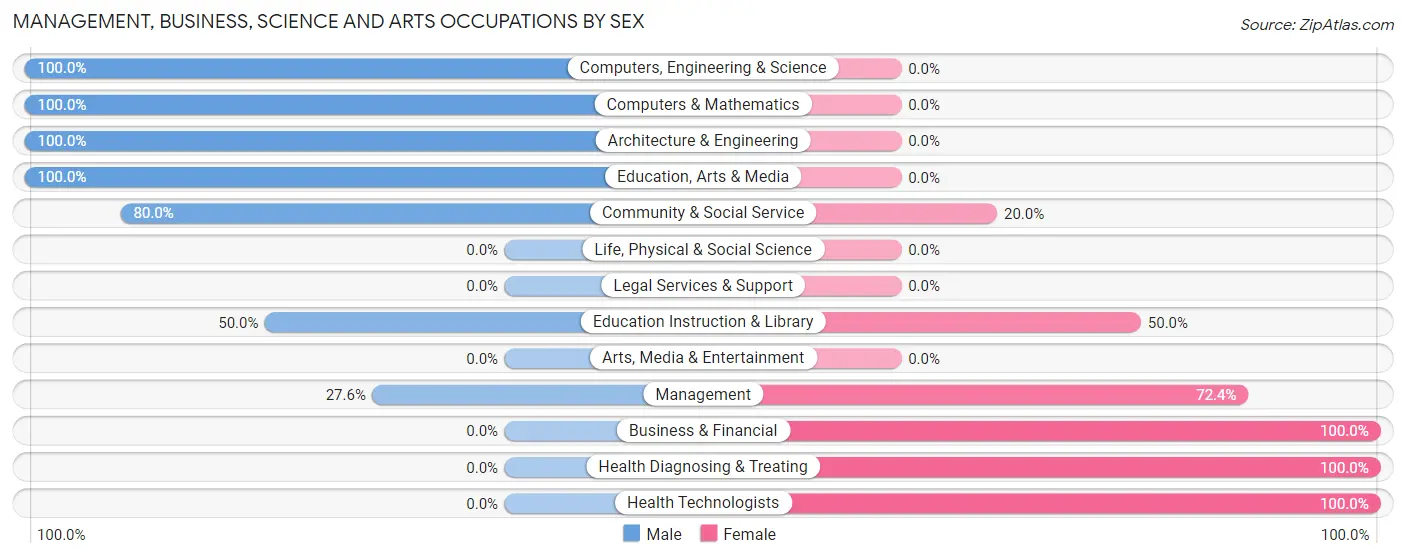
Management, Business, Science and Arts Occupations by Sex
Within the Management, Business, Science and Arts occupations in Converse, the most male-oriented occupations are Computers, Engineering & Science (100.0%), Computers & Mathematics (100.0%), and Architecture & Engineering (100.0%), while the most female-oriented occupations are Business & Financial (100.0%), Health Diagnosing & Treating (100.0%), and Health Technologists (100.0%).
| Occupation | Male | Female |
| Management | 8 (27.6%) | 21 (72.4%) |
| Business & Financial | 0 (0.0%) | 12 (100.0%) |
| Computers, Engineering & Science | 8 (100.0%) | 0 (0.0%) |
| Computers & Mathematics | 7 (100.0%) | 0 (0.0%) |
| Architecture & Engineering | 1 (100.0%) | 0 (0.0%) |
| Life, Physical & Social Science | 0 (0.0%) | 0 (0.0%) |
| Community & Social Service | 4 (80.0%) | 1 (20.0%) |
| Education, Arts & Media | 3 (100.0%) | 0 (0.0%) |
| Legal Services & Support | 0 (0.0%) | 0 (0.0%) |
| Education Instruction & Library | 1 (50.0%) | 1 (50.0%) |
| Arts, Media & Entertainment | 0 (0.0%) | 0 (0.0%) |
| Health Diagnosing & Treating | 0 (0.0%) | 15 (100.0%) |
| Health Technologists | 0 (0.0%) | 9 (100.0%) |
| Total (Category) | 20 (29.0%) | 49 (71.0%) |
| Total (Overall) | 263 (59.9%) | 176 (40.1%) |
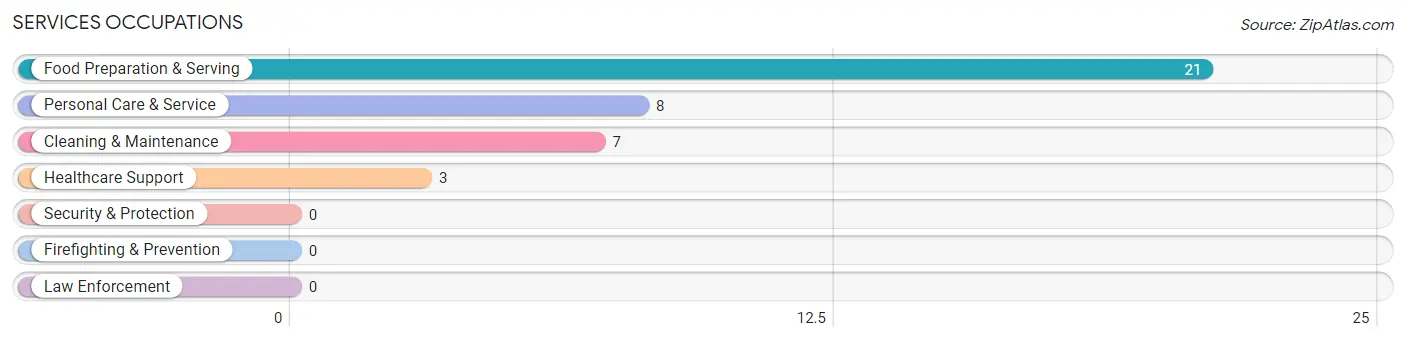
Services Occupations
The most common Services occupations in Converse are Food Preparation & Serving (21 | 4.8%), Personal Care & Service (8 | 1.8%), Cleaning & Maintenance (7 | 1.6%), and Healthcare Support (3 | 0.7%).
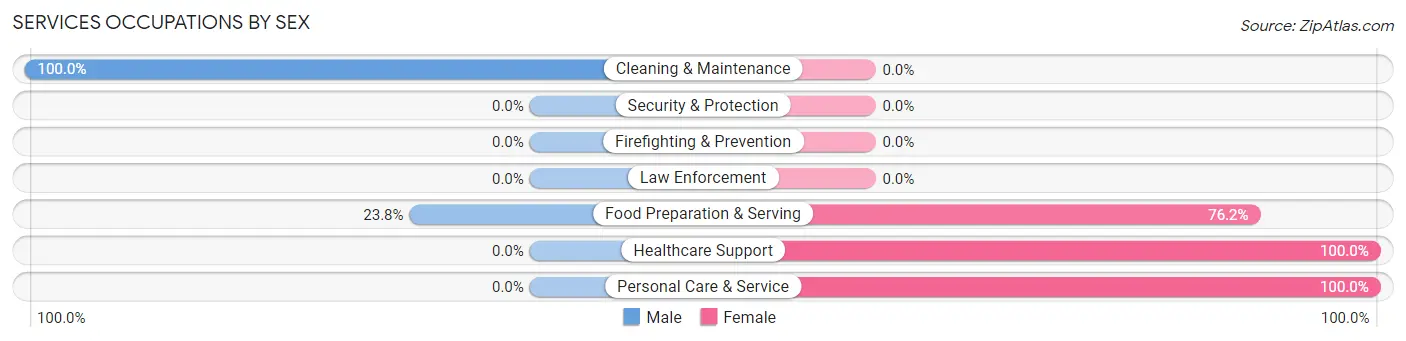
Services Occupations by Sex
Within the Services occupations in Converse, the most male-oriented occupations are Cleaning & Maintenance (100.0%), and Food Preparation & Serving (23.8%), while the most female-oriented occupations are Healthcare Support (100.0%), Personal Care & Service (100.0%), and Food Preparation & Serving (76.2%).
| Occupation | Male | Female |
| Healthcare Support | 0 (0.0%) | 3 (100.0%) |
| Security & Protection | 0 (0.0%) | 0 (0.0%) |
| Firefighting & Prevention | 0 (0.0%) | 0 (0.0%) |
| Law Enforcement | 0 (0.0%) | 0 (0.0%) |
| Food Preparation & Serving | 5 (23.8%) | 16 (76.2%) |
| Cleaning & Maintenance | 7 (100.0%) | 0 (0.0%) |
| Personal Care & Service | 0 (0.0%) | 8 (100.0%) |
| Total (Category) | 12 (30.8%) | 27 (69.2%) |
| Total (Overall) | 263 (59.9%) | 176 (40.1%) |
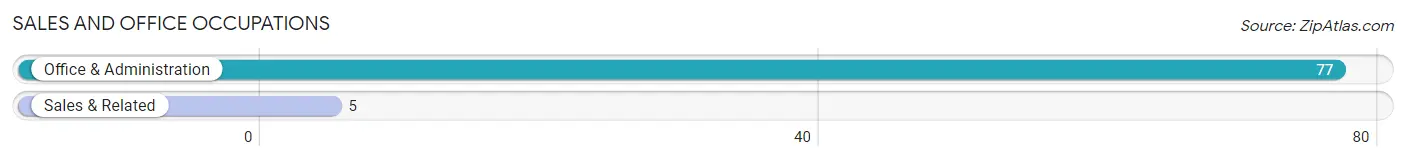
Sales and Office Occupations
The most common Sales and Office occupations in Converse are Office & Administration (77 | 17.5%), and Sales & Related (5 | 1.1%).
Sales and Office Occupations by Sex
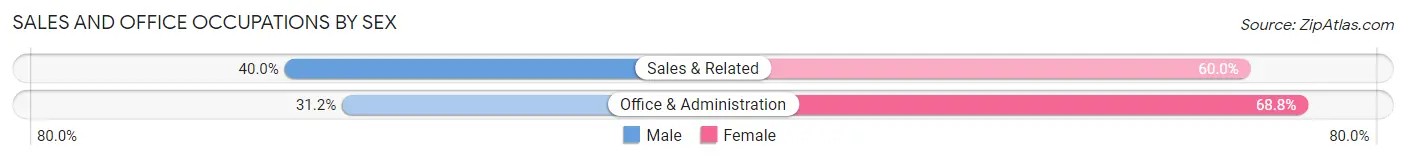
| Occupation | Male | Female |
| Sales & Related | 2 (40.0%) | 3 (60.0%) |
| Office & Administration | 24 (31.2%) | 53 (68.8%) |
| Total (Category) | 26 (31.7%) | 56 (68.3%) |
| Total (Overall) | 263 (59.9%) | 176 (40.1%) |
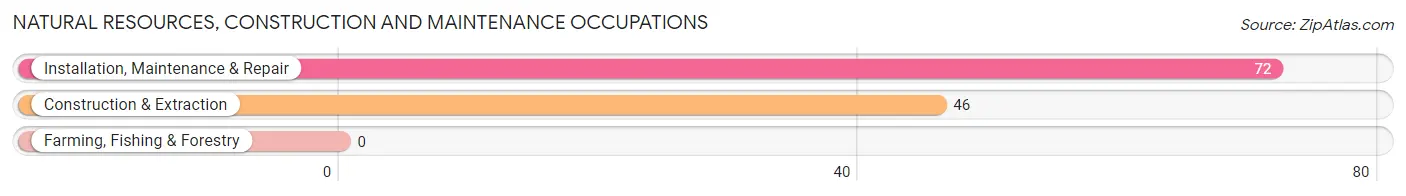
Natural Resources, Construction and Maintenance Occupations
The most common Natural Resources, Construction and Maintenance occupations in Converse are Installation, Maintenance & Repair (72 | 16.4%), and Construction & Extraction (46 | 10.5%).
Natural Resources, Construction and Maintenance Occupations by Sex
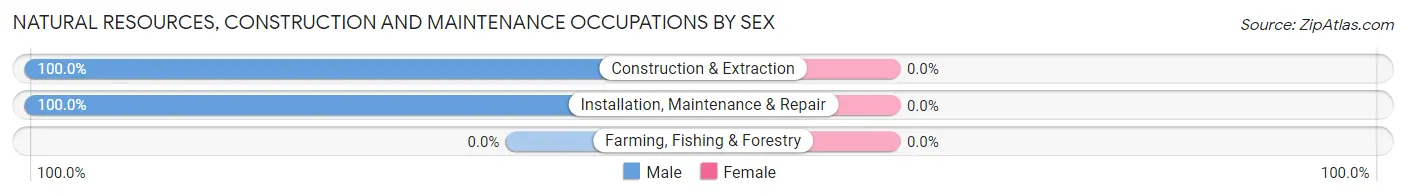
| Occupation | Male | Female |
| Farming, Fishing & Forestry | 0 (0.0%) | 0 (0.0%) |
| Construction & Extraction | 46 (100.0%) | 0 (0.0%) |
| Installation, Maintenance & Repair | 72 (100.0%) | 0 (0.0%) |
| Total (Category) | 118 (100.0%) | 0 (0.0%) |
| Total (Overall) | 263 (59.9%) | 176 (40.1%) |
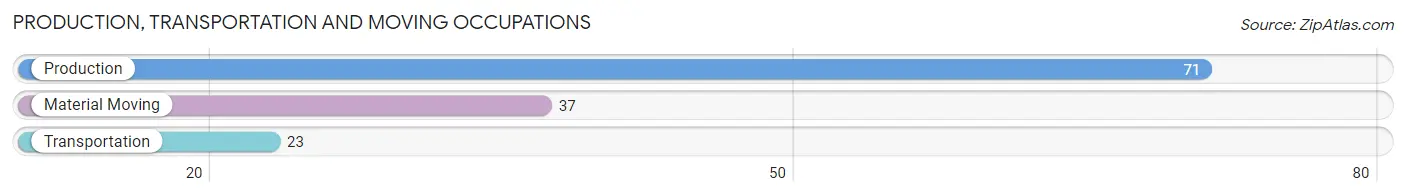
Production, Transportation and Moving Occupations
The most common Production, Transportation and Moving occupations in Converse are Production (71 | 16.2%), Material Moving (37 | 8.4%), and Transportation (23 | 5.2%).
Production, Transportation and Moving Occupations by Sex
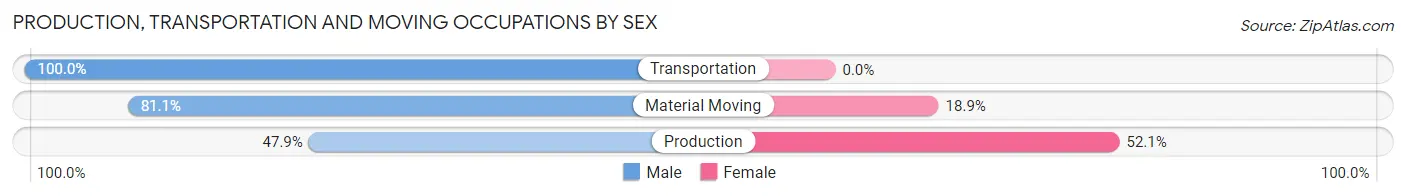
| Occupation | Male | Female |
| Production | 34 (47.9%) | 37 (52.1%) |
| Transportation | 23 (100.0%) | 0 (0.0%) |
| Material Moving | 30 (81.1%) | 7 (18.9%) |
| Total (Category) | 87 (66.4%) | 44 (33.6%) |
| Total (Overall) | 263 (59.9%) | 176 (40.1%) |
Employment Industries by Sex in Converse
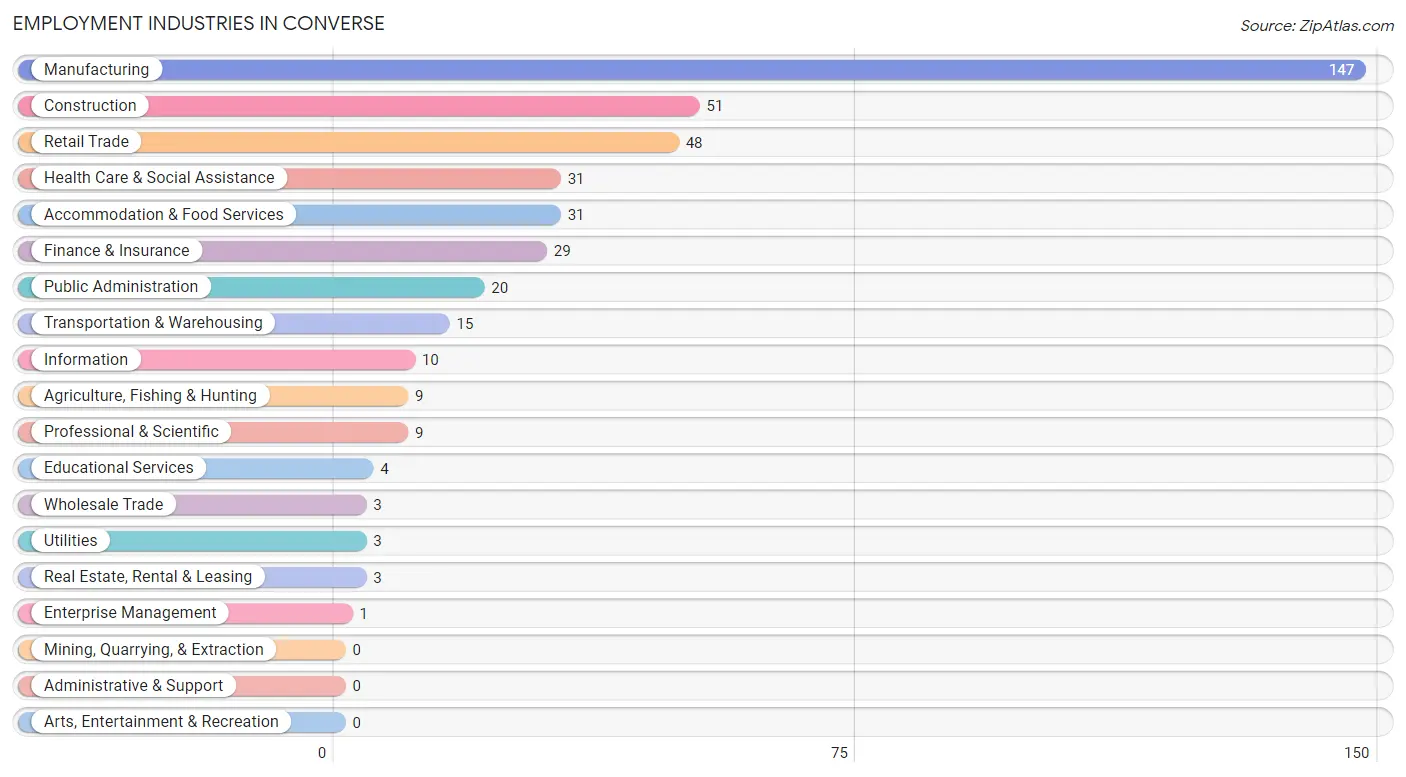
Employment Industries in Converse
The major employment industries in Converse include Manufacturing (147 | 33.5%), Construction (51 | 11.6%), Retail Trade (48 | 10.9%), Health Care & Social Assistance (31 | 7.1%), and Accommodation & Food Services (31 | 7.1%).
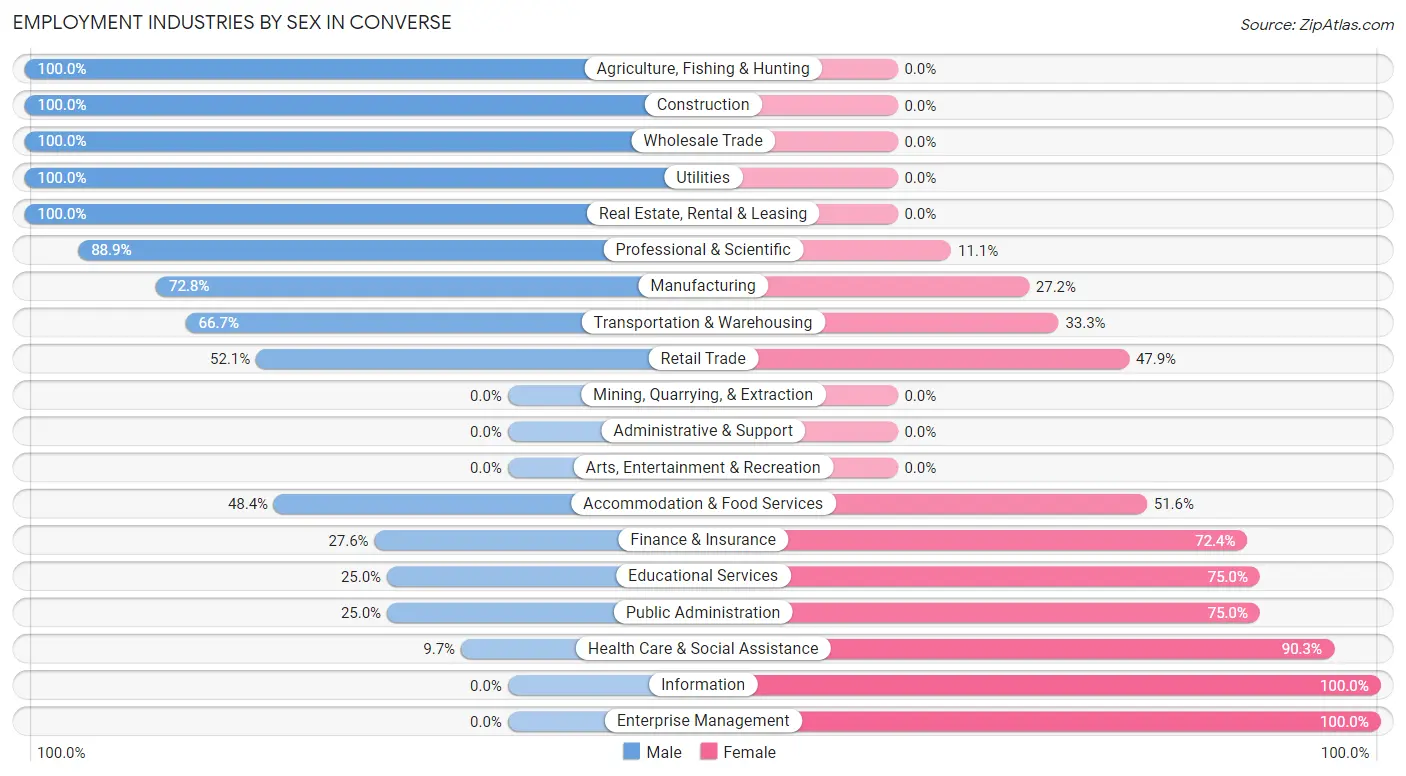
Employment Industries by Sex in Converse
The Converse industries that see more men than women are Agriculture, Fishing & Hunting (100.0%), Construction (100.0%), and Wholesale Trade (100.0%), whereas the industries that tend to have a higher number of women are Information (100.0%), Enterprise Management (100.0%), and Health Care & Social Assistance (90.3%).
| Industry | Male | Female |
| Agriculture, Fishing & Hunting | 9 (100.0%) | 0 (0.0%) |
| Mining, Quarrying, & Extraction | 0 (0.0%) | 0 (0.0%) |
| Construction | 51 (100.0%) | 0 (0.0%) |
| Manufacturing | 107 (72.8%) | 40 (27.2%) |
| Wholesale Trade | 3 (100.0%) | 0 (0.0%) |
| Retail Trade | 25 (52.1%) | 23 (47.9%) |
| Transportation & Warehousing | 10 (66.7%) | 5 (33.3%) |
| Utilities | 3 (100.0%) | 0 (0.0%) |
| Information | 0 (0.0%) | 10 (100.0%) |
| Finance & Insurance | 8 (27.6%) | 21 (72.4%) |
| Real Estate, Rental & Leasing | 3 (100.0%) | 0 (0.0%) |
| Professional & Scientific | 8 (88.9%) | 1 (11.1%) |
| Enterprise Management | 0 (0.0%) | 1 (100.0%) |
| Administrative & Support | 0 (0.0%) | 0 (0.0%) |
| Educational Services | 1 (25.0%) | 3 (75.0%) |
| Health Care & Social Assistance | 3 (9.7%) | 28 (90.3%) |
| Arts, Entertainment & Recreation | 0 (0.0%) | 0 (0.0%) |
| Accommodation & Food Services | 15 (48.4%) | 16 (51.6%) |
| Public Administration | 5 (25.0%) | 15 (75.0%) |
| Total | 263 (59.9%) | 176 (40.1%) |
Education in Converse
School Enrollment in Converse
The most common levels of schooling among the 246 students in Converse are college / undergraduate (96 | 39.0%), middle school (46 | 18.7%), and high school (39 | 15.9%).
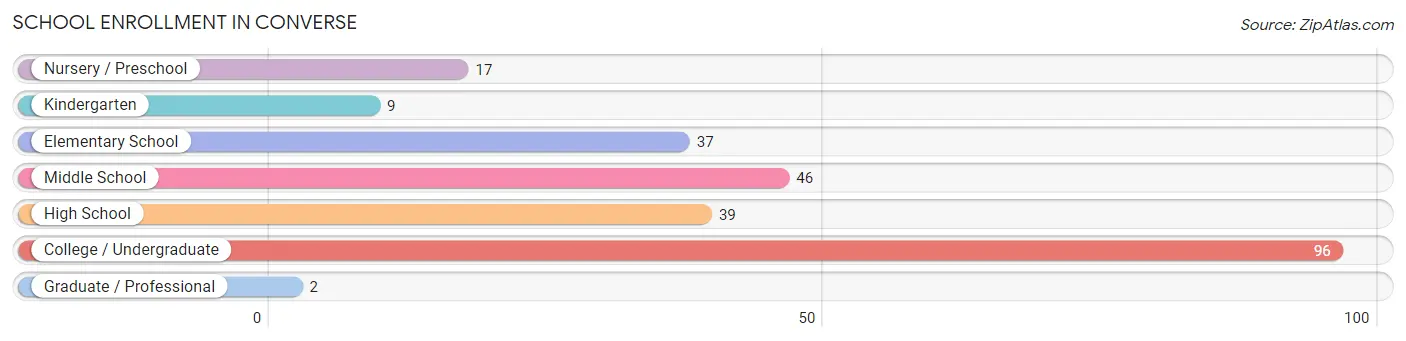
| School Level | # Students | % Students |
| Nursery / Preschool | 17 | 6.9% |
| Kindergarten | 9 | 3.7% |
| Elementary School | 37 | 15.0% |
| Middle School | 46 | 18.7% |
| High School | 39 | 15.9% |
| College / Undergraduate | 96 | 39.0% |
| Graduate / Professional | 2 | 0.8% |
| Total | 246 | 100.0% |
School Enrollment by Age by Funding Source in Converse
Out of a total of 246 students who are enrolled in schools in Converse, 26 (10.6%) attend a private institution, while the remaining 220 (89.4%) are enrolled in public schools. The age group of 35 years and over has the highest likelihood of being enrolled in private schools, with 2 (100.0% in the age bracket) enrolled. Conversely, the age group of 10 to 14 year olds has the lowest likelihood of being enrolled in a private school, with 27 (100.0% in the age bracket) attending a public institution.
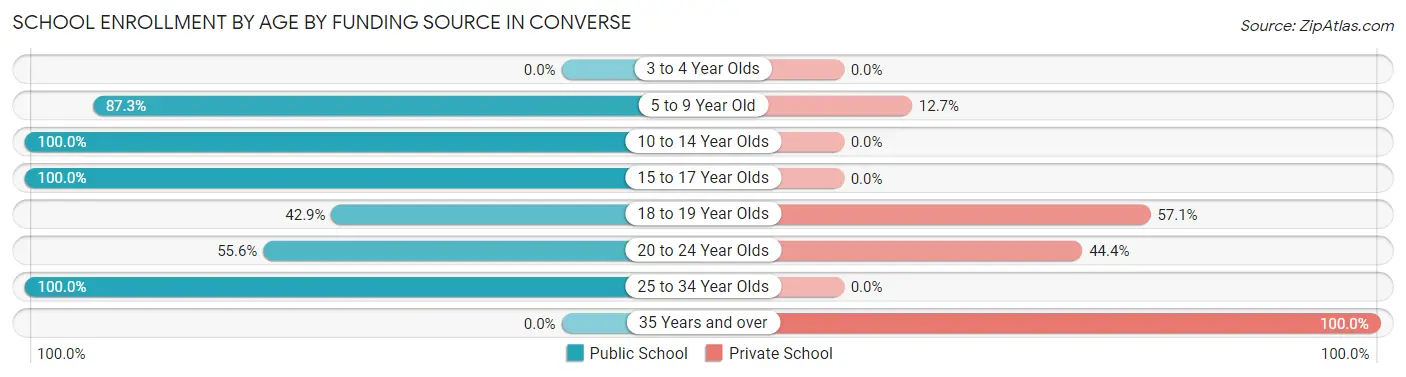
| Age Bracket | Public School | Private School |
| 3 to 4 Year Olds | 0 (0.0%) | 0 (0.0%) |
| 5 to 9 Year Old | 55 (87.3%) | 8 (12.7%) |
| 10 to 14 Year Olds | 27 (100.0%) | 0 (0.0%) |
| 15 to 17 Year Olds | 58 (100.0%) | 0 (0.0%) |
| 18 to 19 Year Olds | 3 (42.9%) | 4 (57.1%) |
| 20 to 24 Year Olds | 15 (55.6%) | 12 (44.4%) |
| 25 to 34 Year Olds | 62 (100.0%) | 0 (0.0%) |
| 35 Years and over | 0 (0.0%) | 2 (100.0%) |
| Total | 220 (89.4%) | 26 (10.6%) |
Educational Attainment by Field of Study in Converse
Business (20 | 25.0%), education (14 | 17.5%), science & technology (13 | 16.3%), arts & humanities (9 | 11.3%), and psychology (7 | 8.7%) are the most common fields of study among 80 individuals in Converse who have obtained a bachelor's degree or higher.
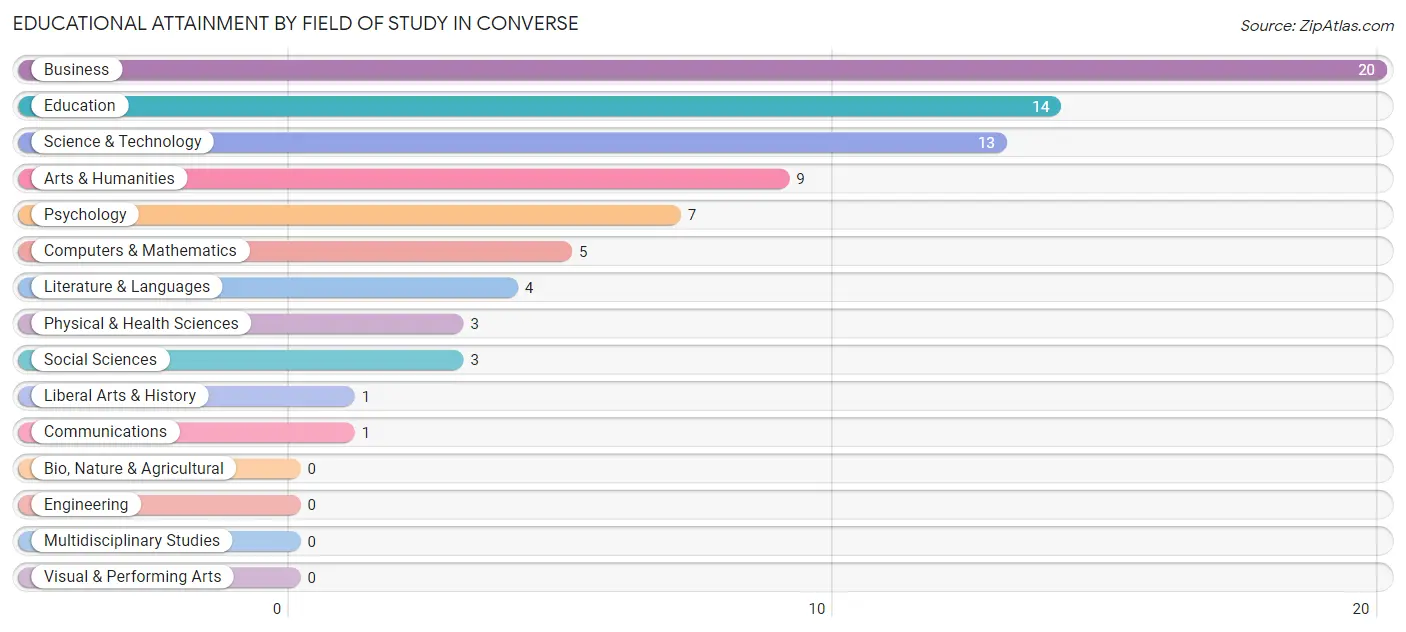
| Field of Study | # Graduates | % Graduates |
| Computers & Mathematics | 5 | 6.2% |
| Bio, Nature & Agricultural | 0 | 0.0% |
| Physical & Health Sciences | 3 | 3.7% |
| Psychology | 7 | 8.7% |
| Social Sciences | 3 | 3.7% |
| Engineering | 0 | 0.0% |
| Multidisciplinary Studies | 0 | 0.0% |
| Science & Technology | 13 | 16.3% |
| Business | 20 | 25.0% |
| Education | 14 | 17.5% |
| Literature & Languages | 4 | 5.0% |
| Liberal Arts & History | 1 | 1.3% |
| Visual & Performing Arts | 0 | 0.0% |
| Communications | 1 | 1.3% |
| Arts & Humanities | 9 | 11.3% |
| Total | 80 | 100.0% |
Transportation & Commute in Converse
Vehicle Availability by Sex in Converse
The most prevalent vehicle ownership categories in Converse are males with 2 vehicles (137, accounting for 52.1%) and females with 2 vehicles (73, making up 77.8%).
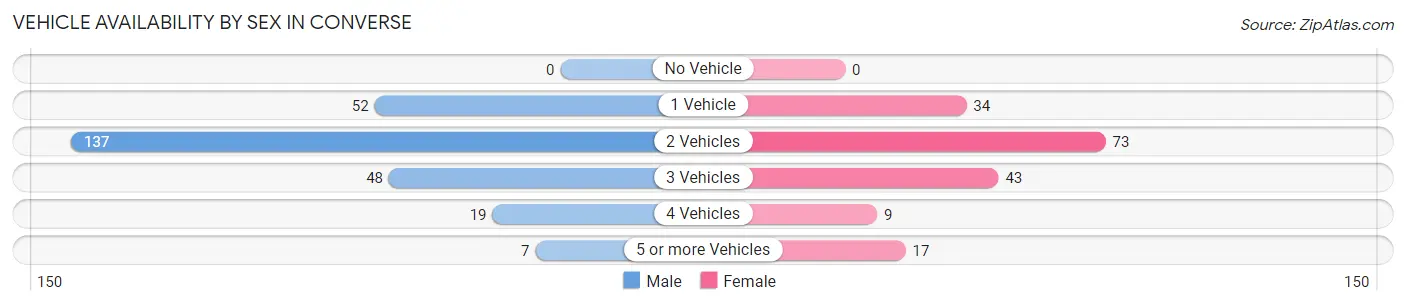
| Vehicles Available | Male | Female |
| No Vehicle | 0 (0.0%) | 0 (0.0%) |
| 1 Vehicle | 52 (19.8%) | 34 (19.3%) |
| 2 Vehicles | 137 (52.1%) | 73 (41.5%) |
| 3 Vehicles | 48 (18.2%) | 43 (24.4%) |
| 4 Vehicles | 19 (7.2%) | 9 (5.1%) |
| 5 or more Vehicles | 7 (2.7%) | 17 (9.7%) |
| Total | 263 (100.0%) | 176 (100.0%) |
Commute Time in Converse
The most frequently occuring commute durations in Converse are 30 to 34 minutes (128 commuters, 29.9%), 25 to 29 minutes (60 commuters, 14.0%), and 5 to 9 minutes (58 commuters, 13.6%).
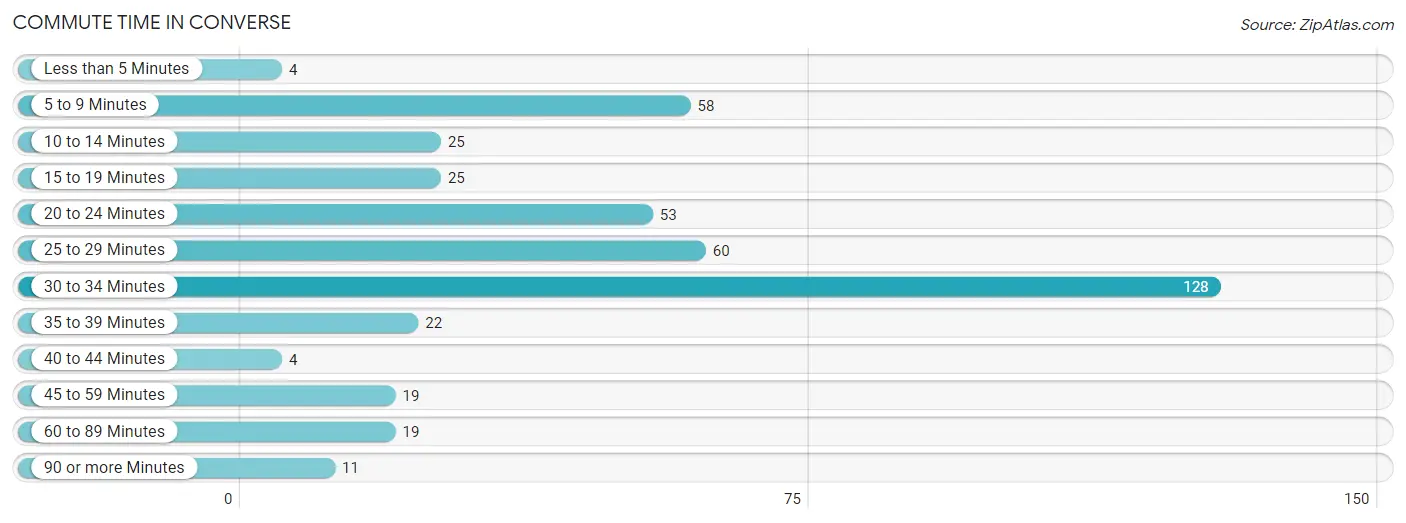
| Commute Time | # Commuters | % Commuters |
| Less than 5 Minutes | 4 | 0.9% |
| 5 to 9 Minutes | 58 | 13.6% |
| 10 to 14 Minutes | 25 | 5.8% |
| 15 to 19 Minutes | 25 | 5.8% |
| 20 to 24 Minutes | 53 | 12.4% |
| 25 to 29 Minutes | 60 | 14.0% |
| 30 to 34 Minutes | 128 | 29.9% |
| 35 to 39 Minutes | 22 | 5.1% |
| 40 to 44 Minutes | 4 | 0.9% |
| 45 to 59 Minutes | 19 | 4.4% |
| 60 to 89 Minutes | 19 | 4.4% |
| 90 or more Minutes | 11 | 2.6% |
Commute Time by Sex in Converse
The most common commute times in Converse are 30 to 34 minutes (101 commuters, 39.3%) for males and 20 to 24 minutes (38 commuters, 22.2%) for females.
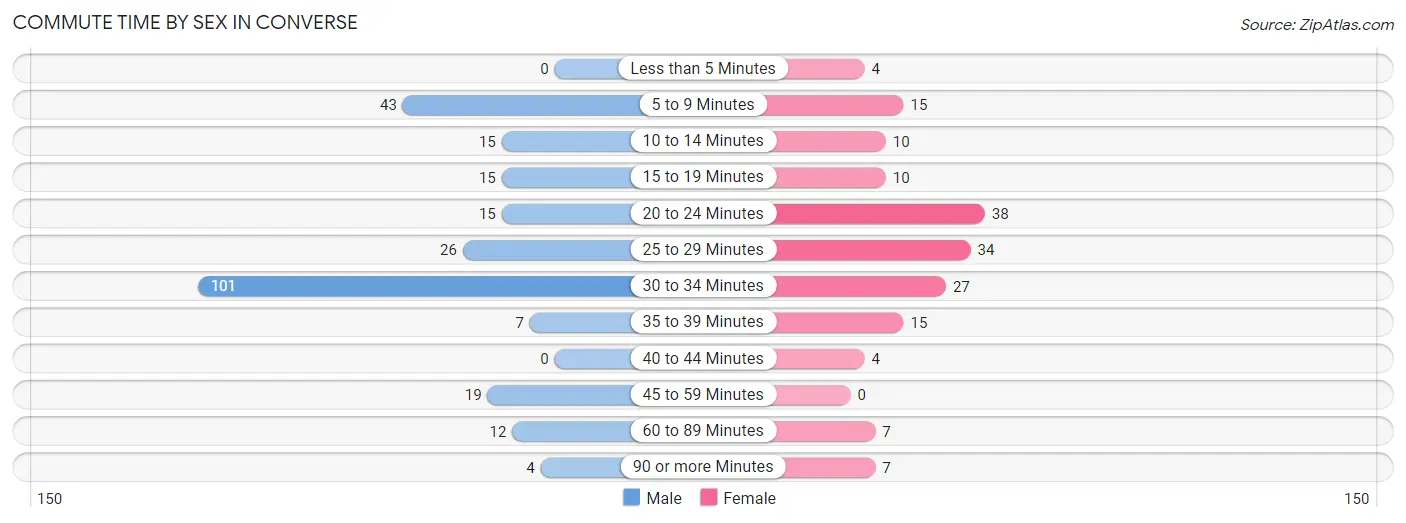
| Commute Time | Male | Female |
| Less than 5 Minutes | 0 (0.0%) | 4 (2.3%) |
| 5 to 9 Minutes | 43 (16.7%) | 15 (8.8%) |
| 10 to 14 Minutes | 15 (5.8%) | 10 (5.9%) |
| 15 to 19 Minutes | 15 (5.8%) | 10 (5.9%) |
| 20 to 24 Minutes | 15 (5.8%) | 38 (22.2%) |
| 25 to 29 Minutes | 26 (10.1%) | 34 (19.9%) |
| 30 to 34 Minutes | 101 (39.3%) | 27 (15.8%) |
| 35 to 39 Minutes | 7 (2.7%) | 15 (8.8%) |
| 40 to 44 Minutes | 0 (0.0%) | 4 (2.3%) |
| 45 to 59 Minutes | 19 (7.4%) | 0 (0.0%) |
| 60 to 89 Minutes | 12 (4.7%) | 7 (4.1%) |
| 90 or more Minutes | 4 (1.6%) | 7 (4.1%) |
Time of Departure to Work by Sex in Converse
The most frequent times of departure to work in Converse are 4:00 PM to 11:59 PM (89, 34.6%) for males and 7:30 AM to 7:59 AM (42, 24.6%) for females.
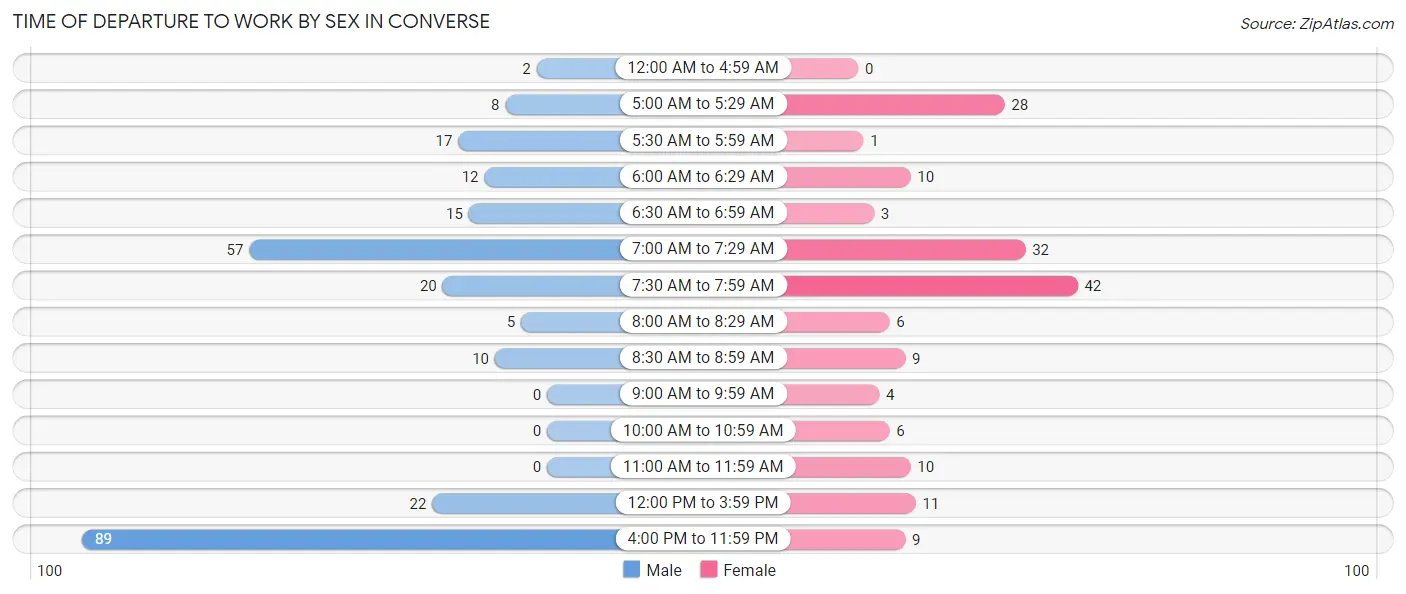
| Time of Departure | Male | Female |
| 12:00 AM to 4:59 AM | 2 (0.8%) | 0 (0.0%) |
| 5:00 AM to 5:29 AM | 8 (3.1%) | 28 (16.4%) |
| 5:30 AM to 5:59 AM | 17 (6.6%) | 1 (0.6%) |
| 6:00 AM to 6:29 AM | 12 (4.7%) | 10 (5.9%) |
| 6:30 AM to 6:59 AM | 15 (5.8%) | 3 (1.8%) |
| 7:00 AM to 7:29 AM | 57 (22.2%) | 32 (18.7%) |
| 7:30 AM to 7:59 AM | 20 (7.8%) | 42 (24.6%) |
| 8:00 AM to 8:29 AM | 5 (1.9%) | 6 (3.5%) |
| 8:30 AM to 8:59 AM | 10 (3.9%) | 9 (5.3%) |
| 9:00 AM to 9:59 AM | 0 (0.0%) | 4 (2.3%) |
| 10:00 AM to 10:59 AM | 0 (0.0%) | 6 (3.5%) |
| 11:00 AM to 11:59 AM | 0 (0.0%) | 10 (5.9%) |
| 12:00 PM to 3:59 PM | 22 (8.6%) | 11 (6.4%) |
| 4:00 PM to 11:59 PM | 89 (34.6%) | 9 (5.3%) |
| Total | 257 (100.0%) | 171 (100.0%) |
Housing Occupancy in Converse
Occupancy by Ownership in Converse
Of the total 453 dwellings in Converse, owner-occupied units account for 346 (76.4%), while renter-occupied units make up 107 (23.6%).
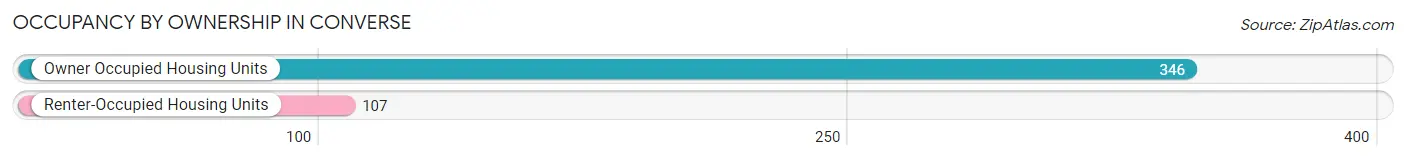
| Occupancy | # Housing Units | % Housing Units |
| Owner Occupied Housing Units | 346 | 76.4% |
| Renter-Occupied Housing Units | 107 | 23.6% |
| Total Occupied Housing Units | 453 | 100.0% |
Occupancy by Household Size in Converse
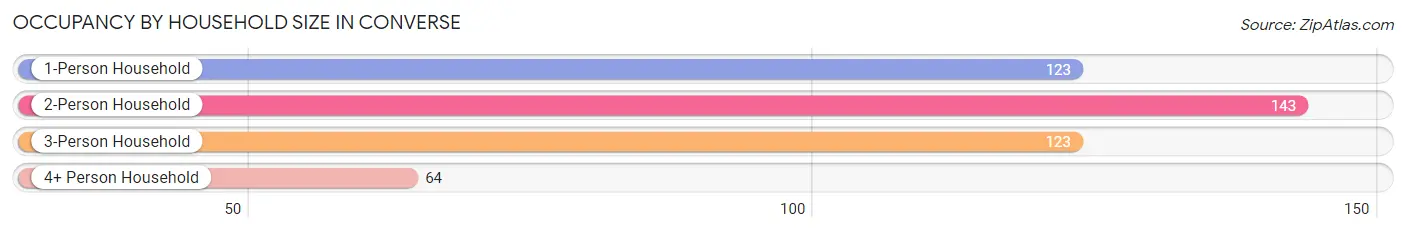
| Household Size | # Housing Units | % Housing Units |
| 1-Person Household | 123 | 27.2% |
| 2-Person Household | 143 | 31.6% |
| 3-Person Household | 123 | 27.2% |
| 4+ Person Household | 64 | 14.1% |
| Total Housing Units | 453 | 100.0% |
Occupancy by Ownership by Household Size in Converse
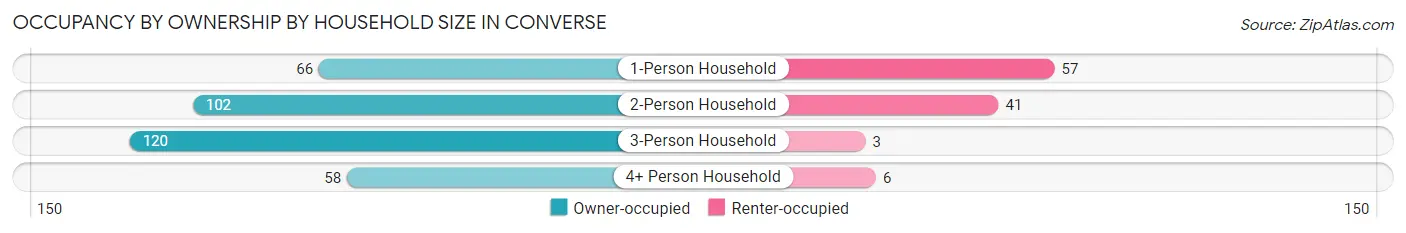
| Household Size | Owner-occupied | Renter-occupied |
| 1-Person Household | 66 (53.7%) | 57 (46.3%) |
| 2-Person Household | 102 (71.3%) | 41 (28.7%) |
| 3-Person Household | 120 (97.6%) | 3 (2.4%) |
| 4+ Person Household | 58 (90.6%) | 6 (9.4%) |
| Total Housing Units | 346 (76.4%) | 107 (23.6%) |
Occupancy by Educational Attainment in Converse
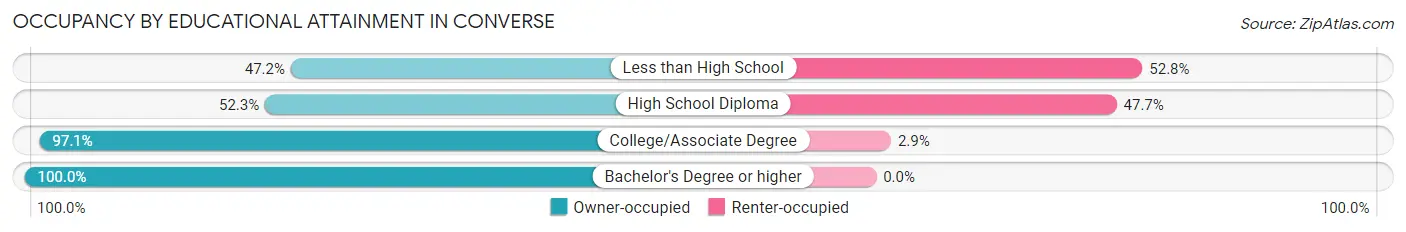
| Household Size | Owner-occupied | Renter-occupied |
| Less than High School | 17 (47.2%) | 19 (52.8%) |
| High School Diploma | 90 (52.3%) | 82 (47.7%) |
| College/Associate Degree | 199 (97.1%) | 6 (2.9%) |
| Bachelor's Degree or higher | 40 (100.0%) | 0 (0.0%) |
Occupancy by Age of Householder in Converse
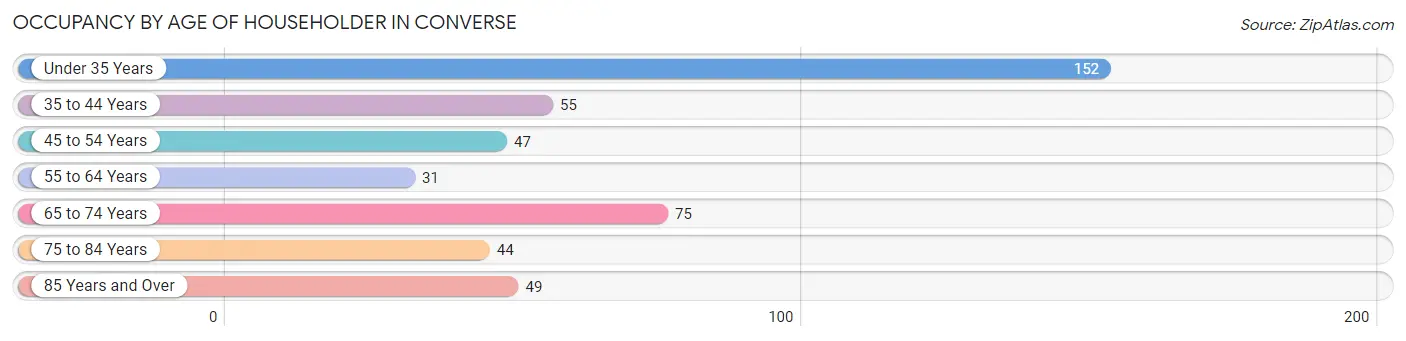
| Age Bracket | # Households | % Households |
| Under 35 Years | 152 | 33.6% |
| 35 to 44 Years | 55 | 12.1% |
| 45 to 54 Years | 47 | 10.4% |
| 55 to 64 Years | 31 | 6.8% |
| 65 to 74 Years | 75 | 16.6% |
| 75 to 84 Years | 44 | 9.7% |
| 85 Years and Over | 49 | 10.8% |
| Total | 453 | 100.0% |
Housing Finances in Converse
Median Income by Occupancy in Converse
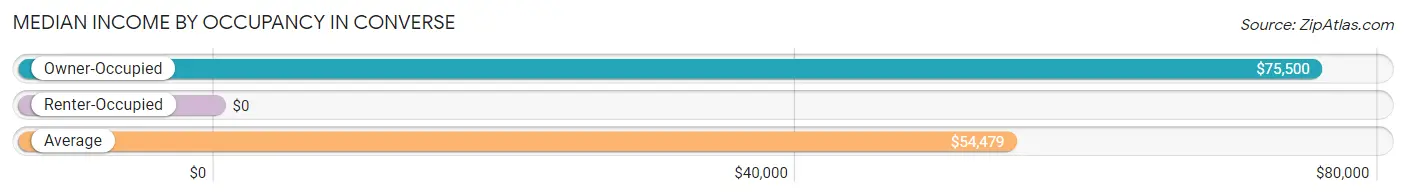
| Occupancy Type | # Households | Median Income |
| Owner-Occupied | 346 (76.4%) | $75,500 |
| Renter-Occupied | 107 (23.6%) | $0 |
| Average | 453 (100.0%) | $54,479 |
Occupancy by Householder Income Bracket in Converse
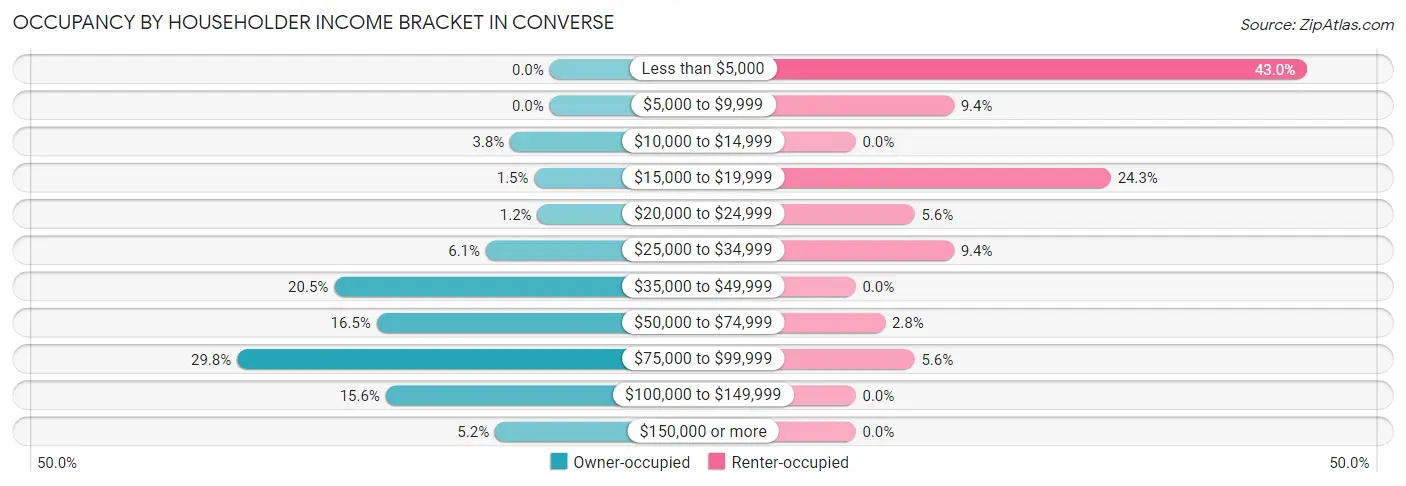
| Income Bracket | Owner-occupied | Renter-occupied |
| Less than $5,000 | 0 (0.0%) | 46 (43.0%) |
| $5,000 to $9,999 | 0 (0.0%) | 10 (9.3%) |
| $10,000 to $14,999 | 13 (3.8%) | 0 (0.0%) |
| $15,000 to $19,999 | 5 (1.5%) | 26 (24.3%) |
| $20,000 to $24,999 | 4 (1.2%) | 6 (5.6%) |
| $25,000 to $34,999 | 21 (6.1%) | 10 (9.3%) |
| $35,000 to $49,999 | 71 (20.5%) | 0 (0.0%) |
| $50,000 to $74,999 | 57 (16.5%) | 3 (2.8%) |
| $75,000 to $99,999 | 103 (29.8%) | 6 (5.6%) |
| $100,000 to $149,999 | 54 (15.6%) | 0 (0.0%) |
| $150,000 or more | 18 (5.2%) | 0 (0.0%) |
| Total | 346 (100.0%) | 107 (100.0%) |
Monthly Housing Cost Tiers in Converse
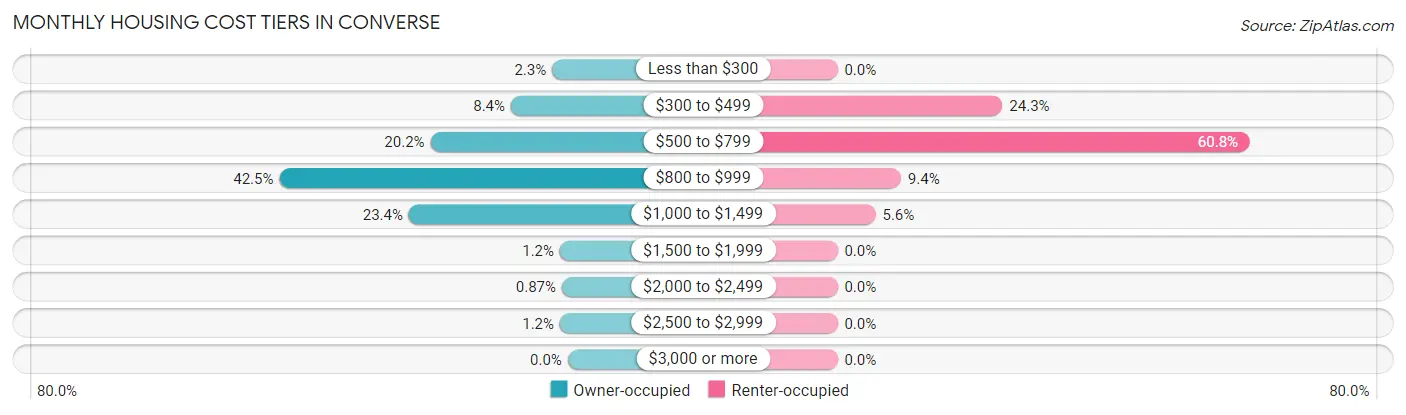
| Monthly Cost | Owner-occupied | Renter-occupied |
| Less than $300 | 8 (2.3%) | 0 (0.0%) |
| $300 to $499 | 29 (8.4%) | 26 (24.3%) |
| $500 to $799 | 70 (20.2%) | 65 (60.8%) |
| $800 to $999 | 147 (42.5%) | 10 (9.3%) |
| $1,000 to $1,499 | 81 (23.4%) | 6 (5.6%) |
| $1,500 to $1,999 | 4 (1.2%) | 0 (0.0%) |
| $2,000 to $2,499 | 3 (0.9%) | 0 (0.0%) |
| $2,500 to $2,999 | 4 (1.2%) | 0 (0.0%) |
| $3,000 or more | 0 (0.0%) | 0 (0.0%) |
| Total | 346 (100.0%) | 107 (100.0%) |
Physical Housing Characteristics in Converse
Housing Structures in Converse
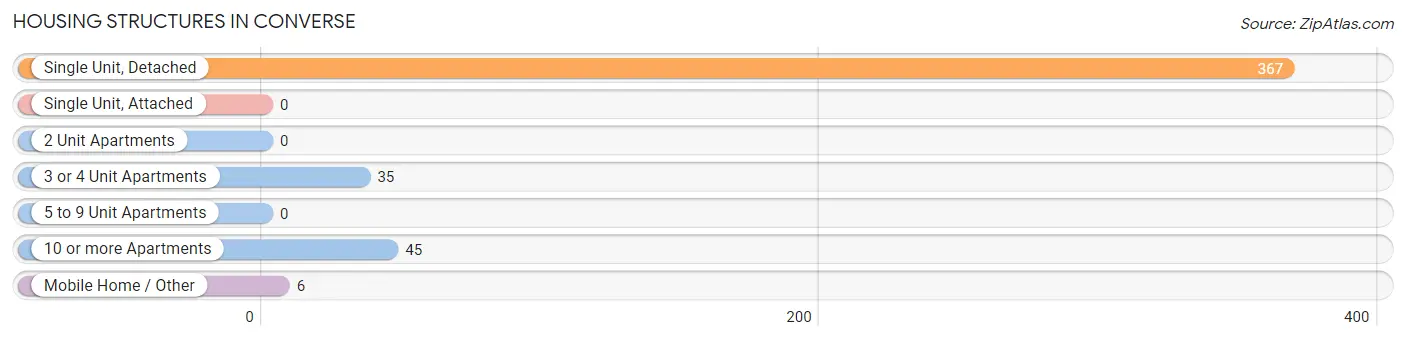
| Structure Type | # Housing Units | % Housing Units |
| Single Unit, Detached | 367 | 81.0% |
| Single Unit, Attached | 0 | 0.0% |
| 2 Unit Apartments | 0 | 0.0% |
| 3 or 4 Unit Apartments | 35 | 7.7% |
| 5 to 9 Unit Apartments | 0 | 0.0% |
| 10 or more Apartments | 45 | 9.9% |
| Mobile Home / Other | 6 | 1.3% |
| Total | 453 | 100.0% |
Housing Structures by Occupancy in Converse
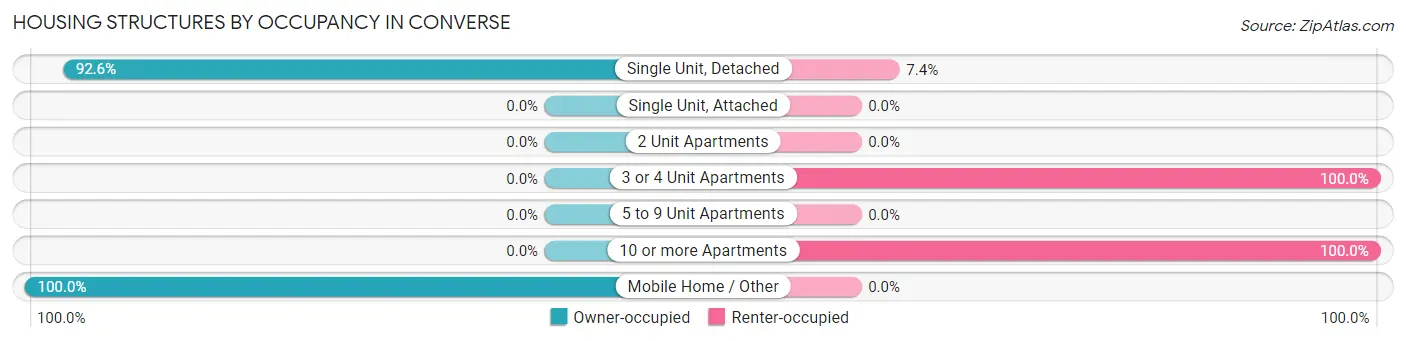
| Structure Type | Owner-occupied | Renter-occupied |
| Single Unit, Detached | 340 (92.6%) | 27 (7.4%) |
| Single Unit, Attached | 0 (0.0%) | 0 (0.0%) |
| 2 Unit Apartments | 0 (0.0%) | 0 (0.0%) |
| 3 or 4 Unit Apartments | 0 (0.0%) | 35 (100.0%) |
| 5 to 9 Unit Apartments | 0 (0.0%) | 0 (0.0%) |
| 10 or more Apartments | 0 (0.0%) | 45 (100.0%) |
| Mobile Home / Other | 6 (100.0%) | 0 (0.0%) |
| Total | 346 (76.4%) | 107 (23.6%) |
Housing Structures by Number of Rooms in Converse
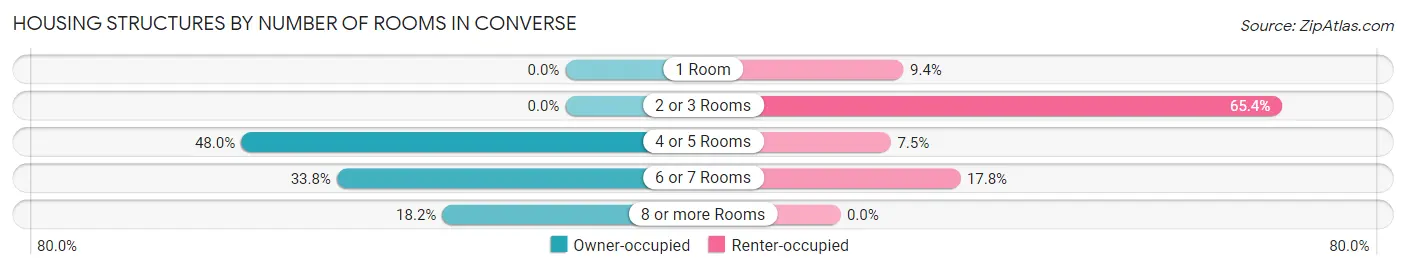
| Number of Rooms | Owner-occupied | Renter-occupied |
| 1 Room | 0 (0.0%) | 10 (9.3%) |
| 2 or 3 Rooms | 0 (0.0%) | 70 (65.4%) |
| 4 or 5 Rooms | 166 (48.0%) | 8 (7.5%) |
| 6 or 7 Rooms | 117 (33.8%) | 19 (17.8%) |
| 8 or more Rooms | 63 (18.2%) | 0 (0.0%) |
| Total | 346 (100.0%) | 107 (100.0%) |
Housing Structure by Heating Type in Converse
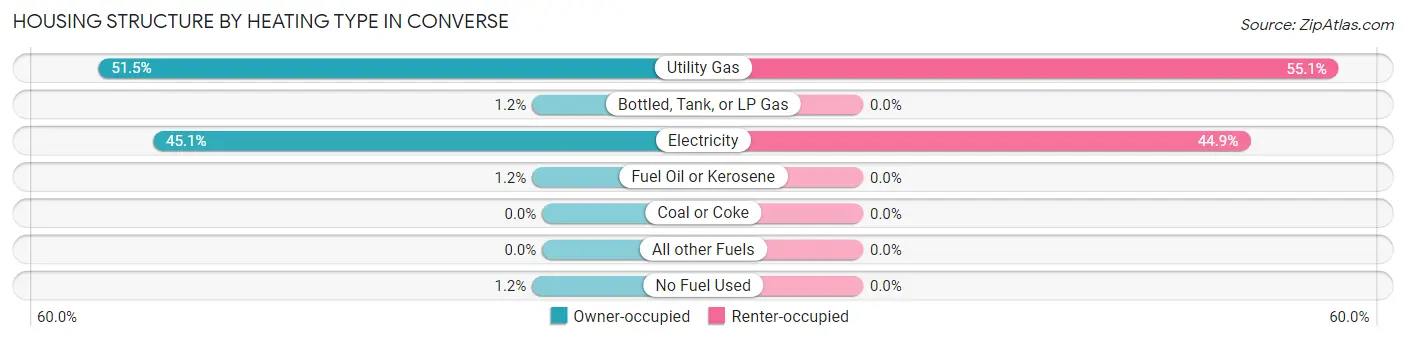
| Heating Type | Owner-occupied | Renter-occupied |
| Utility Gas | 178 (51.4%) | 59 (55.1%) |
| Bottled, Tank, or LP Gas | 4 (1.2%) | 0 (0.0%) |
| Electricity | 156 (45.1%) | 48 (44.9%) |
| Fuel Oil or Kerosene | 4 (1.2%) | 0 (0.0%) |
| Coal or Coke | 0 (0.0%) | 0 (0.0%) |
| All other Fuels | 0 (0.0%) | 0 (0.0%) |
| No Fuel Used | 4 (1.2%) | 0 (0.0%) |
| Total | 346 (100.0%) | 107 (100.0%) |
Household Vehicle Usage in Converse
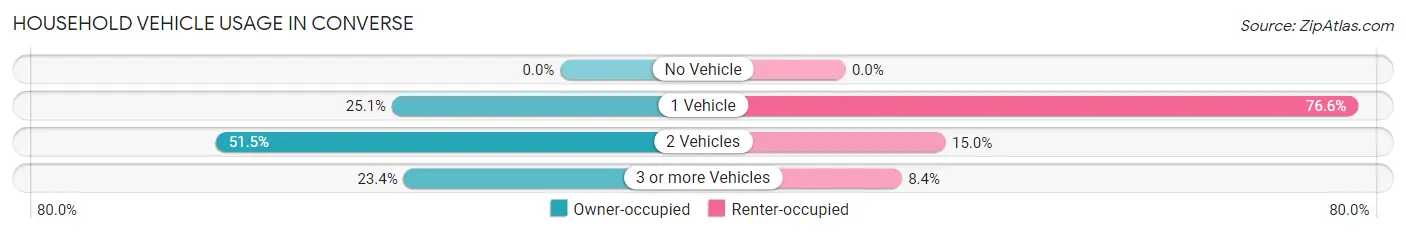
| Vehicles per Household | Owner-occupied | Renter-occupied |
| No Vehicle | 0 (0.0%) | 0 (0.0%) |
| 1 Vehicle | 87 (25.1%) | 82 (76.6%) |
| 2 Vehicles | 178 (51.4%) | 16 (14.9%) |
| 3 or more Vehicles | 81 (23.4%) | 9 (8.4%) |
| Total | 346 (100.0%) | 107 (100.0%) |
Real Estate & Mortgages in Converse
Real Estate and Mortgage Overview in Converse
| Characteristic | Without Mortgage | With Mortgage |
| Housing Units | 86 | 260 |
| Median Property Value | $95,600 | $93,200 |
| Median Household Income | $52,708 | $12 |
| Monthly Housing Costs | $518 | $0 |
| Real Estate Taxes | $683 | $25 |
Property Value by Mortgage Status in Converse
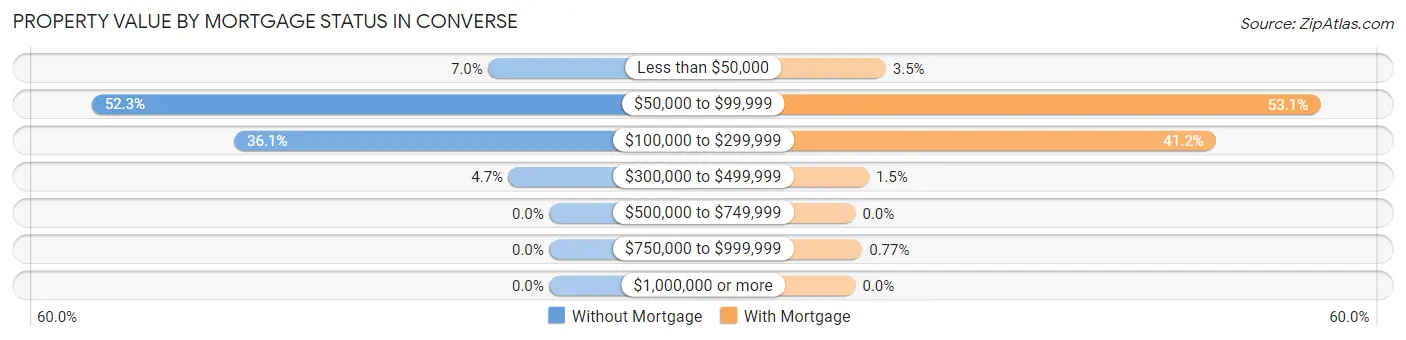
| Property Value | Without Mortgage | With Mortgage |
| Less than $50,000 | 6 (7.0%) | 9 (3.5%) |
| $50,000 to $99,999 | 45 (52.3%) | 138 (53.1%) |
| $100,000 to $299,999 | 31 (36.0%) | 107 (41.1%) |
| $300,000 to $499,999 | 4 (4.6%) | 4 (1.5%) |
| $500,000 to $749,999 | 0 (0.0%) | 0 (0.0%) |
| $750,000 to $999,999 | 0 (0.0%) | 2 (0.8%) |
| $1,000,000 or more | 0 (0.0%) | 0 (0.0%) |
| Total | 86 (100.0%) | 260 (100.0%) |
Household Income by Mortgage Status in Converse
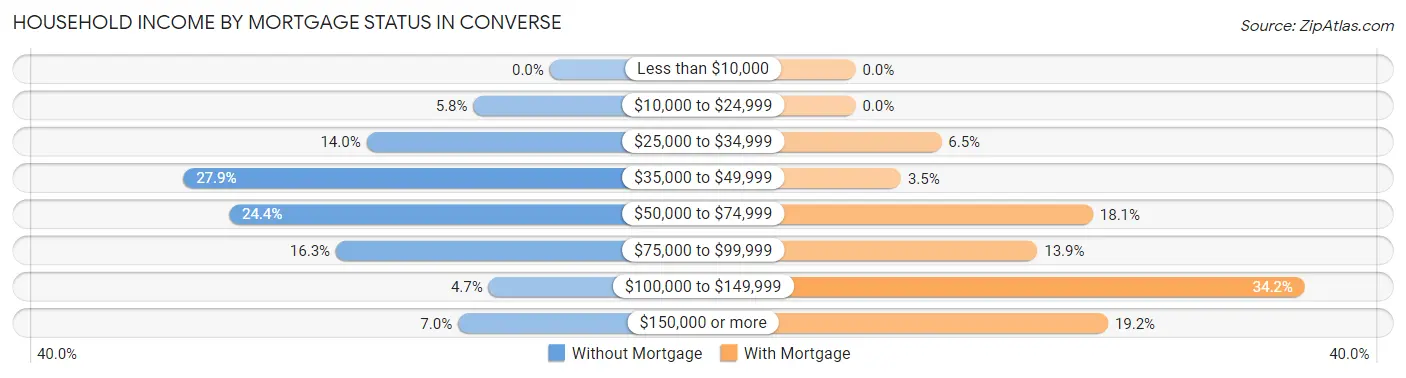
| Household Income | Without Mortgage | With Mortgage |
| Less than $10,000 | 0 (0.0%) | 0 (0.0%) |
| $10,000 to $24,999 | 5 (5.8%) | 0 (0.0%) |
| $25,000 to $34,999 | 12 (14.0%) | 17 (6.5%) |
| $35,000 to $49,999 | 24 (27.9%) | 9 (3.5%) |
| $50,000 to $74,999 | 21 (24.4%) | 47 (18.1%) |
| $75,000 to $99,999 | 14 (16.3%) | 36 (13.9%) |
| $100,000 to $149,999 | 4 (4.6%) | 89 (34.2%) |
| $150,000 or more | 6 (7.0%) | 50 (19.2%) |
| Total | 86 (100.0%) | 260 (100.0%) |
Property Value to Household Income Ratio in Converse
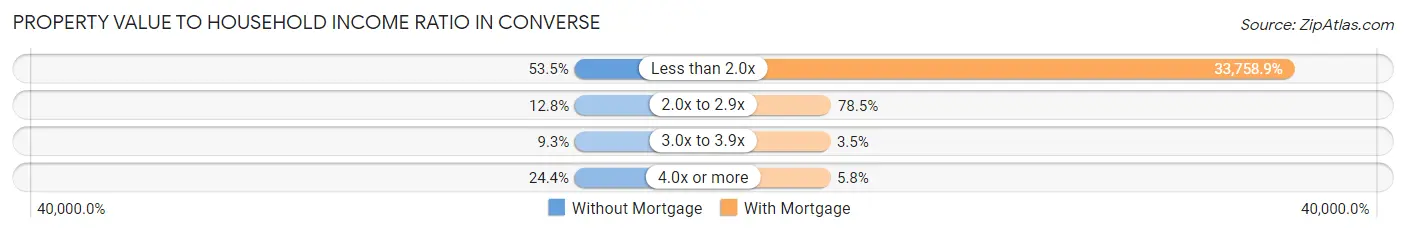
| Value-to-Income Ratio | Without Mortgage | With Mortgage |
| Less than 2.0x | 46 (53.5%) | 87,773 (33,758.9%) |
| 2.0x to 2.9x | 11 (12.8%) | 204 (78.5%) |
| 3.0x to 3.9x | 8 (9.3%) | 9 (3.5%) |
| 4.0x or more | 21 (24.4%) | 15 (5.8%) |
| Total | 86 (100.0%) | 260 (100.0%) |
Real Estate Taxes by Mortgage Status in Converse
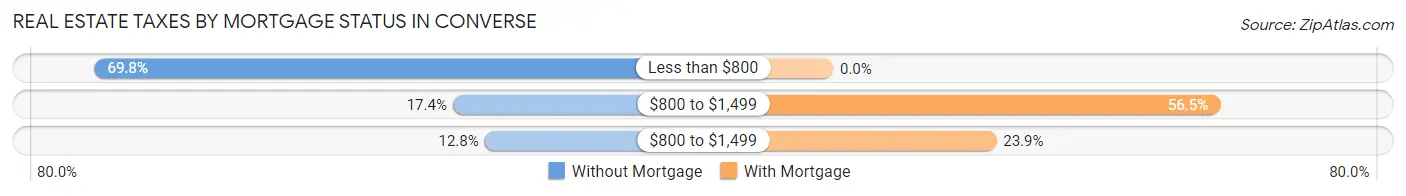
| Property Taxes | Without Mortgage | With Mortgage |
| Less than $800 | 60 (69.8%) | 0 (0.0%) |
| $800 to $1,499 | 15 (17.4%) | 147 (56.5%) |
| $800 to $1,499 | 11 (12.8%) | 62 (23.8%) |
| Total | 86 (100.0%) | 260 (100.0%) |
Health & Disability in Converse
Health Insurance Coverage by Age in Converse
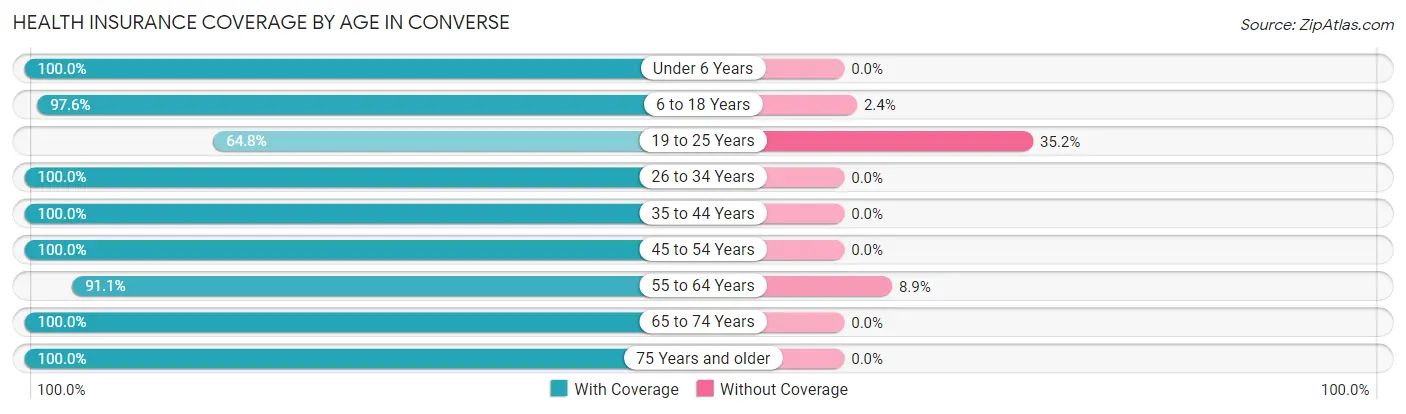
| Age Bracket | With Coverage | Without Coverage |
| Under 6 Years | 82 (100.0%) | 0 (0.0%) |
| 6 to 18 Years | 124 (97.6%) | 3 (2.4%) |
| 19 to 25 Years | 46 (64.8%) | 25 (35.2%) |
| 26 to 34 Years | 190 (100.0%) | 0 (0.0%) |
| 35 to 44 Years | 112 (100.0%) | 0 (0.0%) |
| 45 to 54 Years | 101 (100.0%) | 0 (0.0%) |
| 55 to 64 Years | 41 (91.1%) | 4 (8.9%) |
| 65 to 74 Years | 115 (100.0%) | 0 (0.0%) |
| 75 Years and older | 124 (100.0%) | 0 (0.0%) |
| Total | 935 (96.7%) | 32 (3.3%) |
Health Insurance Coverage by Citizenship Status in Converse
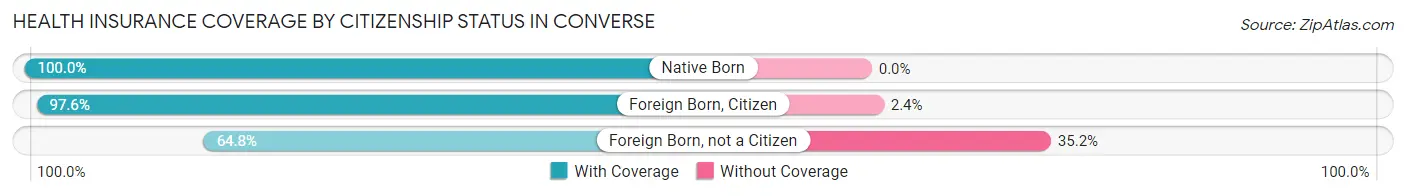
| Citizenship Status | With Coverage | Without Coverage |
| Native Born | 82 (100.0%) | 0 (0.0%) |
| Foreign Born, Citizen | 124 (97.6%) | 3 (2.4%) |
| Foreign Born, not a Citizen | 46 (64.8%) | 25 (35.2%) |
Health Insurance Coverage by Household Income in Converse
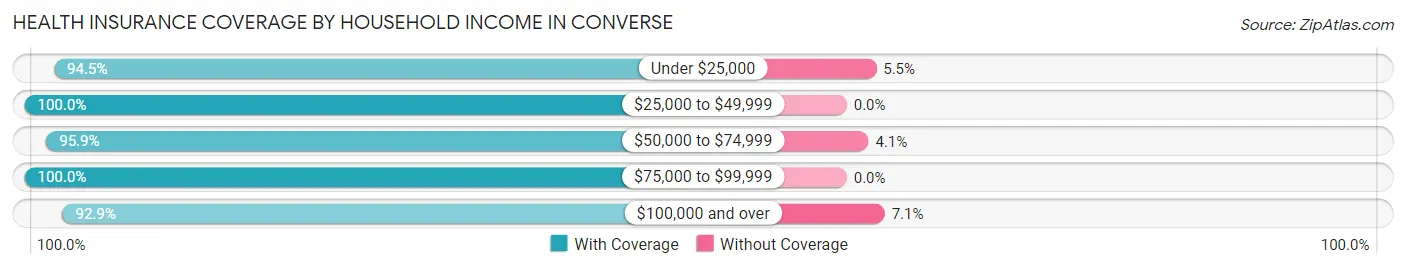
| Household Income | With Coverage | Without Coverage |
| Under $25,000 | 171 (94.5%) | 10 (5.5%) |
| $25,000 to $49,999 | 163 (100.0%) | 0 (0.0%) |
| $50,000 to $74,999 | 165 (95.9%) | 7 (4.1%) |
| $75,000 to $99,999 | 240 (100.0%) | 0 (0.0%) |
| $100,000 and over | 196 (92.9%) | 15 (7.1%) |
Public vs Private Health Insurance Coverage by Age in Converse
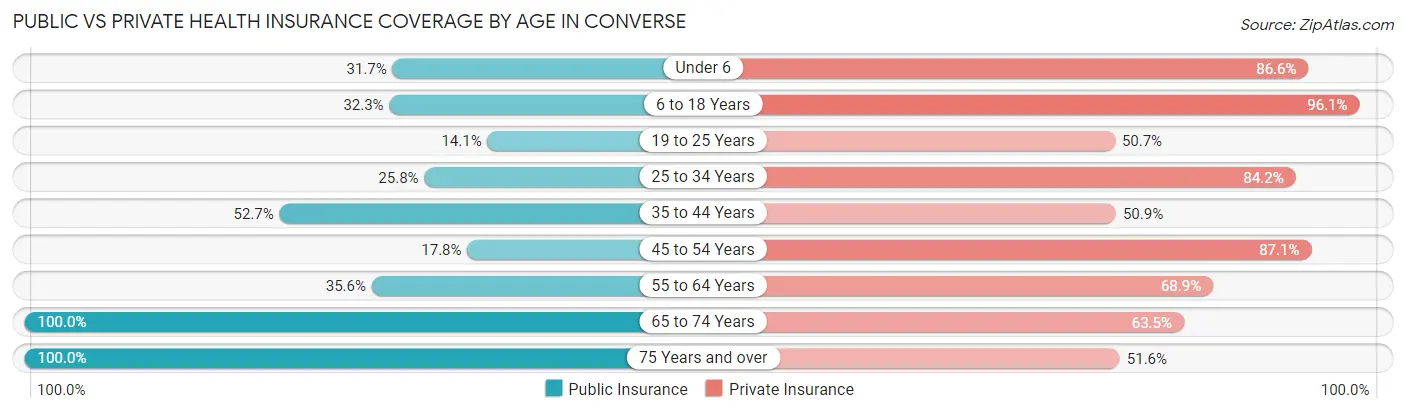
| Age Bracket | Public Insurance | Private Insurance |
| Under 6 | 26 (31.7%) | 71 (86.6%) |
| 6 to 18 Years | 41 (32.3%) | 122 (96.1%) |
| 19 to 25 Years | 10 (14.1%) | 36 (50.7%) |
| 25 to 34 Years | 49 (25.8%) | 160 (84.2%) |
| 35 to 44 Years | 59 (52.7%) | 57 (50.9%) |
| 45 to 54 Years | 18 (17.8%) | 88 (87.1%) |
| 55 to 64 Years | 16 (35.6%) | 31 (68.9%) |
| 65 to 74 Years | 115 (100.0%) | 73 (63.5%) |
| 75 Years and over | 124 (100.0%) | 64 (51.6%) |
| Total | 458 (47.4%) | 702 (72.6%) |
Disability Status by Sex by Age in Converse
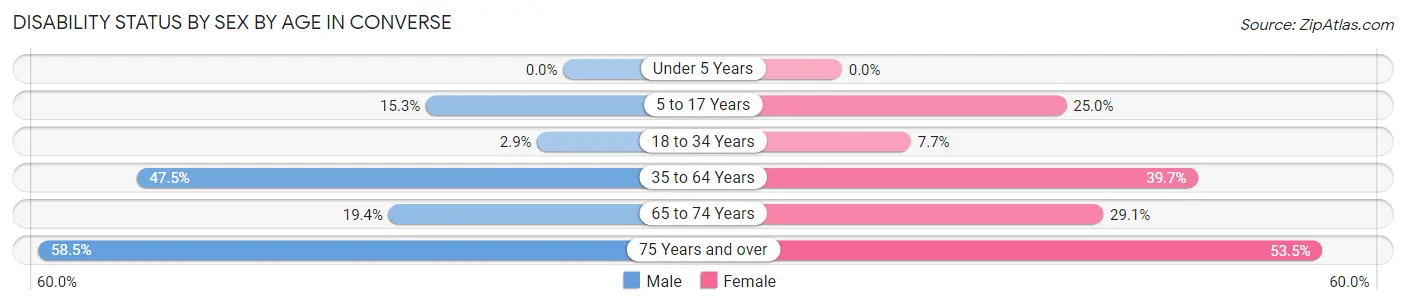
| Age Bracket | Male | Female |
| Under 5 Years | 0 (0.0%) | 0 (0.0%) |
| 5 to 17 Years | 11 (15.3%) | 19 (25.0%) |
| 18 to 34 Years | 5 (2.9%) | 7 (7.7%) |
| 35 to 64 Years | 58 (47.5%) | 54 (39.7%) |
| 65 to 74 Years | 7 (19.4%) | 23 (29.1%) |
| 75 Years and over | 31 (58.5%) | 38 (53.5%) |
Disability Class by Sex by Age in Converse
Disability Class: Hearing Difficulty
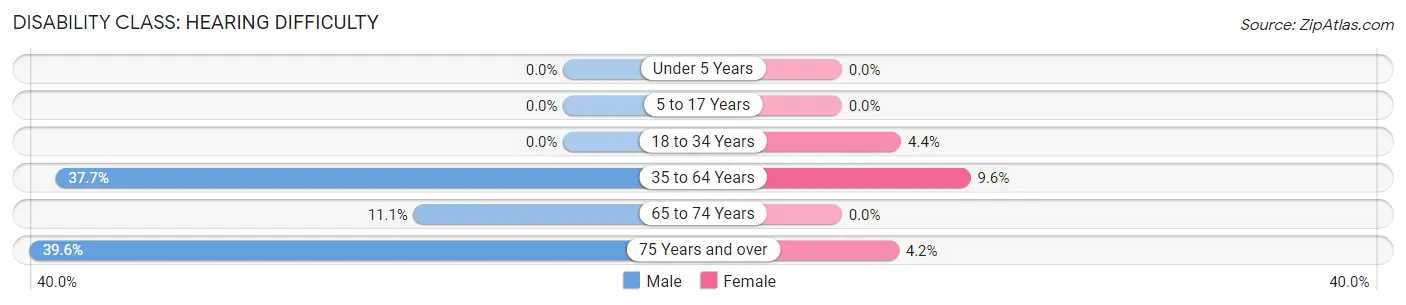
| Age Bracket | Male | Female |
| Under 5 Years | 0 (0.0%) | 0 (0.0%) |
| 5 to 17 Years | 0 (0.0%) | 0 (0.0%) |
| 18 to 34 Years | 0 (0.0%) | 4 (4.4%) |
| 35 to 64 Years | 46 (37.7%) | 13 (9.6%) |
| 65 to 74 Years | 4 (11.1%) | 0 (0.0%) |
| 75 Years and over | 21 (39.6%) | 3 (4.2%) |
Disability Class: Vision Difficulty
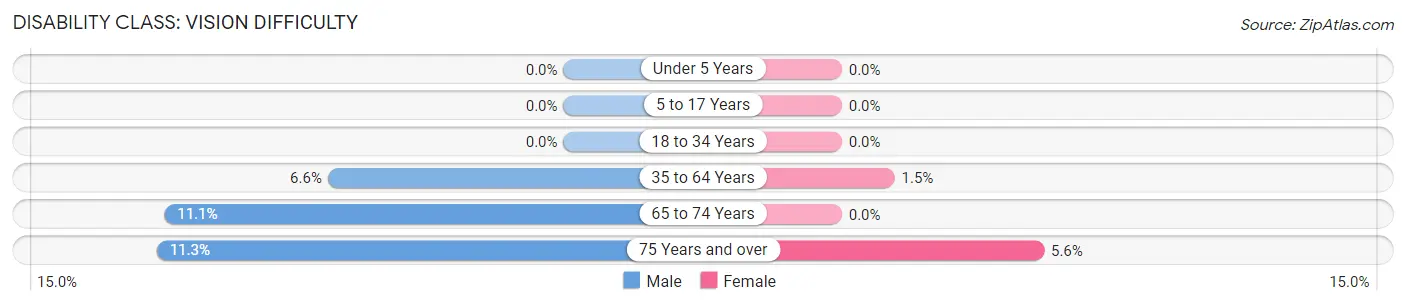
| Age Bracket | Male | Female |
| Under 5 Years | 0 (0.0%) | 0 (0.0%) |
| 5 to 17 Years | 0 (0.0%) | 0 (0.0%) |
| 18 to 34 Years | 0 (0.0%) | 0 (0.0%) |
| 35 to 64 Years | 8 (6.6%) | 2 (1.5%) |
| 65 to 74 Years | 4 (11.1%) | 0 (0.0%) |
| 75 Years and over | 6 (11.3%) | 4 (5.6%) |
Disability Class: Cognitive Difficulty
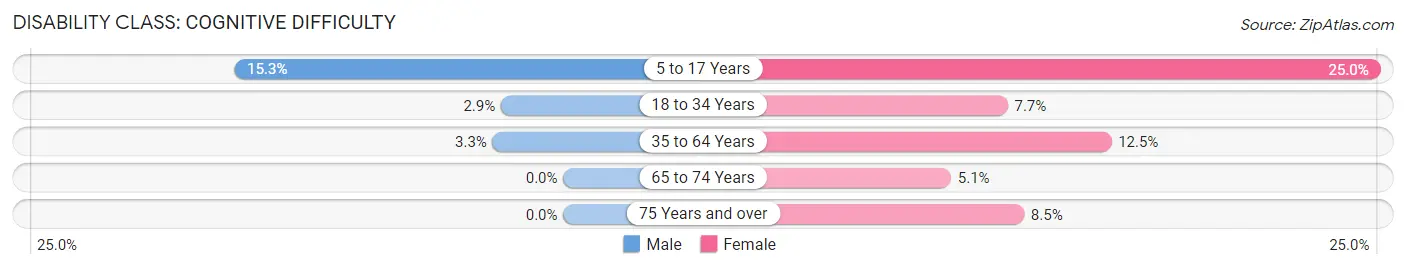
| Age Bracket | Male | Female |
| 5 to 17 Years | 11 (15.3%) | 19 (25.0%) |
| 18 to 34 Years | 5 (2.9%) | 7 (7.7%) |
| 35 to 64 Years | 4 (3.3%) | 17 (12.5%) |
| 65 to 74 Years | 0 (0.0%) | 4 (5.1%) |
| 75 Years and over | 0 (0.0%) | 6 (8.5%) |
Disability Class: Ambulatory Difficulty
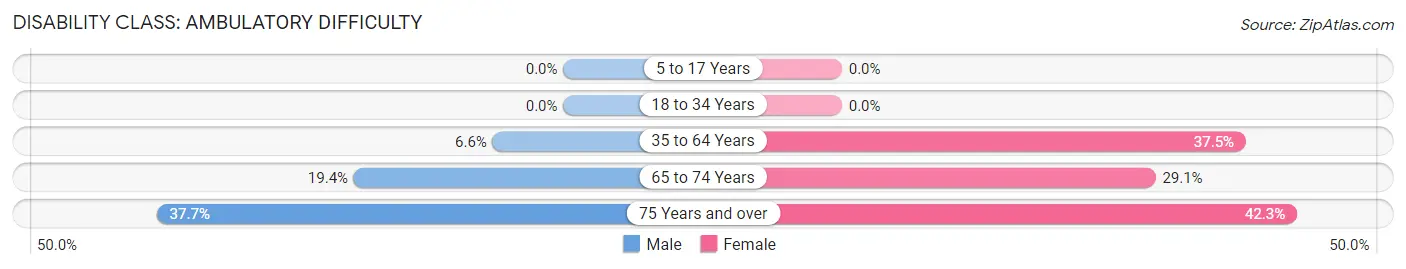
| Age Bracket | Male | Female |
| 5 to 17 Years | 0 (0.0%) | 0 (0.0%) |
| 18 to 34 Years | 0 (0.0%) | 0 (0.0%) |
| 35 to 64 Years | 8 (6.6%) | 51 (37.5%) |
| 65 to 74 Years | 7 (19.4%) | 23 (29.1%) |
| 75 Years and over | 20 (37.7%) | 30 (42.2%) |
Disability Class: Self-Care Difficulty
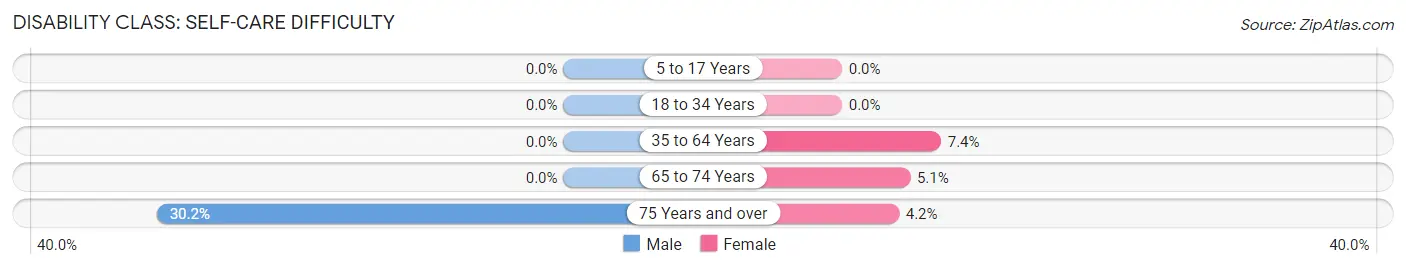
| Age Bracket | Male | Female |
| 5 to 17 Years | 0 (0.0%) | 0 (0.0%) |
| 18 to 34 Years | 0 (0.0%) | 0 (0.0%) |
| 35 to 64 Years | 0 (0.0%) | 10 (7.3%) |
| 65 to 74 Years | 0 (0.0%) | 4 (5.1%) |
| 75 Years and over | 16 (30.2%) | 3 (4.2%) |
Technology Access in Converse
Computing Device Access in Converse
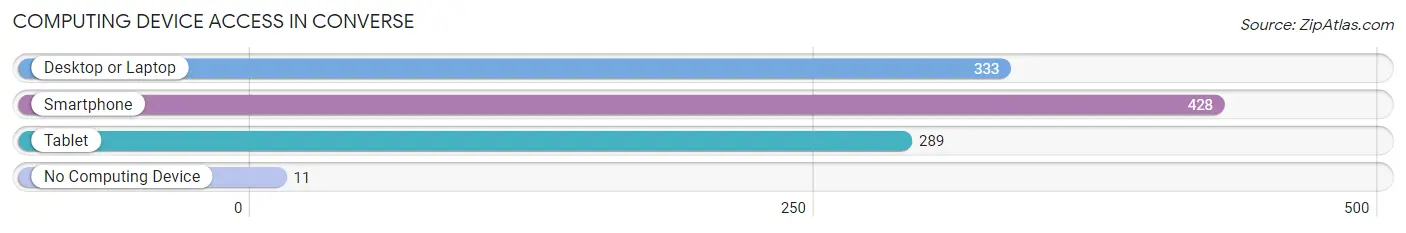
| Device Type | # Households | % Households |
| Desktop or Laptop | 333 | 73.5% |
| Smartphone | 428 | 94.5% |
| Tablet | 289 | 63.8% |
| No Computing Device | 11 | 2.4% |
| Total | 453 | 100.0% |
Internet Access in Converse
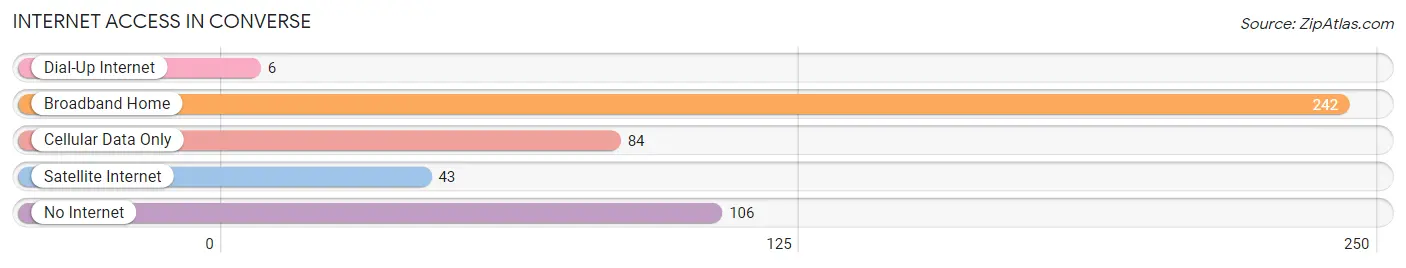
| Internet Type | # Households | % Households |
| Dial-Up Internet | 6 | 1.3% |
| Broadband Home | 242 | 53.4% |
| Cellular Data Only | 84 | 18.5% |
| Satellite Internet | 43 | 9.5% |
| No Internet | 106 | 23.4% |
| Total | 453 | 100.0% |
Converse Summary
Converse, Indiana is a small town located in Miami County, Indiana. It is situated in the Wabash River Valley, approximately 25 miles north of Indianapolis. The town was founded in 1837 and has a population of approximately 1,500 people.
History
Converse was founded in 1837 by a group of settlers from Ohio. The town was named after the Converse family, who were among the first settlers. The town was originally a farming community, but it soon developed into a small industrial center. The first industry in Converse was a sawmill, which was built in 1845. The sawmill was followed by a gristmill, a woolen mill, and a furniture factory.
In the late 19th century, Converse became a popular tourist destination. The town was known for its mineral springs, which were believed to have healing properties. The mineral springs attracted visitors from all over the country, and the town became known as the “Spa of the Wabash Valley”.
Geography
Converse is located in the Wabash River Valley, approximately 25 miles north of Indianapolis. The town is situated on the banks of the Wabash River, and is surrounded by rolling hills and farmland. The town is located in a temperate climate, with hot summers and cold winters.
Economy
Converse’s economy is largely based on agriculture and tourism. The town is home to several small businesses, including a grocery store, a hardware store, and a restaurant. The town also has a small manufacturing sector, which produces furniture and other wood products.
The town is also home to several tourist attractions, including the Converse Mineral Springs, the Converse Opera House, and the Converse Museum. The town is also home to several festivals, including the Converse County Fair and the Converse Music Festival.
Demographics
As of the 2010 census, Converse had a population of 1,500 people. The town is predominantly white, with a small African American population. The median household income in Converse is $37,000, and the median home value is $90,000.
Conclusion
Converse, Indiana is a small town located in Miami County, Indiana. It was founded in 1837 and has a population of approximately 1,500 people. The town’s economy is largely based on agriculture and tourism, and it is home to several small businesses and tourist attractions. The town is predominantly white, with a small African American population. Converse is a charming town with a rich history and a bright future.
Common Questions
What is Per Capita Income in Converse?
Per Capita income in Converse is $26,901.
What is the Median Family Income in Converse?
Median Family Income in Converse is $57,274.
What is the Median Household income in Converse?
Median Household Income in Converse is $54,479.
What is Income or Wage Gap in Converse?
Income or Wage Gap in Converse is 26.5%.
Women in Converse earn 73.5 cents for every dollar earned by a man.
What is Inequality or Gini Index in Converse?
Inequality or Gini Index in Converse is 0.41.
What is the Total Population of Converse?
Total Population of Converse is 967.
What is the Total Male Population of Converse?
Total Male Population of Converse is 485.
What is the Total Female Population of Converse?
Total Female Population of Converse is 482.
What is the Ratio of Males per 100 Females in Converse?
There are 100.62 Males per 100 Females in Converse.
What is the Ratio of Females per 100 Males in Converse?
There are 99.38 Females per 100 Males in Converse.
What is the Median Population Age in Converse?
Median Population Age in Converse is 35.3 Years.
What is the Average Family Size in Converse
Average Family Size in Converse is 2.5 People.
What is the Average Household Size in Converse
Average Household Size in Converse is 2.1 People.
How Large is the Labor Force in Converse?
There are 443 People in the Labor Forcein in Converse.
What is the Percentage of People in the Labor Force in Converse?
55.8% of People are in the Labor Force in Converse.
What is the Unemployment Rate in Converse?
Unemployment Rate in Converse is 0.9%.