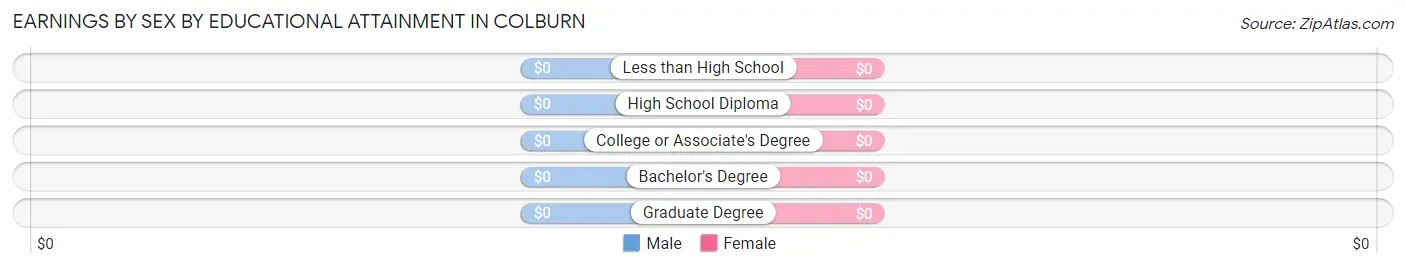
Earnings by Sex by Educational Attainment in Colburn
Educational Attainment
Male Income
Female Income
Less than High School
-
-
High School Diploma
-
-
College or Associate's Degree
-
-
Bachelor's Degree
-
-
Graduate Degree
-
-
Total
-
-
Family Income in Colburn
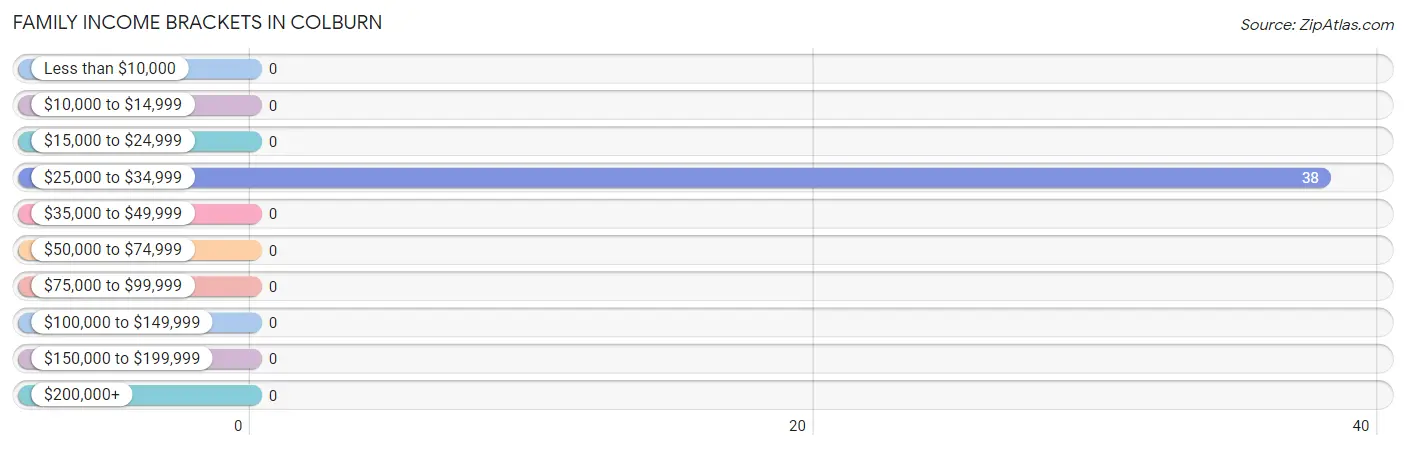
Family Income Brackets in Colburn
According to the Colburn family income data, there are 38 families falling into the $25,000 to $34,999 income range, which is the most common income bracket and makes up 100.0% of all families.
Income Bracket
# Families
% Families
Less than $10,000
0
0.0%
$10,000 to $14,999
0
0.0%
$15,000 to $24,999
0
0.0%
$25,000 to $34,999
38
100.0%
$35,000 to $49,999
0
0.0%
$50,000 to $74,999
0
0.0%
$75,000 to $99,999
0
0.0%
$100,000 to $149,999
0
0.0%
$150,000 to $199,999
0
0.0%
$200,000+
0
0.0%
Family Income by Famaliy Size in Colburn
Income Bracket
# Families
Median Income
2-Person Families
38 (100.0%)
$0
3-Person Families
0 (0.0%)
$0
4-Person Families
0 (0.0%)
$0
5-Person Families
0 (0.0%)
$0
6-Person Families
0 (0.0%)
$0
7+ Person Families
0 (0.0%)
$0
Total
38 (100.0%)
$0
Family Income by Number of Earners in Colburn
Number of Earners
# Families
Median Income
No Earners
0 (0.0%)
$0
1 Earner
38 (100.0%)
$0
2 Earners
0 (0.0%)
$0
3+ Earners
0 (0.0%)
$0
Total
38 (100.0%)
$0
Household Income in Colburn
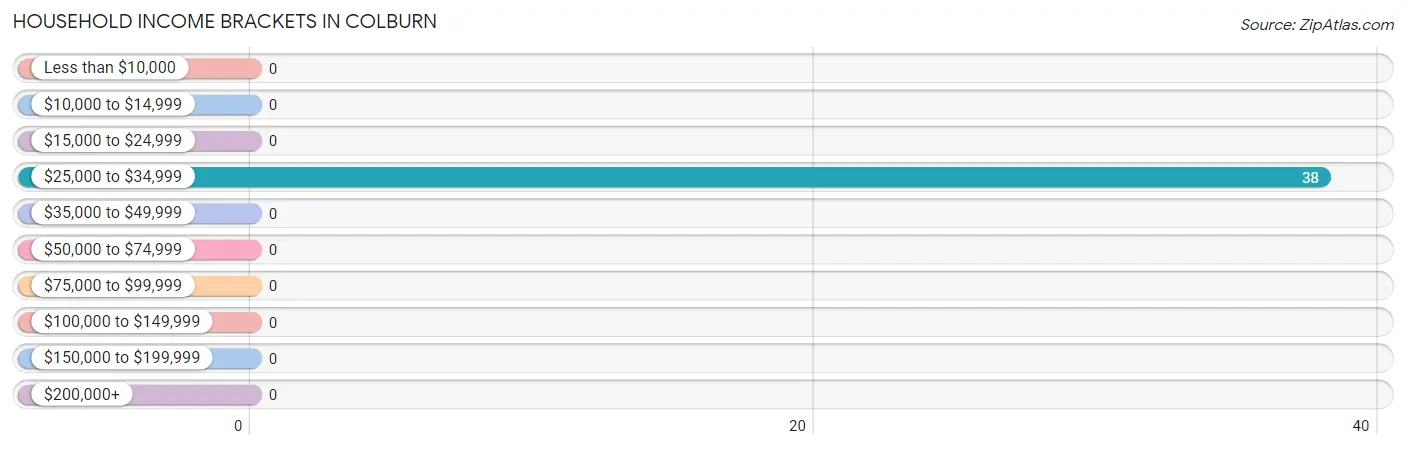
Household Income Brackets in Colburn
With 38 households falling in the category, the $25,000 to $34,999 income range is the most frequent in Colburn, accounting for 100.0% of all households.
Income Bracket
# Households
% Households
Less than $10,000
0
0.0%
$10,000 to $14,999
0
0.0%
$15,000 to $24,999
0
0.0%
$25,000 to $34,999
38
100.0%
$35,000 to $49,999
0
0.0%
$50,000 to $74,999
0
0.0%
$75,000 to $99,999
0
0.0%
$100,000 to $149,999
0
0.0%
$150,000 to $199,999
0
0.0%
$200,000+
0
0.0%
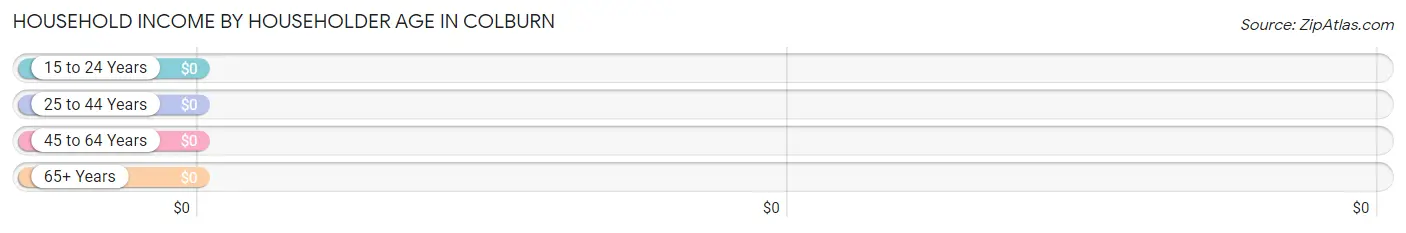
Household Income by Householder Age in Colburn
Income Bracket
# Households
Median Income
15 to 24 Years
0 (0.0%)
$0
25 to 44 Years
0 (0.0%)
$0
45 to 64 Years
38 (100.0%)
$0
65+ Years
0 (0.0%)
$0
Total
38 (100.0%)
$0
Poverty in Colburn
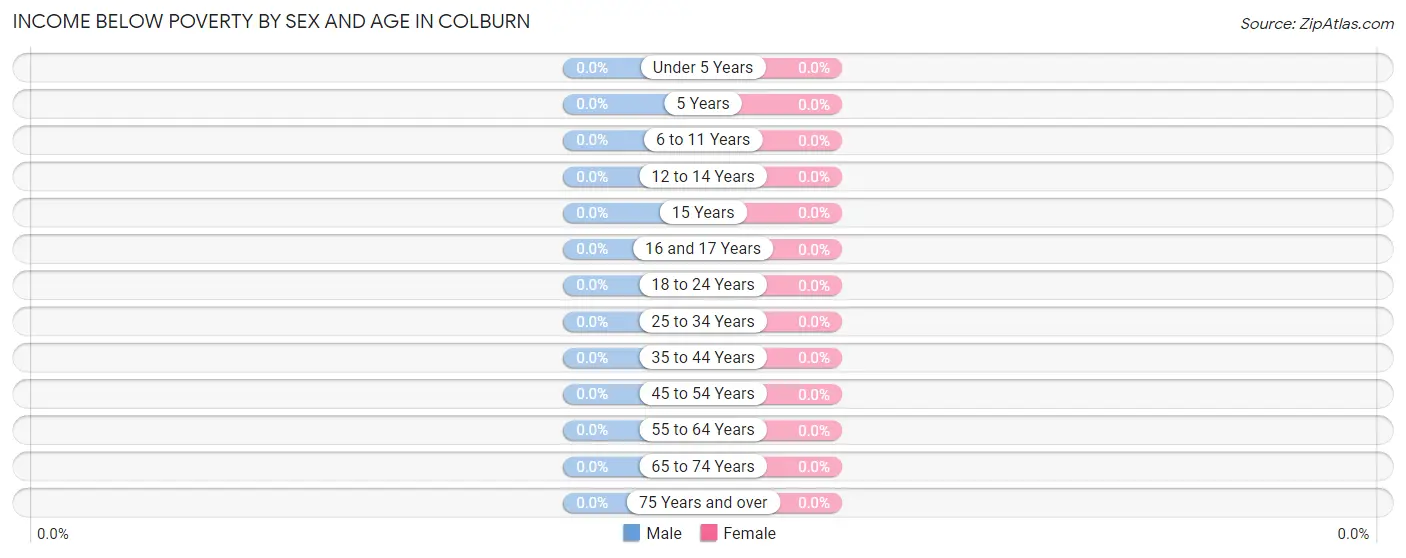
Income Below Poverty by Sex and Age in Colburn
Age Bracket
Male
Female
Under 5 Years
0 (0.0%)
0 (0.0%)
5 Years
0 (0.0%)
0 (0.0%)
6 to 11 Years
0 (0.0%)
0 (0.0%)
12 to 14 Years
0 (0.0%)
0 (0.0%)
15 Years
0 (0.0%)
0 (0.0%)
16 and 17 Years
0 (0.0%)
0 (0.0%)
18 to 24 Years
0 (0.0%)
0 (0.0%)
25 to 34 Years
0 (0.0%)
0 (0.0%)
35 to 44 Years
0 (0.0%)
0 (0.0%)
45 to 54 Years
0 (0.0%)
0 (0.0%)
55 to 64 Years
0 (0.0%)
0 (0.0%)
65 to 74 Years
0 (0.0%)
0 (0.0%)
75 Years and over
0 (0.0%)
0 (0.0%)
Total
0 (0.0%)
0 (0.0%)
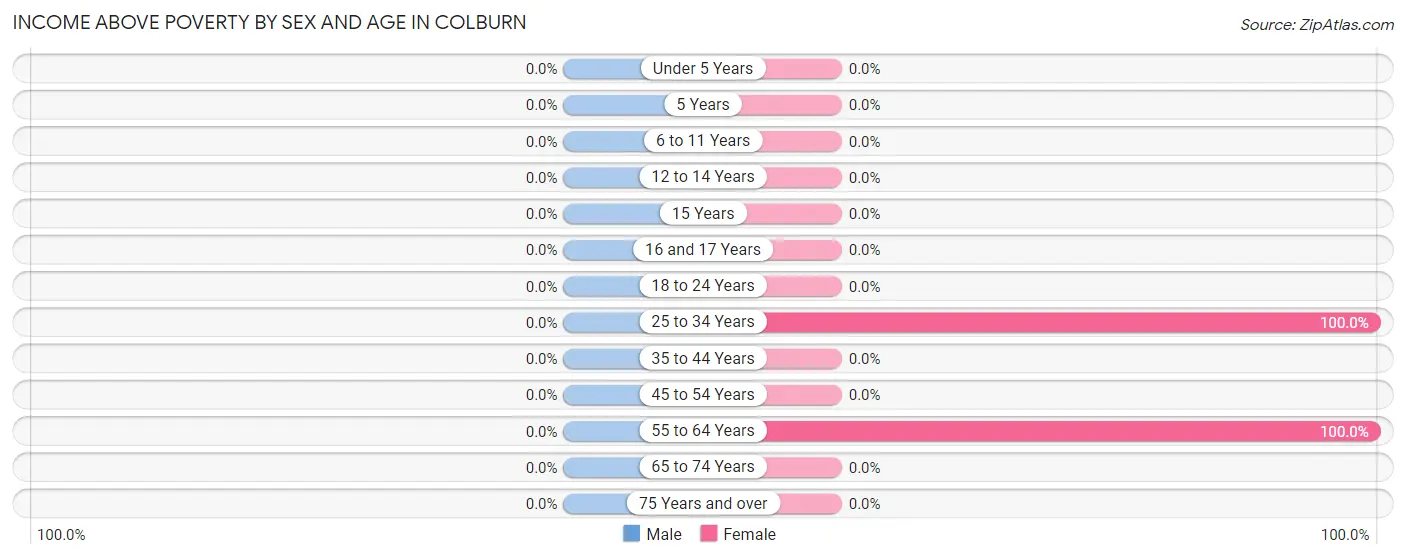
Income Above Poverty by Sex and Age in Colburn
Age Bracket
Male
Female
Under 5 Years
0 (0.0%)
0 (0.0%)
5 Years
0 (0.0%)
0 (0.0%)
6 to 11 Years
0 (0.0%)
0 (0.0%)
12 to 14 Years
0 (0.0%)
0 (0.0%)
15 Years
0 (0.0%)
0 (0.0%)
16 and 17 Years
0 (0.0%)
0 (0.0%)
18 to 24 Years
0 (0.0%)
0 (0.0%)
25 to 34 Years
0 (0.0%)
34 (100.0%)
35 to 44 Years
0 (0.0%)
0 (0.0%)
45 to 54 Years
0 (0.0%)
0 (0.0%)
55 to 64 Years
0 (0.0%)
38 (100.0%)
65 to 74 Years
0 (0.0%)
0 (0.0%)
75 Years and over
0 (0.0%)
0 (0.0%)
Total
0 (0.0%)
72 (100.0%)
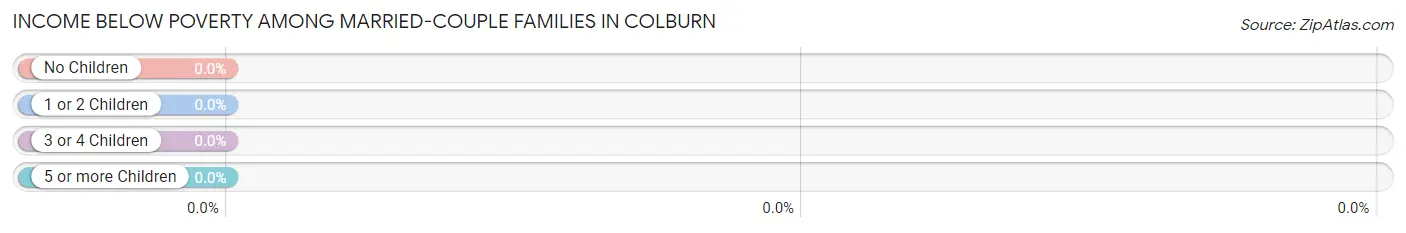
Income Below Poverty Among Married-Couple Families in Colburn
Children
Above Poverty
Below Poverty
No Children
0 (0.0%)
0 (0.0%)
1 or 2 Children
0 (0.0%)
0 (0.0%)
3 or 4 Children
0 (0.0%)
0 (0.0%)
5 or more Children
0 (0.0%)
0 (0.0%)
Total
0 (0.0%)
0 (0.0%)
Income Below Poverty Among Single-Parent Households in Colburn
Children
Single Father
Single Mother
No Children
0 (0.0%)
0 (0.0%)
1 or 2 Children
0 (0.0%)
0 (0.0%)
3 or 4 Children
0 (0.0%)
0 (0.0%)
5 or more Children
0 (0.0%)
0 (0.0%)
Total
0 (0.0%)
0 (0.0%)
Income Below Poverty Among Married-Couple vs Single-Parent Households in Colburn
Children
Married-Couple Families
Single-Parent Households
No Children
0 (0.0%)
0 (0.0%)
1 or 2 Children
0 (0.0%)
0 (0.0%)
3 or 4 Children
0 (0.0%)
0 (0.0%)
5 or more Children
0 (0.0%)
0 (0.0%)
Total
0 (0.0%)
0 (0.0%)
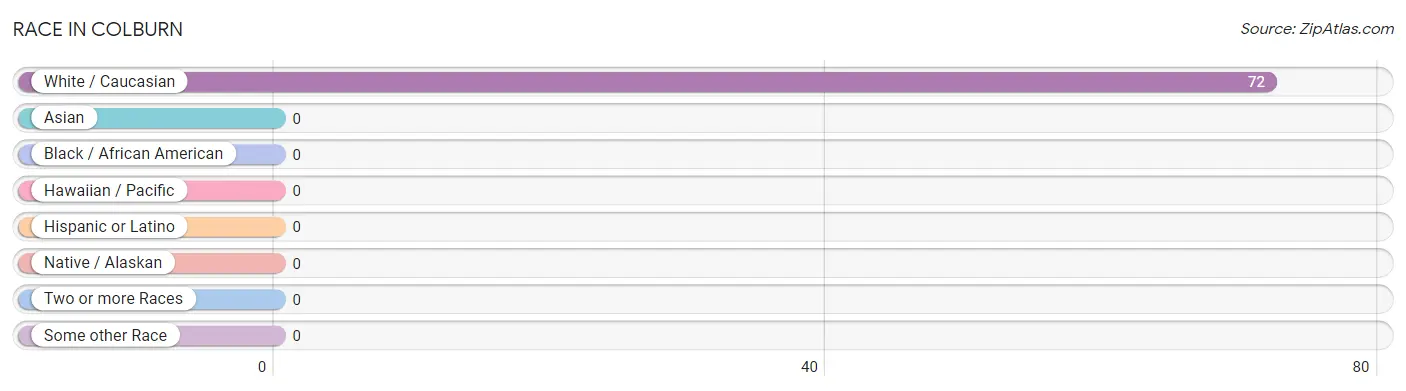
Race in Colburn
The most populous races in Colburn are , and White / Caucasian (72 | 100.0%).
Race
# Population
% Population
Asian
0
0.0%
Black / African American
0
0.0%
Hawaiian / Pacific
0
0.0%
Hispanic or Latino
0
0.0%
Native / Alaskan
0
0.0%
White / Caucasian
72
100.0%
Two or more Races
0
0.0%
Some other Race
0
0.0%
Total
72
100.0%
Ancestry in Colburn
The most populous ancestries reported in Colburn are , and German (72 | 100.0%), together accounting for 100.0% of all Colburn residents.
Ancestry
# Population
% Population
German
72
100.0%
View All 1 Rows
Immigrants in Colburn
Immigration Origin
# Population
% Population
View All 0 Rows
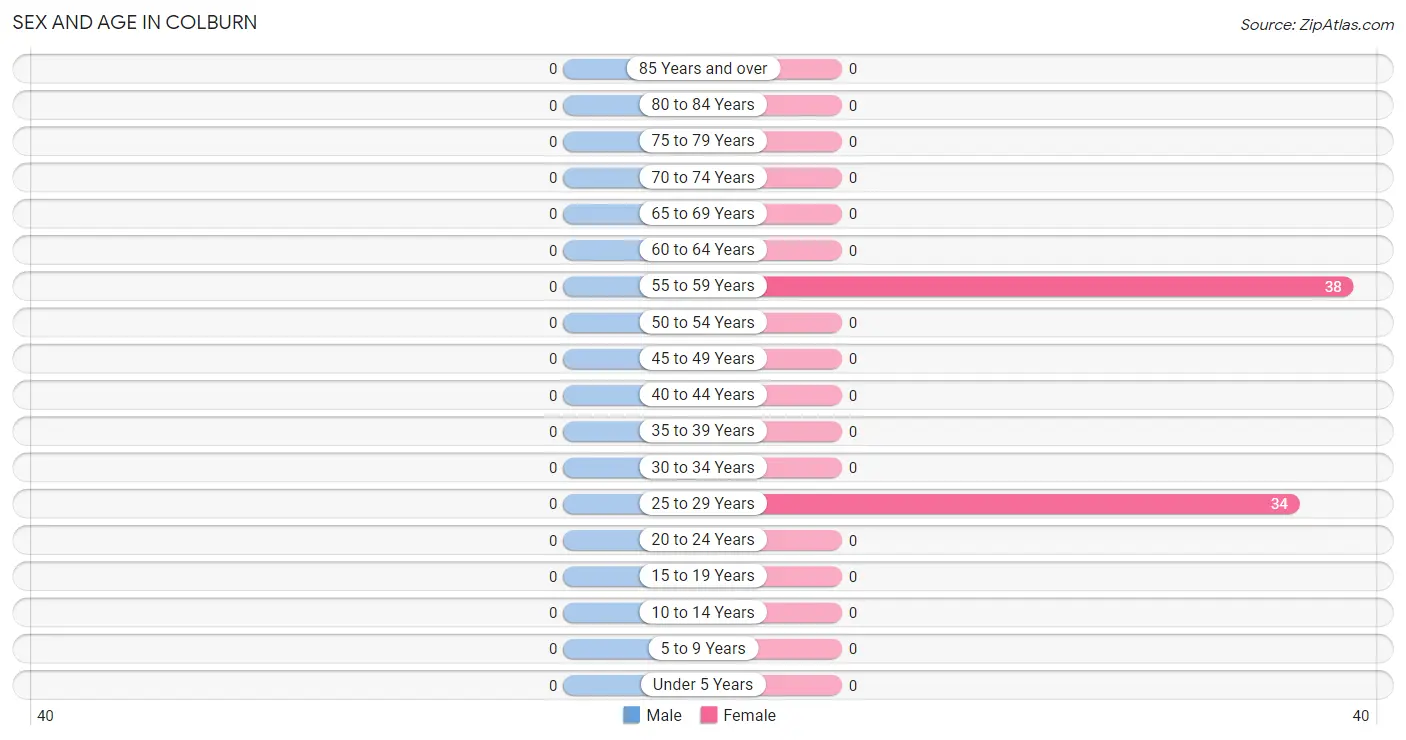
Sex and Age in Colburn
Sex and Age in Colburn
Age Bracket
Male
Female
Under 5 Years
0 (0.0%)
0 (0.0%)
5 to 9 Years
0 (0.0%)
0 (0.0%)
10 to 14 Years
0 (0.0%)
0 (0.0%)
15 to 19 Years
0 (0.0%)
0 (0.0%)
20 to 24 Years
0 (0.0%)
0 (0.0%)
25 to 29 Years
0 (0.0%)
34 (47.2%)
30 to 34 Years
0 (0.0%)
0 (0.0%)
35 to 39 Years
0 (0.0%)
0 (0.0%)
40 to 44 Years
0 (0.0%)
0 (0.0%)
45 to 49 Years
0 (0.0%)
0 (0.0%)
50 to 54 Years
0 (0.0%)
0 (0.0%)
55 to 59 Years
0 (0.0%)
38 (52.8%)
60 to 64 Years
0 (0.0%)
0 (0.0%)
65 to 69 Years
0 (0.0%)
0 (0.0%)
70 to 74 Years
0 (0.0%)
0 (0.0%)
75 to 79 Years
0 (0.0%)
0 (0.0%)
80 to 84 Years
0 (0.0%)
0 (0.0%)
85 Years and over
0 (0.0%)
0 (0.0%)
Total
0 (0.0%)
72 (100.0%)
Families and Households in Colburn
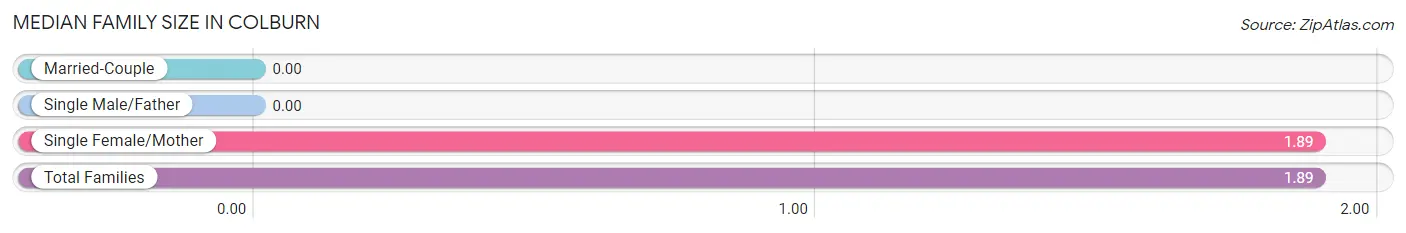
Median Family Size in Colburn
Family Type
# Families
Family Size
Married-Couple
0 (0.0%)
-
Single Male/Father
0 (0.0%)
-
Single Female/Mother
38 (100.0%)
1.89
Total Families
38 (100.0%)
1.89
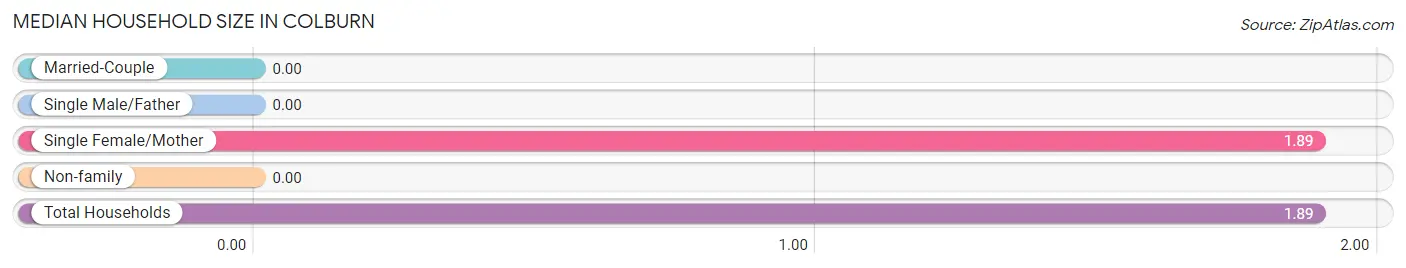
Median Household Size in Colburn
Household Type
# Households
Household Size
Married-Couple
0 (0.0%)
-
Single Male/Father
0 (0.0%)
-
Single Female/Mother
38 (100.0%)
1.89
Non-family
0 (0.0%)
-
Total Households
38 (100.0%)
1.89
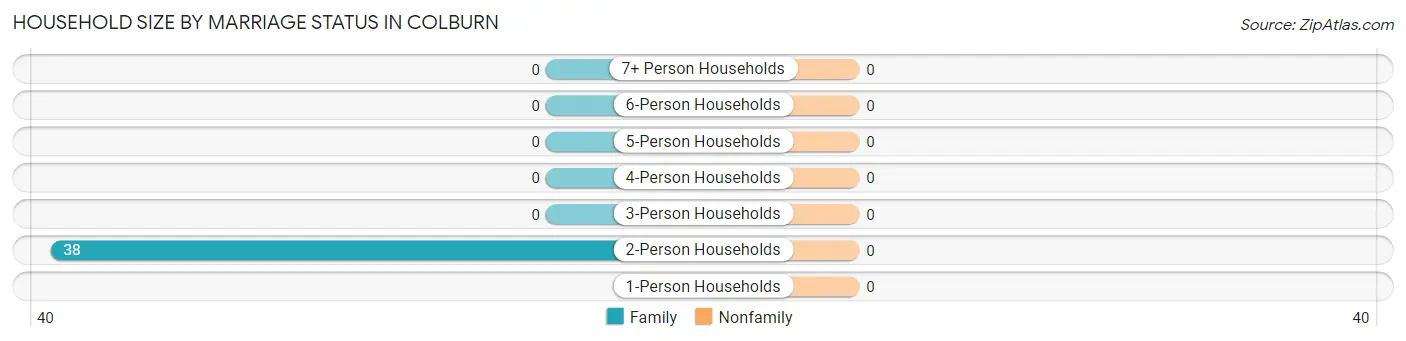
Household Size by Marriage Status in Colburn
Household Size
Family Households
Nonfamily Households
1-Person Households
-
0 (0.0%)
2-Person Households
38 (100.0%)
0 (0.0%)
3-Person Households
0 (0.0%)
0 (0.0%)
4-Person Households
0 (0.0%)
0 (0.0%)
5-Person Households
0 (0.0%)
0 (0.0%)
6-Person Households
0 (0.0%)
0 (0.0%)
7+ Person Households
0 (0.0%)
0 (0.0%)
Total
38 (100.0%)
0 (0.0%)
Female Fertility in Colburn
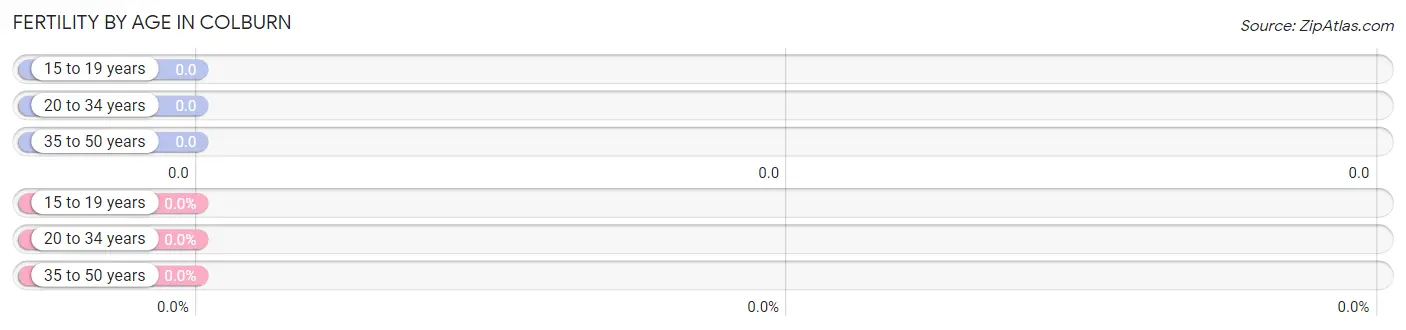
Fertility by Age in Colburn
Age Bracket
Women with Births
Births / 1,000 Women
15 to 19 years
0 (0.0%)
0.0
20 to 34 years
0 (0.0%)
0.0
35 to 50 years
0 (0.0%)
0.0
Total
0 (0.0%)
0.0
Fertility by Age by Marriage Status in Colburn
Age Bracket
Married
Unmarried
15 to 19 years
0 (0.0%)
0 (0.0%)
20 to 34 years
0 (0.0%)
0 (0.0%)
35 to 50 years
0 (0.0%)
0 (0.0%)
Total
0 (0.0%)
0 (0.0%)
Fertility by Education in Colburn
Educational Attainment
Women with Births
Births / 1,000 Women
Less than High School
0 (0.0%)
0.0
High School Diploma
0 (0.0%)
0.0
College or Associate's Degree
0 (0.0%)
0.0
Bachelor's Degree
0 (0.0%)
0.0
Graduate Degree
0 (0.0%)
0.0
Total
0 (0.0%)
0.0
Fertility by Education by Marriage Status in Colburn
Educational Attainment
Married
Unmarried
Less than High School
0 (0.0%)
0 (0.0%)
High School Diploma
0 (0.0%)
0 (0.0%)
College or Associate's Degree
0 (0.0%)
0 (0.0%)
Bachelor's Degree
0 (0.0%)
0 (0.0%)
Graduate Degree
0 (0.0%)
0 (0.0%)
Total
0 (0.0%)
0 (0.0%)
Employment Characteristics in Colburn
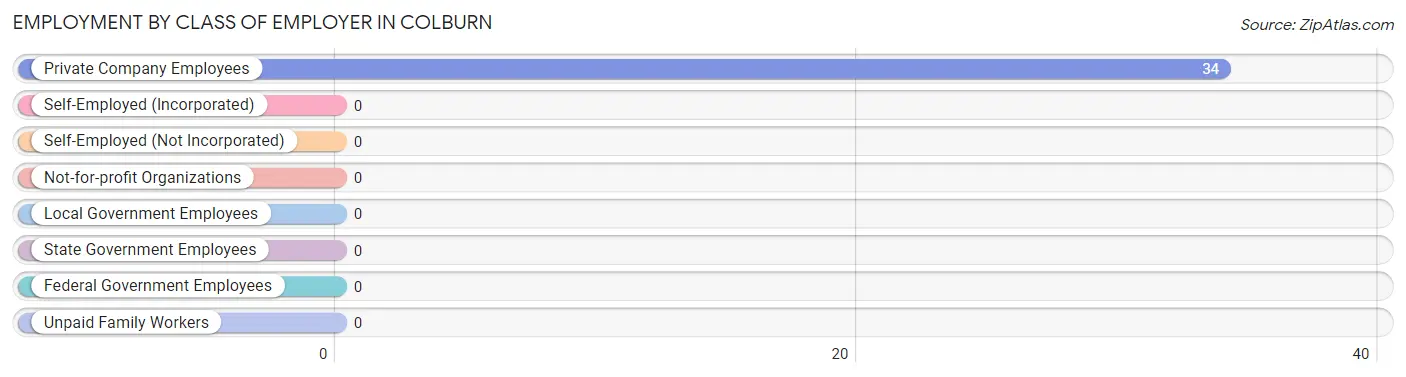
Employment by Class of Employer in Colburn
Among the 34 employed individuals in Colburn, , and private company employees (34 | 100.0%) make up the most common classes of employment.
Employer Class
# Employees
% Employees
Private Company Employees
34
100.0%
Self-Employed (Incorporated)
0
0.0%
Self-Employed (Not Incorporated)
0
0.0%
Not-for-profit Organizations
0
0.0%
Local Government Employees
0
0.0%
State Government Employees
0
0.0%
Federal Government Employees
0
0.0%
Unpaid Family Workers
0
0.0%
Total
34
100.0%
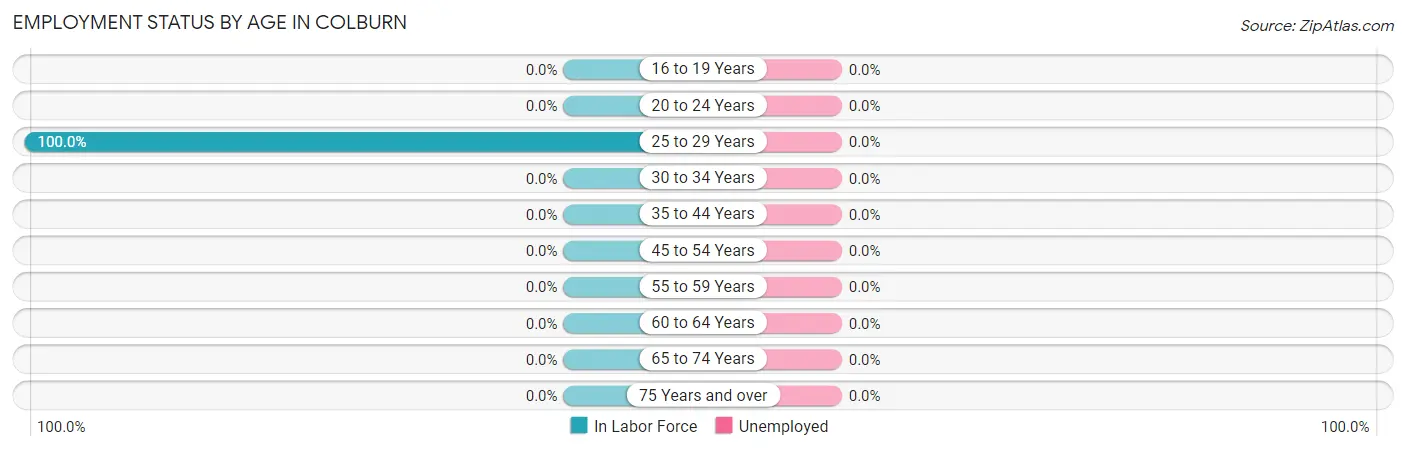
Employment Status by Age in Colburn
Age Bracket
In Labor Force
Unemployed
16 to 19 Years
0 (0.0%)
0 (0.0%)
20 to 24 Years
0 (0.0%)
0 (0.0%)
25 to 29 Years
34 (100.0%)
0 (0.0%)
30 to 34 Years
0 (0.0%)
0 (0.0%)
35 to 44 Years
0 (0.0%)
0 (0.0%)
45 to 54 Years
0 (0.0%)
0 (0.0%)
55 to 59 Years
0 (0.0%)
0 (0.0%)
60 to 64 Years
0 (0.0%)
0 (0.0%)
65 to 74 Years
0 (0.0%)
0 (0.0%)
75 Years and over
0 (0.0%)
0 (0.0%)
Total
34 (47.2%)
0 (0.0%)
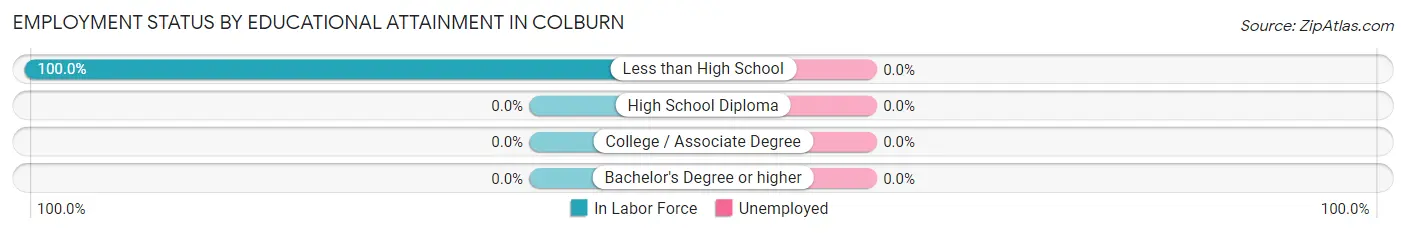
Employment Status by Educational Attainment in Colburn
Educational Attainment
In Labor Force
Unemployed
Less than High School
34 (100.0%)
0 (0.0%)
High School Diploma
0 (0.0%)
0 (0.0%)
College / Associate Degree
0 (0.0%)
0 (0.0%)
Bachelor's Degree or higher
0 (0.0%)
0 (0.0%)
Total
34 (47.2%)
0 (0.0%)
Employment Occupations by Sex in Colburn
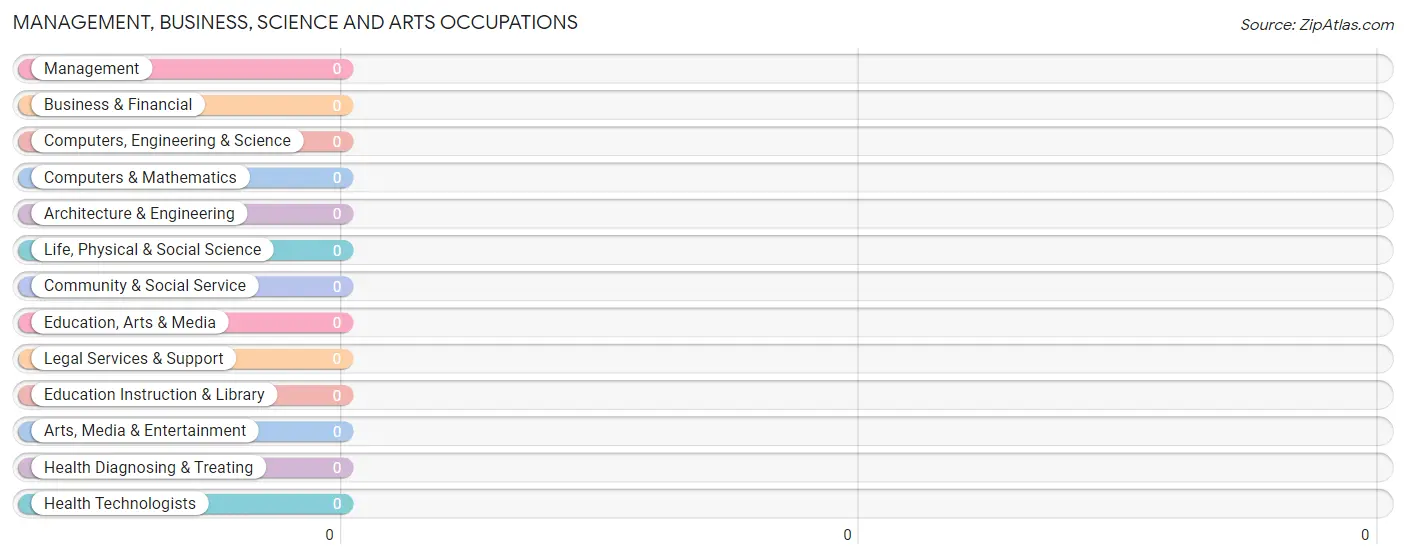
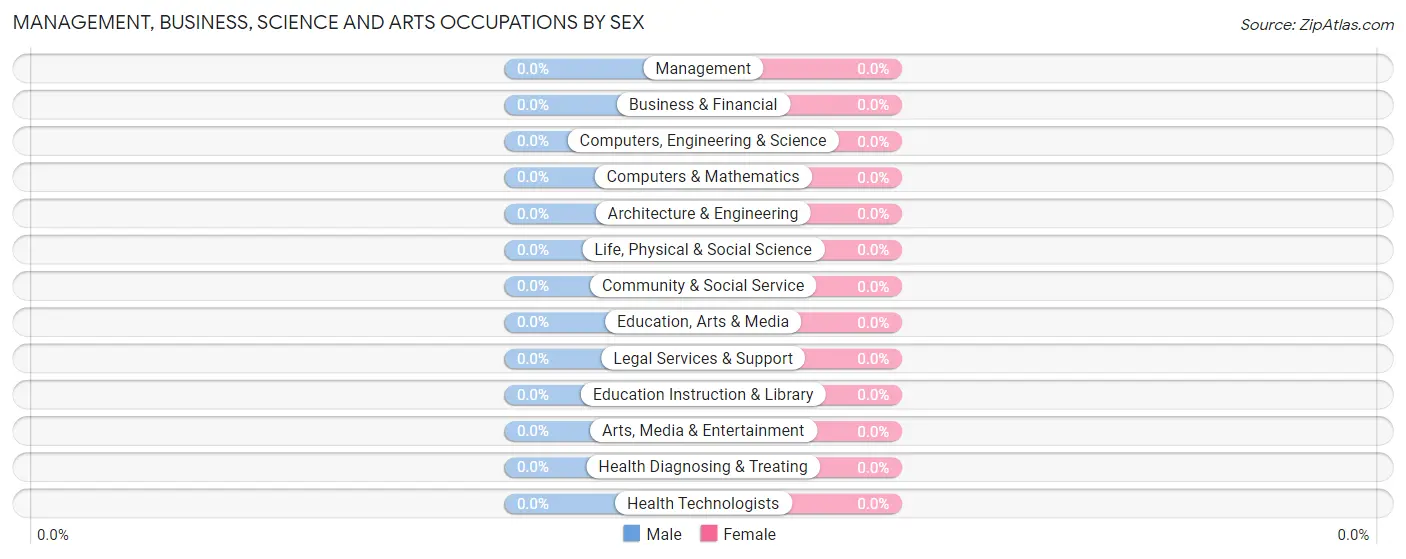
Management, Business, Science and Arts Occupations
Management, Business, Science and Arts Occupations by Sex
Occupation
Male
Female
Management
0 (0.0%)
0 (0.0%)
Business & Financial
0 (0.0%)
0 (0.0%)
Computers, Engineering & Science
0 (0.0%)
0 (0.0%)
Computers & Mathematics
0 (0.0%)
0 (0.0%)
Architecture & Engineering
0 (0.0%)
0 (0.0%)
Life, Physical & Social Science
0 (0.0%)
0 (0.0%)
Community & Social Service
0 (0.0%)
0 (0.0%)
Education, Arts & Media
0 (0.0%)
0 (0.0%)
Legal Services & Support
0 (0.0%)
0 (0.0%)
Education Instruction & Library
0 (0.0%)
0 (0.0%)
Arts, Media & Entertainment
0 (0.0%)
0 (0.0%)
Health Diagnosing & Treating
0 (0.0%)
0 (0.0%)
Health Technologists
0 (0.0%)
0 (0.0%)
Total (Category)
0 (0.0%)
0 (0.0%)
Total (Overall)
0 (0.0%)
34 (100.0%)
Services Occupations
Services Occupations by Sex
Occupation
Male
Female
Healthcare Support
0 (0.0%)
0 (0.0%)
Security & Protection
0 (0.0%)
0 (0.0%)
Firefighting & Prevention
0 (0.0%)
0 (0.0%)
Law Enforcement
0 (0.0%)
0 (0.0%)
Food Preparation & Serving
0 (0.0%)
0 (0.0%)
Cleaning & Maintenance
0 (0.0%)
0 (0.0%)
Personal Care & Service
0 (0.0%)
0 (0.0%)
Total (Category)
0 (0.0%)
0 (0.0%)
Total (Overall)
0 (0.0%)
34 (100.0%)
Sales and Office Occupations
Sales and Office Occupations by Sex
Occupation
Male
Female
Sales & Related
0 (0.0%)
0 (0.0%)
Office & Administration
0 (0.0%)
0 (0.0%)
Total (Category)
0 (0.0%)
0 (0.0%)
Total (Overall)
0 (0.0%)
34 (100.0%)
Natural Resources, Construction and Maintenance Occupations
Natural Resources, Construction and Maintenance Occupations by Sex
Occupation
Male
Female
Farming, Fishing & Forestry
0 (0.0%)
0 (0.0%)
Construction & Extraction
0 (0.0%)
0 (0.0%)
Installation, Maintenance & Repair
0 (0.0%)
0 (0.0%)
Total (Category)
0 (0.0%)
0 (0.0%)
Total (Overall)
0 (0.0%)
34 (100.0%)
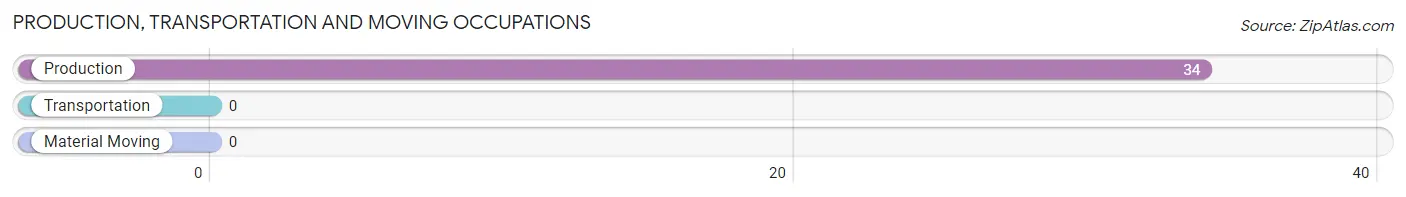
Production, Transportation and Moving Occupations
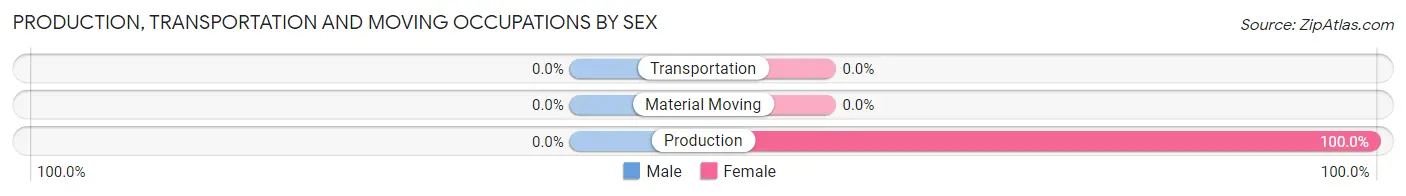
The most common Production, Transportation and Moving occupations in Colburn are , and Production (34 | 100.0%).
Production, Transportation and Moving Occupations by Sex
Occupation
Male
Female
Production
0 (0.0%)
34 (100.0%)
Transportation
0 (0.0%)
0 (0.0%)
Material Moving
0 (0.0%)
0 (0.0%)
Total (Category)
0 (0.0%)
34 (100.0%)
Total (Overall)
0 (0.0%)
34 (100.0%)
Employment Industries by Sex in Colburn
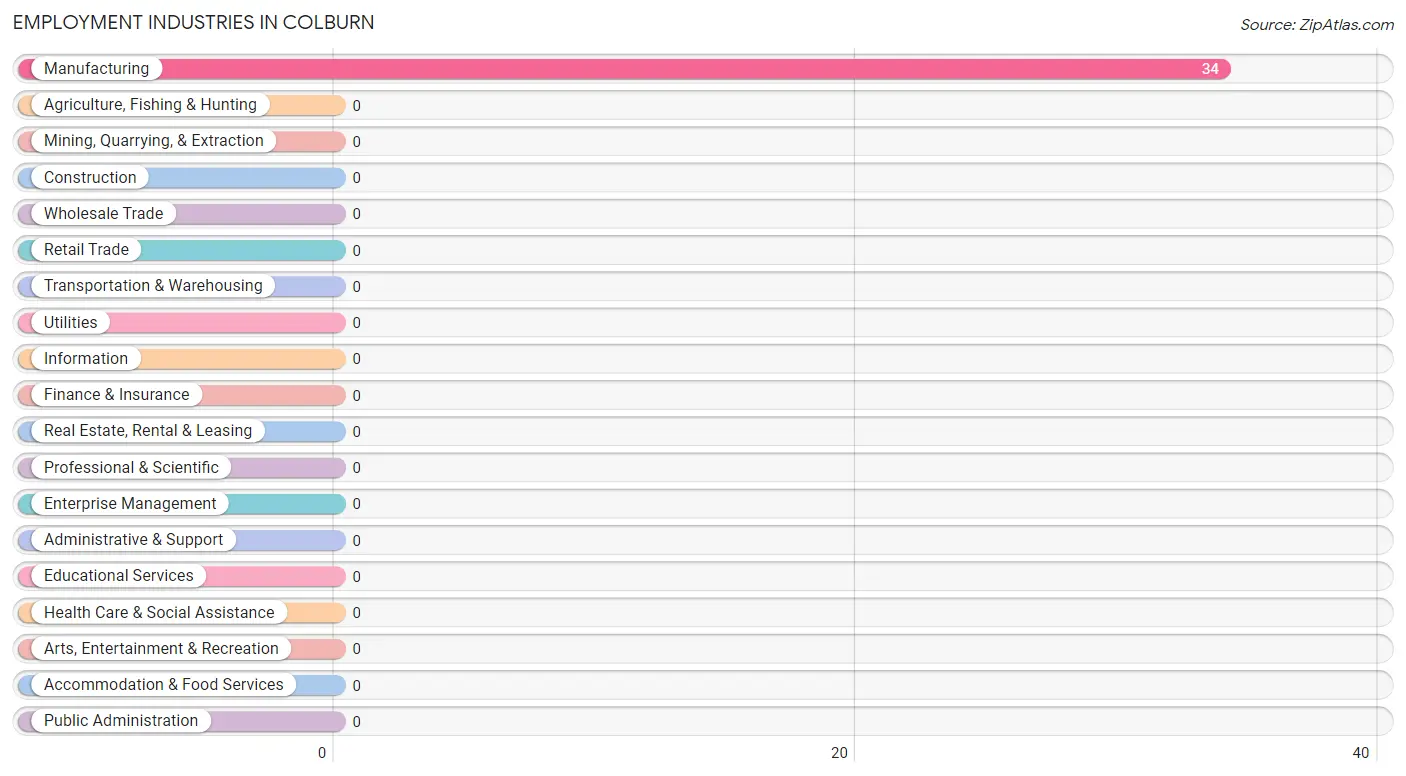
Employment Industries in Colburn
The major employment industries in Colburn include , and Manufacturing (34 | 100.0%).
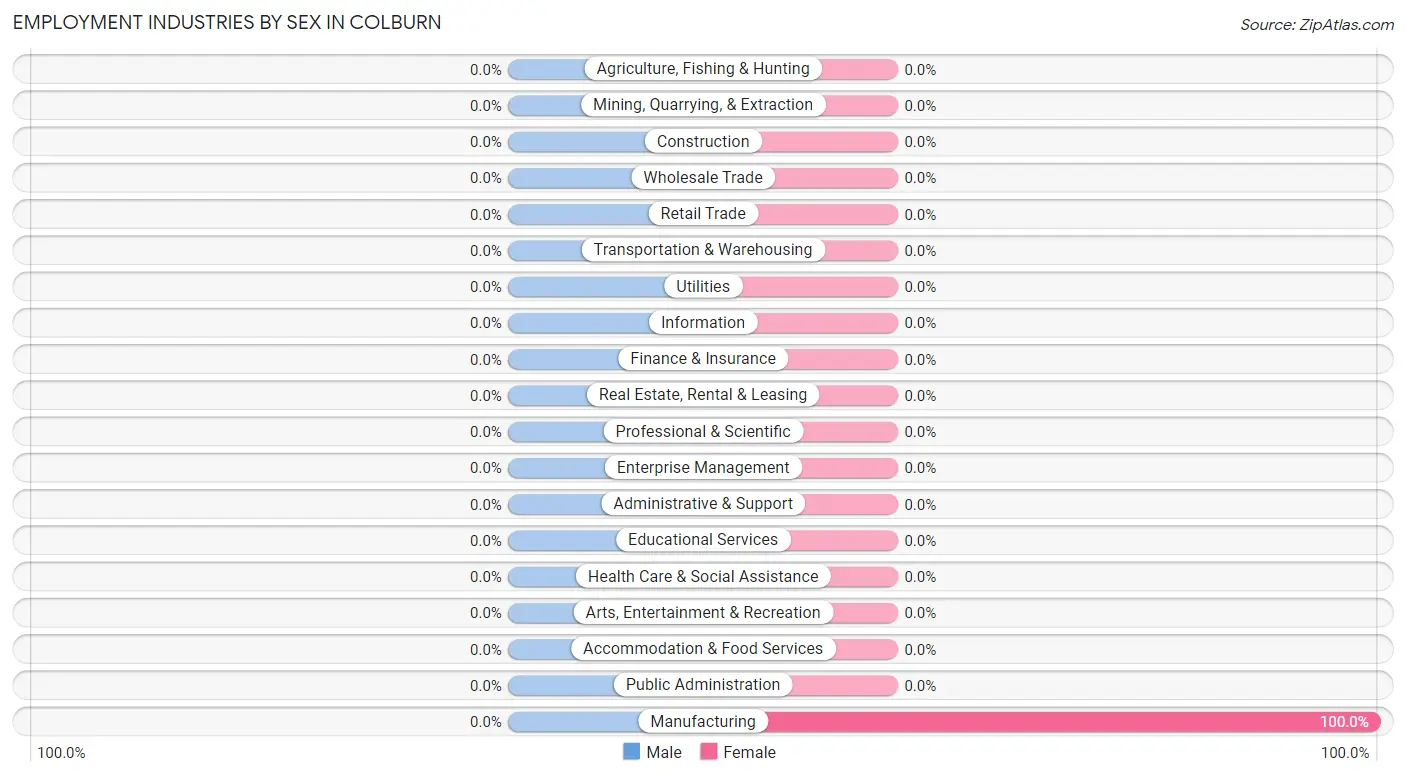
Employment Industries by Sex in Colburn
Industry
Male
Female
Agriculture, Fishing & Hunting
0 (0.0%)
0 (0.0%)
Mining, Quarrying, & Extraction
0 (0.0%)
0 (0.0%)
Construction
0 (0.0%)
0 (0.0%)
Manufacturing
0 (0.0%)
34 (100.0%)
Wholesale Trade
0 (0.0%)
0 (0.0%)
Retail Trade
0 (0.0%)
0 (0.0%)
Transportation & Warehousing
0 (0.0%)
0 (0.0%)
Utilities
0 (0.0%)
0 (0.0%)
Information
0 (0.0%)
0 (0.0%)
Finance & Insurance
0 (0.0%)
0 (0.0%)
Real Estate, Rental & Leasing
0 (0.0%)
0 (0.0%)
Professional & Scientific
0 (0.0%)
0 (0.0%)
Enterprise Management
0 (0.0%)
0 (0.0%)
Administrative & Support
0 (0.0%)
0 (0.0%)
Educational Services
0 (0.0%)
0 (0.0%)
Health Care & Social Assistance
0 (0.0%)
0 (0.0%)
Arts, Entertainment & Recreation
0 (0.0%)
0 (0.0%)
Accommodation & Food Services
0 (0.0%)
0 (0.0%)
Public Administration
0 (0.0%)
0 (0.0%)
Total
0 (0.0%)
34 (100.0%)
Education in Colburn
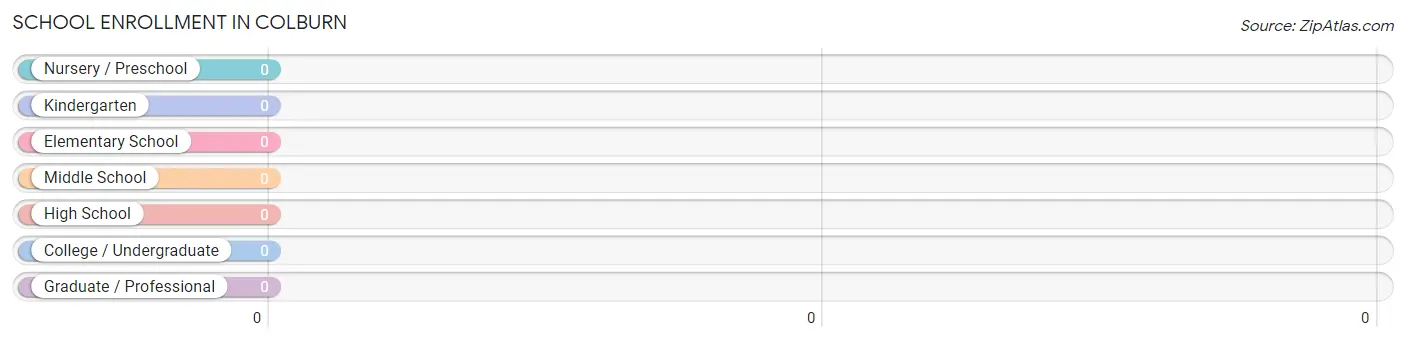
School Enrollment in Colburn
School Level
# Students
% Students
Nursery / Preschool
0
0.0%
Kindergarten
0
0.0%
Elementary School
0
0.0%
Middle School
0
0.0%
High School
0
0.0%
College / Undergraduate
0
0.0%
Graduate / Professional
0
0.0%
Total
0
0.0%
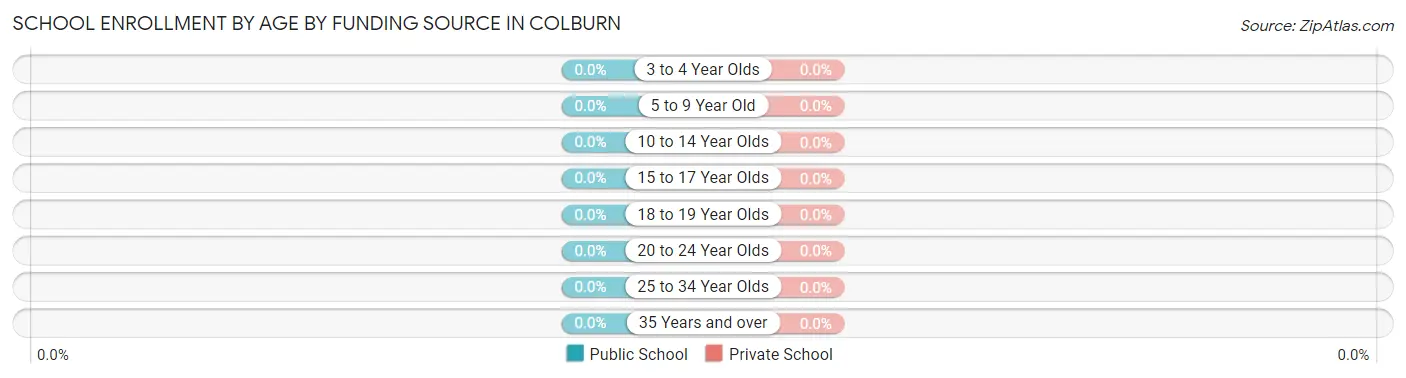
School Enrollment by Age by Funding Source in Colburn
Age Bracket
Public School
Private School
3 to 4 Year Olds
0 (0.0%)
0 (0.0%)
5 to 9 Year Old
0 (0.0%)
0 (0.0%)
10 to 14 Year Olds
0 (0.0%)
0 (0.0%)
15 to 17 Year Olds
0 (0.0%)
0 (0.0%)
18 to 19 Year Olds
0 (0.0%)
0 (0.0%)
20 to 24 Year Olds
0 (0.0%)
0 (0.0%)
25 to 34 Year Olds
0 (0.0%)
0 (0.0%)
35 Years and over
0 (0.0%)
0 (0.0%)
Total
0 (0.0%)
0 (0.0%)
Educational Attainment by Field of Study in Colburn
Field of Study
# Graduates
% Graduates
Computers & Mathematics
0
0.0%
Bio, Nature & Agricultural
0
0.0%
Physical & Health Sciences
0
0.0%
Psychology
0
0.0%
Social Sciences
0
0.0%
Engineering
0
0.0%
Multidisciplinary Studies
0
0.0%
Science & Technology
0
0.0%
Business
0
0.0%
Education
0
0.0%
Literature & Languages
0
0.0%
Liberal Arts & History
0
0.0%
Visual & Performing Arts
0
0.0%
Communications
0
0.0%
Arts & Humanities
0
0.0%
Total
0
0.0%
Transportation & Commute in Colburn
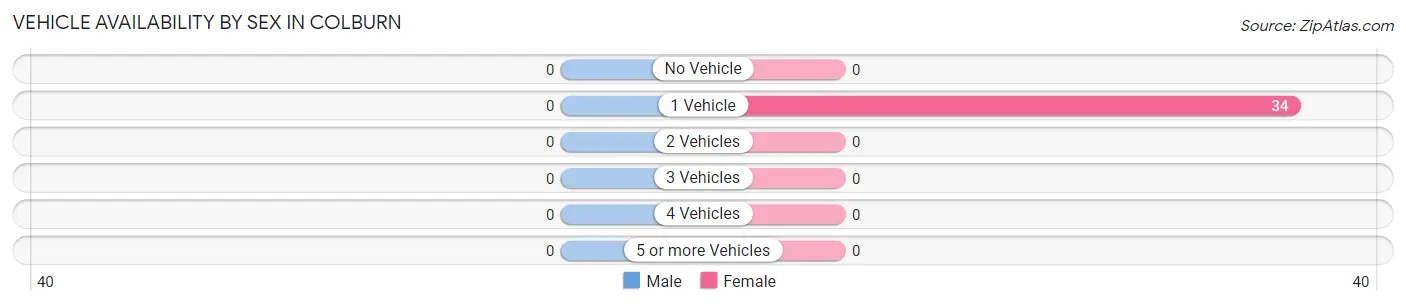
Vehicle Availability by Sex in Colburn
Vehicles Available
Male
Female
No Vehicle
0 (0.0%)
0 (0.0%)
1 Vehicle
0 (0.0%)
34 (100.0%)
2 Vehicles
0 (0.0%)
0 (0.0%)
3 Vehicles
0 (0.0%)
0 (0.0%)
4 Vehicles
0 (0.0%)
0 (0.0%)
5 or more Vehicles
0 (0.0%)
0 (0.0%)
Total
0 (0.0%)
34 (100.0%)
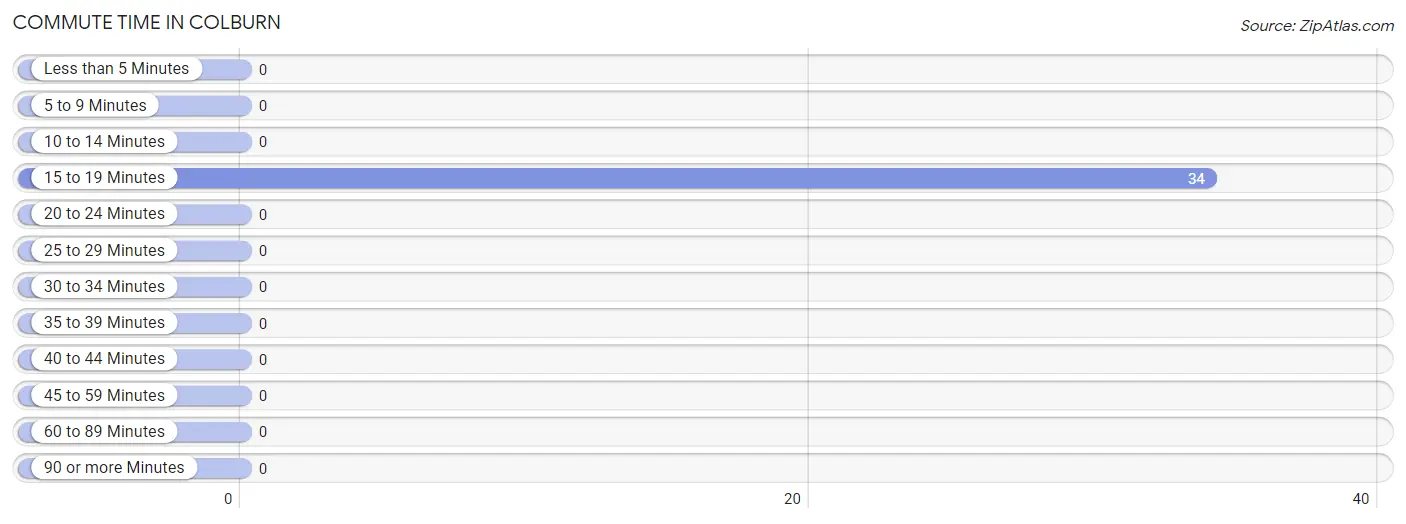
Commute Time in Colburn
The most frequently occuring commute durations in Colburn are 15 to 19 minutes (34 commuters, 100.0%), less than 5 minutes (0 commuters, 0.0%), and 5 to 9 minutes (0 commuters, 0.0%).
Commute Time
# Commuters
% Commuters
Less than 5 Minutes
0
0.0%
5 to 9 Minutes
0
0.0%
10 to 14 Minutes
0
0.0%
15 to 19 Minutes
34
100.0%
20 to 24 Minutes
0
0.0%
25 to 29 Minutes
0
0.0%
30 to 34 Minutes
0
0.0%
35 to 39 Minutes
0
0.0%
40 to 44 Minutes
0
0.0%
45 to 59 Minutes
0
0.0%
60 to 89 Minutes
0
0.0%
90 or more Minutes
0
0.0%
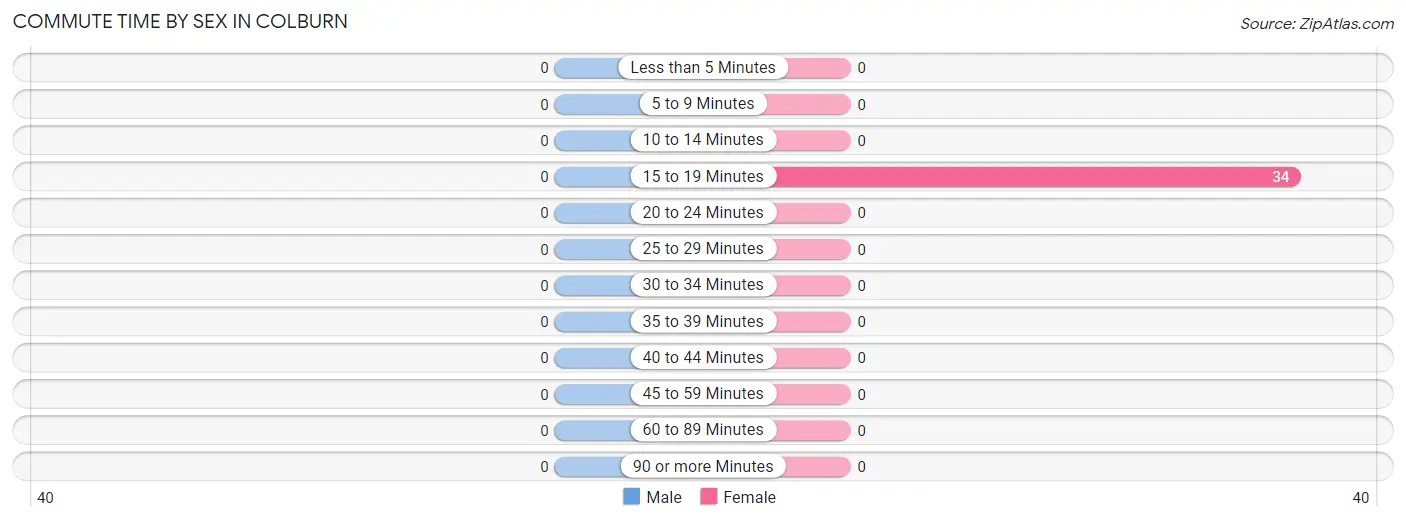
Commute Time by Sex in Colburn
Commute Time
Male
Female
Less than 5 Minutes
0 (0.0%)
0 (0.0%)
5 to 9 Minutes
0 (0.0%)
0 (0.0%)
10 to 14 Minutes
0 (0.0%)
0 (0.0%)
15 to 19 Minutes
0 (0.0%)
34 (100.0%)
20 to 24 Minutes
0 (0.0%)
0 (0.0%)
25 to 29 Minutes
0 (0.0%)
0 (0.0%)
30 to 34 Minutes
0 (0.0%)
0 (0.0%)
35 to 39 Minutes
0 (0.0%)
0 (0.0%)
40 to 44 Minutes
0 (0.0%)
0 (0.0%)
45 to 59 Minutes
0 (0.0%)
0 (0.0%)
60 to 89 Minutes
0 (0.0%)
0 (0.0%)
90 or more Minutes
0 (0.0%)
0 (0.0%)
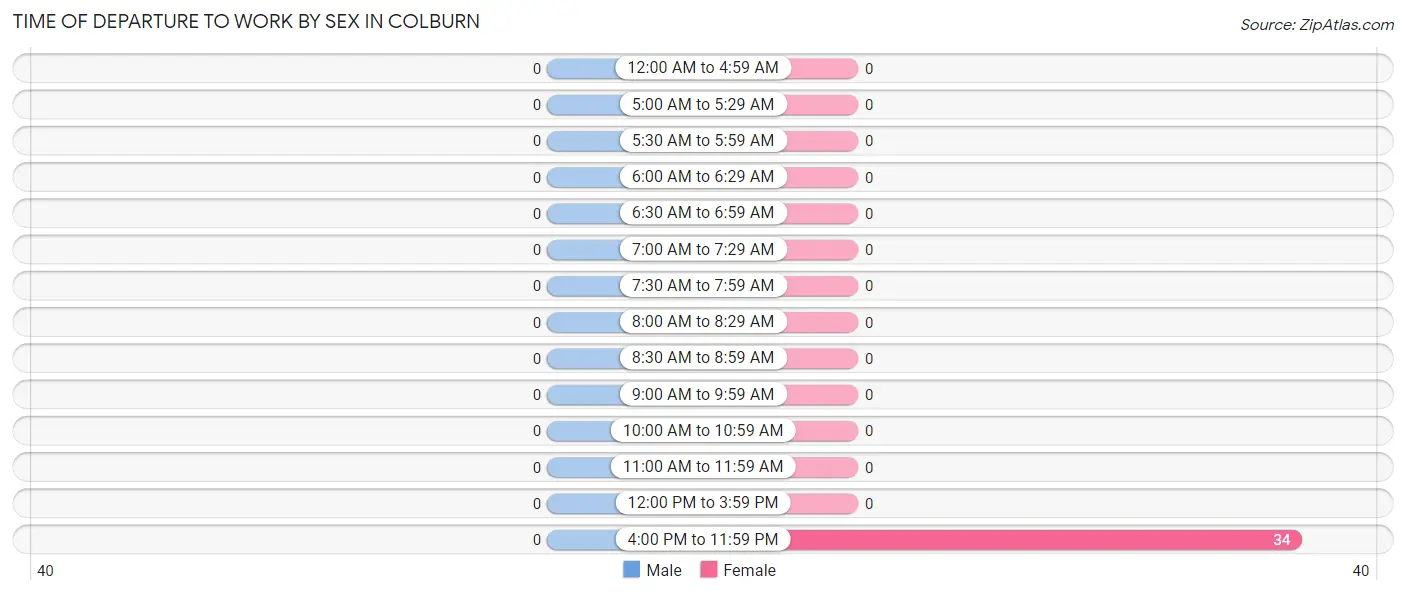
Time of Departure to Work by Sex in Colburn
Time of Departure
Male
Female
12:00 AM to 4:59 AM
0 (0.0%)
0 (0.0%)
5:00 AM to 5:29 AM
0 (0.0%)
0 (0.0%)
5:30 AM to 5:59 AM
0 (0.0%)
0 (0.0%)
6:00 AM to 6:29 AM
0 (0.0%)
0 (0.0%)
6:30 AM to 6:59 AM
0 (0.0%)
0 (0.0%)
7:00 AM to 7:29 AM
0 (0.0%)
0 (0.0%)
7:30 AM to 7:59 AM
0 (0.0%)
0 (0.0%)
8:00 AM to 8:29 AM
0 (0.0%)
0 (0.0%)
8:30 AM to 8:59 AM
0 (0.0%)
0 (0.0%)
9:00 AM to 9:59 AM
0 (0.0%)
0 (0.0%)
10:00 AM to 10:59 AM
0 (0.0%)
0 (0.0%)
11:00 AM to 11:59 AM
0 (0.0%)
0 (0.0%)
12:00 PM to 3:59 PM
0 (0.0%)
0 (0.0%)
4:00 PM to 11:59 PM
0 (0.0%)
34 (100.0%)
Total
0 (0.0%)
34 (100.0%)
Housing Occupancy in Colburn
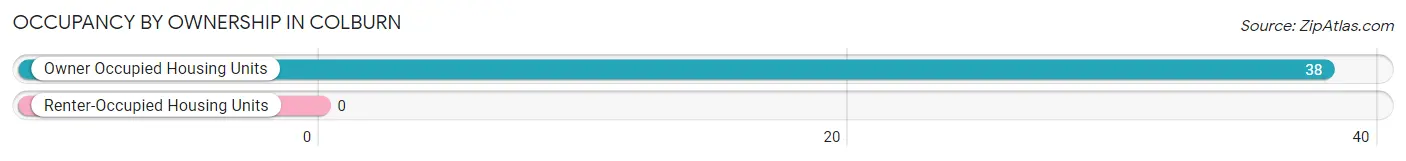
Occupancy by Ownership in Colburn
Of the total 38 dwellings in Colburn, owner-occupied units account for 38 (100.0%), while renter-occupied units make up 0 (0.0%).
Occupancy
# Housing Units
% Housing Units
Owner Occupied Housing Units
38
100.0%
Renter-Occupied Housing Units
0
0.0%
Total Occupied Housing Units
38
100.0%
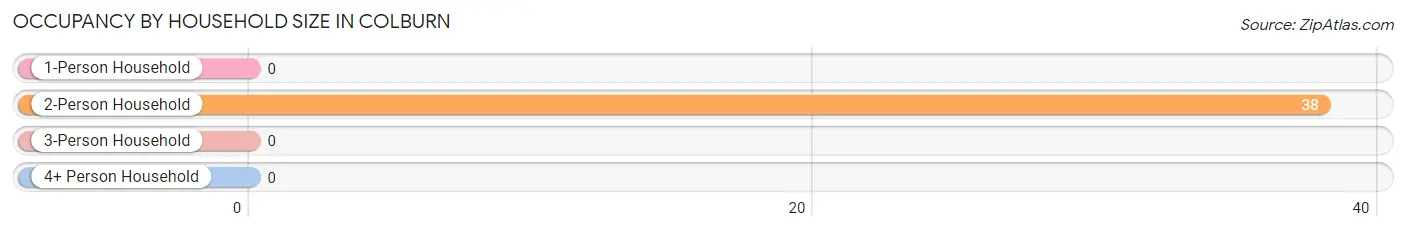
Occupancy by Household Size in Colburn
Household Size
# Housing Units
% Housing Units
1-Person Household
0
0.0%
2-Person Household
38
100.0%
3-Person Household
0
0.0%
4+ Person Household
0
0.0%
Total Housing Units
38
100.0%
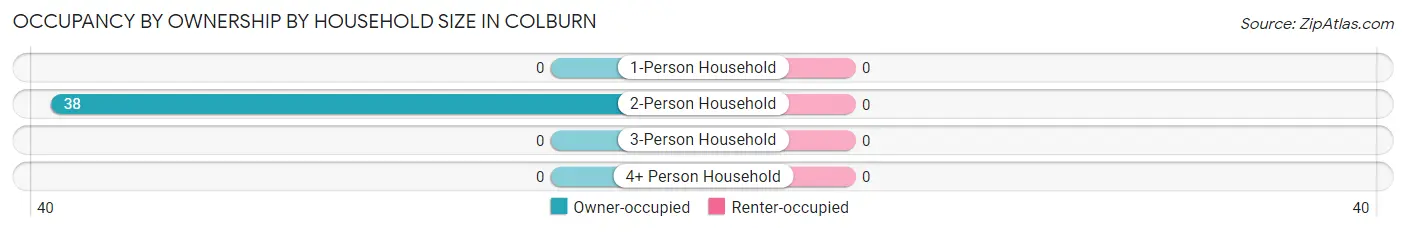
Occupancy by Ownership by Household Size in Colburn
Household Size
Owner-occupied
Renter-occupied
1-Person Household
0 (0.0%)
0 (0.0%)
2-Person Household
38 (100.0%)
0 (0.0%)
3-Person Household
0 (0.0%)
0 (0.0%)
4+ Person Household
0 (0.0%)
0 (0.0%)
Total Housing Units
38 (100.0%)
0 (0.0%)
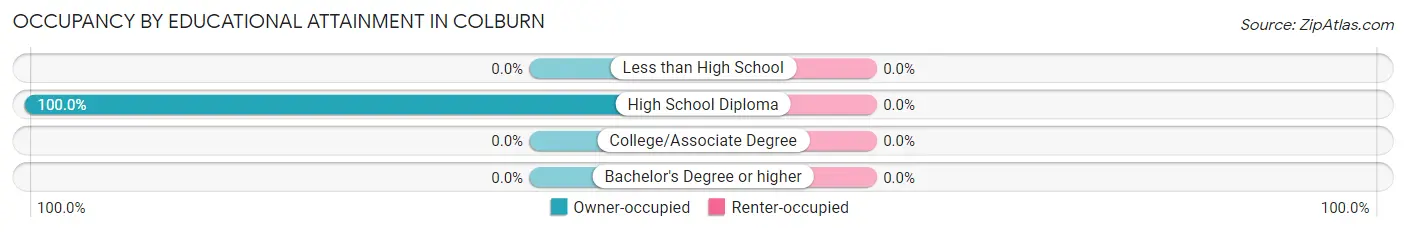
Occupancy by Educational Attainment in Colburn
Household Size
Owner-occupied
Renter-occupied
Less than High School
0 (0.0%)
0 (0.0%)
High School Diploma
38 (100.0%)
0 (0.0%)
College/Associate Degree
0 (0.0%)
0 (0.0%)
Bachelor's Degree or higher
0 (0.0%)
0 (0.0%)
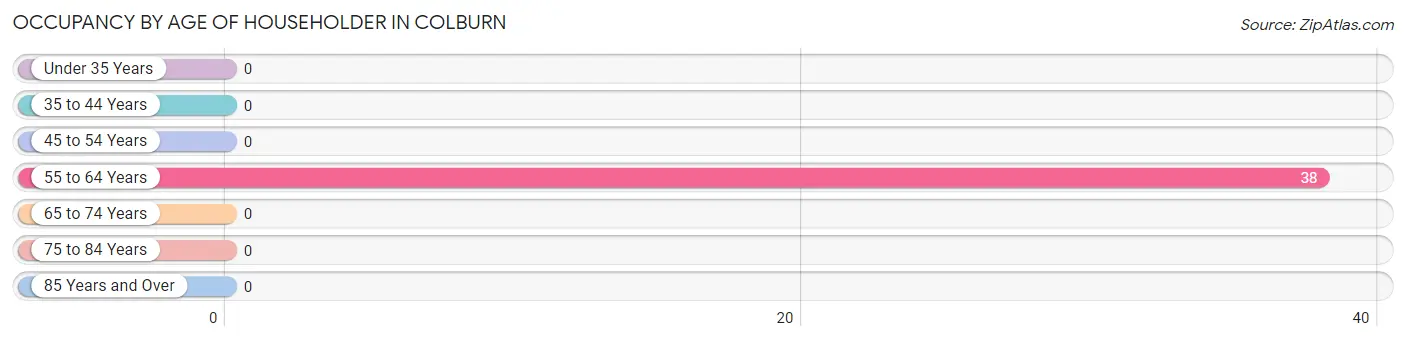
Occupancy by Age of Householder in Colburn
Age Bracket
# Households
% Households
Under 35 Years
0
0.0%
35 to 44 Years
0
0.0%
45 to 54 Years
0
0.0%
55 to 64 Years
38
100.0%
65 to 74 Years
0
0.0%
75 to 84 Years
0
0.0%
85 Years and Over
0
0.0%
Total
38
100.0%
Housing Finances in Colburn
Median Income by Occupancy in Colburn
Occupancy Type
# Households
Median Income
Owner-Occupied
38 (100.0%)
$0
Renter-Occupied
0 (0.0%)
$0
Average
38 (100.0%)
$0
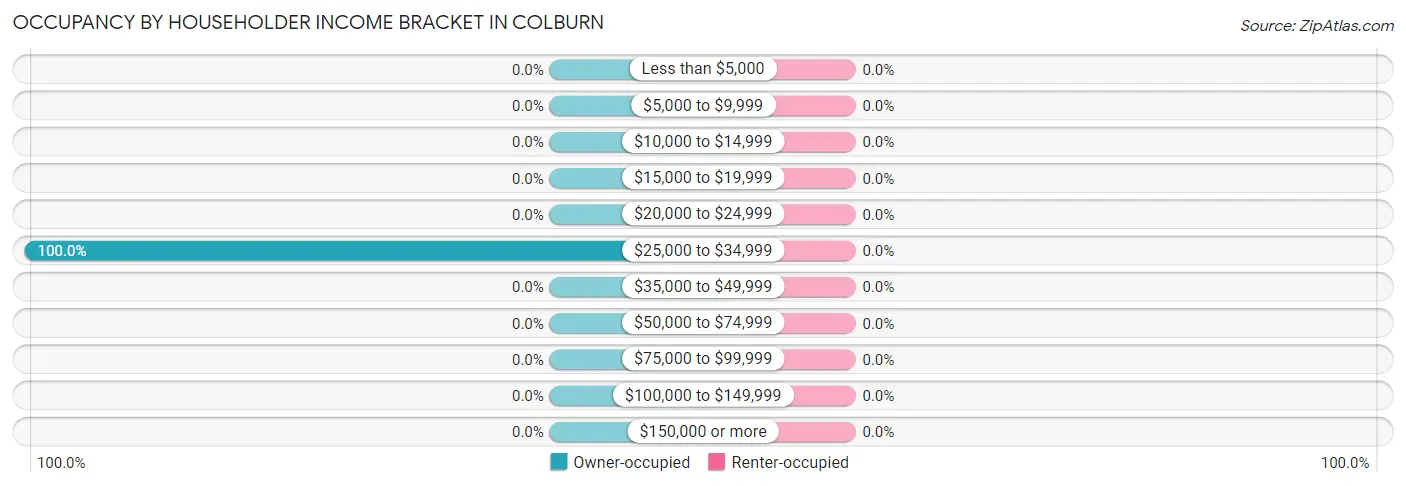
Occupancy by Householder Income Bracket in Colburn
Income Bracket
Owner-occupied
Renter-occupied
Less than $5,000
0 (0.0%)
0 (0.0%)
$5,000 to $9,999
0 (0.0%)
0 (0.0%)
$10,000 to $14,999
0 (0.0%)
0 (0.0%)
$15,000 to $19,999
0 (0.0%)
0 (0.0%)
$20,000 to $24,999
0 (0.0%)
0 (0.0%)
$25,000 to $34,999
38 (100.0%)
0 (0.0%)
$35,000 to $49,999
0 (0.0%)
0 (0.0%)
$50,000 to $74,999
0 (0.0%)
0 (0.0%)
$75,000 to $99,999
0 (0.0%)
0 (0.0%)
$100,000 to $149,999
0 (0.0%)
0 (0.0%)
$150,000 or more
0 (0.0%)
0 (0.0%)
Total
38 (100.0%)
0 (0.0%)
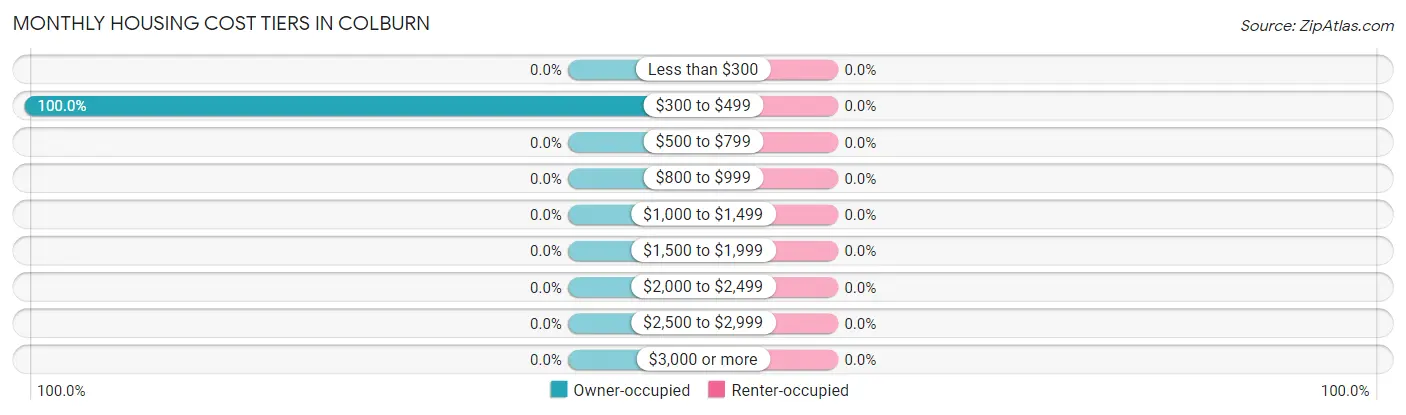
Monthly Housing Cost Tiers in Colburn
Monthly Cost
Owner-occupied
Renter-occupied
Less than $300
0 (0.0%)
0 (0.0%)
$300 to $499
38 (100.0%)
0 (0.0%)
$500 to $799
0 (0.0%)
0 (0.0%)
$800 to $999
0 (0.0%)
0 (0.0%)
$1,000 to $1,499
0 (0.0%)
0 (0.0%)
$1,500 to $1,999
0 (0.0%)
0 (0.0%)
$2,000 to $2,499
0 (0.0%)
0 (0.0%)
$2,500 to $2,999
0 (0.0%)
0 (0.0%)
$3,000 or more
0 (0.0%)
0 (0.0%)
Total
38 (100.0%)
0 (0.0%)
Physical Housing Characteristics in Colburn
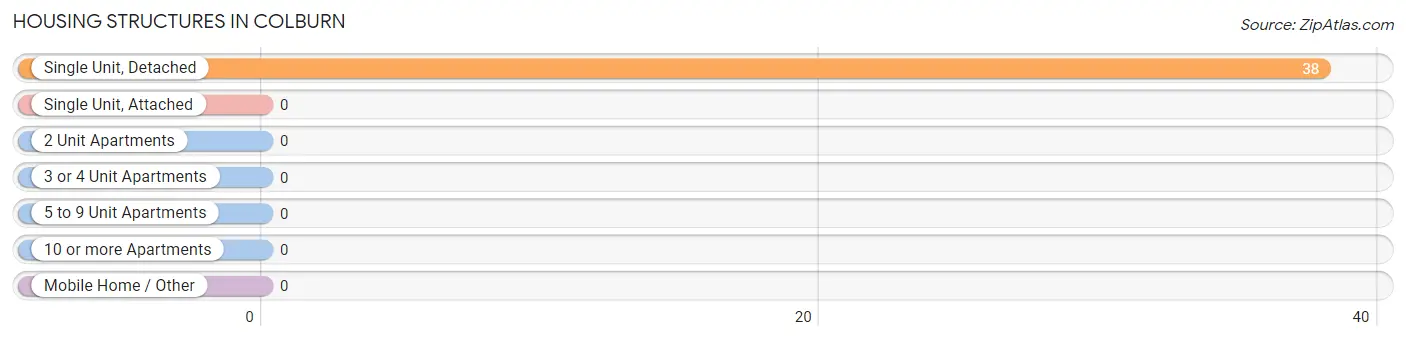
Housing Structures in Colburn
Structure Type
# Housing Units
% Housing Units
Single Unit, Detached
38
100.0%
Single Unit, Attached
0
0.0%
2 Unit Apartments
0
0.0%
3 or 4 Unit Apartments
0
0.0%
5 to 9 Unit Apartments
0
0.0%
10 or more Apartments
0
0.0%
Mobile Home / Other
0
0.0%
Total
38
100.0%
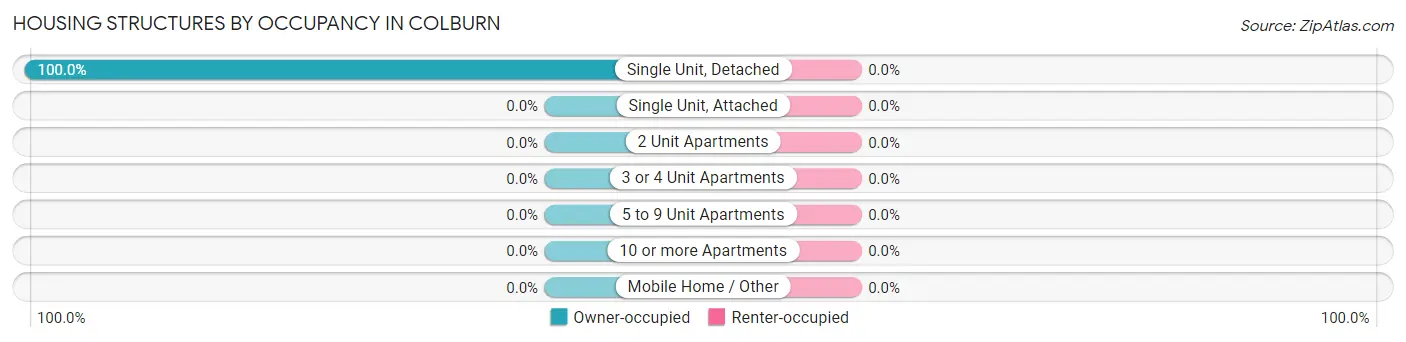
Housing Structures by Occupancy in Colburn
Structure Type
Owner-occupied
Renter-occupied
Single Unit, Detached
38 (100.0%)
0 (0.0%)
Single Unit, Attached
0 (0.0%)
0 (0.0%)
2 Unit Apartments
0 (0.0%)
0 (0.0%)
3 or 4 Unit Apartments
0 (0.0%)
0 (0.0%)
5 to 9 Unit Apartments
0 (0.0%)
0 (0.0%)
10 or more Apartments
0 (0.0%)
0 (0.0%)
Mobile Home / Other
0 (0.0%)
0 (0.0%)
Total
38 (100.0%)
0 (0.0%)
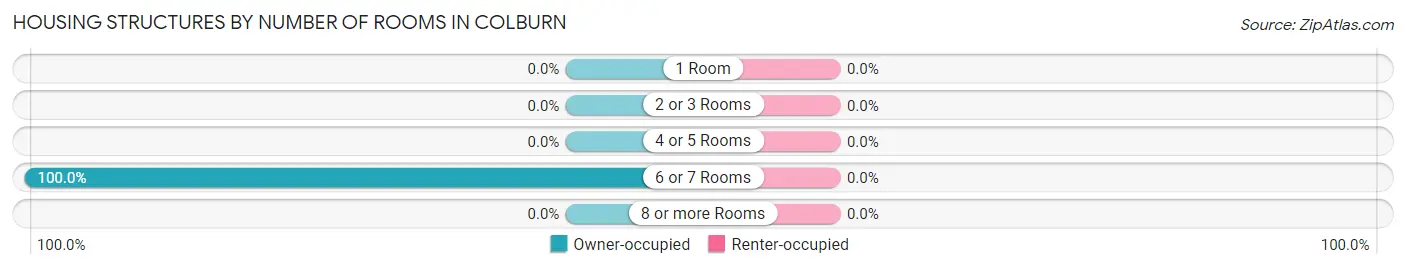
Housing Structures by Number of Rooms in Colburn
Number of Rooms
Owner-occupied
Renter-occupied
1 Room
0 (0.0%)
0 (0.0%)
2 or 3 Rooms
0 (0.0%)
0 (0.0%)
4 or 5 Rooms
0 (0.0%)
0 (0.0%)
6 or 7 Rooms
38 (100.0%)
0 (0.0%)
8 or more Rooms
0 (0.0%)
0 (0.0%)
Total
38 (100.0%)
0 (0.0%)
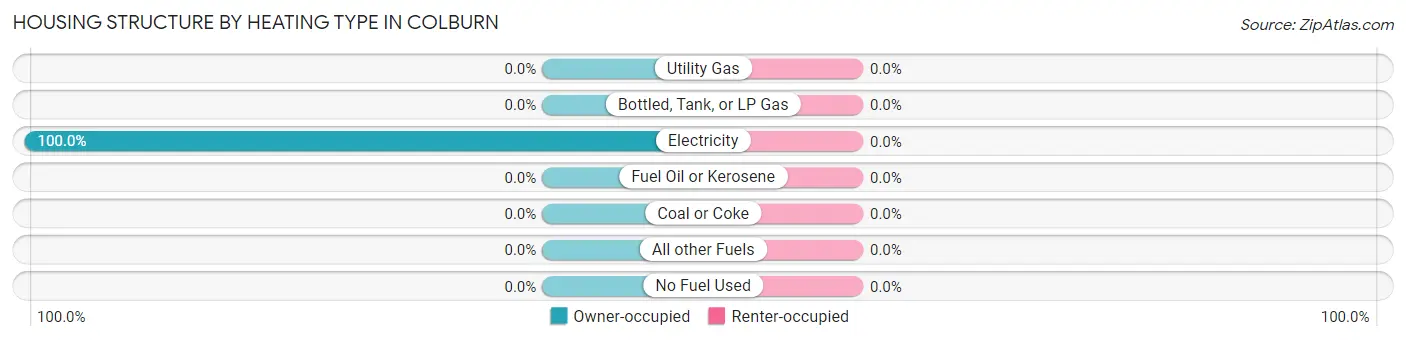
Housing Structure by Heating Type in Colburn
Heating Type
Owner-occupied
Renter-occupied
Utility Gas
0 (0.0%)
0 (0.0%)
Bottled, Tank, or LP Gas
0 (0.0%)
0 (0.0%)
Electricity
38 (100.0%)
0 (0.0%)
Fuel Oil or Kerosene
0 (0.0%)
0 (0.0%)
Coal or Coke
0 (0.0%)
0 (0.0%)
All other Fuels
0 (0.0%)
0 (0.0%)
No Fuel Used
0 (0.0%)
0 (0.0%)
Total
38 (100.0%)
0 (0.0%)
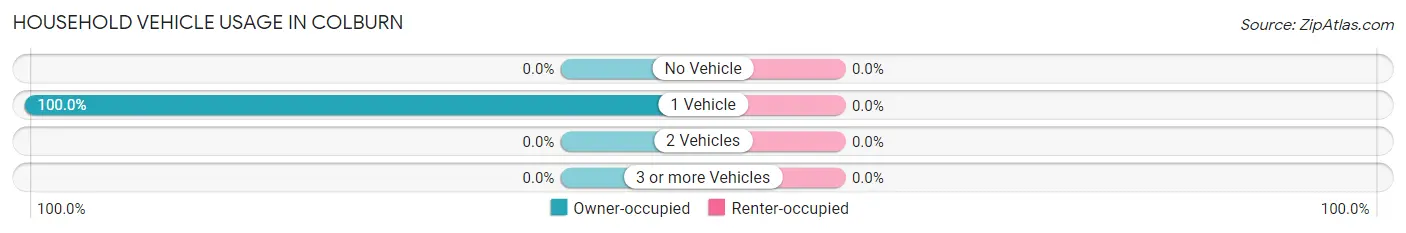
Household Vehicle Usage in Colburn
Vehicles per Household
Owner-occupied
Renter-occupied
No Vehicle
0 (0.0%)
0 (0.0%)
1 Vehicle
38 (100.0%)
0 (0.0%)
2 Vehicles
0 (0.0%)
0 (0.0%)
3 or more Vehicles
0 (0.0%)
0 (0.0%)
Total
38 (100.0%)
0 (0.0%)
Real Estate & Mortgages in Colburn
Real Estate and Mortgage Overview in Colburn
Characteristic
Without Mortgage
With Mortgage
Housing Units
38
0
Median Property Value
-
-
Median Household Income
-
-
Monthly Housing Costs
-
-
Real Estate Taxes
-
-
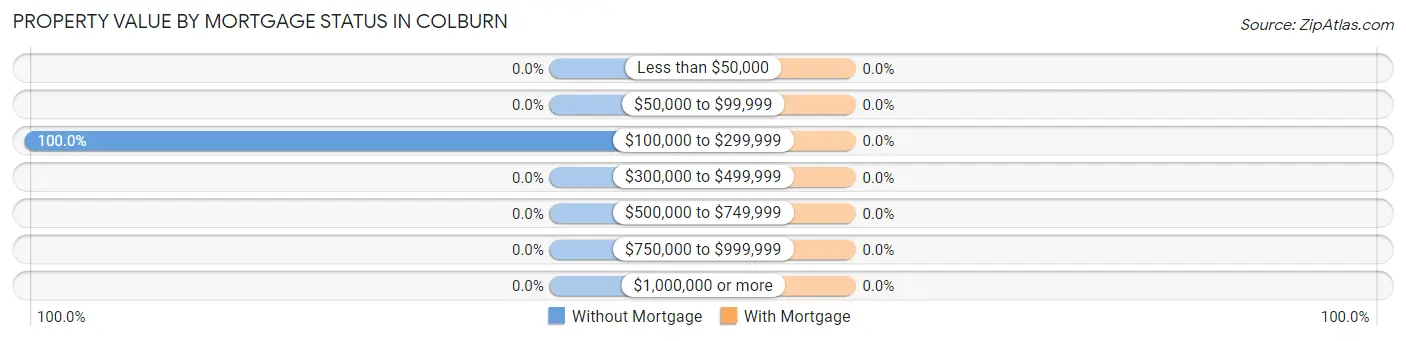
Property Value by Mortgage Status in Colburn
Property Value
Without Mortgage
With Mortgage
Less than $50,000
0 (0.0%)
0 (0.0%)
$50,000 to $99,999
0 (0.0%)
0 (0.0%)
$100,000 to $299,999
38 (100.0%)
0 (0.0%)
$300,000 to $499,999
0 (0.0%)
0 (0.0%)
$500,000 to $749,999
0 (0.0%)
0 (0.0%)
$750,000 to $999,999
0 (0.0%)
0 (0.0%)
$1,000,000 or more
0 (0.0%)
0 (0.0%)
Total
38 (100.0%)
0 (0.0%)
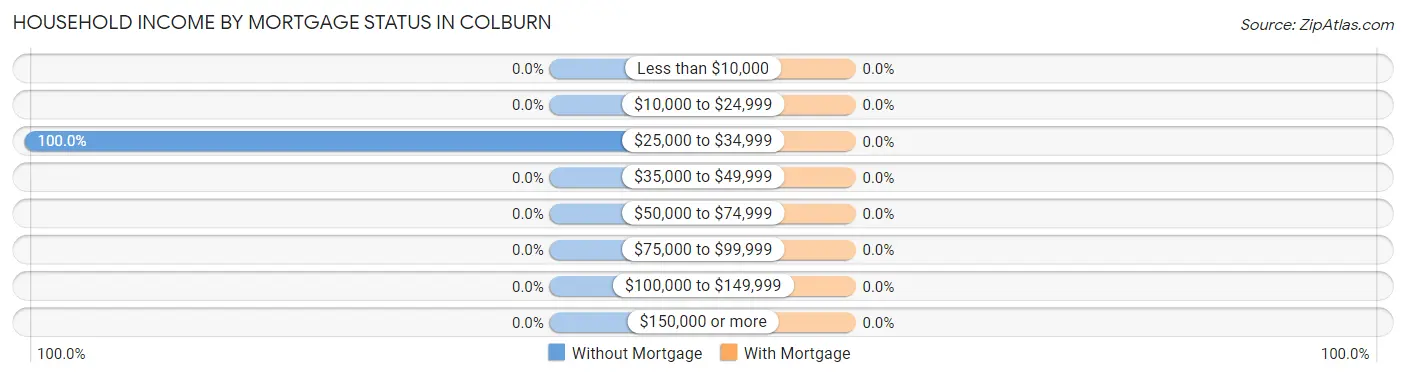
Household Income by Mortgage Status in Colburn
Household Income
Without Mortgage
With Mortgage
Less than $10,000
0 (0.0%)
0 (0.0%)
$10,000 to $24,999
0 (0.0%)
0 (0.0%)
$25,000 to $34,999
38 (100.0%)
0 (0.0%)
$35,000 to $49,999
0 (0.0%)
0 (0.0%)
$50,000 to $74,999
0 (0.0%)
0 (0.0%)
$75,000 to $99,999
0 (0.0%)
0 (0.0%)
$100,000 to $149,999
0 (0.0%)
0 (0.0%)
$150,000 or more
0 (0.0%)
0 (0.0%)
Total
38 (100.0%)
0 (0.0%)
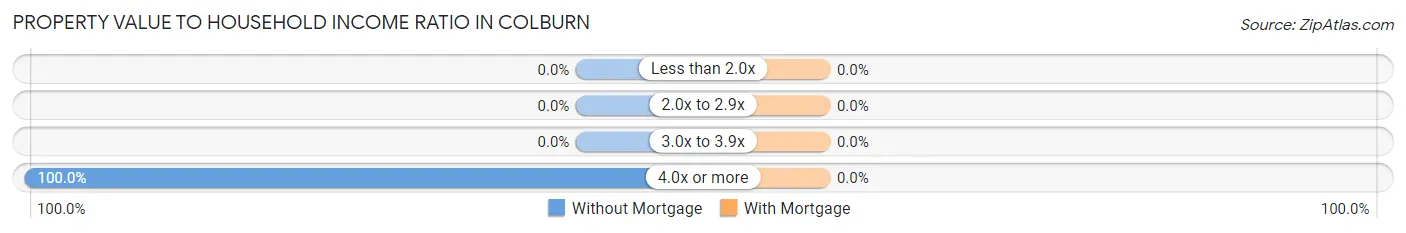
Property Value to Household Income Ratio in Colburn
Value-to-Income Ratio
Without Mortgage
With Mortgage
Less than 2.0x
0 (0.0%)
0 (0.0%)
2.0x to 2.9x
0 (0.0%)
0 (0.0%)
3.0x to 3.9x
0 (0.0%)
0 (0.0%)
4.0x or more
38 (100.0%)
0 (0.0%)
Total
38 (100.0%)
0 (0.0%)
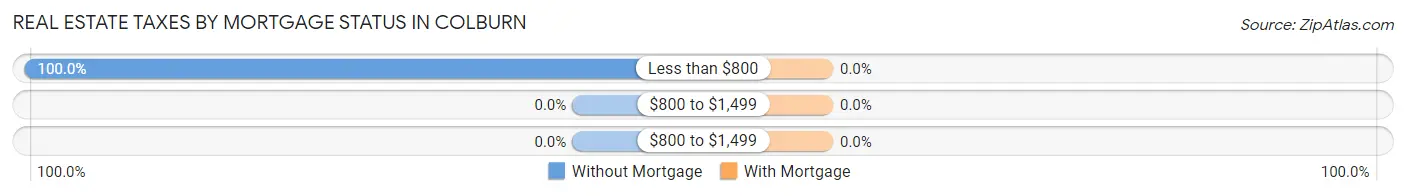
Real Estate Taxes by Mortgage Status in Colburn
Property Taxes
Without Mortgage
With Mortgage
Less than $800
38 (100.0%)
0 (0.0%)
$800 to $1,499
0 (0.0%)
0 (0.0%)
$800 to $1,499
0 (0.0%)
0 (0.0%)
Total
38 (100.0%)
0 (0.0%)
Health & Disability in Colburn
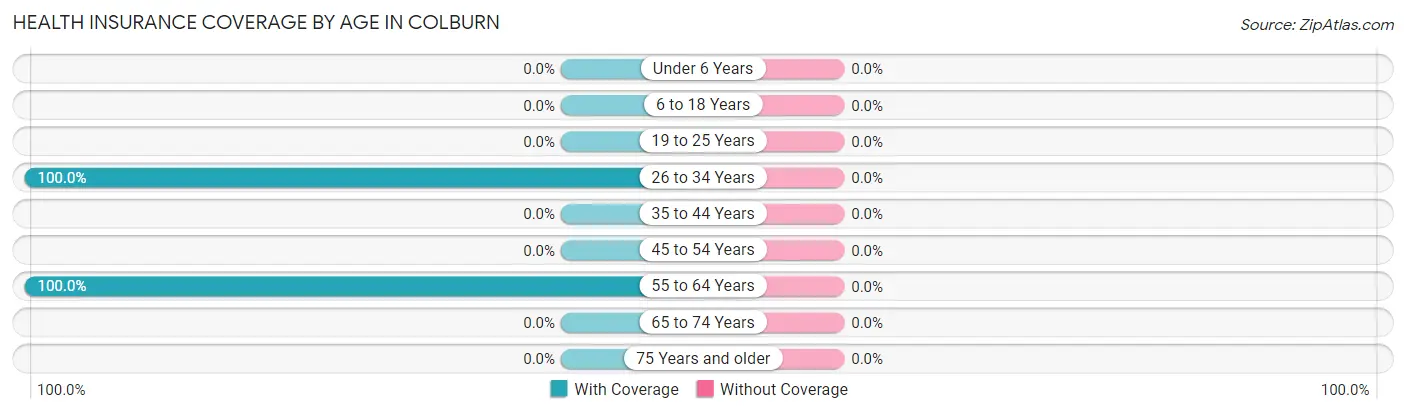
Health Insurance Coverage by Age in Colburn
Age Bracket
With Coverage
Without Coverage
Under 6 Years
0 (0.0%)
0 (0.0%)
6 to 18 Years
0 (0.0%)
0 (0.0%)
19 to 25 Years
0 (0.0%)
0 (0.0%)
26 to 34 Years
34 (100.0%)
0 (0.0%)
35 to 44 Years
0 (0.0%)
0 (0.0%)
45 to 54 Years
0 (0.0%)
0 (0.0%)
55 to 64 Years
38 (100.0%)
0 (0.0%)
65 to 74 Years
0 (0.0%)
0 (0.0%)
75 Years and older
0 (0.0%)
0 (0.0%)
Total
72 (100.0%)
0 (0.0%)
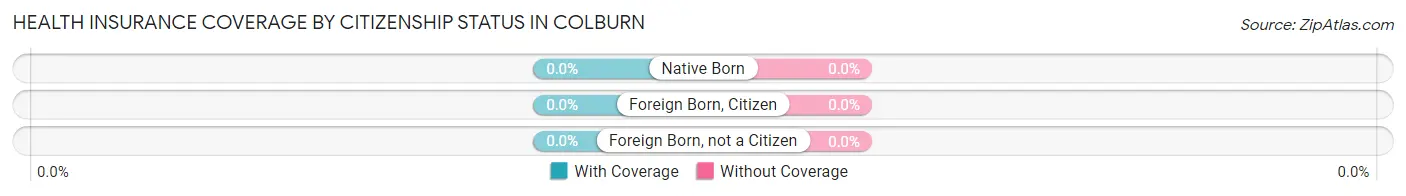
Health Insurance Coverage by Citizenship Status in Colburn
Citizenship Status
With Coverage
Without Coverage
Native Born
0 (0.0%)
0 (0.0%)
Foreign Born, Citizen
0 (0.0%)
0 (0.0%)
Foreign Born, not a Citizen
0 (0.0%)
0 (0.0%)
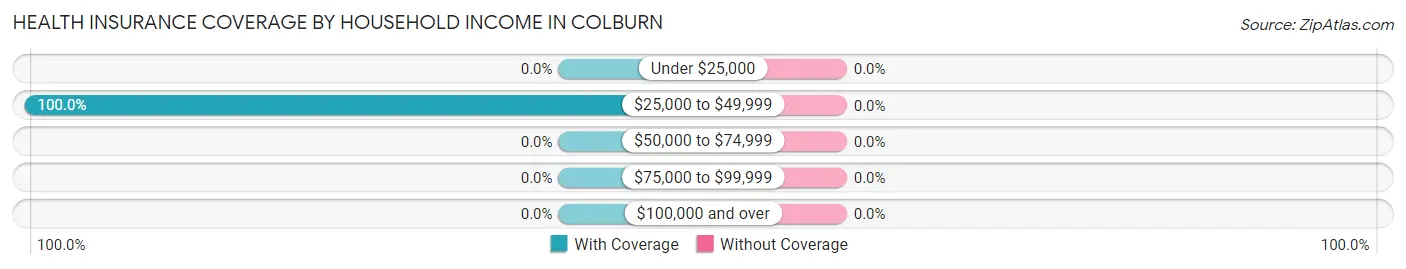
Health Insurance Coverage by Household Income in Colburn
Household Income
With Coverage
Without Coverage
Under $25,000
0 (0.0%)
0 (0.0%)
$25,000 to $49,999
72 (100.0%)
0 (0.0%)
$50,000 to $74,999
0 (0.0%)
0 (0.0%)
$75,000 to $99,999
0 (0.0%)
0 (0.0%)
$100,000 and over
0 (0.0%)
0 (0.0%)
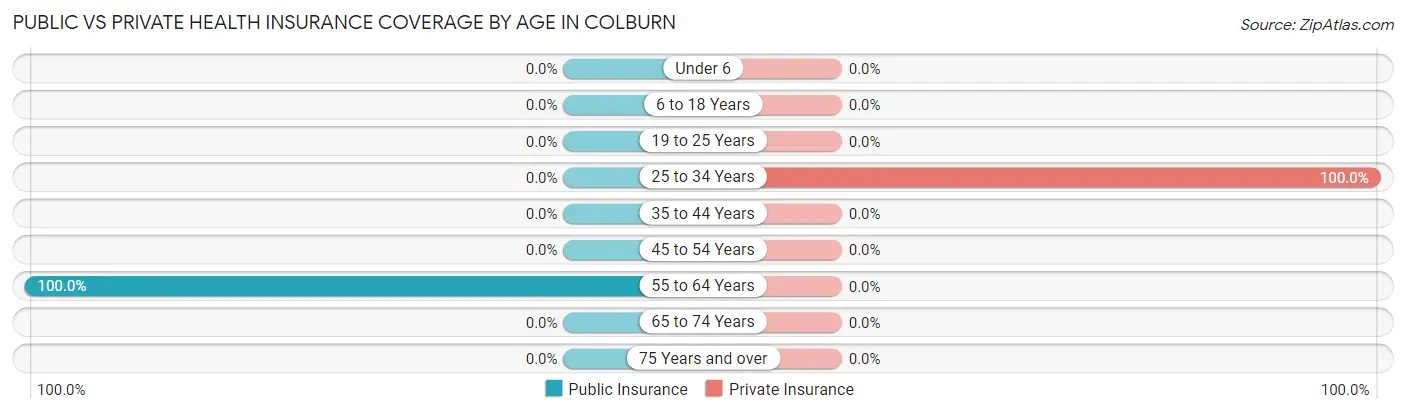
Public vs Private Health Insurance Coverage by Age in Colburn
Age Bracket
Public Insurance
Private Insurance
Under 6
0 (0.0%)
0 (0.0%)
6 to 18 Years
0 (0.0%)
0 (0.0%)
19 to 25 Years
0 (0.0%)
0 (0.0%)
25 to 34 Years
0 (0.0%)
34 (100.0%)
35 to 44 Years
0 (0.0%)
0 (0.0%)
45 to 54 Years
0 (0.0%)
0 (0.0%)
55 to 64 Years
38 (100.0%)
0 (0.0%)
65 to 74 Years
0 (0.0%)
0 (0.0%)
75 Years and over
0 (0.0%)
0 (0.0%)
Total
38 (52.8%)
34 (47.2%)
Disability Status by Sex by Age in Colburn
Age Bracket
Male
Female
Under 5 Years
0 (0.0%)
0 (0.0%)
5 to 17 Years
0 (0.0%)
0 (0.0%)
18 to 34 Years
0 (0.0%)
0 (0.0%)
35 to 64 Years
0 (0.0%)
0 (0.0%)
65 to 74 Years
0 (0.0%)
0 (0.0%)
75 Years and over
0 (0.0%)
0 (0.0%)
Disability Class by Sex by Age in Colburn
Disability Class: Hearing Difficulty
Age Bracket
Male
Female
Under 5 Years
0 (0.0%)
0 (0.0%)
5 to 17 Years
0 (0.0%)
0 (0.0%)
18 to 34 Years
0 (0.0%)
0 (0.0%)
35 to 64 Years
0 (0.0%)
0 (0.0%)
65 to 74 Years
0 (0.0%)
0 (0.0%)
75 Years and over
0 (0.0%)
0 (0.0%)
Disability Class: Vision Difficulty
Age Bracket
Male
Female
Under 5 Years
0 (0.0%)
0 (0.0%)
5 to 17 Years
0 (0.0%)
0 (0.0%)
18 to 34 Years
0 (0.0%)
0 (0.0%)
35 to 64 Years
0 (0.0%)
0 (0.0%)
65 to 74 Years
0 (0.0%)
0 (0.0%)
75 Years and over
0 (0.0%)
0 (0.0%)
Disability Class: Cognitive Difficulty
Age Bracket
Male
Female
5 to 17 Years
0 (0.0%)
0 (0.0%)
18 to 34 Years
0 (0.0%)
0 (0.0%)
35 to 64 Years
0 (0.0%)
0 (0.0%)
65 to 74 Years
0 (0.0%)
0 (0.0%)
75 Years and over
0 (0.0%)
0 (0.0%)
Disability Class: Ambulatory Difficulty
Age Bracket
Male
Female
5 to 17 Years
0 (0.0%)
0 (0.0%)
18 to 34 Years
0 (0.0%)
0 (0.0%)
35 to 64 Years
0 (0.0%)
0 (0.0%)
65 to 74 Years
0 (0.0%)
0 (0.0%)
75 Years and over
0 (0.0%)
0 (0.0%)
Disability Class: Self-Care Difficulty
Age Bracket
Male
Female
5 to 17 Years
0 (0.0%)
0 (0.0%)
18 to 34 Years
0 (0.0%)
0 (0.0%)
35 to 64 Years
0 (0.0%)
0 (0.0%)
65 to 74 Years
0 (0.0%)
0 (0.0%)
75 Years and over
0 (0.0%)
0 (0.0%)
Technology Access in Colburn
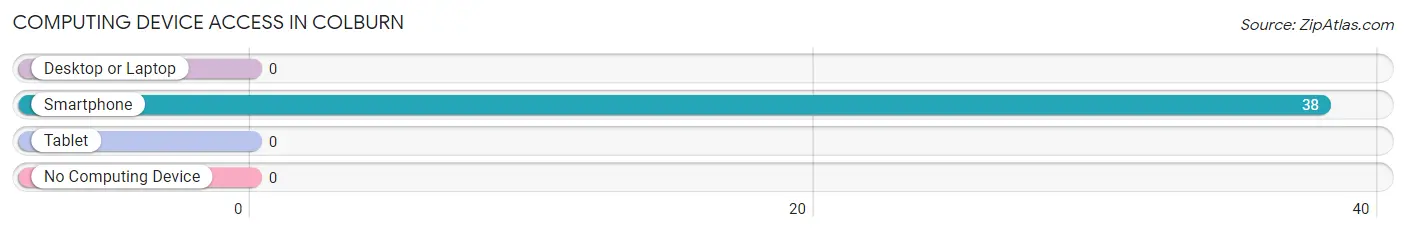
Computing Device Access in Colburn
Device Type
# Households
% Households
Desktop or Laptop
0
0.0%
Smartphone
38
100.0%
Tablet
0
0.0%
No Computing Device
0
0.0%
Total
38
100.0%
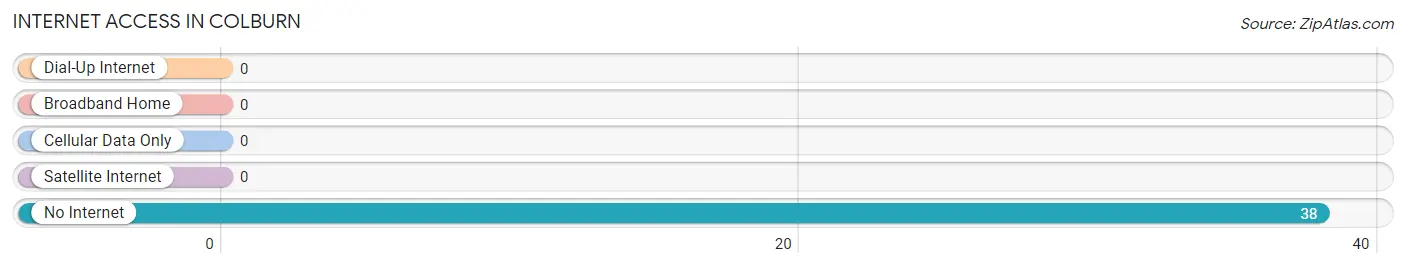
Internet Access in Colburn
Internet Type
# Households
% Households
Dial-Up Internet
0
0.0%
Broadband Home
0
0.0%
Cellular Data Only
0
0.0%
Satellite Internet
0
0.0%
No Internet
38
100.0%
Total
38
100.0%
Colburn Summary
Colburn is a small town located in White County, Indiana, United States. It is situated in the northwest corner of the state, approximately 20 miles south of the Illinois border. The population of Colburn was estimated to be 545 in the 2010 census.
History
Colburn was founded in 1837 by a group of settlers from Ohio. The town was named after a local landowner, John Colburn. The first post office was established in 1838 and the town was officially incorporated in 1867.
Colburn was a small farming community for much of its history. In the late 19th century, the town was home to a number of small businesses, including a general store, a blacksmith shop, and a sawmill.
In the early 20th century, Colburn experienced a period of growth and development. The town was connected to the outside world by the construction of a railroad line in 1906. This allowed for the shipment of goods and services to and from the town.
In the 1950s, Colburn experienced a period of decline as many of its businesses closed and the population began to decline. The town was able to remain afloat due to its proximity to the larger cities of Lafayette and Logansport.
Geography
Colburn is located in the northwest corner of White County, Indiana. It is situated approximately 20 miles south of the Illinois border and 40 miles north of Indianapolis. The town is located on the banks of the Tippecanoe River.
The terrain of Colburn is mostly flat, with some rolling hills in the surrounding area. The town is located in a temperate climate zone, with hot summers and cold winters.
Economy
Colburn’s economy is largely based on agriculture. The town is home to a number of small farms, which produce a variety of crops, including corn, soybeans, and wheat.
The town is also home to a number of small businesses, including a general store, a hardware store, and a restaurant.
Demographics
According to the 2010 census, the population of Colburn was 545. The racial makeup of the town was 97.3% White, 0.7% African American, 0.2% Native American, 0.2% Asian, and 1.6% from other races.
The median household income in Colburn was $37,500, and the median family income was $45,000. The per capita income was $18,000.
Conclusion
Colburn is a small town located in White County, Indiana. It was founded in 1837 and has a population of 545, according to the 2010 census. The town’s economy is largely based on agriculture, and it is home to a number of small businesses. The racial makeup of the town is predominantly White, with a small percentage of African American, Native American, and Asian residents.
Common Questions
What is the Total Population of Colburn?
Total Population of Colburn is 72.
What is the Total Female Population of Colburn?
Total Female Population of Colburn is 72.
What is the Average Family Size in Colburn
Average Family Size in Colburn is 1.9 People.
What is the Average Household Size in Colburn
Average Household Size in Colburn is 1.9 People.
How Large is the Labor Force in Colburn?
There are 34 People in the Labor Forcein in Colburn.
What is the Percentage of People in the Labor Force in Colburn?
47.2% of People are in the Labor Force in Colburn.
Report Title
Report Link
HTML Copy & Paste Link
Social Media
Copy and paste the folowing code into any webpage where you would like this interactive chart to display