Centerville, IN Map & Demographics
Centerville Map
Centerville Overview
$27,373
PER CAPITA INCOME
$60,458
AVG FAMILY INCOME
$51,071
AVG HOUSEHOLD INCOME
42.5%
WAGE / INCOME GAP [ % ]
57.5¢/ $1
WAGE / INCOME GAP [ $ ]
$12,785
FAMILY INCOME DEFICIT
0.43
INEQUALITY / GINI INDEX
2,760
TOTAL POPULATION
1,401
MALE POPULATION
1,359
FEMALE POPULATION
103.09
MALES / 100 FEMALES
97.00
FEMALES / 100 MALES
40.0
MEDIAN AGE
2.8
AVG FAMILY SIZE
2.4
AVG HOUSEHOLD SIZE
1,236
LABOR FORCE [ PEOPLE ]
59.4%
PERCENT IN LABOR FORCE
5.2%
UNEMPLOYMENT RATE
Centerville Zip Codes
Centerville Area Codes
Income in Centerville
Income Overview in Centerville
Per Capita Income in Centerville is $27,373, while median incomes of families and households are $60,458 and $51,071 respectively.
| Characteristic | Number | Measure |
| Per Capita Income | 2,760 | $27,373 |
| Median Family Income | 733 | $60,458 |
| Mean Family Income | 733 | $79,375 |
| Median Household Income | 1,086 | $51,071 |
| Mean Household Income | 1,086 | $66,867 |
| Income Deficit | 733 | $12,785 |
| Wage / Income Gap (%) | 2,760 | 42.51% |
| Wage / Income Gap ($) | 2,760 | 57.49¢ per $1 |
| Gini / Inequality Index | 2,760 | 0.43 |
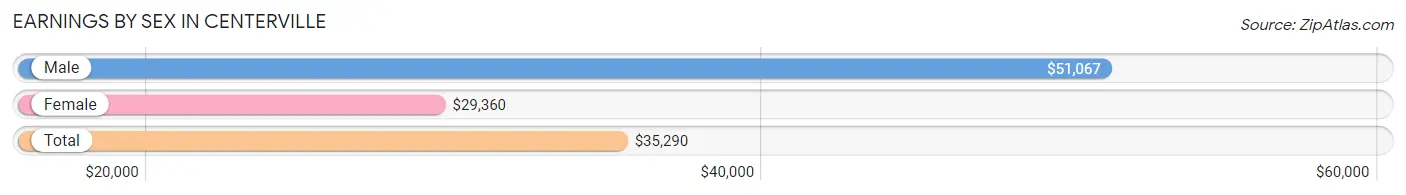
Earnings by Sex in Centerville
Average Earnings in Centerville are $35,290, $51,067 for men and $29,360 for women, a difference of 42.5%.
| Sex | Number | Average Earnings |
| Male | 627 (47.6%) | $51,067 |
| Female | 691 (52.4%) | $29,360 |
| Total | 1,318 (100.0%) | $35,290 |
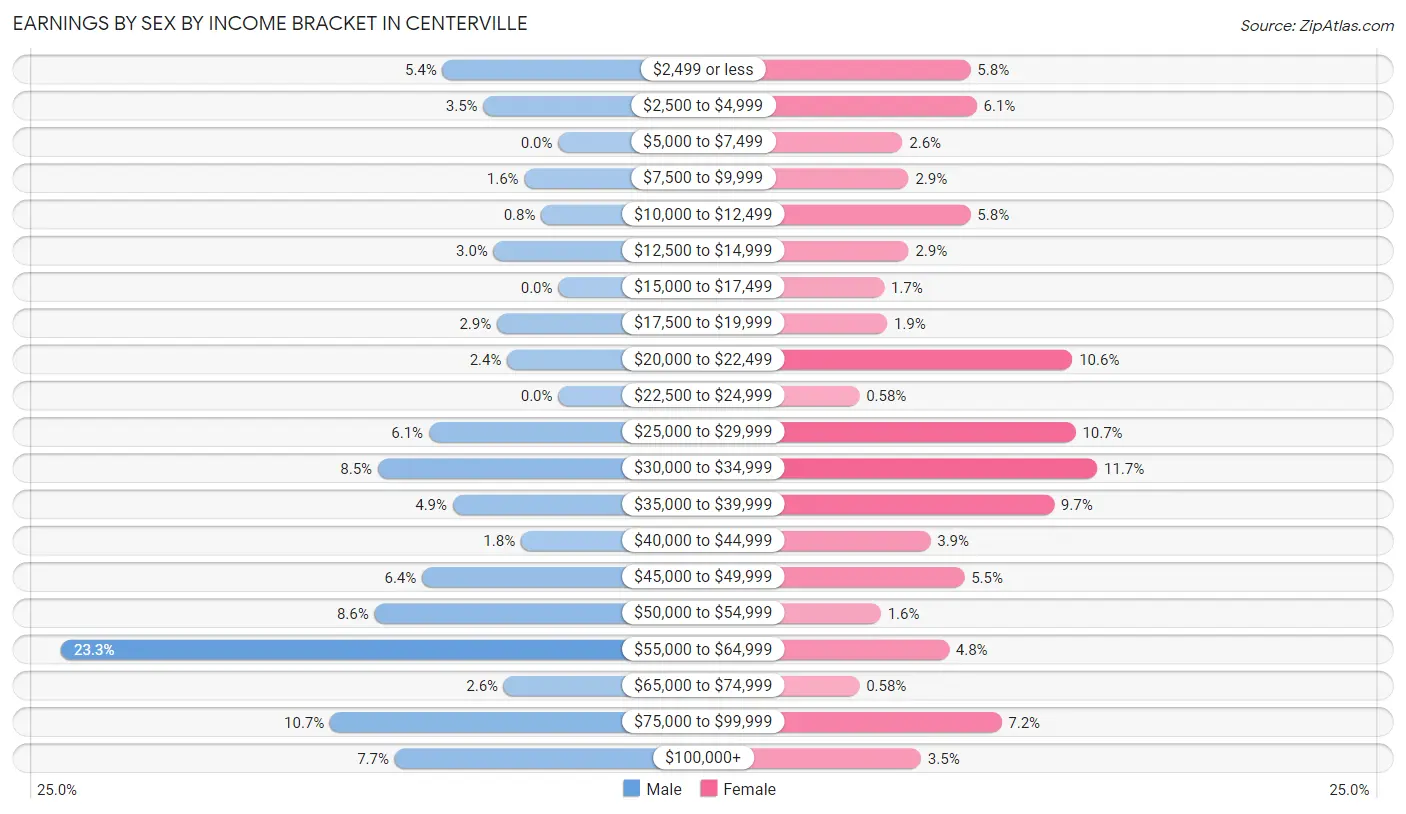
Earnings by Sex by Income Bracket in Centerville
The most common earnings brackets in Centerville are $55,000 to $64,999 for men (146 | 23.3%) and $30,000 to $34,999 for women (81 | 11.7%).
| Income | Male | Female |
| $2,499 or less | 34 (5.4%) | 40 (5.8%) |
| $2,500 to $4,999 | 22 (3.5%) | 42 (6.1%) |
| $5,000 to $7,499 | 0 (0.0%) | 18 (2.6%) |
| $7,500 to $9,999 | 10 (1.6%) | 20 (2.9%) |
| $10,000 to $12,499 | 5 (0.8%) | 40 (5.8%) |
| $12,500 to $14,999 | 19 (3.0%) | 20 (2.9%) |
| $15,000 to $17,499 | 0 (0.0%) | 12 (1.7%) |
| $17,500 to $19,999 | 18 (2.9%) | 13 (1.9%) |
| $20,000 to $22,499 | 15 (2.4%) | 73 (10.6%) |
| $22,500 to $24,999 | 0 (0.0%) | 4 (0.6%) |
| $25,000 to $29,999 | 38 (6.1%) | 74 (10.7%) |
| $30,000 to $34,999 | 53 (8.5%) | 81 (11.7%) |
| $35,000 to $39,999 | 31 (4.9%) | 67 (9.7%) |
| $40,000 to $44,999 | 11 (1.8%) | 27 (3.9%) |
| $45,000 to $49,999 | 40 (6.4%) | 38 (5.5%) |
| $50,000 to $54,999 | 54 (8.6%) | 11 (1.6%) |
| $55,000 to $64,999 | 146 (23.3%) | 33 (4.8%) |
| $65,000 to $74,999 | 16 (2.5%) | 4 (0.6%) |
| $75,000 to $99,999 | 67 (10.7%) | 50 (7.2%) |
| $100,000+ | 48 (7.7%) | 24 (3.5%) |
| Total | 627 (100.0%) | 691 (100.0%) |
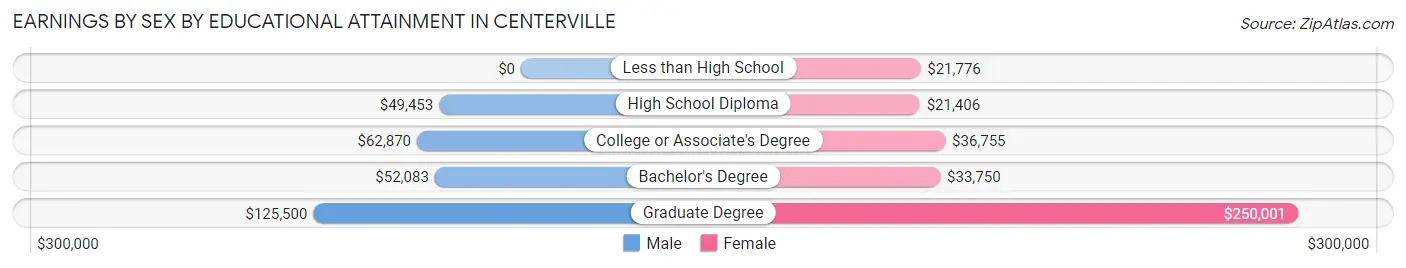
Earnings by Sex by Educational Attainment in Centerville
Average earnings in Centerville are $54,327 for men and $32,971 for women, a difference of 39.3%. Men with an educational attainment of graduate degree enjoy the highest average annual earnings of $125,500, while those with high school diploma education earn the least with $49,453. Women with an educational attainment of graduate degree earn the most with the average annual earnings of $250,001, while those with high school diploma education have the smallest earnings of $21,406.
| Educational Attainment | Male Income | Female Income |
| Less than High School | - | - |
| High School Diploma | $49,453 | $21,406 |
| College or Associate's Degree | $62,870 | $36,755 |
| Bachelor's Degree | $52,083 | $33,750 |
| Graduate Degree | $125,500 | $250,001 |
| Total | $54,327 | $32,971 |
Family Income in Centerville
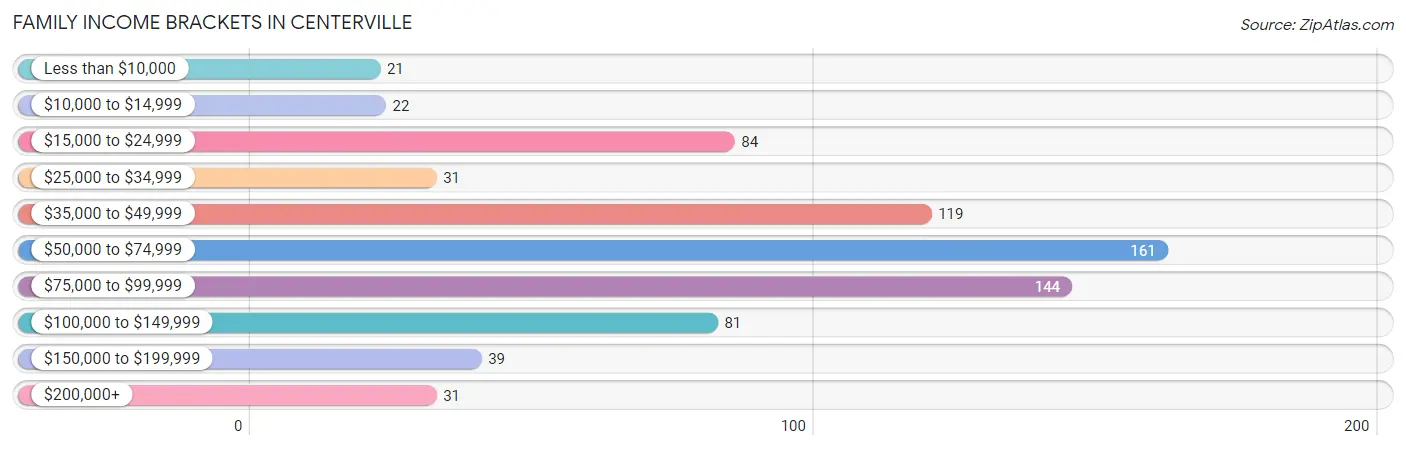
Family Income Brackets in Centerville
According to the Centerville family income data, there are 161 families falling into the $50,000 to $74,999 income range, which is the most common income bracket and makes up 22.0% of all families. Conversely, the less than $10,000 income bracket is the least frequent group with only 21 families (2.9%) belonging to this category.
| Income Bracket | # Families | % Families |
| Less than $10,000 | 21 | 2.9% |
| $10,000 to $14,999 | 22 | 3.0% |
| $15,000 to $24,999 | 84 | 11.5% |
| $25,000 to $34,999 | 31 | 4.2% |
| $35,000 to $49,999 | 119 | 16.2% |
| $50,000 to $74,999 | 161 | 22.0% |
| $75,000 to $99,999 | 144 | 19.6% |
| $100,000 to $149,999 | 81 | 11.1% |
| $150,000 to $199,999 | 39 | 5.3% |
| $200,000+ | 31 | 4.2% |
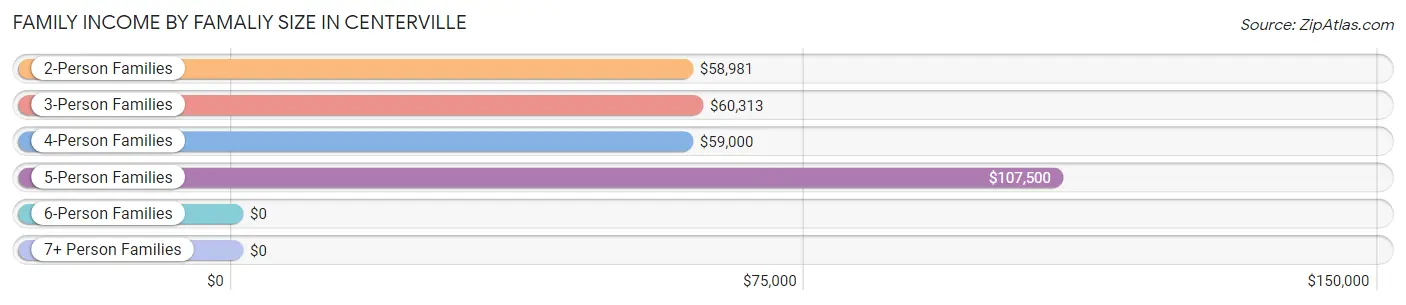
Family Income by Famaliy Size in Centerville
5-person families (20 | 2.7%) account for the highest median family income in Centerville with $107,500 per family, while 2-person families (378 | 51.6%) have the highest median income of $29,490 per family member.
| Income Bracket | # Families | Median Income |
| 2-Person Families | 378 (51.6%) | $58,981 |
| 3-Person Families | 188 (25.7%) | $60,313 |
| 4-Person Families | 134 (18.3%) | $59,000 |
| 5-Person Families | 20 (2.7%) | $107,500 |
| 6-Person Families | 13 (1.8%) | $0 |
| 7+ Person Families | 0 (0.0%) | $0 |
| Total | 733 (100.0%) | $60,458 |
Family Income by Number of Earners in Centerville
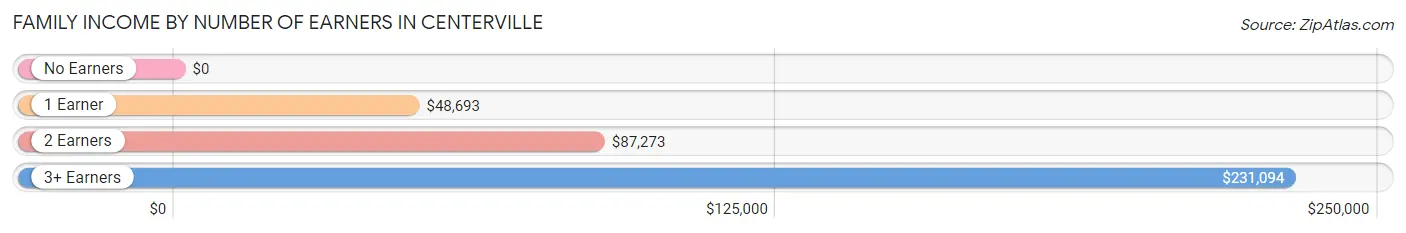
| Number of Earners | # Families | Median Income |
| No Earners | 103 (14.1%) | $0 |
| 1 Earner | 263 (35.9%) | $48,693 |
| 2 Earners | 346 (47.2%) | $87,273 |
| 3+ Earners | 21 (2.9%) | $231,094 |
| Total | 733 (100.0%) | $60,458 |
Household Income in Centerville
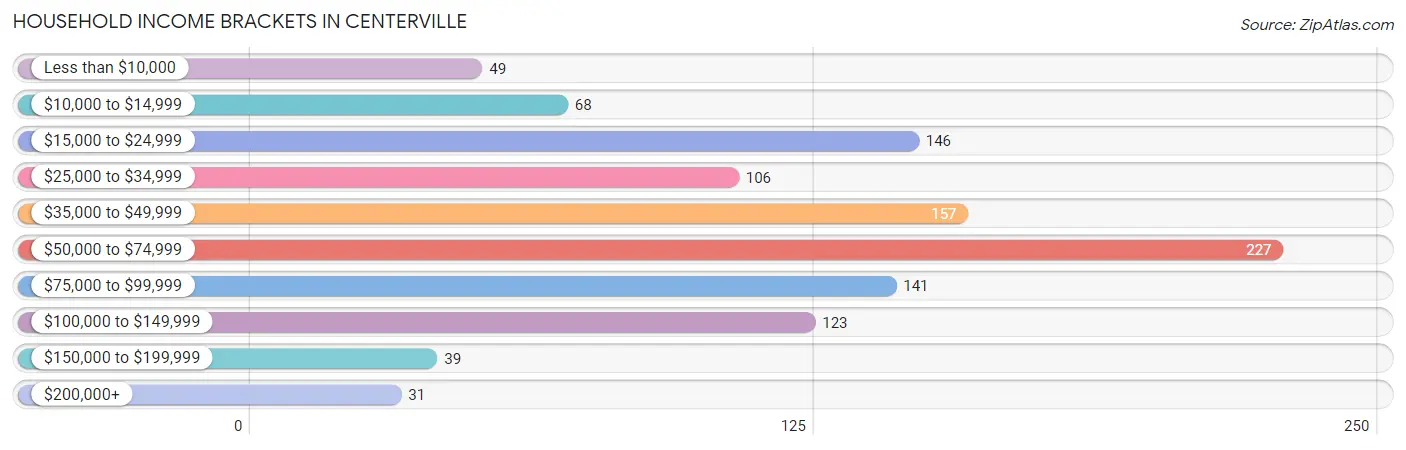
Household Income Brackets in Centerville
With 227 households falling in the category, the $50,000 to $74,999 income range is the most frequent in Centerville, accounting for 20.9% of all households. In contrast, only 31 households (2.9%) fall into the $200,000+ income bracket, making it the least populous group.
| Income Bracket | # Households | % Households |
| Less than $10,000 | 49 | 4.5% |
| $10,000 to $14,999 | 68 | 6.3% |
| $15,000 to $24,999 | 146 | 13.4% |
| $25,000 to $34,999 | 106 | 9.8% |
| $35,000 to $49,999 | 157 | 14.5% |
| $50,000 to $74,999 | 227 | 20.9% |
| $75,000 to $99,999 | 141 | 13.0% |
| $100,000 to $149,999 | 123 | 11.3% |
| $150,000 to $199,999 | 39 | 3.6% |
| $200,000+ | 31 | 2.9% |
Household Income by Householder Age in Centerville
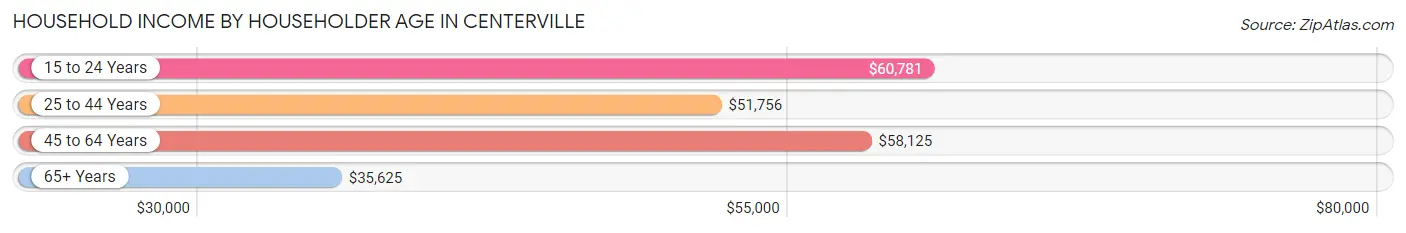
The median household income in Centerville is $51,071, with the highest median household income of $60,781 found in the 15 to 24 years age bracket for the primary householder. A total of 40 households (3.7%) fall into this category. Meanwhile, the 65+ years age bracket for the primary householder has the lowest median household income of $35,625, with 209 households (19.2%) in this group.
| Income Bracket | # Households | Median Income |
| 15 to 24 Years | 40 (3.7%) | $60,781 |
| 25 to 44 Years | 423 (39.0%) | $51,756 |
| 45 to 64 Years | 414 (38.1%) | $58,125 |
| 65+ Years | 209 (19.2%) | $35,625 |
| Total | 1,086 (100.0%) | $51,071 |
Poverty in Centerville
Income Below Poverty by Sex and Age in Centerville
With 14.7% poverty level for males and 13.7% for females among the residents of Centerville, 16 and 17 year old males and 15 year old females are the most vulnerable to poverty, with 37 males (54.4%) and 20 females (62.5%) in their respective age groups living below the poverty level.
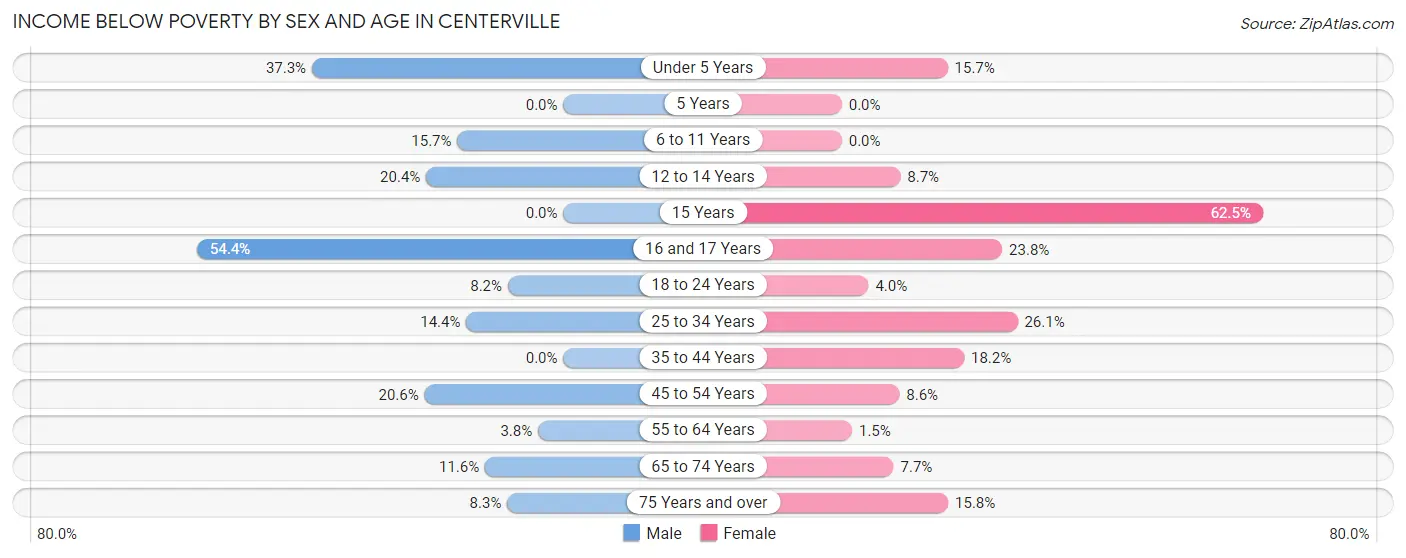
| Age Bracket | Male | Female |
| Under 5 Years | 28 (37.3%) | 11 (15.7%) |
| 5 Years | 0 (0.0%) | 0 (0.0%) |
| 6 to 11 Years | 17 (15.7%) | 0 (0.0%) |
| 12 to 14 Years | 11 (20.4%) | 6 (8.7%) |
| 15 Years | 0 (0.0%) | 20 (62.5%) |
| 16 and 17 Years | 37 (54.4%) | 10 (23.8%) |
| 18 to 24 Years | 7 (8.2%) | 4 (4.0%) |
| 25 to 34 Years | 17 (14.4%) | 42 (26.1%) |
| 35 to 44 Years | 0 (0.0%) | 49 (18.1%) |
| 45 to 54 Years | 47 (20.6%) | 13 (8.6%) |
| 55 to 64 Years | 5 (3.8%) | 2 (1.5%) |
| 65 to 74 Years | 15 (11.6%) | 6 (7.7%) |
| 75 Years and over | 4 (8.3%) | 12 (15.8%) |
| Total | 188 (14.7%) | 175 (13.7%) |
Income Above Poverty by Sex and Age in Centerville
According to the poverty statistics in Centerville, males aged 5 years and females aged 5 years are the age groups that are most secure financially, with 100.0% of males and 100.0% of females in these age groups living above the poverty line.
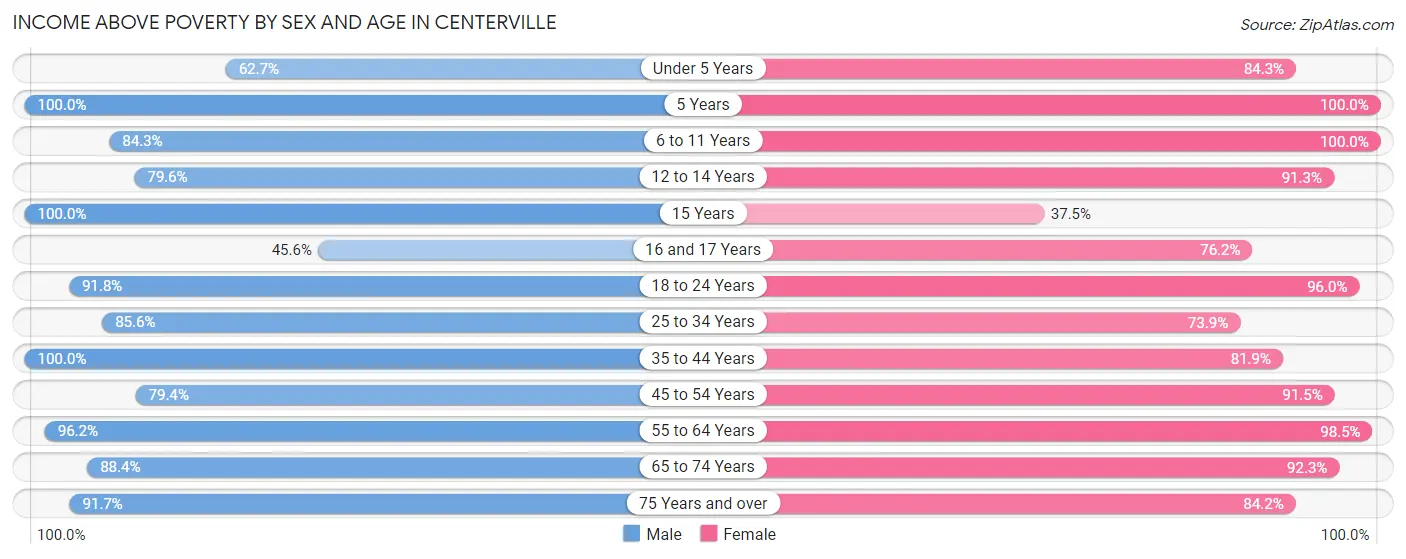
| Age Bracket | Male | Female |
| Under 5 Years | 47 (62.7%) | 59 (84.3%) |
| 5 Years | 15 (100.0%) | 8 (100.0%) |
| 6 to 11 Years | 91 (84.3%) | 87 (100.0%) |
| 12 to 14 Years | 43 (79.6%) | 63 (91.3%) |
| 15 Years | 72 (100.0%) | 12 (37.5%) |
| 16 and 17 Years | 31 (45.6%) | 32 (76.2%) |
| 18 to 24 Years | 78 (91.8%) | 97 (96.0%) |
| 25 to 34 Years | 101 (85.6%) | 119 (73.9%) |
| 35 to 44 Years | 142 (100.0%) | 221 (81.9%) |
| 45 to 54 Years | 181 (79.4%) | 139 (91.4%) |
| 55 to 64 Years | 128 (96.2%) | 130 (98.5%) |
| 65 to 74 Years | 114 (88.4%) | 72 (92.3%) |
| 75 Years and over | 44 (91.7%) | 64 (84.2%) |
| Total | 1,087 (85.3%) | 1,103 (86.3%) |
Income Below Poverty Among Married-Couple Families in Centerville
The poverty statistics for married-couple families in Centerville show that 6.8% or 30 of the total 440 families live below the poverty line. Families with 1 or 2 children have the highest poverty rate of 8.6%, comprising of 12 families. On the other hand, families with 3 or 4 children have the lowest poverty rate of 0.0%, which includes 0 families.
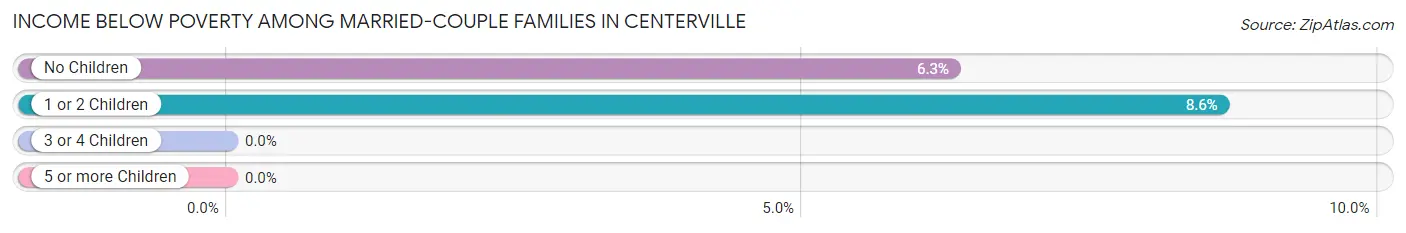
| Children | Above Poverty | Below Poverty |
| No Children | 268 (93.7%) | 18 (6.3%) |
| 1 or 2 Children | 127 (91.4%) | 12 (8.6%) |
| 3 or 4 Children | 15 (100.0%) | 0 (0.0%) |
| 5 or more Children | 0 (0.0%) | 0 (0.0%) |
| Total | 410 (93.2%) | 30 (6.8%) |
Income Below Poverty Among Single-Parent Households in Centerville
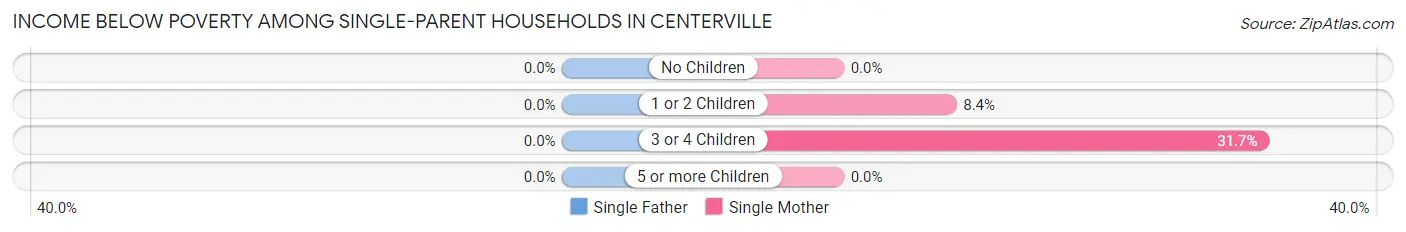
| Children | Single Father | Single Mother |
| No Children | 0 (0.0%) | 0 (0.0%) |
| 1 or 2 Children | 0 (0.0%) | 12 (8.4%) |
| 3 or 4 Children | 0 (0.0%) | 13 (31.7%) |
| 5 or more Children | 0 (0.0%) | 0 (0.0%) |
| Total | 0 (0.0%) | 25 (10.5%) |
Income Below Poverty Among Married-Couple vs Single-Parent Households in Centerville
The poverty data for Centerville shows that 30 of the married-couple family households (6.8%) and 25 of the single-parent households (8.5%) are living below the poverty level. Within the married-couple family households, those with 1 or 2 children have the highest poverty rate, with 12 households (8.6%) falling below the poverty line. Among the single-parent households, those with 3 or 4 children have the highest poverty rate, with 13 household (31.7%) living below poverty.
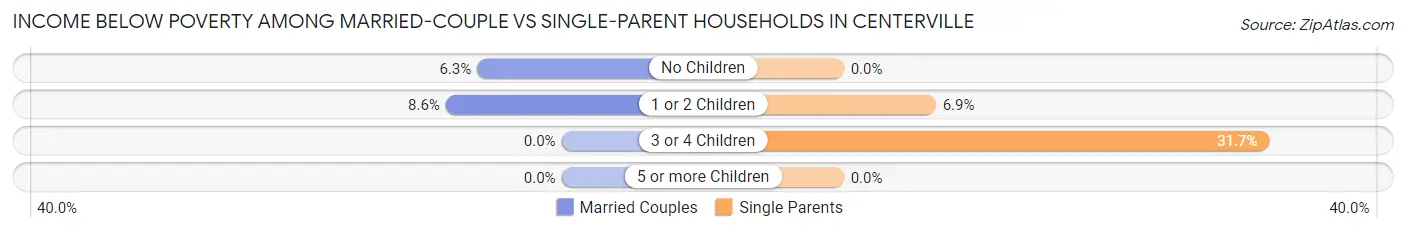
| Children | Married-Couple Families | Single-Parent Households |
| No Children | 18 (6.3%) | 0 (0.0%) |
| 1 or 2 Children | 12 (8.6%) | 12 (6.9%) |
| 3 or 4 Children | 0 (0.0%) | 13 (31.7%) |
| 5 or more Children | 0 (0.0%) | 0 (0.0%) |
| Total | 30 (6.8%) | 25 (8.5%) |
Race in Centerville
The most populous races in Centerville are White / Caucasian (2,524 | 91.4%), Hispanic or Latino (222 | 8.0%), and Two or more Races (120 | 4.3%).
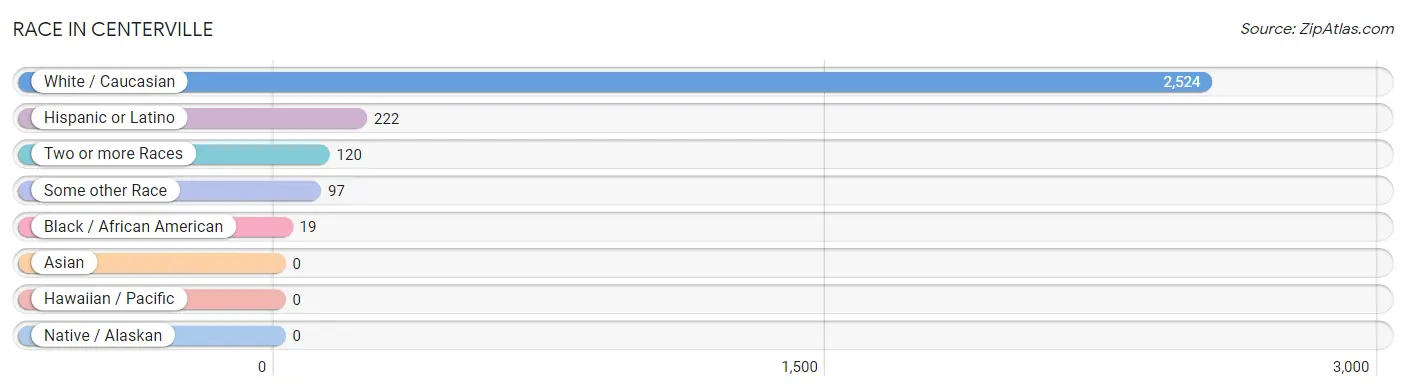
| Race | # Population | % Population |
| Asian | 0 | 0.0% |
| Black / African American | 19 | 0.7% |
| Hawaiian / Pacific | 0 | 0.0% |
| Hispanic or Latino | 222 | 8.0% |
| Native / Alaskan | 0 | 0.0% |
| White / Caucasian | 2,524 | 91.4% |
| Two or more Races | 120 | 4.3% |
| Some other Race | 97 | 3.5% |
| Total | 2,760 | 100.0% |
Ancestry in Centerville
The most populous ancestries reported in Centerville are German (563 | 20.4%), Irish (363 | 13.2%), English (309 | 11.2%), American (157 | 5.7%), and Mexican (155 | 5.6%), together accounting for 56.1% of all Centerville residents.
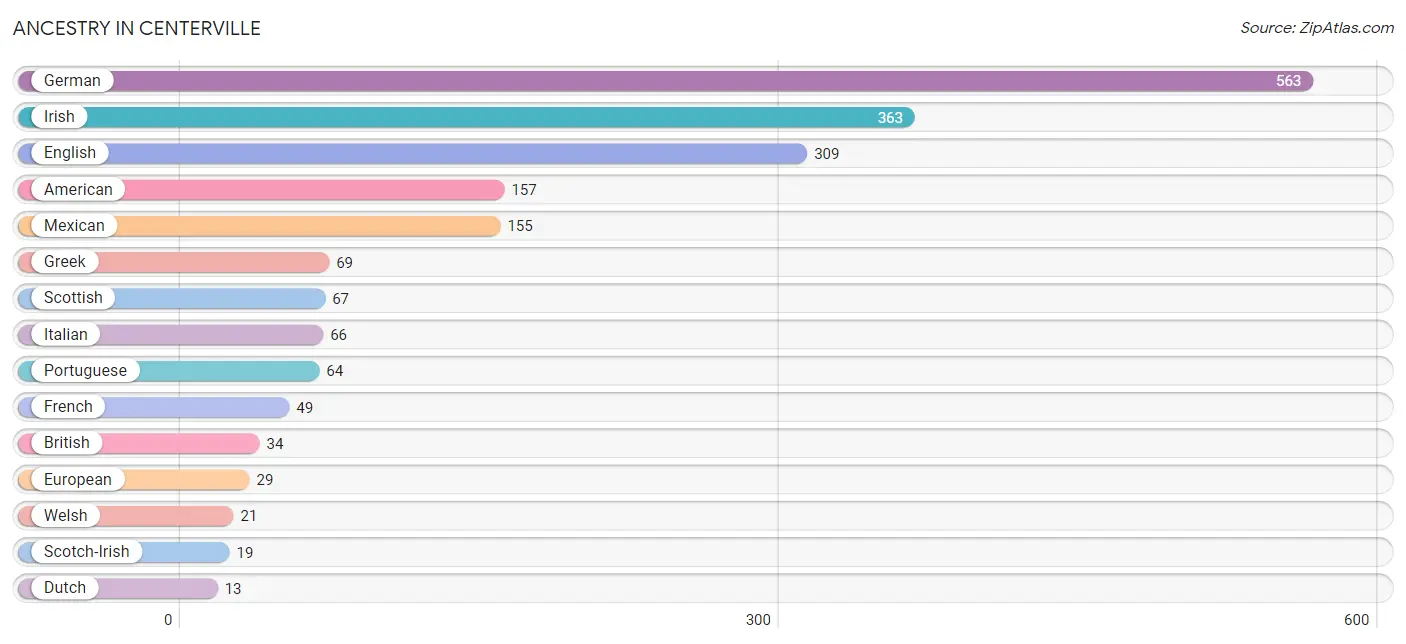
| Ancestry | # Population | % Population |
| African | 7 | 0.3% |
| American | 157 | 5.7% |
| British | 34 | 1.2% |
| Cherokee | 7 | 0.3% |
| Cuban | 6 | 0.2% |
| Dutch | 13 | 0.5% |
| English | 309 | 11.2% |
| European | 29 | 1.1% |
| French | 49 | 1.8% |
| German | 563 | 20.4% |
| Greek | 69 | 2.5% |
| Irish | 363 | 13.2% |
| Italian | 66 | 2.4% |
| Mexican | 155 | 5.6% |
| Pennsylvania German | 3 | 0.1% |
| Polish | 7 | 0.3% |
| Portuguese | 64 | 2.3% |
| Puerto Rican | 4 | 0.1% |
| Scotch-Irish | 19 | 0.7% |
| Scottish | 67 | 2.4% |
| Slovene | 3 | 0.1% |
| Subsaharan African | 7 | 0.3% |
| Welsh | 21 | 0.8% | View All 23 Rows |
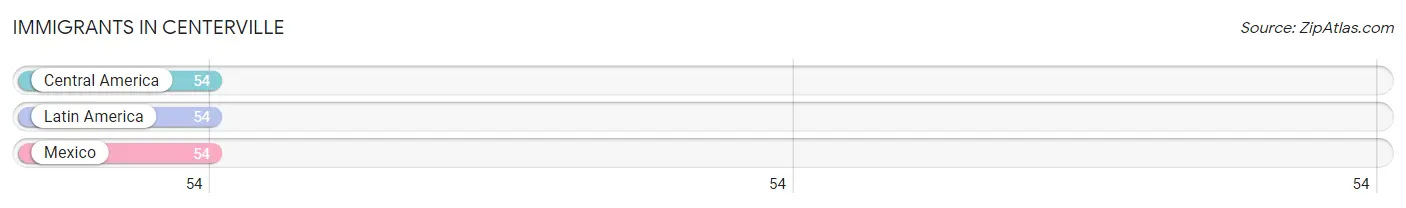
Immigrants in Centerville
The most numerous immigrant groups reported in Centerville came from Central America (54 | 2.0%), Latin America (54 | 2.0%), and Mexico (54 | 2.0%), together accounting for 5.9% of all Centerville residents.
| Immigration Origin | # Population | % Population |
| Central America | 54 | 2.0% |
| Latin America | 54 | 2.0% |
| Mexico | 54 | 2.0% | View All 3 Rows |
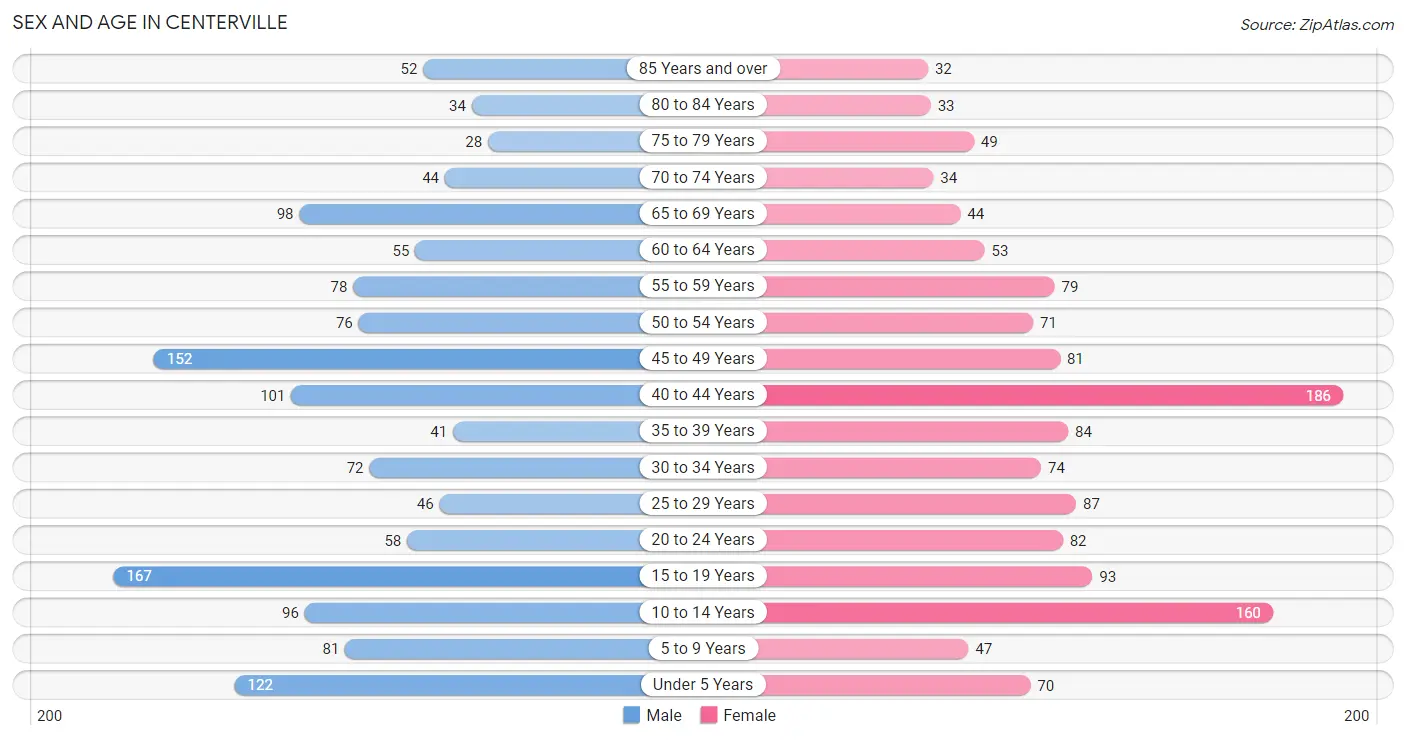
Sex and Age in Centerville
Sex and Age in Centerville
The most populous age groups in Centerville are 15 to 19 Years (167 | 11.9%) for men and 40 to 44 Years (186 | 13.7%) for women.
| Age Bracket | Male | Female |
| Under 5 Years | 122 (8.7%) | 70 (5.1%) |
| 5 to 9 Years | 81 (5.8%) | 47 (3.5%) |
| 10 to 14 Years | 96 (6.9%) | 160 (11.8%) |
| 15 to 19 Years | 167 (11.9%) | 93 (6.8%) |
| 20 to 24 Years | 58 (4.1%) | 82 (6.0%) |
| 25 to 29 Years | 46 (3.3%) | 87 (6.4%) |
| 30 to 34 Years | 72 (5.1%) | 74 (5.4%) |
| 35 to 39 Years | 41 (2.9%) | 84 (6.2%) |
| 40 to 44 Years | 101 (7.2%) | 186 (13.7%) |
| 45 to 49 Years | 152 (10.8%) | 81 (6.0%) |
| 50 to 54 Years | 76 (5.4%) | 71 (5.2%) |
| 55 to 59 Years | 78 (5.6%) | 79 (5.8%) |
| 60 to 64 Years | 55 (3.9%) | 53 (3.9%) |
| 65 to 69 Years | 98 (7.0%) | 44 (3.2%) |
| 70 to 74 Years | 44 (3.1%) | 34 (2.5%) |
| 75 to 79 Years | 28 (2.0%) | 49 (3.6%) |
| 80 to 84 Years | 34 (2.4%) | 33 (2.4%) |
| 85 Years and over | 52 (3.7%) | 32 (2.4%) |
| Total | 1,401 (100.0%) | 1,359 (100.0%) |
Families and Households in Centerville
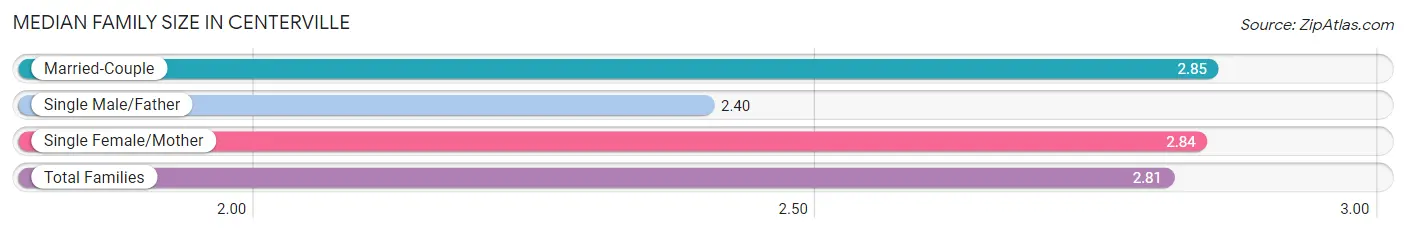
Median Family Size in Centerville
The median family size in Centerville is 2.81 persons per family, with married-couple families (440 | 60.0%) accounting for the largest median family size of 2.85 persons per family. On the other hand, single male/father families (55 | 7.5%) represent the smallest median family size with 2.40 persons per family.
| Family Type | # Families | Family Size |
| Married-Couple | 440 (60.0%) | 2.85 |
| Single Male/Father | 55 (7.5%) | 2.40 |
| Single Female/Mother | 238 (32.5%) | 2.84 |
| Total Families | 733 (100.0%) | 2.81 |
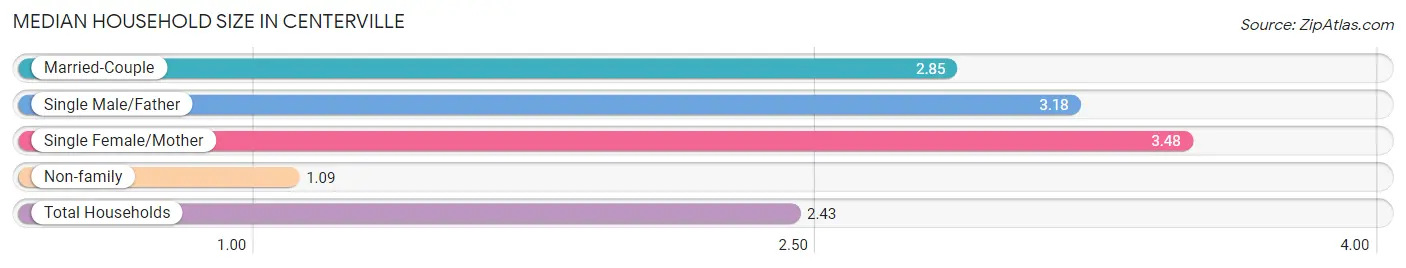
Median Household Size in Centerville
The median household size in Centerville is 2.43 persons per household, with single female/mother households (238 | 21.9%) accounting for the largest median household size of 3.48 persons per household. non-family households (353 | 32.5%) represent the smallest median household size with 1.09 persons per household.
| Household Type | # Households | Household Size |
| Married-Couple | 440 (40.5%) | 2.85 |
| Single Male/Father | 55 (5.1%) | 3.18 |
| Single Female/Mother | 238 (21.9%) | 3.48 |
| Non-family | 353 (32.5%) | 1.09 |
| Total Households | 1,086 (100.0%) | 2.43 |
Household Size by Marriage Status in Centerville
Out of a total of 1,086 households in Centerville, 733 (67.5%) are family households, while 353 (32.5%) are nonfamily households. The most numerous type of family households are 2-person households, comprising 375, and the most common type of nonfamily households are 1-person households, comprising 314.
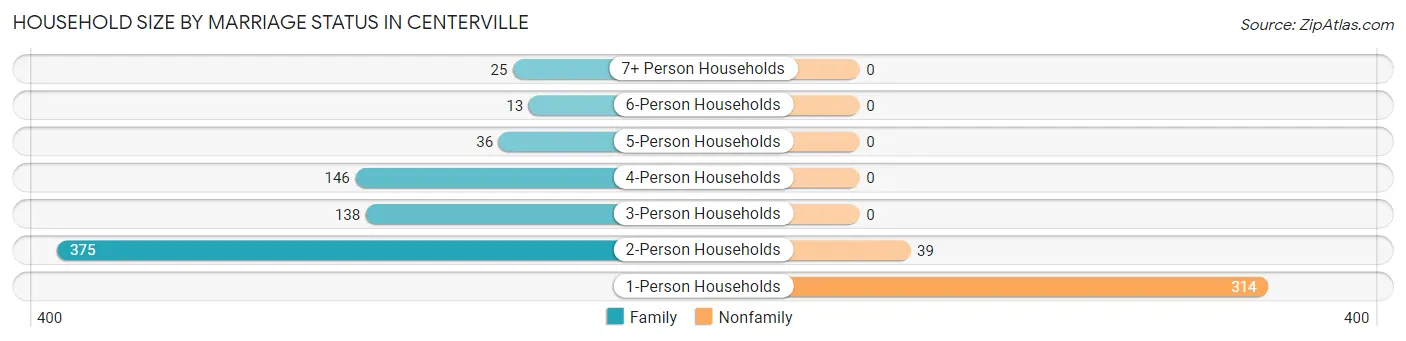
| Household Size | Family Households | Nonfamily Households |
| 1-Person Households | - | 314 (28.9%) |
| 2-Person Households | 375 (34.5%) | 39 (3.6%) |
| 3-Person Households | 138 (12.7%) | 0 (0.0%) |
| 4-Person Households | 146 (13.4%) | 0 (0.0%) |
| 5-Person Households | 36 (3.3%) | 0 (0.0%) |
| 6-Person Households | 13 (1.2%) | 0 (0.0%) |
| 7+ Person Households | 25 (2.3%) | 0 (0.0%) |
| Total | 733 (67.5%) | 353 (32.5%) |
Female Fertility in Centerville
Fertility by Age in Centerville
Average fertility rate in Centerville is 77.0 births per 1,000 women. Women in the age bracket of 35 to 50 years have the highest fertility rate with 105.0 births per 1,000 women. Women in the age bracket of 35 to 50 years acount for 69.8% of all women with births.
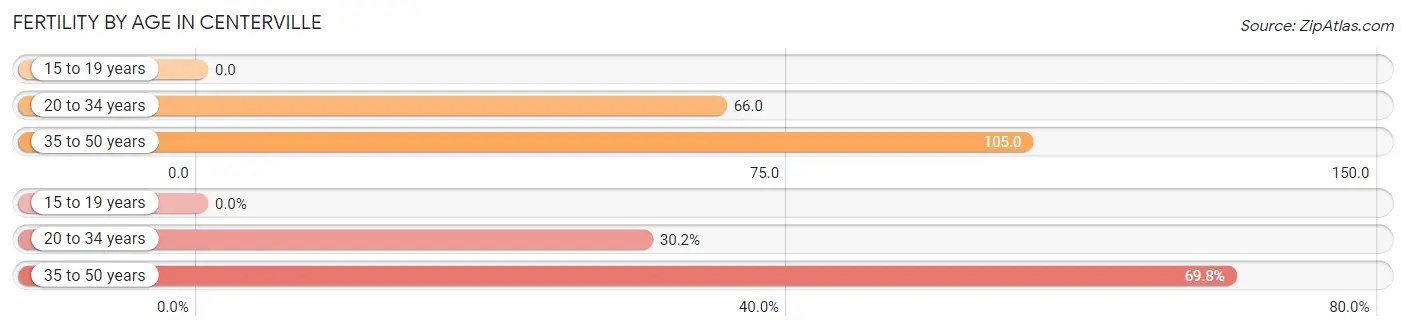
| Age Bracket | Women with Births | Births / 1,000 Women |
| 15 to 19 years | 0 (0.0%) | 0.0 |
| 20 to 34 years | 16 (30.2%) | 66.0 |
| 35 to 50 years | 37 (69.8%) | 105.0 |
| Total | 53 (100.0%) | 77.0 |
Fertility by Age by Marriage Status in Centerville
30.2% of women with births (53) in Centerville are married. The highest percentage of unmarried women with births falls into 35 to 50 years age bracket with 100.0% of them unmarried at the time of birth, while the lowest percentage of unmarried women with births belong to 20 to 34 years age bracket with 0.0% of them unmarried.
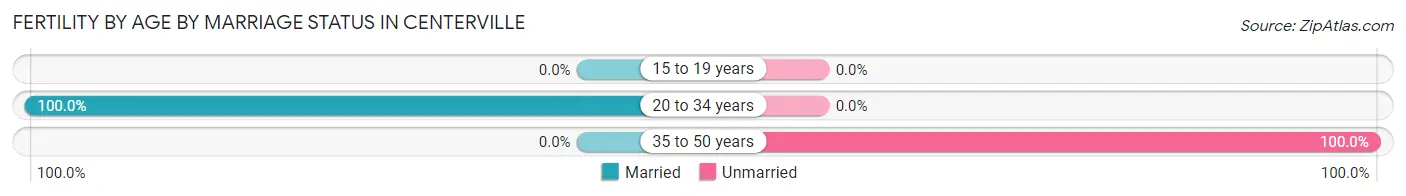
| Age Bracket | Married | Unmarried |
| 15 to 19 years | 0 (0.0%) | 0 (0.0%) |
| 20 to 34 years | 16 (100.0%) | 0 (0.0%) |
| 35 to 50 years | 0 (0.0%) | 37 (100.0%) |
| Total | 16 (30.2%) | 37 (69.8%) |
Fertility by Education in Centerville
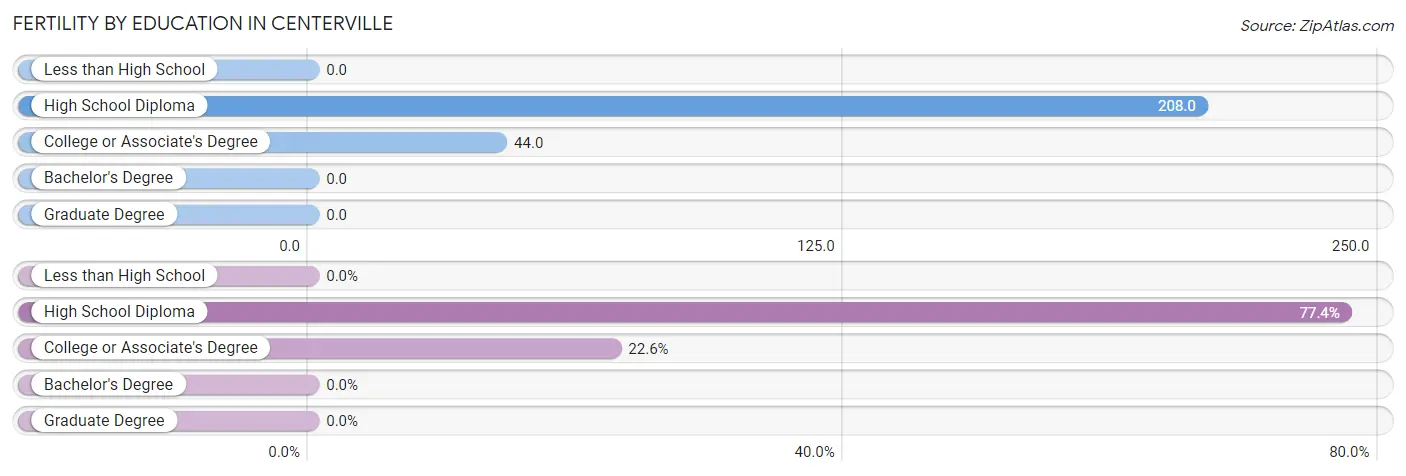
| Educational Attainment | Women with Births | Births / 1,000 Women |
| Less than High School | 0 (0.0%) | 0.0 |
| High School Diploma | 41 (77.4%) | 208.0 |
| College or Associate's Degree | 12 (22.6%) | 44.0 |
| Bachelor's Degree | 0 (0.0%) | 0.0 |
| Graduate Degree | 0 (0.0%) | 0.0 |
| Total | 53 (100.0%) | 77.0 |
Fertility by Education by Marriage Status in Centerville
69.8% of women with births in Centerville are unmarried. Women with the educational attainment of high school diploma are most likely to be married with 39.0% of them married at childbirth, while women with the educational attainment of college or associate's degree are least likely to be married with 100.0% of them unmarried at childbirth.
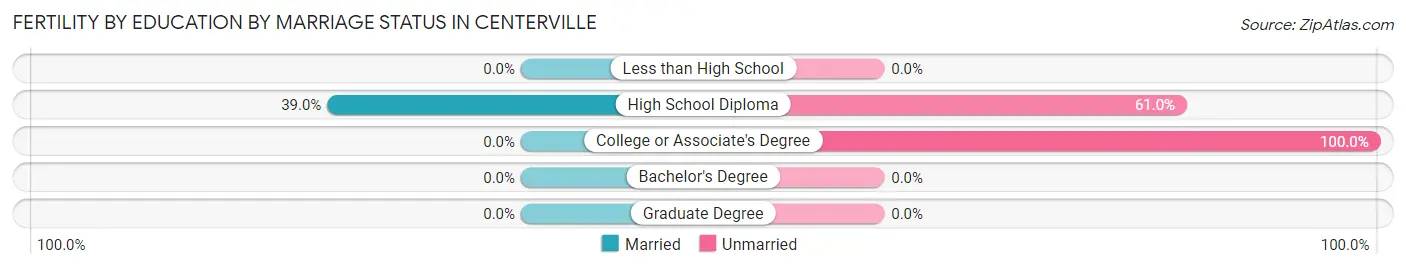
| Educational Attainment | Married | Unmarried |
| Less than High School | 0 (0.0%) | 0 (0.0%) |
| High School Diploma | 16 (39.0%) | 25 (61.0%) |
| College or Associate's Degree | 0 (0.0%) | 12 (100.0%) |
| Bachelor's Degree | 0 (0.0%) | 0 (0.0%) |
| Graduate Degree | 0 (0.0%) | 0 (0.0%) |
| Total | 16 (30.2%) | 37 (69.8%) |
Employment Characteristics in Centerville
Employment by Class of Employer in Centerville
Among the 1,156 employed individuals in Centerville, private company employees (729 | 63.1%), not-for-profit organizations (151 | 13.1%), and local government employees (85 | 7.3%) make up the most common classes of employment.
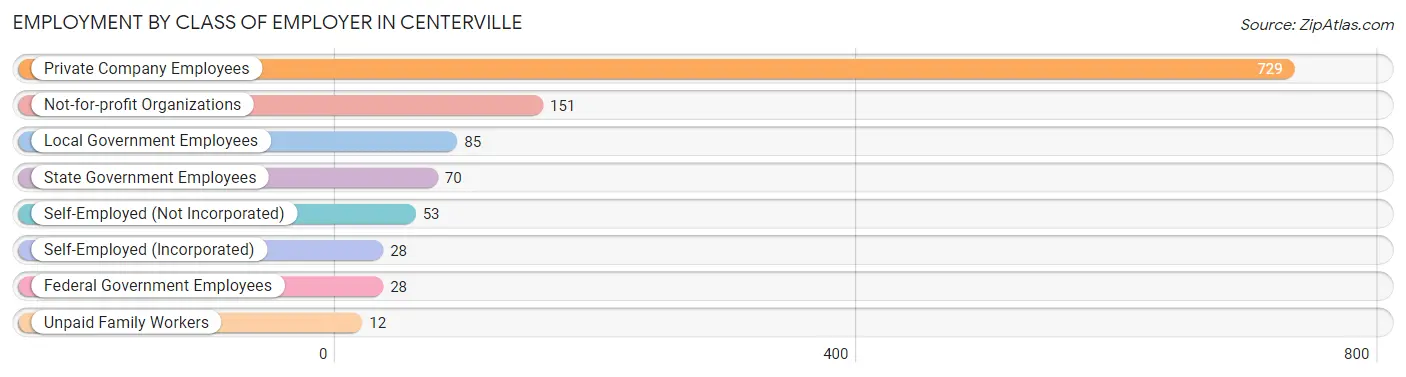
| Employer Class | # Employees | % Employees |
| Private Company Employees | 729 | 63.1% |
| Self-Employed (Incorporated) | 28 | 2.4% |
| Self-Employed (Not Incorporated) | 53 | 4.6% |
| Not-for-profit Organizations | 151 | 13.1% |
| Local Government Employees | 85 | 7.3% |
| State Government Employees | 70 | 6.1% |
| Federal Government Employees | 28 | 2.4% |
| Unpaid Family Workers | 12 | 1.0% |
| Total | 1,156 | 100.0% |
Employment Status by Age in Centerville
According to the labor force statistics for Centerville, out of the total population over 16 years of age (2,080), 59.4% or 1,236 individuals are in the labor force, with 5.2% or 64 of them unemployed. The age group with the highest labor force participation rate is 45 to 54 years, with 85.0% or 323 individuals in the labor force. Within the labor force, the 25 to 29 years age range has the highest percentage of unemployed individuals, with 26.8% or 30 of them being unemployed.
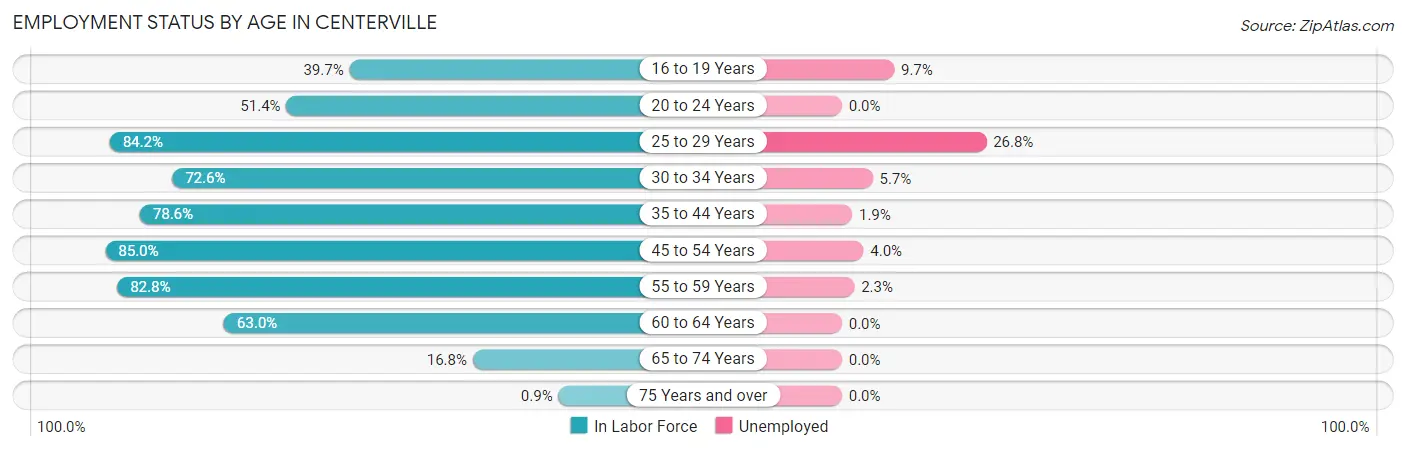
| Age Bracket | In Labor Force | Unemployed |
| 16 to 19 Years | 62 (39.7%) | 6 (9.7%) |
| 20 to 24 Years | 72 (51.4%) | 0 (0.0%) |
| 25 to 29 Years | 112 (84.2%) | 30 (26.8%) |
| 30 to 34 Years | 106 (72.6%) | 6 (5.7%) |
| 35 to 44 Years | 324 (78.6%) | 6 (1.9%) |
| 45 to 54 Years | 323 (85.0%) | 13 (4.0%) |
| 55 to 59 Years | 130 (82.8%) | 3 (2.3%) |
| 60 to 64 Years | 68 (63.0%) | 0 (0.0%) |
| 65 to 74 Years | 37 (16.8%) | 0 (0.0%) |
| 75 Years and over | 2 (0.9%) | 0 (0.0%) |
| Total | 1,236 (59.4%) | 64 (5.2%) |
Employment Status by Educational Attainment in Centerville
According to labor force statistics for Centerville, 79.6% of individuals (1,063) out of the total population between 25 and 64 years of age (1,336) are in the labor force, with 5.5% or 58 of them being unemployed. The group with the highest labor force participation rate are those with the educational attainment of college / associate degree, with 90.0% or 539 individuals in the labor force. Within the labor force, individuals with high school diploma education have the highest percentage of unemployment, with 13.2% or 38 of them being unemployed.
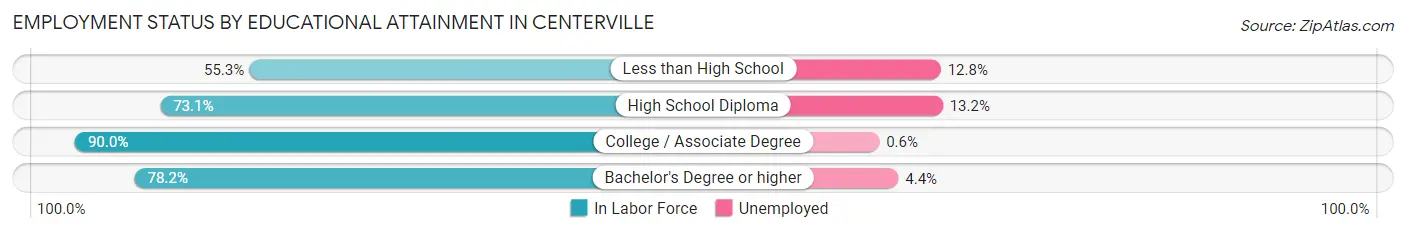
| Educational Attainment | In Labor Force | Unemployed |
| Less than High School | 78 (55.3%) | 18 (12.8%) |
| High School Diploma | 288 (73.1%) | 52 (13.2%) |
| College / Associate Degree | 539 (90.0%) | 4 (0.6%) |
| Bachelor's Degree or higher | 158 (78.2%) | 9 (4.4%) |
| Total | 1,063 (79.6%) | 73 (5.5%) |
Employment Occupations by Sex in Centerville
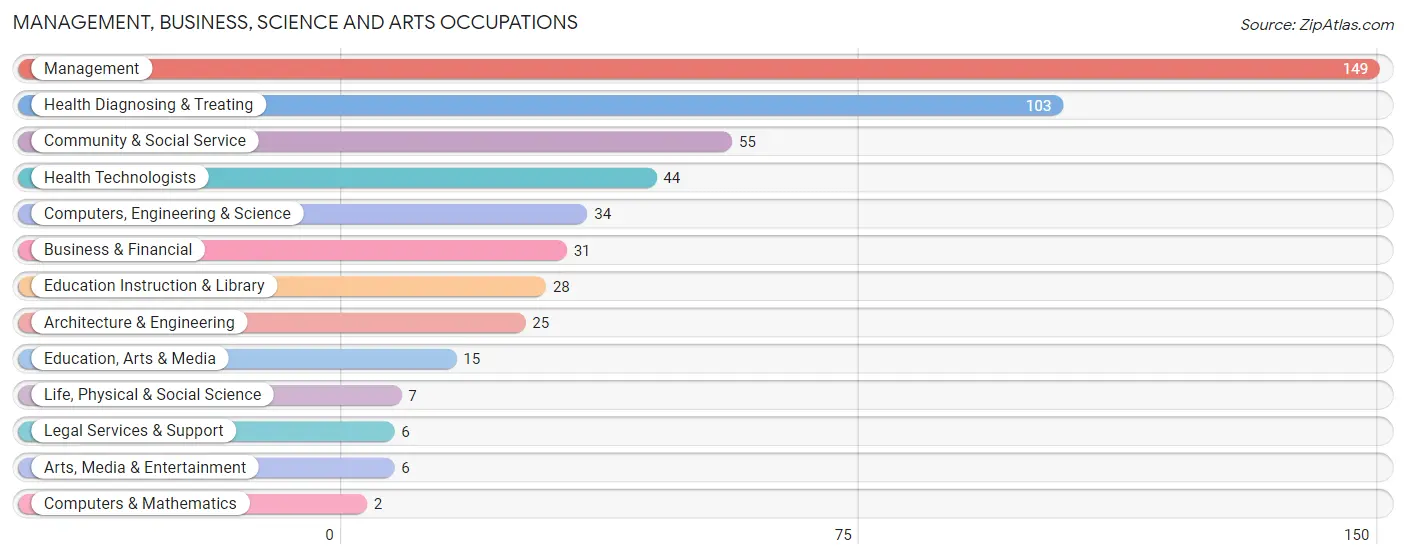
Management, Business, Science and Arts Occupations
The most common Management, Business, Science and Arts occupations in Centerville are Management (149 | 12.7%), Health Diagnosing & Treating (103 | 8.8%), Community & Social Service (55 | 4.7%), Health Technologists (44 | 3.7%), and Computers, Engineering & Science (34 | 2.9%).
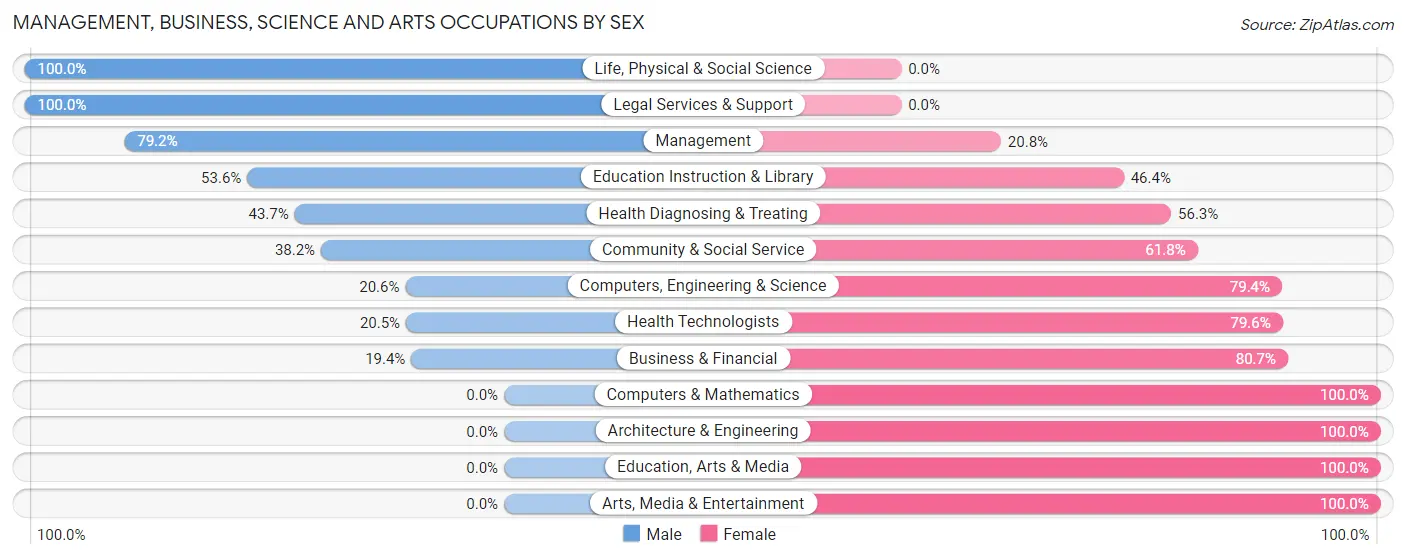
Management, Business, Science and Arts Occupations by Sex
Within the Management, Business, Science and Arts occupations in Centerville, the most male-oriented occupations are Life, Physical & Social Science (100.0%), Legal Services & Support (100.0%), and Management (79.2%), while the most female-oriented occupations are Computers & Mathematics (100.0%), Architecture & Engineering (100.0%), and Education, Arts & Media (100.0%).
| Occupation | Male | Female |
| Management | 118 (79.2%) | 31 (20.8%) |
| Business & Financial | 6 (19.4%) | 25 (80.6%) |
| Computers, Engineering & Science | 7 (20.6%) | 27 (79.4%) |
| Computers & Mathematics | 0 (0.0%) | 2 (100.0%) |
| Architecture & Engineering | 0 (0.0%) | 25 (100.0%) |
| Life, Physical & Social Science | 7 (100.0%) | 0 (0.0%) |
| Community & Social Service | 21 (38.2%) | 34 (61.8%) |
| Education, Arts & Media | 0 (0.0%) | 15 (100.0%) |
| Legal Services & Support | 6 (100.0%) | 0 (0.0%) |
| Education Instruction & Library | 15 (53.6%) | 13 (46.4%) |
| Arts, Media & Entertainment | 0 (0.0%) | 6 (100.0%) |
| Health Diagnosing & Treating | 45 (43.7%) | 58 (56.3%) |
| Health Technologists | 9 (20.4%) | 35 (79.5%) |
| Total (Category) | 197 (53.0%) | 175 (47.0%) |
| Total (Overall) | 560 (47.8%) | 612 (52.2%) |
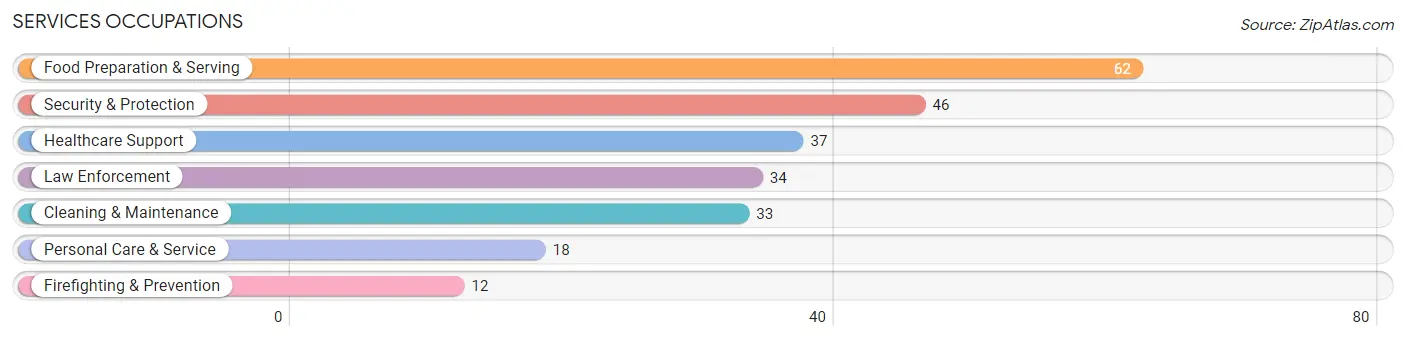
Services Occupations
The most common Services occupations in Centerville are Food Preparation & Serving (62 | 5.3%), Security & Protection (46 | 3.9%), Healthcare Support (37 | 3.2%), Law Enforcement (34 | 2.9%), and Cleaning & Maintenance (33 | 2.8%).
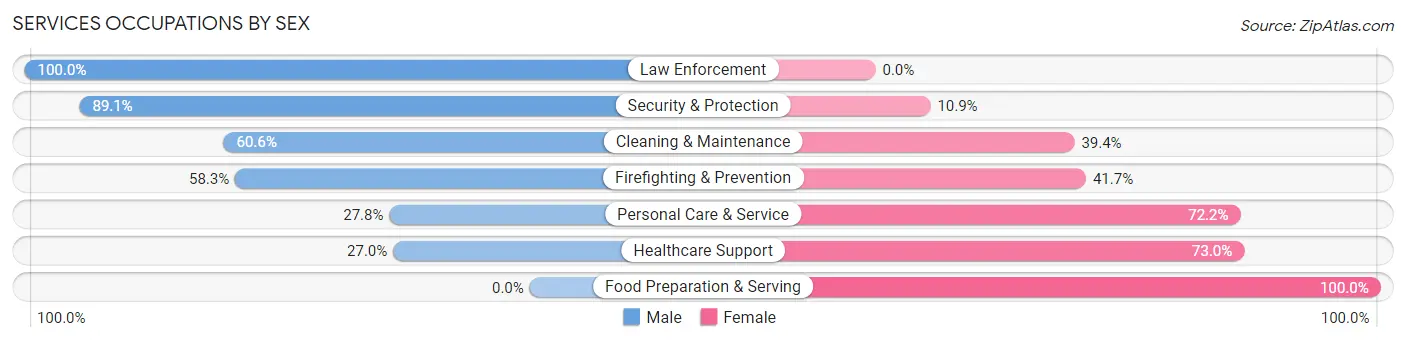
Services Occupations by Sex
Within the Services occupations in Centerville, the most male-oriented occupations are Law Enforcement (100.0%), Security & Protection (89.1%), and Cleaning & Maintenance (60.6%), while the most female-oriented occupations are Food Preparation & Serving (100.0%), Healthcare Support (73.0%), and Personal Care & Service (72.2%).
| Occupation | Male | Female |
| Healthcare Support | 10 (27.0%) | 27 (73.0%) |
| Security & Protection | 41 (89.1%) | 5 (10.9%) |
| Firefighting & Prevention | 7 (58.3%) | 5 (41.7%) |
| Law Enforcement | 34 (100.0%) | 0 (0.0%) |
| Food Preparation & Serving | 0 (0.0%) | 62 (100.0%) |
| Cleaning & Maintenance | 20 (60.6%) | 13 (39.4%) |
| Personal Care & Service | 5 (27.8%) | 13 (72.2%) |
| Total (Category) | 76 (38.8%) | 120 (61.2%) |
| Total (Overall) | 560 (47.8%) | 612 (52.2%) |
Sales and Office Occupations
The most common Sales and Office occupations in Centerville are Office & Administration (209 | 17.8%), and Sales & Related (97 | 8.3%).

Sales and Office Occupations by Sex

| Occupation | Male | Female |
| Sales & Related | 62 (63.9%) | 35 (36.1%) |
| Office & Administration | 12 (5.7%) | 197 (94.3%) |
| Total (Category) | 74 (24.2%) | 232 (75.8%) |
| Total (Overall) | 560 (47.8%) | 612 (52.2%) |
Natural Resources, Construction and Maintenance Occupations
The most common Natural Resources, Construction and Maintenance occupations in Centerville are Installation, Maintenance & Repair (116 | 9.9%), and Construction & Extraction (33 | 2.8%).

Natural Resources, Construction and Maintenance Occupations by Sex

| Occupation | Male | Female |
| Farming, Fishing & Forestry | 0 (0.0%) | 0 (0.0%) |
| Construction & Extraction | 33 (100.0%) | 0 (0.0%) |
| Installation, Maintenance & Repair | 113 (97.4%) | 3 (2.6%) |
| Total (Category) | 146 (98.0%) | 3 (2.0%) |
| Total (Overall) | 560 (47.8%) | 612 (52.2%) |
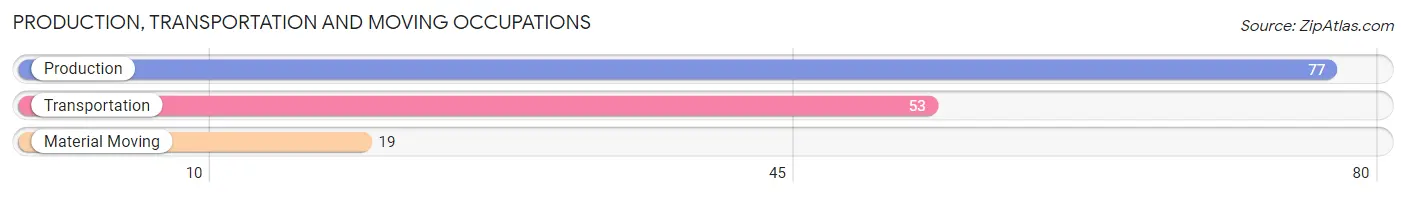
Production, Transportation and Moving Occupations
The most common Production, Transportation and Moving occupations in Centerville are Production (77 | 6.6%), Transportation (53 | 4.5%), and Material Moving (19 | 1.6%).
Production, Transportation and Moving Occupations by Sex

| Occupation | Male | Female |
| Production | 54 (70.1%) | 23 (29.9%) |
| Transportation | 13 (24.5%) | 40 (75.5%) |
| Material Moving | 0 (0.0%) | 19 (100.0%) |
| Total (Category) | 67 (45.0%) | 82 (55.0%) |
| Total (Overall) | 560 (47.8%) | 612 (52.2%) |
Employment Industries by Sex in Centerville
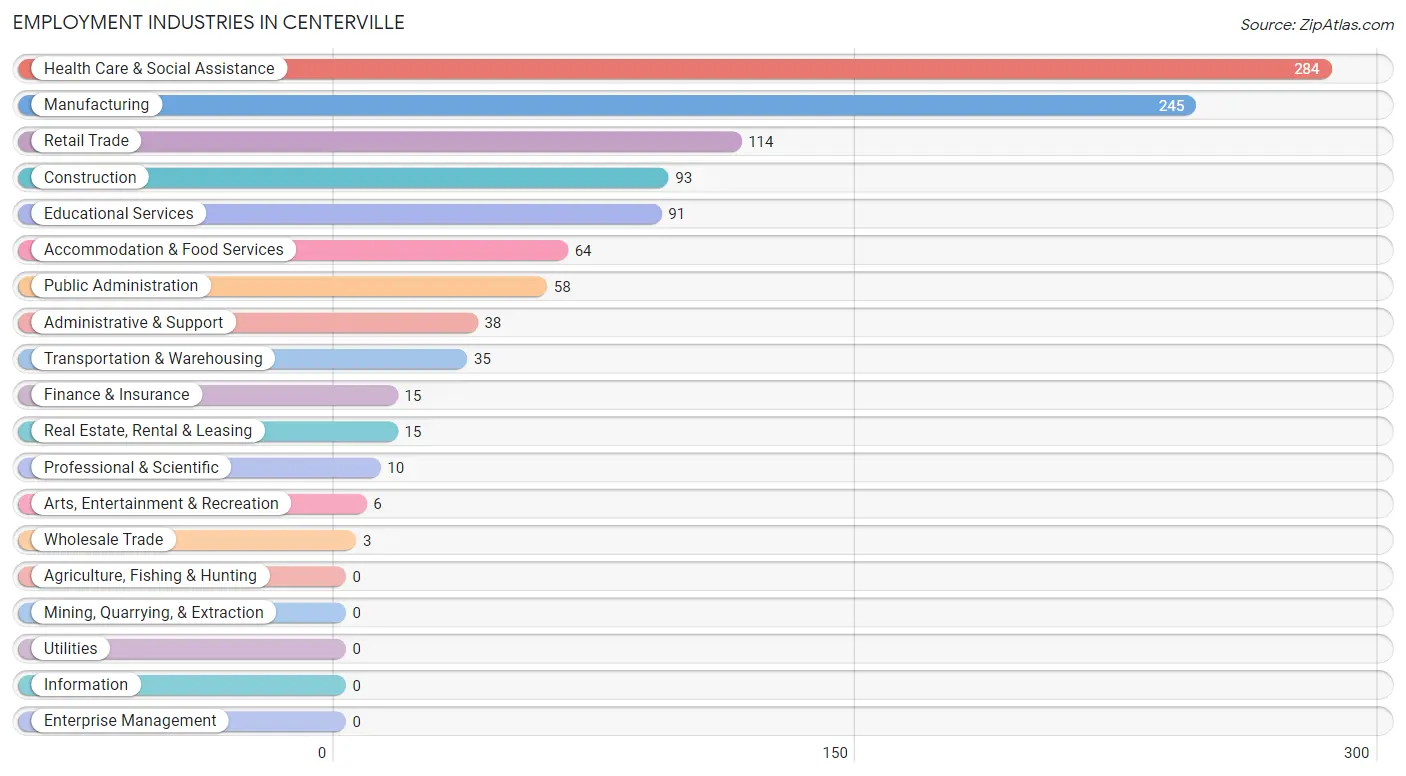
Employment Industries in Centerville
The major employment industries in Centerville include Health Care & Social Assistance (284 | 24.2%), Manufacturing (245 | 20.9%), Retail Trade (114 | 9.7%), Construction (93 | 7.9%), and Educational Services (91 | 7.8%).
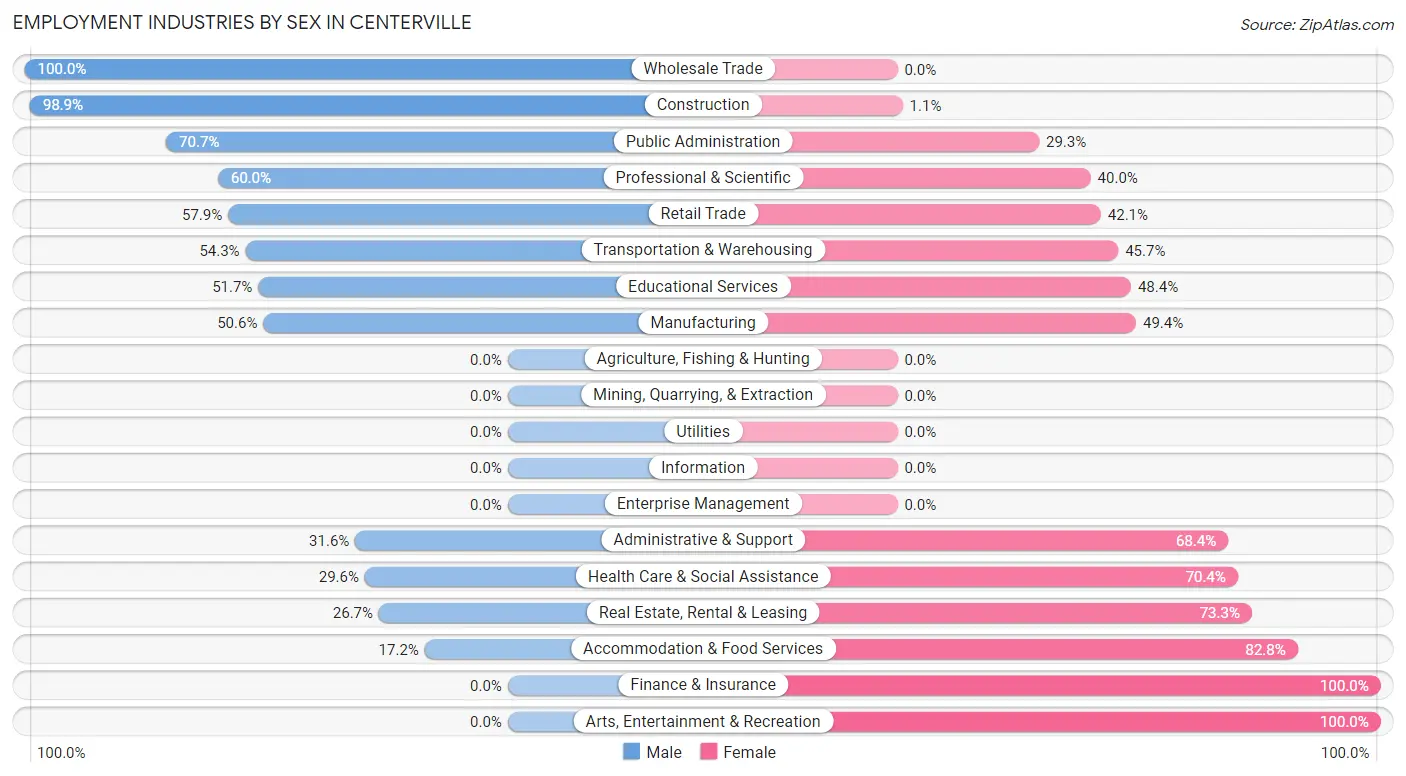
Employment Industries by Sex in Centerville
The Centerville industries that see more men than women are Wholesale Trade (100.0%), Construction (98.9%), and Public Administration (70.7%), whereas the industries that tend to have a higher number of women are Finance & Insurance (100.0%), Arts, Entertainment & Recreation (100.0%), and Accommodation & Food Services (82.8%).
| Industry | Male | Female |
| Agriculture, Fishing & Hunting | 0 (0.0%) | 0 (0.0%) |
| Mining, Quarrying, & Extraction | 0 (0.0%) | 0 (0.0%) |
| Construction | 92 (98.9%) | 1 (1.1%) |
| Manufacturing | 124 (50.6%) | 121 (49.4%) |
| Wholesale Trade | 3 (100.0%) | 0 (0.0%) |
| Retail Trade | 66 (57.9%) | 48 (42.1%) |
| Transportation & Warehousing | 19 (54.3%) | 16 (45.7%) |
| Utilities | 0 (0.0%) | 0 (0.0%) |
| Information | 0 (0.0%) | 0 (0.0%) |
| Finance & Insurance | 0 (0.0%) | 15 (100.0%) |
| Real Estate, Rental & Leasing | 4 (26.7%) | 11 (73.3%) |
| Professional & Scientific | 6 (60.0%) | 4 (40.0%) |
| Enterprise Management | 0 (0.0%) | 0 (0.0%) |
| Administrative & Support | 12 (31.6%) | 26 (68.4%) |
| Educational Services | 47 (51.6%) | 44 (48.3%) |
| Health Care & Social Assistance | 84 (29.6%) | 200 (70.4%) |
| Arts, Entertainment & Recreation | 0 (0.0%) | 6 (100.0%) |
| Accommodation & Food Services | 11 (17.2%) | 53 (82.8%) |
| Public Administration | 41 (70.7%) | 17 (29.3%) |
| Total | 560 (47.8%) | 612 (52.2%) |
Education in Centerville
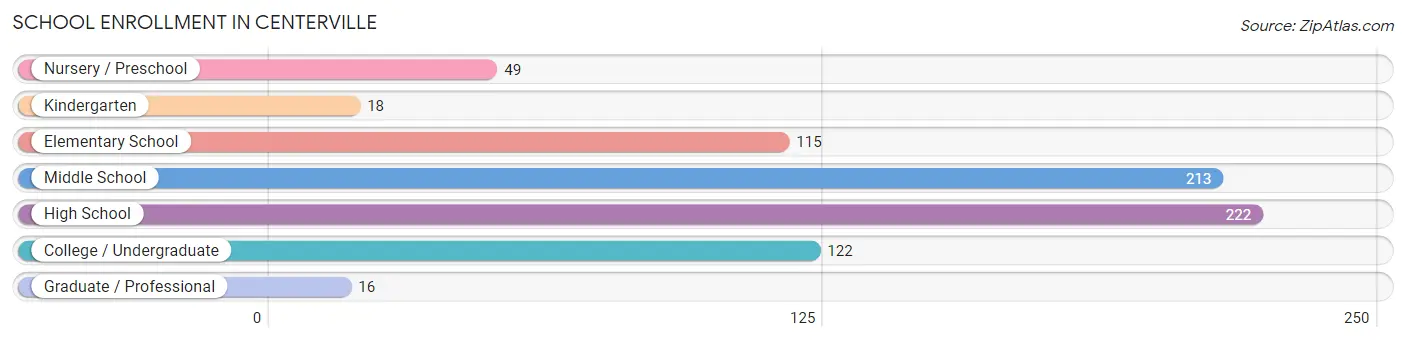
School Enrollment in Centerville
The most common levels of schooling among the 755 students in Centerville are high school (222 | 29.4%), middle school (213 | 28.2%), and college / undergraduate (122 | 16.2%).
| School Level | # Students | % Students |
| Nursery / Preschool | 49 | 6.5% |
| Kindergarten | 18 | 2.4% |
| Elementary School | 115 | 15.2% |
| Middle School | 213 | 28.2% |
| High School | 222 | 29.4% |
| College / Undergraduate | 122 | 16.2% |
| Graduate / Professional | 16 | 2.1% |
| Total | 755 | 100.0% |
School Enrollment by Age by Funding Source in Centerville
Out of a total of 755 students who are enrolled in schools in Centerville, 39 (5.2%) attend a private institution, while the remaining 716 (94.8%) are enrolled in public schools. The age group of 3 to 4 year olds has the highest likelihood of being enrolled in private schools, with 9 (29.0% in the age bracket) enrolled. Conversely, the age group of 15 to 17 year olds has the lowest likelihood of being enrolled in a private school, with 182 (100.0% in the age bracket) attending a public institution.
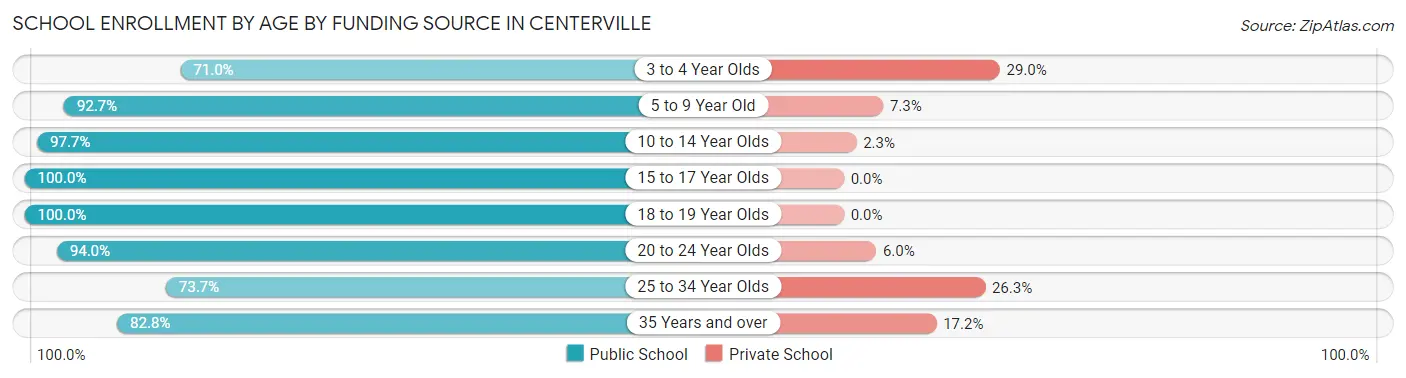
| Age Bracket | Public School | Private School |
| 3 to 4 Year Olds | 22 (71.0%) | 9 (29.0%) |
| 5 to 9 Year Old | 114 (92.7%) | 9 (7.3%) |
| 10 to 14 Year Olds | 250 (97.7%) | 6 (2.3%) |
| 15 to 17 Year Olds | 182 (100.0%) | 0 (0.0%) |
| 18 to 19 Year Olds | 32 (100.0%) | 0 (0.0%) |
| 20 to 24 Year Olds | 78 (94.0%) | 5 (6.0%) |
| 25 to 34 Year Olds | 14 (73.7%) | 5 (26.3%) |
| 35 Years and over | 24 (82.8%) | 5 (17.2%) |
| Total | 716 (94.8%) | 39 (5.2%) |
Educational Attainment by Field of Study in Centerville
Business (54 | 21.2%), science & technology (52 | 20.4%), education (47 | 18.4%), liberal arts & history (28 | 11.0%), and engineering (17 | 6.7%) are the most common fields of study among 255 individuals in Centerville who have obtained a bachelor's degree or higher.
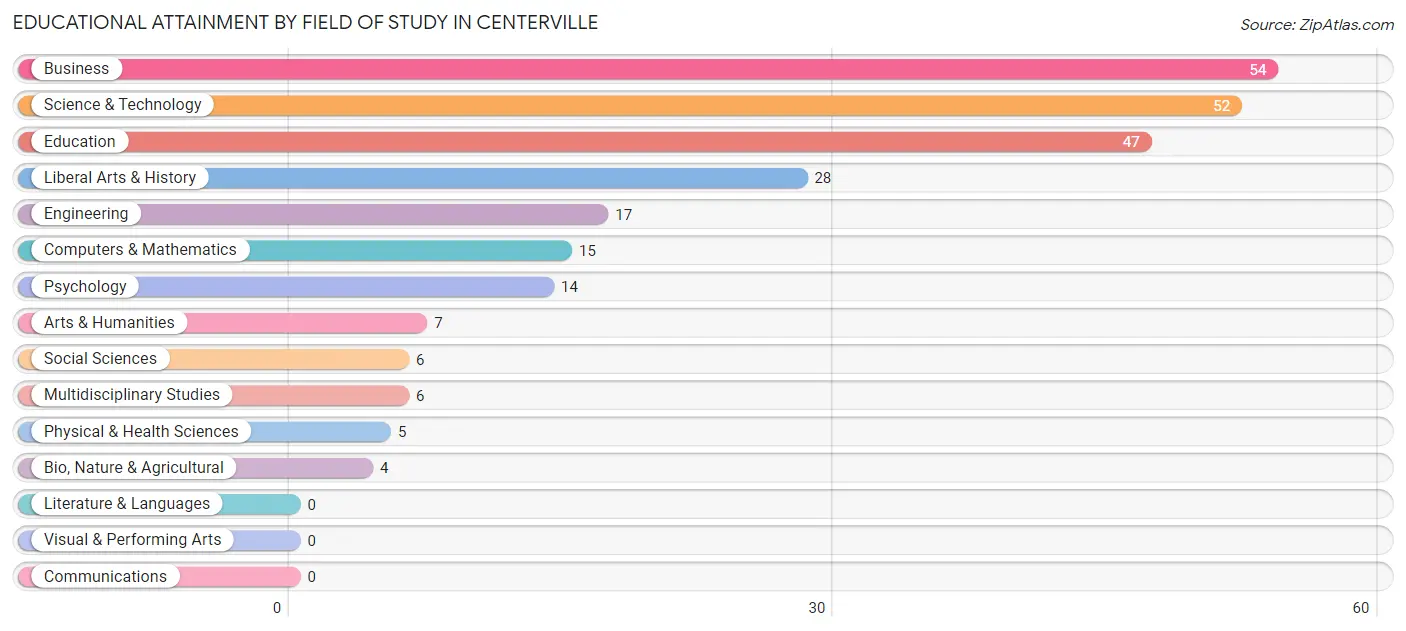
| Field of Study | # Graduates | % Graduates |
| Computers & Mathematics | 15 | 5.9% |
| Bio, Nature & Agricultural | 4 | 1.6% |
| Physical & Health Sciences | 5 | 2.0% |
| Psychology | 14 | 5.5% |
| Social Sciences | 6 | 2.4% |
| Engineering | 17 | 6.7% |
| Multidisciplinary Studies | 6 | 2.4% |
| Science & Technology | 52 | 20.4% |
| Business | 54 | 21.2% |
| Education | 47 | 18.4% |
| Literature & Languages | 0 | 0.0% |
| Liberal Arts & History | 28 | 11.0% |
| Visual & Performing Arts | 0 | 0.0% |
| Communications | 0 | 0.0% |
| Arts & Humanities | 7 | 2.8% |
| Total | 255 | 100.0% |
Transportation & Commute in Centerville
Vehicle Availability by Sex in Centerville
The most prevalent vehicle ownership categories in Centerville are males with 2 vehicles (266, accounting for 48.6%) and females with 2 vehicles (287, making up 43.7%).
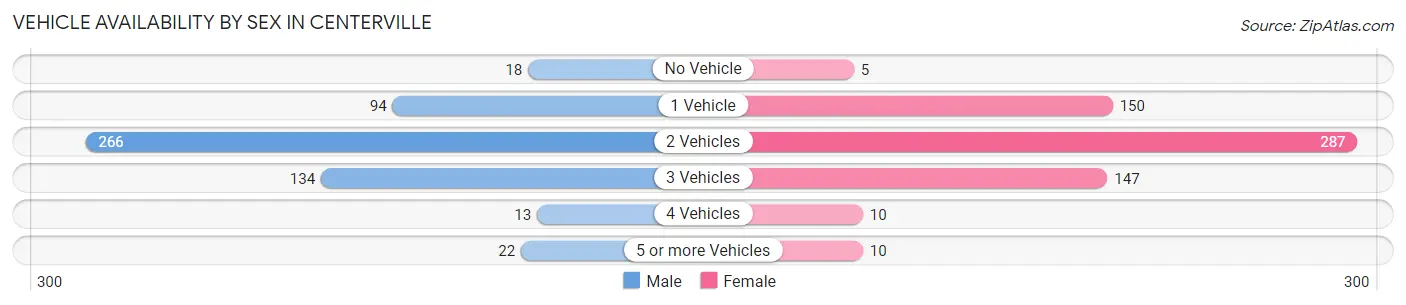
| Vehicles Available | Male | Female |
| No Vehicle | 18 (3.3%) | 5 (0.8%) |
| 1 Vehicle | 94 (17.2%) | 150 (24.6%) |
| 2 Vehicles | 266 (48.6%) | 287 (47.1%) |
| 3 Vehicles | 134 (24.5%) | 147 (24.1%) |
| 4 Vehicles | 13 (2.4%) | 10 (1.6%) |
| 5 or more Vehicles | 22 (4.0%) | 10 (1.6%) |
| Total | 547 (100.0%) | 609 (100.0%) |
Commute Time in Centerville
The most frequently occuring commute durations in Centerville are 10 to 14 minutes (373 commuters, 34.8%), 15 to 19 minutes (265 commuters, 24.7%), and 20 to 24 minutes (165 commuters, 15.4%).
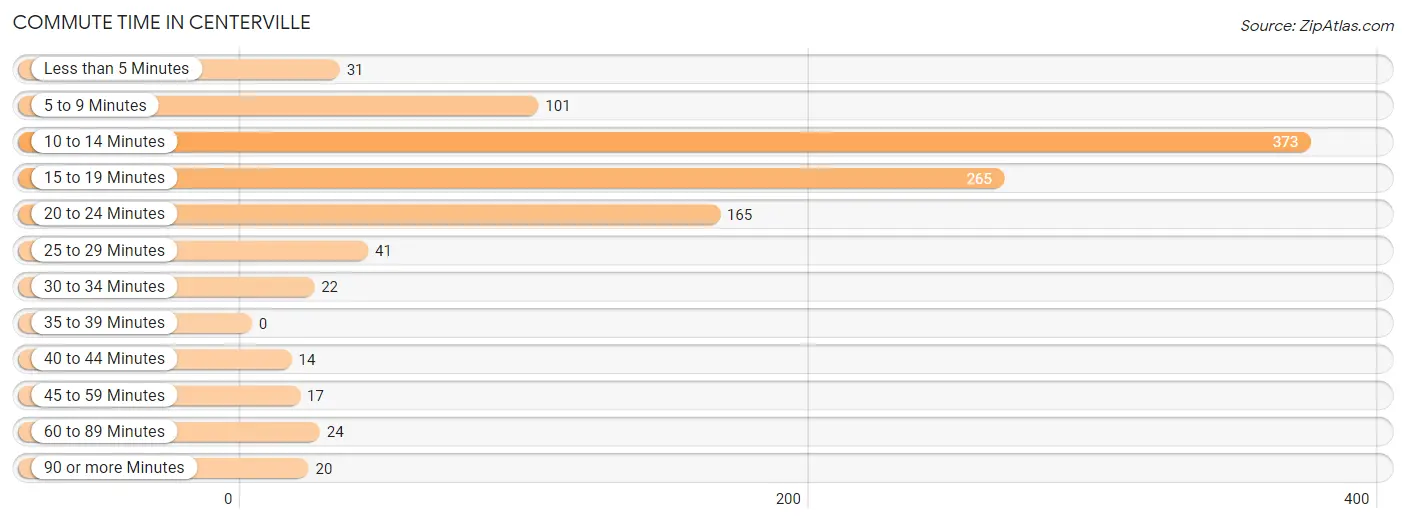
| Commute Time | # Commuters | % Commuters |
| Less than 5 Minutes | 31 | 2.9% |
| 5 to 9 Minutes | 101 | 9.4% |
| 10 to 14 Minutes | 373 | 34.8% |
| 15 to 19 Minutes | 265 | 24.7% |
| 20 to 24 Minutes | 165 | 15.4% |
| 25 to 29 Minutes | 41 | 3.8% |
| 30 to 34 Minutes | 22 | 2.1% |
| 35 to 39 Minutes | 0 | 0.0% |
| 40 to 44 Minutes | 14 | 1.3% |
| 45 to 59 Minutes | 17 | 1.6% |
| 60 to 89 Minutes | 24 | 2.2% |
| 90 or more Minutes | 20 | 1.9% |
Commute Time by Sex in Centerville
The most common commute times in Centerville are 10 to 14 minutes (190 commuters, 36.7%) for males and 10 to 14 minutes (183 commuters, 32.9%) for females.
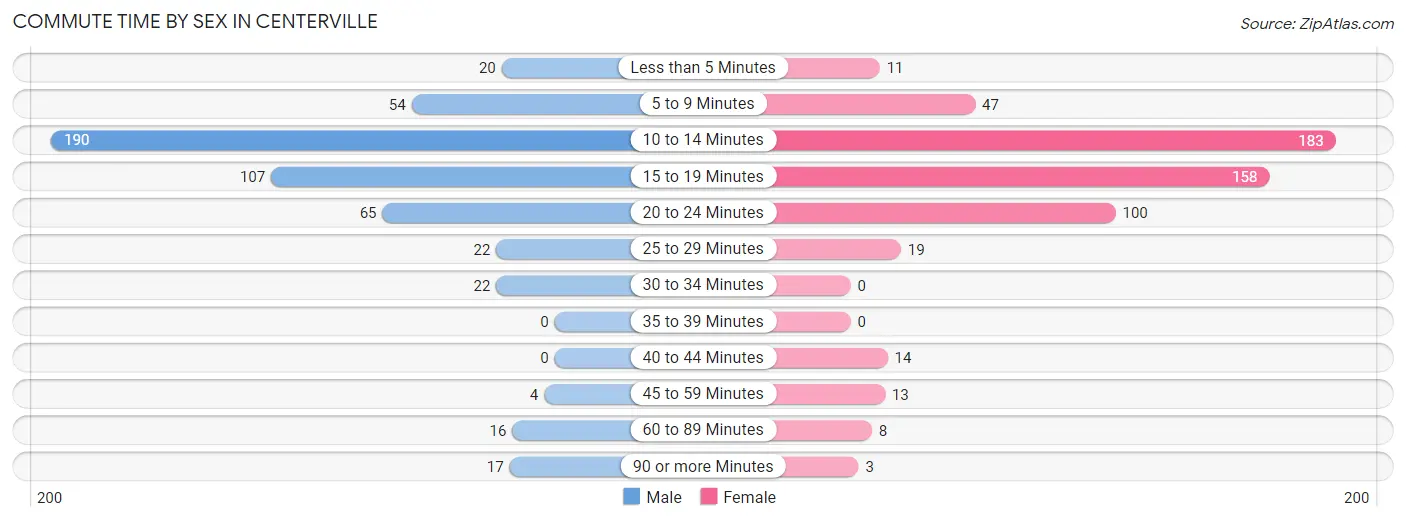
| Commute Time | Male | Female |
| Less than 5 Minutes | 20 (3.9%) | 11 (2.0%) |
| 5 to 9 Minutes | 54 (10.4%) | 47 (8.5%) |
| 10 to 14 Minutes | 190 (36.7%) | 183 (32.9%) |
| 15 to 19 Minutes | 107 (20.7%) | 158 (28.4%) |
| 20 to 24 Minutes | 65 (12.6%) | 100 (18.0%) |
| 25 to 29 Minutes | 22 (4.3%) | 19 (3.4%) |
| 30 to 34 Minutes | 22 (4.3%) | 0 (0.0%) |
| 35 to 39 Minutes | 0 (0.0%) | 0 (0.0%) |
| 40 to 44 Minutes | 0 (0.0%) | 14 (2.5%) |
| 45 to 59 Minutes | 4 (0.8%) | 13 (2.3%) |
| 60 to 89 Minutes | 16 (3.1%) | 8 (1.4%) |
| 90 or more Minutes | 17 (3.3%) | 3 (0.5%) |
Time of Departure to Work by Sex in Centerville
The most frequent times of departure to work in Centerville are 7:00 AM to 7:29 AM (180, 34.8%) for males and 7:30 AM to 7:59 AM (144, 25.9%) for females.
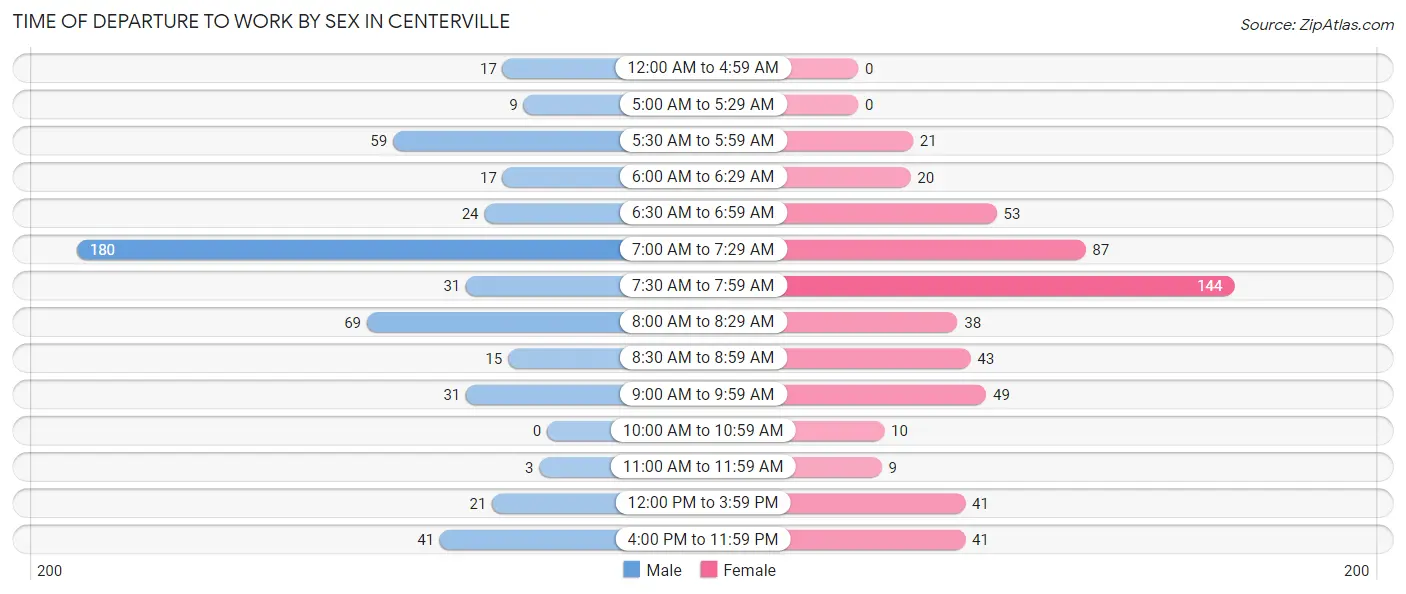
| Time of Departure | Male | Female |
| 12:00 AM to 4:59 AM | 17 (3.3%) | 0 (0.0%) |
| 5:00 AM to 5:29 AM | 9 (1.7%) | 0 (0.0%) |
| 5:30 AM to 5:59 AM | 59 (11.4%) | 21 (3.8%) |
| 6:00 AM to 6:29 AM | 17 (3.3%) | 20 (3.6%) |
| 6:30 AM to 6:59 AM | 24 (4.6%) | 53 (9.5%) |
| 7:00 AM to 7:29 AM | 180 (34.8%) | 87 (15.7%) |
| 7:30 AM to 7:59 AM | 31 (6.0%) | 144 (25.9%) |
| 8:00 AM to 8:29 AM | 69 (13.4%) | 38 (6.8%) |
| 8:30 AM to 8:59 AM | 15 (2.9%) | 43 (7.7%) |
| 9:00 AM to 9:59 AM | 31 (6.0%) | 49 (8.8%) |
| 10:00 AM to 10:59 AM | 0 (0.0%) | 10 (1.8%) |
| 11:00 AM to 11:59 AM | 3 (0.6%) | 9 (1.6%) |
| 12:00 PM to 3:59 PM | 21 (4.1%) | 41 (7.4%) |
| 4:00 PM to 11:59 PM | 41 (7.9%) | 41 (7.4%) |
| Total | 517 (100.0%) | 556 (100.0%) |
Housing Occupancy in Centerville
Occupancy by Ownership in Centerville
Of the total 1,086 dwellings in Centerville, owner-occupied units account for 738 (68.0%), while renter-occupied units make up 348 (32.0%).
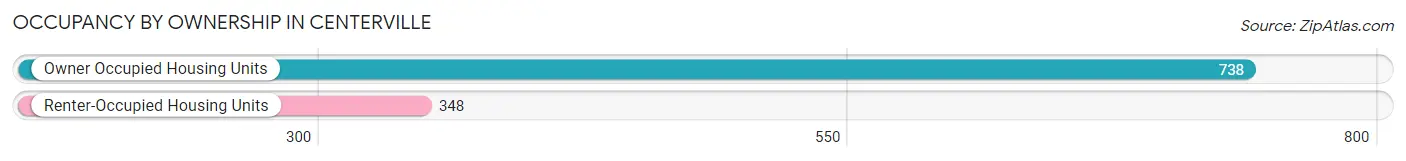
| Occupancy | # Housing Units | % Housing Units |
| Owner Occupied Housing Units | 738 | 68.0% |
| Renter-Occupied Housing Units | 348 | 32.0% |
| Total Occupied Housing Units | 1,086 | 100.0% |
Occupancy by Household Size in Centerville
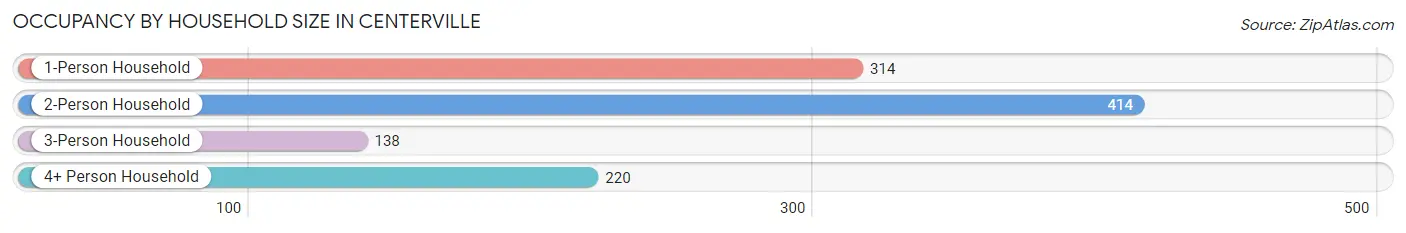
| Household Size | # Housing Units | % Housing Units |
| 1-Person Household | 314 | 28.9% |
| 2-Person Household | 414 | 38.1% |
| 3-Person Household | 138 | 12.7% |
| 4+ Person Household | 220 | 20.3% |
| Total Housing Units | 1,086 | 100.0% |
Occupancy by Ownership by Household Size in Centerville
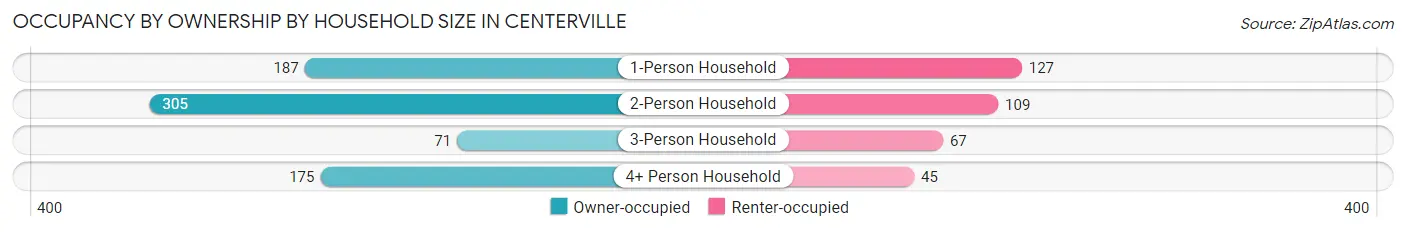
| Household Size | Owner-occupied | Renter-occupied |
| 1-Person Household | 187 (59.6%) | 127 (40.5%) |
| 2-Person Household | 305 (73.7%) | 109 (26.3%) |
| 3-Person Household | 71 (51.4%) | 67 (48.5%) |
| 4+ Person Household | 175 (79.5%) | 45 (20.4%) |
| Total Housing Units | 738 (68.0%) | 348 (32.0%) |
Occupancy by Educational Attainment in Centerville
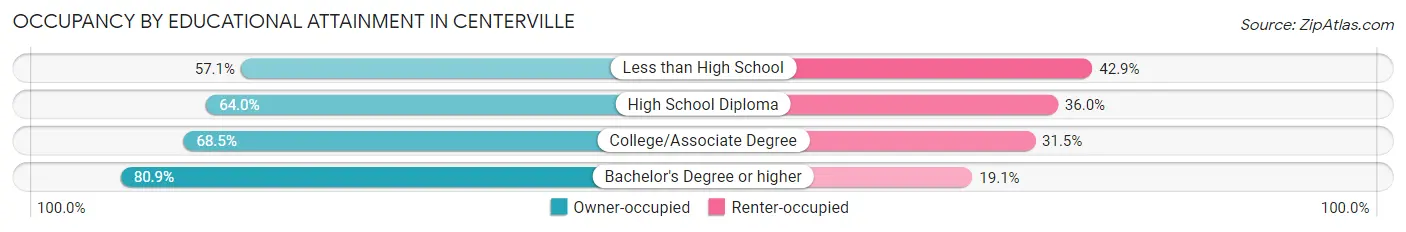
| Household Size | Owner-occupied | Renter-occupied |
| Less than High School | 56 (57.1%) | 42 (42.9%) |
| High School Diploma | 229 (64.0%) | 129 (36.0%) |
| College/Associate Degree | 313 (68.5%) | 144 (31.5%) |
| Bachelor's Degree or higher | 140 (80.9%) | 33 (19.1%) |
Occupancy by Age of Householder in Centerville
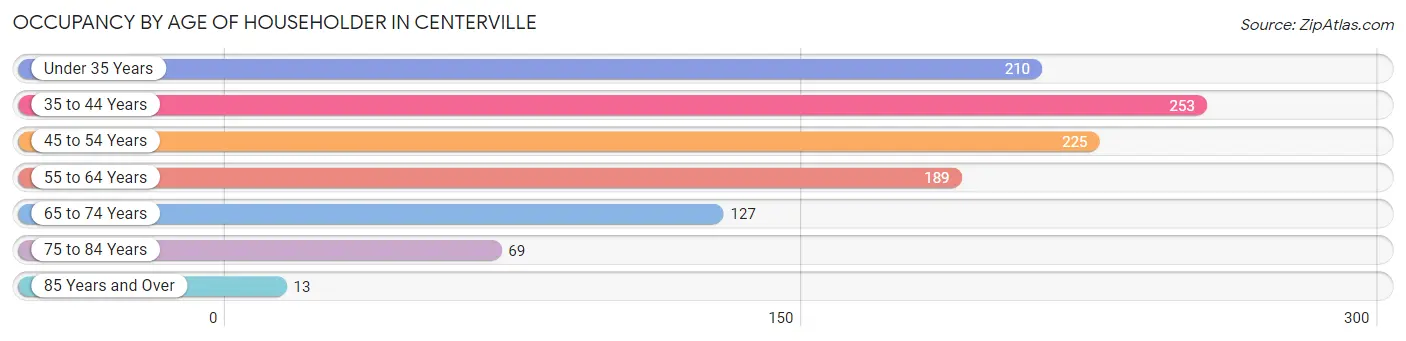
| Age Bracket | # Households | % Households |
| Under 35 Years | 210 | 19.3% |
| 35 to 44 Years | 253 | 23.3% |
| 45 to 54 Years | 225 | 20.7% |
| 55 to 64 Years | 189 | 17.4% |
| 65 to 74 Years | 127 | 11.7% |
| 75 to 84 Years | 69 | 6.4% |
| 85 Years and Over | 13 | 1.2% |
| Total | 1,086 | 100.0% |
Housing Finances in Centerville
Median Income by Occupancy in Centerville
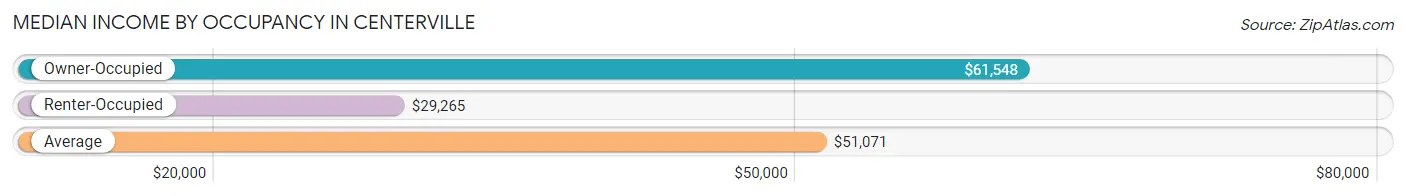
| Occupancy Type | # Households | Median Income |
| Owner-Occupied | 738 (68.0%) | $61,548 |
| Renter-Occupied | 348 (32.0%) | $29,265 |
| Average | 1,086 (100.0%) | $51,071 |
Occupancy by Householder Income Bracket in Centerville
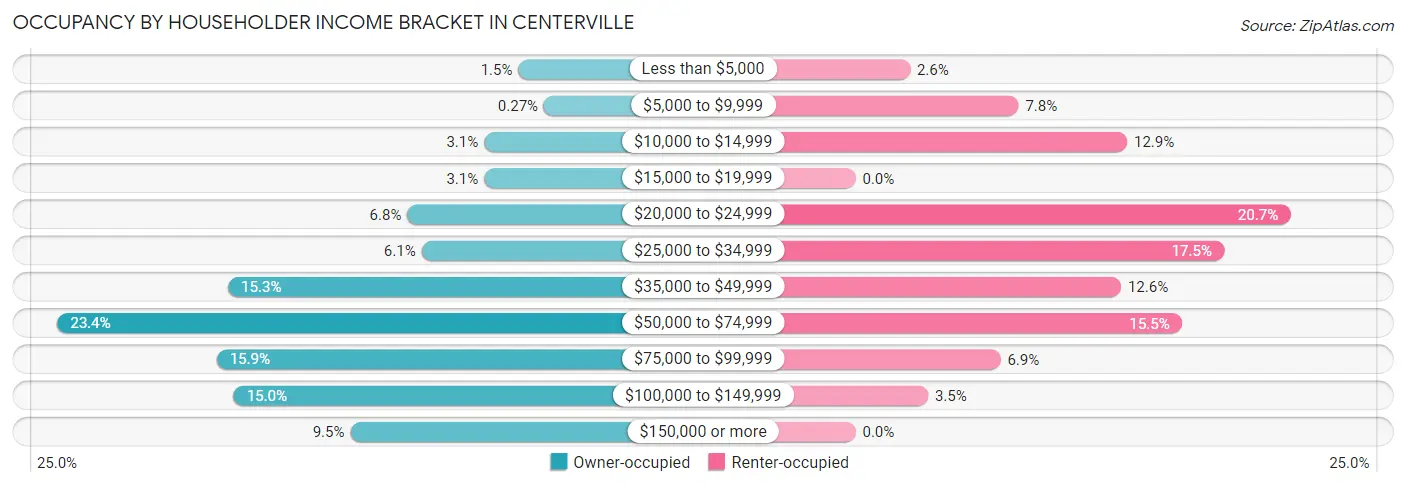
| Income Bracket | Owner-occupied | Renter-occupied |
| Less than $5,000 | 11 (1.5%) | 9 (2.6%) |
| $5,000 to $9,999 | 2 (0.3%) | 27 (7.8%) |
| $10,000 to $14,999 | 23 (3.1%) | 45 (12.9%) |
| $15,000 to $19,999 | 23 (3.1%) | 0 (0.0%) |
| $20,000 to $24,999 | 50 (6.8%) | 72 (20.7%) |
| $25,000 to $34,999 | 45 (6.1%) | 61 (17.5%) |
| $35,000 to $49,999 | 113 (15.3%) | 44 (12.6%) |
| $50,000 to $74,999 | 173 (23.4%) | 54 (15.5%) |
| $75,000 to $99,999 | 117 (15.9%) | 24 (6.9%) |
| $100,000 to $149,999 | 111 (15.0%) | 12 (3.5%) |
| $150,000 or more | 70 (9.5%) | 0 (0.0%) |
| Total | 738 (100.0%) | 348 (100.0%) |
Monthly Housing Cost Tiers in Centerville
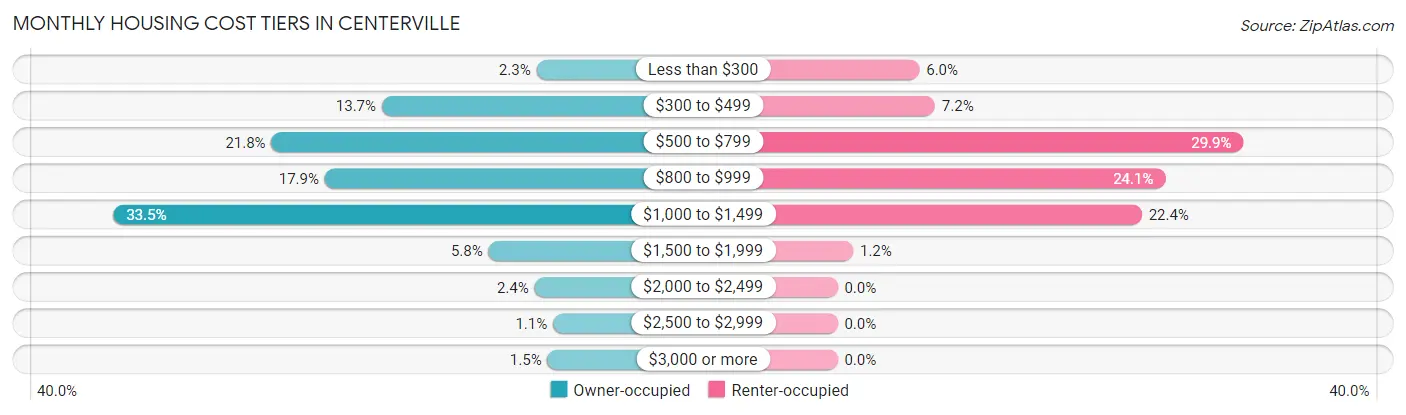
| Monthly Cost | Owner-occupied | Renter-occupied |
| Less than $300 | 17 (2.3%) | 21 (6.0%) |
| $300 to $499 | 101 (13.7%) | 25 (7.2%) |
| $500 to $799 | 161 (21.8%) | 104 (29.9%) |
| $800 to $999 | 132 (17.9%) | 84 (24.1%) |
| $1,000 to $1,499 | 247 (33.5%) | 78 (22.4%) |
| $1,500 to $1,999 | 43 (5.8%) | 4 (1.1%) |
| $2,000 to $2,499 | 18 (2.4%) | 0 (0.0%) |
| $2,500 to $2,999 | 8 (1.1%) | 0 (0.0%) |
| $3,000 or more | 11 (1.5%) | 0 (0.0%) |
| Total | 738 (100.0%) | 348 (100.0%) |
Physical Housing Characteristics in Centerville
Housing Structures in Centerville
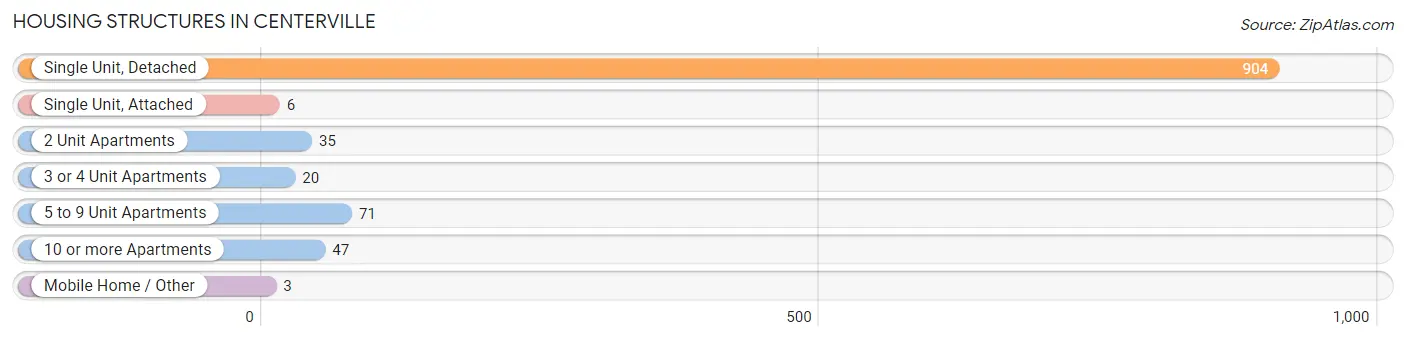
| Structure Type | # Housing Units | % Housing Units |
| Single Unit, Detached | 904 | 83.2% |
| Single Unit, Attached | 6 | 0.5% |
| 2 Unit Apartments | 35 | 3.2% |
| 3 or 4 Unit Apartments | 20 | 1.8% |
| 5 to 9 Unit Apartments | 71 | 6.5% |
| 10 or more Apartments | 47 | 4.3% |
| Mobile Home / Other | 3 | 0.3% |
| Total | 1,086 | 100.0% |
Housing Structures by Occupancy in Centerville
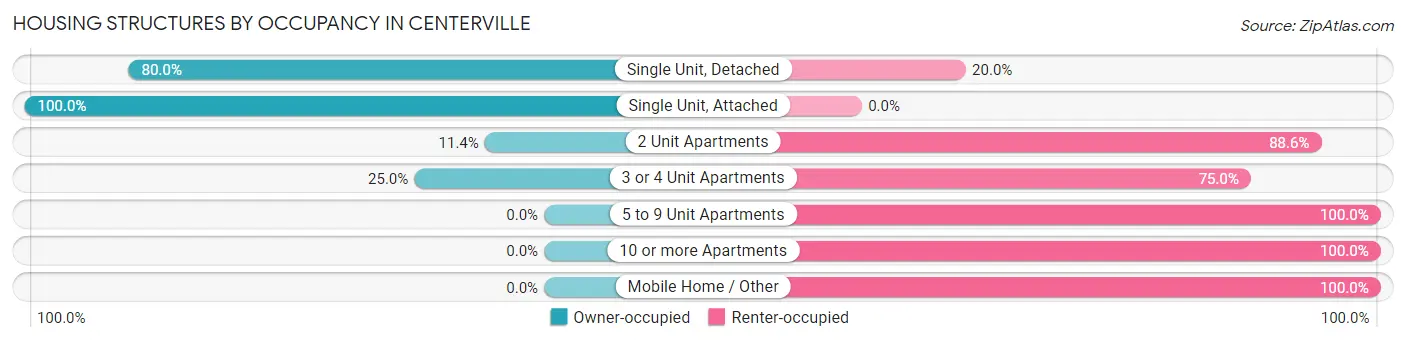
| Structure Type | Owner-occupied | Renter-occupied |
| Single Unit, Detached | 723 (80.0%) | 181 (20.0%) |
| Single Unit, Attached | 6 (100.0%) | 0 (0.0%) |
| 2 Unit Apartments | 4 (11.4%) | 31 (88.6%) |
| 3 or 4 Unit Apartments | 5 (25.0%) | 15 (75.0%) |
| 5 to 9 Unit Apartments | 0 (0.0%) | 71 (100.0%) |
| 10 or more Apartments | 0 (0.0%) | 47 (100.0%) |
| Mobile Home / Other | 0 (0.0%) | 3 (100.0%) |
| Total | 738 (68.0%) | 348 (32.0%) |
Housing Structures by Number of Rooms in Centerville
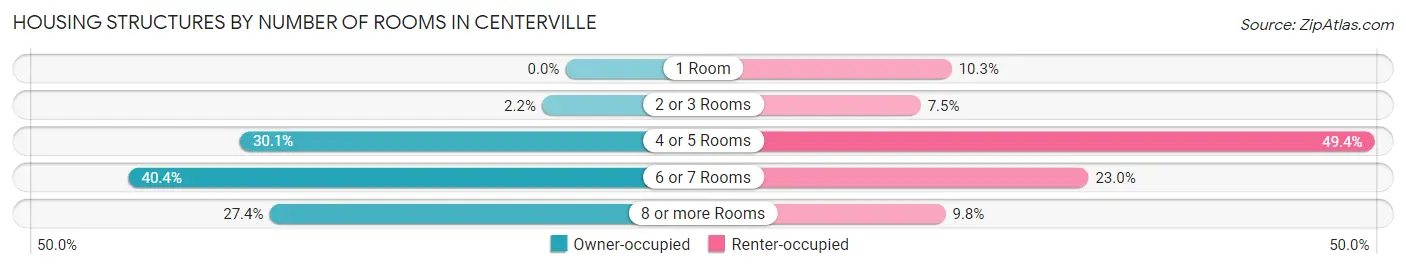
| Number of Rooms | Owner-occupied | Renter-occupied |
| 1 Room | 0 (0.0%) | 36 (10.3%) |
| 2 or 3 Rooms | 16 (2.2%) | 26 (7.5%) |
| 4 or 5 Rooms | 222 (30.1%) | 172 (49.4%) |
| 6 or 7 Rooms | 298 (40.4%) | 80 (23.0%) |
| 8 or more Rooms | 202 (27.4%) | 34 (9.8%) |
| Total | 738 (100.0%) | 348 (100.0%) |
Housing Structure by Heating Type in Centerville
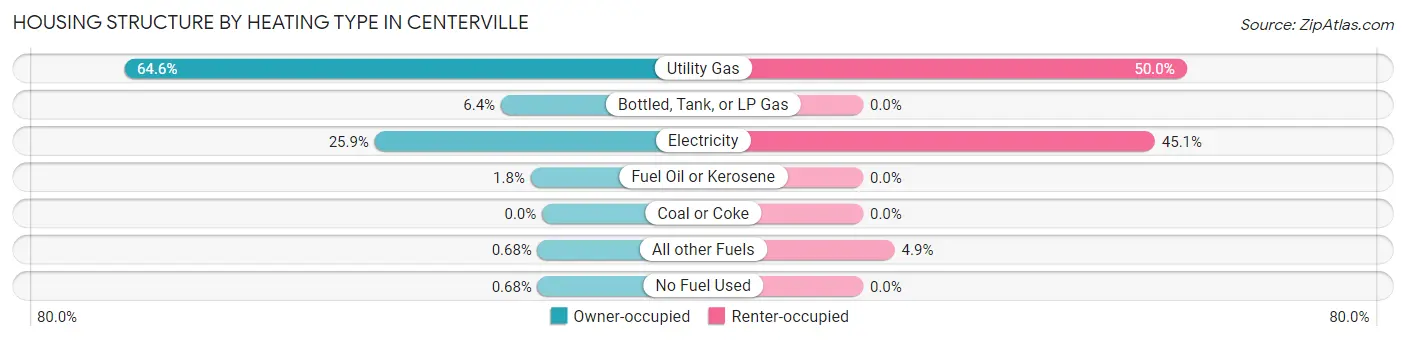
| Heating Type | Owner-occupied | Renter-occupied |
| Utility Gas | 477 (64.6%) | 174 (50.0%) |
| Bottled, Tank, or LP Gas | 47 (6.4%) | 0 (0.0%) |
| Electricity | 191 (25.9%) | 157 (45.1%) |
| Fuel Oil or Kerosene | 13 (1.8%) | 0 (0.0%) |
| Coal or Coke | 0 (0.0%) | 0 (0.0%) |
| All other Fuels | 5 (0.7%) | 17 (4.9%) |
| No Fuel Used | 5 (0.7%) | 0 (0.0%) |
| Total | 738 (100.0%) | 348 (100.0%) |
Household Vehicle Usage in Centerville
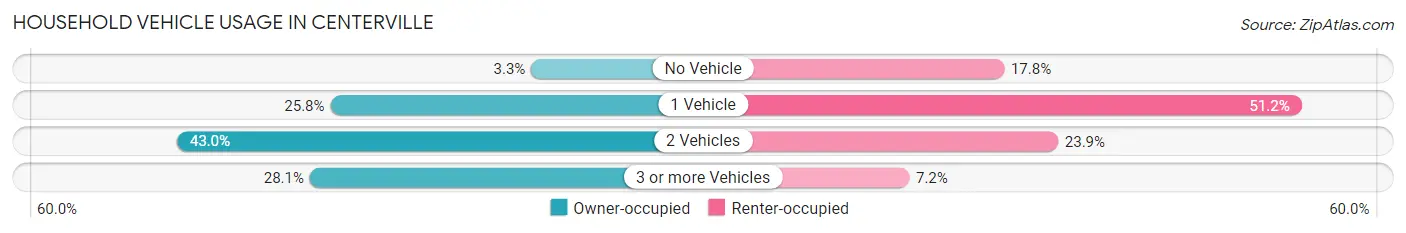
| Vehicles per Household | Owner-occupied | Renter-occupied |
| No Vehicle | 24 (3.3%) | 62 (17.8%) |
| 1 Vehicle | 190 (25.8%) | 178 (51.1%) |
| 2 Vehicles | 317 (42.9%) | 83 (23.8%) |
| 3 or more Vehicles | 207 (28.1%) | 25 (7.2%) |
| Total | 738 (100.0%) | 348 (100.0%) |
Real Estate & Mortgages in Centerville
Real Estate and Mortgage Overview in Centerville
| Characteristic | Without Mortgage | With Mortgage |
| Housing Units | 190 | 548 |
| Median Property Value | $133,000 | $123,700 |
| Median Household Income | $42,500 | $56 |
| Monthly Housing Costs | $454 | $11 |
| Real Estate Taxes | $1,151 | $56 |
Property Value by Mortgage Status in Centerville
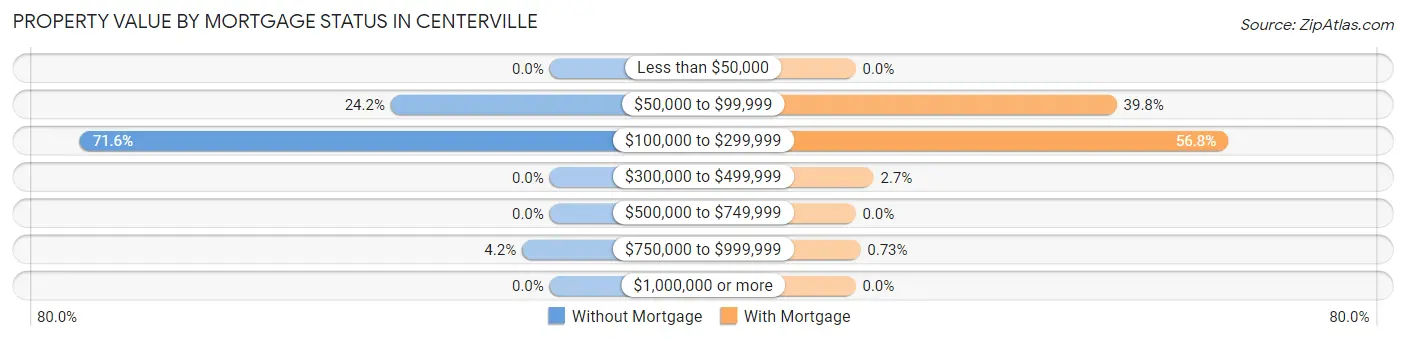
| Property Value | Without Mortgage | With Mortgage |
| Less than $50,000 | 0 (0.0%) | 0 (0.0%) |
| $50,000 to $99,999 | 46 (24.2%) | 218 (39.8%) |
| $100,000 to $299,999 | 136 (71.6%) | 311 (56.8%) |
| $300,000 to $499,999 | 0 (0.0%) | 15 (2.7%) |
| $500,000 to $749,999 | 0 (0.0%) | 0 (0.0%) |
| $750,000 to $999,999 | 8 (4.2%) | 4 (0.7%) |
| $1,000,000 or more | 0 (0.0%) | 0 (0.0%) |
| Total | 190 (100.0%) | 548 (100.0%) |
Household Income by Mortgage Status in Centerville
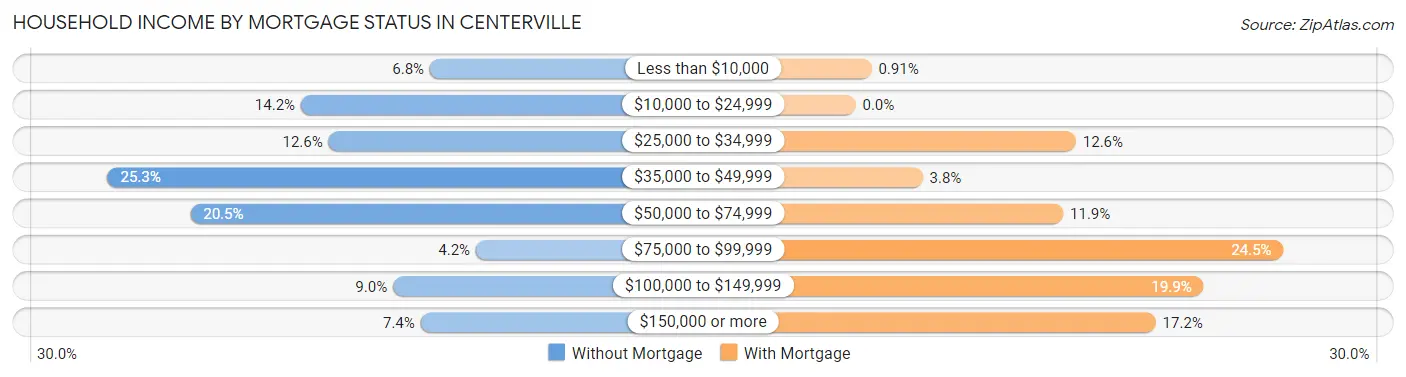
| Household Income | Without Mortgage | With Mortgage |
| Less than $10,000 | 13 (6.8%) | 5 (0.9%) |
| $10,000 to $24,999 | 27 (14.2%) | 0 (0.0%) |
| $25,000 to $34,999 | 24 (12.6%) | 69 (12.6%) |
| $35,000 to $49,999 | 48 (25.3%) | 21 (3.8%) |
| $50,000 to $74,999 | 39 (20.5%) | 65 (11.9%) |
| $75,000 to $99,999 | 8 (4.2%) | 134 (24.4%) |
| $100,000 to $149,999 | 17 (8.9%) | 109 (19.9%) |
| $150,000 or more | 14 (7.4%) | 94 (17.2%) |
| Total | 190 (100.0%) | 548 (100.0%) |
Property Value to Household Income Ratio in Centerville
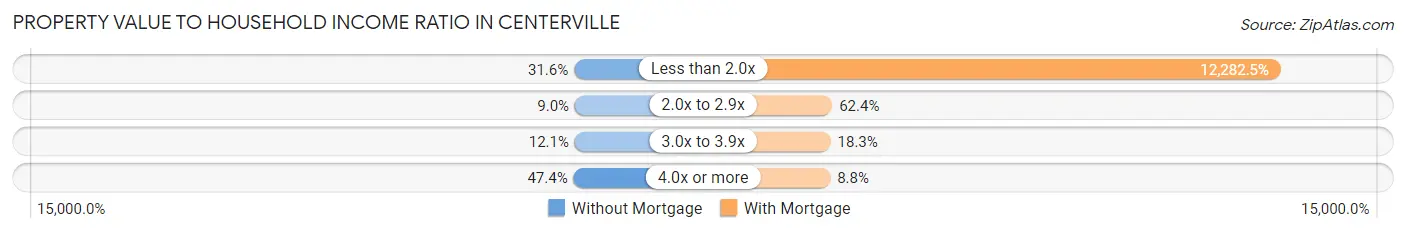
| Value-to-Income Ratio | Without Mortgage | With Mortgage |
| Less than 2.0x | 60 (31.6%) | 67,308 (12,282.5%) |
| 2.0x to 2.9x | 17 (8.9%) | 342 (62.4%) |
| 3.0x to 3.9x | 23 (12.1%) | 100 (18.2%) |
| 4.0x or more | 90 (47.4%) | 48 (8.8%) |
| Total | 190 (100.0%) | 548 (100.0%) |
Real Estate Taxes by Mortgage Status in Centerville

| Property Taxes | Without Mortgage | With Mortgage |
| Less than $800 | 44 (23.2%) | 0 (0.0%) |
| $800 to $1,499 | 97 (51.0%) | 132 (24.1%) |
| $800 to $1,499 | 35 (18.4%) | 263 (48.0%) |
| Total | 190 (100.0%) | 548 (100.0%) |
Health & Disability in Centerville
Health Insurance Coverage by Age in Centerville
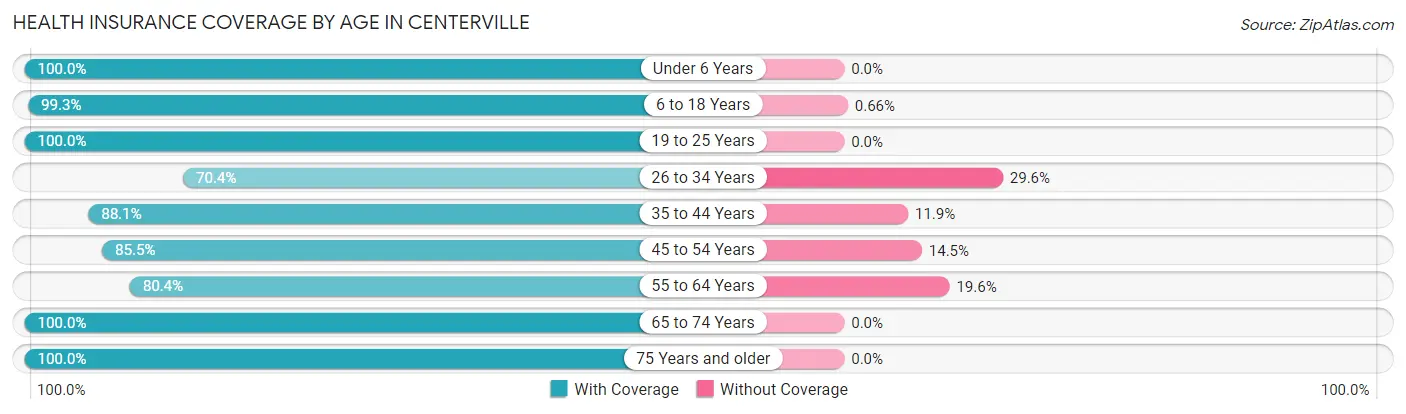
| Age Bracket | With Coverage | Without Coverage |
| Under 6 Years | 215 (100.0%) | 0 (0.0%) |
| 6 to 18 Years | 600 (99.3%) | 4 (0.7%) |
| 19 to 25 Years | 179 (100.0%) | 0 (0.0%) |
| 26 to 34 Years | 181 (70.4%) | 76 (29.6%) |
| 35 to 44 Years | 363 (88.1%) | 49 (11.9%) |
| 45 to 54 Years | 325 (85.5%) | 55 (14.5%) |
| 55 to 64 Years | 213 (80.4%) | 52 (19.6%) |
| 65 to 74 Years | 207 (100.0%) | 0 (0.0%) |
| 75 Years and older | 124 (100.0%) | 0 (0.0%) |
| Total | 2,407 (91.1%) | 236 (8.9%) |
Health Insurance Coverage by Citizenship Status in Centerville

| Citizenship Status | With Coverage | Without Coverage |
| Native Born | 215 (100.0%) | 0 (0.0%) |
| Foreign Born, Citizen | 600 (99.3%) | 4 (0.7%) |
| Foreign Born, not a Citizen | 179 (100.0%) | 0 (0.0%) |
Health Insurance Coverage by Household Income in Centerville
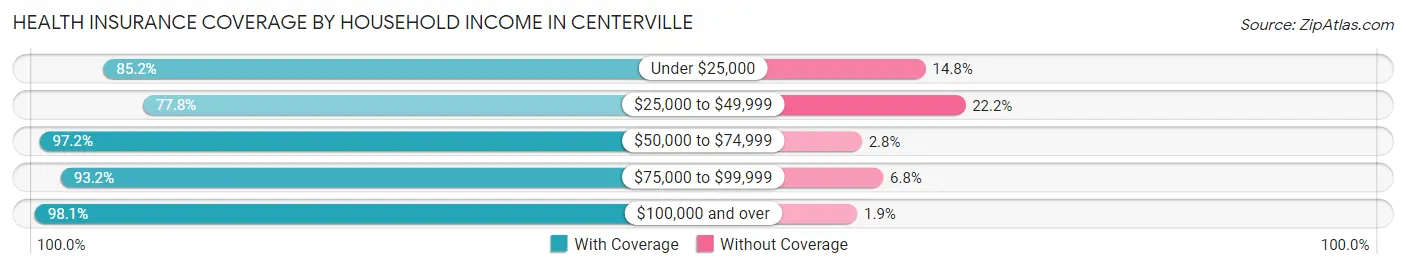
| Household Income | With Coverage | Without Coverage |
| Under $25,000 | 404 (85.2%) | 70 (14.8%) |
| $25,000 to $49,999 | 379 (77.8%) | 108 (22.2%) |
| $50,000 to $74,999 | 694 (97.2%) | 20 (2.8%) |
| $75,000 to $99,999 | 370 (93.2%) | 27 (6.8%) |
| $100,000 and over | 560 (98.1%) | 11 (1.9%) |
Public vs Private Health Insurance Coverage by Age in Centerville
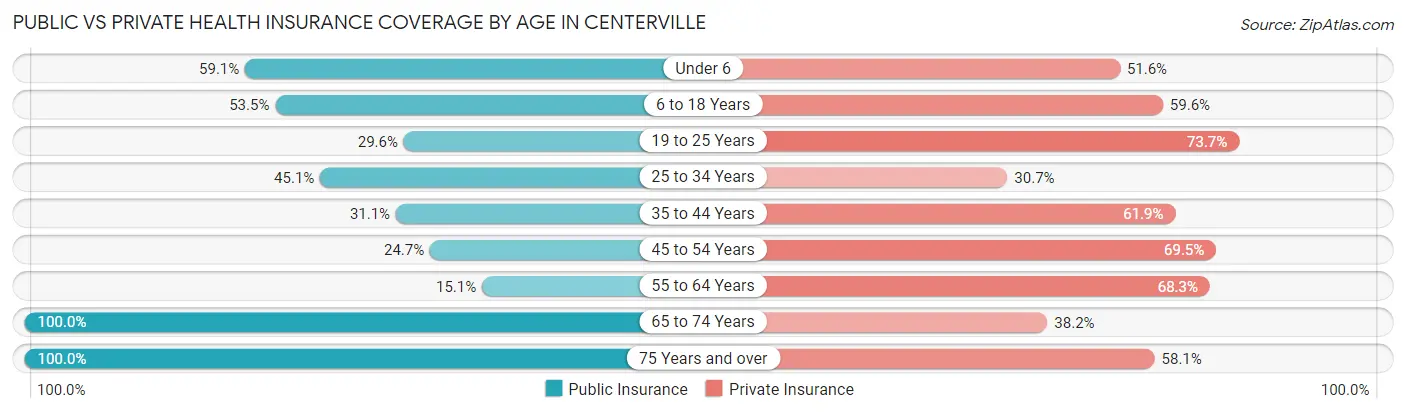
| Age Bracket | Public Insurance | Private Insurance |
| Under 6 | 127 (59.1%) | 111 (51.6%) |
| 6 to 18 Years | 323 (53.5%) | 360 (59.6%) |
| 19 to 25 Years | 53 (29.6%) | 132 (73.7%) |
| 25 to 34 Years | 116 (45.1%) | 79 (30.7%) |
| 35 to 44 Years | 128 (31.1%) | 255 (61.9%) |
| 45 to 54 Years | 94 (24.7%) | 264 (69.5%) |
| 55 to 64 Years | 40 (15.1%) | 181 (68.3%) |
| 65 to 74 Years | 207 (100.0%) | 79 (38.2%) |
| 75 Years and over | 124 (100.0%) | 72 (58.1%) |
| Total | 1,212 (45.9%) | 1,533 (58.0%) |
Disability Status by Sex by Age in Centerville
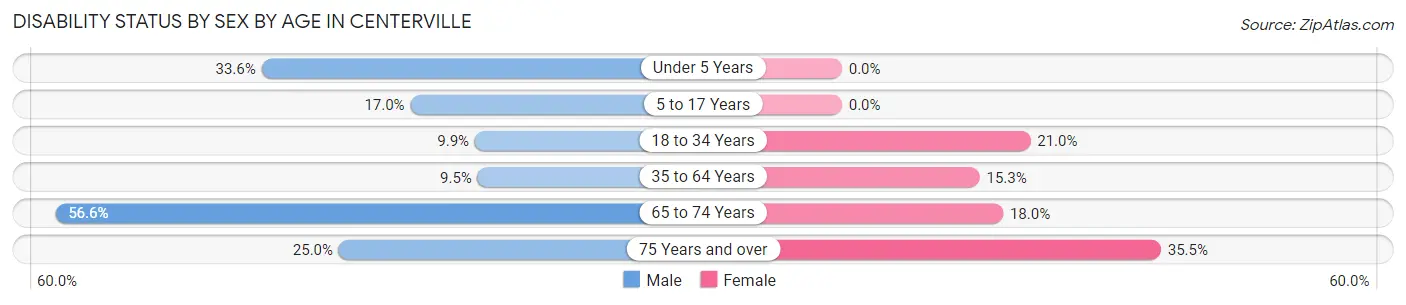
| Age Bracket | Male | Female |
| Under 5 Years | 41 (33.6%) | 0 (0.0%) |
| 5 to 17 Years | 54 (17.0%) | 0 (0.0%) |
| 18 to 34 Years | 20 (9.9%) | 55 (21.0%) |
| 35 to 64 Years | 48 (9.5%) | 85 (15.3%) |
| 65 to 74 Years | 73 (56.6%) | 14 (17.9%) |
| 75 Years and over | 12 (25.0%) | 27 (35.5%) |
Disability Class by Sex by Age in Centerville
Disability Class: Hearing Difficulty
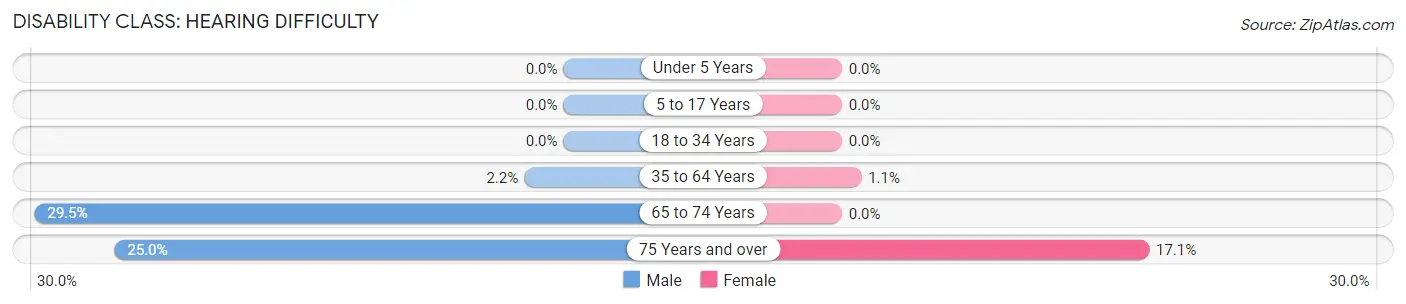
| Age Bracket | Male | Female |
| Under 5 Years | 0 (0.0%) | 0 (0.0%) |
| 5 to 17 Years | 0 (0.0%) | 0 (0.0%) |
| 18 to 34 Years | 0 (0.0%) | 0 (0.0%) |
| 35 to 64 Years | 11 (2.2%) | 6 (1.1%) |
| 65 to 74 Years | 38 (29.5%) | 0 (0.0%) |
| 75 Years and over | 12 (25.0%) | 13 (17.1%) |
Disability Class: Vision Difficulty
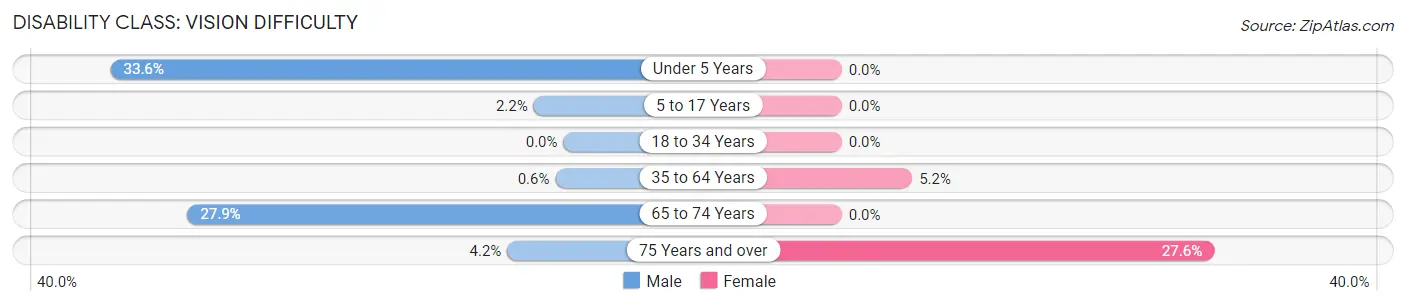
| Age Bracket | Male | Female |
| Under 5 Years | 41 (33.6%) | 0 (0.0%) |
| 5 to 17 Years | 7 (2.2%) | 0 (0.0%) |
| 18 to 34 Years | 0 (0.0%) | 0 (0.0%) |
| 35 to 64 Years | 3 (0.6%) | 29 (5.2%) |
| 65 to 74 Years | 36 (27.9%) | 0 (0.0%) |
| 75 Years and over | 2 (4.2%) | 21 (27.6%) |
Disability Class: Cognitive Difficulty
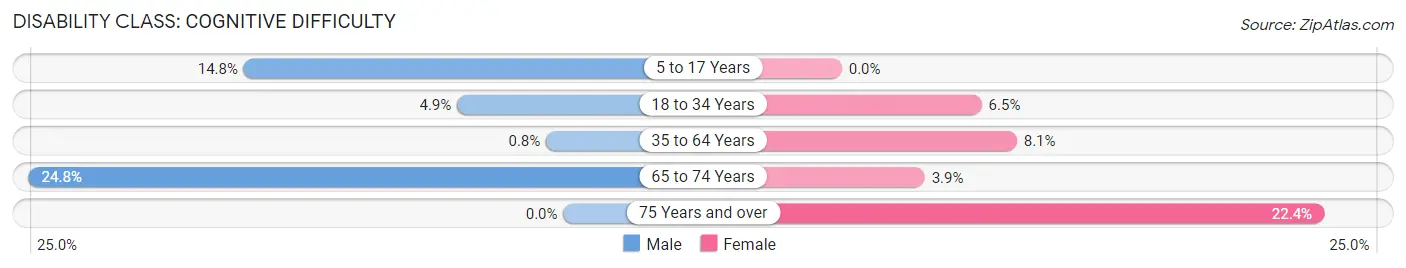
| Age Bracket | Male | Female |
| 5 to 17 Years | 47 (14.8%) | 0 (0.0%) |
| 18 to 34 Years | 10 (4.9%) | 17 (6.5%) |
| 35 to 64 Years | 4 (0.8%) | 45 (8.1%) |
| 65 to 74 Years | 32 (24.8%) | 3 (3.8%) |
| 75 Years and over | 0 (0.0%) | 17 (22.4%) |
Disability Class: Ambulatory Difficulty
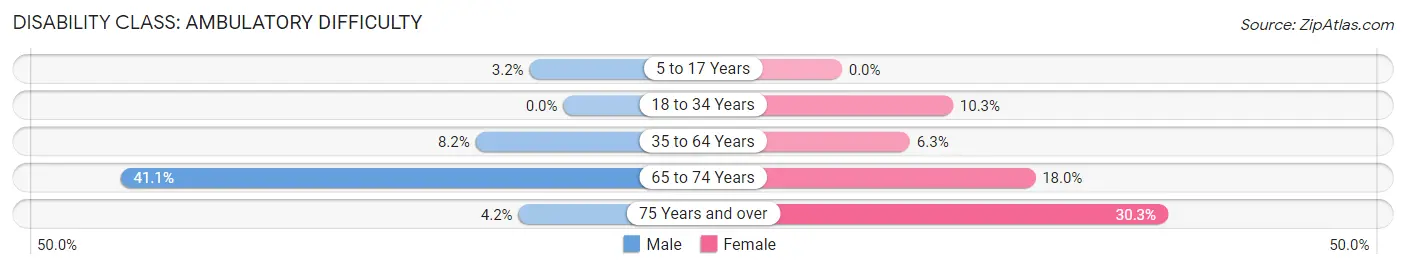
| Age Bracket | Male | Female |
| 5 to 17 Years | 10 (3.2%) | 0 (0.0%) |
| 18 to 34 Years | 0 (0.0%) | 27 (10.3%) |
| 35 to 64 Years | 41 (8.2%) | 35 (6.3%) |
| 65 to 74 Years | 53 (41.1%) | 14 (17.9%) |
| 75 Years and over | 2 (4.2%) | 23 (30.3%) |
Disability Class: Self-Care Difficulty
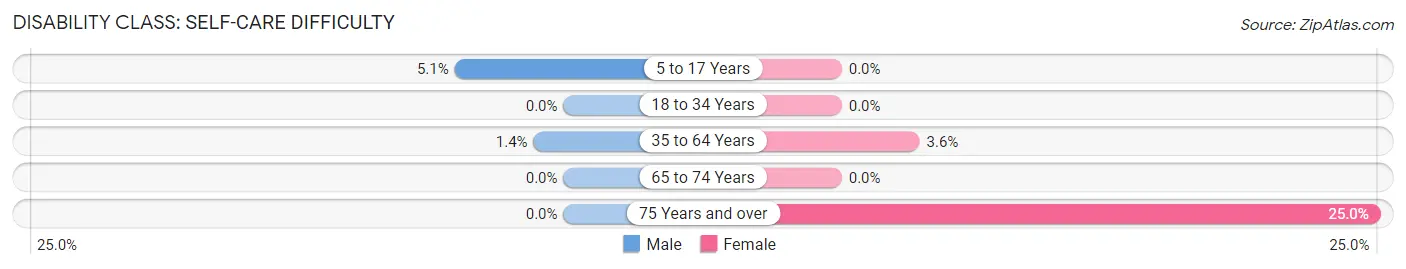
| Age Bracket | Male | Female |
| 5 to 17 Years | 16 (5.1%) | 0 (0.0%) |
| 18 to 34 Years | 0 (0.0%) | 0 (0.0%) |
| 35 to 64 Years | 7 (1.4%) | 20 (3.6%) |
| 65 to 74 Years | 0 (0.0%) | 0 (0.0%) |
| 75 Years and over | 0 (0.0%) | 19 (25.0%) |
Technology Access in Centerville
Computing Device Access in Centerville
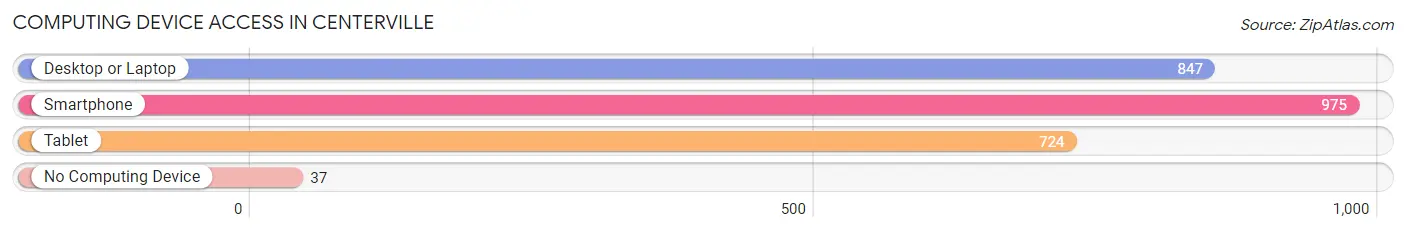
| Device Type | # Households | % Households |
| Desktop or Laptop | 847 | 78.0% |
| Smartphone | 975 | 89.8% |
| Tablet | 724 | 66.7% |
| No Computing Device | 37 | 3.4% |
| Total | 1,086 | 100.0% |
Internet Access in Centerville
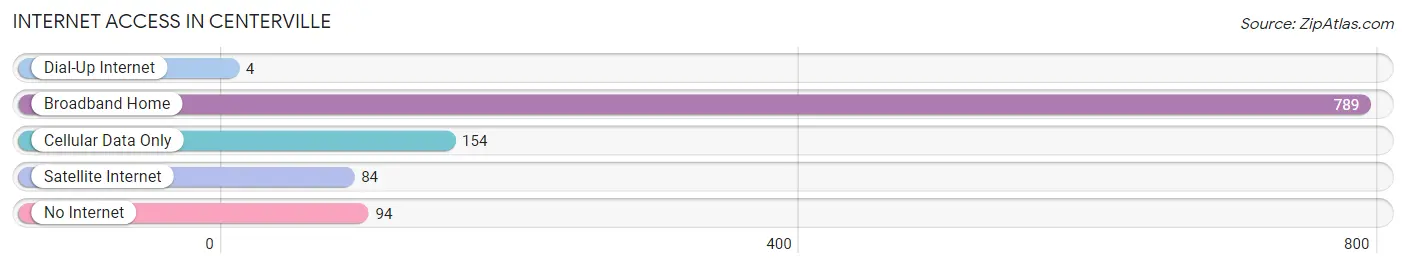
| Internet Type | # Households | % Households |
| Dial-Up Internet | 4 | 0.4% |
| Broadband Home | 789 | 72.7% |
| Cellular Data Only | 154 | 14.2% |
| Satellite Internet | 84 | 7.7% |
| No Internet | 94 | 8.7% |
| Total | 1,086 | 100.0% |
Centerville Summary
Centerville, Indiana is a small town located in Wayne County, Indiana. It is situated in the eastern part of the state, approximately 40 miles east of Indianapolis. The town has a population of approximately 5,000 people and is part of the Richmond, Indiana metropolitan area.
History
Centerville was founded in 1817 by a group of settlers from North Carolina. The town was originally known as Centerville because of its location at the center of Wayne County. The town was officially incorporated in 1837.
In the early years, Centerville was a small farming community. The town was home to a variety of businesses, including a sawmill, a grist mill, a blacksmith shop, and a general store. The town also had a post office, a school, and a church.
In the late 19th century, Centerville began to experience a period of growth. The town was connected to the outside world by the Richmond and Centerville Railroad, which was completed in 1883. This allowed for the transportation of goods and people to and from the town.
In the early 20th century, Centerville experienced a period of industrialization. The town was home to several factories, including a furniture factory, a canning factory, and a brickyard. These factories provided employment for many of the town’s residents.
Geography
Centerville is located in the eastern part of Wayne County, Indiana. The town is situated on the banks of the Whitewater River. The town is surrounded by rolling hills and farmland.
The climate in Centerville is typical of the Midwest. Summers are hot and humid, while winters are cold and snowy. The average annual temperature is around 50 degrees Fahrenheit.
Economy
Centerville’s economy is largely based on agriculture. The town is home to several farms, which produce a variety of crops, including corn, soybeans, and wheat. The town is also home to several small businesses, including restaurants, retail stores, and service providers.
The town is also home to several manufacturing companies, including a furniture factory, a canning factory, and a brickyard. These companies provide employment for many of the town’s residents.
Demographics
As of the 2010 census, the population of Centerville was 5,000. The town is predominantly white, with approximately 95% of the population being Caucasian. The town also has a small African American population, as well as a small Hispanic population.
The median household income in Centerville is $41,000. The town has a poverty rate of approximately 15%. The town also has a high rate of homeownership, with approximately 75% of the population owning their own homes.
Conclusion
Centerville, Indiana is a small town located in Wayne County, Indiana. The town has a population of approximately 5,000 people and is part of the Richmond, Indiana metropolitan area. The town was founded in 1817 and was officially incorporated in 1837. The town’s economy is largely based on agriculture, with several small businesses and manufacturing companies providing employment for many of the town’s residents. The town is predominantly white, with a small African American and Hispanic population. The median household income in Centerville is $41,000 and the town has a poverty rate of approximately 15%.
Common Questions
What is Per Capita Income in Centerville?
Per Capita income in Centerville is $27,373.
What is the Median Family Income in Centerville?
Median Family Income in Centerville is $60,458.
What is the Median Household income in Centerville?
Median Household Income in Centerville is $51,071.
What is Income or Wage Gap in Centerville?
Income or Wage Gap in Centerville is 42.5%.
Women in Centerville earn 57.5 cents for every dollar earned by a man.
What is Family Income Deficit in Centerville?
Family Income Deficit in Centerville is $12,785.
Families that are below poverty line in Centerville earn $12,785 less on average than the poverty threshold level.
What is Inequality or Gini Index in Centerville?
Inequality or Gini Index in Centerville is 0.43.
What is the Total Population of Centerville?
Total Population of Centerville is 2,760.
What is the Total Male Population of Centerville?
Total Male Population of Centerville is 1,401.
What is the Total Female Population of Centerville?
Total Female Population of Centerville is 1,359.
What is the Ratio of Males per 100 Females in Centerville?
There are 103.09 Males per 100 Females in Centerville.
What is the Ratio of Females per 100 Males in Centerville?
There are 97.00 Females per 100 Males in Centerville.
What is the Median Population Age in Centerville?
Median Population Age in Centerville is 40.0 Years.
What is the Average Family Size in Centerville
Average Family Size in Centerville is 2.8 People.
What is the Average Household Size in Centerville
Average Household Size in Centerville is 2.4 People.
How Large is the Labor Force in Centerville?
There are 1,236 People in the Labor Forcein in Centerville.
What is the Percentage of People in the Labor Force in Centerville?
59.4% of People are in the Labor Force in Centerville.
What is the Unemployment Rate in Centerville?
Unemployment Rate in Centerville is 5.2%.