Burns Harbor, IN Map & Demographics
Burns Harbor Map
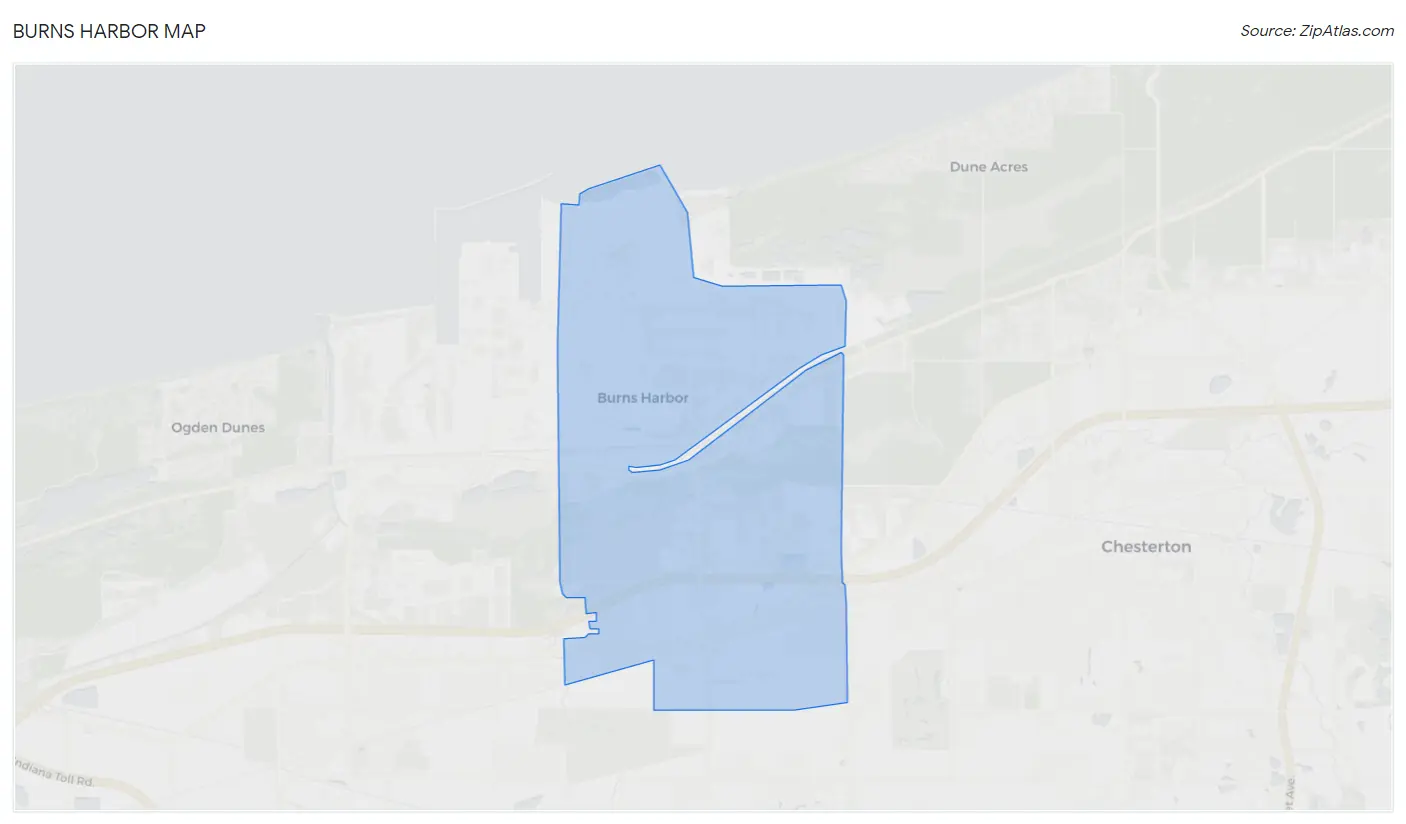
Burns Harbor Overview
$38,882
PER CAPITA INCOME
$112,083
AVG FAMILY INCOME
$96,382
AVG HOUSEHOLD INCOME
46.6%
WAGE / INCOME GAP [ % ]
53.4¢/ $1
WAGE / INCOME GAP [ $ ]
0.33
INEQUALITY / GINI INDEX
2,409
TOTAL POPULATION
1,213
MALE POPULATION
1,196
FEMALE POPULATION
101.42
MALES / 100 FEMALES
98.60
FEMALES / 100 MALES
36.4
MEDIAN AGE
3.3
AVG FAMILY SIZE
2.5
AVG HOUSEHOLD SIZE
1,270
LABOR FORCE [ PEOPLE ]
73.6%
PERCENT IN LABOR FORCE
0.7%
UNEMPLOYMENT RATE
Burns Harbor Area Codes
Income in Burns Harbor
Income Overview in Burns Harbor
Per Capita Income in Burns Harbor is $38,882, while median incomes of families and households are $112,083 and $96,382 respectively.
| Characteristic | Number | Measure |
| Per Capita Income | 2,409 | $38,882 |
| Median Family Income | 599 | $112,083 |
| Mean Family Income | 599 | $112,213 |
| Median Household Income | 945 | $96,382 |
| Mean Household Income | 945 | $98,395 |
| Income Deficit | 599 | $0 |
| Wage / Income Gap (%) | 2,409 | 46.60% |
| Wage / Income Gap ($) | 2,409 | 53.40¢ per $1 |
| Gini / Inequality Index | 2,409 | 0.33 |
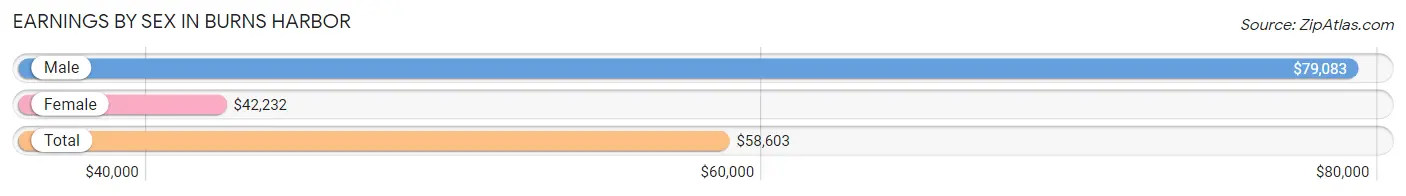
Earnings by Sex in Burns Harbor
Average Earnings in Burns Harbor are $58,603, $79,083 for men and $42,232 for women, a difference of 46.6%.
| Sex | Number | Average Earnings |
| Male | 723 (55.9%) | $79,083 |
| Female | 571 (44.1%) | $42,232 |
| Total | 1,294 (100.0%) | $58,603 |
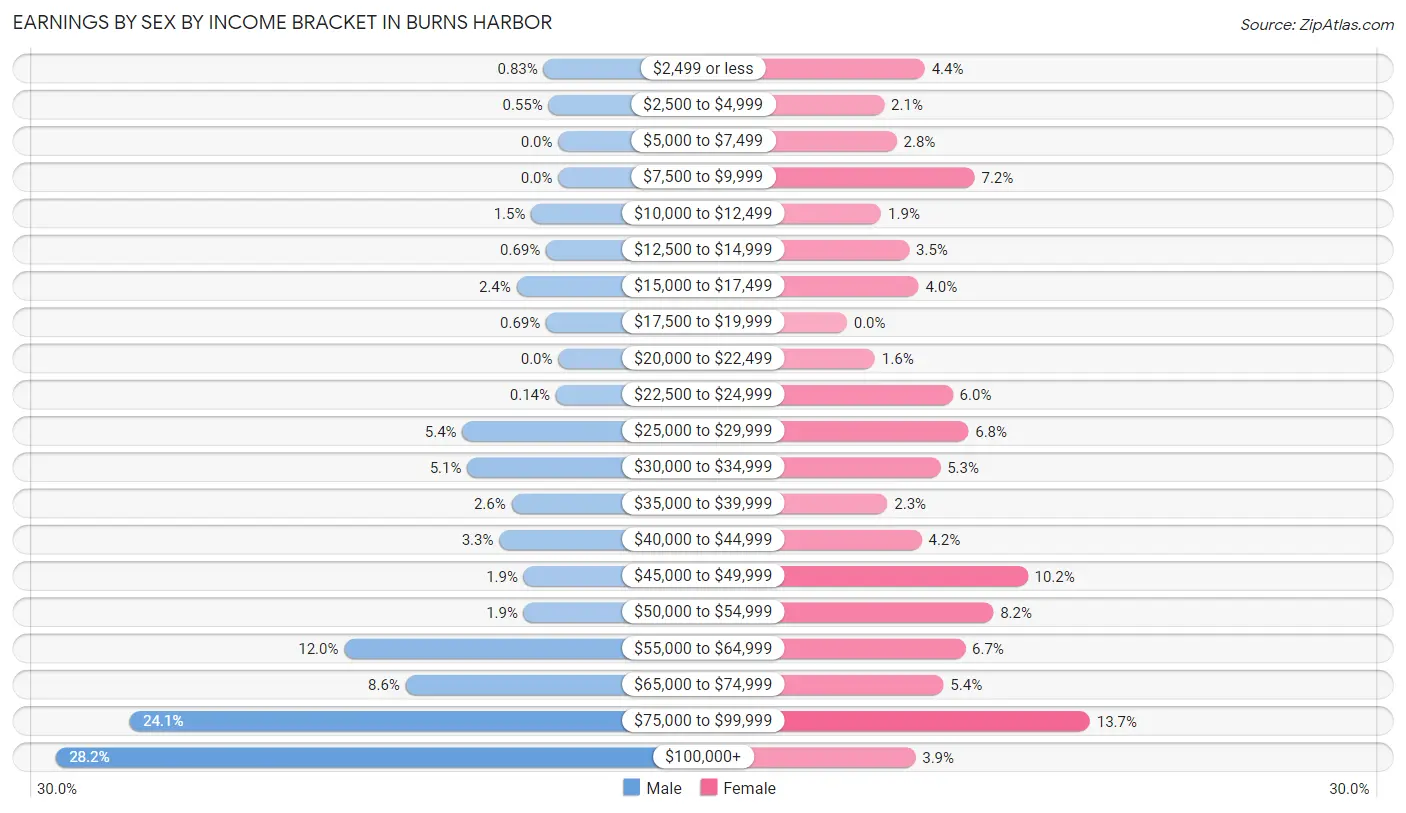
Earnings by Sex by Income Bracket in Burns Harbor
The most common earnings brackets in Burns Harbor are $100,000+ for men (204 | 28.2%) and $75,000 to $99,999 for women (78 | 13.7%).
| Income | Male | Female |
| $2,499 or less | 6 (0.8%) | 25 (4.4%) |
| $2,500 to $4,999 | 4 (0.5%) | 12 (2.1%) |
| $5,000 to $7,499 | 0 (0.0%) | 16 (2.8%) |
| $7,500 to $9,999 | 0 (0.0%) | 41 (7.2%) |
| $10,000 to $12,499 | 11 (1.5%) | 11 (1.9%) |
| $12,500 to $14,999 | 5 (0.7%) | 20 (3.5%) |
| $15,000 to $17,499 | 17 (2.4%) | 23 (4.0%) |
| $17,500 to $19,999 | 5 (0.7%) | 0 (0.0%) |
| $20,000 to $22,499 | 0 (0.0%) | 9 (1.6%) |
| $22,500 to $24,999 | 1 (0.1%) | 34 (5.9%) |
| $25,000 to $29,999 | 39 (5.4%) | 39 (6.8%) |
| $30,000 to $34,999 | 37 (5.1%) | 30 (5.2%) |
| $35,000 to $39,999 | 19 (2.6%) | 13 (2.3%) |
| $40,000 to $44,999 | 24 (3.3%) | 24 (4.2%) |
| $45,000 to $49,999 | 14 (1.9%) | 58 (10.2%) |
| $50,000 to $54,999 | 14 (1.9%) | 47 (8.2%) |
| $55,000 to $64,999 | 87 (12.0%) | 38 (6.7%) |
| $65,000 to $74,999 | 62 (8.6%) | 31 (5.4%) |
| $75,000 to $99,999 | 174 (24.1%) | 78 (13.7%) |
| $100,000+ | 204 (28.2%) | 22 (3.8%) |
| Total | 723 (100.0%) | 571 (100.0%) |
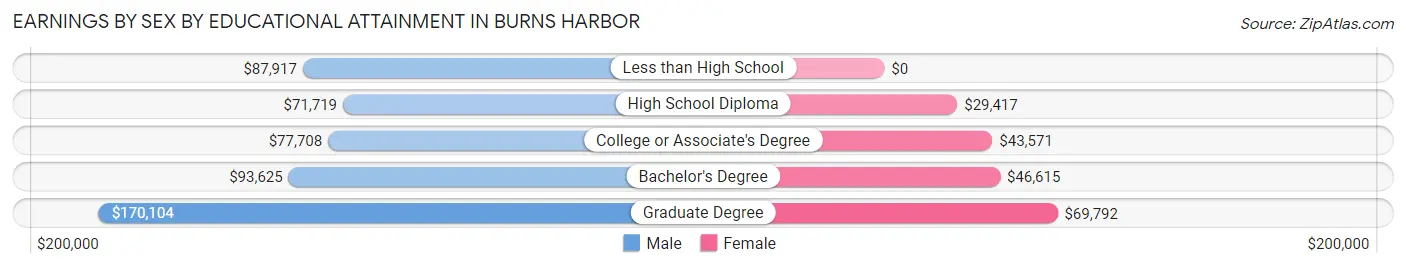
Earnings by Sex by Educational Attainment in Burns Harbor
Average earnings in Burns Harbor are $82,375 for men and $46,051 for women, a difference of 44.1%. Men with an educational attainment of graduate degree enjoy the highest average annual earnings of $170,104, while those with high school diploma education earn the least with $71,719. Women with an educational attainment of graduate degree earn the most with the average annual earnings of $69,792, while those with high school diploma education have the smallest earnings of $29,417.
| Educational Attainment | Male Income | Female Income |
| Less than High School | $87,917 | $0 |
| High School Diploma | $71,719 | $29,417 |
| College or Associate's Degree | $77,708 | $43,571 |
| Bachelor's Degree | $93,625 | $46,615 |
| Graduate Degree | $170,104 | $69,792 |
| Total | $82,375 | $46,051 |
Family Income in Burns Harbor
Family Income Brackets in Burns Harbor
According to the Burns Harbor family income data, there are 224 families falling into the $100,000 to $149,999 income range, which is the most common income bracket and makes up 37.4% of all families. Conversely, the $10,000 to $14,999 income bracket is the least frequent group with only 5 families (0.8%) belonging to this category.
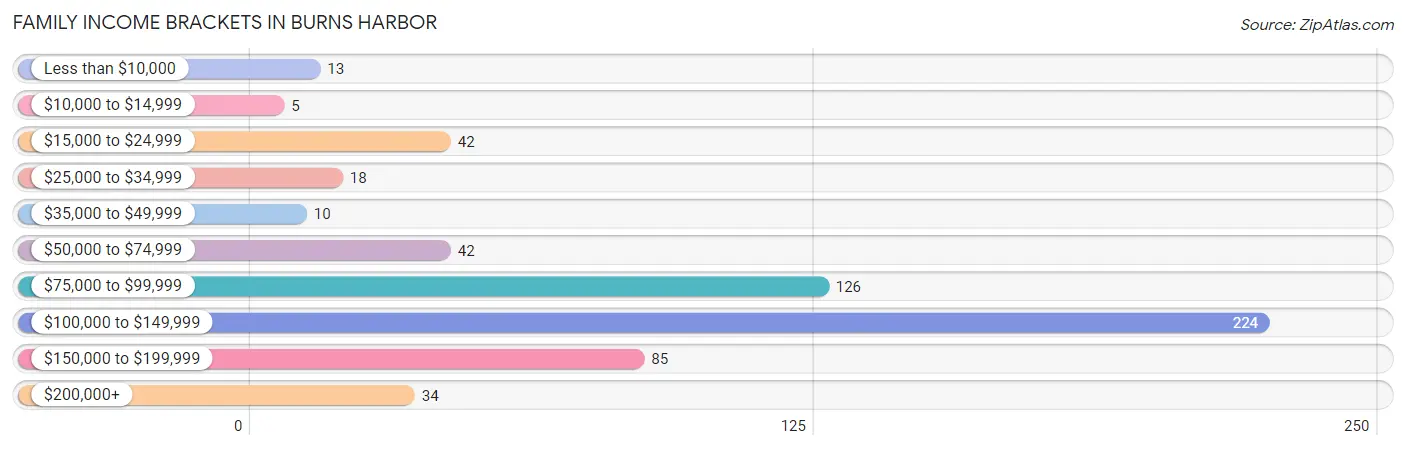
| Income Bracket | # Families | % Families |
| Less than $10,000 | 13 | 2.2% |
| $10,000 to $14,999 | 5 | 0.8% |
| $15,000 to $24,999 | 42 | 7.0% |
| $25,000 to $34,999 | 18 | 3.0% |
| $35,000 to $49,999 | 10 | 1.7% |
| $50,000 to $74,999 | 42 | 7.0% |
| $75,000 to $99,999 | 126 | 21.0% |
| $100,000 to $149,999 | 224 | 37.4% |
| $150,000 to $199,999 | 85 | 14.2% |
| $200,000+ | 34 | 5.7% |
Family Income by Famaliy Size in Burns Harbor
4-person families (152 | 25.4%) account for the highest median family income in Burns Harbor with $119,500 per family, while 2-person families (189 | 31.6%) have the highest median income of $57,458 per family member.
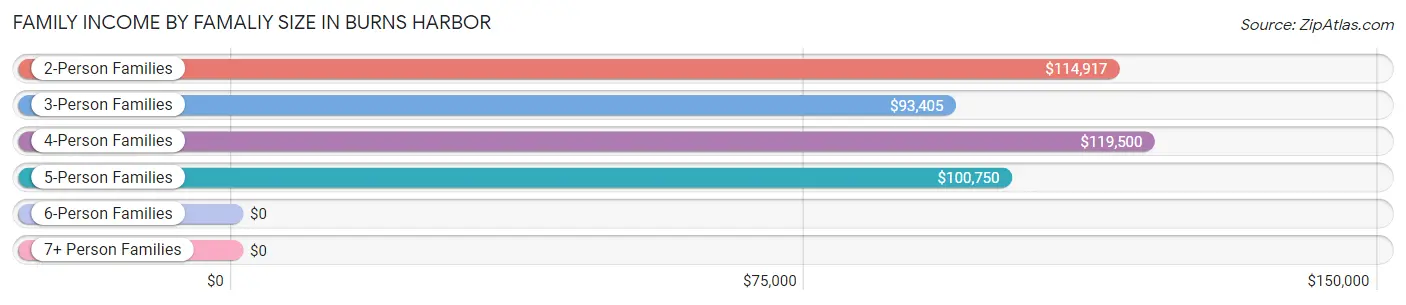
| Income Bracket | # Families | Median Income |
| 2-Person Families | 189 (31.6%) | $114,917 |
| 3-Person Families | 185 (30.9%) | $93,405 |
| 4-Person Families | 152 (25.4%) | $119,500 |
| 5-Person Families | 49 (8.2%) | $100,750 |
| 6-Person Families | 18 (3.0%) | $0 |
| 7+ Person Families | 6 (1.0%) | $0 |
| Total | 599 (100.0%) | $112,083 |
Family Income by Number of Earners in Burns Harbor
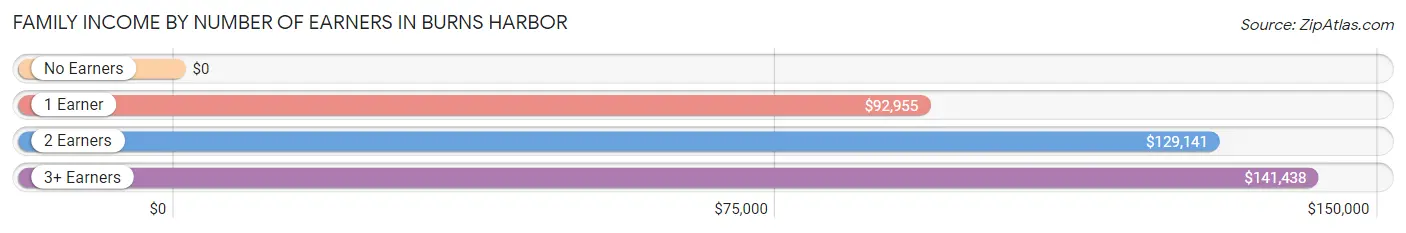
| Number of Earners | # Families | Median Income |
| No Earners | 59 (9.9%) | $0 |
| 1 Earner | 168 (28.1%) | $92,955 |
| 2 Earners | 299 (49.9%) | $129,141 |
| 3+ Earners | 73 (12.2%) | $141,438 |
| Total | 599 (100.0%) | $112,083 |
Household Income in Burns Harbor
Household Income Brackets in Burns Harbor
With 290 households falling in the category, the $100,000 to $149,999 income range is the most frequent in Burns Harbor, accounting for 30.7% of all households. In contrast, only 22 households (2.3%) fall into the less than $10,000 income bracket, making it the least populous group.
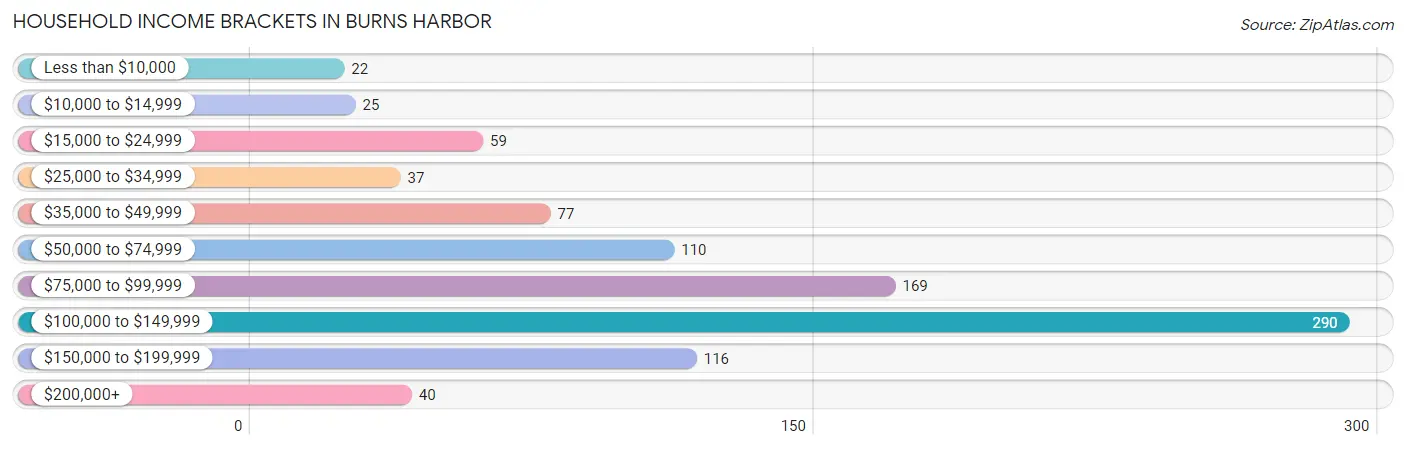
| Income Bracket | # Households | % Households |
| Less than $10,000 | 22 | 2.3% |
| $10,000 to $14,999 | 25 | 2.6% |
| $15,000 to $24,999 | 59 | 6.2% |
| $25,000 to $34,999 | 37 | 3.9% |
| $35,000 to $49,999 | 77 | 8.1% |
| $50,000 to $74,999 | 110 | 11.6% |
| $75,000 to $99,999 | 169 | 17.9% |
| $100,000 to $149,999 | 290 | 30.7% |
| $150,000 to $199,999 | 116 | 12.3% |
| $200,000+ | 40 | 4.2% |
Household Income by Householder Age in Burns Harbor
The median household income in Burns Harbor is $96,382, with the highest median household income of $113,185 found in the 45 to 64 years age bracket for the primary householder. A total of 351 households (37.1%) fall into this category. Meanwhile, the 65+ years age bracket for the primary householder has the lowest median household income of $45,833, with 158 households (16.7%) in this group.
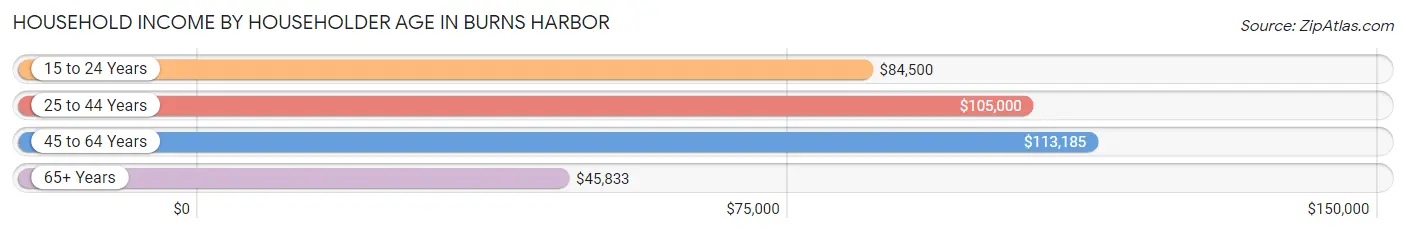
| Income Bracket | # Households | Median Income |
| 15 to 24 Years | 14 (1.5%) | $84,500 |
| 25 to 44 Years | 422 (44.7%) | $105,000 |
| 45 to 64 Years | 351 (37.1%) | $113,185 |
| 65+ Years | 158 (16.7%) | $45,833 |
| Total | 945 (100.0%) | $96,382 |
Poverty in Burns Harbor
Income Below Poverty by Sex and Age in Burns Harbor
With 6.6% poverty level for males and 18.3% for females among the residents of Burns Harbor, 12 to 14 year old males and 15 year old females are the most vulnerable to poverty, with 23 males (23.0%) and 20 females (62.5%) in their respective age groups living below the poverty level.
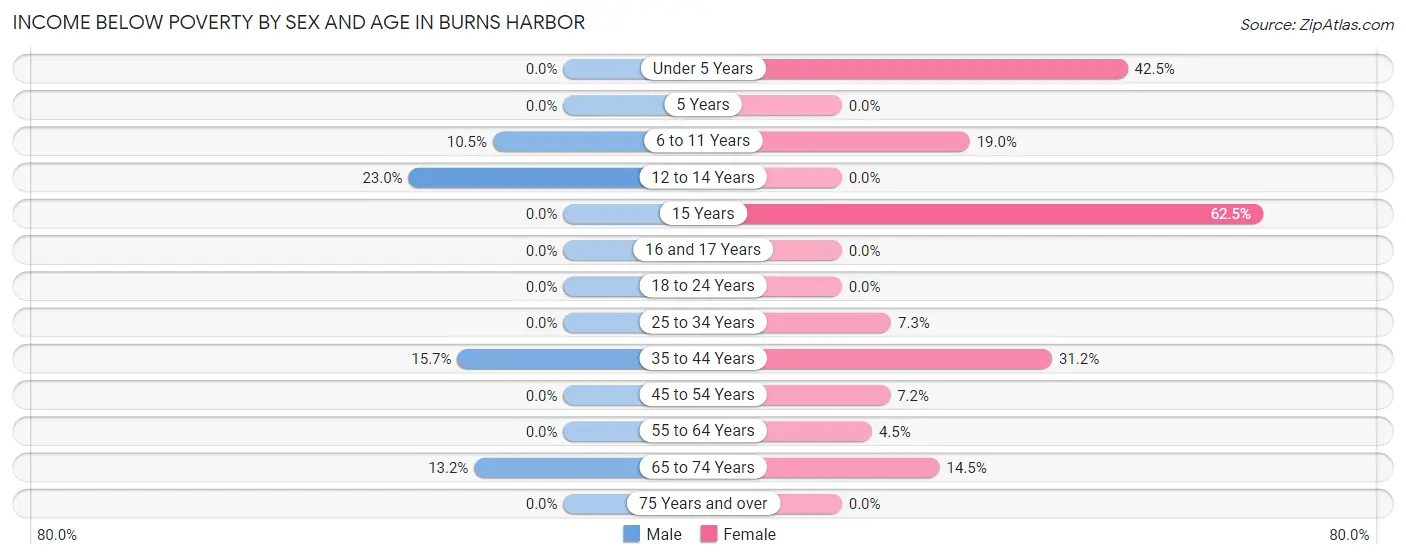
| Age Bracket | Male | Female |
| Under 5 Years | 0 (0.0%) | 59 (42.4%) |
| 5 Years | 0 (0.0%) | 0 (0.0%) |
| 6 to 11 Years | 11 (10.5%) | 19 (19.0%) |
| 12 to 14 Years | 23 (23.0%) | 0 (0.0%) |
| 15 Years | 0 (0.0%) | 20 (62.5%) |
| 16 and 17 Years | 0 (0.0%) | 0 (0.0%) |
| 18 to 24 Years | 0 (0.0%) | 0 (0.0%) |
| 25 to 34 Years | 0 (0.0%) | 9 (7.3%) |
| 35 to 44 Years | 37 (15.7%) | 88 (31.2%) |
| 45 to 54 Years | 0 (0.0%) | 11 (7.2%) |
| 55 to 64 Years | 0 (0.0%) | 4 (4.5%) |
| 65 to 74 Years | 9 (13.2%) | 9 (14.5%) |
| 75 Years and over | 0 (0.0%) | 0 (0.0%) |
| Total | 80 (6.6%) | 219 (18.3%) |
Income Above Poverty by Sex and Age in Burns Harbor
According to the poverty statistics in Burns Harbor, males aged under 5 years and females aged 5 years are the age groups that are most secure financially, with 100.0% of males and 100.0% of females in these age groups living above the poverty line.
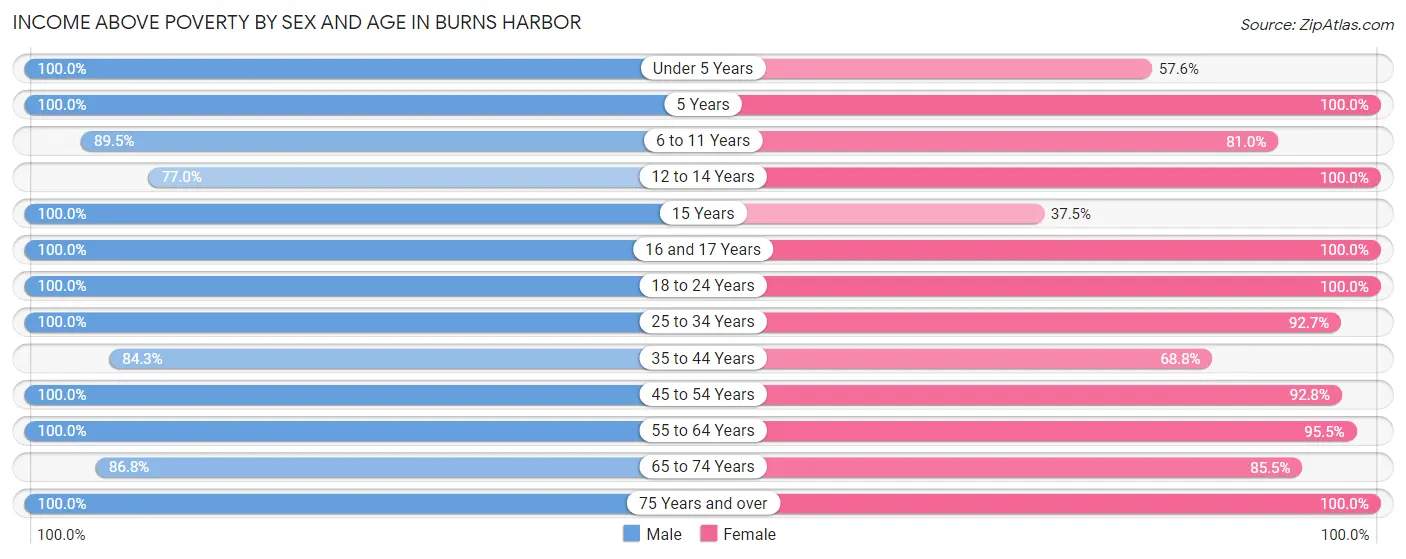
| Age Bracket | Male | Female |
| Under 5 Years | 102 (100.0%) | 80 (57.6%) |
| 5 Years | 20 (100.0%) | 19 (100.0%) |
| 6 to 11 Years | 94 (89.5%) | 81 (81.0%) |
| 12 to 14 Years | 77 (77.0%) | 63 (100.0%) |
| 15 Years | 4 (100.0%) | 12 (37.5%) |
| 16 and 17 Years | 15 (100.0%) | 30 (100.0%) |
| 18 to 24 Years | 49 (100.0%) | 65 (100.0%) |
| 25 to 34 Years | 118 (100.0%) | 114 (92.7%) |
| 35 to 44 Years | 198 (84.3%) | 194 (68.8%) |
| 45 to 54 Years | 227 (100.0%) | 142 (92.8%) |
| 55 to 64 Years | 124 (100.0%) | 85 (95.5%) |
| 65 to 74 Years | 59 (86.8%) | 53 (85.5%) |
| 75 Years and over | 46 (100.0%) | 39 (100.0%) |
| Total | 1,133 (93.4%) | 977 (81.7%) |
Income Below Poverty Among Married-Couple Families in Burns Harbor
The poverty statistics for married-couple families in Burns Harbor show that 5.8% or 28 of the total 486 families live below the poverty line. Families with 1 or 2 children have the highest poverty rate of 9.6%, comprising of 23 families. On the other hand, families with 3 or 4 children have the lowest poverty rate of 0.0%, which includes 0 families.
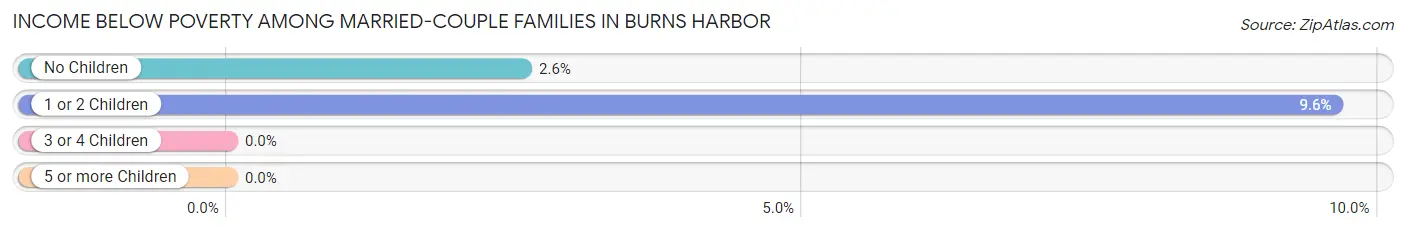
| Children | Above Poverty | Below Poverty |
| No Children | 190 (97.4%) | 5 (2.6%) |
| 1 or 2 Children | 216 (90.4%) | 23 (9.6%) |
| 3 or 4 Children | 46 (100.0%) | 0 (0.0%) |
| 5 or more Children | 6 (100.0%) | 0 (0.0%) |
| Total | 458 (94.2%) | 28 (5.8%) |
Income Below Poverty Among Single-Parent Households in Burns Harbor
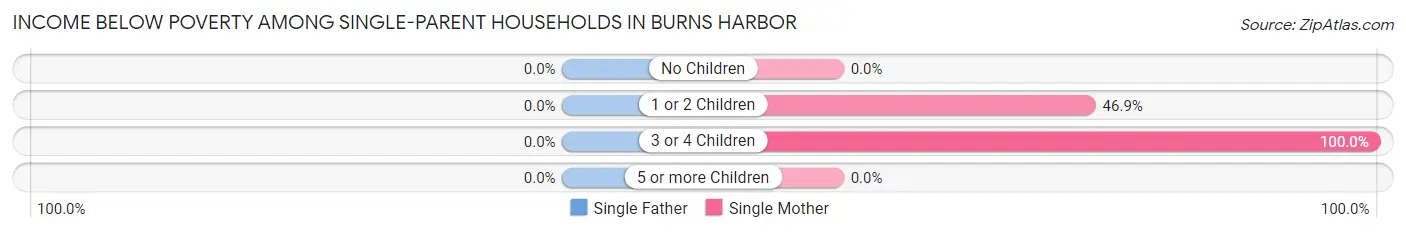
| Children | Single Father | Single Mother |
| No Children | 0 (0.0%) | 0 (0.0%) |
| 1 or 2 Children | 0 (0.0%) | 23 (46.9%) |
| 3 or 4 Children | 0 (0.0%) | 9 (100.0%) |
| 5 or more Children | 0 (0.0%) | 0 (0.0%) |
| Total | 0 (0.0%) | 32 (55.2%) |
Income Below Poverty Among Married-Couple vs Single-Parent Households in Burns Harbor
The poverty data for Burns Harbor shows that 28 of the married-couple family households (5.8%) and 32 of the single-parent households (28.3%) are living below the poverty level. Within the married-couple family households, those with 1 or 2 children have the highest poverty rate, with 23 households (9.6%) falling below the poverty line. Among the single-parent households, those with 3 or 4 children have the highest poverty rate, with 9 household (50.0%) living below poverty.
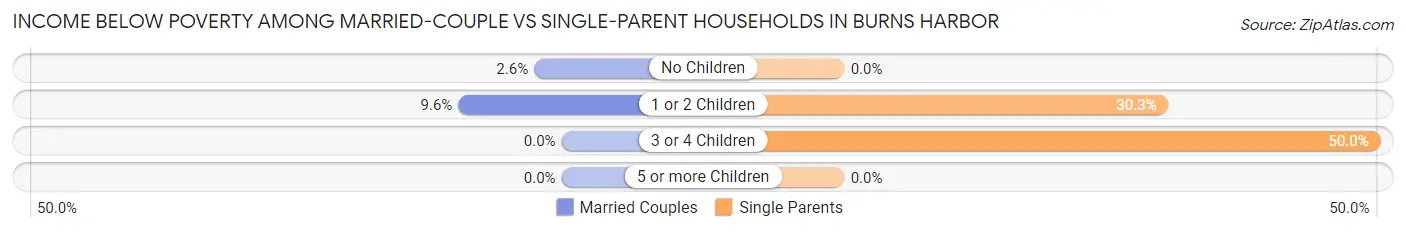
| Children | Married-Couple Families | Single-Parent Households |
| No Children | 5 (2.6%) | 0 (0.0%) |
| 1 or 2 Children | 23 (9.6%) | 23 (30.3%) |
| 3 or 4 Children | 0 (0.0%) | 9 (50.0%) |
| 5 or more Children | 0 (0.0%) | 0 (0.0%) |
| Total | 28 (5.8%) | 32 (28.3%) |
Race in Burns Harbor
The most populous races in Burns Harbor are White / Caucasian (2,235 | 92.8%), Hispanic or Latino (344 | 14.3%), and Two or more Races (85 | 3.5%).
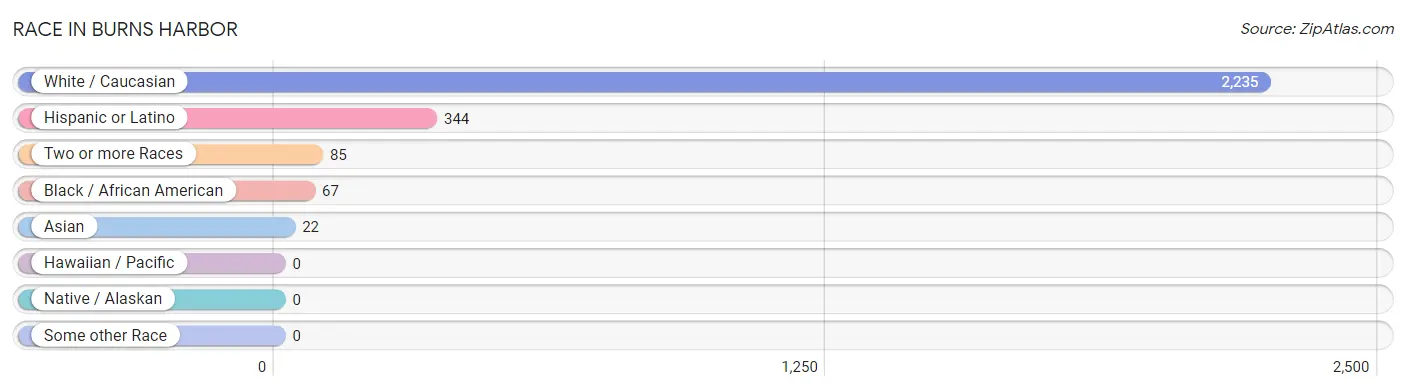
| Race | # Population | % Population |
| Asian | 22 | 0.9% |
| Black / African American | 67 | 2.8% |
| Hawaiian / Pacific | 0 | 0.0% |
| Hispanic or Latino | 344 | 14.3% |
| Native / Alaskan | 0 | 0.0% |
| White / Caucasian | 2,235 | 92.8% |
| Two or more Races | 85 | 3.5% |
| Some other Race | 0 | 0.0% |
| Total | 2,409 | 100.0% |
Ancestry in Burns Harbor
The most populous ancestries reported in Burns Harbor are German (364 | 15.1%), Irish (301 | 12.5%), Mexican (300 | 12.4%), English (217 | 9.0%), and Polish (205 | 8.5%), together accounting for 57.6% of all Burns Harbor residents.
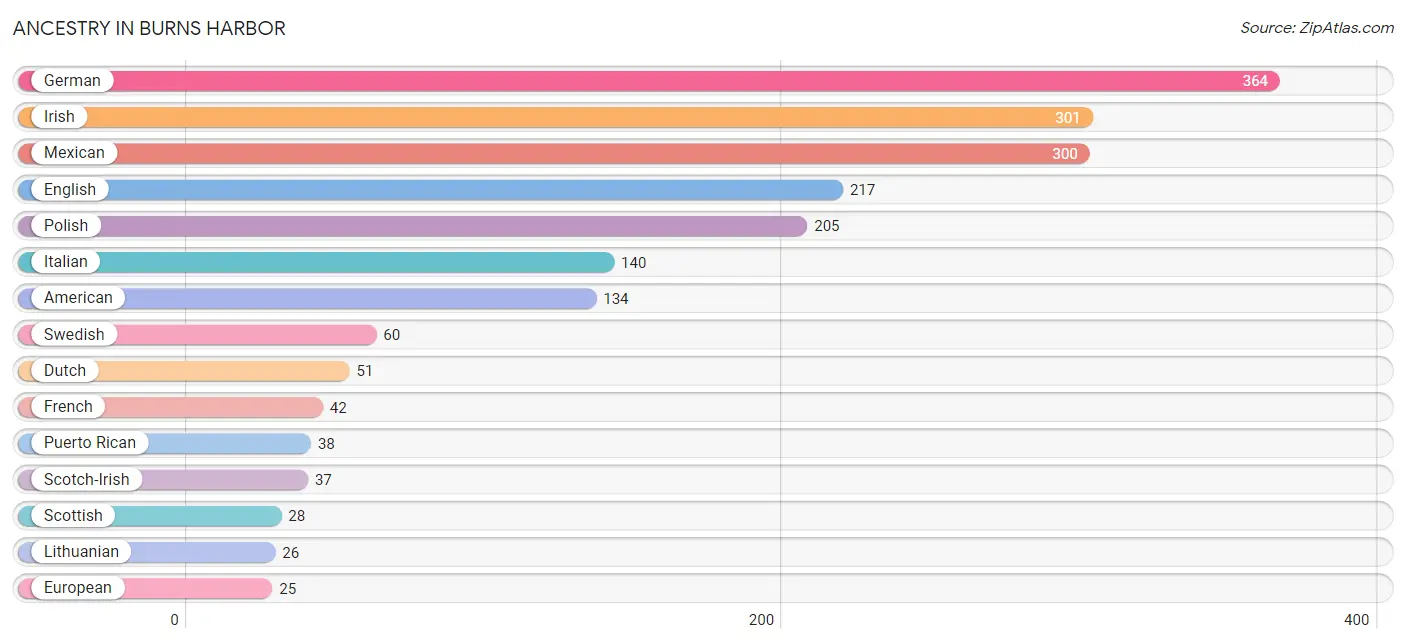
| Ancestry | # Population | % Population |
| American | 134 | 5.6% |
| Armenian | 3 | 0.1% |
| British | 3 | 0.1% |
| Bulgarian | 20 | 0.8% |
| Canadian | 5 | 0.2% |
| Croatian | 12 | 0.5% |
| Dutch | 51 | 2.1% |
| Eastern European | 23 | 0.9% |
| English | 217 | 9.0% |
| European | 25 | 1.0% |
| French | 42 | 1.7% |
| French Canadian | 15 | 0.6% |
| German | 364 | 15.1% |
| Hungarian | 8 | 0.3% |
| Indian (Asian) | 13 | 0.5% |
| Indonesian | 2 | 0.1% |
| Irish | 301 | 12.5% |
| Italian | 140 | 5.8% |
| Korean | 9 | 0.4% |
| Lithuanian | 26 | 1.1% |
| Mexican | 300 | 12.4% |
| Mexican American Indian | 13 | 0.5% |
| Norwegian | 7 | 0.3% |
| Polish | 205 | 8.5% |
| Puerto Rican | 38 | 1.6% |
| Russian | 13 | 0.5% |
| Scandinavian | 5 | 0.2% |
| Scotch-Irish | 37 | 1.5% |
| Scottish | 28 | 1.2% |
| Serbian | 3 | 0.1% |
| Slovak | 16 | 0.7% |
| Swedish | 60 | 2.5% |
| Thai | 7 | 0.3% |
| Ukrainian | 6 | 0.3% |
| Welsh | 13 | 0.5% |
| Yugoslavian | 7 | 0.3% | View All 36 Rows |
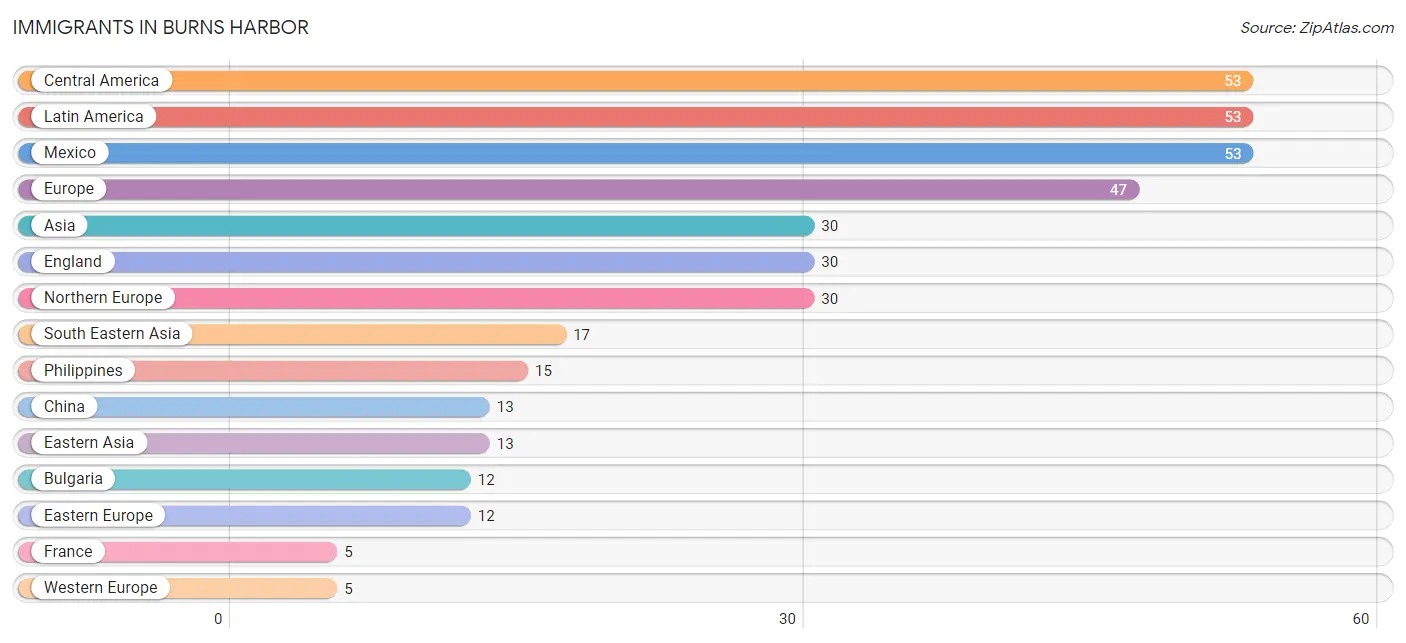
Immigrants in Burns Harbor
The most numerous immigrant groups reported in Burns Harbor came from Central America (53 | 2.2%), Latin America (53 | 2.2%), Mexico (53 | 2.2%), Europe (47 | 1.9%), and Asia (30 | 1.3%), together accounting for 9.8% of all Burns Harbor residents.
| Immigration Origin | # Population | % Population |
| Asia | 30 | 1.3% |
| Bulgaria | 12 | 0.5% |
| Central America | 53 | 2.2% |
| China | 13 | 0.5% |
| Eastern Asia | 13 | 0.5% |
| Eastern Europe | 12 | 0.5% |
| England | 30 | 1.3% |
| Europe | 47 | 1.9% |
| France | 5 | 0.2% |
| Latin America | 53 | 2.2% |
| Mexico | 53 | 2.2% |
| Northern Europe | 30 | 1.3% |
| Philippines | 15 | 0.6% |
| South Eastern Asia | 17 | 0.7% |
| Western Europe | 5 | 0.2% | View All 15 Rows |
Sex and Age in Burns Harbor
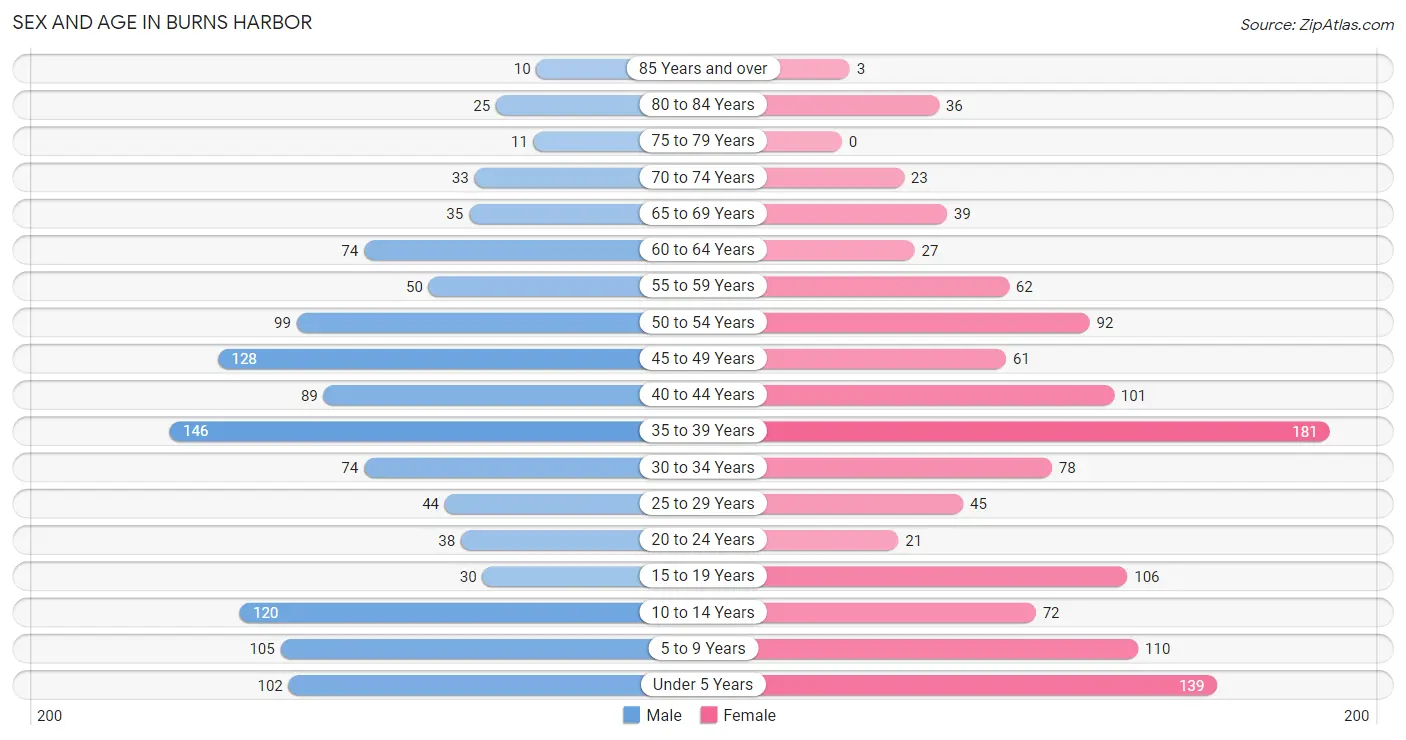
Sex and Age in Burns Harbor
The most populous age groups in Burns Harbor are 35 to 39 Years (146 | 12.0%) for men and 35 to 39 Years (181 | 15.1%) for women.
| Age Bracket | Male | Female |
| Under 5 Years | 102 (8.4%) | 139 (11.6%) |
| 5 to 9 Years | 105 (8.7%) | 110 (9.2%) |
| 10 to 14 Years | 120 (9.9%) | 72 (6.0%) |
| 15 to 19 Years | 30 (2.5%) | 106 (8.9%) |
| 20 to 24 Years | 38 (3.1%) | 21 (1.8%) |
| 25 to 29 Years | 44 (3.6%) | 45 (3.8%) |
| 30 to 34 Years | 74 (6.1%) | 78 (6.5%) |
| 35 to 39 Years | 146 (12.0%) | 181 (15.1%) |
| 40 to 44 Years | 89 (7.3%) | 101 (8.4%) |
| 45 to 49 Years | 128 (10.5%) | 61 (5.1%) |
| 50 to 54 Years | 99 (8.2%) | 92 (7.7%) |
| 55 to 59 Years | 50 (4.1%) | 62 (5.2%) |
| 60 to 64 Years | 74 (6.1%) | 27 (2.3%) |
| 65 to 69 Years | 35 (2.9%) | 39 (3.3%) |
| 70 to 74 Years | 33 (2.7%) | 23 (1.9%) |
| 75 to 79 Years | 11 (0.9%) | 0 (0.0%) |
| 80 to 84 Years | 25 (2.1%) | 36 (3.0%) |
| 85 Years and over | 10 (0.8%) | 3 (0.3%) |
| Total | 1,213 (100.0%) | 1,196 (100.0%) |
Families and Households in Burns Harbor
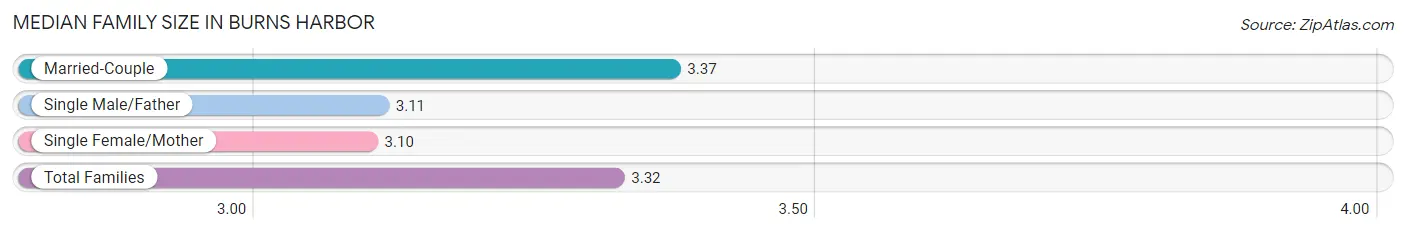
Median Family Size in Burns Harbor
The median family size in Burns Harbor is 3.32 persons per family, with married-couple families (486 | 81.1%) accounting for the largest median family size of 3.37 persons per family. On the other hand, single female/mother families (58 | 9.7%) represent the smallest median family size with 3.10 persons per family.
| Family Type | # Families | Family Size |
| Married-Couple | 486 (81.1%) | 3.37 |
| Single Male/Father | 55 (9.2%) | 3.11 |
| Single Female/Mother | 58 (9.7%) | 3.10 |
| Total Families | 599 (100.0%) | 3.32 |
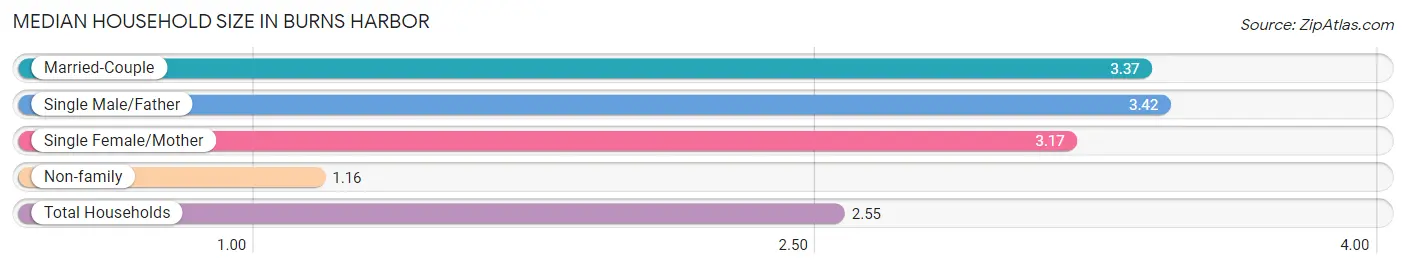
Median Household Size in Burns Harbor
The median household size in Burns Harbor is 2.55 persons per household, with single male/father households (55 | 5.8%) accounting for the largest median household size of 3.42 persons per household. non-family households (346 | 36.6%) represent the smallest median household size with 1.16 persons per household.
| Household Type | # Households | Household Size |
| Married-Couple | 486 (51.4%) | 3.37 |
| Single Male/Father | 55 (5.8%) | 3.42 |
| Single Female/Mother | 58 (6.1%) | 3.17 |
| Non-family | 346 (36.6%) | 1.16 |
| Total Households | 945 (100.0%) | 2.55 |
Household Size by Marriage Status in Burns Harbor
Out of a total of 945 households in Burns Harbor, 599 (63.4%) are family households, while 346 (36.6%) are nonfamily households. The most numerous type of family households are 3-person households, comprising 188, and the most common type of nonfamily households are 1-person households, comprising 297.
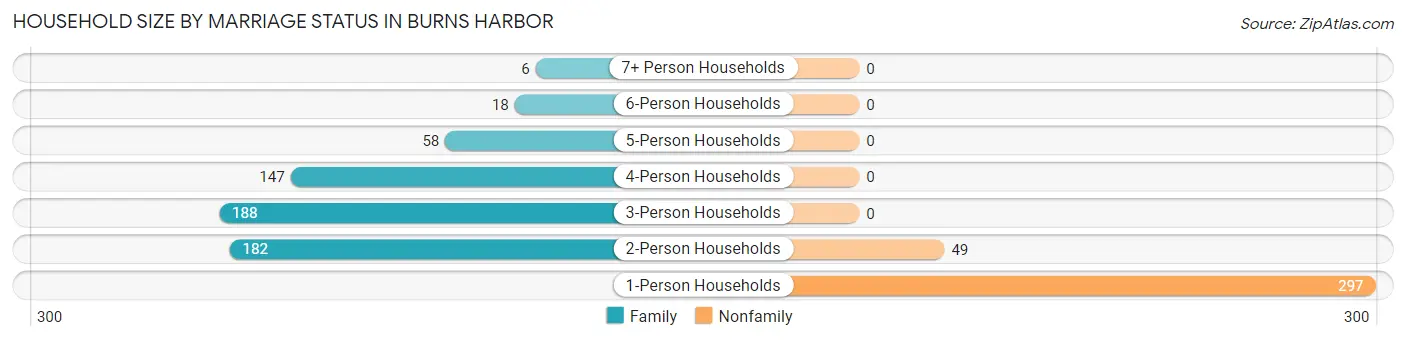
| Household Size | Family Households | Nonfamily Households |
| 1-Person Households | - | 297 (31.4%) |
| 2-Person Households | 182 (19.3%) | 49 (5.2%) |
| 3-Person Households | 188 (19.9%) | 0 (0.0%) |
| 4-Person Households | 147 (15.6%) | 0 (0.0%) |
| 5-Person Households | 58 (6.1%) | 0 (0.0%) |
| 6-Person Households | 18 (1.9%) | 0 (0.0%) |
| 7+ Person Households | 6 (0.6%) | 0 (0.0%) |
| Total | 599 (63.4%) | 346 (36.6%) |
Female Fertility in Burns Harbor
Fertility by Age in Burns Harbor
Average fertility rate in Burns Harbor is 87.0 births per 1,000 women. Women in the age bracket of 20 to 34 years have the highest fertility rate with 243.0 births per 1,000 women. Women in the age bracket of 20 to 34 years acount for 67.3% of all women with births.
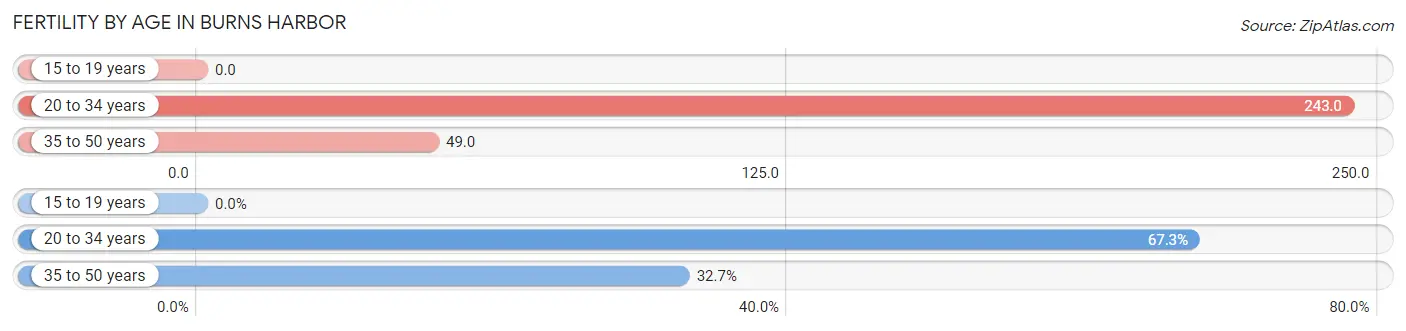
| Age Bracket | Women with Births | Births / 1,000 Women |
| 15 to 19 years | 0 (0.0%) | 0.0 |
| 20 to 34 years | 35 (67.3%) | 243.0 |
| 35 to 50 years | 17 (32.7%) | 49.0 |
| Total | 52 (100.0%) | 87.0 |
Fertility by Age by Marriage Status in Burns Harbor
94.2% of women with births (52) in Burns Harbor are married. The highest percentage of unmarried women with births falls into 20 to 34 years age bracket with 8.6% of them unmarried at the time of birth, while the lowest percentage of unmarried women with births belong to 35 to 50 years age bracket with 0.0% of them unmarried.
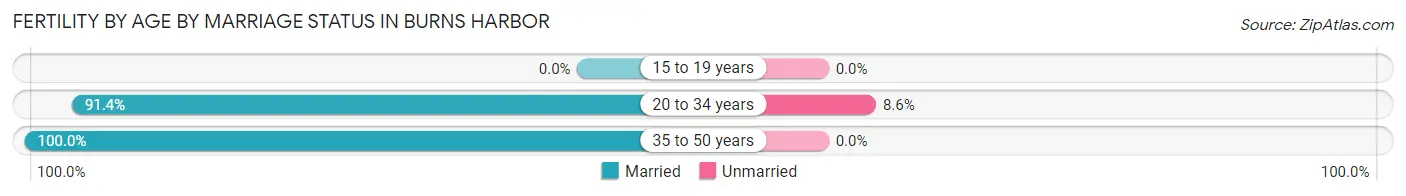
| Age Bracket | Married | Unmarried |
| 15 to 19 years | 0 (0.0%) | 0 (0.0%) |
| 20 to 34 years | 32 (91.4%) | 3 (8.6%) |
| 35 to 50 years | 17 (100.0%) | 0 (0.0%) |
| Total | 49 (94.2%) | 3 (5.8%) |
Fertility by Education in Burns Harbor
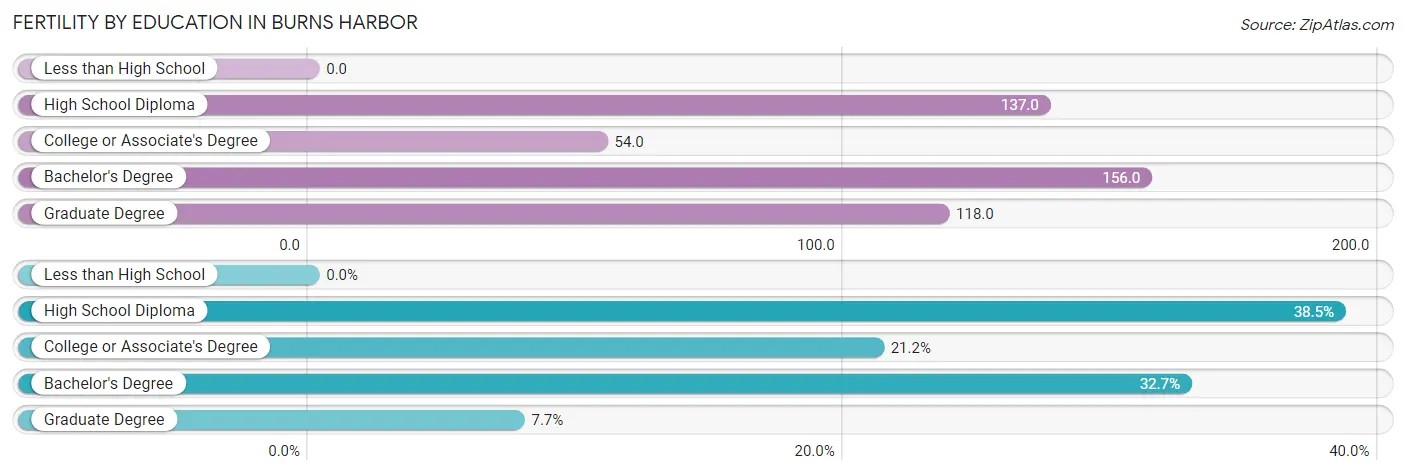
| Educational Attainment | Women with Births | Births / 1,000 Women |
| Less than High School | 0 (0.0%) | 0.0 |
| High School Diploma | 20 (38.5%) | 137.0 |
| College or Associate's Degree | 11 (21.1%) | 54.0 |
| Bachelor's Degree | 17 (32.7%) | 156.0 |
| Graduate Degree | 4 (7.7%) | 118.0 |
| Total | 52 (100.0%) | 87.0 |
Fertility by Education by Marriage Status in Burns Harbor
5.8% of women with births in Burns Harbor are unmarried. Women with the educational attainment of high school diploma are most likely to be married with 100.0% of them married at childbirth, while women with the educational attainment of college or associate's degree are least likely to be married with 27.3% of them unmarried at childbirth.
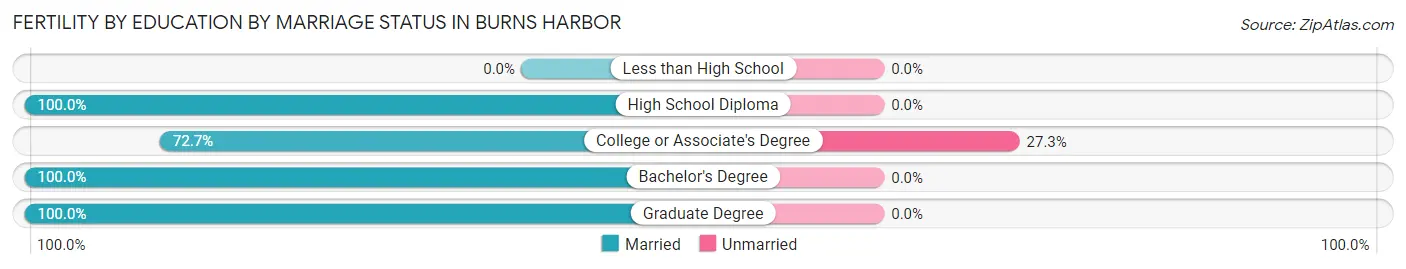
| Educational Attainment | Married | Unmarried |
| Less than High School | 0 (0.0%) | 0 (0.0%) |
| High School Diploma | 20 (100.0%) | 0 (0.0%) |
| College or Associate's Degree | 8 (72.7%) | 3 (27.3%) |
| Bachelor's Degree | 17 (100.0%) | 0 (0.0%) |
| Graduate Degree | 4 (100.0%) | 0 (0.0%) |
| Total | 49 (94.2%) | 3 (5.8%) |
Employment Characteristics in Burns Harbor
Employment by Class of Employer in Burns Harbor
Among the 1,195 employed individuals in Burns Harbor, private company employees (921 | 77.1%), not-for-profit organizations (82 | 6.9%), and local government employees (66 | 5.5%) make up the most common classes of employment.
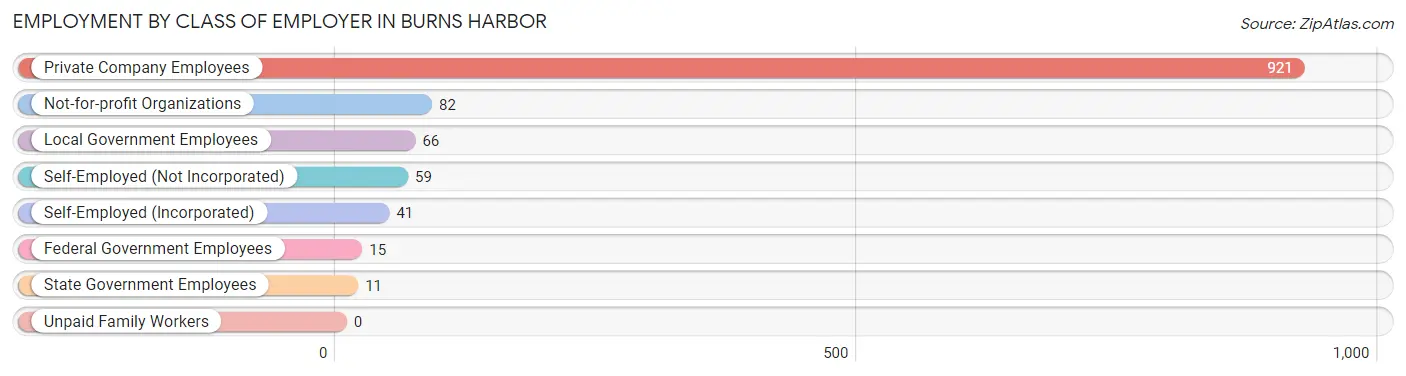
| Employer Class | # Employees | % Employees |
| Private Company Employees | 921 | 77.1% |
| Self-Employed (Incorporated) | 41 | 3.4% |
| Self-Employed (Not Incorporated) | 59 | 4.9% |
| Not-for-profit Organizations | 82 | 6.9% |
| Local Government Employees | 66 | 5.5% |
| State Government Employees | 11 | 0.9% |
| Federal Government Employees | 15 | 1.3% |
| Unpaid Family Workers | 0 | 0.0% |
| Total | 1,195 | 100.0% |
Employment Status by Age in Burns Harbor
According to the labor force statistics for Burns Harbor, out of the total population over 16 years of age (1,725), 73.6% or 1,270 individuals are in the labor force, with 0.7% or 9 of them unemployed. The age group with the highest labor force participation rate is 60 to 64 years, with 91.1% or 92 individuals in the labor force. Within the labor force, the 20 to 24 years age range has the highest percentage of unemployed individuals, with 17.4% or 8 of them being unemployed.
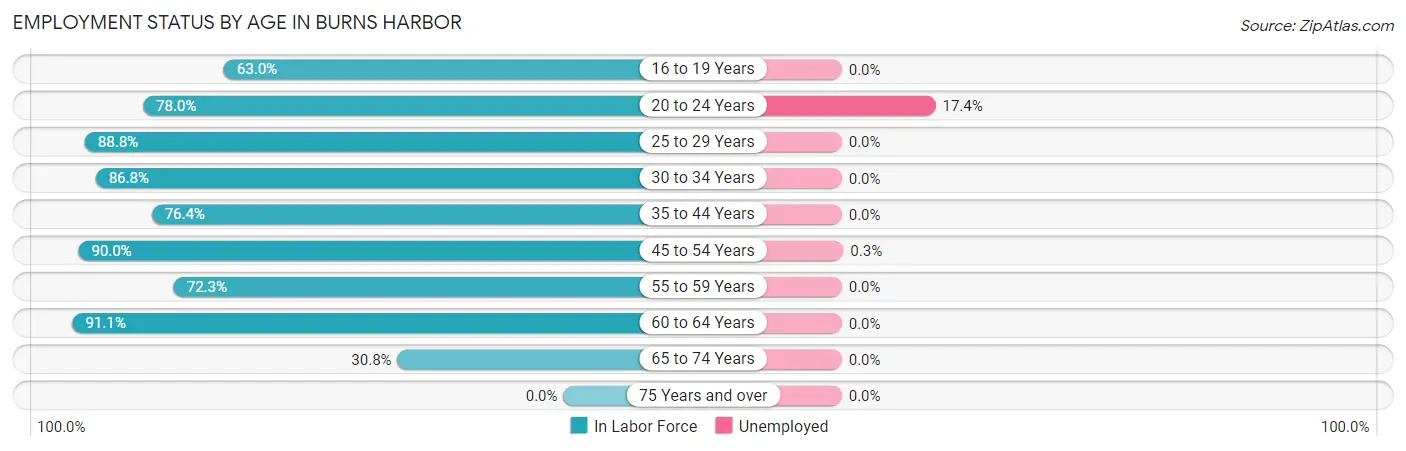
| Age Bracket | In Labor Force | Unemployed |
| 16 to 19 Years | 63 (63.0%) | 0 (0.0%) |
| 20 to 24 Years | 46 (78.0%) | 8 (17.4%) |
| 25 to 29 Years | 79 (88.8%) | 0 (0.0%) |
| 30 to 34 Years | 132 (86.8%) | 0 (0.0%) |
| 35 to 44 Years | 395 (76.4%) | 0 (0.0%) |
| 45 to 54 Years | 342 (90.0%) | 1 (0.3%) |
| 55 to 59 Years | 81 (72.3%) | 0 (0.0%) |
| 60 to 64 Years | 92 (91.1%) | 0 (0.0%) |
| 65 to 74 Years | 40 (30.8%) | 0 (0.0%) |
| 75 Years and over | 0 (0.0%) | 0 (0.0%) |
| Total | 1,270 (73.6%) | 9 (0.7%) |
Employment Status by Educational Attainment in Burns Harbor
According to labor force statistics for Burns Harbor, 83.0% of individuals (1,121) out of the total population between 25 and 64 years of age (1,351) are in the labor force, with 0.1% or 1 of them being unemployed. The group with the highest labor force participation rate are those with the educational attainment of bachelor's degree or higher, with 95.8% or 389 individuals in the labor force. Within the labor force, individuals with high school diploma education have the highest percentage of unemployment, with 0.3% or 1 of them being unemployed.
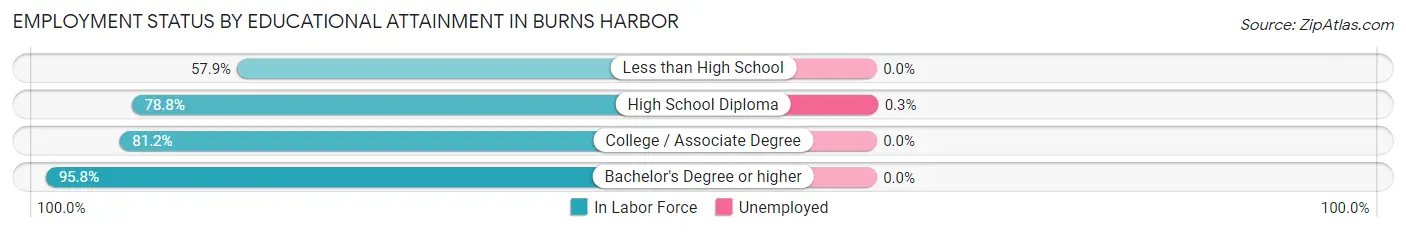
| Educational Attainment | In Labor Force | Unemployed |
| Less than High School | 66 (57.9%) | 0 (0.0%) |
| High School Diploma | 286 (78.8%) | 1 (0.3%) |
| College / Associate Degree | 380 (81.2%) | 0 (0.0%) |
| Bachelor's Degree or higher | 389 (95.8%) | 0 (0.0%) |
| Total | 1,121 (83.0%) | 1 (0.1%) |
Employment Occupations by Sex in Burns Harbor
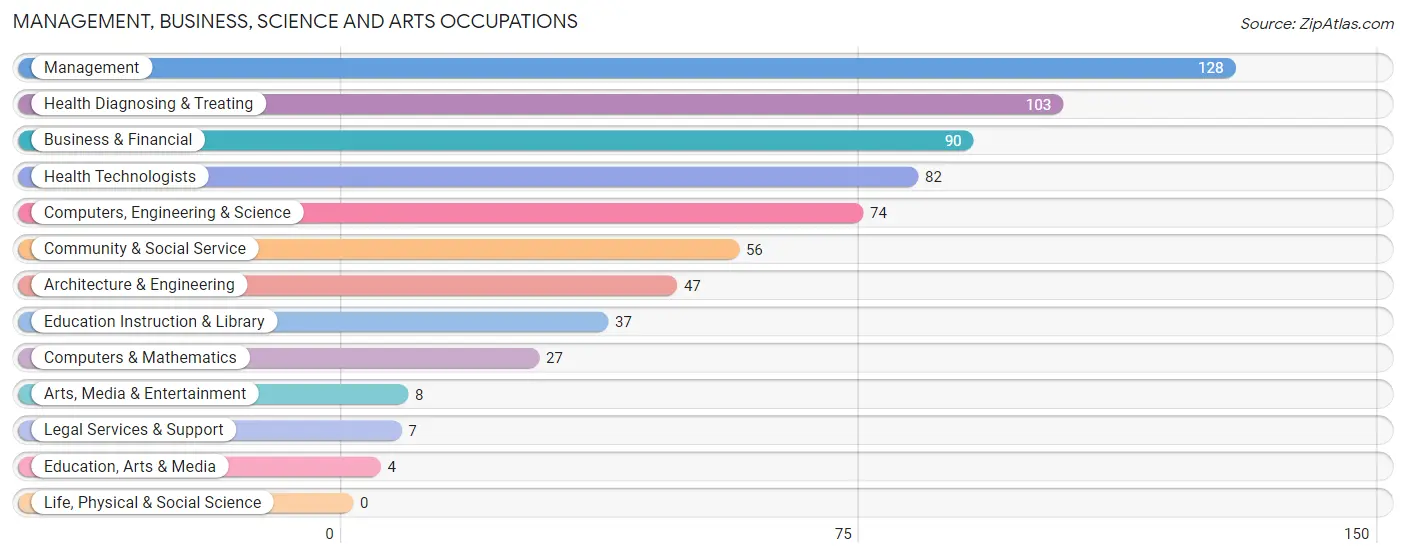
Management, Business, Science and Arts Occupations
The most common Management, Business, Science and Arts occupations in Burns Harbor are Management (128 | 10.3%), Health Diagnosing & Treating (103 | 8.3%), Business & Financial (90 | 7.2%), Health Technologists (82 | 6.6%), and Computers, Engineering & Science (74 | 5.9%).
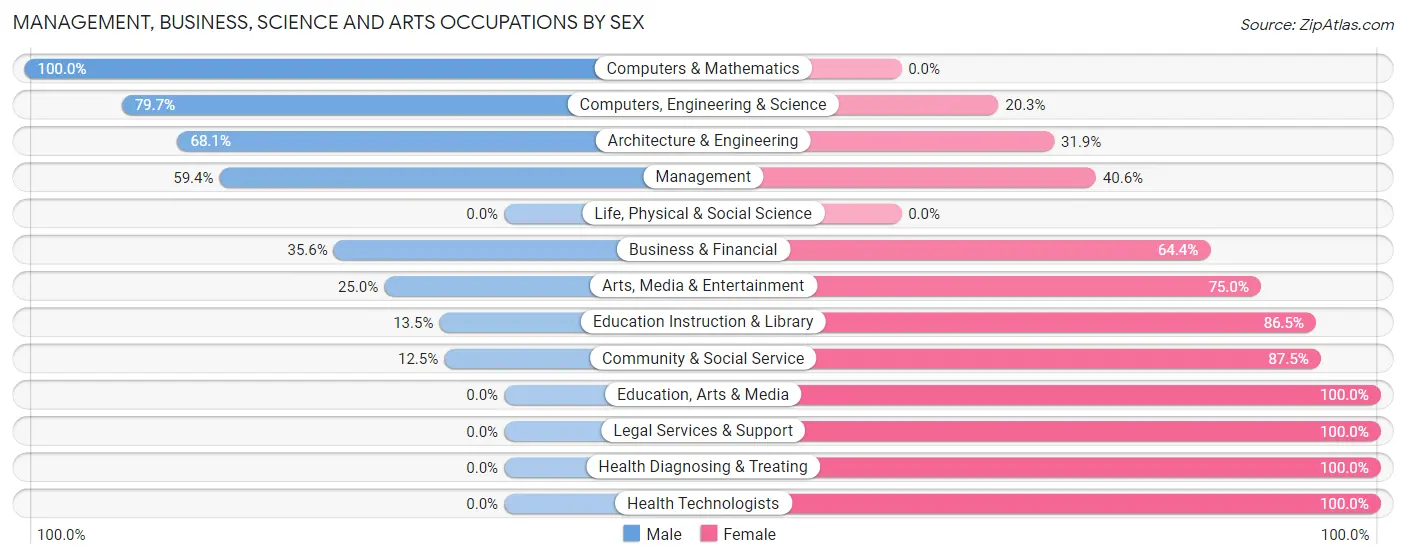
Management, Business, Science and Arts Occupations by Sex
Within the Management, Business, Science and Arts occupations in Burns Harbor, the most male-oriented occupations are Computers & Mathematics (100.0%), Computers, Engineering & Science (79.7%), and Architecture & Engineering (68.1%), while the most female-oriented occupations are Education, Arts & Media (100.0%), Legal Services & Support (100.0%), and Health Diagnosing & Treating (100.0%).
| Occupation | Male | Female |
| Management | 76 (59.4%) | 52 (40.6%) |
| Business & Financial | 32 (35.6%) | 58 (64.4%) |
| Computers, Engineering & Science | 59 (79.7%) | 15 (20.3%) |
| Computers & Mathematics | 27 (100.0%) | 0 (0.0%) |
| Architecture & Engineering | 32 (68.1%) | 15 (31.9%) |
| Life, Physical & Social Science | 0 (0.0%) | 0 (0.0%) |
| Community & Social Service | 7 (12.5%) | 49 (87.5%) |
| Education, Arts & Media | 0 (0.0%) | 4 (100.0%) |
| Legal Services & Support | 0 (0.0%) | 7 (100.0%) |
| Education Instruction & Library | 5 (13.5%) | 32 (86.5%) |
| Arts, Media & Entertainment | 2 (25.0%) | 6 (75.0%) |
| Health Diagnosing & Treating | 0 (0.0%) | 103 (100.0%) |
| Health Technologists | 0 (0.0%) | 82 (100.0%) |
| Total (Category) | 174 (38.6%) | 277 (61.4%) |
| Total (Overall) | 706 (56.7%) | 540 (43.3%) |
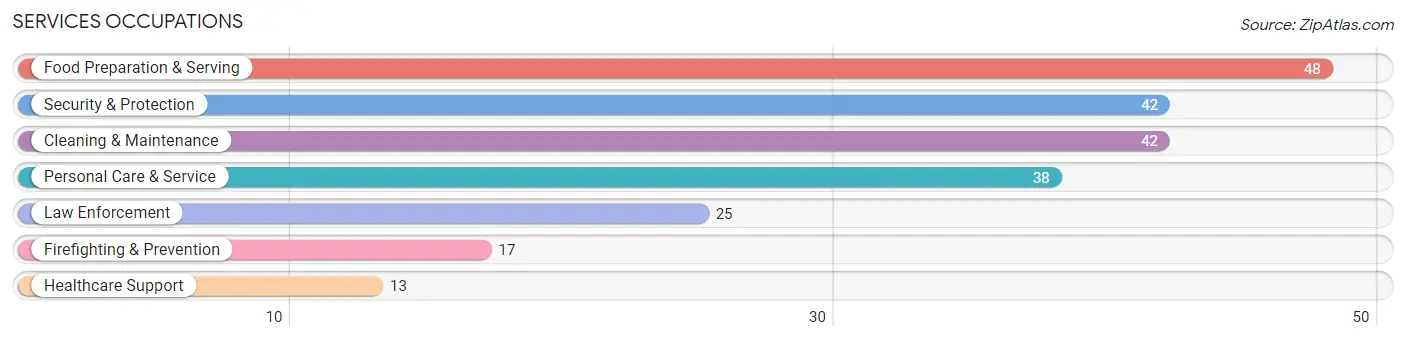
Services Occupations
The most common Services occupations in Burns Harbor are Food Preparation & Serving (48 | 3.8%), Security & Protection (42 | 3.4%), Cleaning & Maintenance (42 | 3.4%), Personal Care & Service (38 | 3.0%), and Law Enforcement (25 | 2.0%).
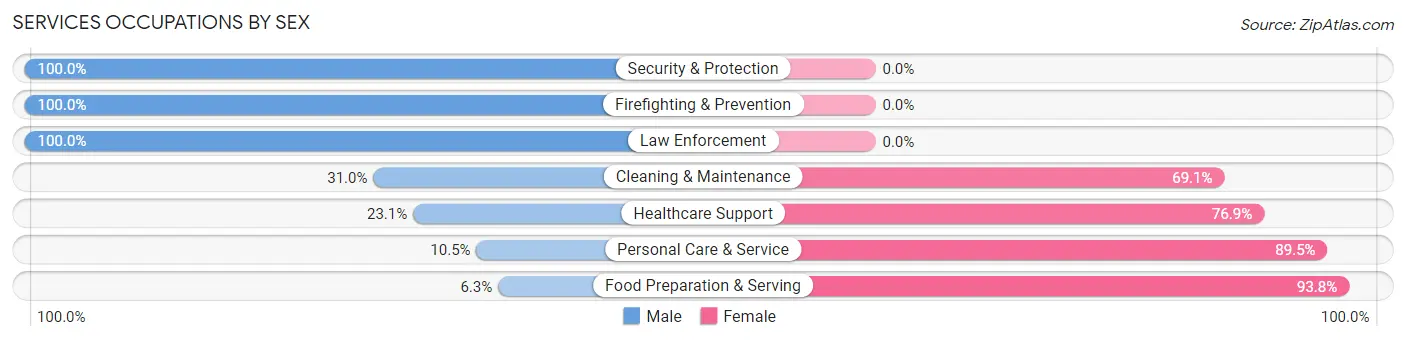
Services Occupations by Sex
Within the Services occupations in Burns Harbor, the most male-oriented occupations are Security & Protection (100.0%), Firefighting & Prevention (100.0%), and Law Enforcement (100.0%), while the most female-oriented occupations are Food Preparation & Serving (93.8%), Personal Care & Service (89.5%), and Healthcare Support (76.9%).
| Occupation | Male | Female |
| Healthcare Support | 3 (23.1%) | 10 (76.9%) |
| Security & Protection | 42 (100.0%) | 0 (0.0%) |
| Firefighting & Prevention | 17 (100.0%) | 0 (0.0%) |
| Law Enforcement | 25 (100.0%) | 0 (0.0%) |
| Food Preparation & Serving | 3 (6.2%) | 45 (93.8%) |
| Cleaning & Maintenance | 13 (30.9%) | 29 (69.1%) |
| Personal Care & Service | 4 (10.5%) | 34 (89.5%) |
| Total (Category) | 65 (35.5%) | 118 (64.5%) |
| Total (Overall) | 706 (56.7%) | 540 (43.3%) |
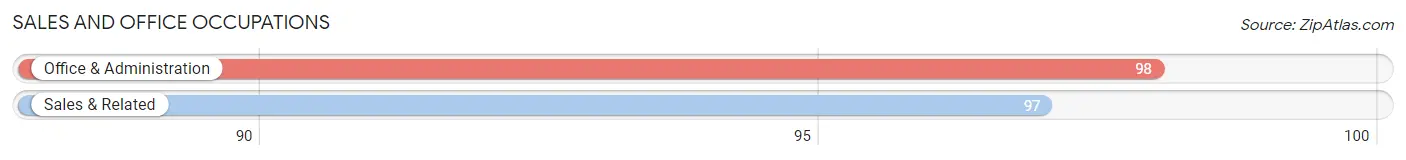
Sales and Office Occupations
The most common Sales and Office occupations in Burns Harbor are Office & Administration (98 | 7.9%), and Sales & Related (97 | 7.8%).
Sales and Office Occupations by Sex
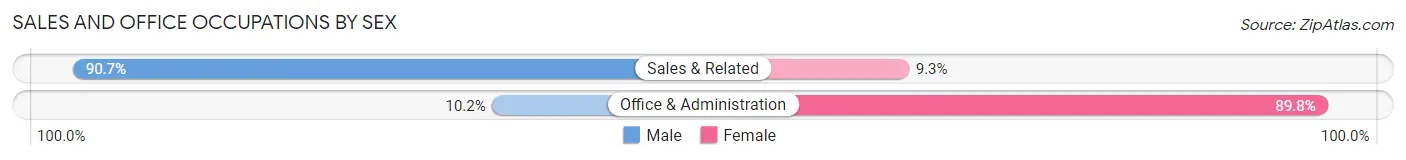
| Occupation | Male | Female |
| Sales & Related | 88 (90.7%) | 9 (9.3%) |
| Office & Administration | 10 (10.2%) | 88 (89.8%) |
| Total (Category) | 98 (50.3%) | 97 (49.7%) |
| Total (Overall) | 706 (56.7%) | 540 (43.3%) |
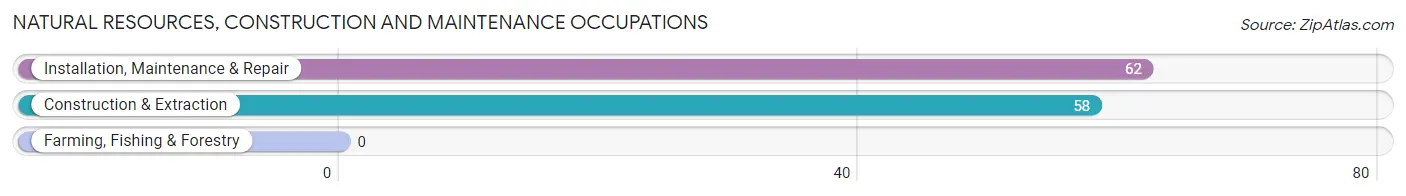
Natural Resources, Construction and Maintenance Occupations
The most common Natural Resources, Construction and Maintenance occupations in Burns Harbor are Installation, Maintenance & Repair (62 | 5.0%), and Construction & Extraction (58 | 4.6%).
Natural Resources, Construction and Maintenance Occupations by Sex
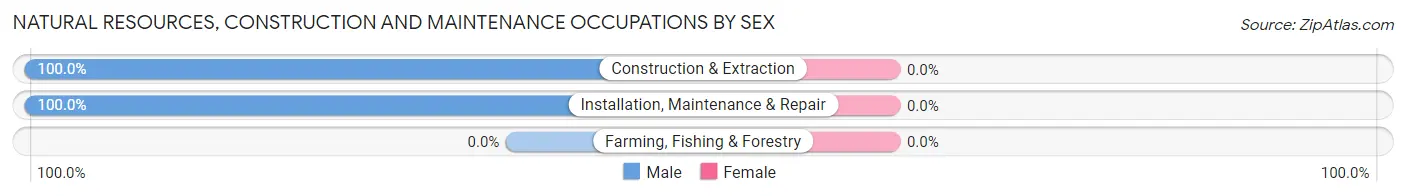
| Occupation | Male | Female |
| Farming, Fishing & Forestry | 0 (0.0%) | 0 (0.0%) |
| Construction & Extraction | 58 (100.0%) | 0 (0.0%) |
| Installation, Maintenance & Repair | 62 (100.0%) | 0 (0.0%) |
| Total (Category) | 120 (100.0%) | 0 (0.0%) |
| Total (Overall) | 706 (56.7%) | 540 (43.3%) |
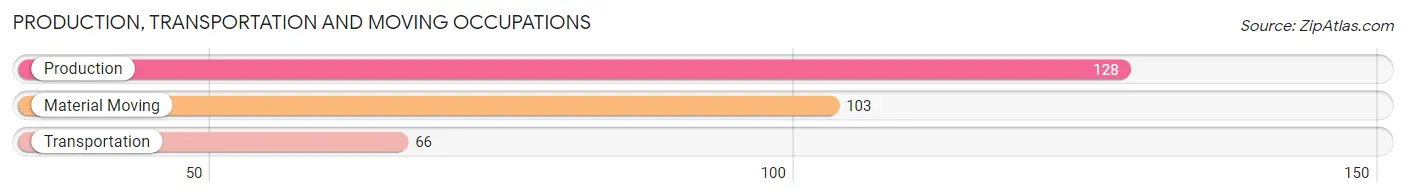
Production, Transportation and Moving Occupations
The most common Production, Transportation and Moving occupations in Burns Harbor are Production (128 | 10.3%), Material Moving (103 | 8.3%), and Transportation (66 | 5.3%).
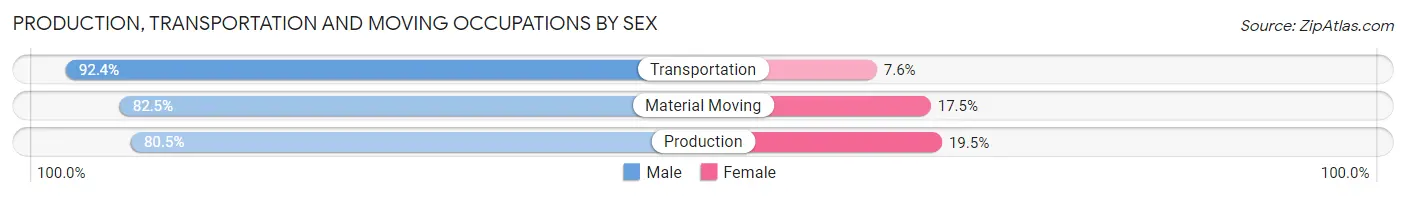
Production, Transportation and Moving Occupations by Sex
| Occupation | Male | Female |
| Production | 103 (80.5%) | 25 (19.5%) |
| Transportation | 61 (92.4%) | 5 (7.6%) |
| Material Moving | 85 (82.5%) | 18 (17.5%) |
| Total (Category) | 249 (83.8%) | 48 (16.2%) |
| Total (Overall) | 706 (56.7%) | 540 (43.3%) |
Employment Industries by Sex in Burns Harbor
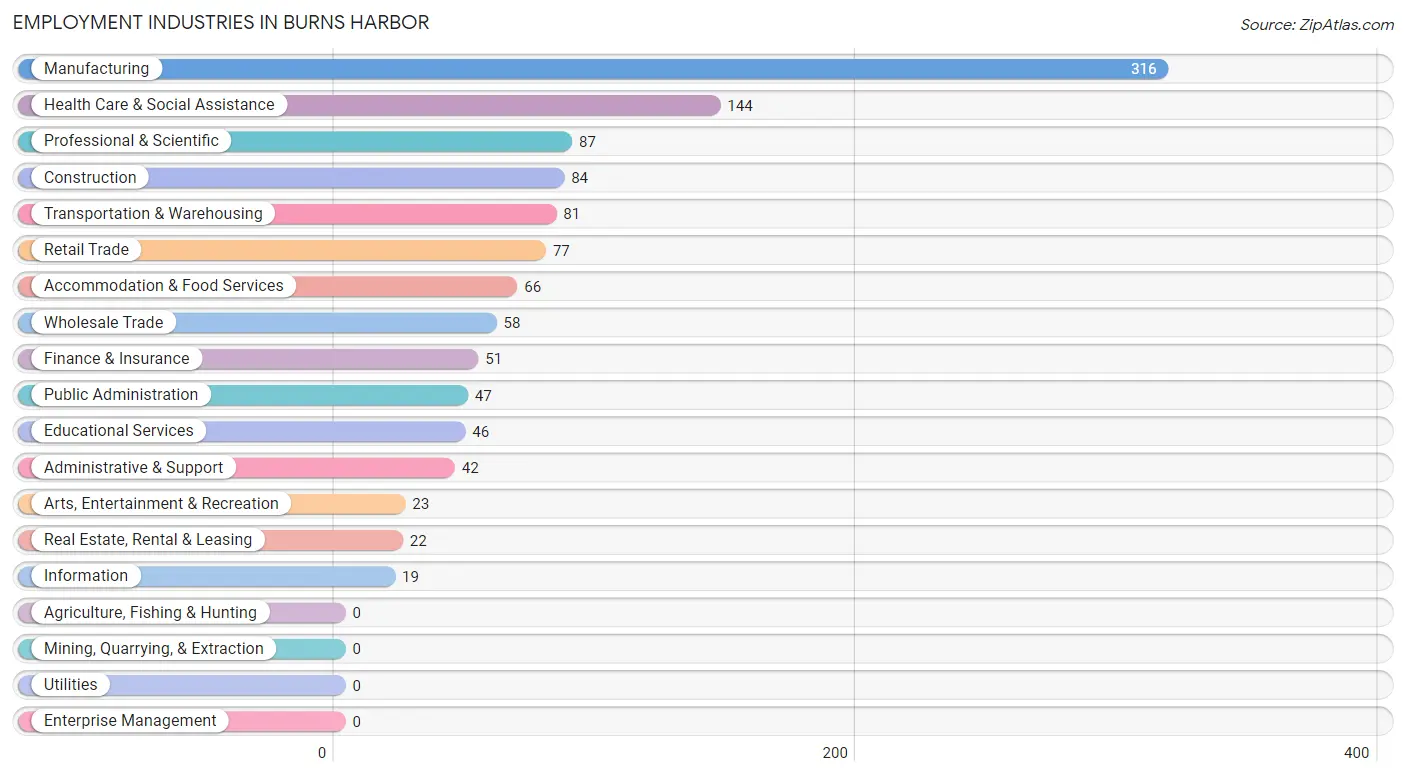
Employment Industries in Burns Harbor
The major employment industries in Burns Harbor include Manufacturing (316 | 25.4%), Health Care & Social Assistance (144 | 11.6%), Professional & Scientific (87 | 7.0%), Construction (84 | 6.7%), and Transportation & Warehousing (81 | 6.5%).
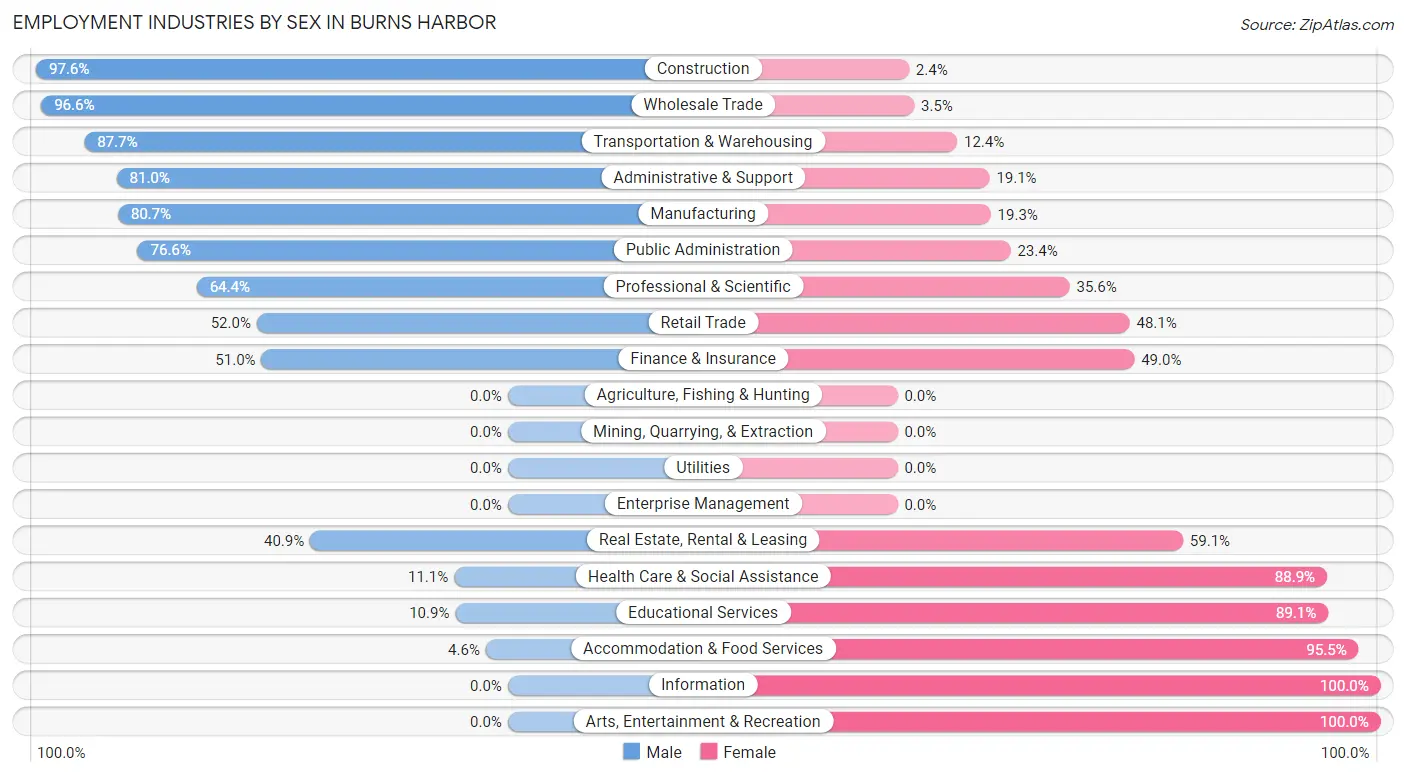
Employment Industries by Sex in Burns Harbor
The Burns Harbor industries that see more men than women are Construction (97.6%), Wholesale Trade (96.6%), and Transportation & Warehousing (87.6%), whereas the industries that tend to have a higher number of women are Information (100.0%), Arts, Entertainment & Recreation (100.0%), and Accommodation & Food Services (95.5%).
| Industry | Male | Female |
| Agriculture, Fishing & Hunting | 0 (0.0%) | 0 (0.0%) |
| Mining, Quarrying, & Extraction | 0 (0.0%) | 0 (0.0%) |
| Construction | 82 (97.6%) | 2 (2.4%) |
| Manufacturing | 255 (80.7%) | 61 (19.3%) |
| Wholesale Trade | 56 (96.6%) | 2 (3.5%) |
| Retail Trade | 40 (51.9%) | 37 (48.0%) |
| Transportation & Warehousing | 71 (87.6%) | 10 (12.3%) |
| Utilities | 0 (0.0%) | 0 (0.0%) |
| Information | 0 (0.0%) | 19 (100.0%) |
| Finance & Insurance | 26 (51.0%) | 25 (49.0%) |
| Real Estate, Rental & Leasing | 9 (40.9%) | 13 (59.1%) |
| Professional & Scientific | 56 (64.4%) | 31 (35.6%) |
| Enterprise Management | 0 (0.0%) | 0 (0.0%) |
| Administrative & Support | 34 (80.9%) | 8 (19.1%) |
| Educational Services | 5 (10.9%) | 41 (89.1%) |
| Health Care & Social Assistance | 16 (11.1%) | 128 (88.9%) |
| Arts, Entertainment & Recreation | 0 (0.0%) | 23 (100.0%) |
| Accommodation & Food Services | 3 (4.5%) | 63 (95.5%) |
| Public Administration | 36 (76.6%) | 11 (23.4%) |
| Total | 706 (56.7%) | 540 (43.3%) |
Education in Burns Harbor
School Enrollment in Burns Harbor
The most common levels of schooling among the 584 students in Burns Harbor are middle school (153 | 26.2%), elementary school (120 | 20.5%), and high school (120 | 20.5%).
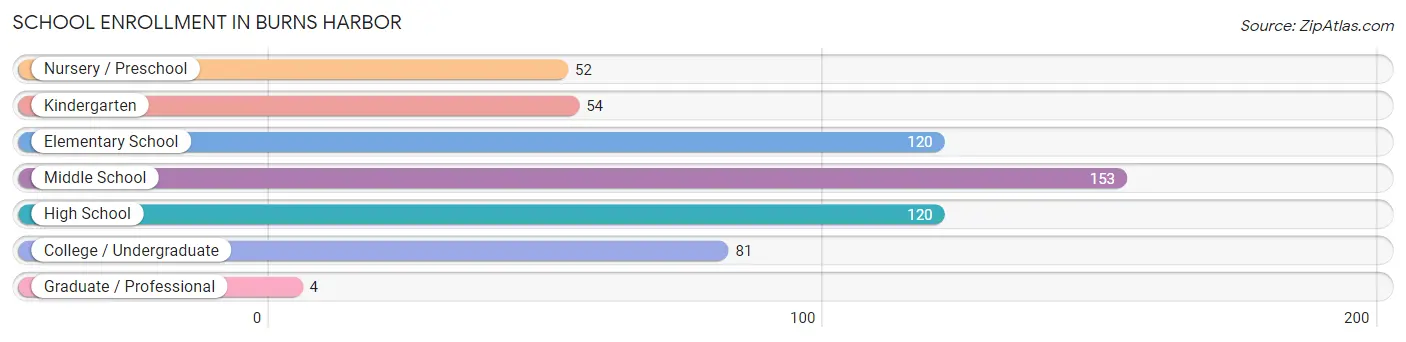
| School Level | # Students | % Students |
| Nursery / Preschool | 52 | 8.9% |
| Kindergarten | 54 | 9.2% |
| Elementary School | 120 | 20.5% |
| Middle School | 153 | 26.2% |
| High School | 120 | 20.5% |
| College / Undergraduate | 81 | 13.9% |
| Graduate / Professional | 4 | 0.7% |
| Total | 584 | 100.0% |
School Enrollment by Age by Funding Source in Burns Harbor
Out of a total of 584 students who are enrolled in schools in Burns Harbor, 80 (13.7%) attend a private institution, while the remaining 504 (86.3%) are enrolled in public schools. The age group of 3 to 4 year olds has the highest likelihood of being enrolled in private schools, with 21 (75.0% in the age bracket) enrolled. Conversely, the age group of 20 to 24 year olds has the lowest likelihood of being enrolled in a private school, with 9 (100.0% in the age bracket) attending a public institution.
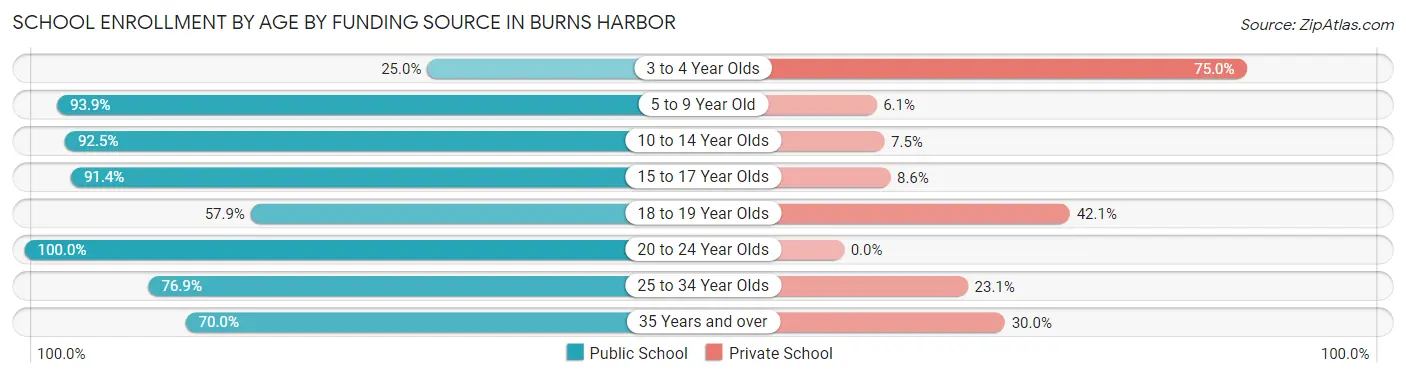
| Age Bracket | Public School | Private School |
| 3 to 4 Year Olds | 7 (25.0%) | 21 (75.0%) |
| 5 to 9 Year Old | 186 (93.9%) | 12 (6.1%) |
| 10 to 14 Year Olds | 172 (92.5%) | 14 (7.5%) |
| 15 to 17 Year Olds | 74 (91.4%) | 7 (8.6%) |
| 18 to 19 Year Olds | 11 (57.9%) | 8 (42.1%) |
| 20 to 24 Year Olds | 9 (100.0%) | 0 (0.0%) |
| 25 to 34 Year Olds | 10 (76.9%) | 3 (23.1%) |
| 35 Years and over | 35 (70.0%) | 15 (30.0%) |
| Total | 504 (86.3%) | 80 (13.7%) |
Educational Attainment by Field of Study in Burns Harbor
Business (139 | 29.8%), engineering (68 | 14.6%), education (66 | 14.2%), science & technology (60 | 12.9%), and bio, nature & agricultural (39 | 8.4%) are the most common fields of study among 466 individuals in Burns Harbor who have obtained a bachelor's degree or higher.
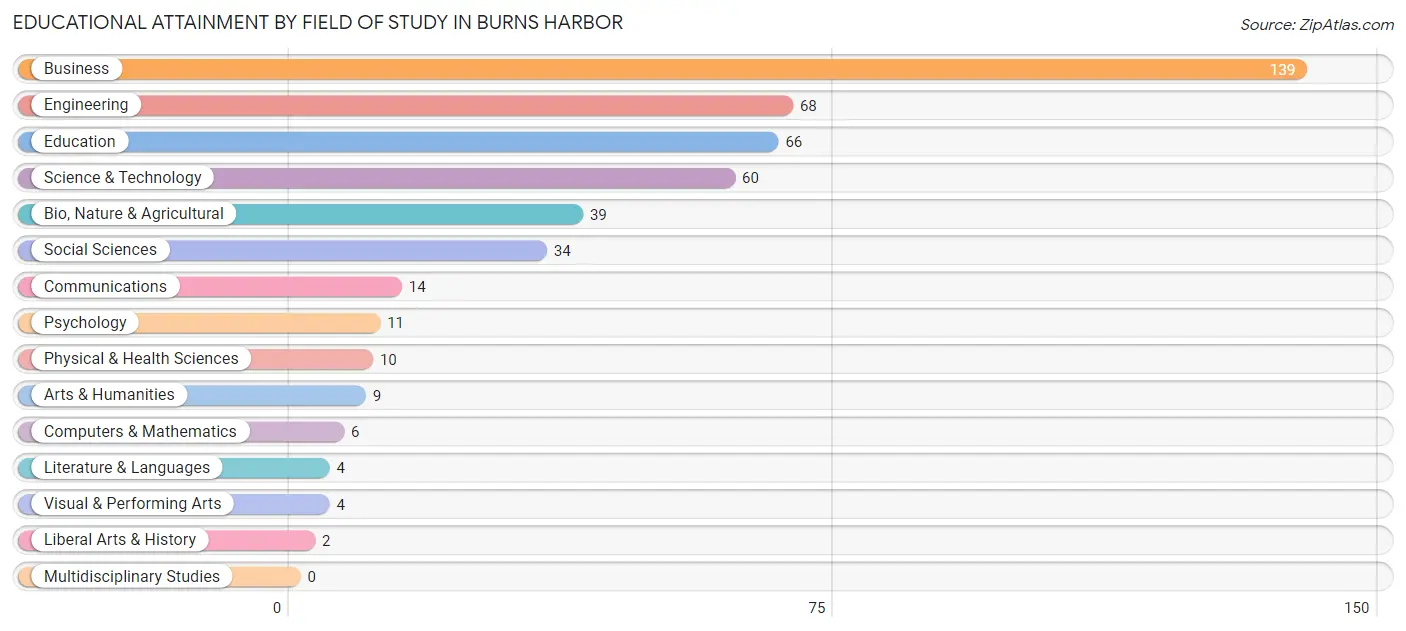
| Field of Study | # Graduates | % Graduates |
| Computers & Mathematics | 6 | 1.3% |
| Bio, Nature & Agricultural | 39 | 8.4% |
| Physical & Health Sciences | 10 | 2.1% |
| Psychology | 11 | 2.4% |
| Social Sciences | 34 | 7.3% |
| Engineering | 68 | 14.6% |
| Multidisciplinary Studies | 0 | 0.0% |
| Science & Technology | 60 | 12.9% |
| Business | 139 | 29.8% |
| Education | 66 | 14.2% |
| Literature & Languages | 4 | 0.9% |
| Liberal Arts & History | 2 | 0.4% |
| Visual & Performing Arts | 4 | 0.9% |
| Communications | 14 | 3.0% |
| Arts & Humanities | 9 | 1.9% |
| Total | 466 | 100.0% |
Transportation & Commute in Burns Harbor
Vehicle Availability by Sex in Burns Harbor
The most prevalent vehicle ownership categories in Burns Harbor are males with 2 vehicles (340, accounting for 51.1%) and females with 2 vehicles (273, making up 64.1%).
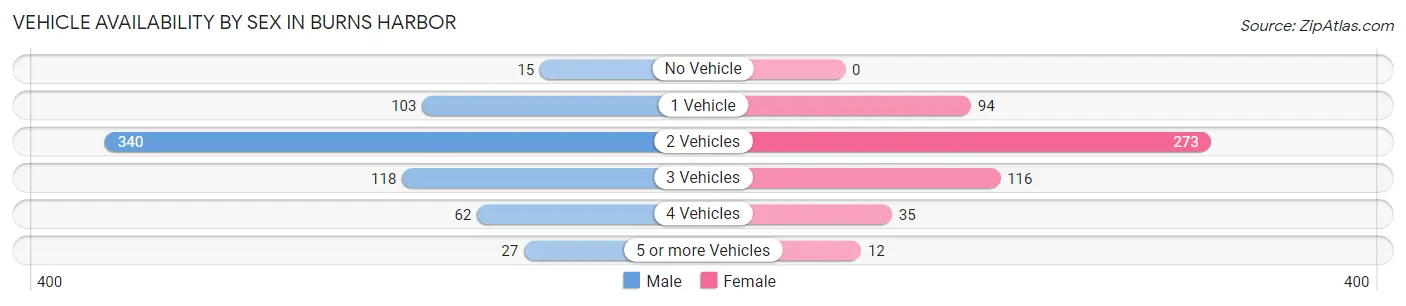
| Vehicles Available | Male | Female |
| No Vehicle | 15 (2.3%) | 0 (0.0%) |
| 1 Vehicle | 103 (15.5%) | 94 (17.7%) |
| 2 Vehicles | 340 (51.1%) | 273 (51.5%) |
| 3 Vehicles | 118 (17.7%) | 116 (21.9%) |
| 4 Vehicles | 62 (9.3%) | 35 (6.6%) |
| 5 or more Vehicles | 27 (4.1%) | 12 (2.3%) |
| Total | 665 (100.0%) | 530 (100.0%) |
Commute Time in Burns Harbor
The most frequently occuring commute durations in Burns Harbor are 30 to 34 minutes (208 commuters, 18.1%), 10 to 14 minutes (202 commuters, 17.5%), and 20 to 24 minutes (166 commuters, 14.4%).
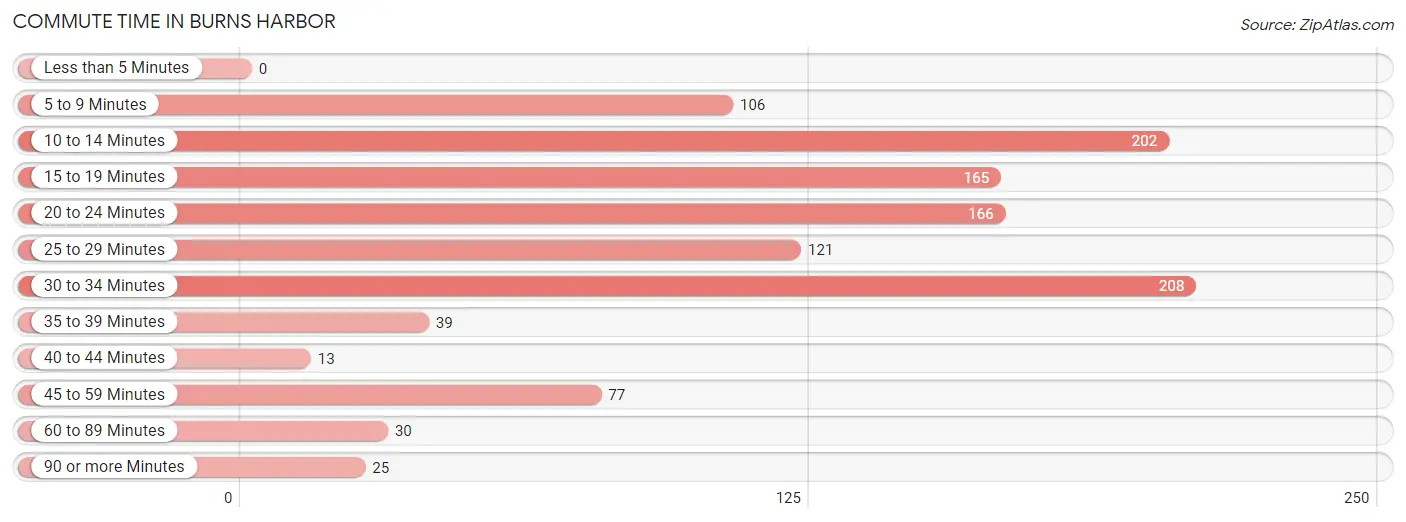
| Commute Time | # Commuters | % Commuters |
| Less than 5 Minutes | 0 | 0.0% |
| 5 to 9 Minutes | 106 | 9.2% |
| 10 to 14 Minutes | 202 | 17.5% |
| 15 to 19 Minutes | 165 | 14.3% |
| 20 to 24 Minutes | 166 | 14.4% |
| 25 to 29 Minutes | 121 | 10.5% |
| 30 to 34 Minutes | 208 | 18.1% |
| 35 to 39 Minutes | 39 | 3.4% |
| 40 to 44 Minutes | 13 | 1.1% |
| 45 to 59 Minutes | 77 | 6.7% |
| 60 to 89 Minutes | 30 | 2.6% |
| 90 or more Minutes | 25 | 2.2% |
Commute Time by Sex in Burns Harbor
The most common commute times in Burns Harbor are 30 to 34 minutes (118 commuters, 18.3%) for males and 10 to 14 minutes (100 commuters, 19.7%) for females.
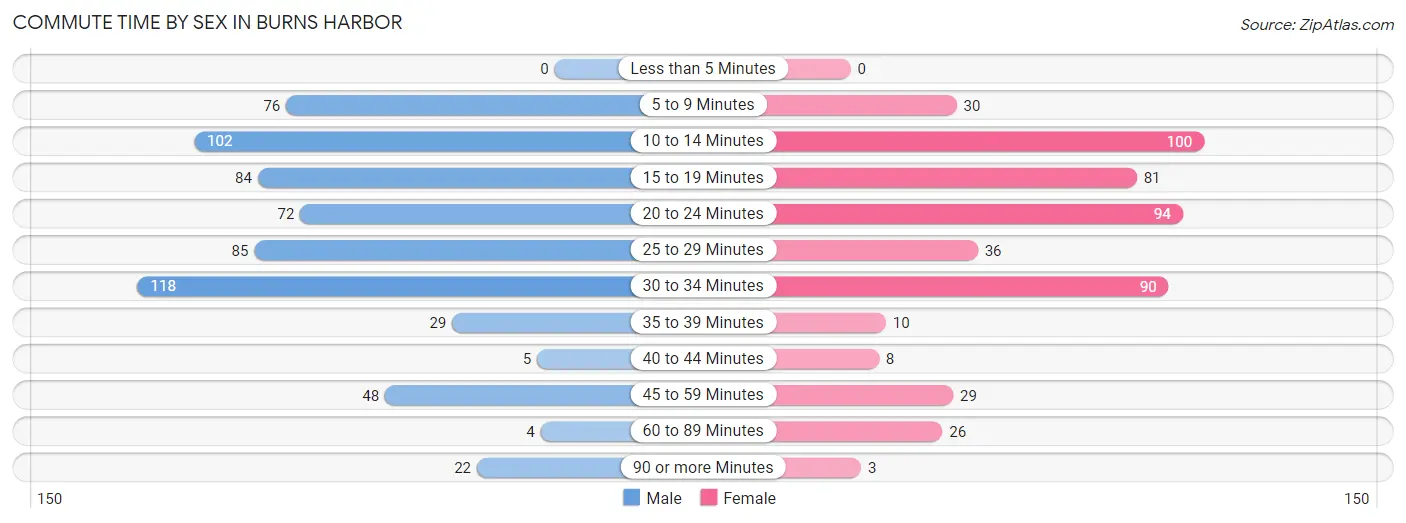
| Commute Time | Male | Female |
| Less than 5 Minutes | 0 (0.0%) | 0 (0.0%) |
| 5 to 9 Minutes | 76 (11.8%) | 30 (5.9%) |
| 10 to 14 Minutes | 102 (15.8%) | 100 (19.7%) |
| 15 to 19 Minutes | 84 (13.0%) | 81 (16.0%) |
| 20 to 24 Minutes | 72 (11.2%) | 94 (18.5%) |
| 25 to 29 Minutes | 85 (13.2%) | 36 (7.1%) |
| 30 to 34 Minutes | 118 (18.3%) | 90 (17.7%) |
| 35 to 39 Minutes | 29 (4.5%) | 10 (2.0%) |
| 40 to 44 Minutes | 5 (0.8%) | 8 (1.6%) |
| 45 to 59 Minutes | 48 (7.4%) | 29 (5.7%) |
| 60 to 89 Minutes | 4 (0.6%) | 26 (5.1%) |
| 90 or more Minutes | 22 (3.4%) | 3 (0.6%) |
Time of Departure to Work by Sex in Burns Harbor
The most frequent times of departure to work in Burns Harbor are 6:00 AM to 6:29 AM (99, 15.3%) for males and 7:00 AM to 7:29 AM (105, 20.7%) for females.
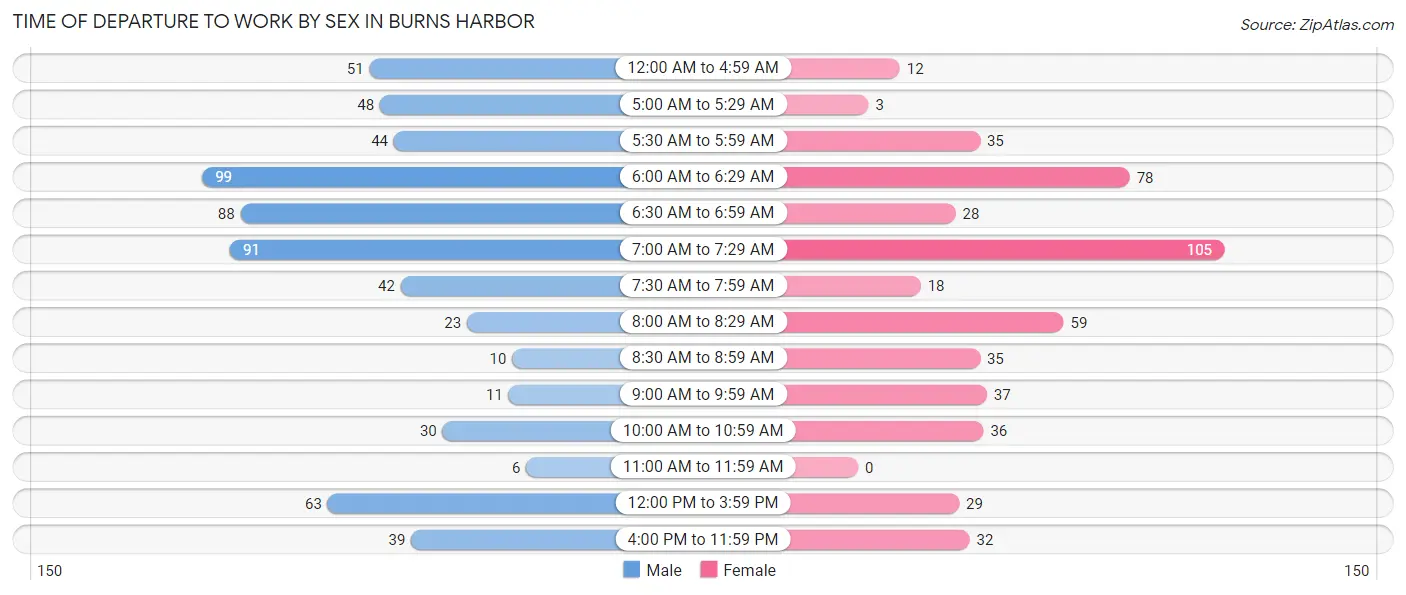
| Time of Departure | Male | Female |
| 12:00 AM to 4:59 AM | 51 (7.9%) | 12 (2.4%) |
| 5:00 AM to 5:29 AM | 48 (7.4%) | 3 (0.6%) |
| 5:30 AM to 5:59 AM | 44 (6.8%) | 35 (6.9%) |
| 6:00 AM to 6:29 AM | 99 (15.3%) | 78 (15.4%) |
| 6:30 AM to 6:59 AM | 88 (13.6%) | 28 (5.5%) |
| 7:00 AM to 7:29 AM | 91 (14.1%) | 105 (20.7%) |
| 7:30 AM to 7:59 AM | 42 (6.5%) | 18 (3.5%) |
| 8:00 AM to 8:29 AM | 23 (3.6%) | 59 (11.6%) |
| 8:30 AM to 8:59 AM | 10 (1.5%) | 35 (6.9%) |
| 9:00 AM to 9:59 AM | 11 (1.7%) | 37 (7.3%) |
| 10:00 AM to 10:59 AM | 30 (4.6%) | 36 (7.1%) |
| 11:00 AM to 11:59 AM | 6 (0.9%) | 0 (0.0%) |
| 12:00 PM to 3:59 PM | 63 (9.8%) | 29 (5.7%) |
| 4:00 PM to 11:59 PM | 39 (6.0%) | 32 (6.3%) |
| Total | 645 (100.0%) | 507 (100.0%) |
Housing Occupancy in Burns Harbor
Occupancy by Ownership in Burns Harbor
Of the total 945 dwellings in Burns Harbor, owner-occupied units account for 669 (70.8%), while renter-occupied units make up 276 (29.2%).
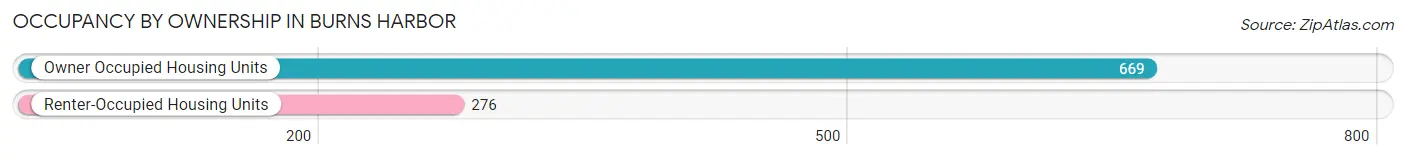
| Occupancy | # Housing Units | % Housing Units |
| Owner Occupied Housing Units | 669 | 70.8% |
| Renter-Occupied Housing Units | 276 | 29.2% |
| Total Occupied Housing Units | 945 | 100.0% |
Occupancy by Household Size in Burns Harbor
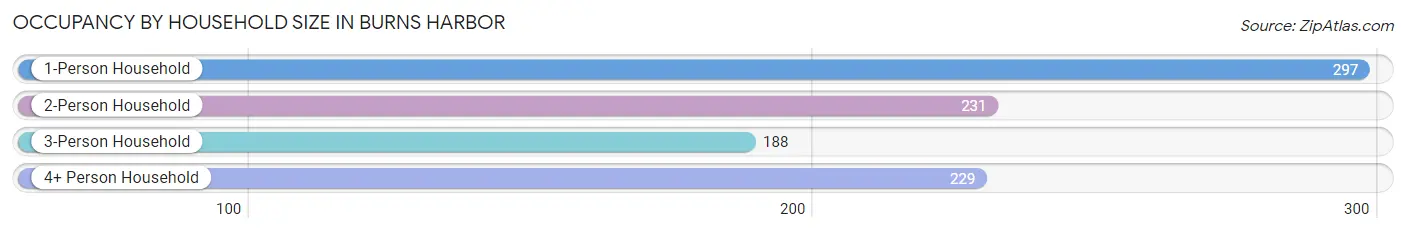
| Household Size | # Housing Units | % Housing Units |
| 1-Person Household | 297 | 31.4% |
| 2-Person Household | 231 | 24.4% |
| 3-Person Household | 188 | 19.9% |
| 4+ Person Household | 229 | 24.2% |
| Total Housing Units | 945 | 100.0% |
Occupancy by Ownership by Household Size in Burns Harbor
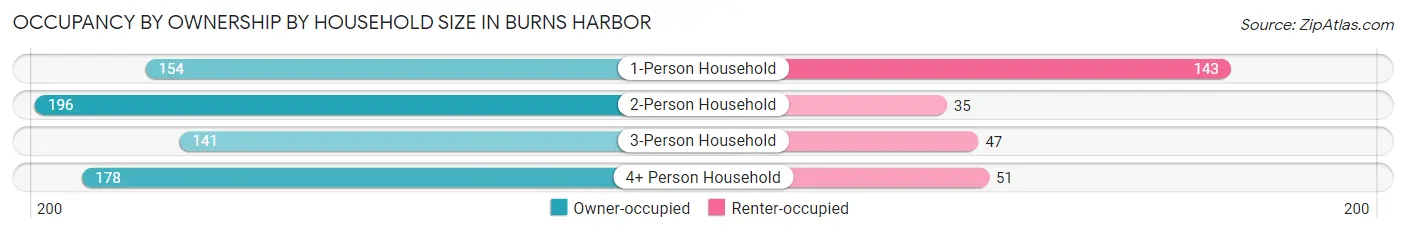
| Household Size | Owner-occupied | Renter-occupied |
| 1-Person Household | 154 (51.8%) | 143 (48.1%) |
| 2-Person Household | 196 (84.9%) | 35 (15.1%) |
| 3-Person Household | 141 (75.0%) | 47 (25.0%) |
| 4+ Person Household | 178 (77.7%) | 51 (22.3%) |
| Total Housing Units | 669 (70.8%) | 276 (29.2%) |
Occupancy by Educational Attainment in Burns Harbor
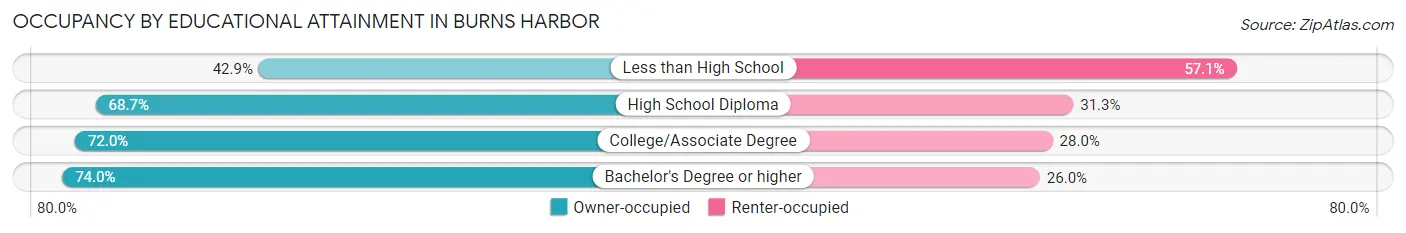
| Household Size | Owner-occupied | Renter-occupied |
| Less than High School | 12 (42.9%) | 16 (57.1%) |
| High School Diploma | 200 (68.7%) | 91 (31.3%) |
| College/Associate Degree | 229 (72.0%) | 89 (28.0%) |
| Bachelor's Degree or higher | 228 (74.0%) | 80 (26.0%) |
Occupancy by Age of Householder in Burns Harbor
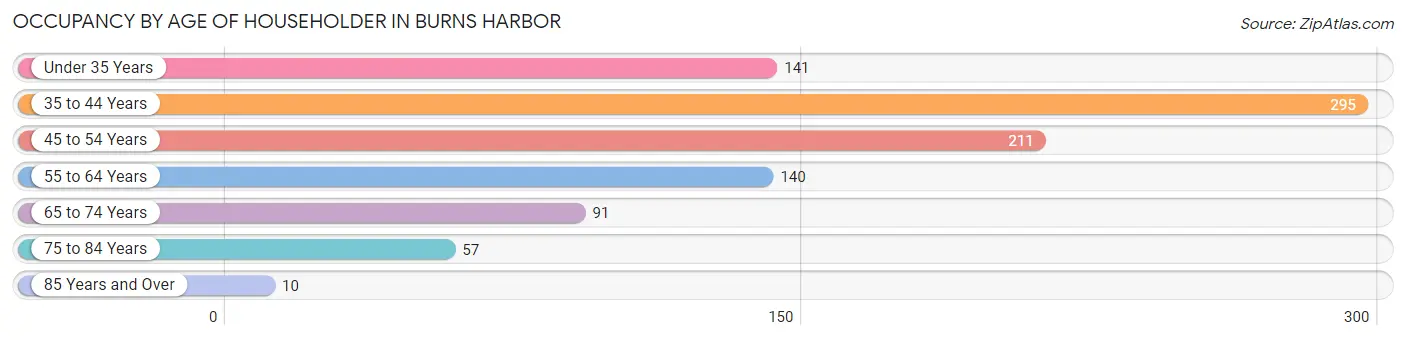
| Age Bracket | # Households | % Households |
| Under 35 Years | 141 | 14.9% |
| 35 to 44 Years | 295 | 31.2% |
| 45 to 54 Years | 211 | 22.3% |
| 55 to 64 Years | 140 | 14.8% |
| 65 to 74 Years | 91 | 9.6% |
| 75 to 84 Years | 57 | 6.0% |
| 85 Years and Over | 10 | 1.1% |
| Total | 945 | 100.0% |
Housing Finances in Burns Harbor
Median Income by Occupancy in Burns Harbor
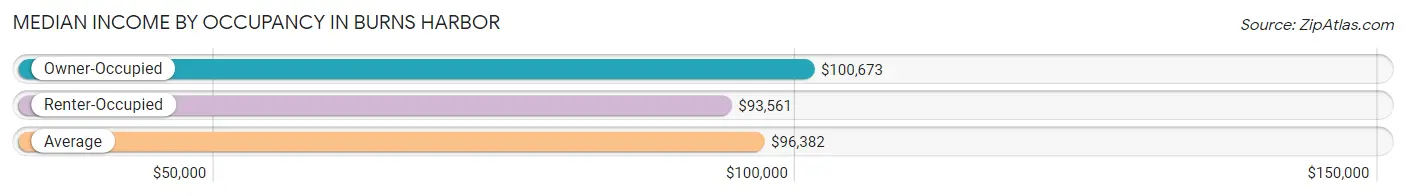
| Occupancy Type | # Households | Median Income |
| Owner-Occupied | 669 (70.8%) | $100,673 |
| Renter-Occupied | 276 (29.2%) | $93,561 |
| Average | 945 (100.0%) | $96,382 |
Occupancy by Householder Income Bracket in Burns Harbor
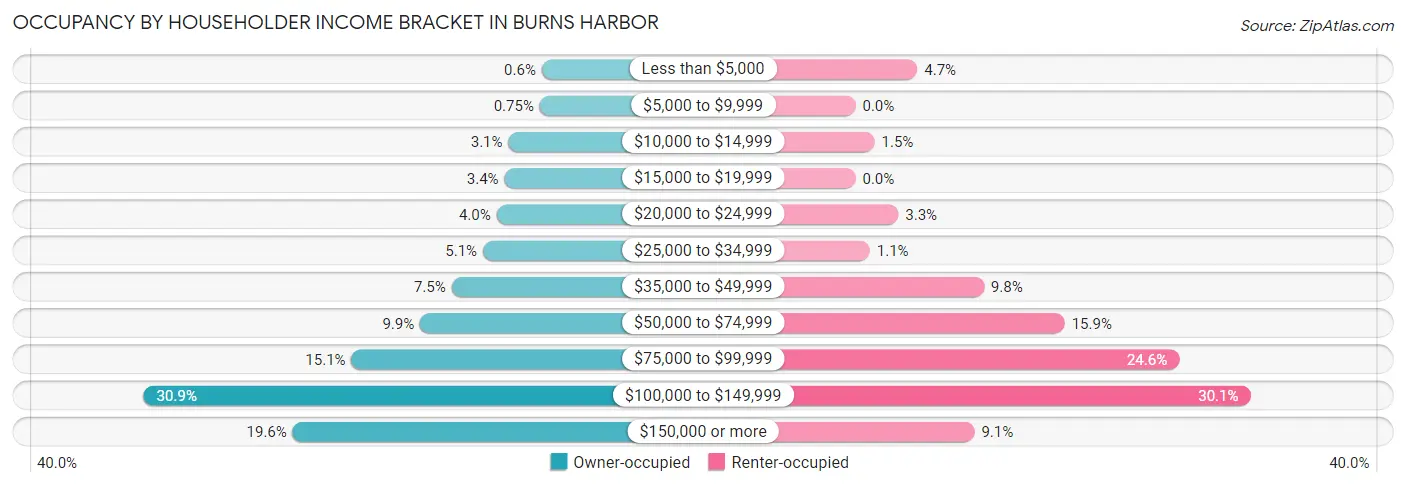
| Income Bracket | Owner-occupied | Renter-occupied |
| Less than $5,000 | 4 (0.6%) | 13 (4.7%) |
| $5,000 to $9,999 | 5 (0.7%) | 0 (0.0%) |
| $10,000 to $14,999 | 21 (3.1%) | 4 (1.5%) |
| $15,000 to $19,999 | 23 (3.4%) | 0 (0.0%) |
| $20,000 to $24,999 | 27 (4.0%) | 9 (3.3%) |
| $25,000 to $34,999 | 34 (5.1%) | 3 (1.1%) |
| $35,000 to $49,999 | 50 (7.5%) | 27 (9.8%) |
| $50,000 to $74,999 | 66 (9.9%) | 44 (15.9%) |
| $75,000 to $99,999 | 101 (15.1%) | 68 (24.6%) |
| $100,000 to $149,999 | 207 (30.9%) | 83 (30.1%) |
| $150,000 or more | 131 (19.6%) | 25 (9.1%) |
| Total | 669 (100.0%) | 276 (100.0%) |
Monthly Housing Cost Tiers in Burns Harbor
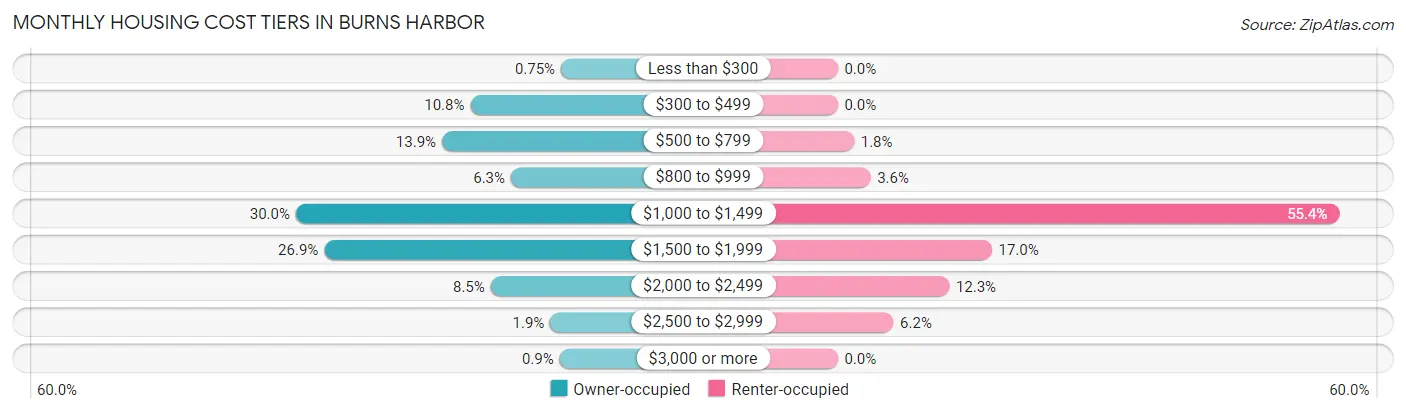
| Monthly Cost | Owner-occupied | Renter-occupied |
| Less than $300 | 5 (0.7%) | 0 (0.0%) |
| $300 to $499 | 72 (10.8%) | 0 (0.0%) |
| $500 to $799 | 93 (13.9%) | 5 (1.8%) |
| $800 to $999 | 42 (6.3%) | 10 (3.6%) |
| $1,000 to $1,499 | 201 (30.0%) | 153 (55.4%) |
| $1,500 to $1,999 | 180 (26.9%) | 47 (17.0%) |
| $2,000 to $2,499 | 57 (8.5%) | 34 (12.3%) |
| $2,500 to $2,999 | 13 (1.9%) | 17 (6.2%) |
| $3,000 or more | 6 (0.9%) | 0 (0.0%) |
| Total | 669 (100.0%) | 276 (100.0%) |
Physical Housing Characteristics in Burns Harbor
Housing Structures in Burns Harbor
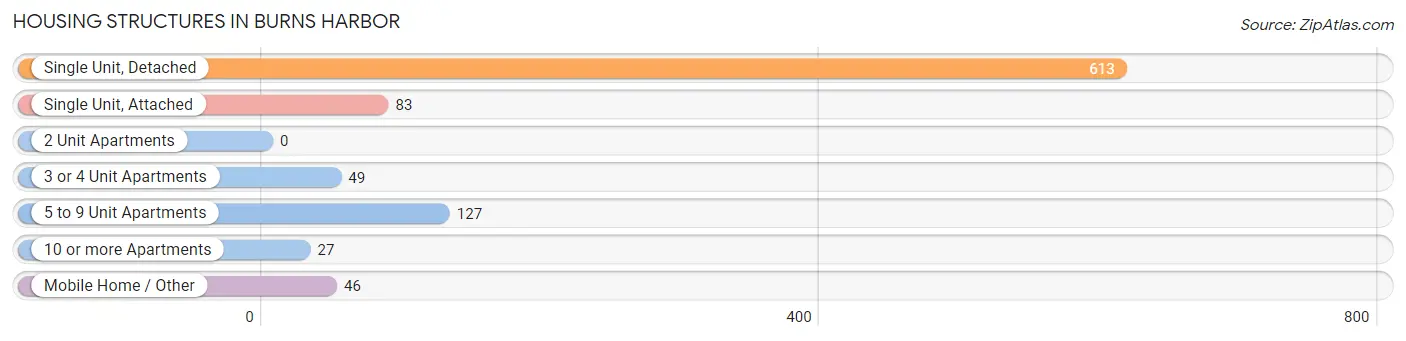
| Structure Type | # Housing Units | % Housing Units |
| Single Unit, Detached | 613 | 64.9% |
| Single Unit, Attached | 83 | 8.8% |
| 2 Unit Apartments | 0 | 0.0% |
| 3 or 4 Unit Apartments | 49 | 5.2% |
| 5 to 9 Unit Apartments | 127 | 13.4% |
| 10 or more Apartments | 27 | 2.9% |
| Mobile Home / Other | 46 | 4.9% |
| Total | 945 | 100.0% |
Housing Structures by Occupancy in Burns Harbor
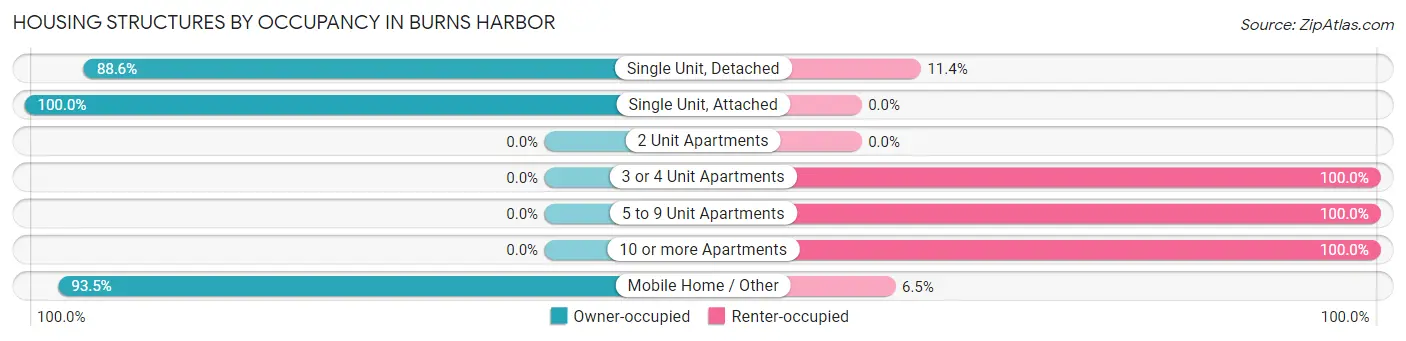
| Structure Type | Owner-occupied | Renter-occupied |
| Single Unit, Detached | 543 (88.6%) | 70 (11.4%) |
| Single Unit, Attached | 83 (100.0%) | 0 (0.0%) |
| 2 Unit Apartments | 0 (0.0%) | 0 (0.0%) |
| 3 or 4 Unit Apartments | 0 (0.0%) | 49 (100.0%) |
| 5 to 9 Unit Apartments | 0 (0.0%) | 127 (100.0%) |
| 10 or more Apartments | 0 (0.0%) | 27 (100.0%) |
| Mobile Home / Other | 43 (93.5%) | 3 (6.5%) |
| Total | 669 (70.8%) | 276 (29.2%) |
Housing Structures by Number of Rooms in Burns Harbor
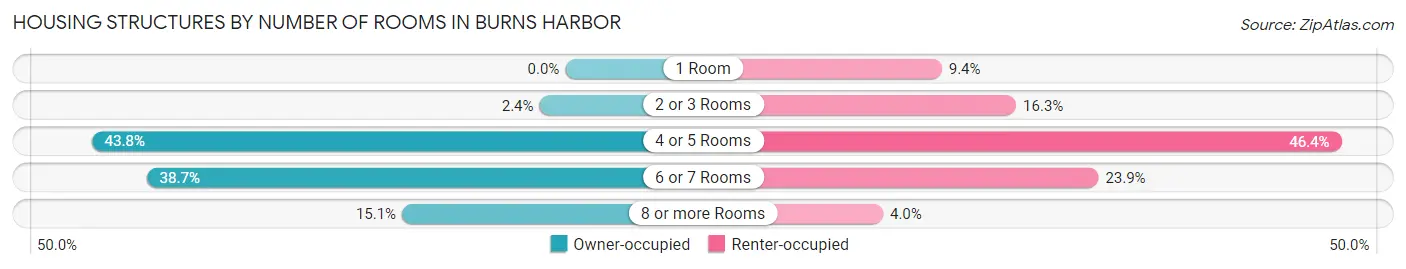
| Number of Rooms | Owner-occupied | Renter-occupied |
| 1 Room | 0 (0.0%) | 26 (9.4%) |
| 2 or 3 Rooms | 16 (2.4%) | 45 (16.3%) |
| 4 or 5 Rooms | 293 (43.8%) | 128 (46.4%) |
| 6 or 7 Rooms | 259 (38.7%) | 66 (23.9%) |
| 8 or more Rooms | 101 (15.1%) | 11 (4.0%) |
| Total | 669 (100.0%) | 276 (100.0%) |
Housing Structure by Heating Type in Burns Harbor
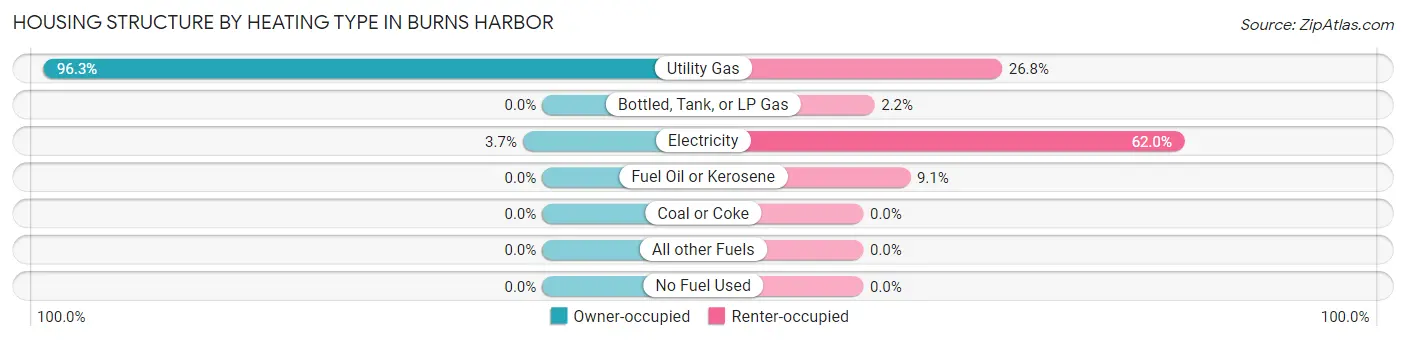
| Heating Type | Owner-occupied | Renter-occupied |
| Utility Gas | 644 (96.3%) | 74 (26.8%) |
| Bottled, Tank, or LP Gas | 0 (0.0%) | 6 (2.2%) |
| Electricity | 25 (3.7%) | 171 (62.0%) |
| Fuel Oil or Kerosene | 0 (0.0%) | 25 (9.1%) |
| Coal or Coke | 0 (0.0%) | 0 (0.0%) |
| All other Fuels | 0 (0.0%) | 0 (0.0%) |
| No Fuel Used | 0 (0.0%) | 0 (0.0%) |
| Total | 669 (100.0%) | 276 (100.0%) |
Household Vehicle Usage in Burns Harbor
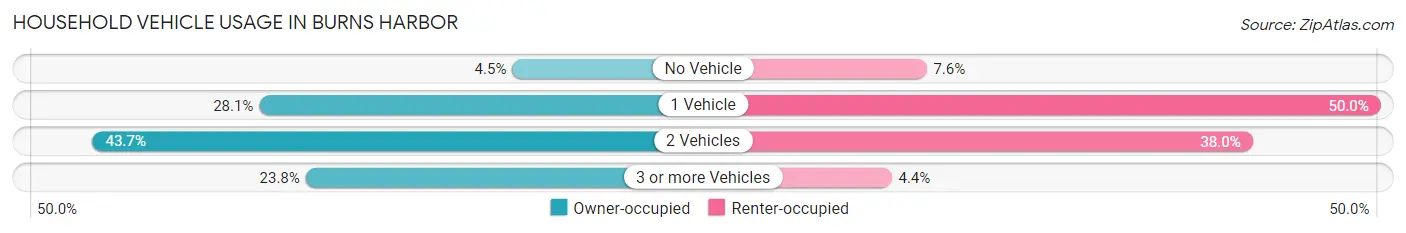
| Vehicles per Household | Owner-occupied | Renter-occupied |
| No Vehicle | 30 (4.5%) | 21 (7.6%) |
| 1 Vehicle | 188 (28.1%) | 138 (50.0%) |
| 2 Vehicles | 292 (43.6%) | 105 (38.0%) |
| 3 or more Vehicles | 159 (23.8%) | 12 (4.3%) |
| Total | 669 (100.0%) | 276 (100.0%) |
Real Estate & Mortgages in Burns Harbor
Real Estate and Mortgage Overview in Burns Harbor
| Characteristic | Without Mortgage | With Mortgage |
| Housing Units | 170 | 499 |
| Median Property Value | $154,400 | $234,500 |
| Median Household Income | $39,821 | $128 |
| Monthly Housing Costs | $540 | $6 |
| Real Estate Taxes | $1,214 | $2 |
Property Value by Mortgage Status in Burns Harbor
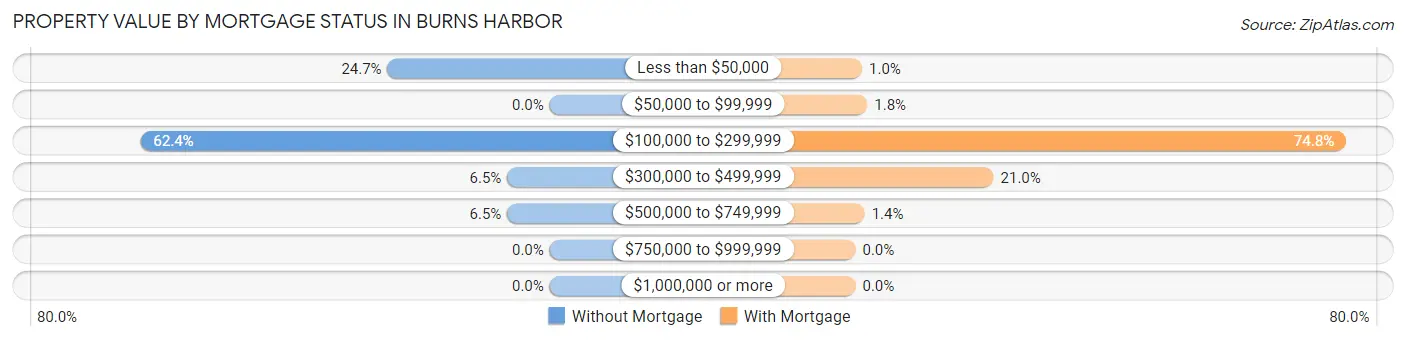
| Property Value | Without Mortgage | With Mortgage |
| Less than $50,000 | 42 (24.7%) | 5 (1.0%) |
| $50,000 to $99,999 | 0 (0.0%) | 9 (1.8%) |
| $100,000 to $299,999 | 106 (62.4%) | 373 (74.8%) |
| $300,000 to $499,999 | 11 (6.5%) | 105 (21.0%) |
| $500,000 to $749,999 | 11 (6.5%) | 7 (1.4%) |
| $750,000 to $999,999 | 0 (0.0%) | 0 (0.0%) |
| $1,000,000 or more | 0 (0.0%) | 0 (0.0%) |
| Total | 170 (100.0%) | 499 (100.0%) |
Household Income by Mortgage Status in Burns Harbor
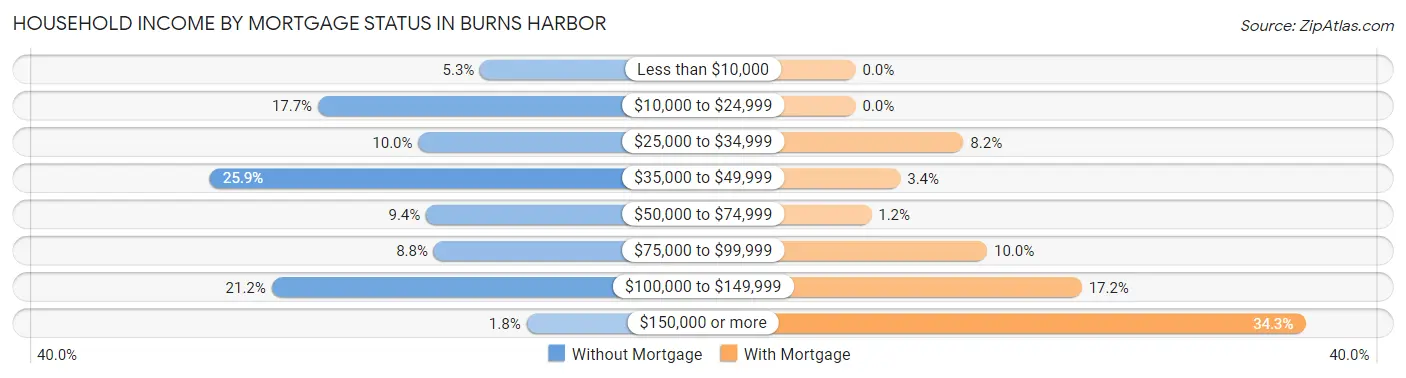
| Household Income | Without Mortgage | With Mortgage |
| Less than $10,000 | 9 (5.3%) | 0 (0.0%) |
| $10,000 to $24,999 | 30 (17.6%) | 0 (0.0%) |
| $25,000 to $34,999 | 17 (10.0%) | 41 (8.2%) |
| $35,000 to $49,999 | 44 (25.9%) | 17 (3.4%) |
| $50,000 to $74,999 | 16 (9.4%) | 6 (1.2%) |
| $75,000 to $99,999 | 15 (8.8%) | 50 (10.0%) |
| $100,000 to $149,999 | 36 (21.2%) | 86 (17.2%) |
| $150,000 or more | 3 (1.8%) | 171 (34.3%) |
| Total | 170 (100.0%) | 499 (100.0%) |
Property Value to Household Income Ratio in Burns Harbor
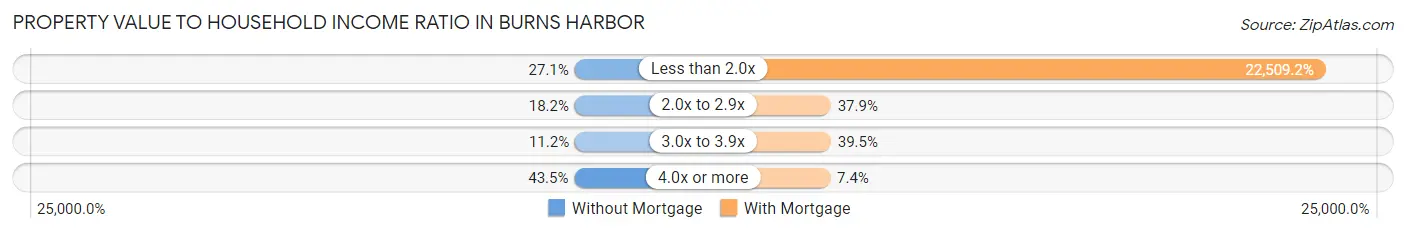
| Value-to-Income Ratio | Without Mortgage | With Mortgage |
| Less than 2.0x | 46 (27.1%) | 112,321 (22,509.2%) |
| 2.0x to 2.9x | 31 (18.2%) | 189 (37.9%) |
| 3.0x to 3.9x | 19 (11.2%) | 197 (39.5%) |
| 4.0x or more | 74 (43.5%) | 37 (7.4%) |
| Total | 170 (100.0%) | 499 (100.0%) |
Real Estate Taxes by Mortgage Status in Burns Harbor
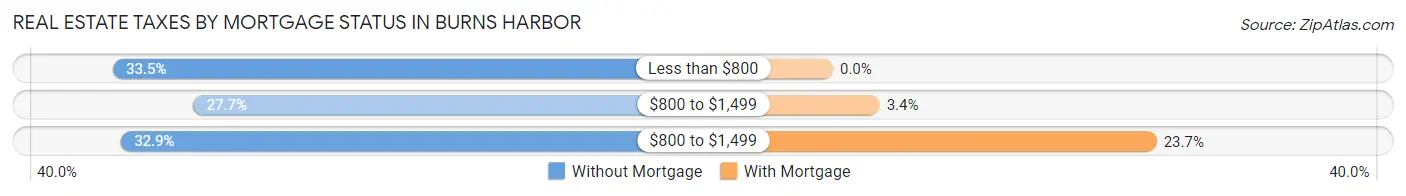
| Property Taxes | Without Mortgage | With Mortgage |
| Less than $800 | 57 (33.5%) | 0 (0.0%) |
| $800 to $1,499 | 47 (27.7%) | 17 (3.4%) |
| $800 to $1,499 | 56 (32.9%) | 118 (23.6%) |
| Total | 170 (100.0%) | 499 (100.0%) |
Health & Disability in Burns Harbor
Health Insurance Coverage by Age in Burns Harbor
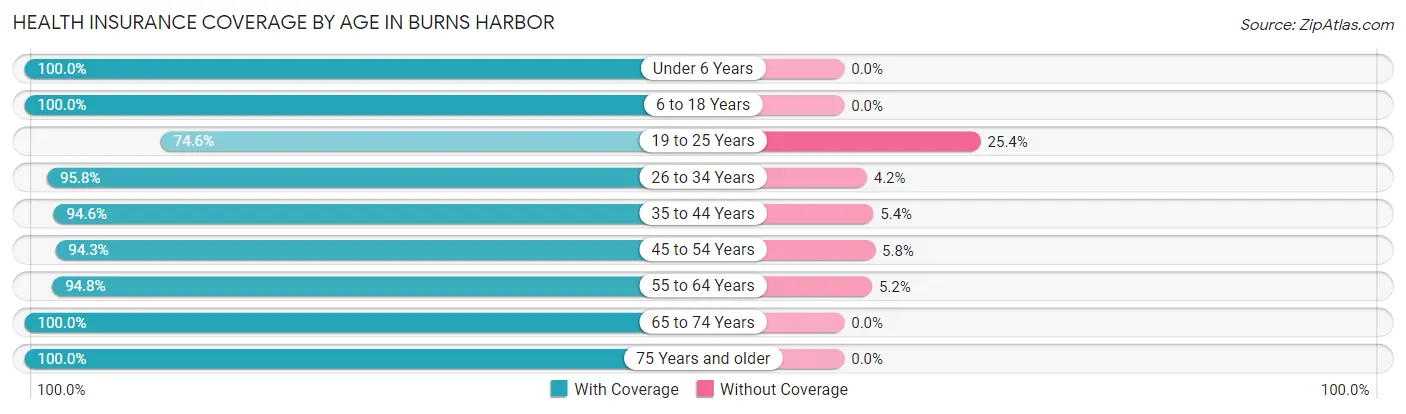
| Age Bracket | With Coverage | Without Coverage |
| Under 6 Years | 280 (100.0%) | 0 (0.0%) |
| 6 to 18 Years | 471 (100.0%) | 0 (0.0%) |
| 19 to 25 Years | 88 (74.6%) | 30 (25.4%) |
| 26 to 34 Years | 206 (95.8%) | 9 (4.2%) |
| 35 to 44 Years | 489 (94.6%) | 28 (5.4%) |
| 45 to 54 Years | 344 (94.3%) | 21 (5.8%) |
| 55 to 64 Years | 202 (94.8%) | 11 (5.2%) |
| 65 to 74 Years | 130 (100.0%) | 0 (0.0%) |
| 75 Years and older | 85 (100.0%) | 0 (0.0%) |
| Total | 2,295 (95.9%) | 99 (4.1%) |
Health Insurance Coverage by Citizenship Status in Burns Harbor
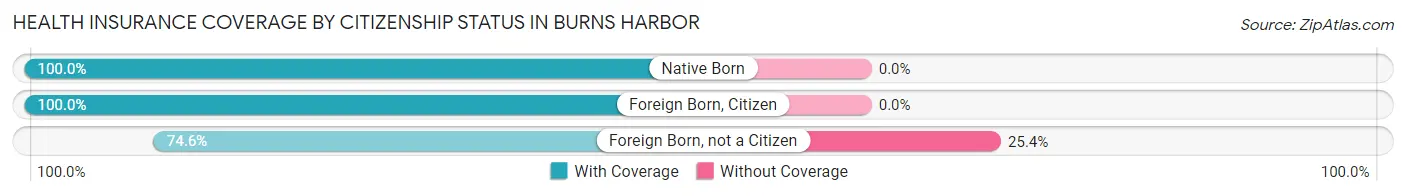
| Citizenship Status | With Coverage | Without Coverage |
| Native Born | 280 (100.0%) | 0 (0.0%) |
| Foreign Born, Citizen | 471 (100.0%) | 0 (0.0%) |
| Foreign Born, not a Citizen | 88 (74.6%) | 30 (25.4%) |
Health Insurance Coverage by Household Income in Burns Harbor
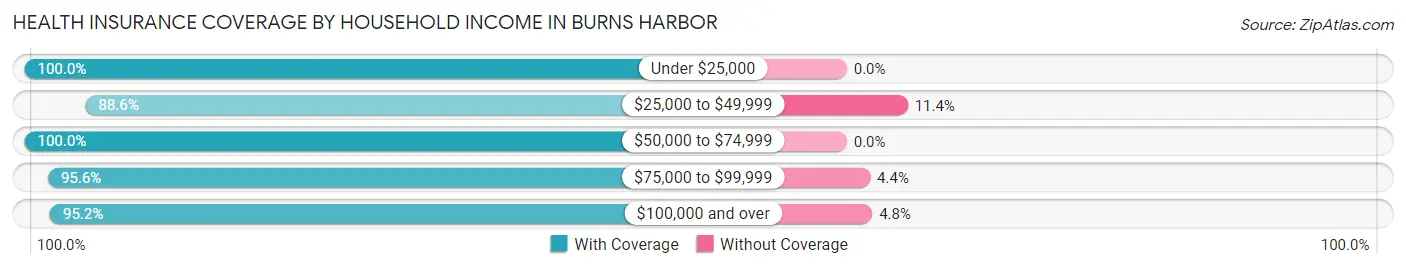
| Household Income | With Coverage | Without Coverage |
| Under $25,000 | 292 (100.0%) | 0 (0.0%) |
| $25,000 to $49,999 | 132 (88.6%) | 17 (11.4%) |
| $50,000 to $74,999 | 194 (100.0%) | 0 (0.0%) |
| $75,000 to $99,999 | 458 (95.6%) | 21 (4.4%) |
| $100,000 and over | 1,219 (95.2%) | 61 (4.8%) |
Public vs Private Health Insurance Coverage by Age in Burns Harbor
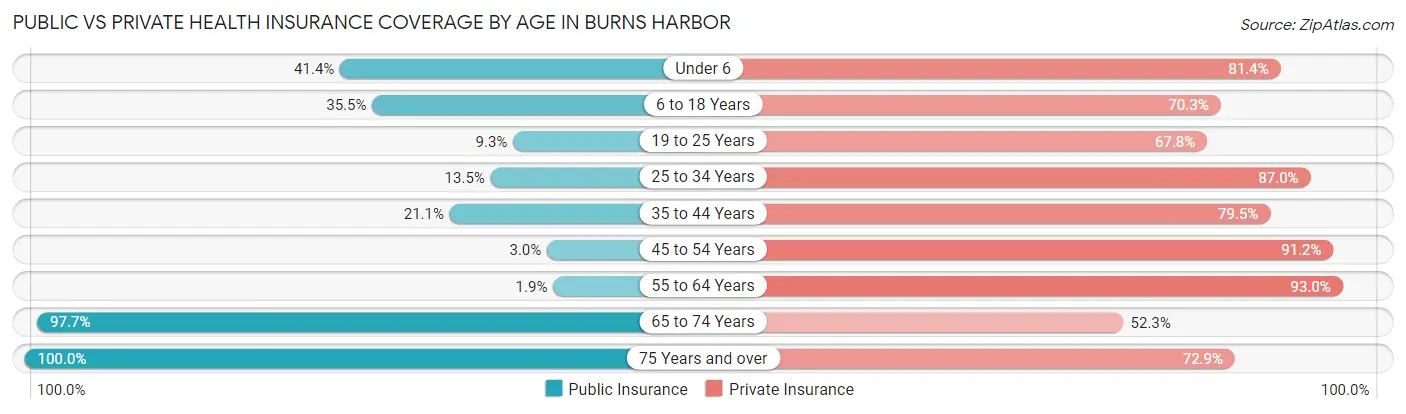
| Age Bracket | Public Insurance | Private Insurance |
| Under 6 | 116 (41.4%) | 228 (81.4%) |
| 6 to 18 Years | 167 (35.5%) | 331 (70.3%) |
| 19 to 25 Years | 11 (9.3%) | 80 (67.8%) |
| 25 to 34 Years | 29 (13.5%) | 187 (87.0%) |
| 35 to 44 Years | 109 (21.1%) | 411 (79.5%) |
| 45 to 54 Years | 11 (3.0%) | 333 (91.2%) |
| 55 to 64 Years | 4 (1.9%) | 198 (93.0%) |
| 65 to 74 Years | 127 (97.7%) | 68 (52.3%) |
| 75 Years and over | 85 (100.0%) | 62 (72.9%) |
| Total | 659 (27.5%) | 1,898 (79.3%) |
Disability Status by Sex by Age in Burns Harbor
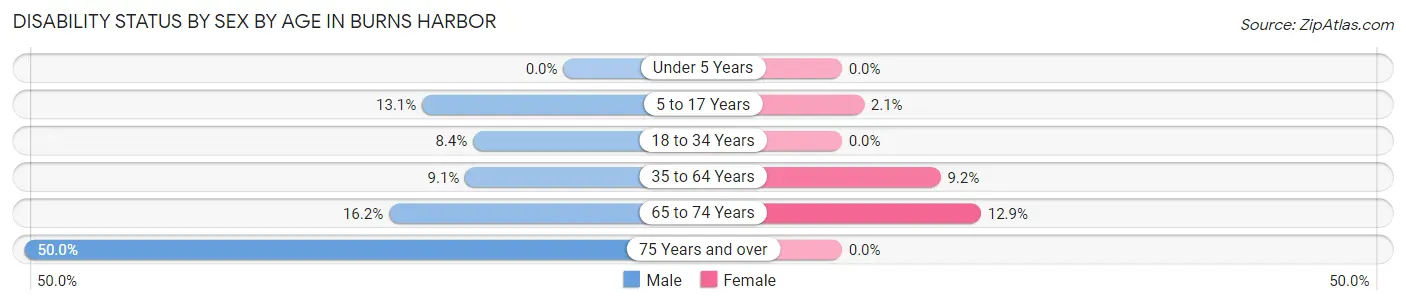
| Age Bracket | Male | Female |
| Under 5 Years | 0 (0.0%) | 0 (0.0%) |
| 5 to 17 Years | 32 (13.1%) | 5 (2.1%) |
| 18 to 34 Years | 14 (8.4%) | 0 (0.0%) |
| 35 to 64 Years | 52 (9.1%) | 48 (9.2%) |
| 65 to 74 Years | 11 (16.2%) | 8 (12.9%) |
| 75 Years and over | 23 (50.0%) | 0 (0.0%) |
Disability Class by Sex by Age in Burns Harbor
Disability Class: Hearing Difficulty
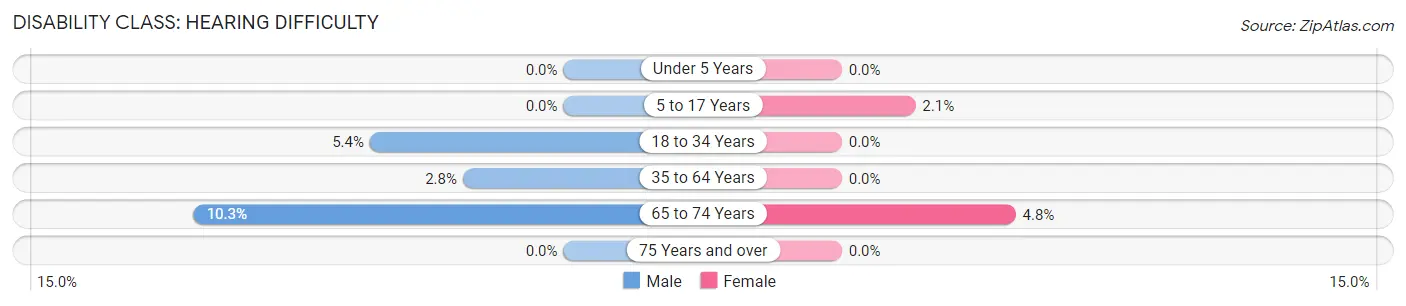
| Age Bracket | Male | Female |
| Under 5 Years | 0 (0.0%) | 0 (0.0%) |
| 5 to 17 Years | 0 (0.0%) | 5 (2.1%) |
| 18 to 34 Years | 9 (5.4%) | 0 (0.0%) |
| 35 to 64 Years | 16 (2.8%) | 0 (0.0%) |
| 65 to 74 Years | 7 (10.3%) | 3 (4.8%) |
| 75 Years and over | 0 (0.0%) | 0 (0.0%) |
Disability Class: Vision Difficulty
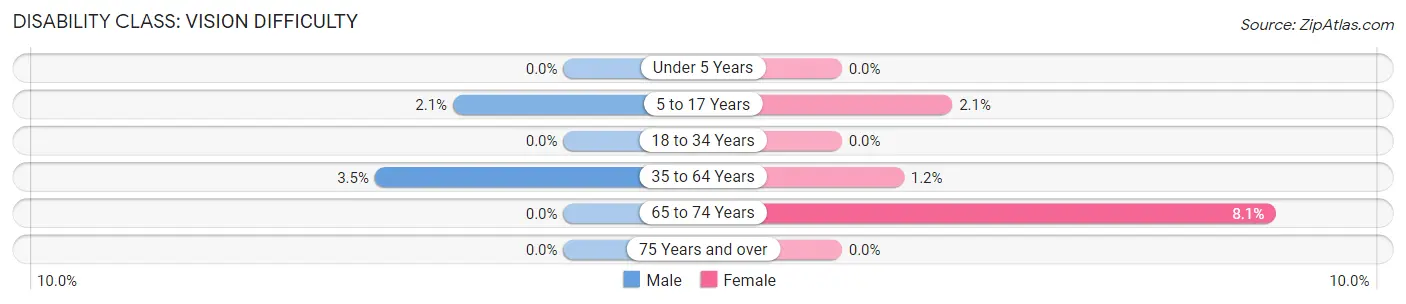
| Age Bracket | Male | Female |
| Under 5 Years | 0 (0.0%) | 0 (0.0%) |
| 5 to 17 Years | 5 (2.1%) | 5 (2.1%) |
| 18 to 34 Years | 0 (0.0%) | 0 (0.0%) |
| 35 to 64 Years | 20 (3.5%) | 6 (1.1%) |
| 65 to 74 Years | 0 (0.0%) | 5 (8.1%) |
| 75 Years and over | 0 (0.0%) | 0 (0.0%) |
Disability Class: Cognitive Difficulty
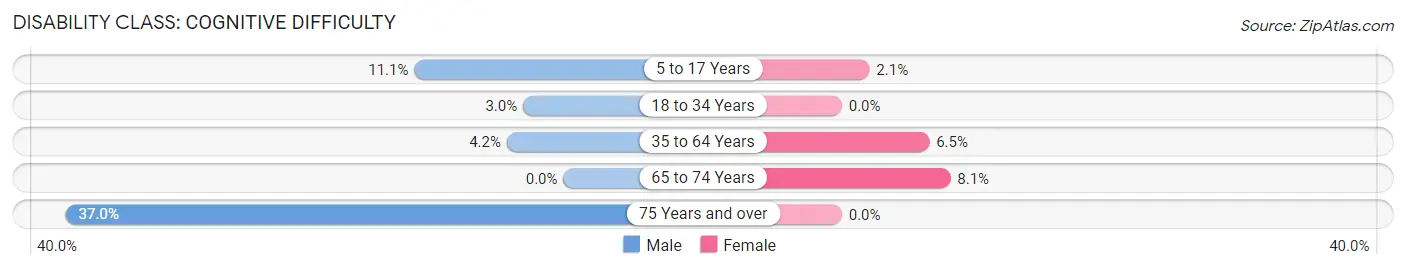
| Age Bracket | Male | Female |
| 5 to 17 Years | 27 (11.1%) | 5 (2.1%) |
| 18 to 34 Years | 5 (3.0%) | 0 (0.0%) |
| 35 to 64 Years | 24 (4.2%) | 34 (6.5%) |
| 65 to 74 Years | 0 (0.0%) | 5 (8.1%) |
| 75 Years and over | 17 (37.0%) | 0 (0.0%) |
Disability Class: Ambulatory Difficulty
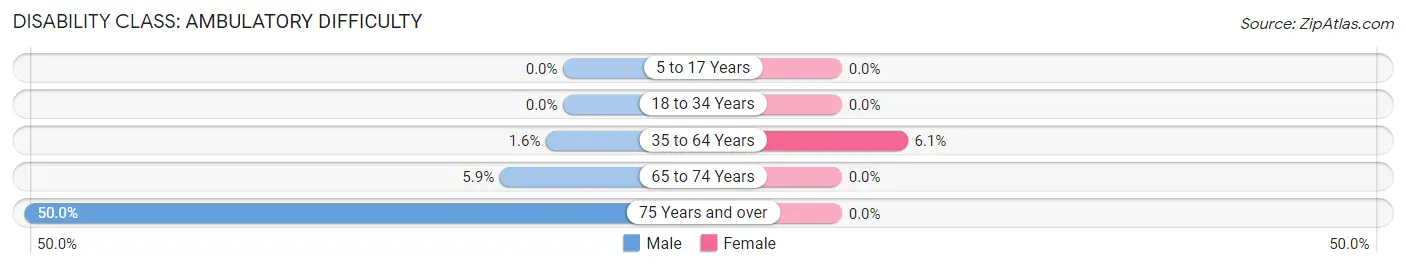
| Age Bracket | Male | Female |
| 5 to 17 Years | 0 (0.0%) | 0 (0.0%) |
| 18 to 34 Years | 0 (0.0%) | 0 (0.0%) |
| 35 to 64 Years | 9 (1.6%) | 32 (6.1%) |
| 65 to 74 Years | 4 (5.9%) | 0 (0.0%) |
| 75 Years and over | 23 (50.0%) | 0 (0.0%) |
Disability Class: Self-Care Difficulty
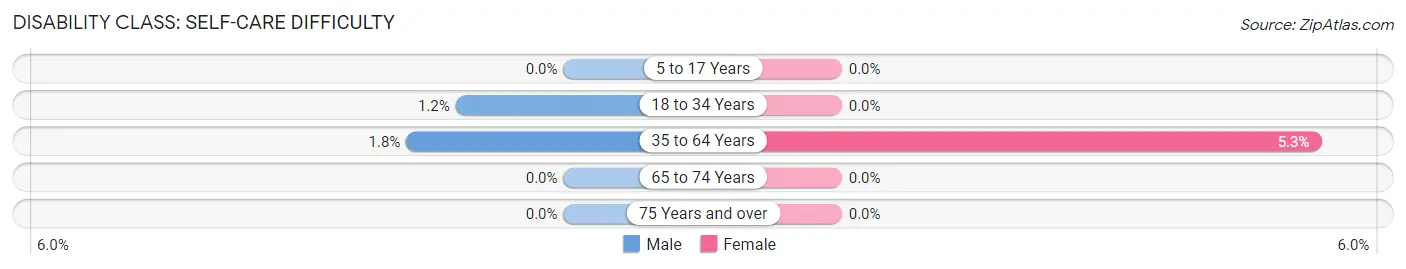
| Age Bracket | Male | Female |
| 5 to 17 Years | 0 (0.0%) | 0 (0.0%) |
| 18 to 34 Years | 2 (1.2%) | 0 (0.0%) |
| 35 to 64 Years | 10 (1.8%) | 28 (5.3%) |
| 65 to 74 Years | 0 (0.0%) | 0 (0.0%) |
| 75 Years and over | 0 (0.0%) | 0 (0.0%) |
Technology Access in Burns Harbor
Computing Device Access in Burns Harbor
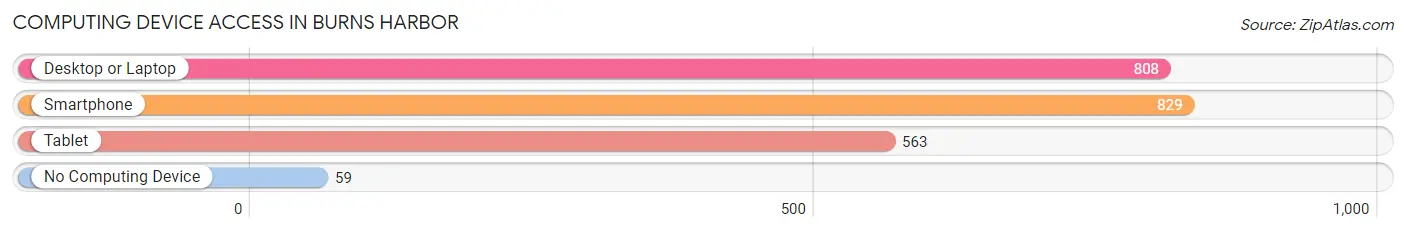
| Device Type | # Households | % Households |
| Desktop or Laptop | 808 | 85.5% |
| Smartphone | 829 | 87.7% |
| Tablet | 563 | 59.6% |
| No Computing Device | 59 | 6.2% |
| Total | 945 | 100.0% |
Internet Access in Burns Harbor
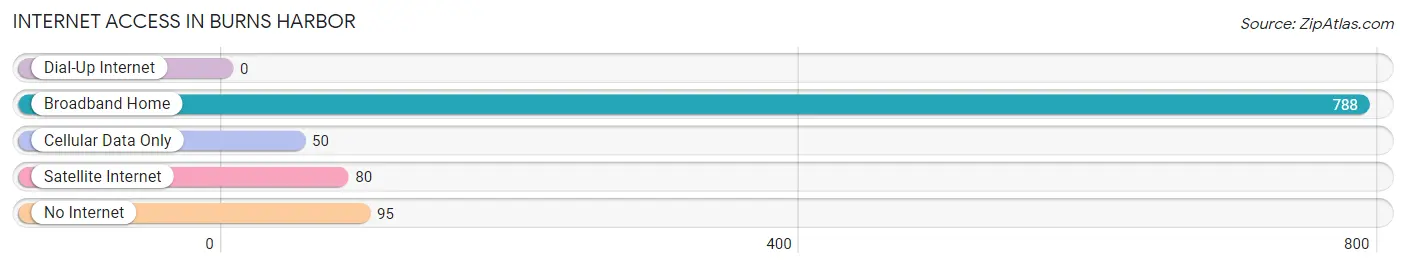
| Internet Type | # Households | % Households |
| Dial-Up Internet | 0 | 0.0% |
| Broadband Home | 788 | 83.4% |
| Cellular Data Only | 50 | 5.3% |
| Satellite Internet | 80 | 8.5% |
| No Internet | 95 | 10.1% |
| Total | 945 | 100.0% |
Burns Harbor Summary
Burns Harbor, Indiana is a small town located in Porter County, Indiana, United States. The town is located on the southern shore of Lake Michigan, approximately 25 miles east of Chicago. The town was founded in 1883 and was named after the Burns Harbor Steel Company, which was founded in the area in 1883. The town has a population of approximately 1,500 people and is part of the Portage-Burns Harbor Metropolitan Statistical Area.
History
The area that is now Burns Harbor was originally inhabited by the Potawatomi Native American tribe. The first European settlers arrived in the area in the early 1800s. The town was founded in 1883 by the Burns Harbor Steel Company, which was founded by William Burns and John Harbor. The company was the first steel mill in the area and was responsible for the development of the town. The town was officially incorporated in 1887.
The town grew rapidly in the late 19th and early 20th centuries, due to the steel industry. The town was home to several steel mills, including the Burns Harbor Steel Company, the Portage Steel Company, and the Burns Harbor Steel Works. The town was also home to several other industries, including a shipbuilding company, a brickyard, and a foundry.
The town experienced a period of decline in the mid-20th century, as the steel industry began to decline. The steel mills closed in the 1970s and 1980s, leaving the town without its main source of employment. The town has since experienced a resurgence, as new businesses have moved into the area.
Geography
Burns Harbor is located in Porter County, Indiana, on the southern shore of Lake Michigan. The town is located approximately 25 miles east of Chicago. The town is bordered by the towns of Portage, Chesterton, and Porter. The town is located in a flat, low-lying area, with an elevation of approximately 600 feet. The town is located in the Central Lowland region of the United States.
The town is located in a humid continental climate zone, with hot summers and cold winters. The average annual temperature is approximately 50 degrees Fahrenheit. The town receives an average of 36 inches of precipitation per year.
Economy
The economy of Burns Harbor is largely based on the steel industry. The town is home to several steel mills, including the Burns Harbor Steel Company, the Portage Steel Company, and the Burns Harbor Steel Works. The town is also home to several other industries, including a shipbuilding company, a brickyard, and a foundry.
The town is also home to several retail stores, restaurants, and other businesses. The town is home to several parks and recreational areas, including the Burns Harbor State Park.
Demographics
As of the 2010 census, the population of Burns Harbor was 1,500 people. The town has a population density of approximately 1,000 people per square mile. The town is approximately 97% white, 1% African American, and 1% Hispanic. The median household income in the town is approximately $50,000 per year. The median home value in the town is approximately $150,000.
Common Questions
What is Per Capita Income in Burns Harbor?
Per Capita income in Burns Harbor is $38,882.
What is the Median Family Income in Burns Harbor?
Median Family Income in Burns Harbor is $112,083.
What is the Median Household income in Burns Harbor?
Median Household Income in Burns Harbor is $96,382.
What is Income or Wage Gap in Burns Harbor?
Income or Wage Gap in Burns Harbor is 46.6%.
Women in Burns Harbor earn 53.4 cents for every dollar earned by a man.
What is Inequality or Gini Index in Burns Harbor?
Inequality or Gini Index in Burns Harbor is 0.33.
What is the Total Population of Burns Harbor?
Total Population of Burns Harbor is 2,409.
What is the Total Male Population of Burns Harbor?
Total Male Population of Burns Harbor is 1,213.
What is the Total Female Population of Burns Harbor?
Total Female Population of Burns Harbor is 1,196.
What is the Ratio of Males per 100 Females in Burns Harbor?
There are 101.42 Males per 100 Females in Burns Harbor.
What is the Ratio of Females per 100 Males in Burns Harbor?
There are 98.60 Females per 100 Males in Burns Harbor.
What is the Median Population Age in Burns Harbor?
Median Population Age in Burns Harbor is 36.4 Years.
What is the Average Family Size in Burns Harbor
Average Family Size in Burns Harbor is 3.3 People.
What is the Average Household Size in Burns Harbor
Average Household Size in Burns Harbor is 2.5 People.
How Large is the Labor Force in Burns Harbor?
There are 1,270 People in the Labor Forcein in Burns Harbor.
What is the Percentage of People in the Labor Force in Burns Harbor?
73.6% of People are in the Labor Force in Burns Harbor.
What is the Unemployment Rate in Burns Harbor?
Unemployment Rate in Burns Harbor is 0.7%.