Brookville, IN Map & Demographics
Brookville Map
Brookville Overview
$30,439
PER CAPITA INCOME
$79,236
AVG FAMILY INCOME
$54,537
AVG HOUSEHOLD INCOME
14.4%
WAGE / INCOME GAP [ % ]
85.6¢/ $1
WAGE / INCOME GAP [ $ ]
0.43
INEQUALITY / GINI INDEX
2,619
TOTAL POPULATION
1,263
MALE POPULATION
1,356
FEMALE POPULATION
93.14
MALES / 100 FEMALES
107.36
FEMALES / 100 MALES
43.1
MEDIAN AGE
3.0
AVG FAMILY SIZE
2.1
AVG HOUSEHOLD SIZE
1,269
LABOR FORCE [ PEOPLE ]
58.8%
PERCENT IN LABOR FORCE
0.6%
UNEMPLOYMENT RATE
Brookville Zip Codes
Brookville Area Codes
Income in Brookville
Income Overview in Brookville
Per Capita Income in Brookville is $30,439, while median incomes of families and households are $79,236 and $54,537 respectively.
| Characteristic | Number | Measure |
| Per Capita Income | 2,619 | $30,439 |
| Median Family Income | 645 | $79,236 |
| Mean Family Income | 645 | $86,973 |
| Median Household Income | 1,230 | $54,537 |
| Mean Household Income | 1,230 | $61,692 |
| Income Deficit | 645 | $0 |
| Wage / Income Gap (%) | 2,619 | 14.38% |
| Wage / Income Gap ($) | 2,619 | 85.62¢ per $1 |
| Gini / Inequality Index | 2,619 | 0.43 |
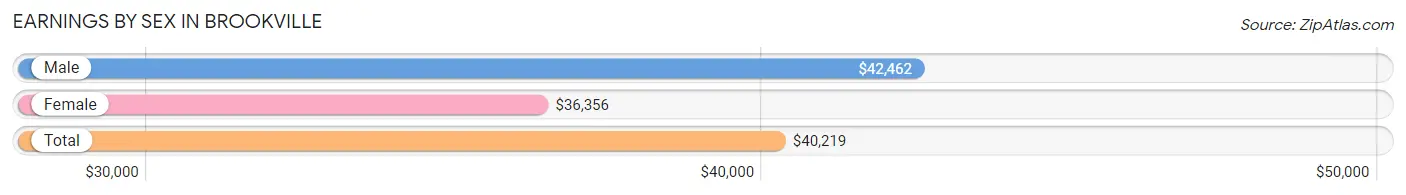
Earnings by Sex in Brookville
Average Earnings in Brookville are $40,219, $42,462 for men and $36,356 for women, a difference of 14.4%.
| Sex | Number | Average Earnings |
| Male | 739 (57.1%) | $42,462 |
| Female | 555 (42.9%) | $36,356 |
| Total | 1,294 (100.0%) | $40,219 |
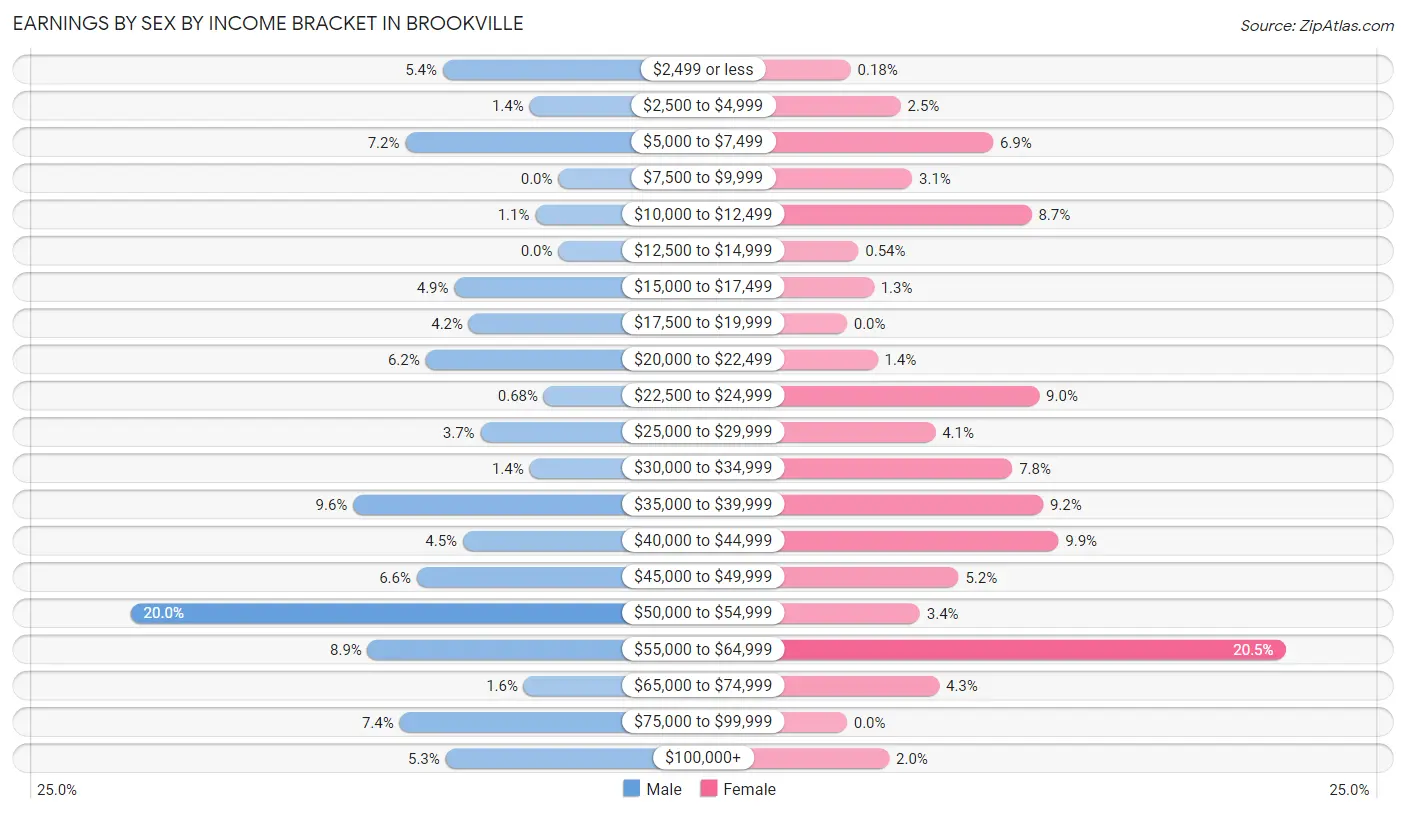
Earnings by Sex by Income Bracket in Brookville
The most common earnings brackets in Brookville are $50,000 to $54,999 for men (148 | 20.0%) and $55,000 to $64,999 for women (114 | 20.5%).
| Income | Male | Female |
| $2,499 or less | 40 (5.4%) | 1 (0.2%) |
| $2,500 to $4,999 | 10 (1.3%) | 14 (2.5%) |
| $5,000 to $7,499 | 53 (7.2%) | 38 (6.9%) |
| $7,500 to $9,999 | 0 (0.0%) | 17 (3.1%) |
| $10,000 to $12,499 | 8 (1.1%) | 48 (8.6%) |
| $12,500 to $14,999 | 0 (0.0%) | 3 (0.5%) |
| $15,000 to $17,499 | 36 (4.9%) | 7 (1.3%) |
| $17,500 to $19,999 | 31 (4.2%) | 0 (0.0%) |
| $20,000 to $22,499 | 46 (6.2%) | 8 (1.4%) |
| $22,500 to $24,999 | 5 (0.7%) | 50 (9.0%) |
| $25,000 to $29,999 | 27 (3.6%) | 23 (4.1%) |
| $30,000 to $34,999 | 10 (1.3%) | 43 (7.7%) |
| $35,000 to $39,999 | 71 (9.6%) | 51 (9.2%) |
| $40,000 to $44,999 | 33 (4.5%) | 55 (9.9%) |
| $45,000 to $49,999 | 49 (6.6%) | 29 (5.2%) |
| $50,000 to $54,999 | 148 (20.0%) | 19 (3.4%) |
| $55,000 to $64,999 | 66 (8.9%) | 114 (20.5%) |
| $65,000 to $74,999 | 12 (1.6%) | 24 (4.3%) |
| $75,000 to $99,999 | 55 (7.4%) | 0 (0.0%) |
| $100,000+ | 39 (5.3%) | 11 (2.0%) |
| Total | 739 (100.0%) | 555 (100.0%) |
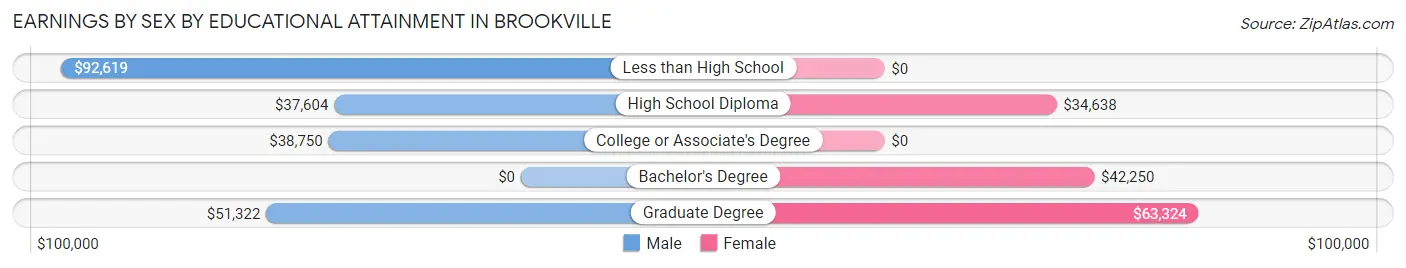
Earnings by Sex by Educational Attainment in Brookville
Average earnings in Brookville are $50,047 for men and $36,835 for women, a difference of 26.4%. Men with an educational attainment of less than high school enjoy the highest average annual earnings of $92,619, while those with high school diploma education earn the least with $37,604. Women with an educational attainment of graduate degree earn the most with the average annual earnings of $63,324, while those with high school diploma education have the smallest earnings of $34,638.
| Educational Attainment | Male Income | Female Income |
| Less than High School | $92,619 | $0 |
| High School Diploma | $37,604 | $34,638 |
| College or Associate's Degree | $38,750 | $0 |
| Bachelor's Degree | - | - |
| Graduate Degree | $51,322 | $63,324 |
| Total | $50,047 | $36,835 |
Family Income in Brookville
Family Income Brackets in Brookville
According to the Brookville family income data, there are 183 families falling into the $50,000 to $74,999 income range, which is the most common income bracket and makes up 28.4% of all families. Conversely, the less than $10,000 income bracket is the least frequent group with only 9 families (1.4%) belonging to this category.
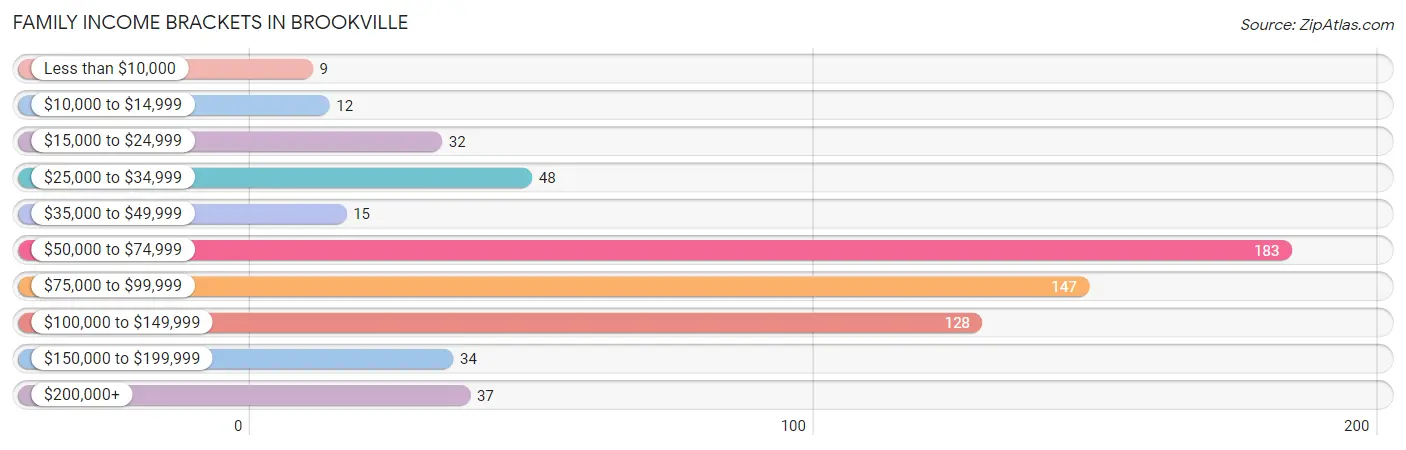
| Income Bracket | # Families | % Families |
| Less than $10,000 | 9 | 1.4% |
| $10,000 to $14,999 | 12 | 1.9% |
| $15,000 to $24,999 | 32 | 5.0% |
| $25,000 to $34,999 | 48 | 7.4% |
| $35,000 to $49,999 | 15 | 2.3% |
| $50,000 to $74,999 | 183 | 28.4% |
| $75,000 to $99,999 | 147 | 22.8% |
| $100,000 to $149,999 | 128 | 19.8% |
| $150,000 to $199,999 | 34 | 5.3% |
| $200,000+ | 37 | 5.7% |
Family Income by Famaliy Size in Brookville
4-person families (68 | 10.5%) account for the highest median family income in Brookville with $94,500 per family, while 2-person families (373 | 57.8%) have the highest median income of $36,062 per family member.
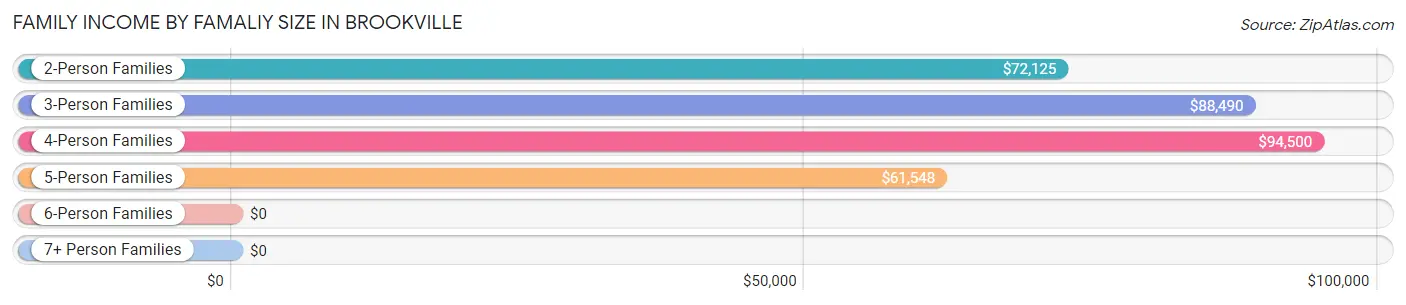
| Income Bracket | # Families | Median Income |
| 2-Person Families | 373 (57.8%) | $72,125 |
| 3-Person Families | 137 (21.2%) | $88,490 |
| 4-Person Families | 68 (10.5%) | $94,500 |
| 5-Person Families | 58 (9.0%) | $61,548 |
| 6-Person Families | 9 (1.4%) | $0 |
| 7+ Person Families | 0 (0.0%) | $0 |
| Total | 645 (100.0%) | $79,236 |
Family Income by Number of Earners in Brookville
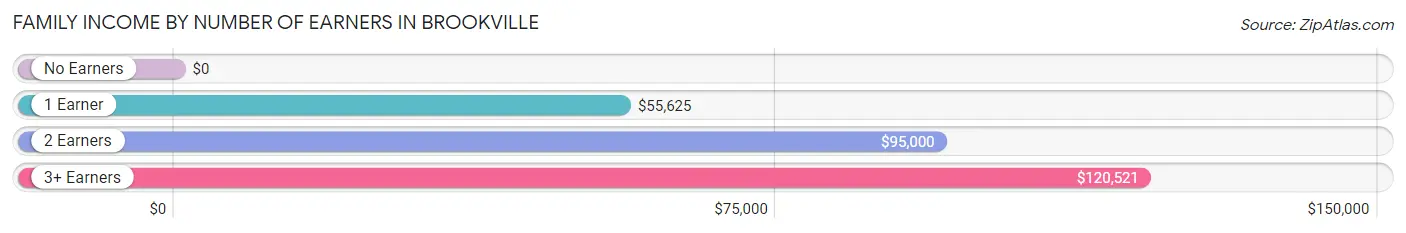
| Number of Earners | # Families | Median Income |
| No Earners | 110 (17.1%) | $0 |
| 1 Earner | 156 (24.2%) | $55,625 |
| 2 Earners | 348 (53.9%) | $95,000 |
| 3+ Earners | 31 (4.8%) | $120,521 |
| Total | 645 (100.0%) | $79,236 |
Household Income in Brookville
Household Income Brackets in Brookville
With 273 households falling in the category, the $15,000 to $24,999 income range is the most frequent in Brookville, accounting for 22.2% of all households. In contrast, only 36 households (2.9%) fall into the $10,000 to $14,999 income bracket, making it the least populous group.
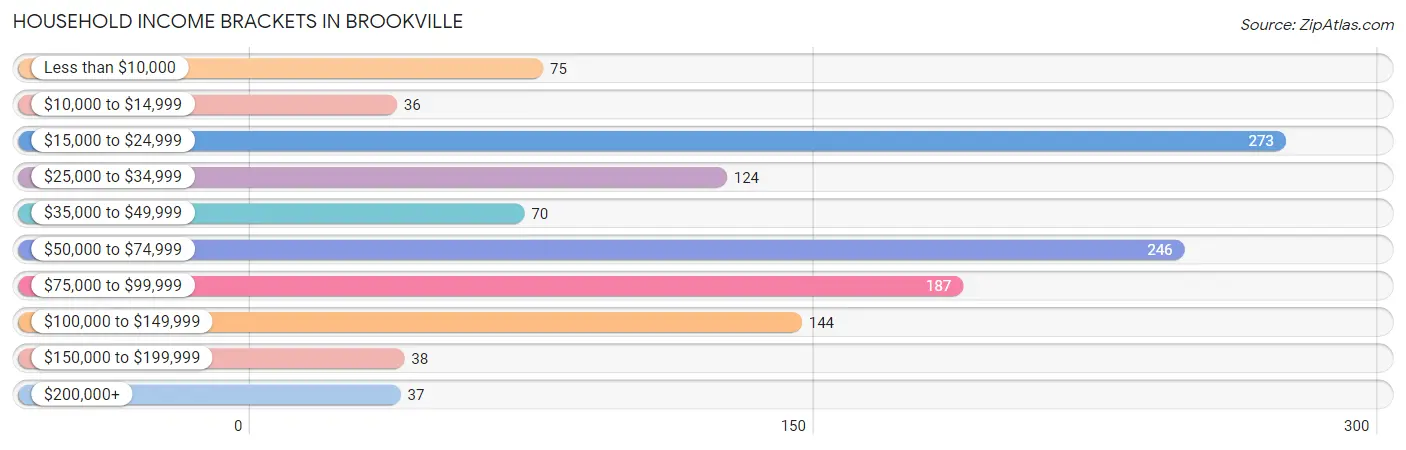
| Income Bracket | # Households | % Households |
| Less than $10,000 | 75 | 6.1% |
| $10,000 to $14,999 | 36 | 2.9% |
| $15,000 to $24,999 | 273 | 22.2% |
| $25,000 to $34,999 | 124 | 10.1% |
| $35,000 to $49,999 | 70 | 5.7% |
| $50,000 to $74,999 | 246 | 20.0% |
| $75,000 to $99,999 | 187 | 15.2% |
| $100,000 to $149,999 | 144 | 11.7% |
| $150,000 to $199,999 | 38 | 3.1% |
| $200,000+ | 37 | 3.0% |
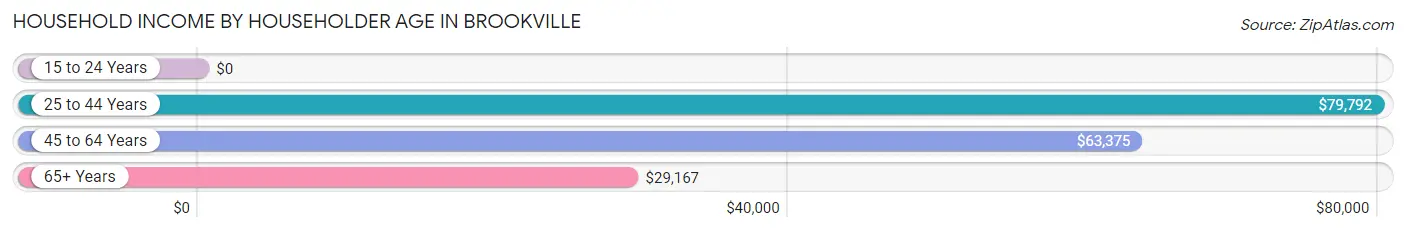
Household Income by Householder Age in Brookville
The median household income in Brookville is $54,537, with the highest median household income of $79,792 found in the 25 to 44 years age bracket for the primary householder. A total of 361 households (29.3%) fall into this category. Meanwhile, the 15 to 24 years age bracket for the primary householder has the lowest median household income of $0, with 15 households (1.2%) in this group.
| Income Bracket | # Households | Median Income |
| 15 to 24 Years | 15 (1.2%) | $0 |
| 25 to 44 Years | 361 (29.3%) | $79,792 |
| 45 to 64 Years | 350 (28.5%) | $63,375 |
| 65+ Years | 504 (41.0%) | $29,167 |
| Total | 1,230 (100.0%) | $54,537 |
Poverty in Brookville
Income Below Poverty by Sex and Age in Brookville
With 8.7% poverty level for males and 10.6% for females among the residents of Brookville, 6 to 11 year old males and 45 to 54 year old females are the most vulnerable to poverty, with 46 males (56.8%) and 38 females (30.6%) in their respective age groups living below the poverty level.
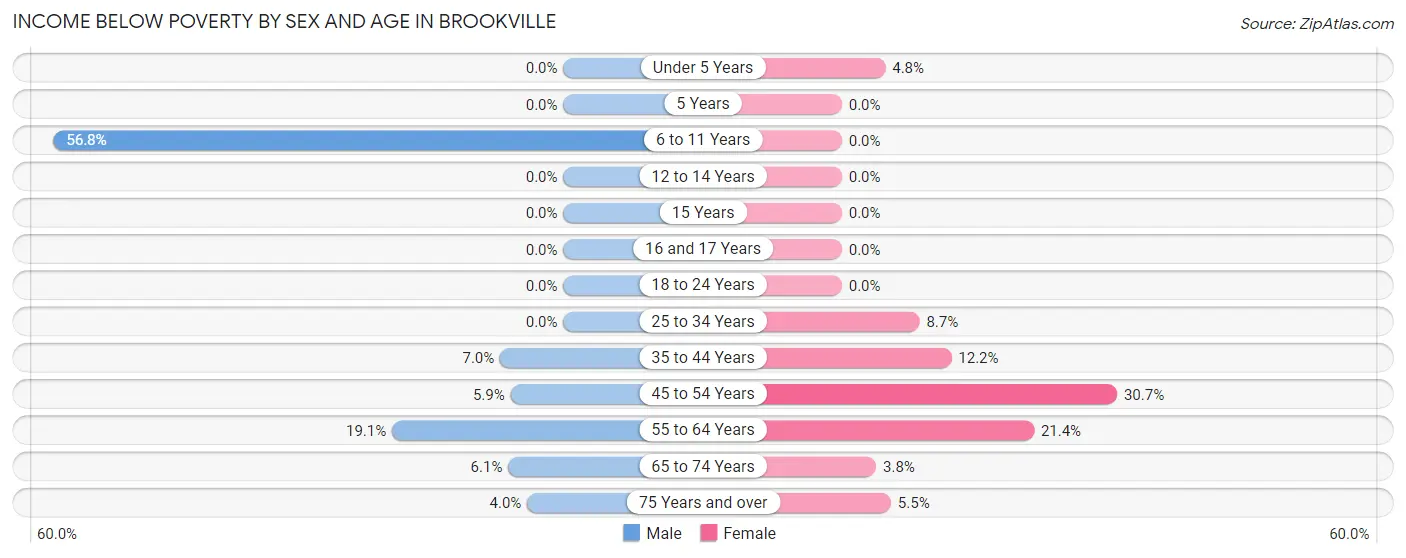
| Age Bracket | Male | Female |
| Under 5 Years | 0 (0.0%) | 6 (4.8%) |
| 5 Years | 0 (0.0%) | 0 (0.0%) |
| 6 to 11 Years | 46 (56.8%) | 0 (0.0%) |
| 12 to 14 Years | 0 (0.0%) | 0 (0.0%) |
| 15 Years | 0 (0.0%) | 0 (0.0%) |
| 16 and 17 Years | 0 (0.0%) | 0 (0.0%) |
| 18 to 24 Years | 0 (0.0%) | 0 (0.0%) |
| 25 to 34 Years | 0 (0.0%) | 16 (8.6%) |
| 35 to 44 Years | 15 (7.0%) | 15 (12.2%) |
| 45 to 54 Years | 7 (5.9%) | 38 (30.6%) |
| 55 to 64 Years | 29 (19.1%) | 49 (21.4%) |
| 65 to 74 Years | 7 (6.1%) | 6 (3.8%) |
| 75 Years and over | 5 (4.0%) | 14 (5.5%) |
| Total | 109 (8.7%) | 144 (10.6%) |
Income Above Poverty by Sex and Age in Brookville
According to the poverty statistics in Brookville, males aged under 5 years and females aged 6 to 11 years are the age groups that are most secure financially, with 100.0% of males and 100.0% of females in these age groups living above the poverty line.
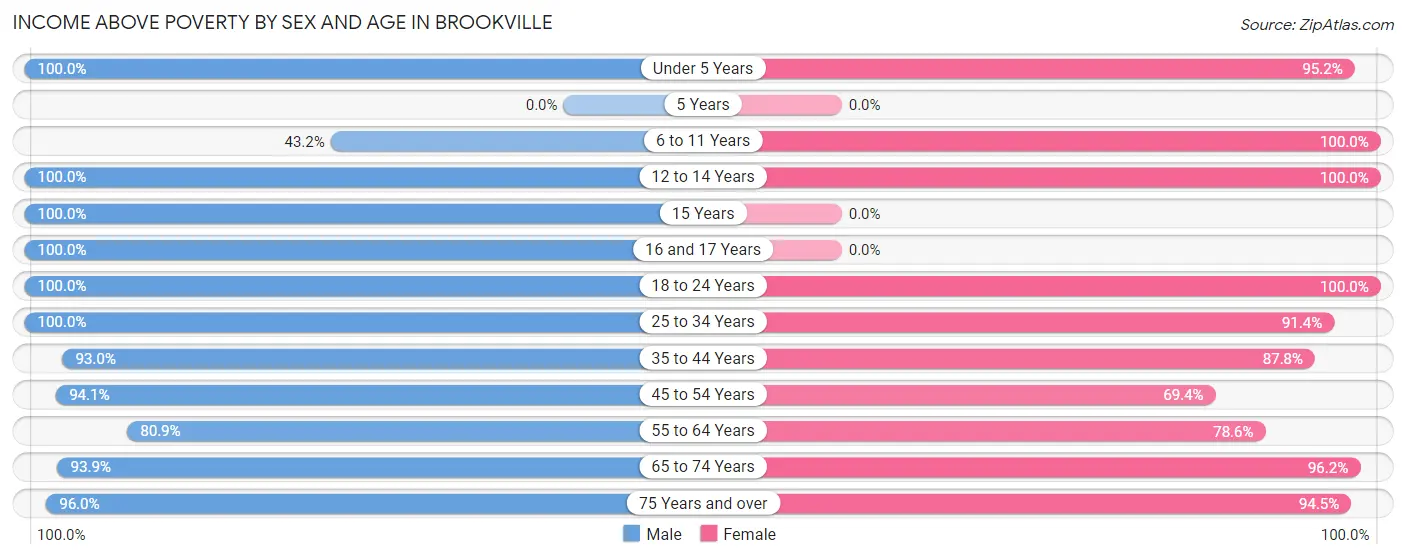
| Age Bracket | Male | Female |
| Under 5 Years | 105 (100.0%) | 118 (95.2%) |
| 5 Years | 0 (0.0%) | 0 (0.0%) |
| 6 to 11 Years | 35 (43.2%) | 26 (100.0%) |
| 12 to 14 Years | 20 (100.0%) | 83 (100.0%) |
| 15 Years | 6 (100.0%) | 0 (0.0%) |
| 16 and 17 Years | 42 (100.0%) | 0 (0.0%) |
| 18 to 24 Years | 109 (100.0%) | 49 (100.0%) |
| 25 to 34 Years | 163 (100.0%) | 169 (91.3%) |
| 35 to 44 Years | 198 (93.0%) | 108 (87.8%) |
| 45 to 54 Years | 112 (94.1%) | 86 (69.4%) |
| 55 to 64 Years | 123 (80.9%) | 180 (78.6%) |
| 65 to 74 Years | 107 (93.9%) | 151 (96.2%) |
| 75 Years and over | 119 (96.0%) | 242 (94.5%) |
| Total | 1,139 (91.3%) | 1,212 (89.4%) |
Income Below Poverty Among Married-Couple Families in Brookville
The poverty statistics for married-couple families in Brookville show that 3.8% or 19 of the total 496 families live below the poverty line. Families with no children have the highest poverty rate of 5.6%, comprising of 19 families. On the other hand, families with 1 or 2 children have the lowest poverty rate of 0.0%, which includes 0 families.
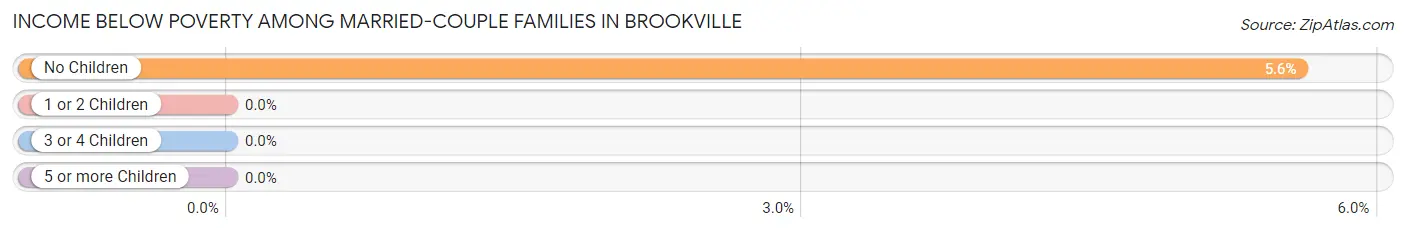
| Children | Above Poverty | Below Poverty |
| No Children | 321 (94.4%) | 19 (5.6%) |
| 1 or 2 Children | 92 (100.0%) | 0 (0.0%) |
| 3 or 4 Children | 64 (100.0%) | 0 (0.0%) |
| 5 or more Children | 0 (0.0%) | 0 (0.0%) |
| Total | 477 (96.2%) | 19 (3.8%) |
Income Below Poverty Among Single-Parent Households in Brookville
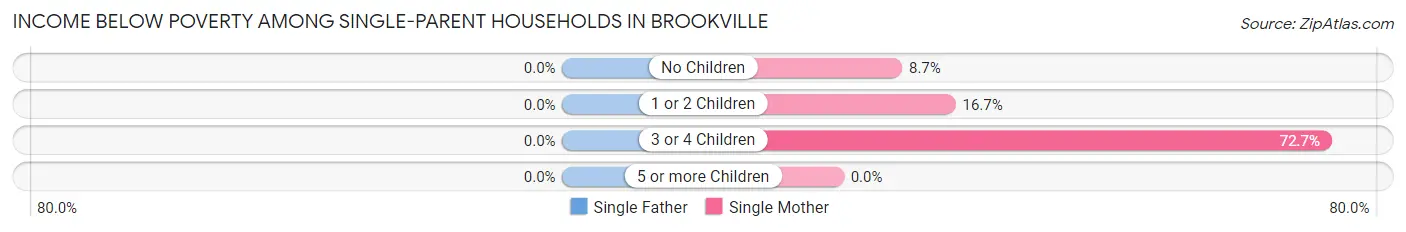
| Children | Single Father | Single Mother |
| No Children | 0 (0.0%) | 6 (8.7%) |
| 1 or 2 Children | 0 (0.0%) | 9 (16.7%) |
| 3 or 4 Children | 0 (0.0%) | 8 (72.7%) |
| 5 or more Children | 0 (0.0%) | 0 (0.0%) |
| Total | 0 (0.0%) | 23 (17.2%) |
Income Below Poverty Among Married-Couple vs Single-Parent Households in Brookville
The poverty data for Brookville shows that 19 of the married-couple family households (3.8%) and 23 of the single-parent households (15.4%) are living below the poverty level. Within the married-couple family households, those with no children have the highest poverty rate, with 19 households (5.6%) falling below the poverty line. Among the single-parent households, those with 3 or 4 children have the highest poverty rate, with 8 household (47.1%) living below poverty.
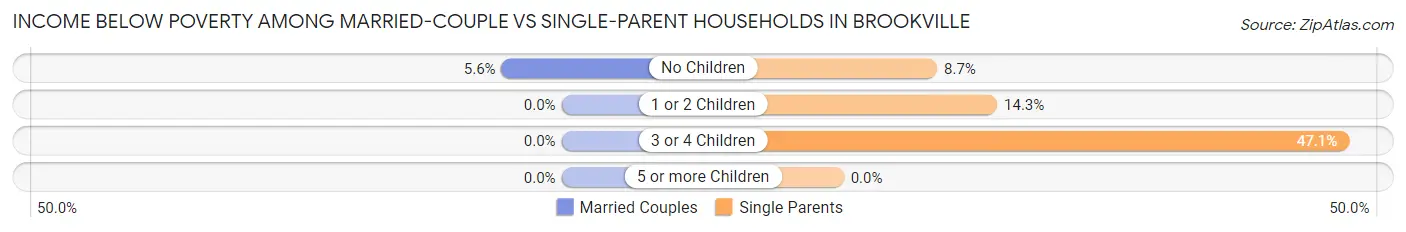
| Children | Married-Couple Families | Single-Parent Households |
| No Children | 19 (5.6%) | 6 (8.7%) |
| 1 or 2 Children | 0 (0.0%) | 9 (14.3%) |
| 3 or 4 Children | 0 (0.0%) | 8 (47.1%) |
| 5 or more Children | 0 (0.0%) | 0 (0.0%) |
| Total | 19 (3.8%) | 23 (15.4%) |
Race in Brookville
The most populous races in Brookville are White / Caucasian (2,543 | 97.1%), Hispanic or Latino (82 | 3.1%), and Some other Race (43 | 1.6%).
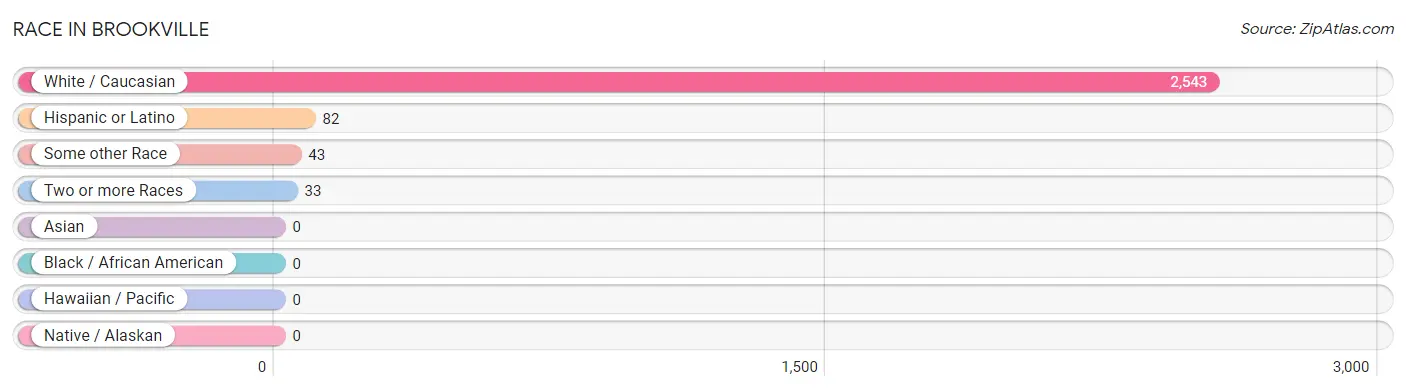
| Race | # Population | % Population |
| Asian | 0 | 0.0% |
| Black / African American | 0 | 0.0% |
| Hawaiian / Pacific | 0 | 0.0% |
| Hispanic or Latino | 82 | 3.1% |
| Native / Alaskan | 0 | 0.0% |
| White / Caucasian | 2,543 | 97.1% |
| Two or more Races | 33 | 1.3% |
| Some other Race | 43 | 1.6% |
| Total | 2,619 | 100.0% |
Ancestry in Brookville
The most populous ancestries reported in Brookville are German (721 | 27.5%), Irish (404 | 15.4%), English (351 | 13.4%), American (189 | 7.2%), and Scottish (89 | 3.4%), together accounting for 67.0% of all Brookville residents.
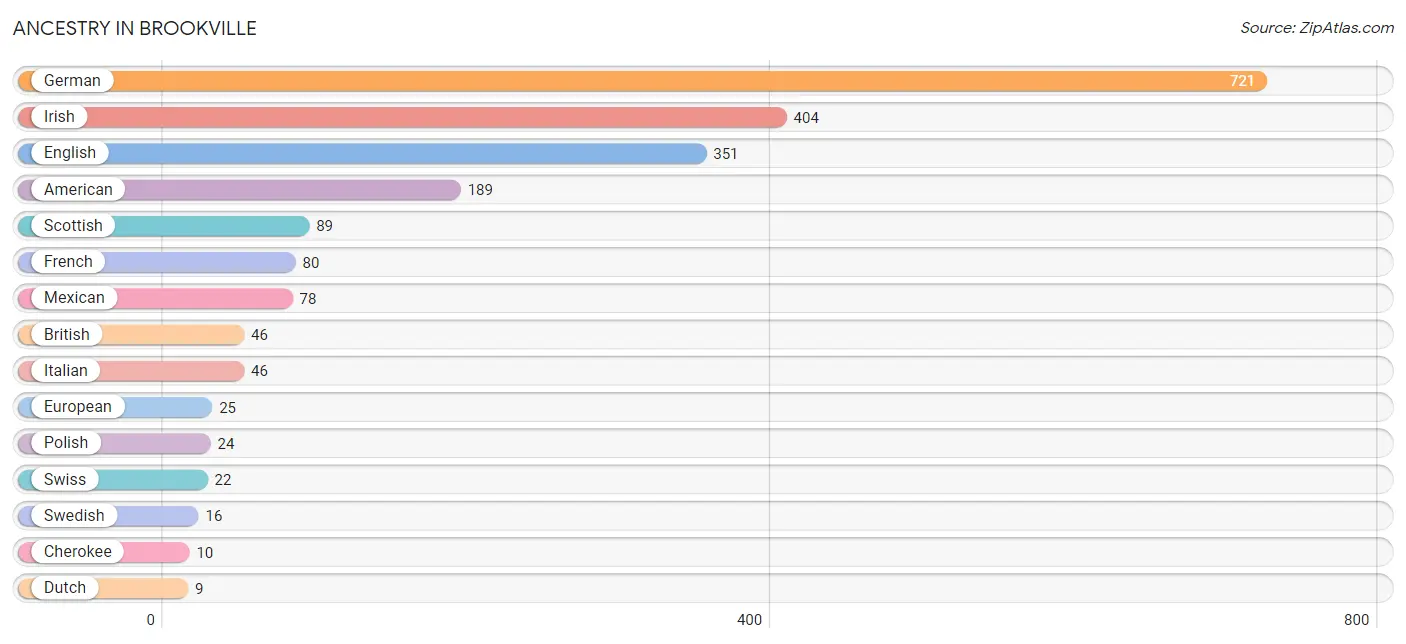
| Ancestry | # Population | % Population |
| American | 189 | 7.2% |
| British | 46 | 1.8% |
| Cherokee | 10 | 0.4% |
| Danish | 7 | 0.3% |
| Dutch | 9 | 0.3% |
| English | 351 | 13.4% |
| European | 25 | 0.9% |
| French | 80 | 3.0% |
| German | 721 | 27.5% |
| Irish | 404 | 15.4% |
| Italian | 46 | 1.8% |
| Mexican | 78 | 3.0% |
| Polish | 24 | 0.9% |
| Scottish | 89 | 3.4% |
| Slovene | 4 | 0.2% |
| Swedish | 16 | 0.6% |
| Swiss | 22 | 0.8% |
| Welsh | 6 | 0.2% | View All 18 Rows |
Immigrants in Brookville
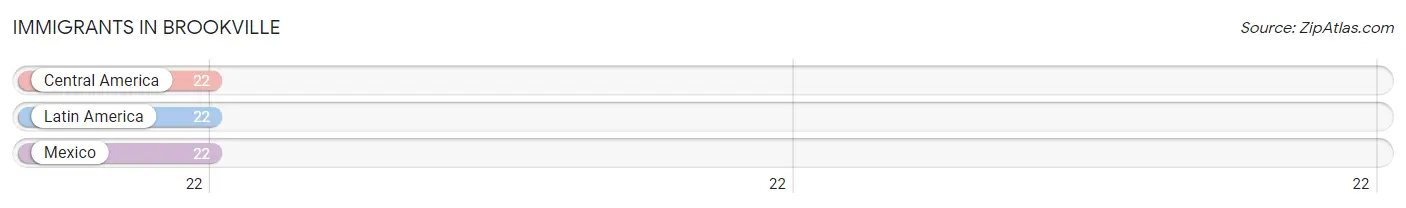
The most numerous immigrant groups reported in Brookville came from Central America (22 | 0.8%), Latin America (22 | 0.8%), and Mexico (22 | 0.8%), together accounting for 2.5% of all Brookville residents.
| Immigration Origin | # Population | % Population |
| Central America | 22 | 0.8% |
| Latin America | 22 | 0.8% |
| Mexico | 22 | 0.8% | View All 3 Rows |
Sex and Age in Brookville
Sex and Age in Brookville
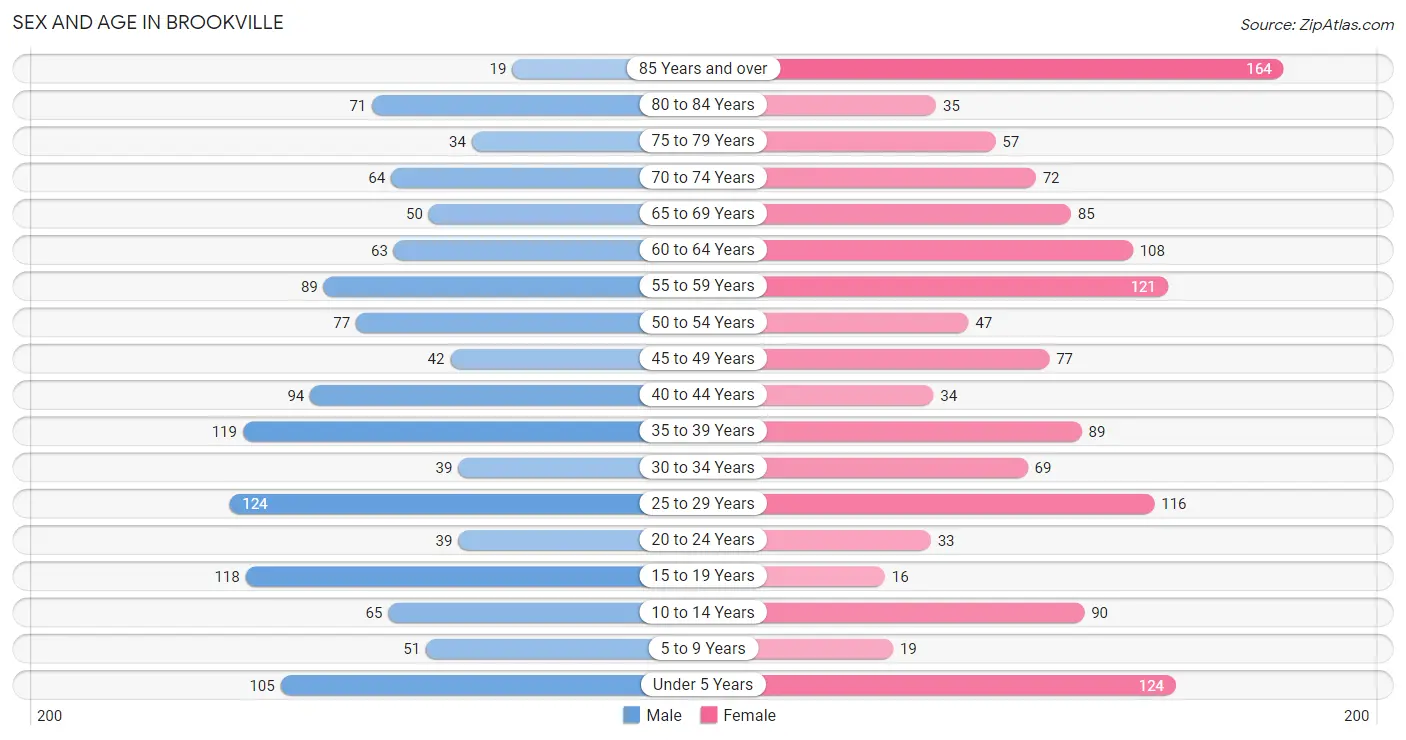
The most populous age groups in Brookville are 25 to 29 Years (124 | 9.8%) for men and 85 Years and over (164 | 12.1%) for women.
| Age Bracket | Male | Female |
| Under 5 Years | 105 (8.3%) | 124 (9.1%) |
| 5 to 9 Years | 51 (4.0%) | 19 (1.4%) |
| 10 to 14 Years | 65 (5.1%) | 90 (6.6%) |
| 15 to 19 Years | 118 (9.3%) | 16 (1.2%) |
| 20 to 24 Years | 39 (3.1%) | 33 (2.4%) |
| 25 to 29 Years | 124 (9.8%) | 116 (8.6%) |
| 30 to 34 Years | 39 (3.1%) | 69 (5.1%) |
| 35 to 39 Years | 119 (9.4%) | 89 (6.6%) |
| 40 to 44 Years | 94 (7.4%) | 34 (2.5%) |
| 45 to 49 Years | 42 (3.3%) | 77 (5.7%) |
| 50 to 54 Years | 77 (6.1%) | 47 (3.5%) |
| 55 to 59 Years | 89 (7.0%) | 121 (8.9%) |
| 60 to 64 Years | 63 (5.0%) | 108 (8.0%) |
| 65 to 69 Years | 50 (4.0%) | 85 (6.3%) |
| 70 to 74 Years | 64 (5.1%) | 72 (5.3%) |
| 75 to 79 Years | 34 (2.7%) | 57 (4.2%) |
| 80 to 84 Years | 71 (5.6%) | 35 (2.6%) |
| 85 Years and over | 19 (1.5%) | 164 (12.1%) |
| Total | 1,263 (100.0%) | 1,356 (100.0%) |
Families and Households in Brookville
Median Family Size in Brookville
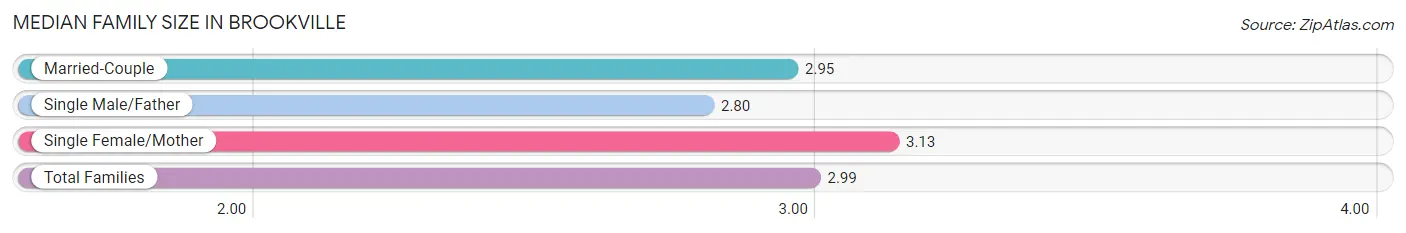
The median family size in Brookville is 2.99 persons per family, with single female/mother families (134 | 20.8%) accounting for the largest median family size of 3.13 persons per family. On the other hand, single male/father families (15 | 2.3%) represent the smallest median family size with 2.80 persons per family.
| Family Type | # Families | Family Size |
| Married-Couple | 496 (76.9%) | 2.95 |
| Single Male/Father | 15 (2.3%) | 2.80 |
| Single Female/Mother | 134 (20.8%) | 3.13 |
| Total Families | 645 (100.0%) | 2.99 |
Median Household Size in Brookville
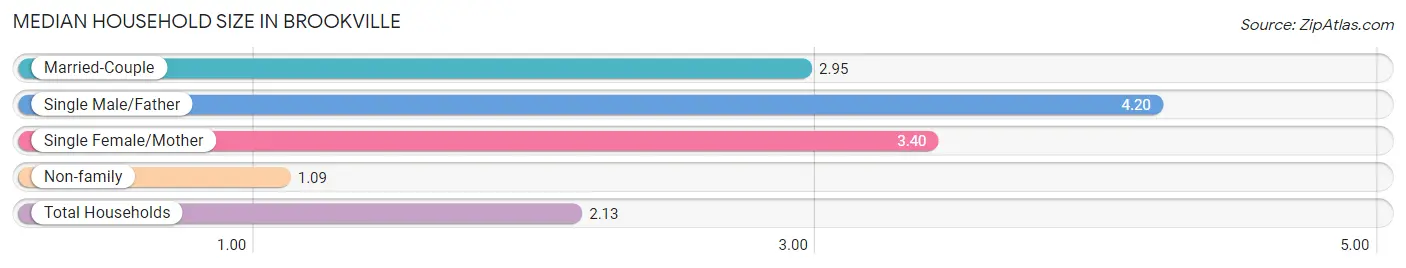
The median household size in Brookville is 2.13 persons per household, with single male/father households (15 | 1.2%) accounting for the largest median household size of 4.2 persons per household. non-family households (585 | 47.6%) represent the smallest median household size with 1.09 persons per household.
| Household Type | # Households | Household Size |
| Married-Couple | 496 (40.3%) | 2.95 |
| Single Male/Father | 15 (1.2%) | 4.20 |
| Single Female/Mother | 134 (10.9%) | 3.40 |
| Non-family | 585 (47.6%) | 1.09 |
| Total Households | 1,230 (100.0%) | 2.13 |
Household Size by Marriage Status in Brookville
Out of a total of 1,230 households in Brookville, 645 (52.4%) are family households, while 585 (47.6%) are nonfamily households. The most numerous type of family households are 2-person households, comprising 358, and the most common type of nonfamily households are 1-person households, comprising 548.
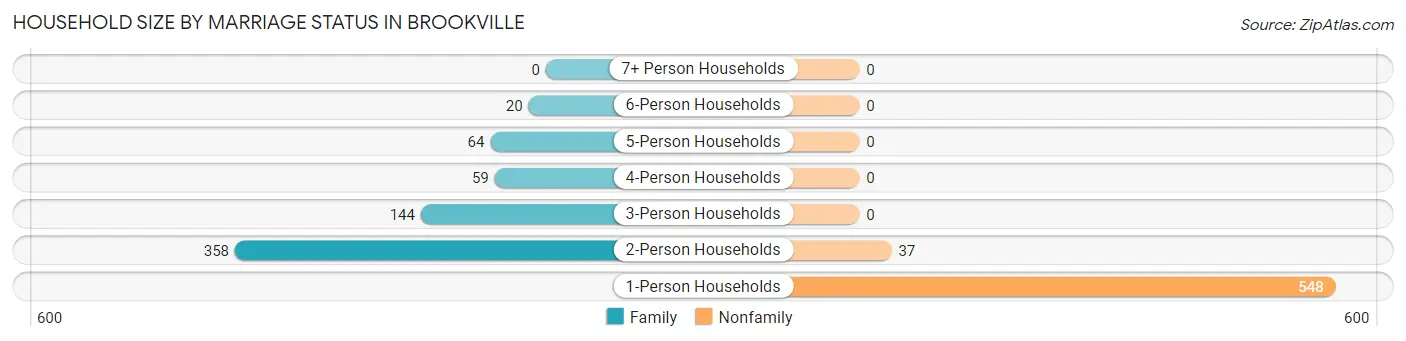
| Household Size | Family Households | Nonfamily Households |
| 1-Person Households | - | 548 (44.6%) |
| 2-Person Households | 358 (29.1%) | 37 (3.0%) |
| 3-Person Households | 144 (11.7%) | 0 (0.0%) |
| 4-Person Households | 59 (4.8%) | 0 (0.0%) |
| 5-Person Households | 64 (5.2%) | 0 (0.0%) |
| 6-Person Households | 20 (1.6%) | 0 (0.0%) |
| 7+ Person Households | 0 (0.0%) | 0 (0.0%) |
| Total | 645 (52.4%) | 585 (47.6%) |
Female Fertility in Brookville
Fertility by Age in Brookville
Average fertility rate in Brookville is 118.0 births per 1,000 women. Women in the age bracket of 20 to 34 years have the highest fertility rate with 234.0 births per 1,000 women. Women in the age bracket of 20 to 34 years acount for 100.0% of all women with births.
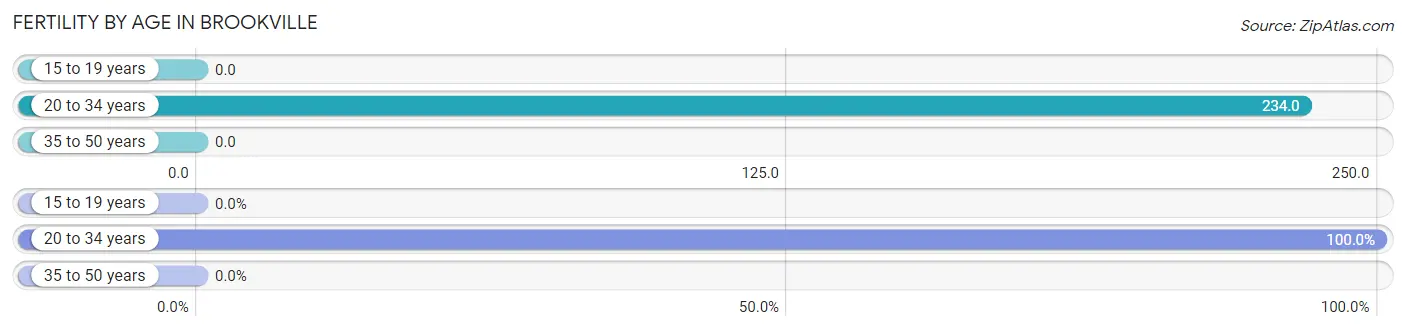
| Age Bracket | Women with Births | Births / 1,000 Women |
| 15 to 19 years | 0 (0.0%) | 0.0 |
| 20 to 34 years | 51 (100.0%) | 234.0 |
| 35 to 50 years | 0 (0.0%) | 0.0 |
| Total | 51 (100.0%) | 118.0 |
Fertility by Age by Marriage Status in Brookville
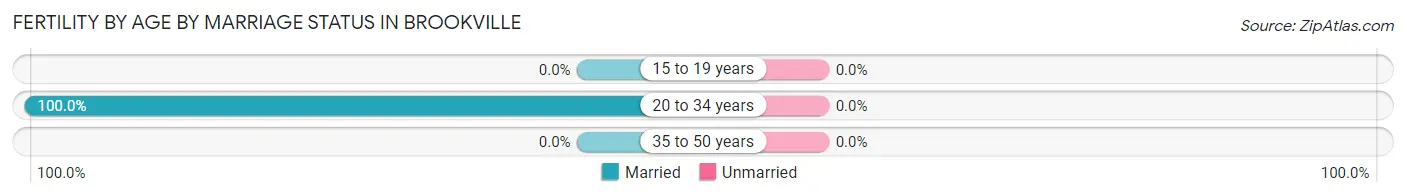
| Age Bracket | Married | Unmarried |
| 15 to 19 years | 0 (0.0%) | 0 (0.0%) |
| 20 to 34 years | 51 (100.0%) | 0 (0.0%) |
| 35 to 50 years | 0 (0.0%) | 0 (0.0%) |
| Total | 51 (100.0%) | 0 (0.0%) |
Fertility by Education in Brookville
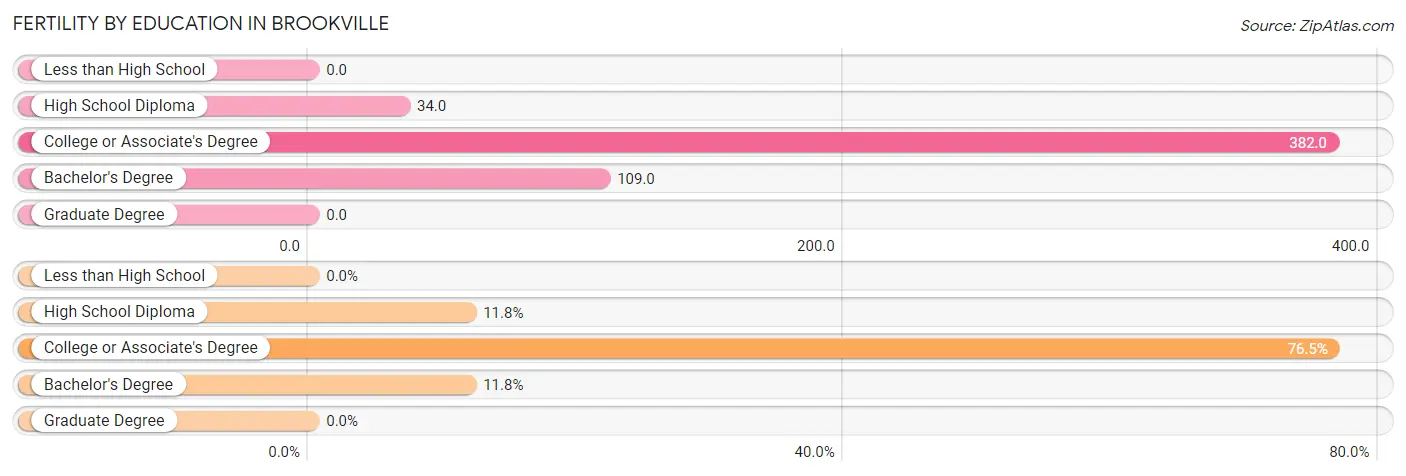
| Educational Attainment | Women with Births | Births / 1,000 Women |
| Less than High School | 0 (0.0%) | 0.0 |
| High School Diploma | 6 (11.8%) | 34.0 |
| College or Associate's Degree | 39 (76.5%) | 382.0 |
| Bachelor's Degree | 6 (11.8%) | 109.0 |
| Graduate Degree | 0 (0.0%) | 0.0 |
| Total | 51 (100.0%) | 118.0 |
Fertility by Education by Marriage Status in Brookville
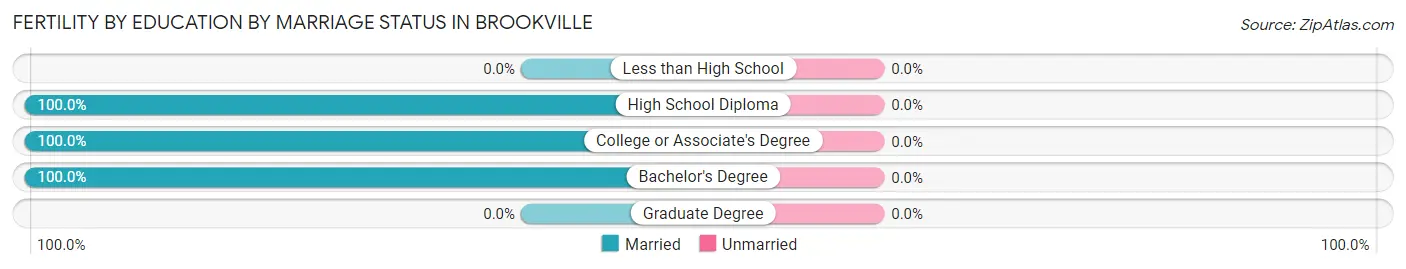
| Educational Attainment | Married | Unmarried |
| Less than High School | 0 (0.0%) | 0 (0.0%) |
| High School Diploma | 6 (100.0%) | 0 (0.0%) |
| College or Associate's Degree | 39 (100.0%) | 0 (0.0%) |
| Bachelor's Degree | 6 (100.0%) | 0 (0.0%) |
| Graduate Degree | 0 (0.0%) | 0 (0.0%) |
| Total | 51 (100.0%) | 0 (0.0%) |
Employment Characteristics in Brookville
Employment by Class of Employer in Brookville
Among the 1,255 employed individuals in Brookville, private company employees (863 | 68.8%), not-for-profit organizations (202 | 16.1%), and local government employees (107 | 8.5%) make up the most common classes of employment.
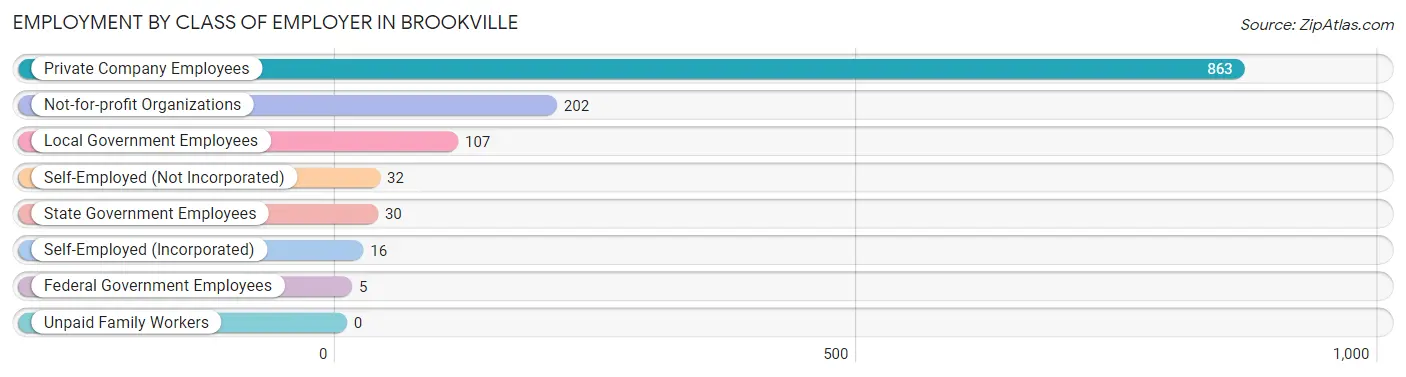
| Employer Class | # Employees | % Employees |
| Private Company Employees | 863 | 68.8% |
| Self-Employed (Incorporated) | 16 | 1.3% |
| Self-Employed (Not Incorporated) | 32 | 2.5% |
| Not-for-profit Organizations | 202 | 16.1% |
| Local Government Employees | 107 | 8.5% |
| State Government Employees | 30 | 2.4% |
| Federal Government Employees | 5 | 0.4% |
| Unpaid Family Workers | 0 | 0.0% |
| Total | 1,255 | 100.0% |
Employment Status by Age in Brookville
According to the labor force statistics for Brookville, out of the total population over 16 years of age (2,159), 58.8% or 1,269 individuals are in the labor force, with 0.6% or 8 of them unemployed. The age group with the highest labor force participation rate is 30 to 34 years, with 100.0% or 108 individuals in the labor force. Within the labor force, the 45 to 54 years age range has the highest percentage of unemployed individuals, with 3.8% or 7 of them being unemployed.
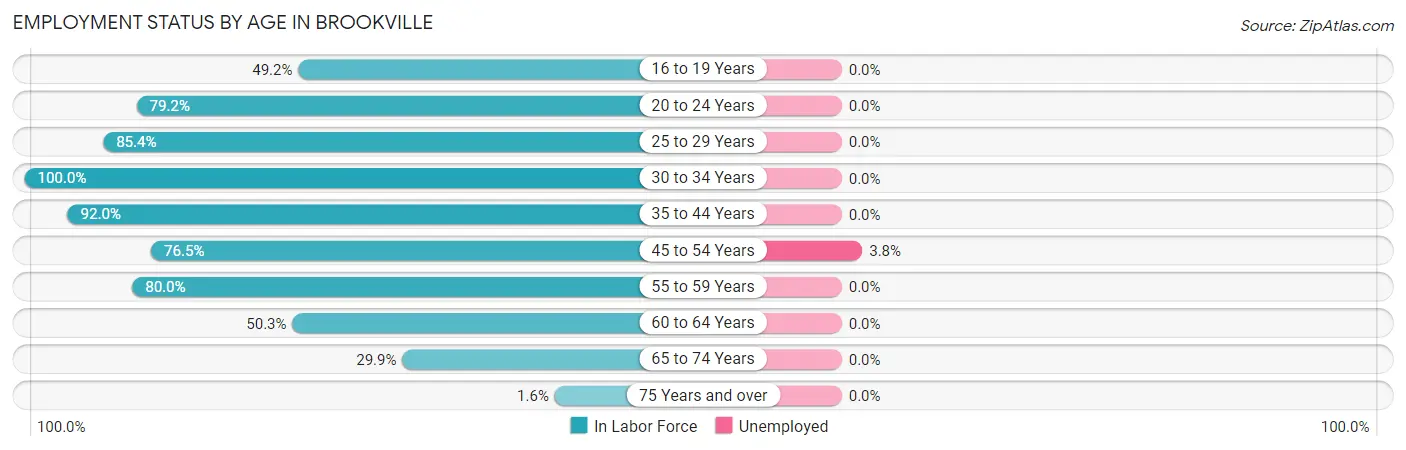
| Age Bracket | In Labor Force | Unemployed |
| 16 to 19 Years | 63 (49.2%) | 0 (0.0%) |
| 20 to 24 Years | 57 (79.2%) | 0 (0.0%) |
| 25 to 29 Years | 205 (85.4%) | 0 (0.0%) |
| 30 to 34 Years | 108 (100.0%) | 0 (0.0%) |
| 35 to 44 Years | 309 (92.0%) | 0 (0.0%) |
| 45 to 54 Years | 186 (76.5%) | 7 (3.8%) |
| 55 to 59 Years | 168 (80.0%) | 0 (0.0%) |
| 60 to 64 Years | 86 (50.3%) | 0 (0.0%) |
| 65 to 74 Years | 81 (29.9%) | 0 (0.0%) |
| 75 Years and over | 6 (1.6%) | 0 (0.0%) |
| Total | 1,269 (58.8%) | 8 (0.6%) |
Employment Status by Educational Attainment in Brookville
According to labor force statistics for Brookville, 81.2% of individuals (1,062) out of the total population between 25 and 64 years of age (1,308) are in the labor force, with 0.7% or 7 of them being unemployed. The group with the highest labor force participation rate are those with the educational attainment of bachelor's degree or higher, with 93.0% or 361 individuals in the labor force. Within the labor force, individuals with college / associate degree education have the highest percentage of unemployment, with 3.4% or 7 of them being unemployed.
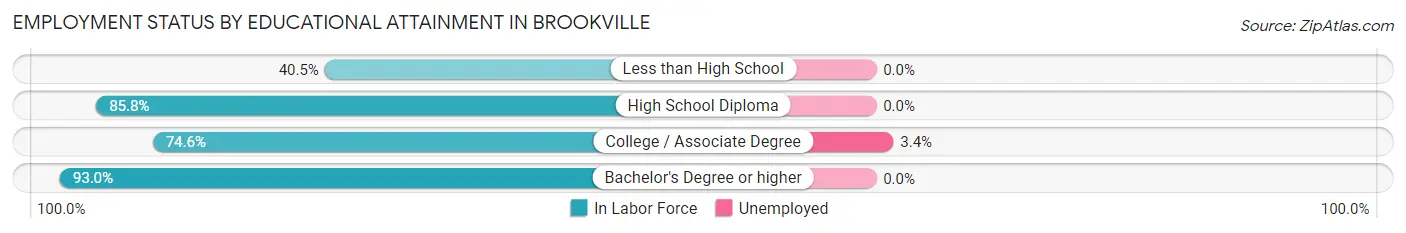
| Educational Attainment | In Labor Force | Unemployed |
| Less than High School | 51 (40.5%) | 0 (0.0%) |
| High School Diploma | 442 (85.8%) | 0 (0.0%) |
| College / Associate Degree | 208 (74.6%) | 9 (3.4%) |
| Bachelor's Degree or higher | 361 (93.0%) | 0 (0.0%) |
| Total | 1,062 (81.2%) | 9 (0.7%) |
Employment Occupations by Sex in Brookville
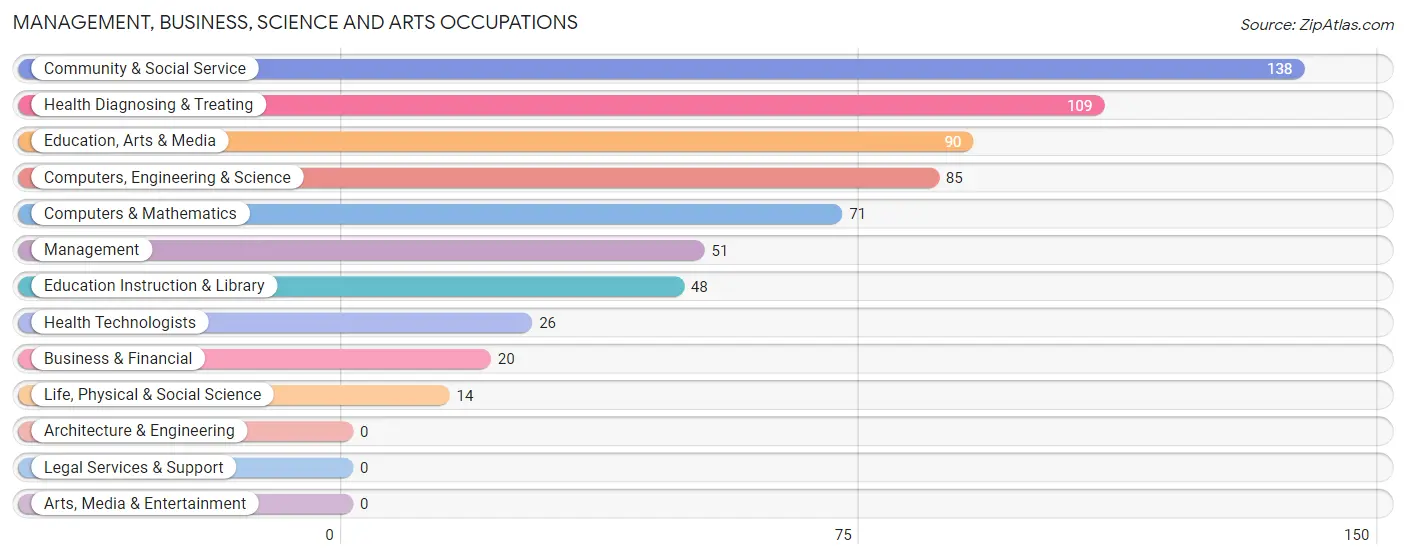
Management, Business, Science and Arts Occupations
The most common Management, Business, Science and Arts occupations in Brookville are Community & Social Service (138 | 10.9%), Health Diagnosing & Treating (109 | 8.6%), Education, Arts & Media (90 | 7.1%), Computers, Engineering & Science (85 | 6.7%), and Computers & Mathematics (71 | 5.6%).
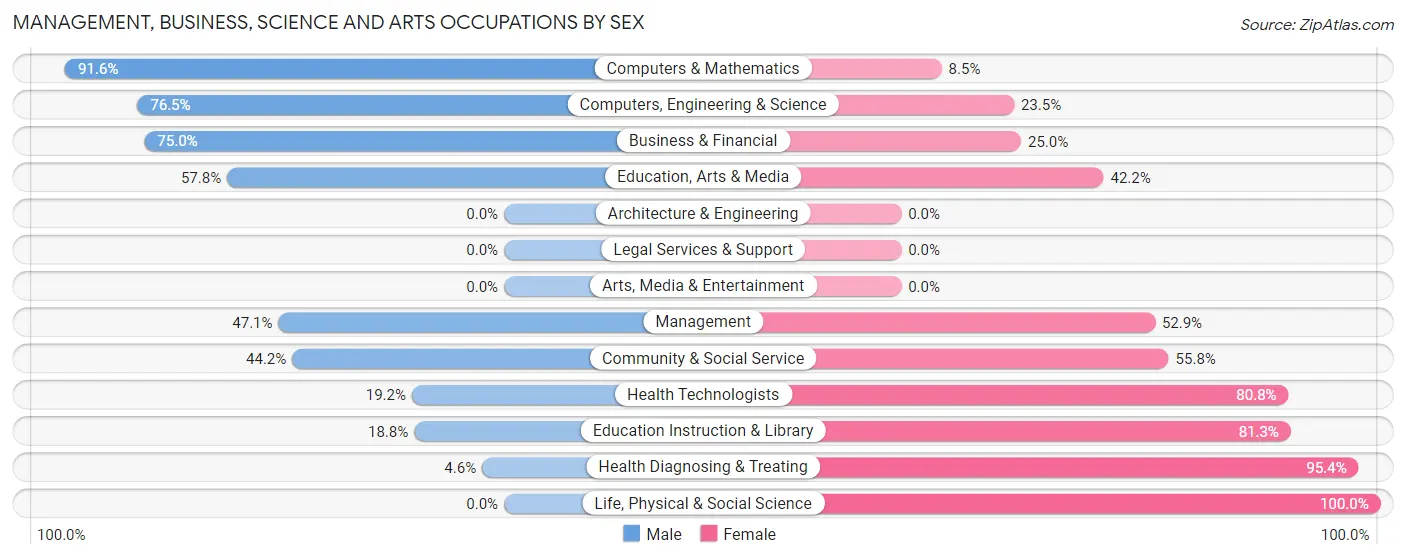
Management, Business, Science and Arts Occupations by Sex
Within the Management, Business, Science and Arts occupations in Brookville, the most male-oriented occupations are Computers & Mathematics (91.5%), Computers, Engineering & Science (76.5%), and Business & Financial (75.0%), while the most female-oriented occupations are Life, Physical & Social Science (100.0%), Health Diagnosing & Treating (95.4%), and Education Instruction & Library (81.2%).
| Occupation | Male | Female |
| Management | 24 (47.1%) | 27 (52.9%) |
| Business & Financial | 15 (75.0%) | 5 (25.0%) |
| Computers, Engineering & Science | 65 (76.5%) | 20 (23.5%) |
| Computers & Mathematics | 65 (91.5%) | 6 (8.5%) |
| Architecture & Engineering | 0 (0.0%) | 0 (0.0%) |
| Life, Physical & Social Science | 0 (0.0%) | 14 (100.0%) |
| Community & Social Service | 61 (44.2%) | 77 (55.8%) |
| Education, Arts & Media | 52 (57.8%) | 38 (42.2%) |
| Legal Services & Support | 0 (0.0%) | 0 (0.0%) |
| Education Instruction & Library | 9 (18.8%) | 39 (81.2%) |
| Arts, Media & Entertainment | 0 (0.0%) | 0 (0.0%) |
| Health Diagnosing & Treating | 5 (4.6%) | 104 (95.4%) |
| Health Technologists | 5 (19.2%) | 21 (80.8%) |
| Total (Category) | 170 (42.2%) | 233 (57.8%) |
| Total (Overall) | 718 (56.9%) | 544 (43.1%) |
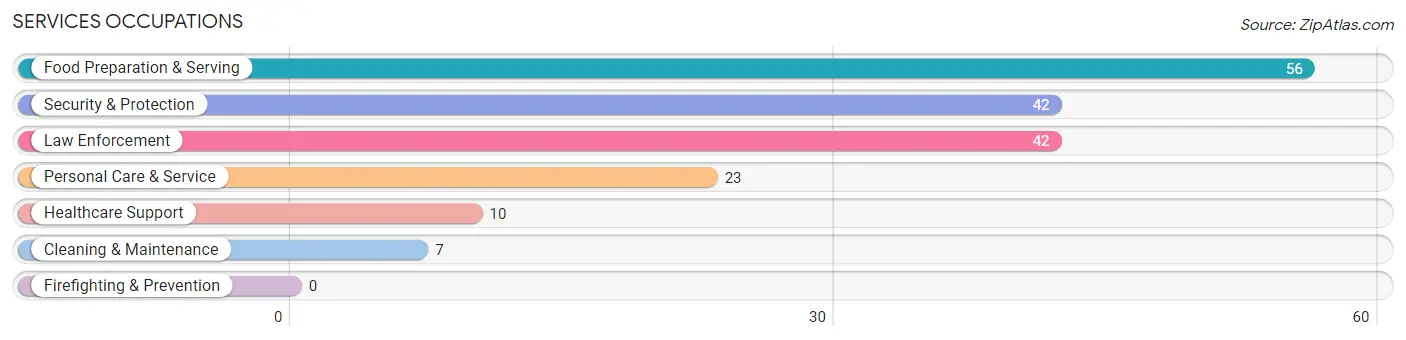
Services Occupations
The most common Services occupations in Brookville are Food Preparation & Serving (56 | 4.4%), Security & Protection (42 | 3.3%), Law Enforcement (42 | 3.3%), Personal Care & Service (23 | 1.8%), and Healthcare Support (10 | 0.8%).
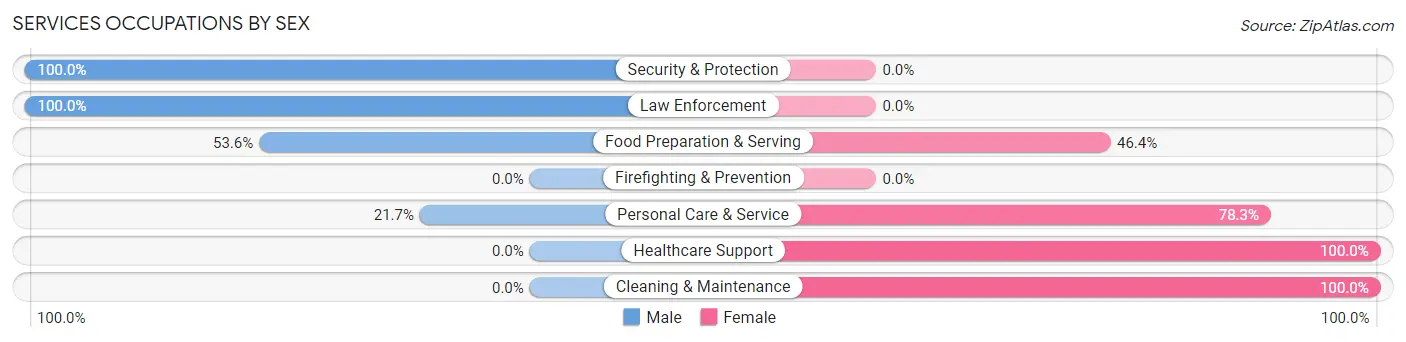
Services Occupations by Sex
Within the Services occupations in Brookville, the most male-oriented occupations are Security & Protection (100.0%), Law Enforcement (100.0%), and Food Preparation & Serving (53.6%), while the most female-oriented occupations are Healthcare Support (100.0%), Cleaning & Maintenance (100.0%), and Personal Care & Service (78.3%).
| Occupation | Male | Female |
| Healthcare Support | 0 (0.0%) | 10 (100.0%) |
| Security & Protection | 42 (100.0%) | 0 (0.0%) |
| Firefighting & Prevention | 0 (0.0%) | 0 (0.0%) |
| Law Enforcement | 42 (100.0%) | 0 (0.0%) |
| Food Preparation & Serving | 30 (53.6%) | 26 (46.4%) |
| Cleaning & Maintenance | 0 (0.0%) | 7 (100.0%) |
| Personal Care & Service | 5 (21.7%) | 18 (78.3%) |
| Total (Category) | 77 (55.8%) | 61 (44.2%) |
| Total (Overall) | 718 (56.9%) | 544 (43.1%) |
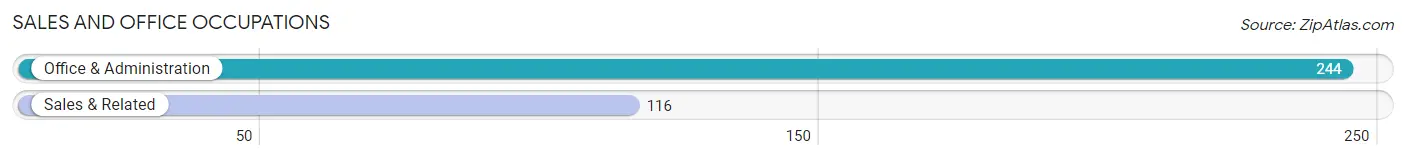
Sales and Office Occupations
The most common Sales and Office occupations in Brookville are Office & Administration (244 | 19.3%), and Sales & Related (116 | 9.2%).
Sales and Office Occupations by Sex
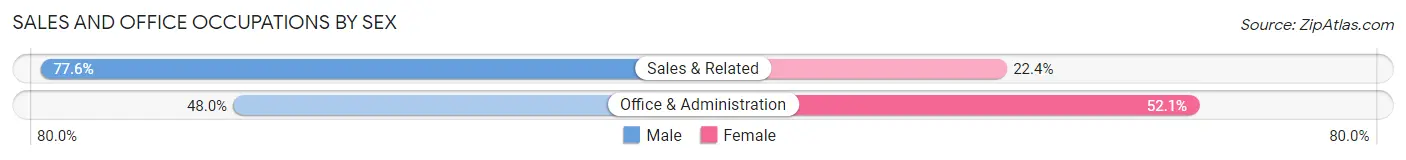
| Occupation | Male | Female |
| Sales & Related | 90 (77.6%) | 26 (22.4%) |
| Office & Administration | 117 (47.9%) | 127 (52.0%) |
| Total (Category) | 207 (57.5%) | 153 (42.5%) |
| Total (Overall) | 718 (56.9%) | 544 (43.1%) |
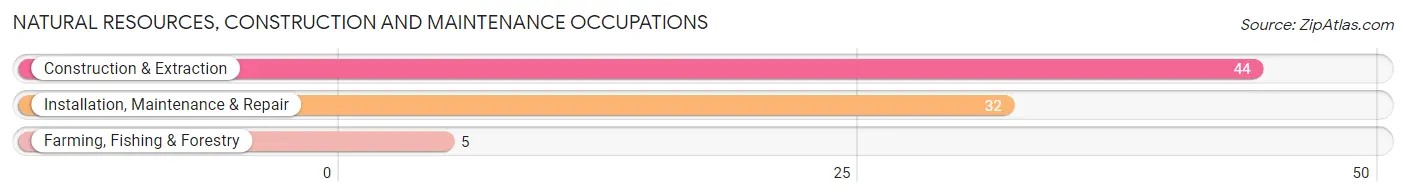
Natural Resources, Construction and Maintenance Occupations
The most common Natural Resources, Construction and Maintenance occupations in Brookville are Construction & Extraction (44 | 3.5%), Installation, Maintenance & Repair (32 | 2.5%), and Farming, Fishing & Forestry (5 | 0.4%).
Natural Resources, Construction and Maintenance Occupations by Sex
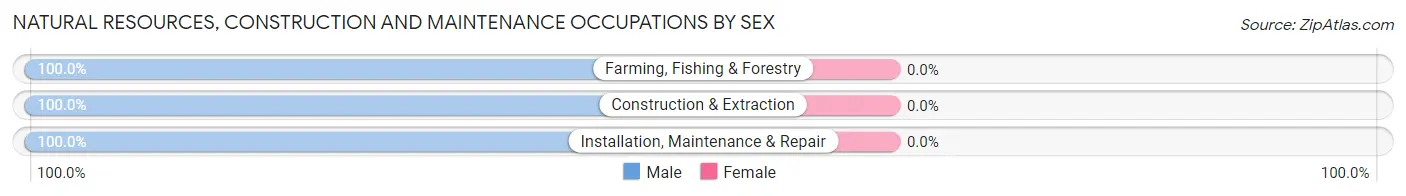
| Occupation | Male | Female |
| Farming, Fishing & Forestry | 5 (100.0%) | 0 (0.0%) |
| Construction & Extraction | 44 (100.0%) | 0 (0.0%) |
| Installation, Maintenance & Repair | 32 (100.0%) | 0 (0.0%) |
| Total (Category) | 81 (100.0%) | 0 (0.0%) |
| Total (Overall) | 718 (56.9%) | 544 (43.1%) |
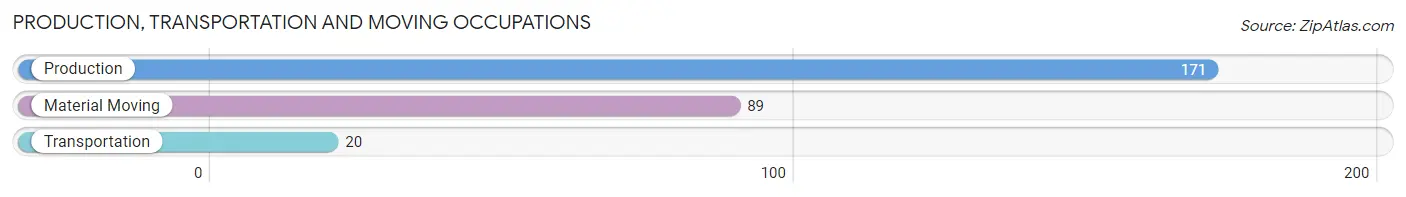
Production, Transportation and Moving Occupations
The most common Production, Transportation and Moving occupations in Brookville are Production (171 | 13.6%), Material Moving (89 | 7.0%), and Transportation (20 | 1.6%).
Production, Transportation and Moving Occupations by Sex
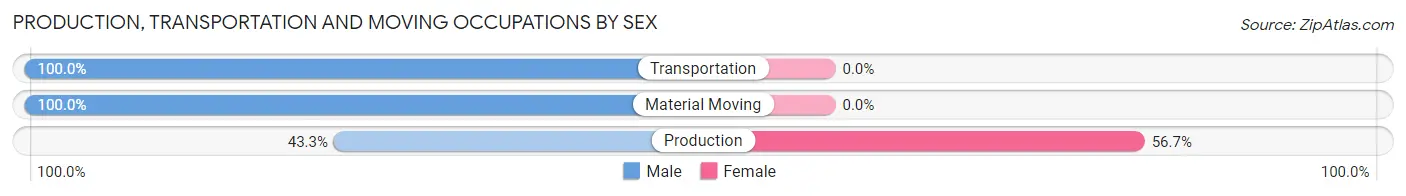
| Occupation | Male | Female |
| Production | 74 (43.3%) | 97 (56.7%) |
| Transportation | 20 (100.0%) | 0 (0.0%) |
| Material Moving | 89 (100.0%) | 0 (0.0%) |
| Total (Category) | 183 (65.4%) | 97 (34.6%) |
| Total (Overall) | 718 (56.9%) | 544 (43.1%) |
Employment Industries by Sex in Brookville
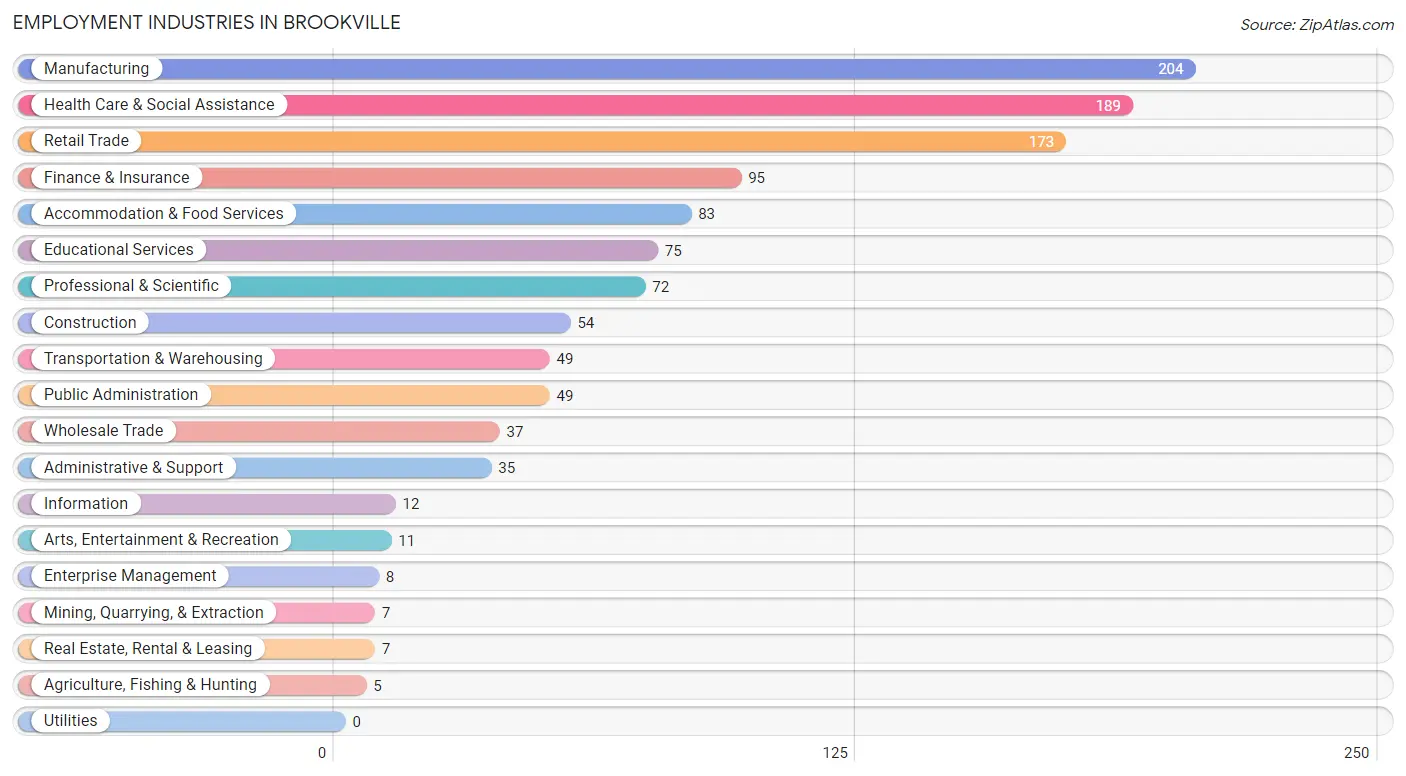
Employment Industries in Brookville
The major employment industries in Brookville include Manufacturing (204 | 16.2%), Health Care & Social Assistance (189 | 15.0%), Retail Trade (173 | 13.7%), Finance & Insurance (95 | 7.5%), and Accommodation & Food Services (83 | 6.6%).
Employment Industries by Sex in Brookville
The Brookville industries that see more men than women are Agriculture, Fishing & Hunting (100.0%), Mining, Quarrying, & Extraction (100.0%), and Transportation & Warehousing (100.0%), whereas the industries that tend to have a higher number of women are Real Estate, Rental & Leasing (100.0%), Health Care & Social Assistance (97.4%), and Educational Services (88.0%).
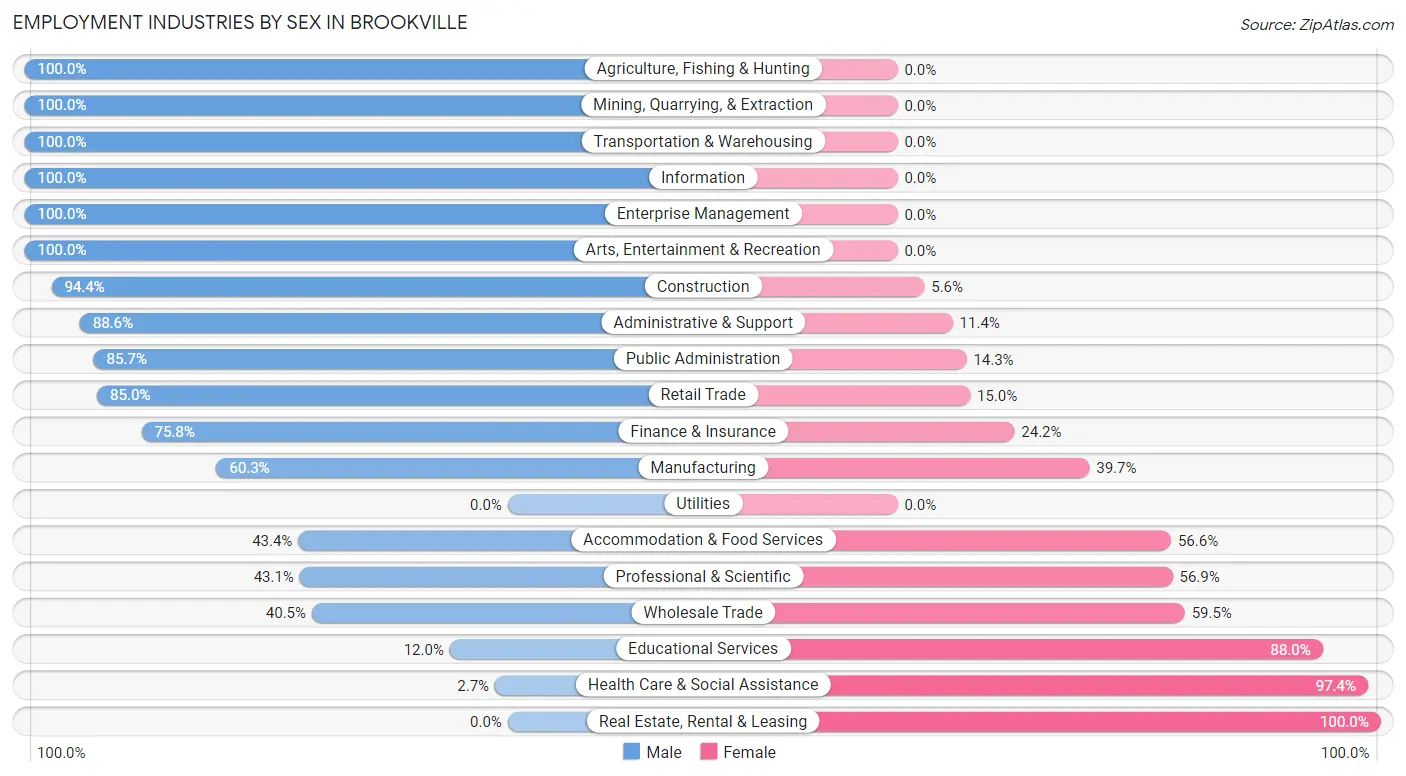
| Industry | Male | Female |
| Agriculture, Fishing & Hunting | 5 (100.0%) | 0 (0.0%) |
| Mining, Quarrying, & Extraction | 7 (100.0%) | 0 (0.0%) |
| Construction | 51 (94.4%) | 3 (5.6%) |
| Manufacturing | 123 (60.3%) | 81 (39.7%) |
| Wholesale Trade | 15 (40.5%) | 22 (59.5%) |
| Retail Trade | 147 (85.0%) | 26 (15.0%) |
| Transportation & Warehousing | 49 (100.0%) | 0 (0.0%) |
| Utilities | 0 (0.0%) | 0 (0.0%) |
| Information | 12 (100.0%) | 0 (0.0%) |
| Finance & Insurance | 72 (75.8%) | 23 (24.2%) |
| Real Estate, Rental & Leasing | 0 (0.0%) | 7 (100.0%) |
| Professional & Scientific | 31 (43.1%) | 41 (56.9%) |
| Enterprise Management | 8 (100.0%) | 0 (0.0%) |
| Administrative & Support | 31 (88.6%) | 4 (11.4%) |
| Educational Services | 9 (12.0%) | 66 (88.0%) |
| Health Care & Social Assistance | 5 (2.6%) | 184 (97.4%) |
| Arts, Entertainment & Recreation | 11 (100.0%) | 0 (0.0%) |
| Accommodation & Food Services | 36 (43.4%) | 47 (56.6%) |
| Public Administration | 42 (85.7%) | 7 (14.3%) |
| Total | 718 (56.9%) | 544 (43.1%) |
Education in Brookville
School Enrollment in Brookville
The most common levels of schooling among the 433 students in Brookville are high school (123 | 28.4%), graduate / professional (96 | 22.2%), and middle school (72 | 16.6%).
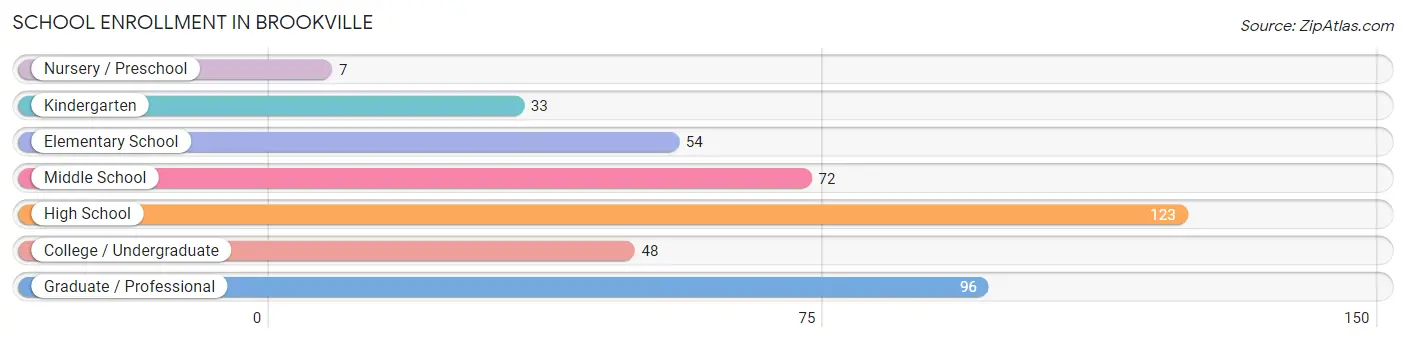
| School Level | # Students | % Students |
| Nursery / Preschool | 7 | 1.6% |
| Kindergarten | 33 | 7.6% |
| Elementary School | 54 | 12.5% |
| Middle School | 72 | 16.6% |
| High School | 123 | 28.4% |
| College / Undergraduate | 48 | 11.1% |
| Graduate / Professional | 96 | 22.2% |
| Total | 433 | 100.0% |
School Enrollment by Age by Funding Source in Brookville
Out of a total of 433 students who are enrolled in schools in Brookville, 79 (18.2%) attend a private institution, while the remaining 354 (81.8%) are enrolled in public schools. The age group of 35 years and over has the highest likelihood of being enrolled in private schools, with 38 (67.9% in the age bracket) enrolled. Conversely, the age group of 15 to 17 year olds has the lowest likelihood of being enrolled in a private school, with 48 (100.0% in the age bracket) attending a public institution.
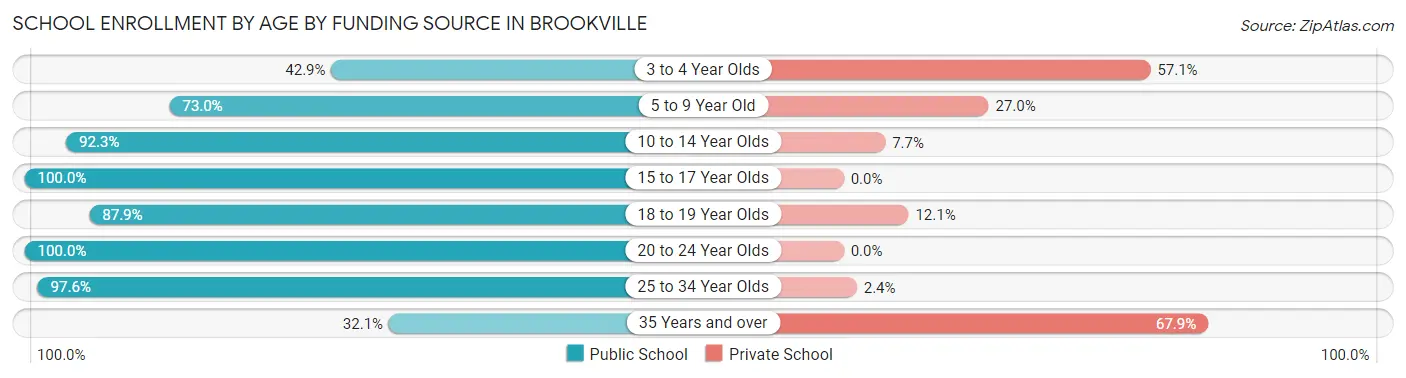
| Age Bracket | Public School | Private School |
| 3 to 4 Year Olds | 3 (42.9%) | 4 (57.1%) |
| 5 to 9 Year Old | 46 (73.0%) | 17 (27.0%) |
| 10 to 14 Year Olds | 143 (92.3%) | 12 (7.7%) |
| 15 to 17 Year Olds | 48 (100.0%) | 0 (0.0%) |
| 18 to 19 Year Olds | 51 (87.9%) | 7 (12.1%) |
| 20 to 24 Year Olds | 5 (100.0%) | 0 (0.0%) |
| 25 to 34 Year Olds | 40 (97.6%) | 1 (2.4%) |
| 35 Years and over | 18 (32.1%) | 38 (67.9%) |
| Total | 354 (81.8%) | 79 (18.2%) |
Educational Attainment by Field of Study in Brookville
Education (108 | 21.5%), business (102 | 20.3%), science & technology (71 | 14.1%), arts & humanities (55 | 11.0%), and bio, nature & agricultural (42 | 8.4%) are the most common fields of study among 502 individuals in Brookville who have obtained a bachelor's degree or higher.
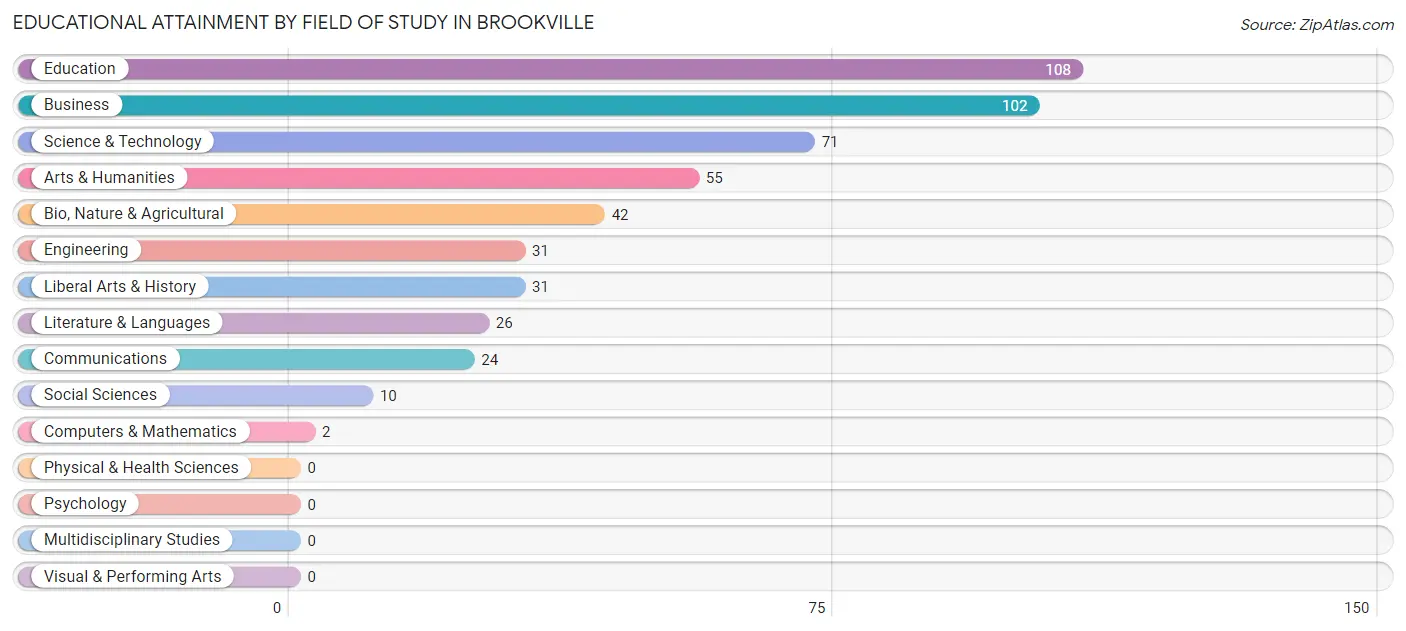
| Field of Study | # Graduates | % Graduates |
| Computers & Mathematics | 2 | 0.4% |
| Bio, Nature & Agricultural | 42 | 8.4% |
| Physical & Health Sciences | 0 | 0.0% |
| Psychology | 0 | 0.0% |
| Social Sciences | 10 | 2.0% |
| Engineering | 31 | 6.2% |
| Multidisciplinary Studies | 0 | 0.0% |
| Science & Technology | 71 | 14.1% |
| Business | 102 | 20.3% |
| Education | 108 | 21.5% |
| Literature & Languages | 26 | 5.2% |
| Liberal Arts & History | 31 | 6.2% |
| Visual & Performing Arts | 0 | 0.0% |
| Communications | 24 | 4.8% |
| Arts & Humanities | 55 | 11.0% |
| Total | 502 | 100.0% |
Transportation & Commute in Brookville
Vehicle Availability by Sex in Brookville
The most prevalent vehicle ownership categories in Brookville are males with 2 vehicles (442, accounting for 62.2%) and females with 2 vehicles (364, making up 81.2%).
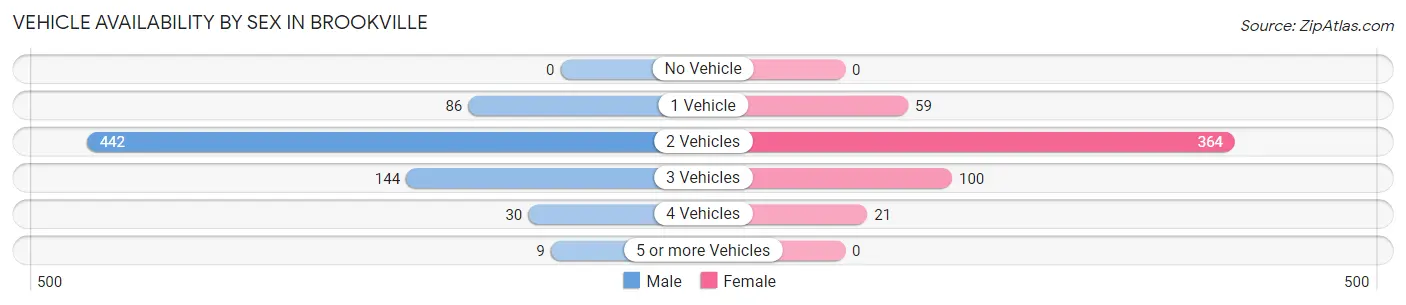
| Vehicles Available | Male | Female |
| No Vehicle | 0 (0.0%) | 0 (0.0%) |
| 1 Vehicle | 86 (12.1%) | 59 (10.8%) |
| 2 Vehicles | 442 (62.2%) | 364 (66.9%) |
| 3 Vehicles | 144 (20.3%) | 100 (18.4%) |
| 4 Vehicles | 30 (4.2%) | 21 (3.9%) |
| 5 or more Vehicles | 9 (1.3%) | 0 (0.0%) |
| Total | 711 (100.0%) | 544 (100.0%) |
Commute Time in Brookville
The most frequently occuring commute durations in Brookville are 10 to 14 minutes (158 commuters, 13.7%), 5 to 9 minutes (148 commuters, 12.9%), and 45 to 59 minutes (139 commuters, 12.1%).
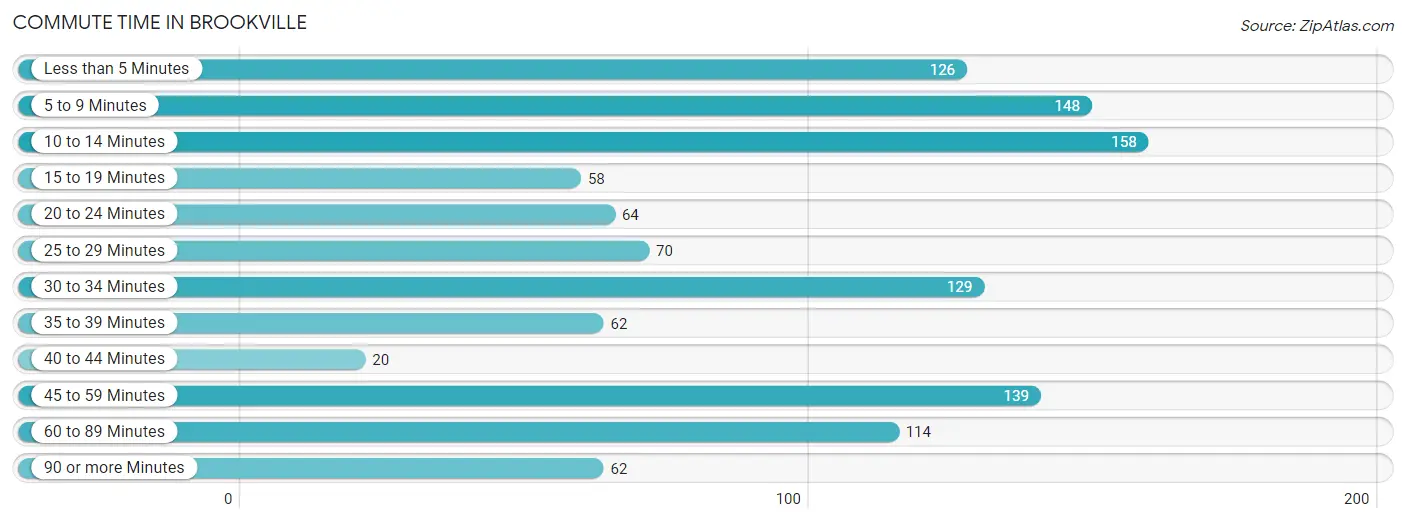
| Commute Time | # Commuters | % Commuters |
| Less than 5 Minutes | 126 | 11.0% |
| 5 to 9 Minutes | 148 | 12.9% |
| 10 to 14 Minutes | 158 | 13.7% |
| 15 to 19 Minutes | 58 | 5.0% |
| 20 to 24 Minutes | 64 | 5.6% |
| 25 to 29 Minutes | 70 | 6.1% |
| 30 to 34 Minutes | 129 | 11.2% |
| 35 to 39 Minutes | 62 | 5.4% |
| 40 to 44 Minutes | 20 | 1.7% |
| 45 to 59 Minutes | 139 | 12.1% |
| 60 to 89 Minutes | 114 | 9.9% |
| 90 or more Minutes | 62 | 5.4% |
Commute Time by Sex in Brookville
The most common commute times in Brookville are 5 to 9 minutes (108 commuters, 16.6%) for males and 30 to 34 minutes (85 commuters, 17.1%) for females.
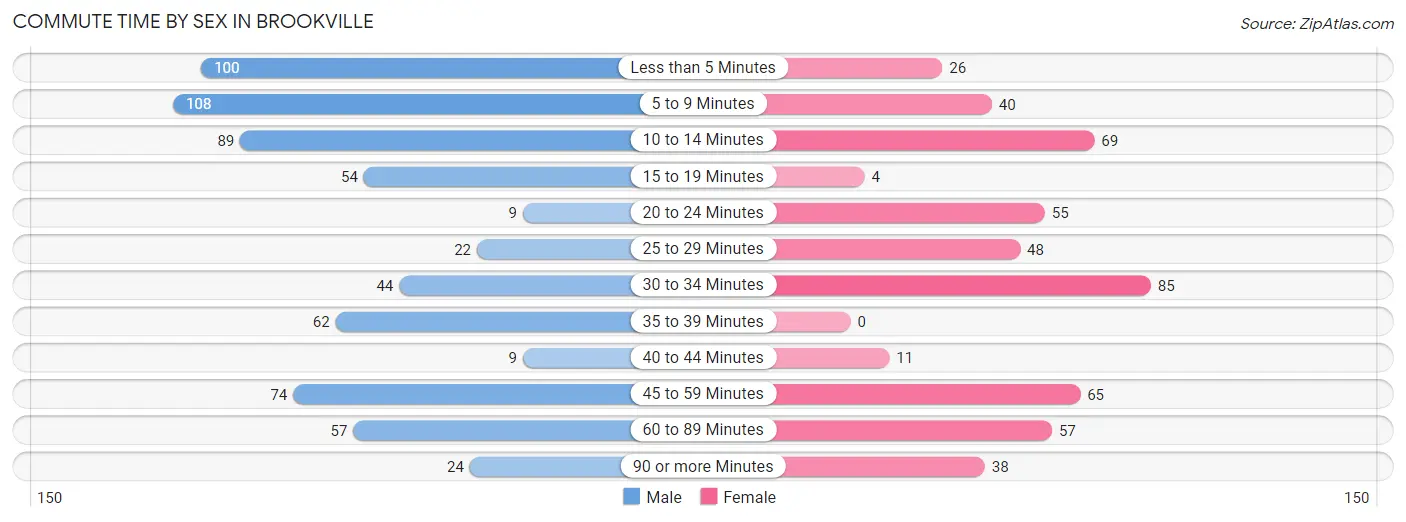
| Commute Time | Male | Female |
| Less than 5 Minutes | 100 (15.3%) | 26 (5.2%) |
| 5 to 9 Minutes | 108 (16.6%) | 40 (8.0%) |
| 10 to 14 Minutes | 89 (13.7%) | 69 (13.9%) |
| 15 to 19 Minutes | 54 (8.3%) | 4 (0.8%) |
| 20 to 24 Minutes | 9 (1.4%) | 55 (11.0%) |
| 25 to 29 Minutes | 22 (3.4%) | 48 (9.6%) |
| 30 to 34 Minutes | 44 (6.8%) | 85 (17.1%) |
| 35 to 39 Minutes | 62 (9.5%) | 0 (0.0%) |
| 40 to 44 Minutes | 9 (1.4%) | 11 (2.2%) |
| 45 to 59 Minutes | 74 (11.4%) | 65 (13.1%) |
| 60 to 89 Minutes | 57 (8.7%) | 57 (11.5%) |
| 90 or more Minutes | 24 (3.7%) | 38 (7.6%) |
Time of Departure to Work by Sex in Brookville
The most frequent times of departure to work in Brookville are 6:00 AM to 6:29 AM (138, 21.2%) for males and 12:00 AM to 4:59 AM (98, 19.7%) for females.
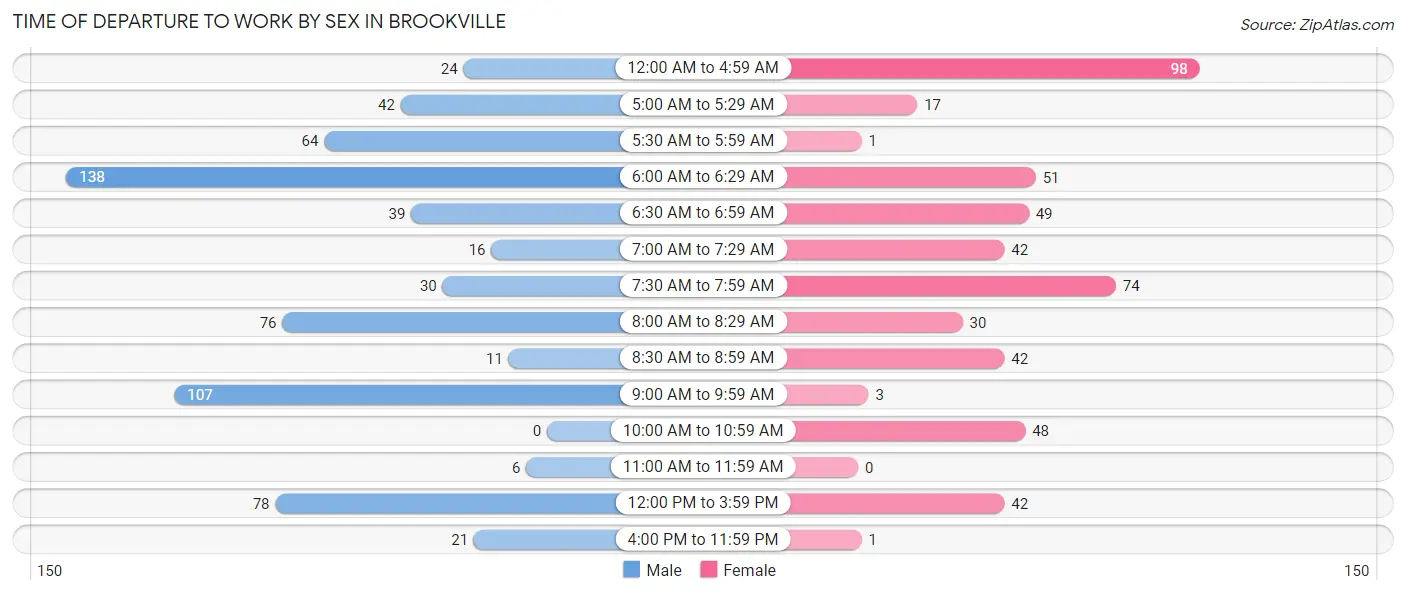
| Time of Departure | Male | Female |
| 12:00 AM to 4:59 AM | 24 (3.7%) | 98 (19.7%) |
| 5:00 AM to 5:29 AM | 42 (6.4%) | 17 (3.4%) |
| 5:30 AM to 5:59 AM | 64 (9.8%) | 1 (0.2%) |
| 6:00 AM to 6:29 AM | 138 (21.2%) | 51 (10.2%) |
| 6:30 AM to 6:59 AM | 39 (6.0%) | 49 (9.8%) |
| 7:00 AM to 7:29 AM | 16 (2.5%) | 42 (8.4%) |
| 7:30 AM to 7:59 AM | 30 (4.6%) | 74 (14.9%) |
| 8:00 AM to 8:29 AM | 76 (11.7%) | 30 (6.0%) |
| 8:30 AM to 8:59 AM | 11 (1.7%) | 42 (8.4%) |
| 9:00 AM to 9:59 AM | 107 (16.4%) | 3 (0.6%) |
| 10:00 AM to 10:59 AM | 0 (0.0%) | 48 (9.6%) |
| 11:00 AM to 11:59 AM | 6 (0.9%) | 0 (0.0%) |
| 12:00 PM to 3:59 PM | 78 (12.0%) | 42 (8.4%) |
| 4:00 PM to 11:59 PM | 21 (3.2%) | 1 (0.2%) |
| Total | 652 (100.0%) | 498 (100.0%) |
Housing Occupancy in Brookville
Occupancy by Ownership in Brookville
Of the total 1,230 dwellings in Brookville, owner-occupied units account for 640 (52.0%), while renter-occupied units make up 590 (48.0%).
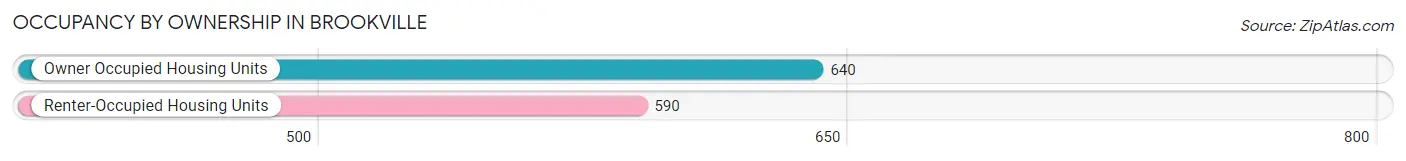
| Occupancy | # Housing Units | % Housing Units |
| Owner Occupied Housing Units | 640 | 52.0% |
| Renter-Occupied Housing Units | 590 | 48.0% |
| Total Occupied Housing Units | 1,230 | 100.0% |
Occupancy by Household Size in Brookville
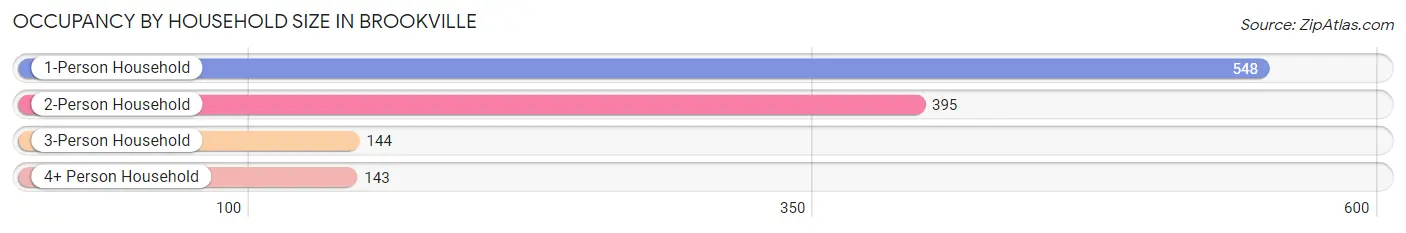
| Household Size | # Housing Units | % Housing Units |
| 1-Person Household | 548 | 44.6% |
| 2-Person Household | 395 | 32.1% |
| 3-Person Household | 144 | 11.7% |
| 4+ Person Household | 143 | 11.6% |
| Total Housing Units | 1,230 | 100.0% |
Occupancy by Ownership by Household Size in Brookville
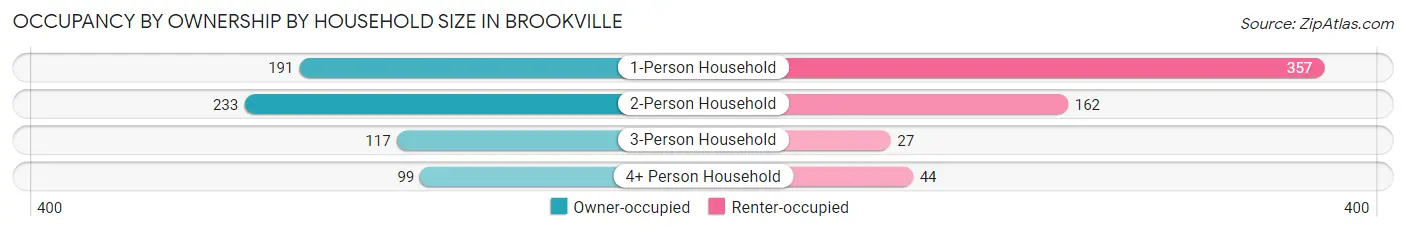
| Household Size | Owner-occupied | Renter-occupied |
| 1-Person Household | 191 (34.8%) | 357 (65.1%) |
| 2-Person Household | 233 (59.0%) | 162 (41.0%) |
| 3-Person Household | 117 (81.2%) | 27 (18.8%) |
| 4+ Person Household | 99 (69.2%) | 44 (30.8%) |
| Total Housing Units | 640 (52.0%) | 590 (48.0%) |
Occupancy by Educational Attainment in Brookville
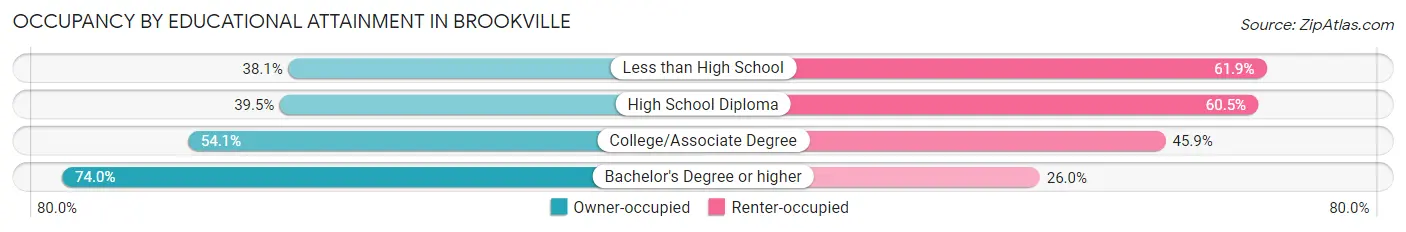
| Household Size | Owner-occupied | Renter-occupied |
| Less than High School | 53 (38.1%) | 86 (61.9%) |
| High School Diploma | 191 (39.5%) | 293 (60.5%) |
| College/Associate Degree | 145 (54.1%) | 123 (45.9%) |
| Bachelor's Degree or higher | 251 (74.0%) | 88 (26.0%) |
Occupancy by Age of Householder in Brookville
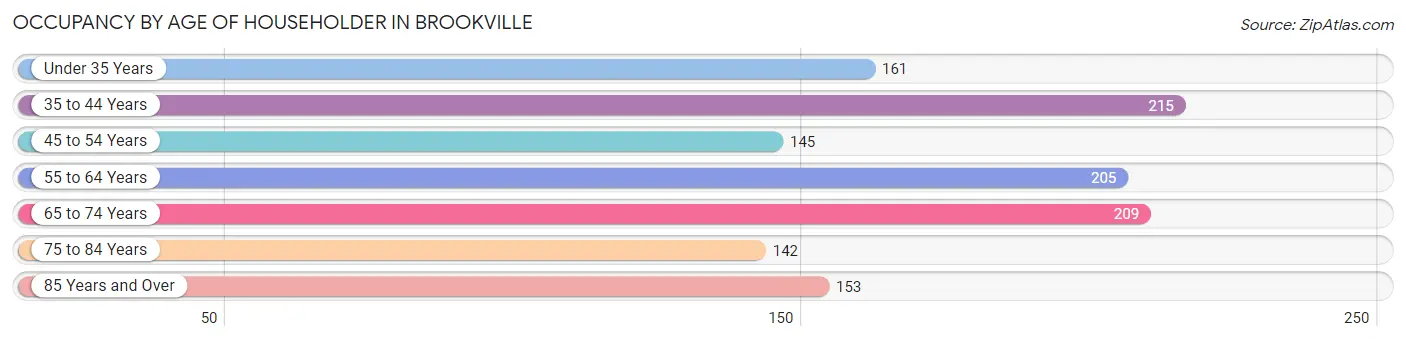
| Age Bracket | # Households | % Households |
| Under 35 Years | 161 | 13.1% |
| 35 to 44 Years | 215 | 17.5% |
| 45 to 54 Years | 145 | 11.8% |
| 55 to 64 Years | 205 | 16.7% |
| 65 to 74 Years | 209 | 17.0% |
| 75 to 84 Years | 142 | 11.5% |
| 85 Years and Over | 153 | 12.4% |
| Total | 1,230 | 100.0% |
Housing Finances in Brookville
Median Income by Occupancy in Brookville
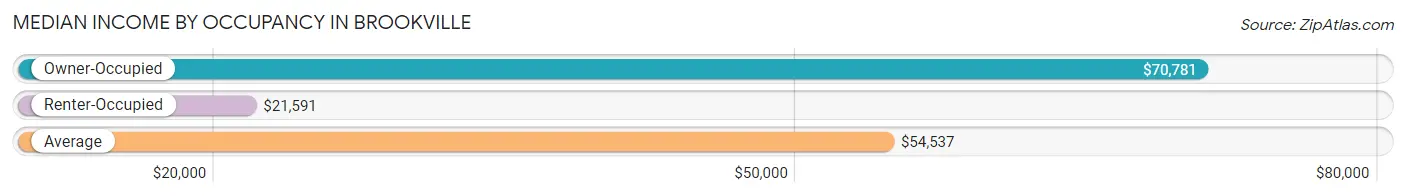
| Occupancy Type | # Households | Median Income |
| Owner-Occupied | 640 (52.0%) | $70,781 |
| Renter-Occupied | 590 (48.0%) | $21,591 |
| Average | 1,230 (100.0%) | $54,537 |
Occupancy by Householder Income Bracket in Brookville
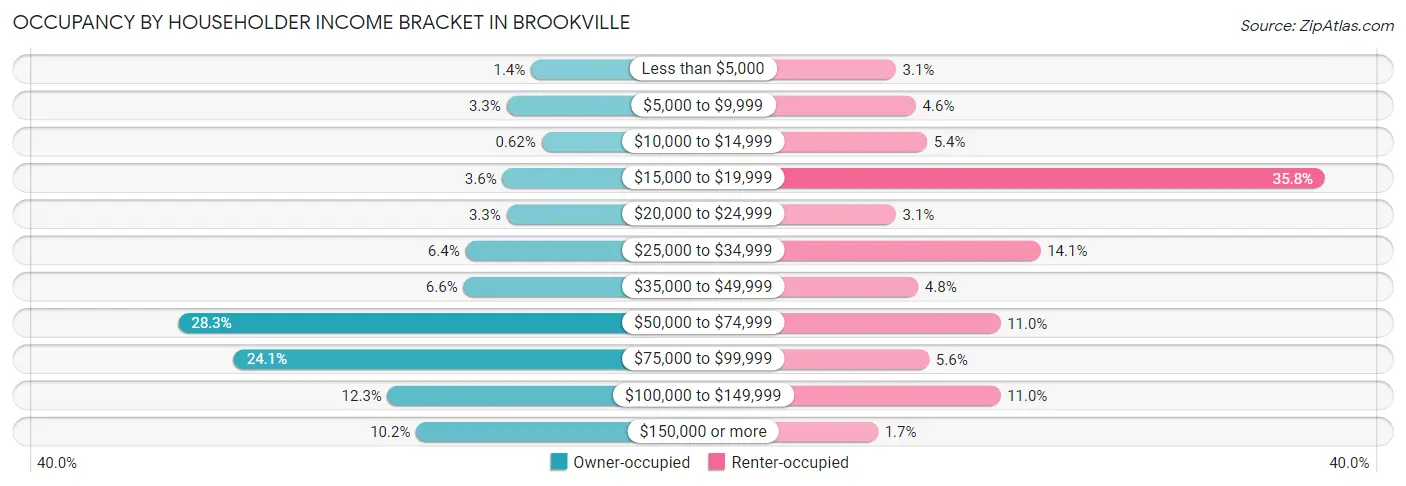
| Income Bracket | Owner-occupied | Renter-occupied |
| Less than $5,000 | 9 (1.4%) | 18 (3.0%) |
| $5,000 to $9,999 | 21 (3.3%) | 27 (4.6%) |
| $10,000 to $14,999 | 4 (0.6%) | 32 (5.4%) |
| $15,000 to $19,999 | 23 (3.6%) | 211 (35.8%) |
| $20,000 to $24,999 | 21 (3.3%) | 18 (3.0%) |
| $25,000 to $34,999 | 41 (6.4%) | 83 (14.1%) |
| $35,000 to $49,999 | 42 (6.6%) | 28 (4.8%) |
| $50,000 to $74,999 | 181 (28.3%) | 65 (11.0%) |
| $75,000 to $99,999 | 154 (24.1%) | 33 (5.6%) |
| $100,000 to $149,999 | 79 (12.3%) | 65 (11.0%) |
| $150,000 or more | 65 (10.2%) | 10 (1.7%) |
| Total | 640 (100.0%) | 590 (100.0%) |
Monthly Housing Cost Tiers in Brookville
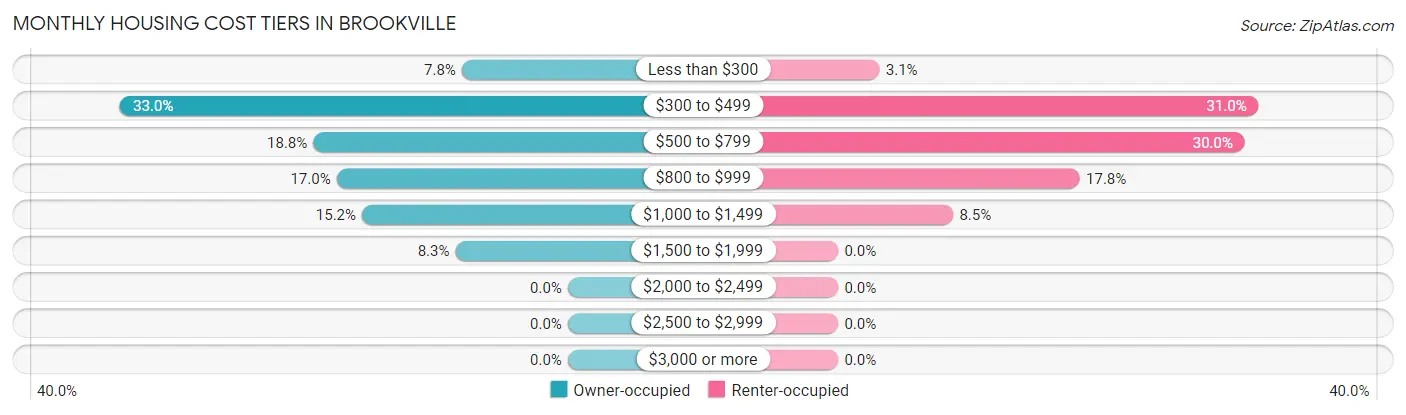
| Monthly Cost | Owner-occupied | Renter-occupied |
| Less than $300 | 50 (7.8%) | 18 (3.0%) |
| $300 to $499 | 211 (33.0%) | 183 (31.0%) |
| $500 to $799 | 120 (18.8%) | 177 (30.0%) |
| $800 to $999 | 109 (17.0%) | 105 (17.8%) |
| $1,000 to $1,499 | 97 (15.2%) | 50 (8.5%) |
| $1,500 to $1,999 | 53 (8.3%) | 0 (0.0%) |
| $2,000 to $2,499 | 0 (0.0%) | 0 (0.0%) |
| $2,500 to $2,999 | 0 (0.0%) | 0 (0.0%) |
| $3,000 or more | 0 (0.0%) | 0 (0.0%) |
| Total | 640 (100.0%) | 590 (100.0%) |
Physical Housing Characteristics in Brookville
Housing Structures in Brookville
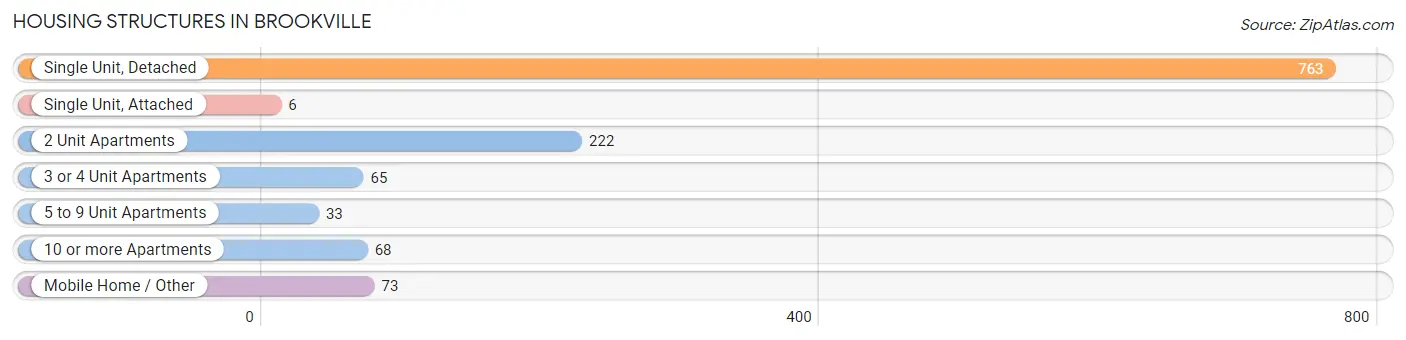
| Structure Type | # Housing Units | % Housing Units |
| Single Unit, Detached | 763 | 62.0% |
| Single Unit, Attached | 6 | 0.5% |
| 2 Unit Apartments | 222 | 18.0% |
| 3 or 4 Unit Apartments | 65 | 5.3% |
| 5 to 9 Unit Apartments | 33 | 2.7% |
| 10 or more Apartments | 68 | 5.5% |
| Mobile Home / Other | 73 | 5.9% |
| Total | 1,230 | 100.0% |
Housing Structures by Occupancy in Brookville
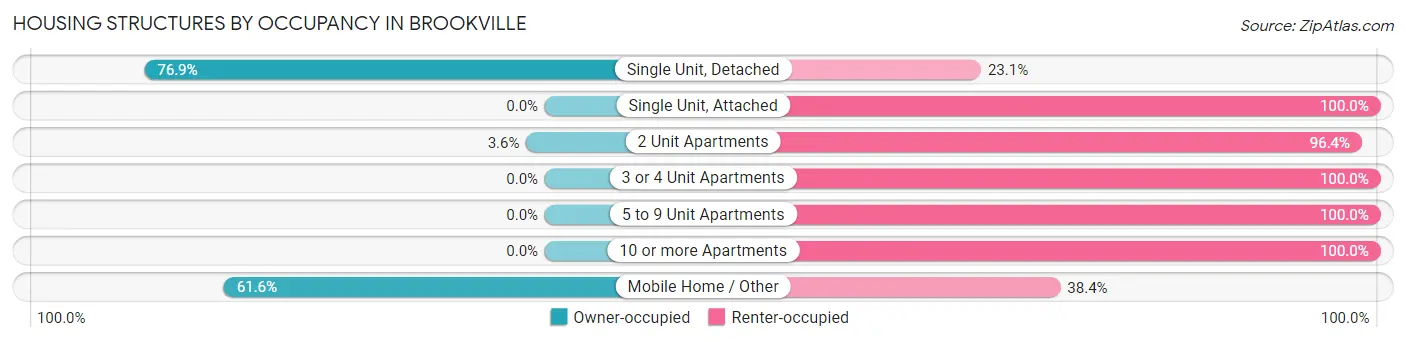
| Structure Type | Owner-occupied | Renter-occupied |
| Single Unit, Detached | 587 (76.9%) | 176 (23.1%) |
| Single Unit, Attached | 0 (0.0%) | 6 (100.0%) |
| 2 Unit Apartments | 8 (3.6%) | 214 (96.4%) |
| 3 or 4 Unit Apartments | 0 (0.0%) | 65 (100.0%) |
| 5 to 9 Unit Apartments | 0 (0.0%) | 33 (100.0%) |
| 10 or more Apartments | 0 (0.0%) | 68 (100.0%) |
| Mobile Home / Other | 45 (61.6%) | 28 (38.4%) |
| Total | 640 (52.0%) | 590 (48.0%) |
Housing Structures by Number of Rooms in Brookville
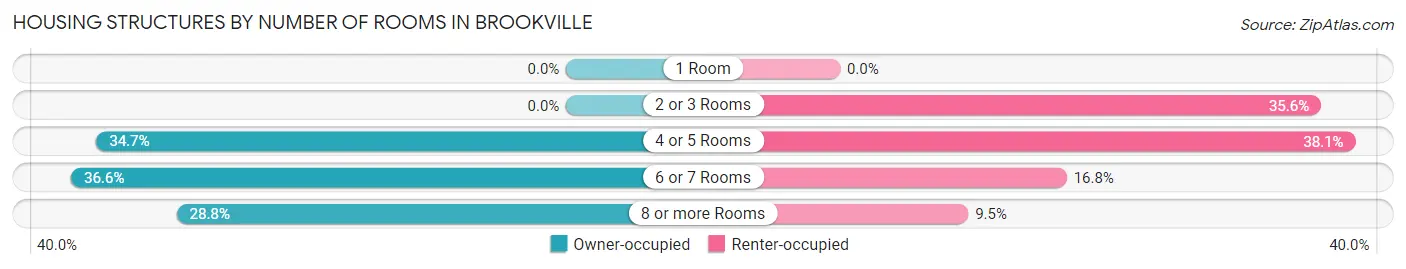
| Number of Rooms | Owner-occupied | Renter-occupied |
| 1 Room | 0 (0.0%) | 0 (0.0%) |
| 2 or 3 Rooms | 0 (0.0%) | 210 (35.6%) |
| 4 or 5 Rooms | 222 (34.7%) | 225 (38.1%) |
| 6 or 7 Rooms | 234 (36.6%) | 99 (16.8%) |
| 8 or more Rooms | 184 (28.7%) | 56 (9.5%) |
| Total | 640 (100.0%) | 590 (100.0%) |
Housing Structure by Heating Type in Brookville
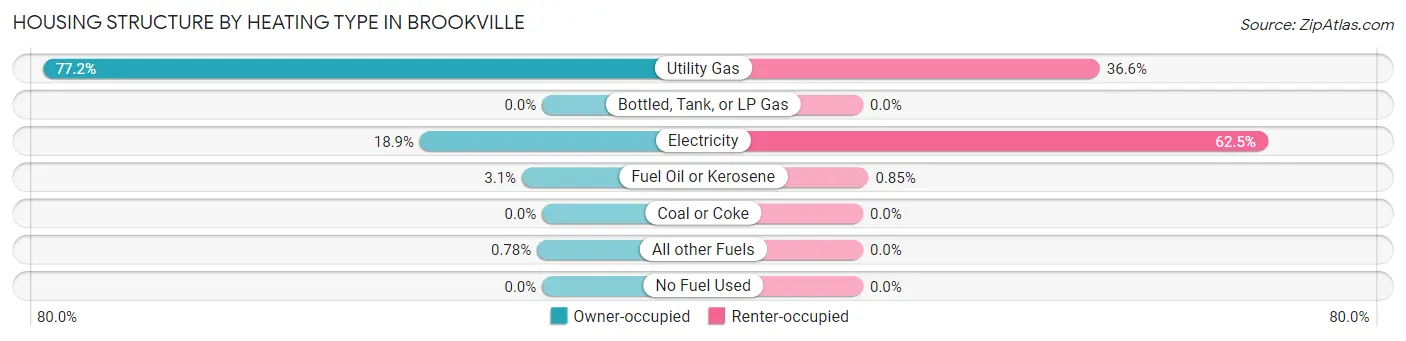
| Heating Type | Owner-occupied | Renter-occupied |
| Utility Gas | 494 (77.2%) | 216 (36.6%) |
| Bottled, Tank, or LP Gas | 0 (0.0%) | 0 (0.0%) |
| Electricity | 121 (18.9%) | 369 (62.5%) |
| Fuel Oil or Kerosene | 20 (3.1%) | 5 (0.9%) |
| Coal or Coke | 0 (0.0%) | 0 (0.0%) |
| All other Fuels | 5 (0.8%) | 0 (0.0%) |
| No Fuel Used | 0 (0.0%) | 0 (0.0%) |
| Total | 640 (100.0%) | 590 (100.0%) |
Household Vehicle Usage in Brookville
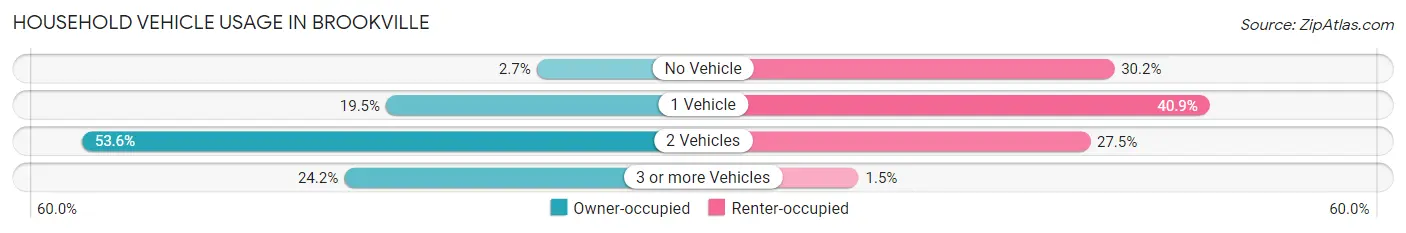
| Vehicles per Household | Owner-occupied | Renter-occupied |
| No Vehicle | 17 (2.7%) | 178 (30.2%) |
| 1 Vehicle | 125 (19.5%) | 241 (40.8%) |
| 2 Vehicles | 343 (53.6%) | 162 (27.5%) |
| 3 or more Vehicles | 155 (24.2%) | 9 (1.5%) |
| Total | 640 (100.0%) | 590 (100.0%) |
Real Estate & Mortgages in Brookville
Real Estate and Mortgage Overview in Brookville
| Characteristic | Without Mortgage | With Mortgage |
| Housing Units | 321 | 319 |
| Median Property Value | $132,900 | $146,200 |
| Median Household Income | $59,911 | $12 |
| Monthly Housing Costs | $430 | $0 |
| Real Estate Taxes | $743 | $3 |
Property Value by Mortgage Status in Brookville
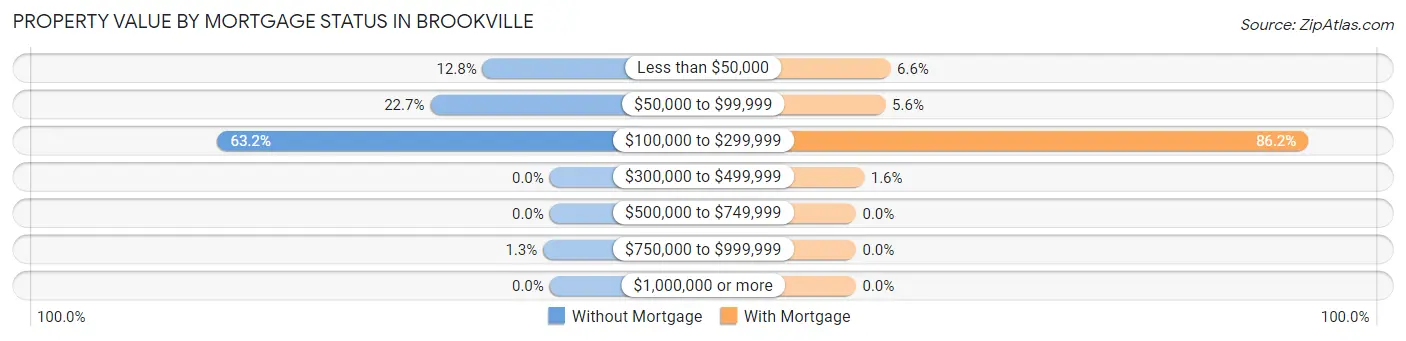
| Property Value | Without Mortgage | With Mortgage |
| Less than $50,000 | 41 (12.8%) | 21 (6.6%) |
| $50,000 to $99,999 | 73 (22.7%) | 18 (5.6%) |
| $100,000 to $299,999 | 203 (63.2%) | 275 (86.2%) |
| $300,000 to $499,999 | 0 (0.0%) | 5 (1.6%) |
| $500,000 to $749,999 | 0 (0.0%) | 0 (0.0%) |
| $750,000 to $999,999 | 4 (1.3%) | 0 (0.0%) |
| $1,000,000 or more | 0 (0.0%) | 0 (0.0%) |
| Total | 321 (100.0%) | 319 (100.0%) |
Household Income by Mortgage Status in Brookville
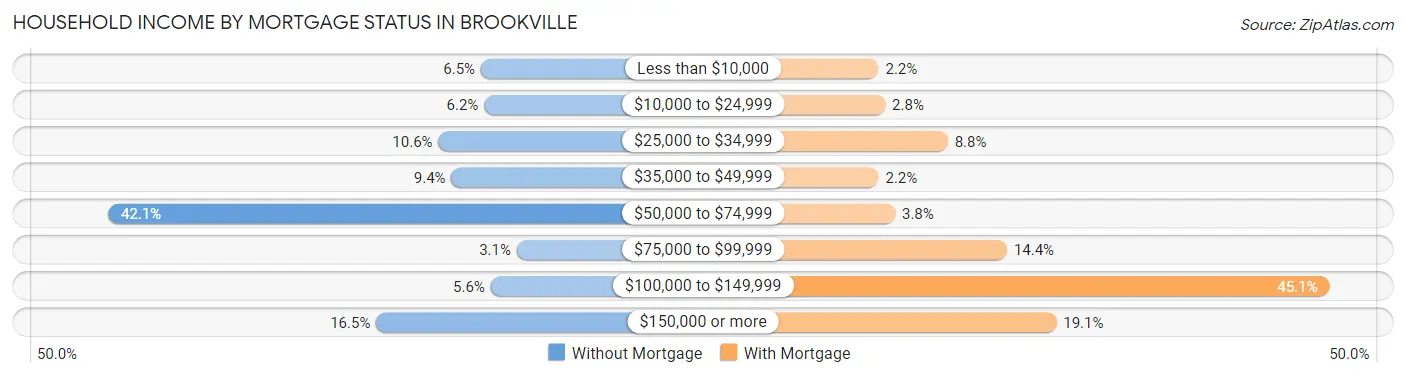
| Household Income | Without Mortgage | With Mortgage |
| Less than $10,000 | 21 (6.5%) | 7 (2.2%) |
| $10,000 to $24,999 | 20 (6.2%) | 9 (2.8%) |
| $25,000 to $34,999 | 34 (10.6%) | 28 (8.8%) |
| $35,000 to $49,999 | 30 (9.3%) | 7 (2.2%) |
| $50,000 to $74,999 | 135 (42.1%) | 12 (3.8%) |
| $75,000 to $99,999 | 10 (3.1%) | 46 (14.4%) |
| $100,000 to $149,999 | 18 (5.6%) | 144 (45.1%) |
| $150,000 or more | 53 (16.5%) | 61 (19.1%) |
| Total | 321 (100.0%) | 319 (100.0%) |
Property Value to Household Income Ratio in Brookville
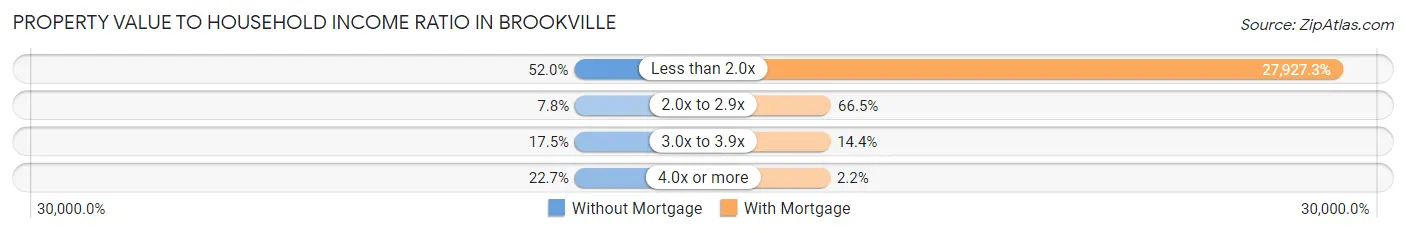
| Value-to-Income Ratio | Without Mortgage | With Mortgage |
| Less than 2.0x | 167 (52.0%) | 89,088 (27,927.3%) |
| 2.0x to 2.9x | 25 (7.8%) | 212 (66.5%) |
| 3.0x to 3.9x | 56 (17.4%) | 46 (14.4%) |
| 4.0x or more | 73 (22.7%) | 7 (2.2%) |
| Total | 321 (100.0%) | 319 (100.0%) |
Real Estate Taxes by Mortgage Status in Brookville
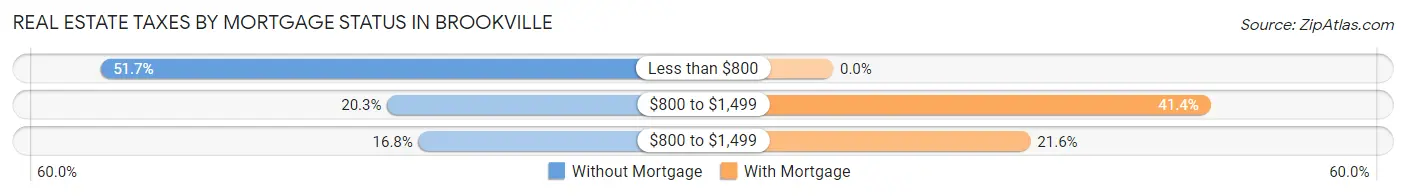
| Property Taxes | Without Mortgage | With Mortgage |
| Less than $800 | 166 (51.7%) | 0 (0.0%) |
| $800 to $1,499 | 65 (20.3%) | 132 (41.4%) |
| $800 to $1,499 | 54 (16.8%) | 69 (21.6%) |
| Total | 321 (100.0%) | 319 (100.0%) |
Health & Disability in Brookville
Health Insurance Coverage by Age in Brookville
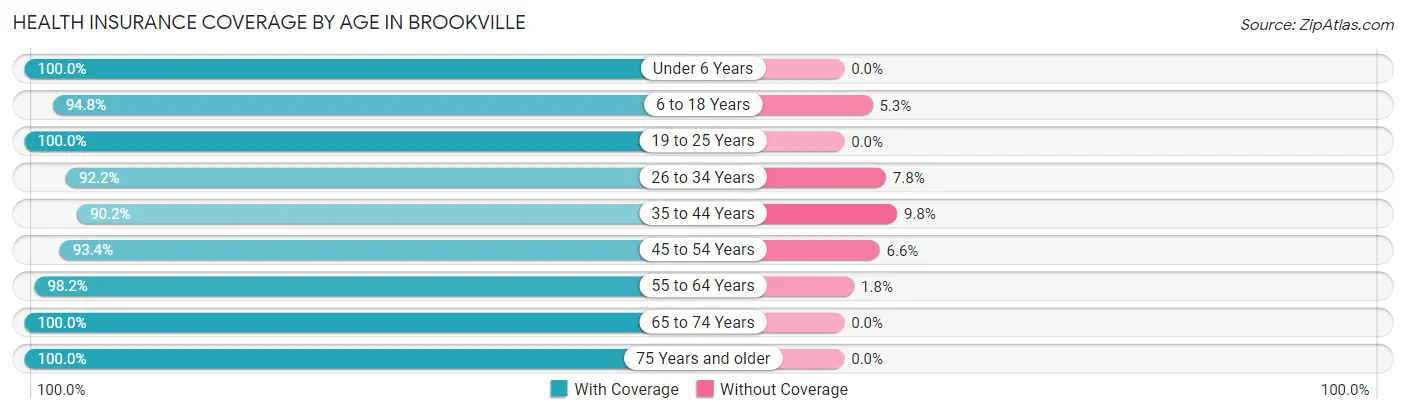
| Age Bracket | With Coverage | Without Coverage |
| Under 6 Years | 229 (100.0%) | 0 (0.0%) |
| 6 to 18 Years | 289 (94.8%) | 16 (5.2%) |
| 19 to 25 Years | 126 (100.0%) | 0 (0.0%) |
| 26 to 34 Years | 321 (92.2%) | 27 (7.8%) |
| 35 to 44 Years | 303 (90.2%) | 33 (9.8%) |
| 45 to 54 Years | 227 (93.4%) | 16 (6.6%) |
| 55 to 64 Years | 374 (98.2%) | 7 (1.8%) |
| 65 to 74 Years | 271 (100.0%) | 0 (0.0%) |
| 75 Years and older | 380 (100.0%) | 0 (0.0%) |
| Total | 2,520 (96.2%) | 99 (3.8%) |
Health Insurance Coverage by Citizenship Status in Brookville
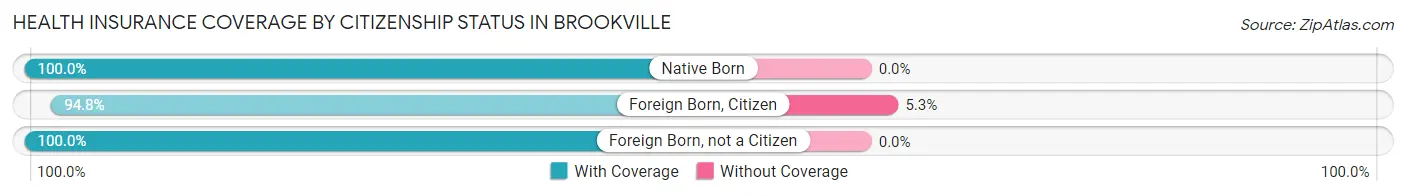
| Citizenship Status | With Coverage | Without Coverage |
| Native Born | 229 (100.0%) | 0 (0.0%) |
| Foreign Born, Citizen | 289 (94.8%) | 16 (5.2%) |
| Foreign Born, not a Citizen | 126 (100.0%) | 0 (0.0%) |
Health Insurance Coverage by Household Income in Brookville
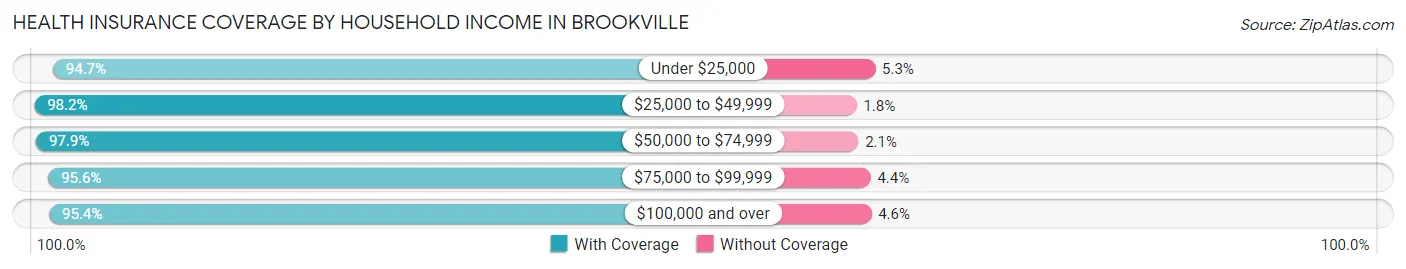
| Household Income | With Coverage | Without Coverage |
| Under $25,000 | 465 (94.7%) | 26 (5.3%) |
| $25,000 to $49,999 | 272 (98.2%) | 5 (1.8%) |
| $50,000 to $74,999 | 641 (97.9%) | 14 (2.1%) |
| $75,000 to $99,999 | 475 (95.6%) | 22 (4.4%) |
| $100,000 and over | 667 (95.4%) | 32 (4.6%) |
Public vs Private Health Insurance Coverage by Age in Brookville
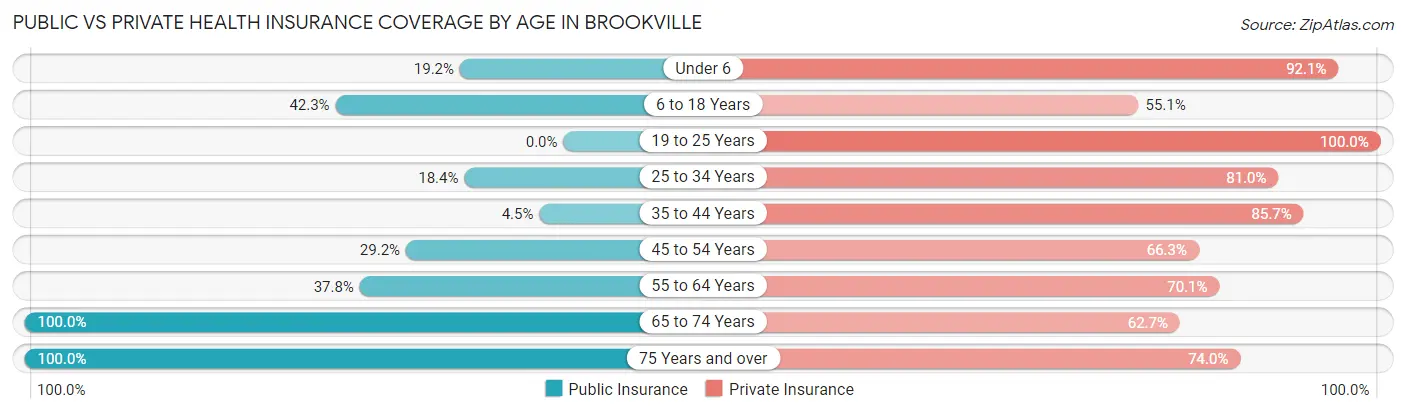
| Age Bracket | Public Insurance | Private Insurance |
| Under 6 | 44 (19.2%) | 211 (92.1%) |
| 6 to 18 Years | 129 (42.3%) | 168 (55.1%) |
| 19 to 25 Years | 0 (0.0%) | 126 (100.0%) |
| 25 to 34 Years | 64 (18.4%) | 282 (81.0%) |
| 35 to 44 Years | 15 (4.5%) | 288 (85.7%) |
| 45 to 54 Years | 71 (29.2%) | 161 (66.3%) |
| 55 to 64 Years | 144 (37.8%) | 267 (70.1%) |
| 65 to 74 Years | 271 (100.0%) | 170 (62.7%) |
| 75 Years and over | 380 (100.0%) | 281 (74.0%) |
| Total | 1,118 (42.7%) | 1,954 (74.6%) |
Disability Status by Sex by Age in Brookville
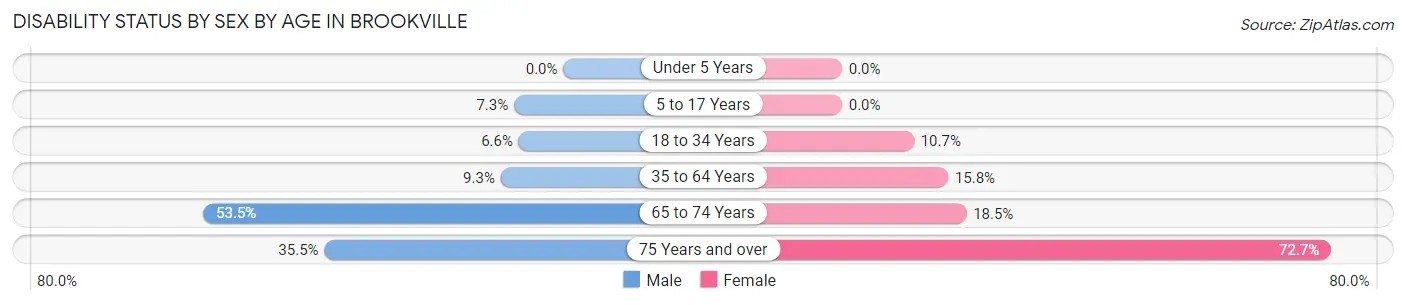
| Age Bracket | Male | Female |
| Under 5 Years | 0 (0.0%) | 0 (0.0%) |
| 5 to 17 Years | 12 (7.3%) | 0 (0.0%) |
| 18 to 34 Years | 18 (6.6%) | 25 (10.7%) |
| 35 to 64 Years | 45 (9.3%) | 75 (15.8%) |
| 65 to 74 Years | 61 (53.5%) | 29 (18.5%) |
| 75 Years and over | 44 (35.5%) | 186 (72.7%) |
Disability Class by Sex by Age in Brookville
Disability Class: Hearing Difficulty
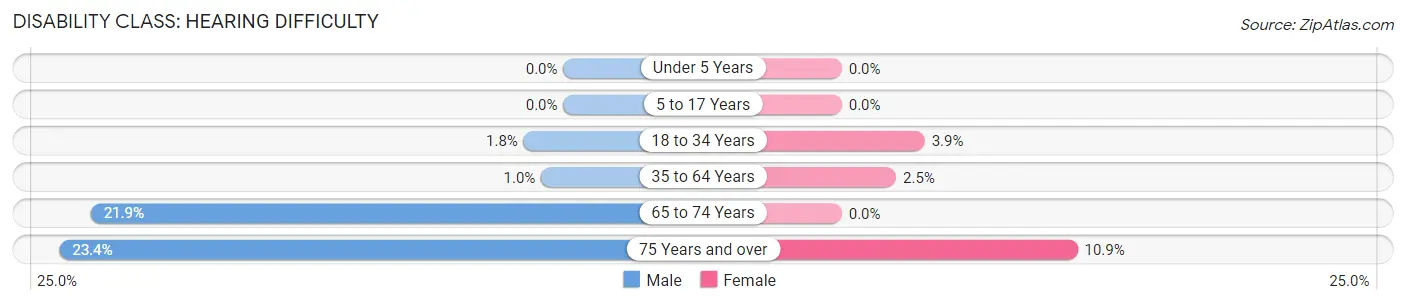
| Age Bracket | Male | Female |
| Under 5 Years | 0 (0.0%) | 0 (0.0%) |
| 5 to 17 Years | 0 (0.0%) | 0 (0.0%) |
| 18 to 34 Years | 5 (1.8%) | 9 (3.8%) |
| 35 to 64 Years | 5 (1.0%) | 12 (2.5%) |
| 65 to 74 Years | 25 (21.9%) | 0 (0.0%) |
| 75 Years and over | 29 (23.4%) | 28 (10.9%) |
Disability Class: Vision Difficulty
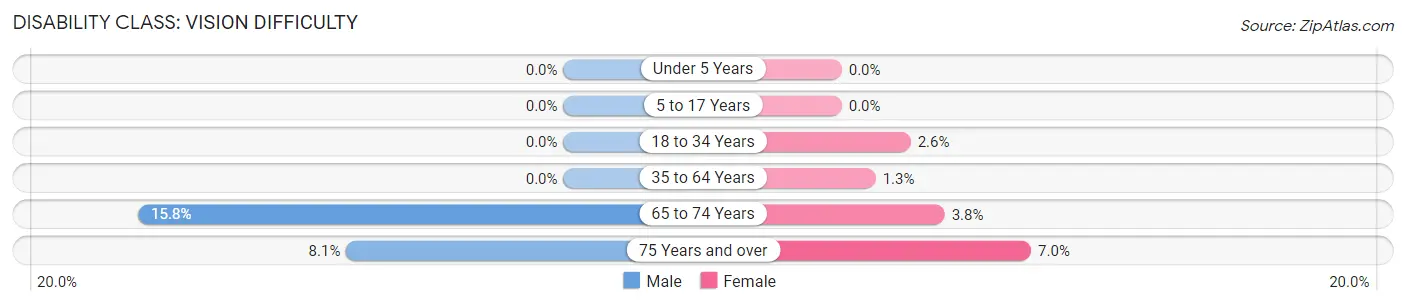
| Age Bracket | Male | Female |
| Under 5 Years | 0 (0.0%) | 0 (0.0%) |
| 5 to 17 Years | 0 (0.0%) | 0 (0.0%) |
| 18 to 34 Years | 0 (0.0%) | 6 (2.6%) |
| 35 to 64 Years | 0 (0.0%) | 6 (1.3%) |
| 65 to 74 Years | 18 (15.8%) | 6 (3.8%) |
| 75 Years and over | 10 (8.1%) | 18 (7.0%) |
Disability Class: Cognitive Difficulty
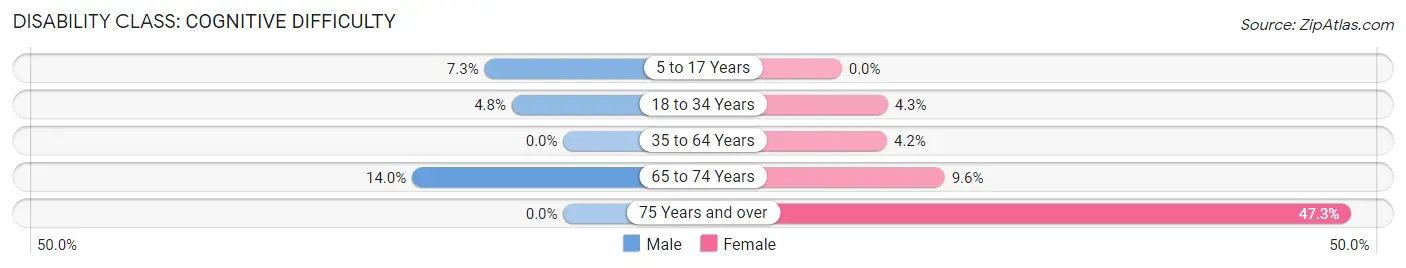
| Age Bracket | Male | Female |
| 5 to 17 Years | 12 (7.3%) | 0 (0.0%) |
| 18 to 34 Years | 13 (4.8%) | 10 (4.3%) |
| 35 to 64 Years | 0 (0.0%) | 20 (4.2%) |
| 65 to 74 Years | 16 (14.0%) | 15 (9.6%) |
| 75 Years and over | 0 (0.0%) | 121 (47.3%) |
Disability Class: Ambulatory Difficulty
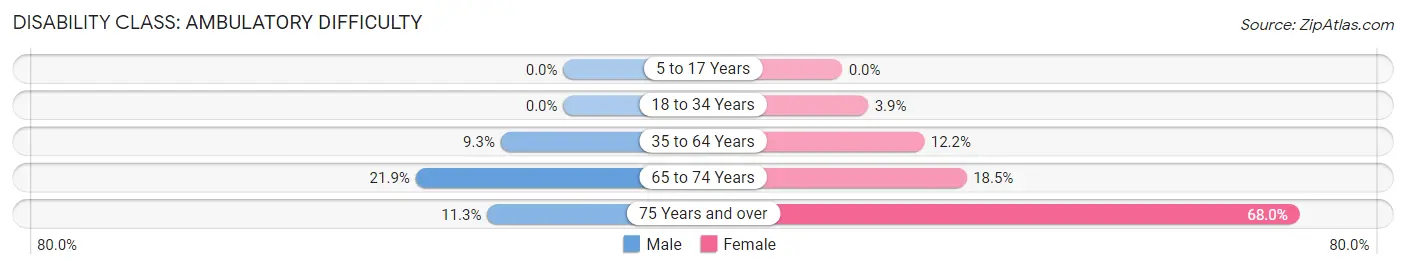
| Age Bracket | Male | Female |
| 5 to 17 Years | 0 (0.0%) | 0 (0.0%) |
| 18 to 34 Years | 0 (0.0%) | 9 (3.8%) |
| 35 to 64 Years | 45 (9.3%) | 58 (12.2%) |
| 65 to 74 Years | 25 (21.9%) | 29 (18.5%) |
| 75 Years and over | 14 (11.3%) | 174 (68.0%) |
Disability Class: Self-Care Difficulty
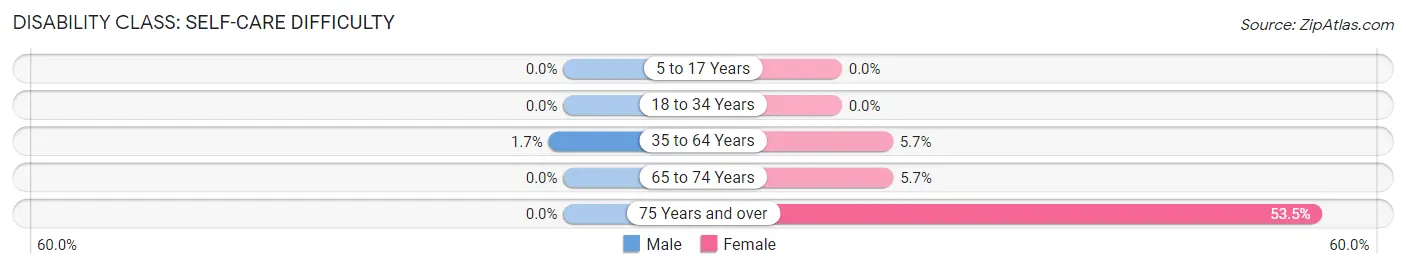
| Age Bracket | Male | Female |
| 5 to 17 Years | 0 (0.0%) | 0 (0.0%) |
| 18 to 34 Years | 0 (0.0%) | 0 (0.0%) |
| 35 to 64 Years | 8 (1.7%) | 27 (5.7%) |
| 65 to 74 Years | 0 (0.0%) | 9 (5.7%) |
| 75 Years and over | 0 (0.0%) | 137 (53.5%) |
Technology Access in Brookville
Computing Device Access in Brookville
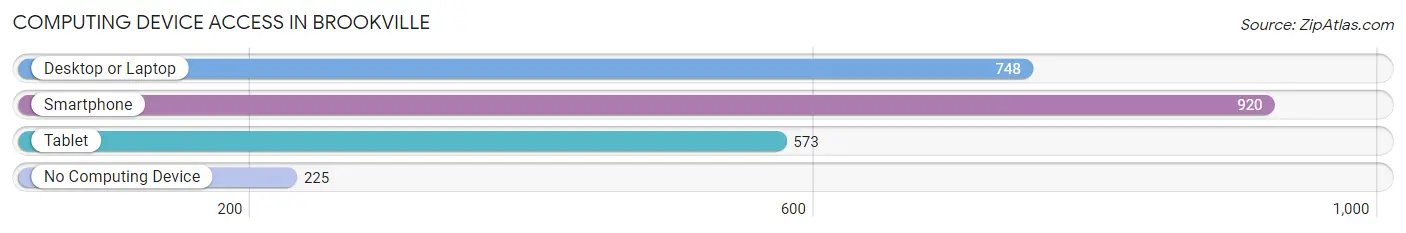
| Device Type | # Households | % Households |
| Desktop or Laptop | 748 | 60.8% |
| Smartphone | 920 | 74.8% |
| Tablet | 573 | 46.6% |
| No Computing Device | 225 | 18.3% |
| Total | 1,230 | 100.0% |
Internet Access in Brookville
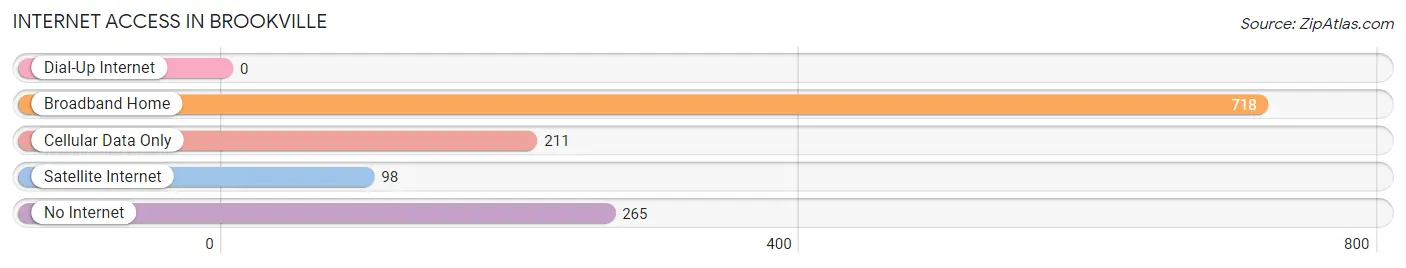
| Internet Type | # Households | % Households |
| Dial-Up Internet | 0 | 0.0% |
| Broadband Home | 718 | 58.4% |
| Cellular Data Only | 211 | 17.2% |
| Satellite Internet | 98 | 8.0% |
| No Internet | 265 | 21.5% |
| Total | 1,230 | 100.0% |
Brookville Summary
History
The town of Brookville, Indiana is located in Franklin County, Indiana, and is the county seat. It was founded in 1811 and was named after the nearby Brookville Creek. The town was originally a trading post and was the first county seat of Franklin County. The first courthouse was built in 1814 and the first post office was established in 1817.
The town was an important stop on the Whitewater Canal, which was built in 1845 and connected the Ohio River to the Great Lakes. The canal was a major transportation route for goods and people, and it helped to spur the growth of the town. The canal was eventually replaced by the railroad in the late 19th century.
The town was also an important stop on the Underground Railroad, which was a network of secret routes and safe houses used by African Americans to escape slavery in the southern United States. The town was home to several prominent abolitionists, including Levi Coffin, who was known as the “President of the Underground Railroad.”
Geography
Brookville is located in the eastern part of Franklin County, Indiana, and is situated on the banks of the Whitewater River. The town is located about 40 miles west of Cincinnati, Ohio, and about 70 miles east of Indianapolis, Indiana. The town is surrounded by rolling hills and farmland, and is located in the Whitewater Valley.
The climate in Brookville is humid continental, with hot summers and cold winters. The average annual temperature is around 50 degrees Fahrenheit, and the average annual precipitation is around 40 inches.
Economy
The economy of Brookville is largely based on agriculture and manufacturing. The town is home to several large manufacturing companies, including a paper mill, a furniture factory, and a plastics factory. The town is also home to several small businesses, including restaurants, shops, and other services.
The town is also home to several educational institutions, including a community college, a technical college, and a vocational school. The town is also home to a hospital and several medical clinics.
Demographics
As of the 2010 census, the population of Brookville was 2,619. The racial makeup of the town was 95.3% White, 1.2% African American, 0.3% Native American, 0.7% Asian, 0.1% Pacific Islander, 0.7% from other races, and 1.7% from two or more races. Hispanic or Latino of any race were 2.2% of the population.
The median income for a household in the town was $37,917, and the median income for a family was $45,938. The per capita income for the town was $19,945. About 11.2% of families and 14.2% of the population were below the poverty line, including 19.2% of those under age 18 and 8.2% of those age 65 or over.
Common Questions
What is Per Capita Income in Brookville?
Per Capita income in Brookville is $30,439.
What is the Median Family Income in Brookville?
Median Family Income in Brookville is $79,236.
What is the Median Household income in Brookville?
Median Household Income in Brookville is $54,537.
What is Income or Wage Gap in Brookville?
Income or Wage Gap in Brookville is 14.4%.
Women in Brookville earn 85.6 cents for every dollar earned by a man.
What is Inequality or Gini Index in Brookville?
Inequality or Gini Index in Brookville is 0.43.
What is the Total Population of Brookville?
Total Population of Brookville is 2,619.
What is the Total Male Population of Brookville?
Total Male Population of Brookville is 1,263.
What is the Total Female Population of Brookville?
Total Female Population of Brookville is 1,356.
What is the Ratio of Males per 100 Females in Brookville?
There are 93.14 Males per 100 Females in Brookville.
What is the Ratio of Females per 100 Males in Brookville?
There are 107.36 Females per 100 Males in Brookville.
What is the Median Population Age in Brookville?
Median Population Age in Brookville is 43.1 Years.
What is the Average Family Size in Brookville
Average Family Size in Brookville is 3.0 People.
What is the Average Household Size in Brookville
Average Household Size in Brookville is 2.1 People.
How Large is the Labor Force in Brookville?
There are 1,269 People in the Labor Forcein in Brookville.
What is the Percentage of People in the Labor Force in Brookville?
58.8% of People are in the Labor Force in Brookville.
What is the Unemployment Rate in Brookville?
Unemployment Rate in Brookville is 0.6%.