Bluffton, IN Map & Demographics
Bluffton Map
Bluffton Overview
$28,031
PER CAPITA INCOME
$76,031
AVG FAMILY INCOME
$56,955
AVG HOUSEHOLD INCOME
29.0%
WAGE / INCOME GAP [ % ]
71.0¢/ $1
WAGE / INCOME GAP [ $ ]
0.39
INEQUALITY / GINI INDEX
10,461
TOTAL POPULATION
4,925
MALE POPULATION
5,536
FEMALE POPULATION
88.96
MALES / 100 FEMALES
112.41
FEMALES / 100 MALES
38.7
MEDIAN AGE
3.2
AVG FAMILY SIZE
2.4
AVG HOUSEHOLD SIZE
5,509
LABOR FORCE [ PEOPLE ]
67.4%
PERCENT IN LABOR FORCE
4.0%
UNEMPLOYMENT RATE
Bluffton Zip Codes
Bluffton Area Codes
Income in Bluffton
Income Overview in Bluffton
Per Capita Income in Bluffton is $28,031, while median incomes of families and households are $76,031 and $56,955 respectively.
| Characteristic | Number | Measure |
| Per Capita Income | 10,461 | $28,031 |
| Median Family Income | 2,488 | $76,031 |
| Mean Family Income | 2,488 | $84,152 |
| Median Household Income | 4,298 | $56,955 |
| Mean Household Income | 4,298 | $66,739 |
| Income Deficit | 2,488 | $0 |
| Wage / Income Gap (%) | 10,461 | 29.02% |
| Wage / Income Gap ($) | 10,461 | 70.98¢ per $1 |
| Gini / Inequality Index | 10,461 | 0.39 |
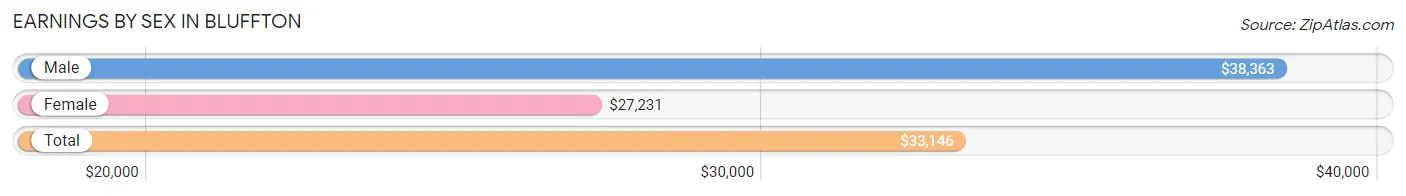
Earnings by Sex in Bluffton
Average Earnings in Bluffton are $33,146, $38,363 for men and $27,231 for women, a difference of 29.0%.
| Sex | Number | Average Earnings |
| Male | 3,131 (54.0%) | $38,363 |
| Female | 2,667 (46.0%) | $27,231 |
| Total | 5,798 (100.0%) | $33,146 |
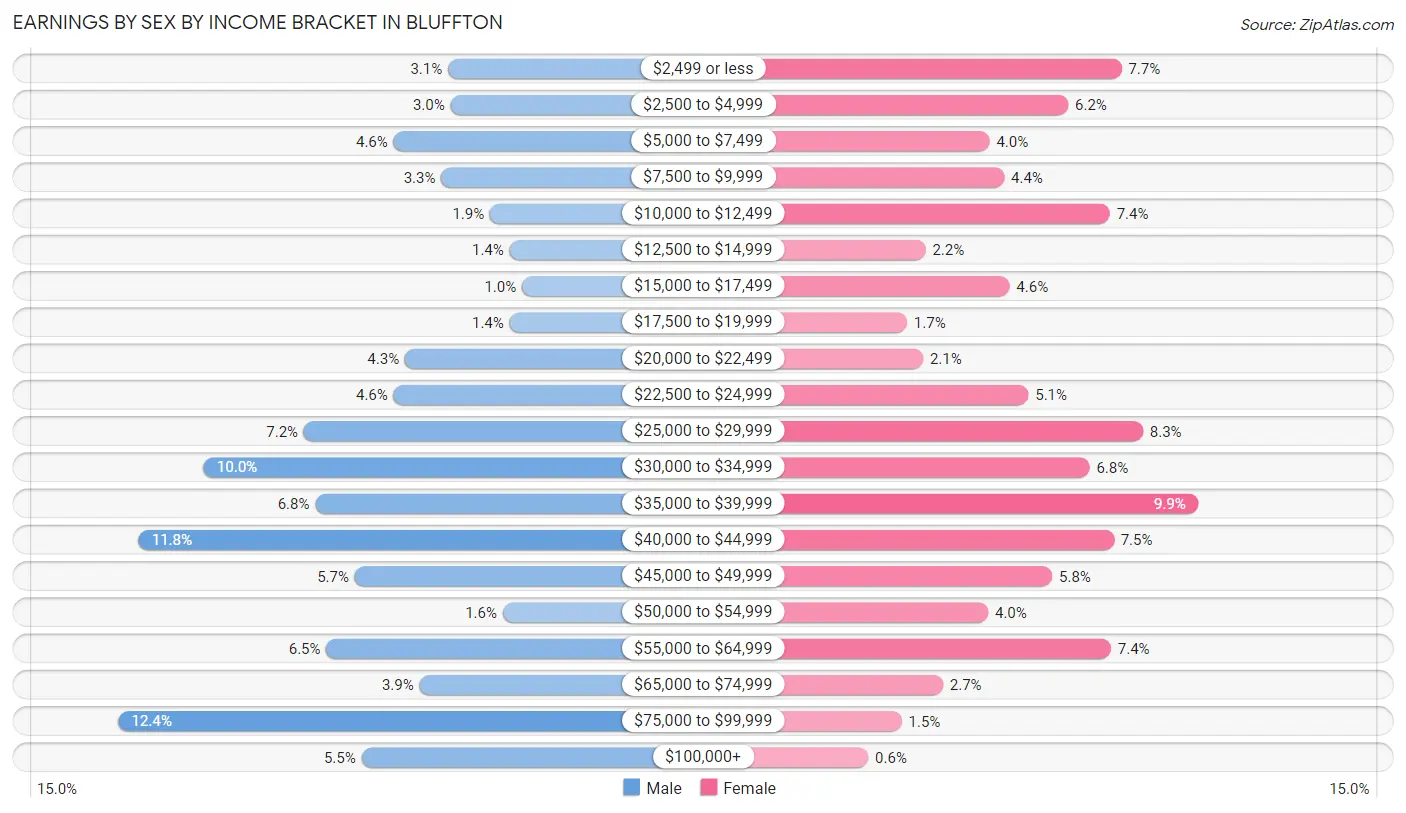
Earnings by Sex by Income Bracket in Bluffton
The most common earnings brackets in Bluffton are $75,000 to $99,999 for men (387 | 12.4%) and $35,000 to $39,999 for women (263 | 9.9%).
| Income | Male | Female |
| $2,499 or less | 97 (3.1%) | 206 (7.7%) |
| $2,500 to $4,999 | 95 (3.0%) | 166 (6.2%) |
| $5,000 to $7,499 | 145 (4.6%) | 107 (4.0%) |
| $7,500 to $9,999 | 103 (3.3%) | 118 (4.4%) |
| $10,000 to $12,499 | 60 (1.9%) | 197 (7.4%) |
| $12,500 to $14,999 | 43 (1.4%) | 59 (2.2%) |
| $15,000 to $17,499 | 32 (1.0%) | 122 (4.6%) |
| $17,500 to $19,999 | 43 (1.4%) | 45 (1.7%) |
| $20,000 to $22,499 | 135 (4.3%) | 57 (2.1%) |
| $22,500 to $24,999 | 145 (4.6%) | 136 (5.1%) |
| $25,000 to $29,999 | 224 (7.1%) | 222 (8.3%) |
| $30,000 to $34,999 | 312 (10.0%) | 182 (6.8%) |
| $35,000 to $39,999 | 214 (6.8%) | 263 (9.9%) |
| $40,000 to $44,999 | 369 (11.8%) | 200 (7.5%) |
| $45,000 to $49,999 | 179 (5.7%) | 154 (5.8%) |
| $50,000 to $54,999 | 49 (1.6%) | 106 (4.0%) |
| $55,000 to $64,999 | 204 (6.5%) | 198 (7.4%) |
| $65,000 to $74,999 | 122 (3.9%) | 72 (2.7%) |
| $75,000 to $99,999 | 387 (12.4%) | 41 (1.5%) |
| $100,000+ | 173 (5.5%) | 16 (0.6%) |
| Total | 3,131 (100.0%) | 2,667 (100.0%) |
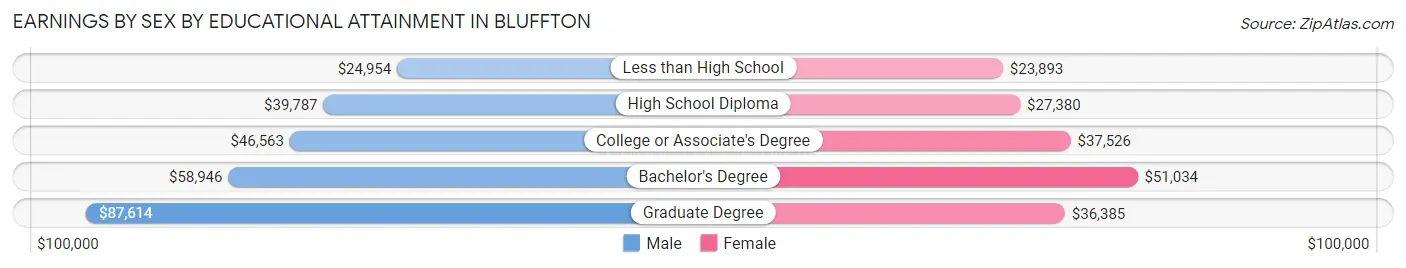
Earnings by Sex by Educational Attainment in Bluffton
Average earnings in Bluffton are $42,122 for men and $33,981 for women, a difference of 19.3%. Men with an educational attainment of graduate degree enjoy the highest average annual earnings of $87,614, while those with less than high school education earn the least with $24,954. Women with an educational attainment of bachelor's degree earn the most with the average annual earnings of $51,034, while those with less than high school education have the smallest earnings of $23,893.
| Educational Attainment | Male Income | Female Income |
| Less than High School | $24,954 | $23,893 |
| High School Diploma | $39,787 | $27,380 |
| College or Associate's Degree | $46,563 | $37,526 |
| Bachelor's Degree | $58,946 | $51,034 |
| Graduate Degree | $87,614 | $36,385 |
| Total | $42,122 | $33,981 |
Family Income in Bluffton
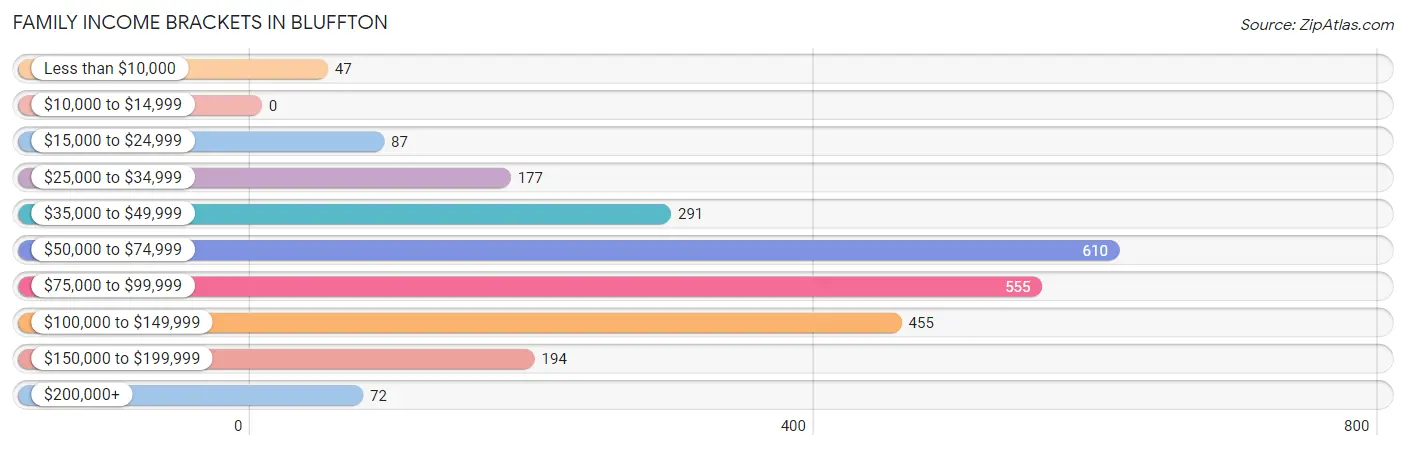
Family Income Brackets in Bluffton
According to the Bluffton family income data, there are 610 families falling into the $50,000 to $74,999 income range, which is the most common income bracket and makes up 24.5% of all families.
| Income Bracket | # Families | % Families |
| Less than $10,000 | 47 | 1.9% |
| $10,000 to $14,999 | 0 | 0.0% |
| $15,000 to $24,999 | 87 | 3.5% |
| $25,000 to $34,999 | 177 | 7.1% |
| $35,000 to $49,999 | 291 | 11.7% |
| $50,000 to $74,999 | 610 | 24.5% |
| $75,000 to $99,999 | 555 | 22.3% |
| $100,000 to $149,999 | 455 | 18.3% |
| $150,000 to $199,999 | 194 | 7.8% |
| $200,000+ | 72 | 2.9% |
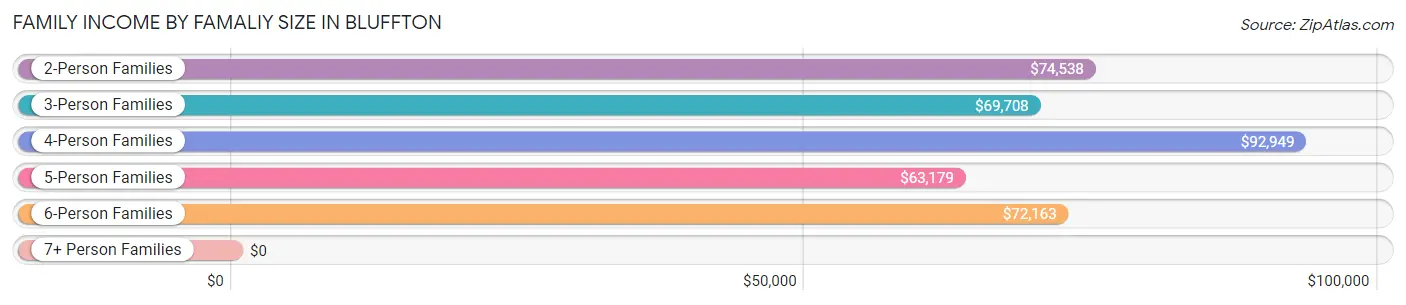
Family Income by Famaliy Size in Bluffton
4-person families (522 | 21.0%) account for the highest median family income in Bluffton with $92,949 per family, while 2-person families (1,197 | 48.1%) have the highest median income of $37,269 per family member.
| Income Bracket | # Families | Median Income |
| 2-Person Families | 1,197 (48.1%) | $74,538 |
| 3-Person Families | 333 (13.4%) | $69,708 |
| 4-Person Families | 522 (21.0%) | $92,949 |
| 5-Person Families | 217 (8.7%) | $63,179 |
| 6-Person Families | 209 (8.4%) | $72,163 |
| 7+ Person Families | 10 (0.4%) | $0 |
| Total | 2,488 (100.0%) | $76,031 |
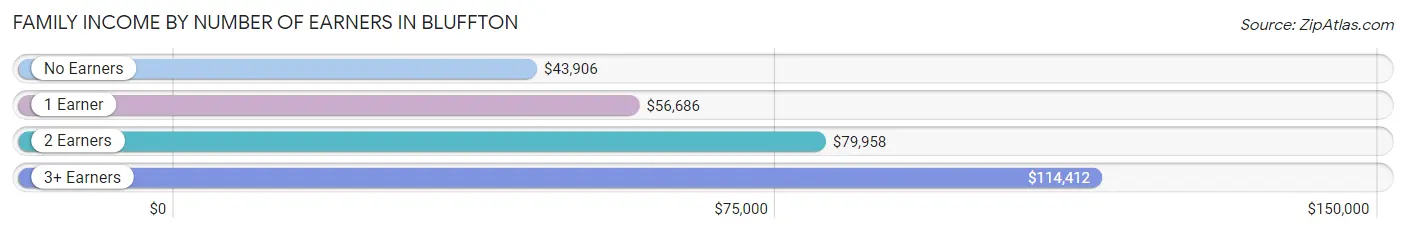
Family Income by Number of Earners in Bluffton
The median family income in Bluffton is $76,031, with families comprising 3+ earners (352) having the highest median family income of $114,412, while families with no earners (210) have the lowest median family income of $43,906, accounting for 14.1% and 8.4% of families, respectively.
| Number of Earners | # Families | Median Income |
| No Earners | 210 (8.4%) | $43,906 |
| 1 Earner | 776 (31.2%) | $56,686 |
| 2 Earners | 1,150 (46.2%) | $79,958 |
| 3+ Earners | 352 (14.1%) | $114,412 |
| Total | 2,488 (100.0%) | $76,031 |
Household Income in Bluffton
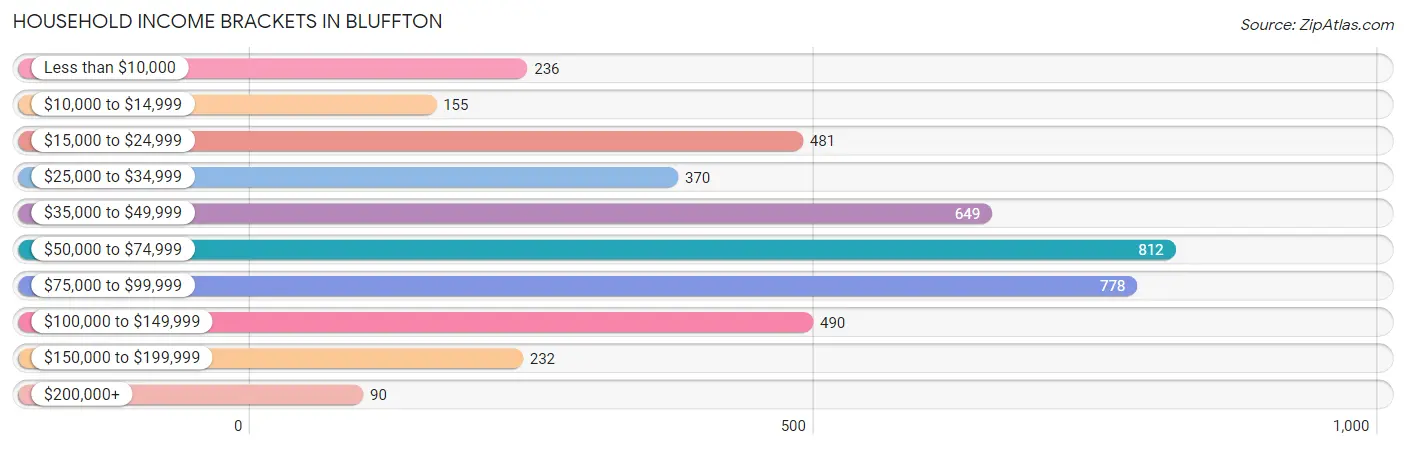
Household Income Brackets in Bluffton
With 812 households falling in the category, the $50,000 to $74,999 income range is the most frequent in Bluffton, accounting for 18.9% of all households. In contrast, only 90 households (2.1%) fall into the $200,000+ income bracket, making it the least populous group.
| Income Bracket | # Households | % Households |
| Less than $10,000 | 236 | 5.5% |
| $10,000 to $14,999 | 155 | 3.6% |
| $15,000 to $24,999 | 481 | 11.2% |
| $25,000 to $34,999 | 370 | 8.6% |
| $35,000 to $49,999 | 649 | 15.1% |
| $50,000 to $74,999 | 812 | 18.9% |
| $75,000 to $99,999 | 778 | 18.1% |
| $100,000 to $149,999 | 490 | 11.4% |
| $150,000 to $199,999 | 232 | 5.4% |
| $200,000+ | 90 | 2.1% |
Household Income by Householder Age in Bluffton
The median household income in Bluffton is $56,955, with the highest median household income of $71,964 found in the 45 to 64 years age bracket for the primary householder. A total of 1,474 households (34.3%) fall into this category. Meanwhile, the 15 to 24 years age bracket for the primary householder has the lowest median household income of $0, with 129 households (3.0%) in this group.
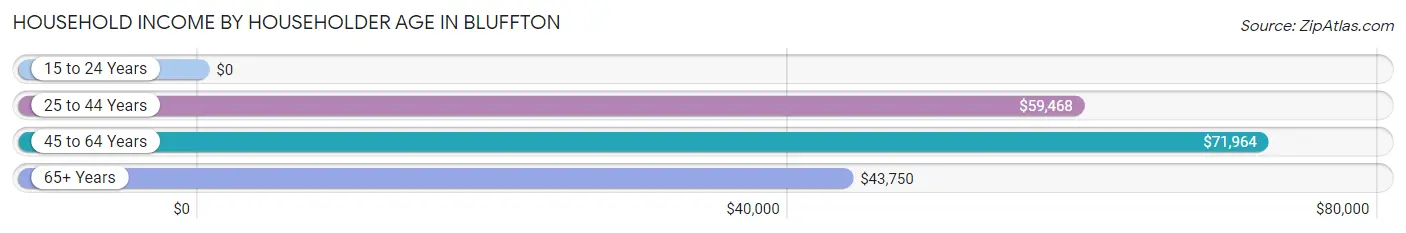
| Income Bracket | # Households | Median Income |
| 15 to 24 Years | 129 (3.0%) | $0 |
| 25 to 44 Years | 1,425 (33.2%) | $59,468 |
| 45 to 64 Years | 1,474 (34.3%) | $71,964 |
| 65+ Years | 1,270 (29.5%) | $43,750 |
| Total | 4,298 (100.0%) | $56,955 |
Poverty in Bluffton
Income Below Poverty by Sex and Age in Bluffton
With 7.9% poverty level for males and 10.6% for females among the residents of Bluffton, 15 year old males and 18 to 24 year old females are the most vulnerable to poverty, with 25 males (38.5%) and 152 females (32.8%) in their respective age groups living below the poverty level.
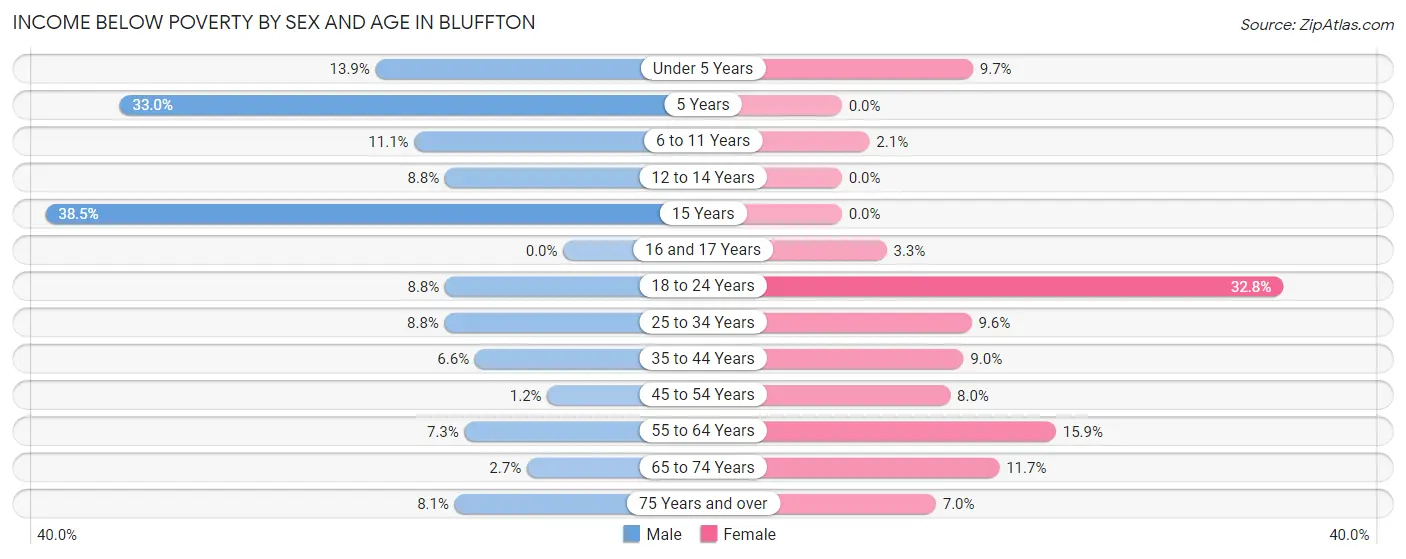
| Age Bracket | Male | Female |
| Under 5 Years | 35 (13.9%) | 33 (9.7%) |
| 5 Years | 29 (33.0%) | 0 (0.0%) |
| 6 to 11 Years | 48 (11.1%) | 8 (2.1%) |
| 12 to 14 Years | 13 (8.8%) | 0 (0.0%) |
| 15 Years | 25 (38.5%) | 0 (0.0%) |
| 16 and 17 Years | 0 (0.0%) | 7 (3.3%) |
| 18 to 24 Years | 48 (8.8%) | 152 (32.8%) |
| 25 to 34 Years | 56 (8.8%) | 49 (9.6%) |
| 35 to 44 Years | 40 (6.6%) | 57 (9.0%) |
| 45 to 54 Years | 7 (1.2%) | 55 (8.0%) |
| 55 to 64 Years | 43 (7.3%) | 106 (15.9%) |
| 65 to 74 Years | 12 (2.7%) | 72 (11.7%) |
| 75 Years and over | 22 (8.1%) | 24 (7.0%) |
| Total | 378 (7.9%) | 563 (10.6%) |
Income Above Poverty by Sex and Age in Bluffton
According to the poverty statistics in Bluffton, males aged 16 and 17 years and females aged 5 years are the age groups that are most secure financially, with 100.0% of males and 100.0% of females in these age groups living above the poverty line.
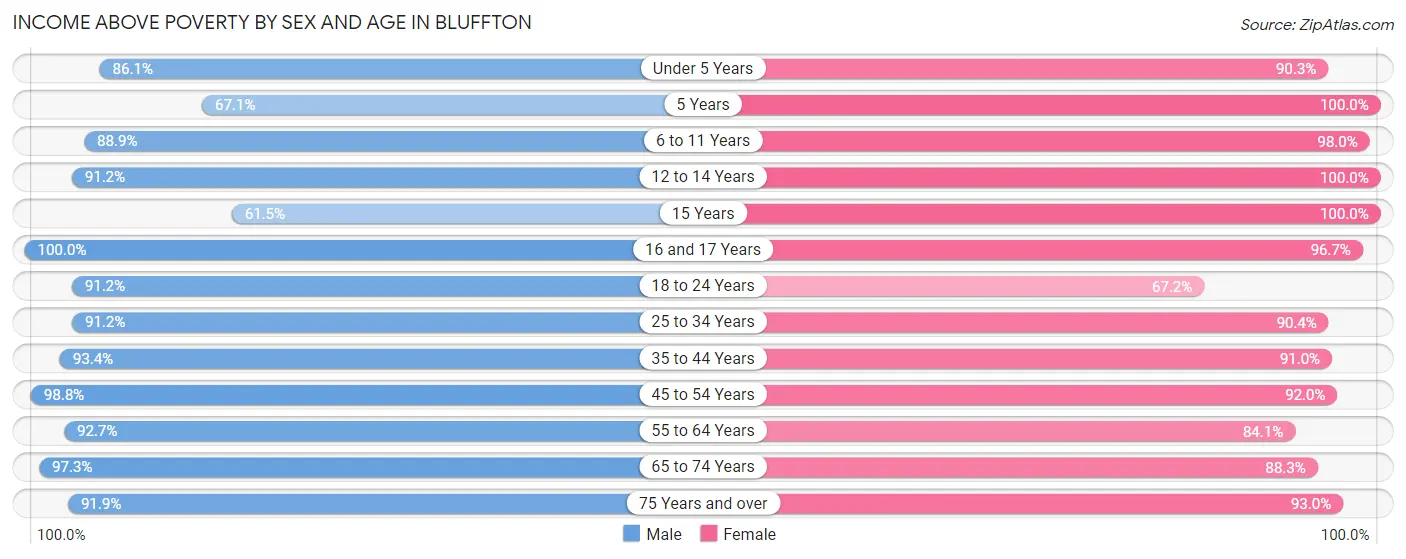
| Age Bracket | Male | Female |
| Under 5 Years | 216 (86.1%) | 306 (90.3%) |
| 5 Years | 59 (67.0%) | 103 (100.0%) |
| 6 to 11 Years | 386 (88.9%) | 383 (98.0%) |
| 12 to 14 Years | 135 (91.2%) | 288 (100.0%) |
| 15 Years | 40 (61.5%) | 75 (100.0%) |
| 16 and 17 Years | 113 (100.0%) | 204 (96.7%) |
| 18 to 24 Years | 499 (91.2%) | 312 (67.2%) |
| 25 to 34 Years | 580 (91.2%) | 460 (90.4%) |
| 35 to 44 Years | 570 (93.4%) | 574 (91.0%) |
| 45 to 54 Years | 587 (98.8%) | 629 (92.0%) |
| 55 to 64 Years | 544 (92.7%) | 561 (84.1%) |
| 65 to 74 Years | 433 (97.3%) | 544 (88.3%) |
| 75 Years and over | 251 (91.9%) | 320 (93.0%) |
| Total | 4,413 (92.1%) | 4,759 (89.4%) |
Income Below Poverty Among Married-Couple Families in Bluffton
The poverty statistics for married-couple families in Bluffton show that 2.5% or 48 of the total 1,880 families live below the poverty line. Families with 3 or 4 children have the highest poverty rate of 5.2%, comprising of 12 families. On the other hand, families with 5 or more children have the lowest poverty rate of 0.0%, which includes 0 families.
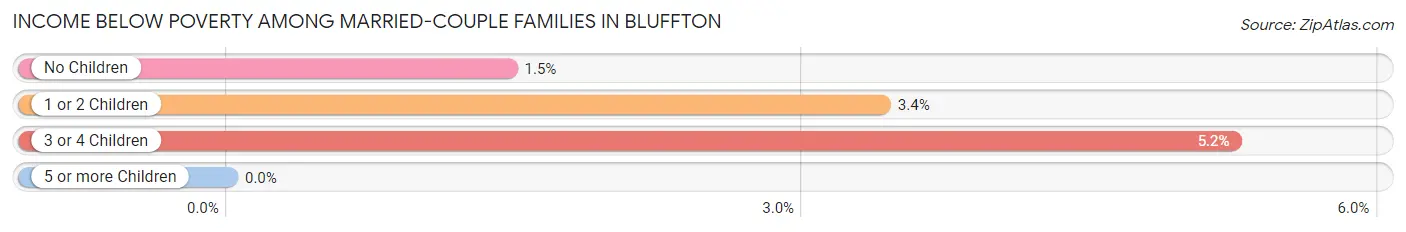
| Children | Above Poverty | Below Poverty |
| No Children | 1,010 (98.5%) | 15 (1.5%) |
| 1 or 2 Children | 595 (96.6%) | 21 (3.4%) |
| 3 or 4 Children | 217 (94.8%) | 12 (5.2%) |
| 5 or more Children | 10 (100.0%) | 0 (0.0%) |
| Total | 1,832 (97.5%) | 48 (2.5%) |
Income Below Poverty Among Single-Parent Households in Bluffton
According to the poverty data in Bluffton, 10.0% or 16 single-father households and 7.8% or 35 single-mother households are living below the poverty line. Among single-father households, those with 1 or 2 children have the highest poverty rate, with 16 households (23.5%) experiencing poverty. Likewise, among single-mother households, those with 3 or 4 children have the highest poverty rate, with 21 households (50.0%) falling below the poverty line.
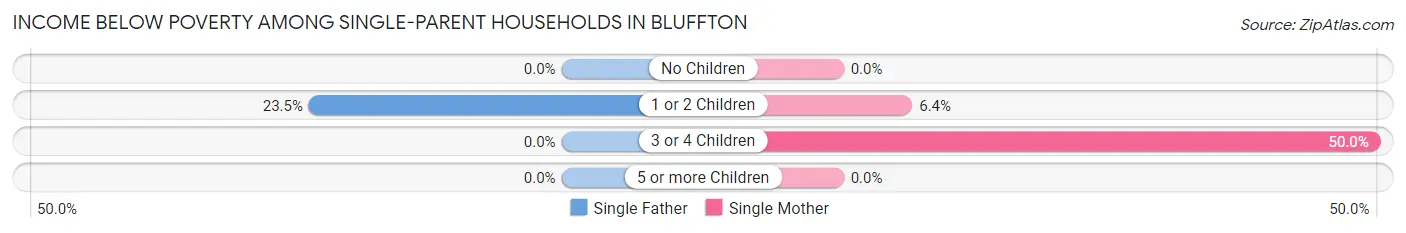
| Children | Single Father | Single Mother |
| No Children | 0 (0.0%) | 0 (0.0%) |
| 1 or 2 Children | 16 (23.5%) | 14 (6.4%) |
| 3 or 4 Children | 0 (0.0%) | 21 (50.0%) |
| 5 or more Children | 0 (0.0%) | 0 (0.0%) |
| Total | 16 (10.0%) | 35 (7.8%) |
Income Below Poverty Among Married-Couple vs Single-Parent Households in Bluffton
The poverty data for Bluffton shows that 48 of the married-couple family households (2.5%) and 51 of the single-parent households (8.4%) are living below the poverty level. Within the married-couple family households, those with 3 or 4 children have the highest poverty rate, with 12 households (5.2%) falling below the poverty line. Among the single-parent households, those with 3 or 4 children have the highest poverty rate, with 21 household (50.0%) living below poverty.
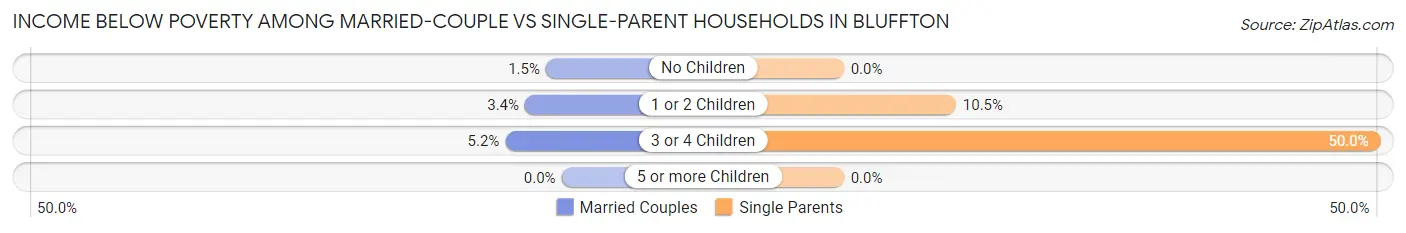
| Children | Married-Couple Families | Single-Parent Households |
| No Children | 15 (1.5%) | 0 (0.0%) |
| 1 or 2 Children | 21 (3.4%) | 30 (10.4%) |
| 3 or 4 Children | 12 (5.2%) | 21 (50.0%) |
| 5 or more Children | 0 (0.0%) | 0 (0.0%) |
| Total | 48 (2.5%) | 51 (8.4%) |
Race in Bluffton
The most populous races in Bluffton are White / Caucasian (9,458 | 90.4%), Hispanic or Latino (527 | 5.0%), and Two or more Races (383 | 3.7%).
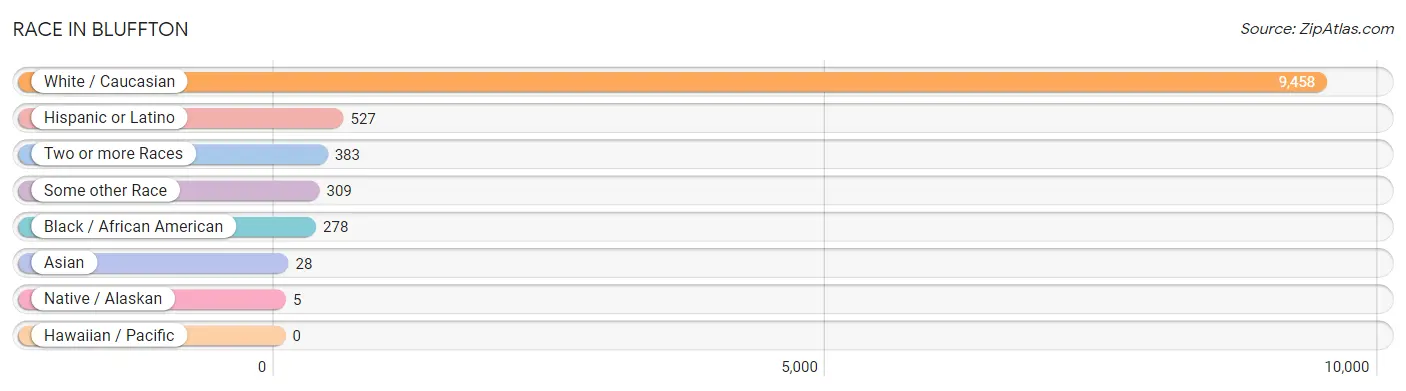
| Race | # Population | % Population |
| Asian | 28 | 0.3% |
| Black / African American | 278 | 2.7% |
| Hawaiian / Pacific | 0 | 0.0% |
| Hispanic or Latino | 527 | 5.0% |
| Native / Alaskan | 5 | 0.1% |
| White / Caucasian | 9,458 | 90.4% |
| Two or more Races | 383 | 3.7% |
| Some other Race | 309 | 2.9% |
| Total | 10,461 | 100.0% |
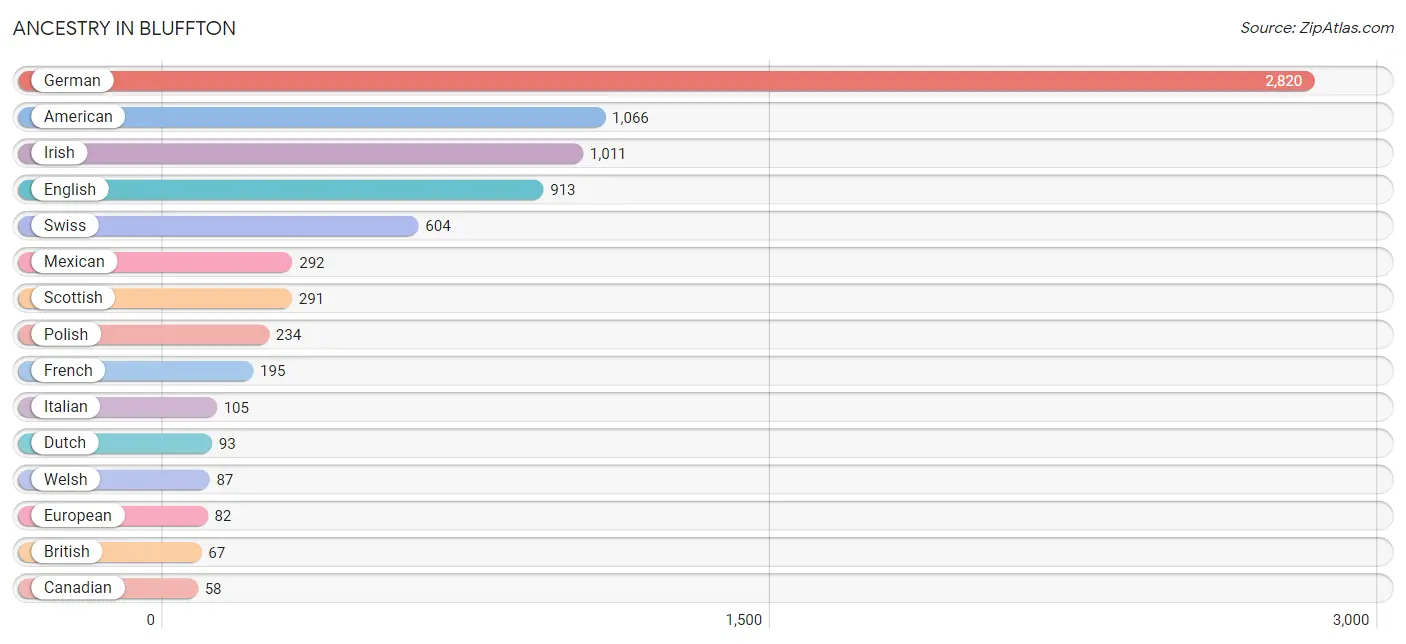
Ancestry in Bluffton
The most populous ancestries reported in Bluffton are German (2,820 | 27.0%), American (1,066 | 10.2%), Irish (1,011 | 9.7%), English (913 | 8.7%), and Swiss (604 | 5.8%), together accounting for 61.3% of all Bluffton residents.
| Ancestry | # Population | % Population |
| American | 1,066 | 10.2% |
| Belgian | 7 | 0.1% |
| British | 67 | 0.6% |
| Burmese | 13 | 0.1% |
| Canadian | 58 | 0.5% |
| Central American | 16 | 0.2% |
| Cherokee | 12 | 0.1% |
| Chippewa | 1 | 0.0% |
| Choctaw | 26 | 0.3% |
| Colombian | 1 | 0.0% |
| Croatian | 15 | 0.1% |
| Czechoslovakian | 9 | 0.1% |
| Danish | 9 | 0.1% |
| Dutch | 93 | 0.9% |
| English | 913 | 8.7% |
| European | 82 | 0.8% |
| Finnish | 3 | 0.0% |
| French | 195 | 1.9% |
| French American Indian | 8 | 0.1% |
| French Canadian | 8 | 0.1% |
| German | 2,820 | 27.0% |
| Greek | 12 | 0.1% |
| Honduran | 16 | 0.2% |
| Hungarian | 31 | 0.3% |
| Indian (Asian) | 2 | 0.0% |
| Irish | 1,011 | 9.7% |
| Israeli | 14 | 0.1% |
| Italian | 105 | 1.0% |
| Korean | 26 | 0.3% |
| Mexican | 292 | 2.8% |
| Northern European | 7 | 0.1% |
| Norwegian | 12 | 0.1% |
| Polish | 234 | 2.2% |
| Portuguese | 24 | 0.2% |
| Puerto Rican | 46 | 0.4% |
| Russian | 14 | 0.1% |
| Scandinavian | 14 | 0.1% |
| Scotch-Irish | 44 | 0.4% |
| Scottish | 291 | 2.8% |
| Sioux | 53 | 0.5% |
| Slavic | 11 | 0.1% |
| Slovak | 11 | 0.1% |
| South American | 1 | 0.0% |
| Spaniard | 26 | 0.3% |
| Spanish | 5 | 0.1% |
| Swedish | 38 | 0.4% |
| Swiss | 604 | 5.8% |
| Ukrainian | 7 | 0.1% |
| Welsh | 87 | 0.8% |
| West Indian | 46 | 0.4% | View All 50 Rows |
Immigrants in Bluffton
The most numerous immigrant groups reported in Bluffton came from Latin America (102 | 1.0%), Central America (101 | 1.0%), Mexico (85 | 0.8%), Asia (26 | 0.3%), and Europe (26 | 0.3%), together accounting for 3.3% of all Bluffton residents.
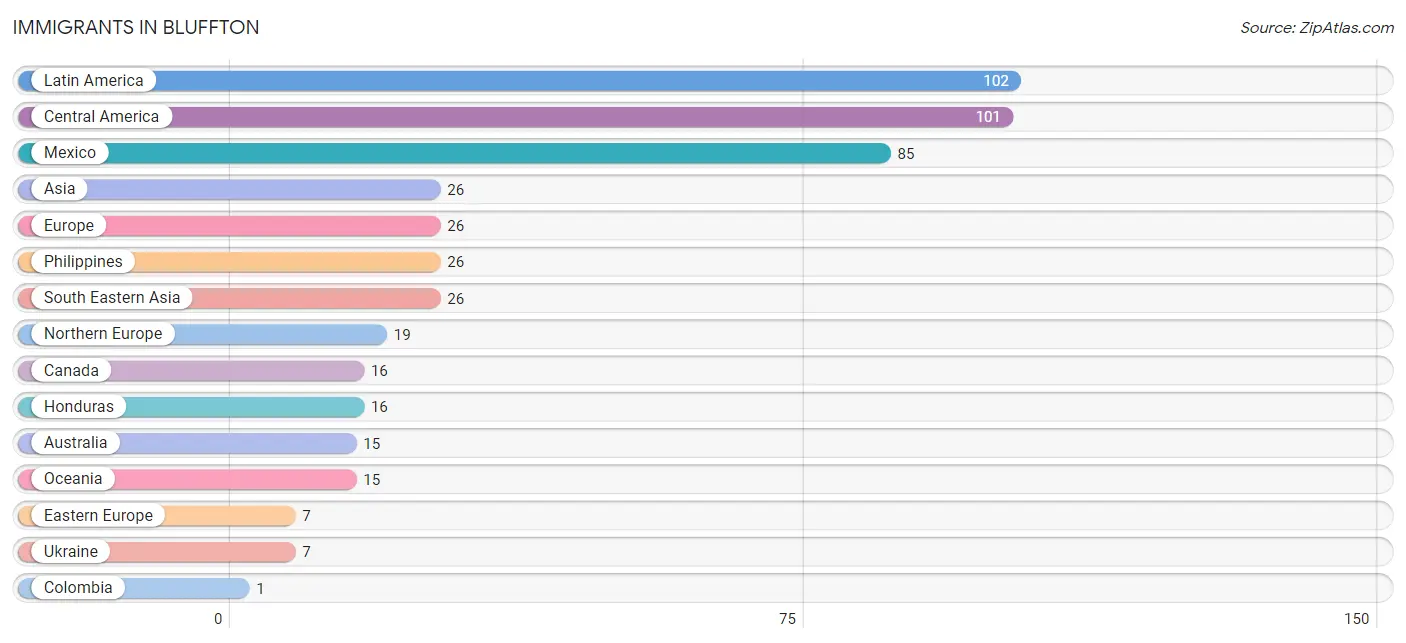
| Immigration Origin | # Population | % Population |
| Asia | 26 | 0.3% |
| Australia | 15 | 0.1% |
| Canada | 16 | 0.2% |
| Central America | 101 | 1.0% |
| Colombia | 1 | 0.0% |
| Eastern Europe | 7 | 0.1% |
| Europe | 26 | 0.3% |
| Honduras | 16 | 0.2% |
| Latin America | 102 | 1.0% |
| Mexico | 85 | 0.8% |
| Northern Europe | 19 | 0.2% |
| Oceania | 15 | 0.1% |
| Philippines | 26 | 0.3% |
| South America | 1 | 0.0% |
| South Eastern Asia | 26 | 0.3% |
| Ukraine | 7 | 0.1% | View All 16 Rows |
Sex and Age in Bluffton
Sex and Age in Bluffton
The most populous age groups in Bluffton are 20 to 24 Years (398 | 8.1%) for men and 10 to 14 Years (460 | 8.3%) for women.
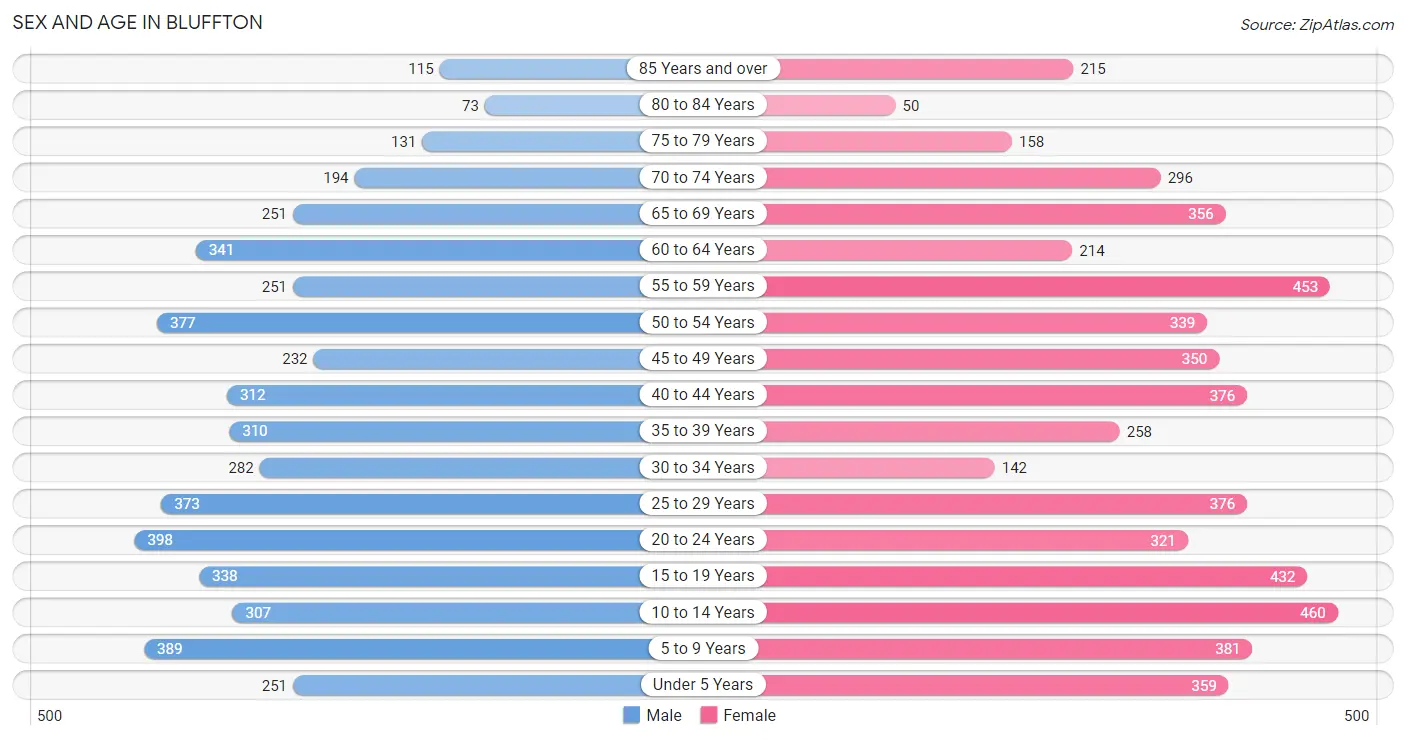
| Age Bracket | Male | Female |
| Under 5 Years | 251 (5.1%) | 359 (6.5%) |
| 5 to 9 Years | 389 (7.9%) | 381 (6.9%) |
| 10 to 14 Years | 307 (6.2%) | 460 (8.3%) |
| 15 to 19 Years | 338 (6.9%) | 432 (7.8%) |
| 20 to 24 Years | 398 (8.1%) | 321 (5.8%) |
| 25 to 29 Years | 373 (7.6%) | 376 (6.8%) |
| 30 to 34 Years | 282 (5.7%) | 142 (2.6%) |
| 35 to 39 Years | 310 (6.3%) | 258 (4.7%) |
| 40 to 44 Years | 312 (6.3%) | 376 (6.8%) |
| 45 to 49 Years | 232 (4.7%) | 350 (6.3%) |
| 50 to 54 Years | 377 (7.6%) | 339 (6.1%) |
| 55 to 59 Years | 251 (5.1%) | 453 (8.2%) |
| 60 to 64 Years | 341 (6.9%) | 214 (3.9%) |
| 65 to 69 Years | 251 (5.1%) | 356 (6.4%) |
| 70 to 74 Years | 194 (3.9%) | 296 (5.3%) |
| 75 to 79 Years | 131 (2.7%) | 158 (2.9%) |
| 80 to 84 Years | 73 (1.5%) | 50 (0.9%) |
| 85 Years and over | 115 (2.3%) | 215 (3.9%) |
| Total | 4,925 (100.0%) | 5,536 (100.0%) |
Families and Households in Bluffton
Median Family Size in Bluffton
The median family size in Bluffton is 3.16 persons per family, with married-couple families (1,880 | 75.6%) accounting for the largest median family size of 3.34 persons per family. On the other hand, single male/father families (160 | 6.4%) represent the smallest median family size with 2.33 persons per family.
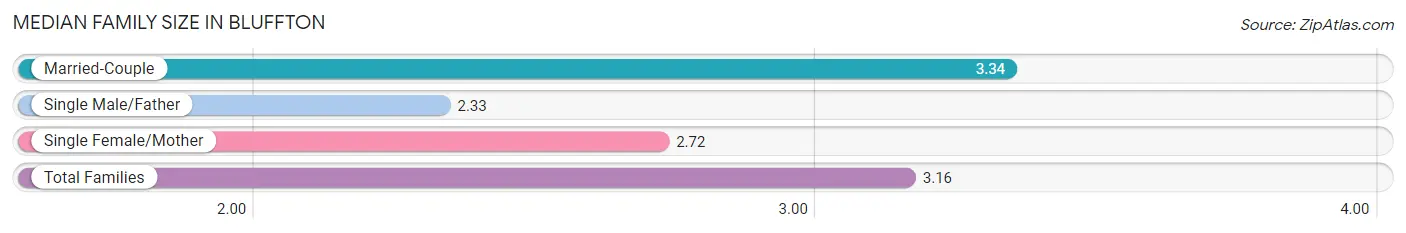
| Family Type | # Families | Family Size |
| Married-Couple | 1,880 (75.6%) | 3.34 |
| Single Male/Father | 160 (6.4%) | 2.33 |
| Single Female/Mother | 448 (18.0%) | 2.72 |
| Total Families | 2,488 (100.0%) | 3.16 |
Median Household Size in Bluffton
The median household size in Bluffton is 2.37 persons per household, with married-couple households (1,880 | 43.7%) accounting for the largest median household size of 3.4 persons per household. non-family households (1,810 | 42.1%) represent the smallest median household size with 1.12 persons per household.
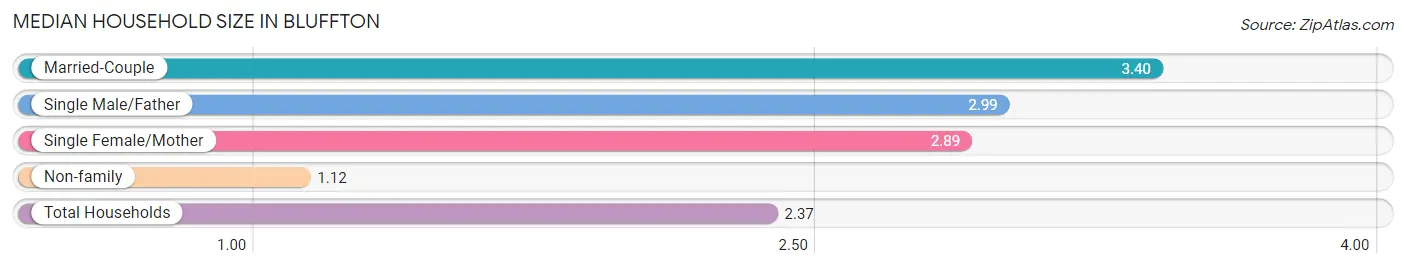
| Household Type | # Households | Household Size |
| Married-Couple | 1,880 (43.7%) | 3.40 |
| Single Male/Father | 160 (3.7%) | 2.99 |
| Single Female/Mother | 448 (10.4%) | 2.89 |
| Non-family | 1,810 (42.1%) | 1.12 |
| Total Households | 4,298 (100.0%) | 2.37 |
Household Size by Marriage Status in Bluffton
Out of a total of 4,298 households in Bluffton, 2,488 (57.9%) are family households, while 1,810 (42.1%) are nonfamily households. The most numerous type of family households are 2-person households, comprising 1,158, and the most common type of nonfamily households are 1-person households, comprising 1,614.
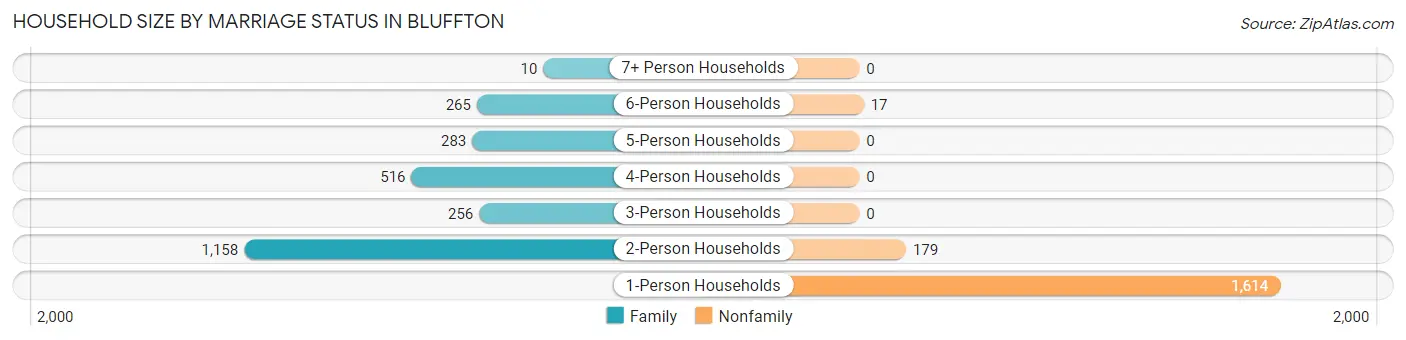
| Household Size | Family Households | Nonfamily Households |
| 1-Person Households | - | 1,614 (37.6%) |
| 2-Person Households | 1,158 (26.9%) | 179 (4.2%) |
| 3-Person Households | 256 (6.0%) | 0 (0.0%) |
| 4-Person Households | 516 (12.0%) | 0 (0.0%) |
| 5-Person Households | 283 (6.6%) | 0 (0.0%) |
| 6-Person Households | 265 (6.2%) | 17 (0.4%) |
| 7+ Person Households | 10 (0.2%) | 0 (0.0%) |
| Total | 2,488 (57.9%) | 1,810 (42.1%) |
Female Fertility in Bluffton
Fertility by Age in Bluffton
Average fertility rate in Bluffton is 94.0 births per 1,000 women. Women in the age bracket of 20 to 34 years have the highest fertility rate with 243.0 births per 1,000 women. Women in the age bracket of 20 to 34 years acount for 94.4% of all women with births.
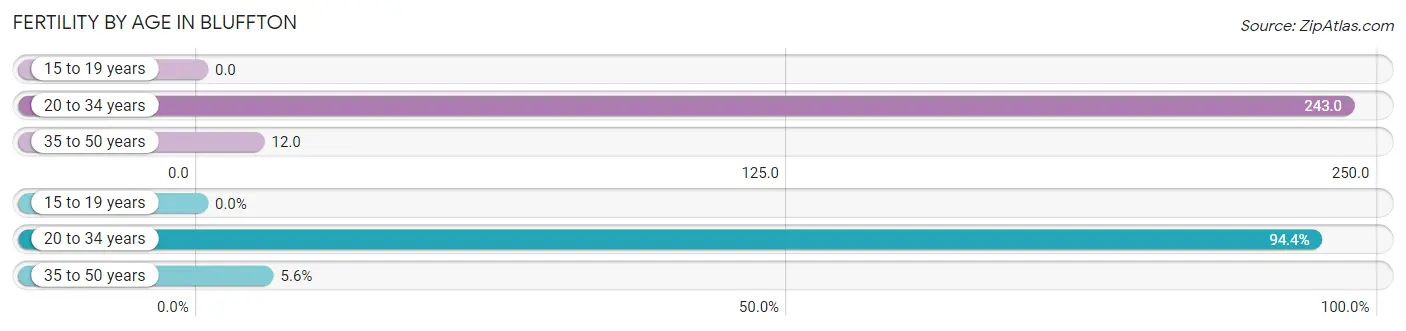
| Age Bracket | Women with Births | Births / 1,000 Women |
| 15 to 19 years | 0 (0.0%) | 0.0 |
| 20 to 34 years | 204 (94.4%) | 243.0 |
| 35 to 50 years | 12 (5.6%) | 12.0 |
| Total | 216 (100.0%) | 94.0 |
Fertility by Age by Marriage Status in Bluffton
75.9% of women with births (216) in Bluffton are married. The highest percentage of unmarried women with births falls into 35 to 50 years age bracket with 100.0% of them unmarried at the time of birth, while the lowest percentage of unmarried women with births belong to 20 to 34 years age bracket with 19.6% of them unmarried.
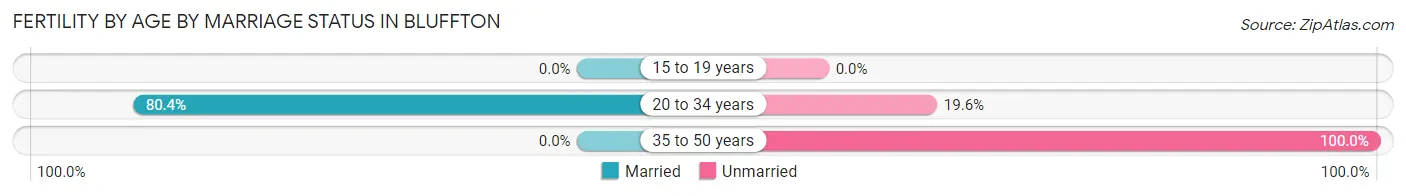
| Age Bracket | Married | Unmarried |
| 15 to 19 years | 0 (0.0%) | 0 (0.0%) |
| 20 to 34 years | 164 (80.4%) | 40 (19.6%) |
| 35 to 50 years | 0 (0.0%) | 12 (100.0%) |
| Total | 164 (75.9%) | 52 (24.1%) |
Fertility by Education in Bluffton
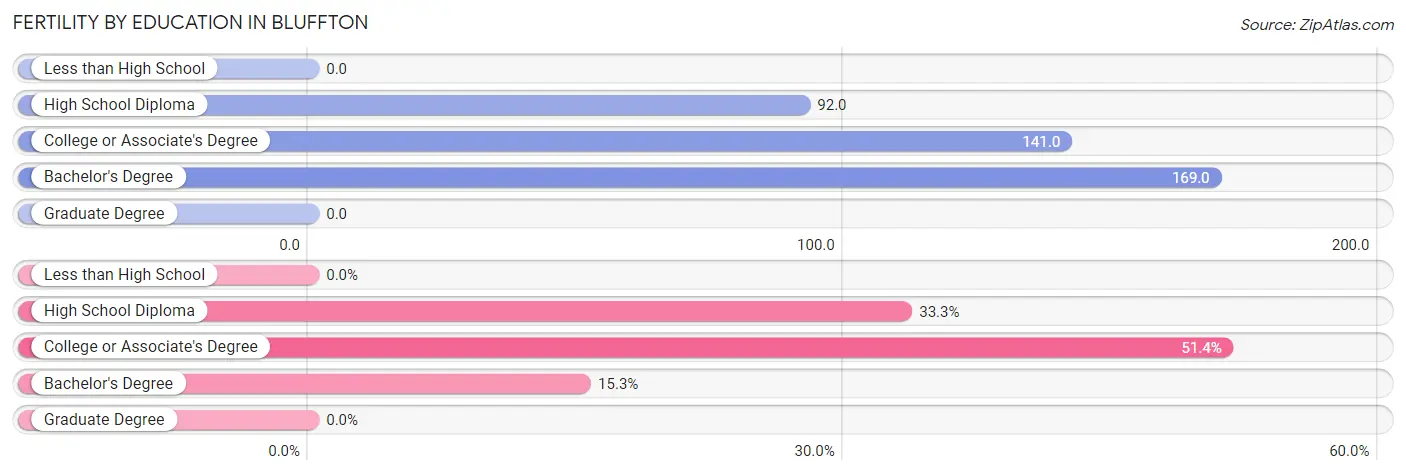
| Educational Attainment | Women with Births | Births / 1,000 Women |
| Less than High School | 0 (0.0%) | 0.0 |
| High School Diploma | 72 (33.3%) | 92.0 |
| College or Associate's Degree | 111 (51.4%) | 141.0 |
| Bachelor's Degree | 33 (15.3%) | 169.0 |
| Graduate Degree | 0 (0.0%) | 0.0 |
| Total | 216 (100.0%) | 94.0 |
Fertility by Education by Marriage Status in Bluffton
24.1% of women with births in Bluffton are unmarried. Women with the educational attainment of bachelor's degree are most likely to be married with 100.0% of them married at childbirth, while women with the educational attainment of high school diploma are least likely to be married with 43.1% of them unmarried at childbirth.
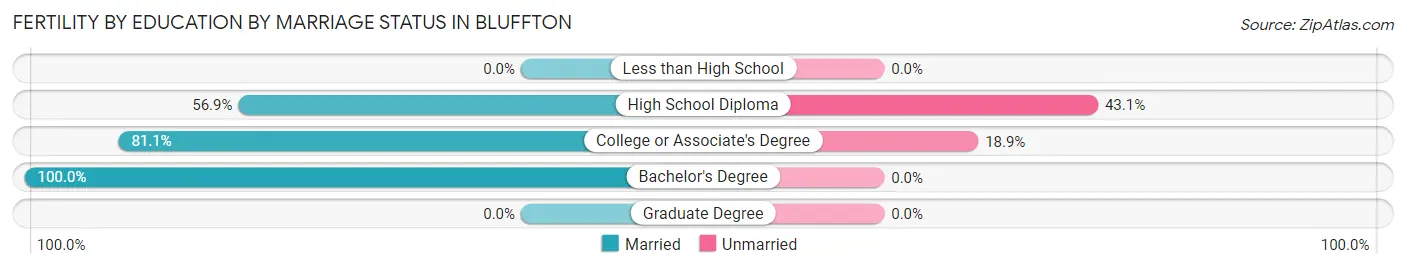
| Educational Attainment | Married | Unmarried |
| Less than High School | 0 (0.0%) | 0 (0.0%) |
| High School Diploma | 41 (56.9%) | 31 (43.1%) |
| College or Associate's Degree | 90 (81.1%) | 21 (18.9%) |
| Bachelor's Degree | 33 (100.0%) | 0 (0.0%) |
| Graduate Degree | 0 (0.0%) | 0 (0.0%) |
| Total | 164 (75.9%) | 52 (24.1%) |
Employment Characteristics in Bluffton
Employment by Class of Employer in Bluffton
Among the 5,276 employed individuals in Bluffton, private company employees (3,903 | 74.0%), not-for-profit organizations (425 | 8.1%), and local government employees (383 | 7.3%) make up the most common classes of employment.
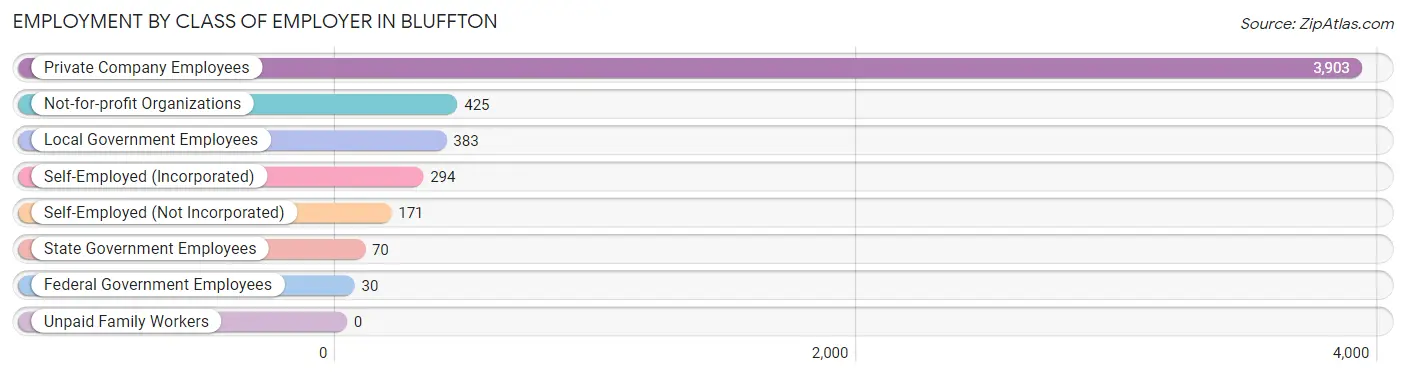
| Employer Class | # Employees | % Employees |
| Private Company Employees | 3,903 | 74.0% |
| Self-Employed (Incorporated) | 294 | 5.6% |
| Self-Employed (Not Incorporated) | 171 | 3.2% |
| Not-for-profit Organizations | 425 | 8.1% |
| Local Government Employees | 383 | 7.3% |
| State Government Employees | 70 | 1.3% |
| Federal Government Employees | 30 | 0.6% |
| Unpaid Family Workers | 0 | 0.0% |
| Total | 5,276 | 100.0% |
Employment Status by Age in Bluffton
According to the labor force statistics for Bluffton, out of the total population over 16 years of age (8,174), 67.4% or 5,509 individuals are in the labor force, with 4.0% or 220 of them unemployed. The age group with the highest labor force participation rate is 20 to 24 years, with 98.2% or 706 individuals in the labor force. Within the labor force, the 35 to 44 years age range has the highest percentage of unemployed individuals, with 13.3% or 142 of them being unemployed.
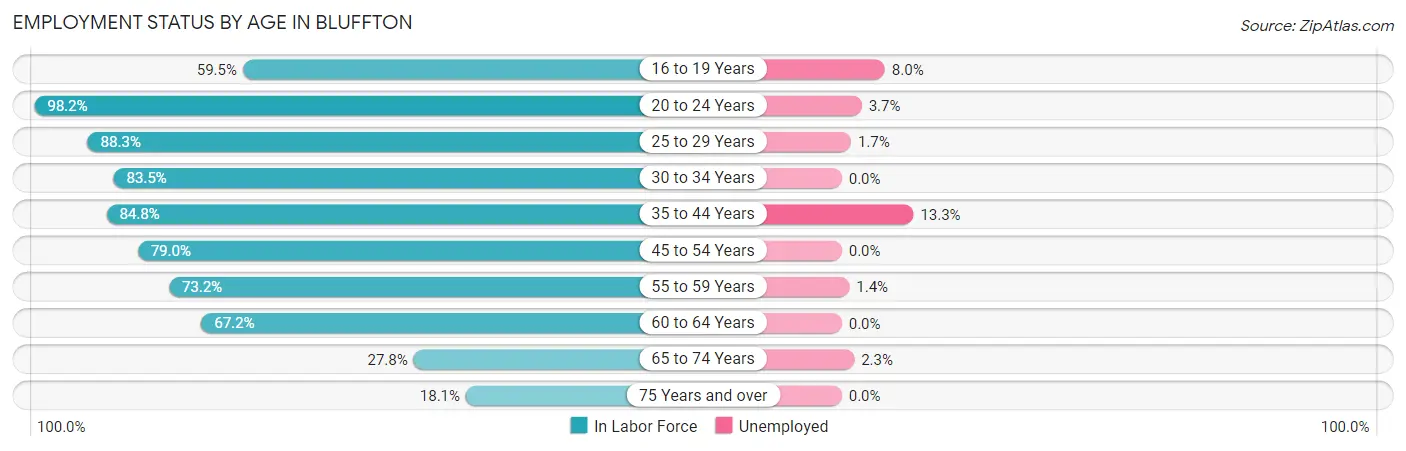
| Age Bracket | In Labor Force | Unemployed |
| 16 to 19 Years | 375 (59.5%) | 30 (8.0%) |
| 20 to 24 Years | 706 (98.2%) | 26 (3.7%) |
| 25 to 29 Years | 661 (88.3%) | 11 (1.7%) |
| 30 to 34 Years | 354 (83.5%) | 0 (0.0%) |
| 35 to 44 Years | 1,065 (84.8%) | 142 (13.3%) |
| 45 to 54 Years | 1,025 (79.0%) | 0 (0.0%) |
| 55 to 59 Years | 515 (73.2%) | 7 (1.4%) |
| 60 to 64 Years | 373 (67.2%) | 0 (0.0%) |
| 65 to 74 Years | 305 (27.8%) | 7 (2.3%) |
| 75 Years and over | 134 (18.1%) | 0 (0.0%) |
| Total | 5,509 (67.4%) | 220 (4.0%) |
Employment Status by Educational Attainment in Bluffton
According to labor force statistics for Bluffton, 80.1% of individuals (3,994) out of the total population between 25 and 64 years of age (4,986) are in the labor force, with 4.0% or 160 of them being unemployed. The group with the highest labor force participation rate are those with the educational attainment of bachelor's degree or higher, with 91.1% or 740 individuals in the labor force. Within the labor force, individuals with high school diploma education have the highest percentage of unemployment, with 8.7% or 147 of them being unemployed.
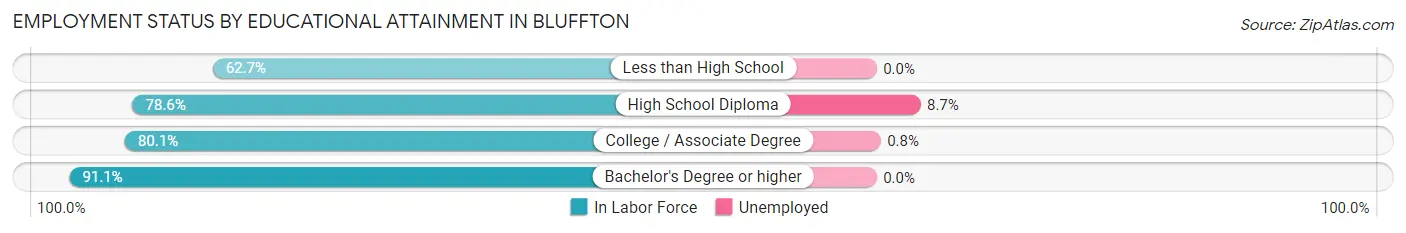
| Educational Attainment | In Labor Force | Unemployed |
| Less than High School | 208 (62.7%) | 0 (0.0%) |
| High School Diploma | 1,689 (78.6%) | 187 (8.7%) |
| College / Associate Degree | 1,356 (80.1%) | 14 (0.8%) |
| Bachelor's Degree or higher | 740 (91.1%) | 0 (0.0%) |
| Total | 3,994 (80.1%) | 199 (4.0%) |
Employment Occupations by Sex in Bluffton
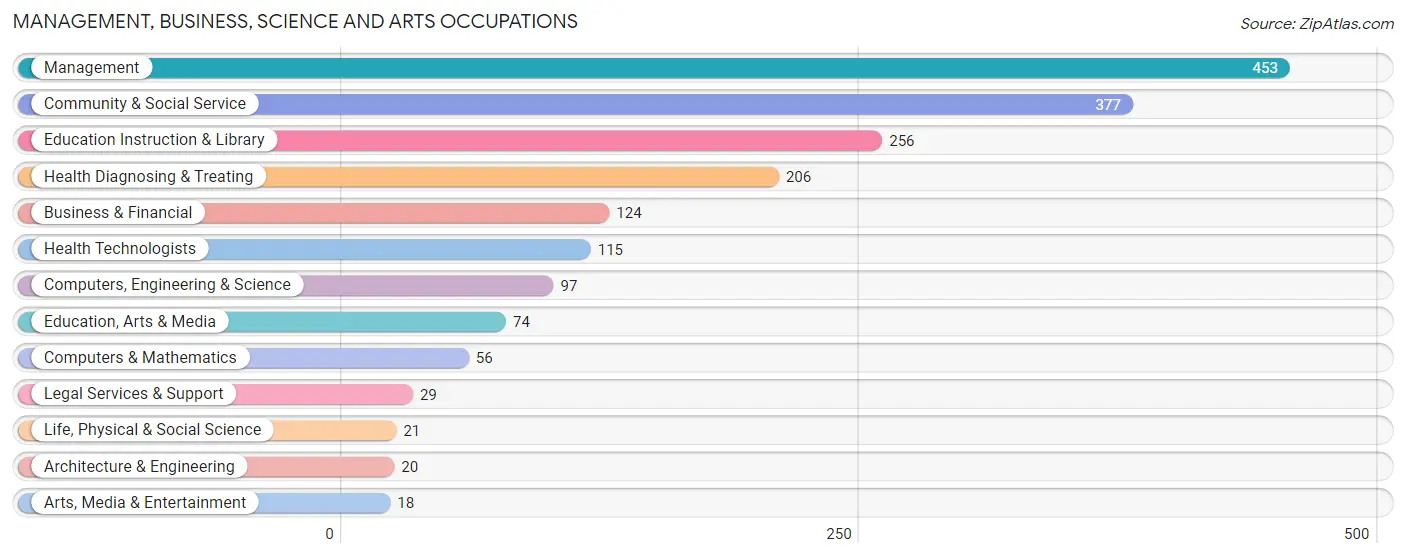
Management, Business, Science and Arts Occupations
The most common Management, Business, Science and Arts occupations in Bluffton are Management (453 | 8.6%), Community & Social Service (377 | 7.1%), Education Instruction & Library (256 | 4.9%), Health Diagnosing & Treating (206 | 3.9%), and Business & Financial (124 | 2.4%).
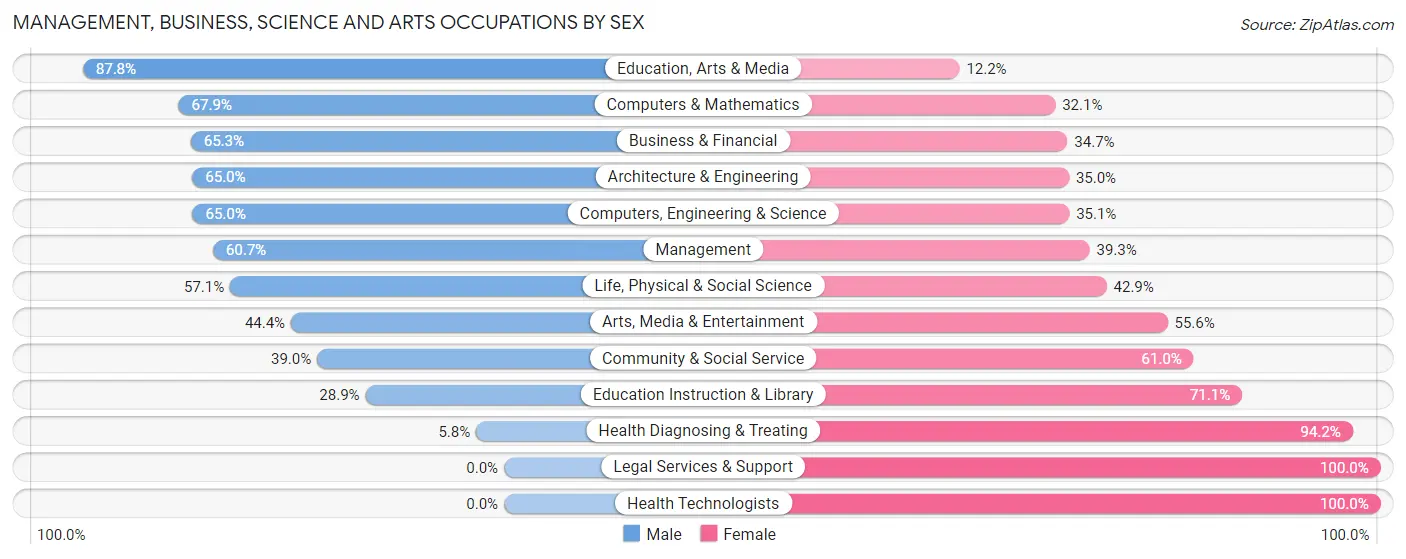
Management, Business, Science and Arts Occupations by Sex
Within the Management, Business, Science and Arts occupations in Bluffton, the most male-oriented occupations are Education, Arts & Media (87.8%), Computers & Mathematics (67.9%), and Business & Financial (65.3%), while the most female-oriented occupations are Legal Services & Support (100.0%), Health Technologists (100.0%), and Health Diagnosing & Treating (94.2%).
| Occupation | Male | Female |
| Management | 275 (60.7%) | 178 (39.3%) |
| Business & Financial | 81 (65.3%) | 43 (34.7%) |
| Computers, Engineering & Science | 63 (64.9%) | 34 (35.0%) |
| Computers & Mathematics | 38 (67.9%) | 18 (32.1%) |
| Architecture & Engineering | 13 (65.0%) | 7 (35.0%) |
| Life, Physical & Social Science | 12 (57.1%) | 9 (42.9%) |
| Community & Social Service | 147 (39.0%) | 230 (61.0%) |
| Education, Arts & Media | 65 (87.8%) | 9 (12.2%) |
| Legal Services & Support | 0 (0.0%) | 29 (100.0%) |
| Education Instruction & Library | 74 (28.9%) | 182 (71.1%) |
| Arts, Media & Entertainment | 8 (44.4%) | 10 (55.6%) |
| Health Diagnosing & Treating | 12 (5.8%) | 194 (94.2%) |
| Health Technologists | 0 (0.0%) | 115 (100.0%) |
| Total (Category) | 578 (46.0%) | 679 (54.0%) |
| Total (Overall) | 2,916 (55.2%) | 2,364 (44.8%) |
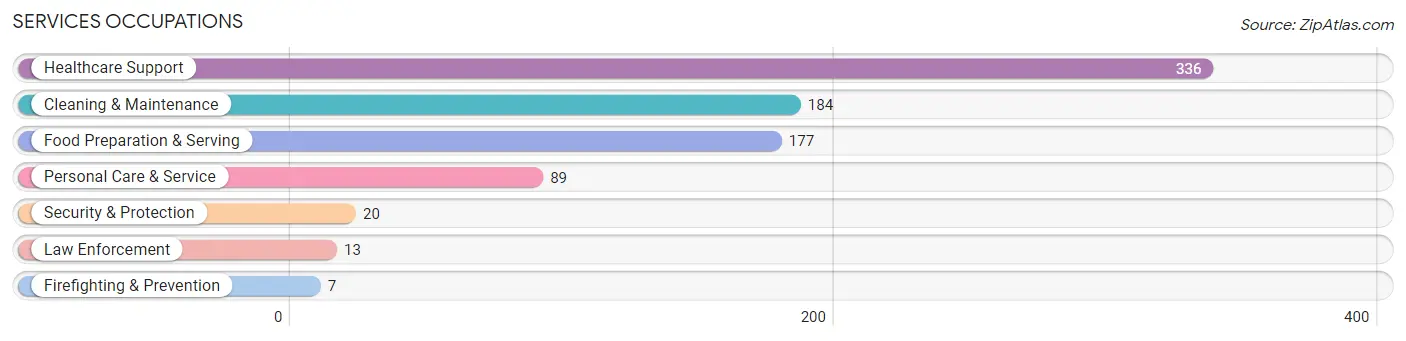
Services Occupations
The most common Services occupations in Bluffton are Healthcare Support (336 | 6.4%), Cleaning & Maintenance (184 | 3.5%), Food Preparation & Serving (177 | 3.4%), Personal Care & Service (89 | 1.7%), and Security & Protection (20 | 0.4%).
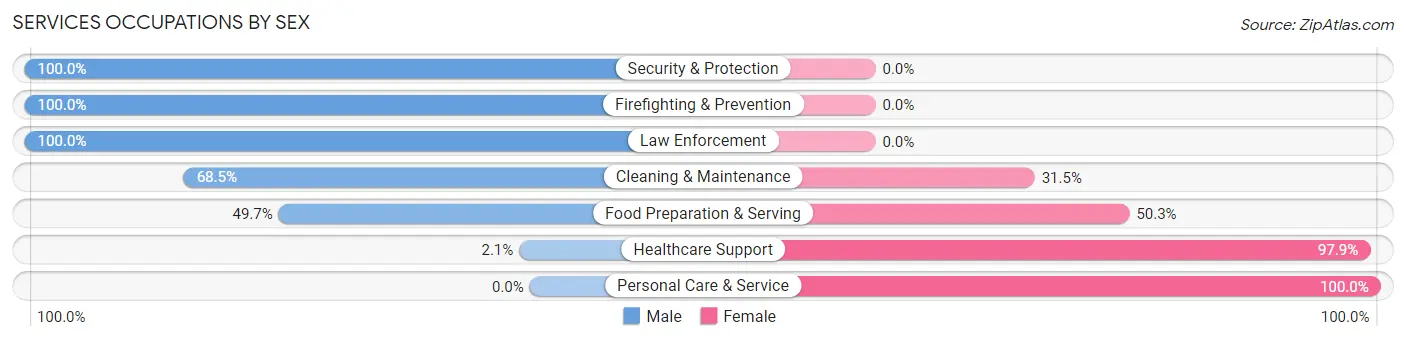
Services Occupations by Sex
Within the Services occupations in Bluffton, the most male-oriented occupations are Security & Protection (100.0%), Firefighting & Prevention (100.0%), and Law Enforcement (100.0%), while the most female-oriented occupations are Personal Care & Service (100.0%), Healthcare Support (97.9%), and Food Preparation & Serving (50.3%).
| Occupation | Male | Female |
| Healthcare Support | 7 (2.1%) | 329 (97.9%) |
| Security & Protection | 20 (100.0%) | 0 (0.0%) |
| Firefighting & Prevention | 7 (100.0%) | 0 (0.0%) |
| Law Enforcement | 13 (100.0%) | 0 (0.0%) |
| Food Preparation & Serving | 88 (49.7%) | 89 (50.3%) |
| Cleaning & Maintenance | 126 (68.5%) | 58 (31.5%) |
| Personal Care & Service | 0 (0.0%) | 89 (100.0%) |
| Total (Category) | 241 (29.9%) | 565 (70.1%) |
| Total (Overall) | 2,916 (55.2%) | 2,364 (44.8%) |
Sales and Office Occupations
The most common Sales and Office occupations in Bluffton are Sales & Related (594 | 11.3%), and Office & Administration (592 | 11.2%).
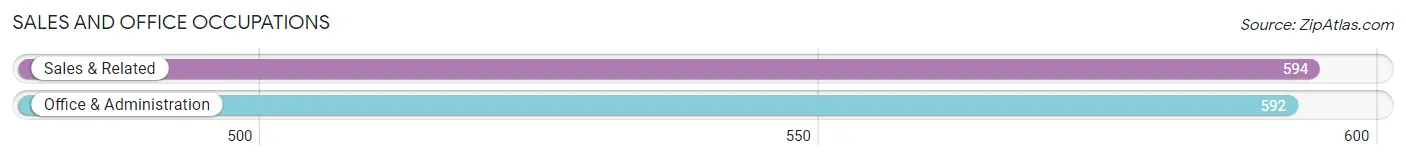
Sales and Office Occupations by Sex
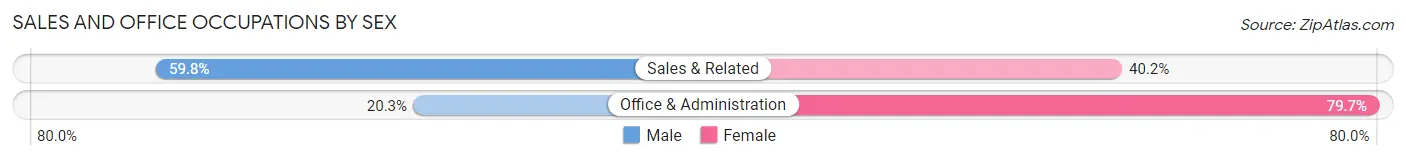
| Occupation | Male | Female |
| Sales & Related | 355 (59.8%) | 239 (40.2%) |
| Office & Administration | 120 (20.3%) | 472 (79.7%) |
| Total (Category) | 475 (40.1%) | 711 (60.0%) |
| Total (Overall) | 2,916 (55.2%) | 2,364 (44.8%) |
Natural Resources, Construction and Maintenance Occupations
The most common Natural Resources, Construction and Maintenance occupations in Bluffton are Installation, Maintenance & Repair (251 | 4.8%), Construction & Extraction (121 | 2.3%), and Farming, Fishing & Forestry (16 | 0.3%).
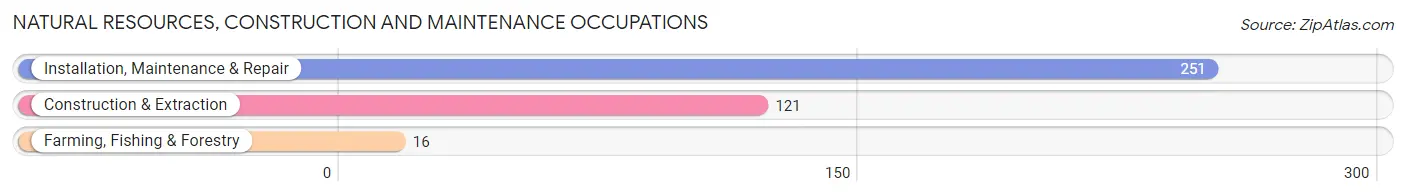
Natural Resources, Construction and Maintenance Occupations by Sex
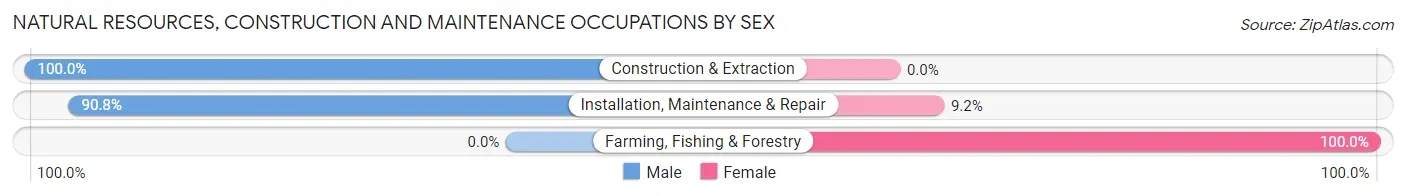
| Occupation | Male | Female |
| Farming, Fishing & Forestry | 0 (0.0%) | 16 (100.0%) |
| Construction & Extraction | 121 (100.0%) | 0 (0.0%) |
| Installation, Maintenance & Repair | 228 (90.8%) | 23 (9.2%) |
| Total (Category) | 349 (89.9%) | 39 (10.1%) |
| Total (Overall) | 2,916 (55.2%) | 2,364 (44.8%) |
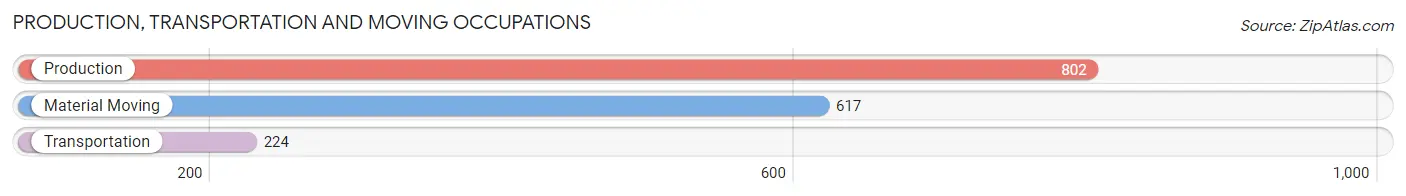
Production, Transportation and Moving Occupations
The most common Production, Transportation and Moving occupations in Bluffton are Production (802 | 15.2%), Material Moving (617 | 11.7%), and Transportation (224 | 4.2%).
Production, Transportation and Moving Occupations by Sex
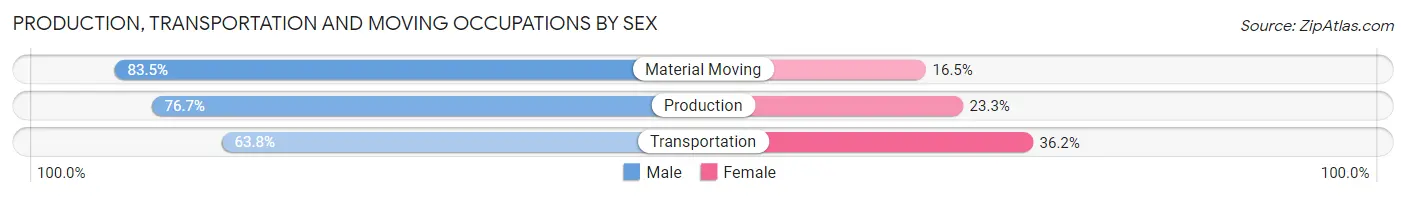
| Occupation | Male | Female |
| Production | 615 (76.7%) | 187 (23.3%) |
| Transportation | 143 (63.8%) | 81 (36.2%) |
| Material Moving | 515 (83.5%) | 102 (16.5%) |
| Total (Category) | 1,273 (77.5%) | 370 (22.5%) |
| Total (Overall) | 2,916 (55.2%) | 2,364 (44.8%) |
Employment Industries by Sex in Bluffton
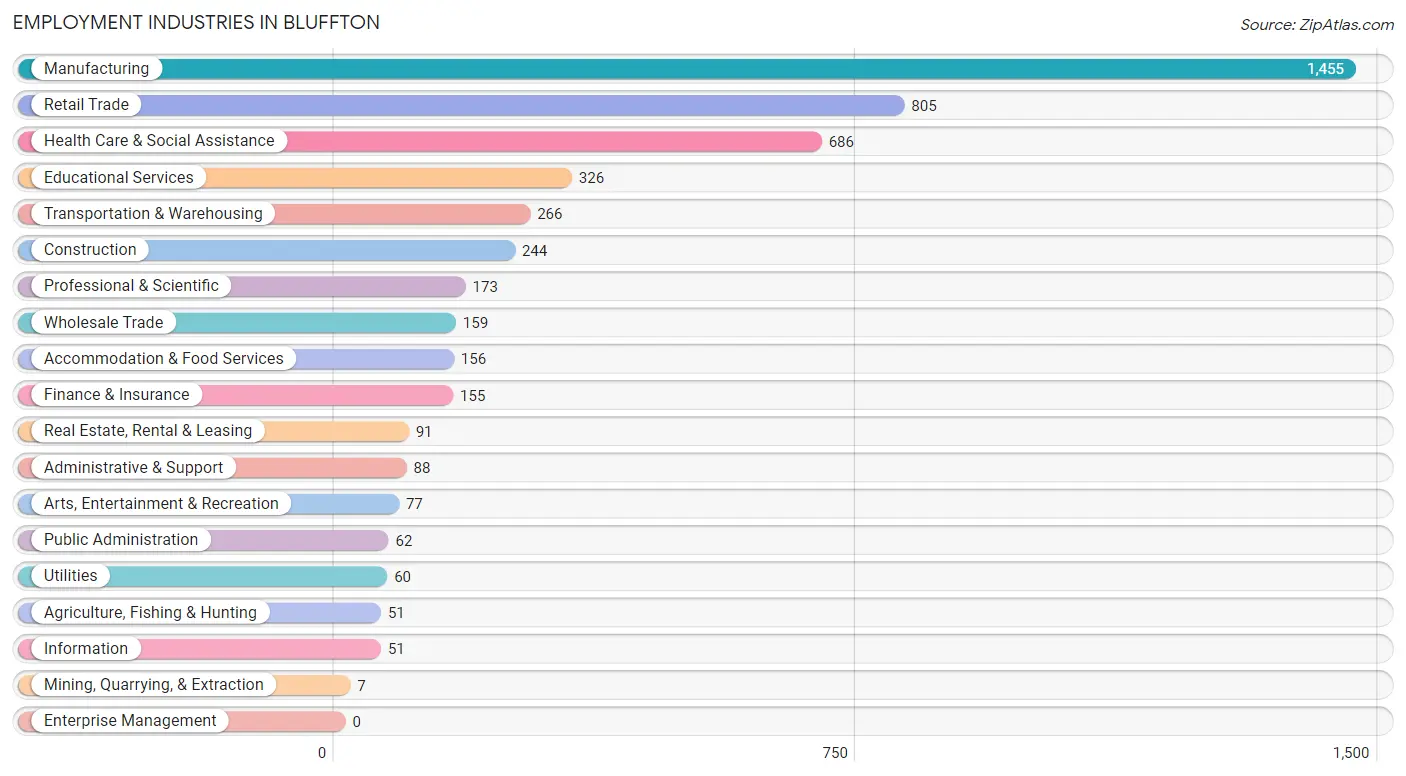
Employment Industries in Bluffton
The major employment industries in Bluffton include Manufacturing (1,455 | 27.6%), Retail Trade (805 | 15.2%), Health Care & Social Assistance (686 | 13.0%), Educational Services (326 | 6.2%), and Transportation & Warehousing (266 | 5.0%).
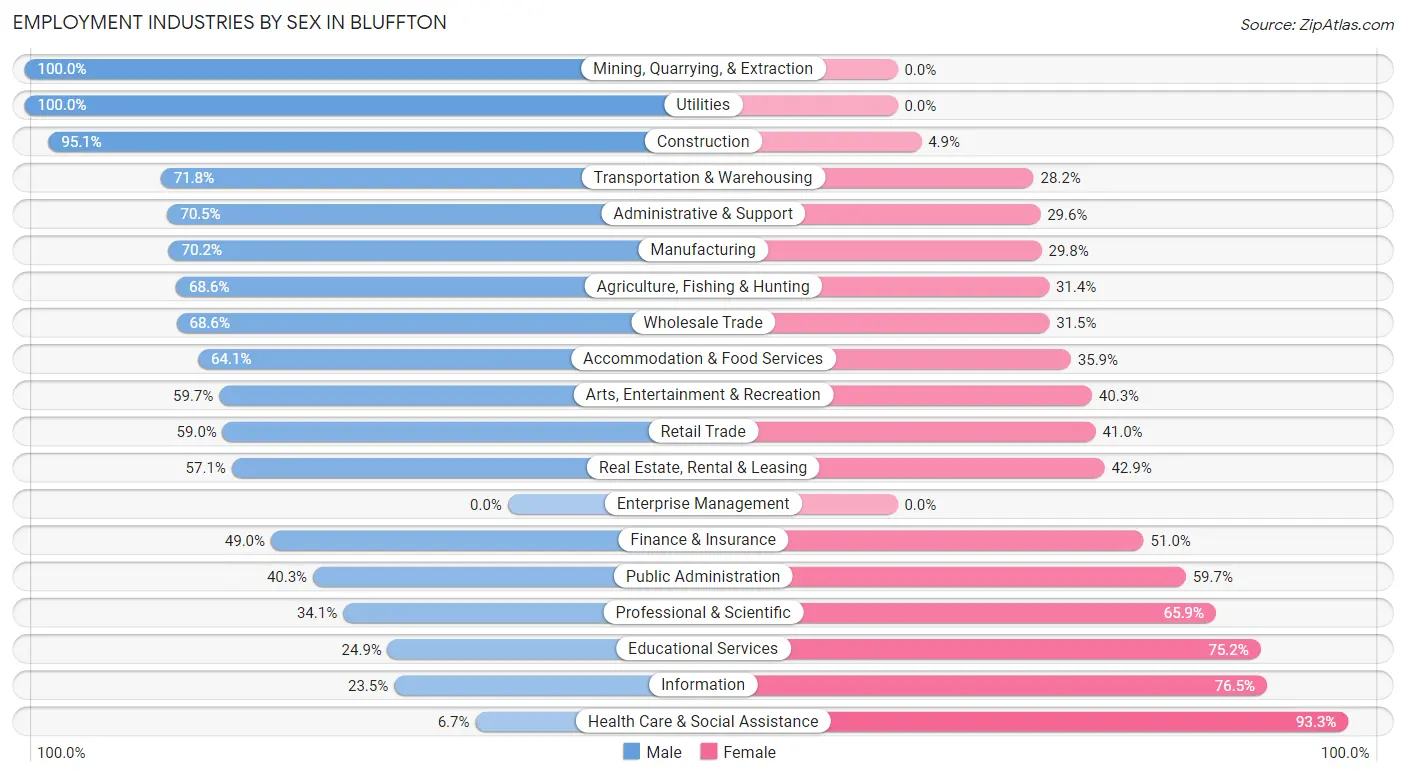
Employment Industries by Sex in Bluffton
The Bluffton industries that see more men than women are Mining, Quarrying, & Extraction (100.0%), Utilities (100.0%), and Construction (95.1%), whereas the industries that tend to have a higher number of women are Health Care & Social Assistance (93.3%), Information (76.5%), and Educational Services (75.1%).
| Industry | Male | Female |
| Agriculture, Fishing & Hunting | 35 (68.6%) | 16 (31.4%) |
| Mining, Quarrying, & Extraction | 7 (100.0%) | 0 (0.0%) |
| Construction | 232 (95.1%) | 12 (4.9%) |
| Manufacturing | 1,021 (70.2%) | 434 (29.8%) |
| Wholesale Trade | 109 (68.5%) | 50 (31.5%) |
| Retail Trade | 475 (59.0%) | 330 (41.0%) |
| Transportation & Warehousing | 191 (71.8%) | 75 (28.2%) |
| Utilities | 60 (100.0%) | 0 (0.0%) |
| Information | 12 (23.5%) | 39 (76.5%) |
| Finance & Insurance | 76 (49.0%) | 79 (51.0%) |
| Real Estate, Rental & Leasing | 52 (57.1%) | 39 (42.9%) |
| Professional & Scientific | 59 (34.1%) | 114 (65.9%) |
| Enterprise Management | 0 (0.0%) | 0 (0.0%) |
| Administrative & Support | 62 (70.5%) | 26 (29.5%) |
| Educational Services | 81 (24.8%) | 245 (75.1%) |
| Health Care & Social Assistance | 46 (6.7%) | 640 (93.3%) |
| Arts, Entertainment & Recreation | 46 (59.7%) | 31 (40.3%) |
| Accommodation & Food Services | 100 (64.1%) | 56 (35.9%) |
| Public Administration | 25 (40.3%) | 37 (59.7%) |
| Total | 2,916 (55.2%) | 2,364 (44.8%) |
Education in Bluffton
School Enrollment in Bluffton
The most common levels of schooling among the 2,421 students in Bluffton are middle school (651 | 26.9%), high school (616 | 25.4%), and elementary school (567 | 23.4%).
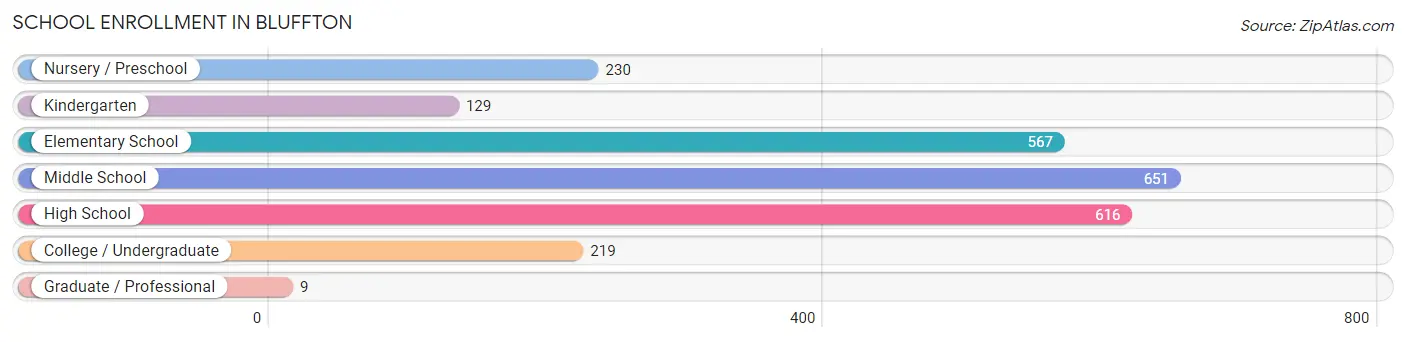
| School Level | # Students | % Students |
| Nursery / Preschool | 230 | 9.5% |
| Kindergarten | 129 | 5.3% |
| Elementary School | 567 | 23.4% |
| Middle School | 651 | 26.9% |
| High School | 616 | 25.4% |
| College / Undergraduate | 219 | 9.0% |
| Graduate / Professional | 9 | 0.4% |
| Total | 2,421 | 100.0% |
School Enrollment by Age by Funding Source in Bluffton
Out of a total of 2,421 students who are enrolled in schools in Bluffton, 312 (12.9%) attend a private institution, while the remaining 2,109 (87.1%) are enrolled in public schools. The age group of 3 to 4 year olds has the highest likelihood of being enrolled in private schools, with 34 (26.6% in the age bracket) enrolled. Conversely, the age group of 25 to 34 year olds has the lowest likelihood of being enrolled in a private school, with 31 (100.0% in the age bracket) attending a public institution.
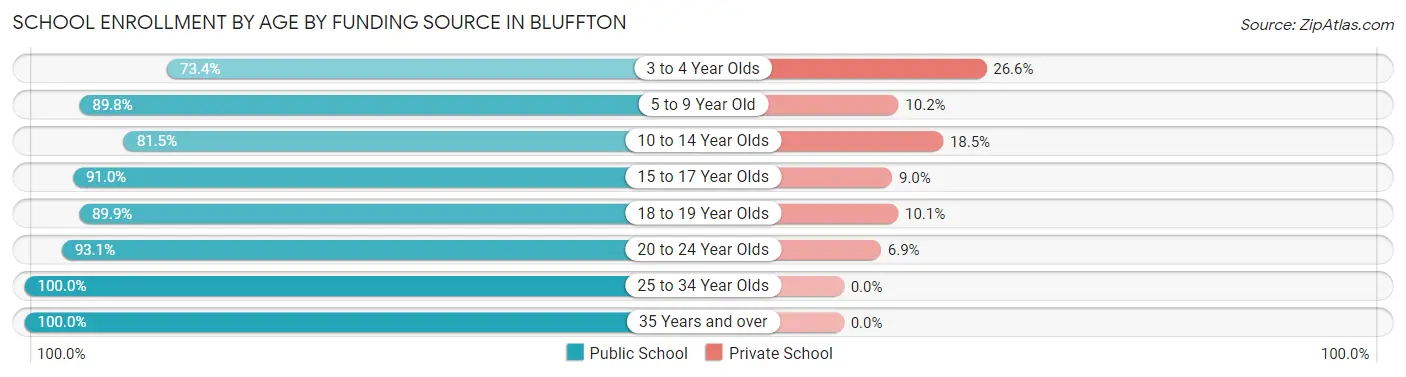
| Age Bracket | Public School | Private School |
| 3 to 4 Year Olds | 94 (73.4%) | 34 (26.6%) |
| 5 to 9 Year Old | 660 (89.8%) | 75 (10.2%) |
| 10 to 14 Year Olds | 604 (81.5%) | 137 (18.5%) |
| 15 to 17 Year Olds | 424 (91.0%) | 42 (9.0%) |
| 18 to 19 Year Olds | 142 (89.9%) | 16 (10.1%) |
| 20 to 24 Year Olds | 121 (93.1%) | 9 (6.9%) |
| 25 to 34 Year Olds | 31 (100.0%) | 0 (0.0%) |
| 35 Years and over | 32 (100.0%) | 0 (0.0%) |
| Total | 2,109 (87.1%) | 312 (12.9%) |
Educational Attainment by Field of Study in Bluffton
Business (288 | 24.2%), education (192 | 16.1%), science & technology (113 | 9.5%), engineering (102 | 8.6%), and liberal arts & history (92 | 7.7%) are the most common fields of study among 1,191 individuals in Bluffton who have obtained a bachelor's degree or higher.
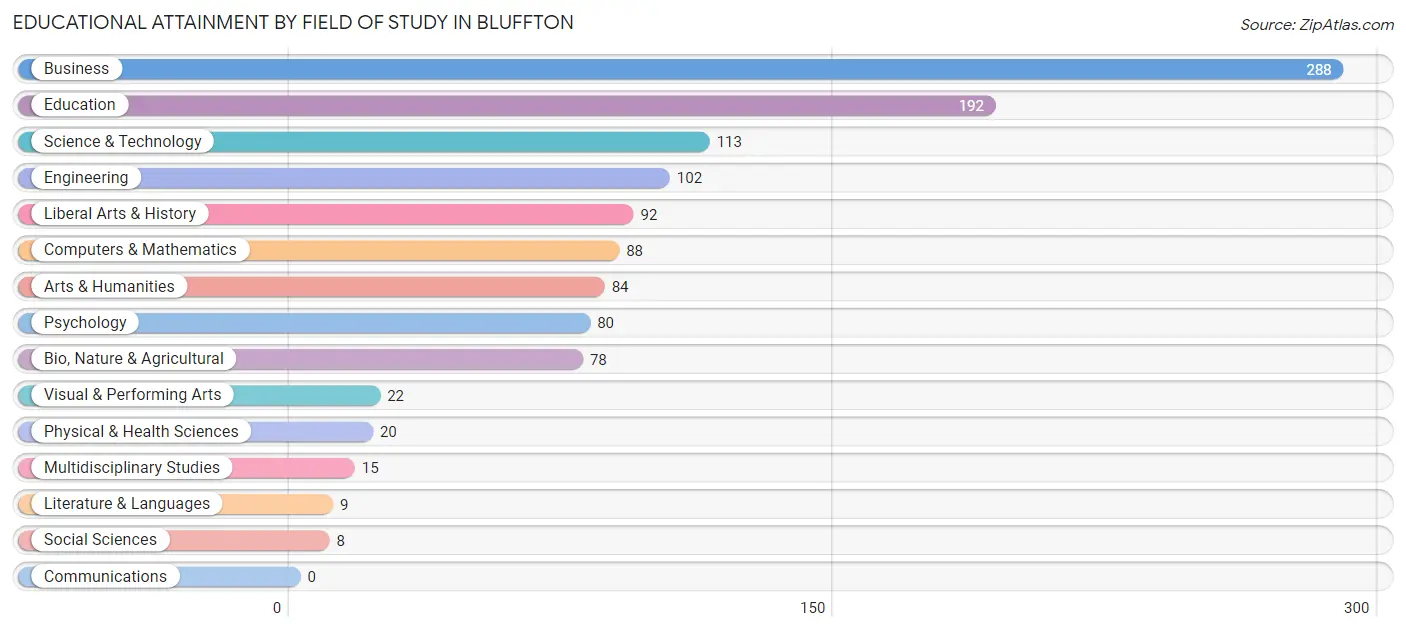
| Field of Study | # Graduates | % Graduates |
| Computers & Mathematics | 88 | 7.4% |
| Bio, Nature & Agricultural | 78 | 6.6% |
| Physical & Health Sciences | 20 | 1.7% |
| Psychology | 80 | 6.7% |
| Social Sciences | 8 | 0.7% |
| Engineering | 102 | 8.6% |
| Multidisciplinary Studies | 15 | 1.3% |
| Science & Technology | 113 | 9.5% |
| Business | 288 | 24.2% |
| Education | 192 | 16.1% |
| Literature & Languages | 9 | 0.8% |
| Liberal Arts & History | 92 | 7.7% |
| Visual & Performing Arts | 22 | 1.8% |
| Communications | 0 | 0.0% |
| Arts & Humanities | 84 | 7.0% |
| Total | 1,191 | 100.0% |
Transportation & Commute in Bluffton
Vehicle Availability by Sex in Bluffton
The most prevalent vehicle ownership categories in Bluffton are males with 2 vehicles (1,275, accounting for 43.7%) and females with 2 vehicles (844, making up 54.1%).
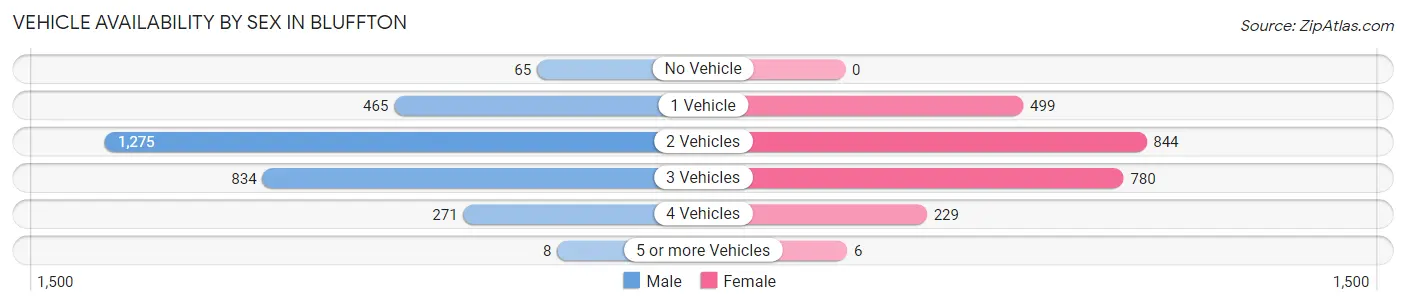
| Vehicles Available | Male | Female |
| No Vehicle | 65 (2.2%) | 0 (0.0%) |
| 1 Vehicle | 465 (15.9%) | 499 (21.2%) |
| 2 Vehicles | 1,275 (43.7%) | 844 (35.8%) |
| 3 Vehicles | 834 (28.6%) | 780 (33.1%) |
| 4 Vehicles | 271 (9.3%) | 229 (9.7%) |
| 5 or more Vehicles | 8 (0.3%) | 6 (0.3%) |
| Total | 2,918 (100.0%) | 2,358 (100.0%) |
Commute Time in Bluffton
The most frequently occuring commute durations in Bluffton are 5 to 9 minutes (1,553 commuters, 30.2%), 10 to 14 minutes (940 commuters, 18.3%), and less than 5 minutes (610 commuters, 11.9%).
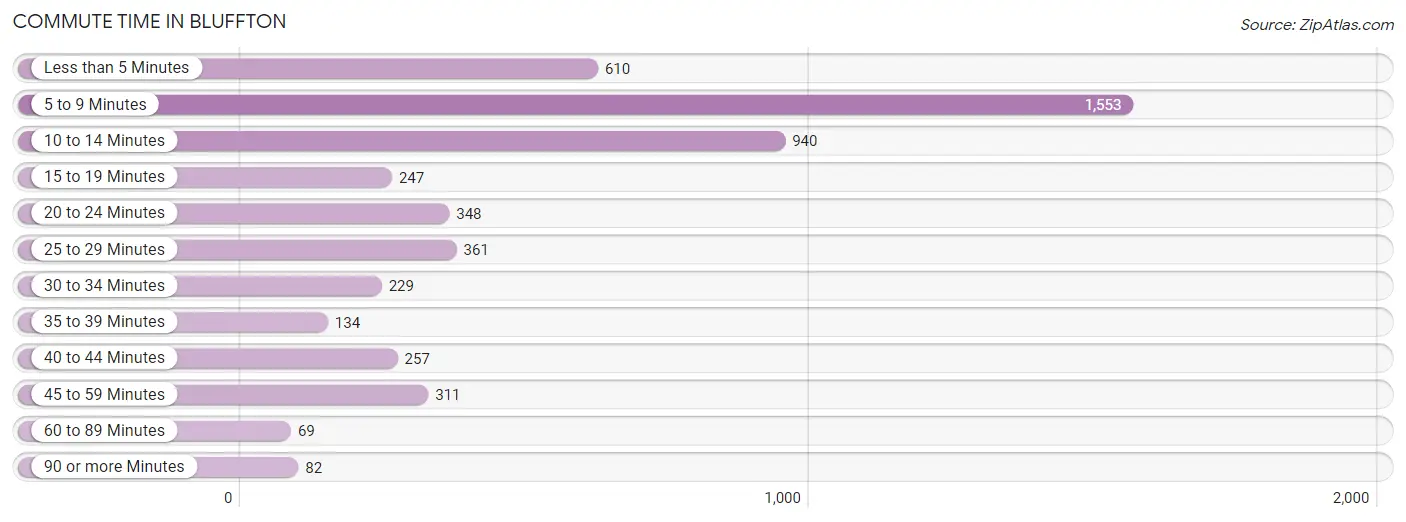
| Commute Time | # Commuters | % Commuters |
| Less than 5 Minutes | 610 | 11.9% |
| 5 to 9 Minutes | 1,553 | 30.2% |
| 10 to 14 Minutes | 940 | 18.3% |
| 15 to 19 Minutes | 247 | 4.8% |
| 20 to 24 Minutes | 348 | 6.8% |
| 25 to 29 Minutes | 361 | 7.0% |
| 30 to 34 Minutes | 229 | 4.4% |
| 35 to 39 Minutes | 134 | 2.6% |
| 40 to 44 Minutes | 257 | 5.0% |
| 45 to 59 Minutes | 311 | 6.0% |
| 60 to 89 Minutes | 69 | 1.3% |
| 90 or more Minutes | 82 | 1.6% |
Commute Time by Sex in Bluffton
The most common commute times in Bluffton are 5 to 9 minutes (779 commuters, 27.3%) for males and 5 to 9 minutes (774 commuters, 33.8%) for females.
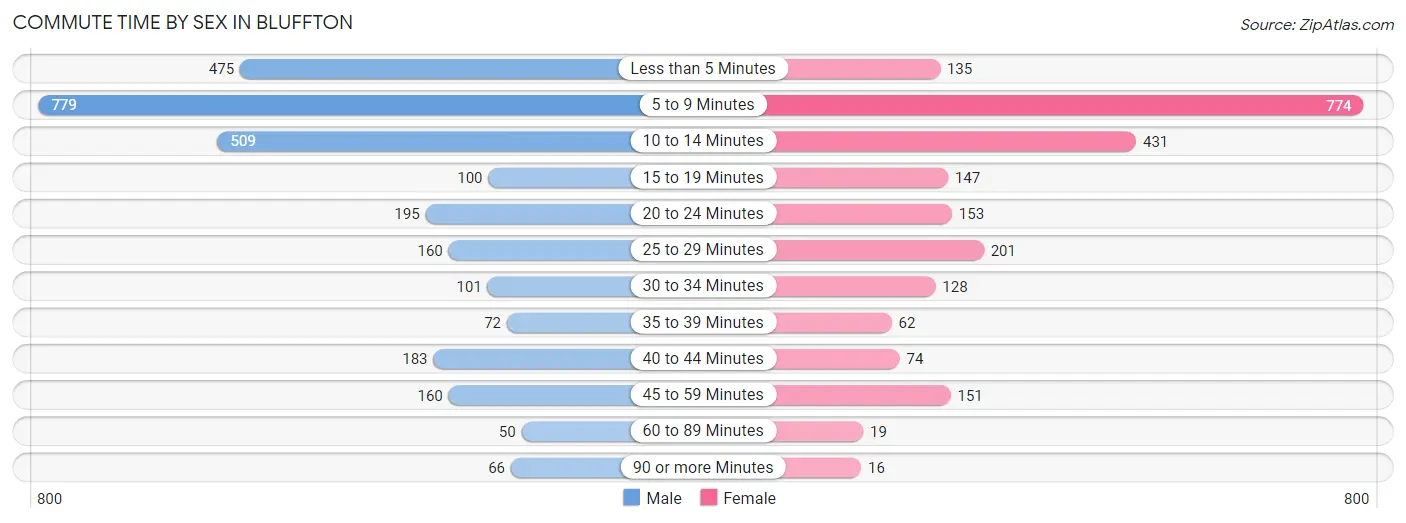
| Commute Time | Male | Female |
| Less than 5 Minutes | 475 (16.7%) | 135 (5.9%) |
| 5 to 9 Minutes | 779 (27.3%) | 774 (33.8%) |
| 10 to 14 Minutes | 509 (17.9%) | 431 (18.8%) |
| 15 to 19 Minutes | 100 (3.5%) | 147 (6.4%) |
| 20 to 24 Minutes | 195 (6.8%) | 153 (6.7%) |
| 25 to 29 Minutes | 160 (5.6%) | 201 (8.8%) |
| 30 to 34 Minutes | 101 (3.5%) | 128 (5.6%) |
| 35 to 39 Minutes | 72 (2.5%) | 62 (2.7%) |
| 40 to 44 Minutes | 183 (6.4%) | 74 (3.2%) |
| 45 to 59 Minutes | 160 (5.6%) | 151 (6.6%) |
| 60 to 89 Minutes | 50 (1.8%) | 19 (0.8%) |
| 90 or more Minutes | 66 (2.3%) | 16 (0.7%) |
Time of Departure to Work by Sex in Bluffton
The most frequent times of departure to work in Bluffton are 4:00 PM to 11:59 PM (455, 16.0%) for males and 7:30 AM to 7:59 AM (355, 15.5%) for females.
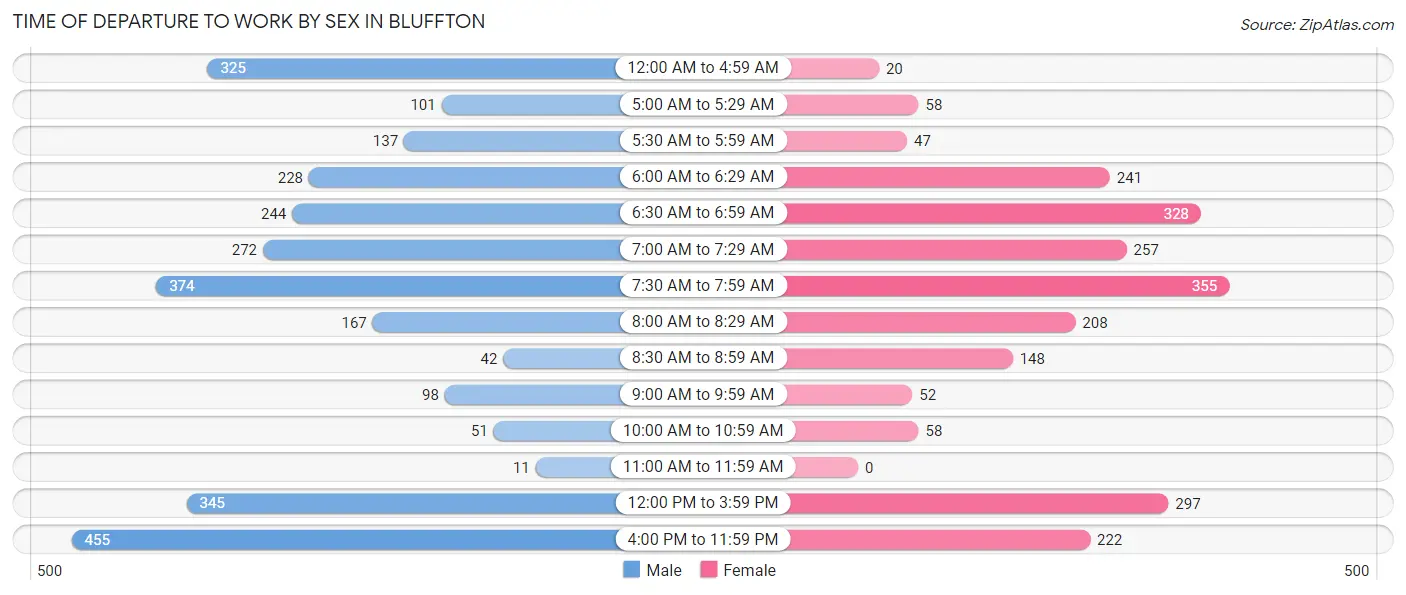
| Time of Departure | Male | Female |
| 12:00 AM to 4:59 AM | 325 (11.4%) | 20 (0.9%) |
| 5:00 AM to 5:29 AM | 101 (3.5%) | 58 (2.5%) |
| 5:30 AM to 5:59 AM | 137 (4.8%) | 47 (2.1%) |
| 6:00 AM to 6:29 AM | 228 (8.0%) | 241 (10.5%) |
| 6:30 AM to 6:59 AM | 244 (8.6%) | 328 (14.3%) |
| 7:00 AM to 7:29 AM | 272 (9.5%) | 257 (11.2%) |
| 7:30 AM to 7:59 AM | 374 (13.1%) | 355 (15.5%) |
| 8:00 AM to 8:29 AM | 167 (5.9%) | 208 (9.1%) |
| 8:30 AM to 8:59 AM | 42 (1.5%) | 148 (6.5%) |
| 9:00 AM to 9:59 AM | 98 (3.4%) | 52 (2.3%) |
| 10:00 AM to 10:59 AM | 51 (1.8%) | 58 (2.5%) |
| 11:00 AM to 11:59 AM | 11 (0.4%) | 0 (0.0%) |
| 12:00 PM to 3:59 PM | 345 (12.1%) | 297 (13.0%) |
| 4:00 PM to 11:59 PM | 455 (16.0%) | 222 (9.7%) |
| Total | 2,850 (100.0%) | 2,291 (100.0%) |
Housing Occupancy in Bluffton
Occupancy by Ownership in Bluffton
Of the total 4,298 dwellings in Bluffton, owner-occupied units account for 2,819 (65.6%), while renter-occupied units make up 1,479 (34.4%).
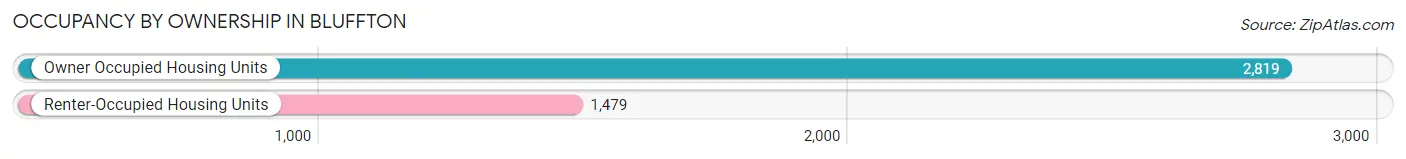
| Occupancy | # Housing Units | % Housing Units |
| Owner Occupied Housing Units | 2,819 | 65.6% |
| Renter-Occupied Housing Units | 1,479 | 34.4% |
| Total Occupied Housing Units | 4,298 | 100.0% |
Occupancy by Household Size in Bluffton
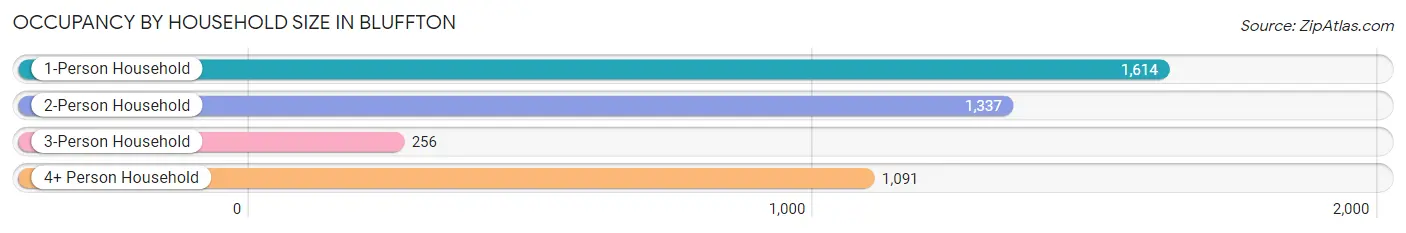
| Household Size | # Housing Units | % Housing Units |
| 1-Person Household | 1,614 | 37.6% |
| 2-Person Household | 1,337 | 31.1% |
| 3-Person Household | 256 | 6.0% |
| 4+ Person Household | 1,091 | 25.4% |
| Total Housing Units | 4,298 | 100.0% |
Occupancy by Ownership by Household Size in Bluffton
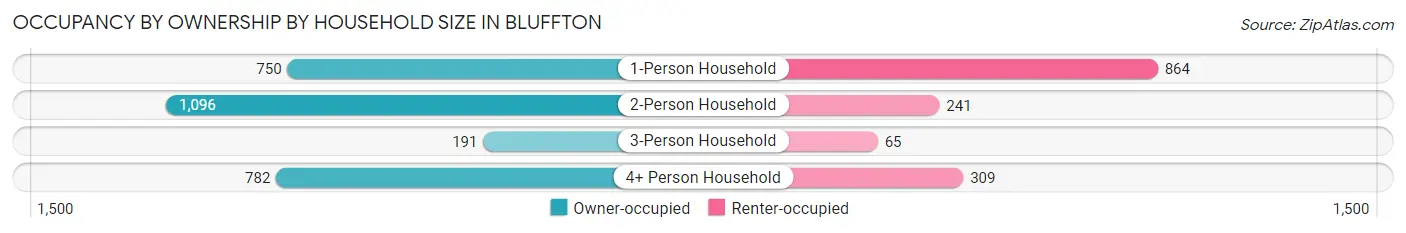
| Household Size | Owner-occupied | Renter-occupied |
| 1-Person Household | 750 (46.5%) | 864 (53.5%) |
| 2-Person Household | 1,096 (82.0%) | 241 (18.0%) |
| 3-Person Household | 191 (74.6%) | 65 (25.4%) |
| 4+ Person Household | 782 (71.7%) | 309 (28.3%) |
| Total Housing Units | 2,819 (65.6%) | 1,479 (34.4%) |
Occupancy by Educational Attainment in Bluffton
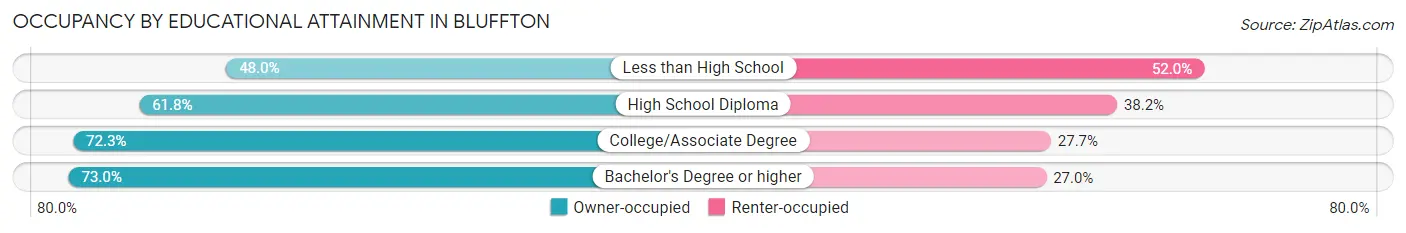
| Household Size | Owner-occupied | Renter-occupied |
| Less than High School | 193 (48.0%) | 209 (52.0%) |
| High School Diploma | 1,149 (61.8%) | 710 (38.2%) |
| College/Associate Degree | 1,033 (72.3%) | 396 (27.7%) |
| Bachelor's Degree or higher | 444 (73.0%) | 164 (27.0%) |
Occupancy by Age of Householder in Bluffton
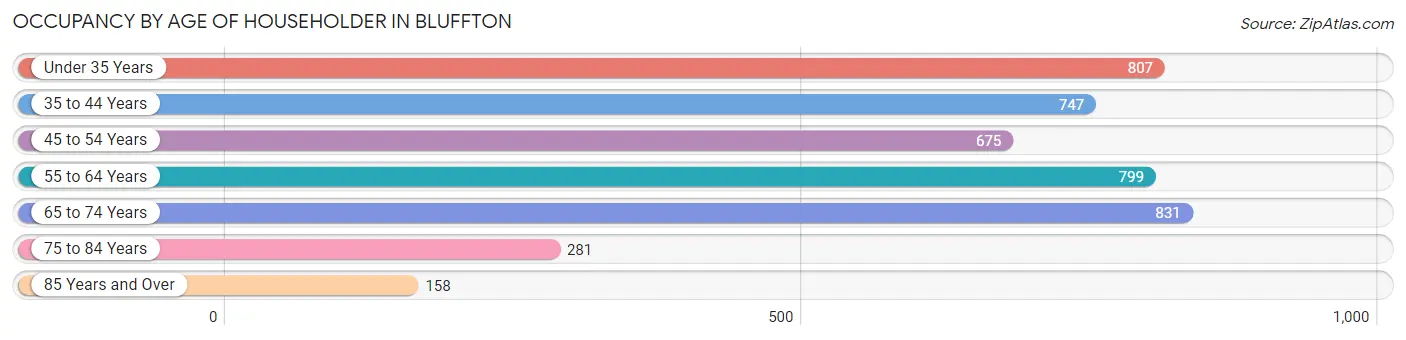
| Age Bracket | # Households | % Households |
| Under 35 Years | 807 | 18.8% |
| 35 to 44 Years | 747 | 17.4% |
| 45 to 54 Years | 675 | 15.7% |
| 55 to 64 Years | 799 | 18.6% |
| 65 to 74 Years | 831 | 19.3% |
| 75 to 84 Years | 281 | 6.5% |
| 85 Years and Over | 158 | 3.7% |
| Total | 4,298 | 100.0% |
Housing Finances in Bluffton
Median Income by Occupancy in Bluffton
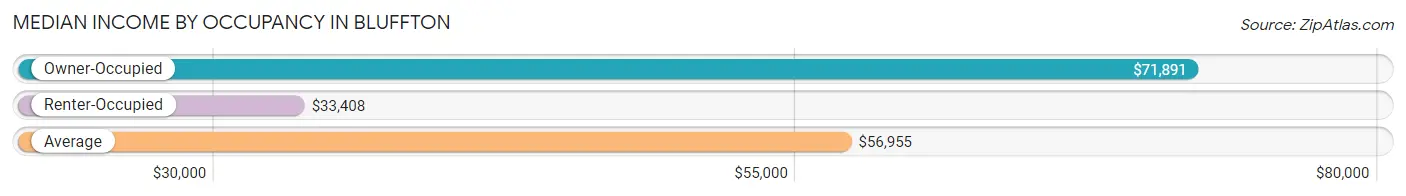
| Occupancy Type | # Households | Median Income |
| Owner-Occupied | 2,819 (65.6%) | $71,891 |
| Renter-Occupied | 1,479 (34.4%) | $33,408 |
| Average | 4,298 (100.0%) | $56,955 |
Occupancy by Householder Income Bracket in Bluffton
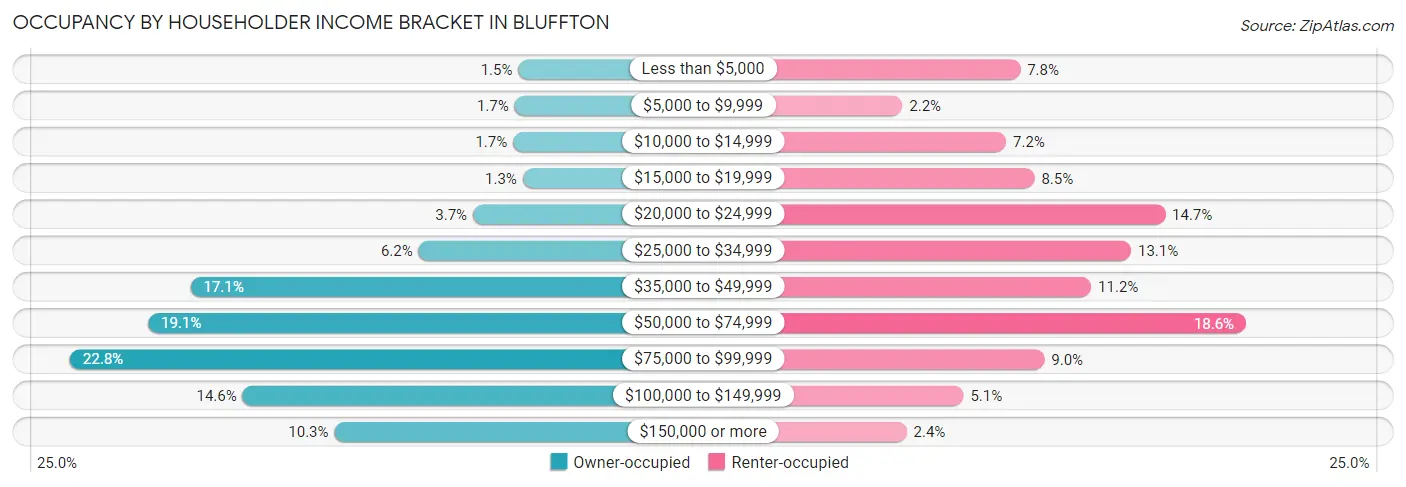
| Income Bracket | Owner-occupied | Renter-occupied |
| Less than $5,000 | 42 (1.5%) | 116 (7.8%) |
| $5,000 to $9,999 | 47 (1.7%) | 33 (2.2%) |
| $10,000 to $14,999 | 49 (1.7%) | 106 (7.2%) |
| $15,000 to $19,999 | 36 (1.3%) | 126 (8.5%) |
| $20,000 to $24,999 | 103 (3.6%) | 218 (14.7%) |
| $25,000 to $34,999 | 176 (6.2%) | 194 (13.1%) |
| $35,000 to $49,999 | 482 (17.1%) | 166 (11.2%) |
| $50,000 to $74,999 | 539 (19.1%) | 275 (18.6%) |
| $75,000 to $99,999 | 644 (22.8%) | 133 (9.0%) |
| $100,000 to $149,999 | 412 (14.6%) | 76 (5.1%) |
| $150,000 or more | 289 (10.2%) | 36 (2.4%) |
| Total | 2,819 (100.0%) | 1,479 (100.0%) |
Monthly Housing Cost Tiers in Bluffton
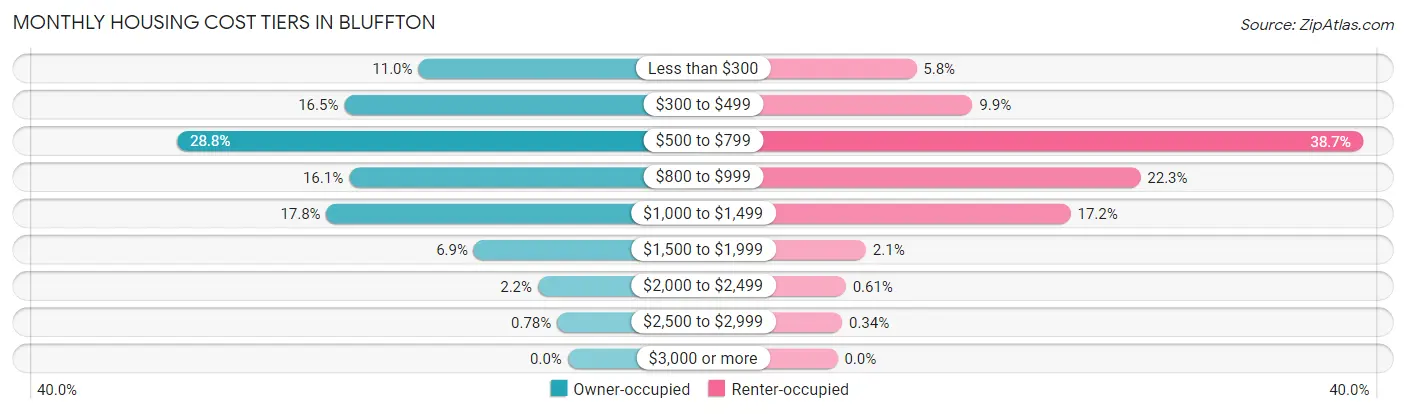
| Monthly Cost | Owner-occupied | Renter-occupied |
| Less than $300 | 310 (11.0%) | 86 (5.8%) |
| $300 to $499 | 464 (16.5%) | 147 (9.9%) |
| $500 to $799 | 811 (28.8%) | 572 (38.7%) |
| $800 to $999 | 454 (16.1%) | 330 (22.3%) |
| $1,000 to $1,499 | 501 (17.8%) | 254 (17.2%) |
| $1,500 to $1,999 | 195 (6.9%) | 31 (2.1%) |
| $2,000 to $2,499 | 62 (2.2%) | 9 (0.6%) |
| $2,500 to $2,999 | 22 (0.8%) | 5 (0.3%) |
| $3,000 or more | 0 (0.0%) | 0 (0.0%) |
| Total | 2,819 (100.0%) | 1,479 (100.0%) |
Physical Housing Characteristics in Bluffton
Housing Structures in Bluffton
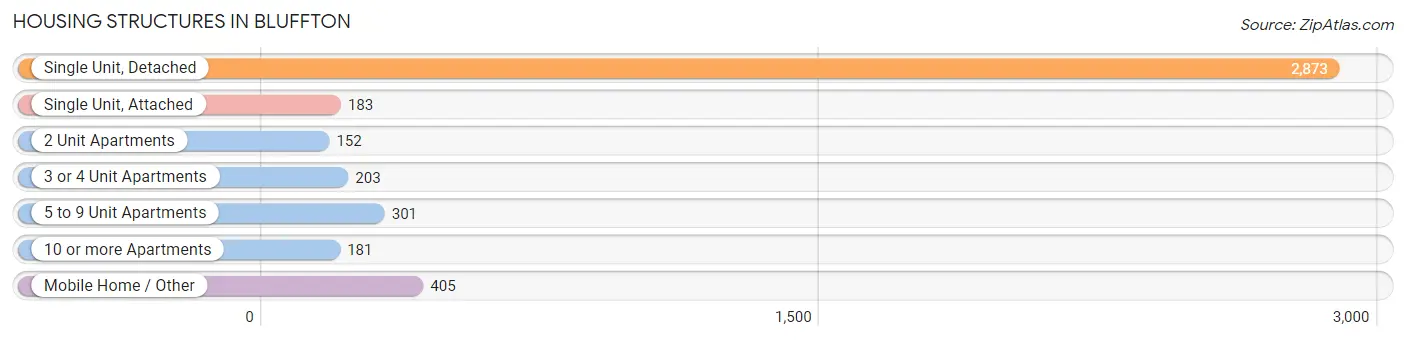
| Structure Type | # Housing Units | % Housing Units |
| Single Unit, Detached | 2,873 | 66.8% |
| Single Unit, Attached | 183 | 4.3% |
| 2 Unit Apartments | 152 | 3.5% |
| 3 or 4 Unit Apartments | 203 | 4.7% |
| 5 to 9 Unit Apartments | 301 | 7.0% |
| 10 or more Apartments | 181 | 4.2% |
| Mobile Home / Other | 405 | 9.4% |
| Total | 4,298 | 100.0% |
Housing Structures by Occupancy in Bluffton
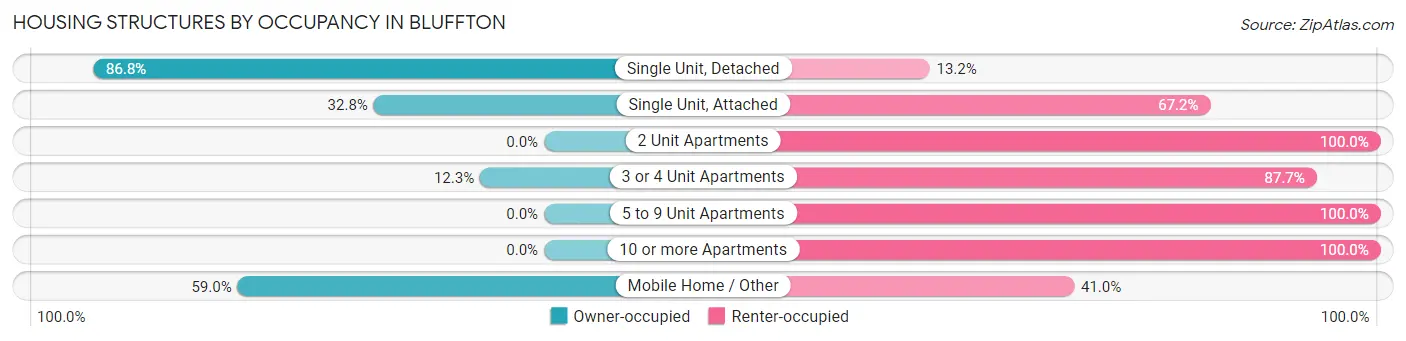
| Structure Type | Owner-occupied | Renter-occupied |
| Single Unit, Detached | 2,495 (86.8%) | 378 (13.2%) |
| Single Unit, Attached | 60 (32.8%) | 123 (67.2%) |
| 2 Unit Apartments | 0 (0.0%) | 152 (100.0%) |
| 3 or 4 Unit Apartments | 25 (12.3%) | 178 (87.7%) |
| 5 to 9 Unit Apartments | 0 (0.0%) | 301 (100.0%) |
| 10 or more Apartments | 0 (0.0%) | 181 (100.0%) |
| Mobile Home / Other | 239 (59.0%) | 166 (41.0%) |
| Total | 2,819 (65.6%) | 1,479 (34.4%) |
Housing Structures by Number of Rooms in Bluffton
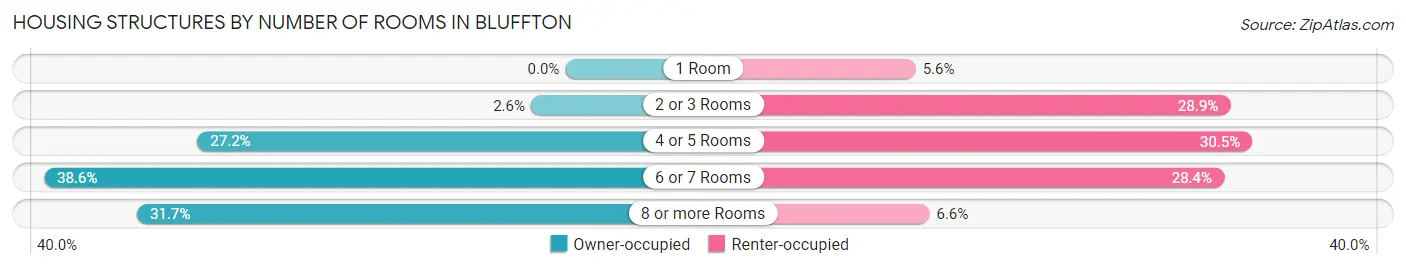
| Number of Rooms | Owner-occupied | Renter-occupied |
| 1 Room | 0 (0.0%) | 83 (5.6%) |
| 2 or 3 Rooms | 72 (2.5%) | 427 (28.9%) |
| 4 or 5 Rooms | 767 (27.2%) | 451 (30.5%) |
| 6 or 7 Rooms | 1,087 (38.6%) | 420 (28.4%) |
| 8 or more Rooms | 893 (31.7%) | 98 (6.6%) |
| Total | 2,819 (100.0%) | 1,479 (100.0%) |
Housing Structure by Heating Type in Bluffton
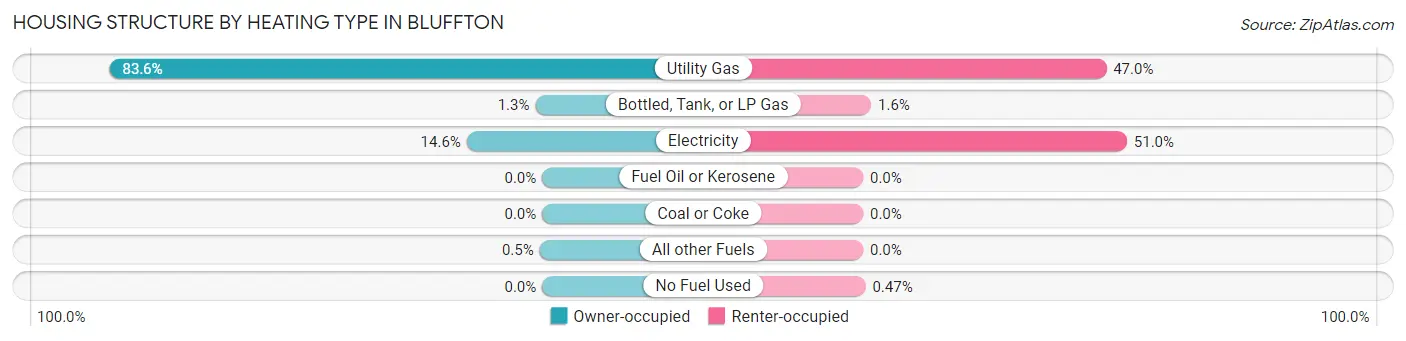
| Heating Type | Owner-occupied | Renter-occupied |
| Utility Gas | 2,357 (83.6%) | 695 (47.0%) |
| Bottled, Tank, or LP Gas | 37 (1.3%) | 23 (1.6%) |
| Electricity | 411 (14.6%) | 754 (51.0%) |
| Fuel Oil or Kerosene | 0 (0.0%) | 0 (0.0%) |
| Coal or Coke | 0 (0.0%) | 0 (0.0%) |
| All other Fuels | 14 (0.5%) | 0 (0.0%) |
| No Fuel Used | 0 (0.0%) | 7 (0.5%) |
| Total | 2,819 (100.0%) | 1,479 (100.0%) |
Household Vehicle Usage in Bluffton
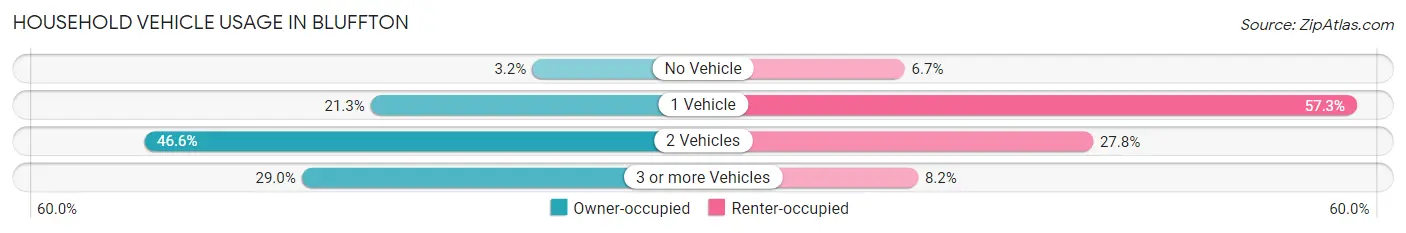
| Vehicles per Household | Owner-occupied | Renter-occupied |
| No Vehicle | 89 (3.2%) | 99 (6.7%) |
| 1 Vehicle | 599 (21.2%) | 848 (57.3%) |
| 2 Vehicles | 1,314 (46.6%) | 411 (27.8%) |
| 3 or more Vehicles | 817 (29.0%) | 121 (8.2%) |
| Total | 2,819 (100.0%) | 1,479 (100.0%) |
Real Estate & Mortgages in Bluffton
Real Estate and Mortgage Overview in Bluffton
| Characteristic | Without Mortgage | With Mortgage |
| Housing Units | 1,049 | 1,770 |
| Median Property Value | $109,000 | $126,100 |
| Median Household Income | $55,774 | $153 |
| Monthly Housing Costs | $382 | $0 |
| Real Estate Taxes | $686 | $188 |
Property Value by Mortgage Status in Bluffton
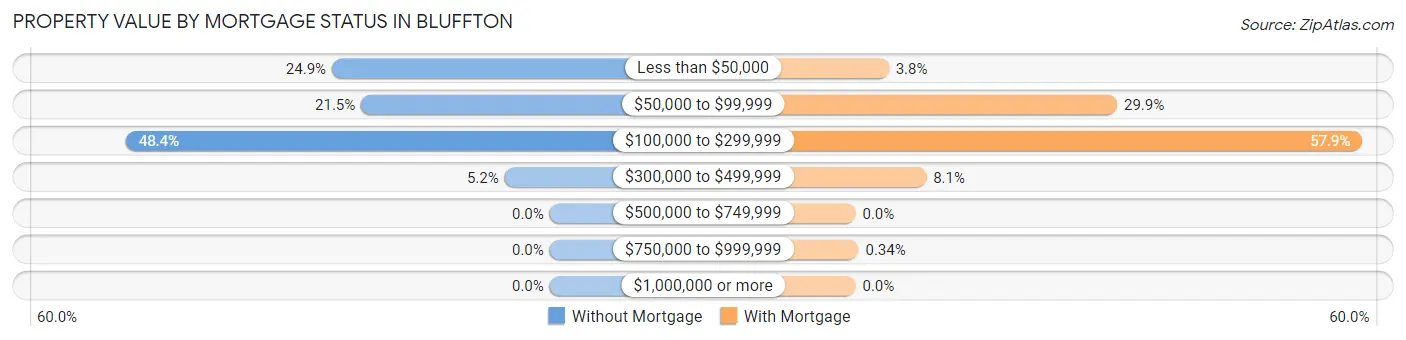
| Property Value | Without Mortgage | With Mortgage |
| Less than $50,000 | 261 (24.9%) | 67 (3.8%) |
| $50,000 to $99,999 | 226 (21.5%) | 529 (29.9%) |
| $100,000 to $299,999 | 508 (48.4%) | 1,025 (57.9%) |
| $300,000 to $499,999 | 54 (5.1%) | 143 (8.1%) |
| $500,000 to $749,999 | 0 (0.0%) | 0 (0.0%) |
| $750,000 to $999,999 | 0 (0.0%) | 6 (0.3%) |
| $1,000,000 or more | 0 (0.0%) | 0 (0.0%) |
| Total | 1,049 (100.0%) | 1,770 (100.0%) |
Household Income by Mortgage Status in Bluffton
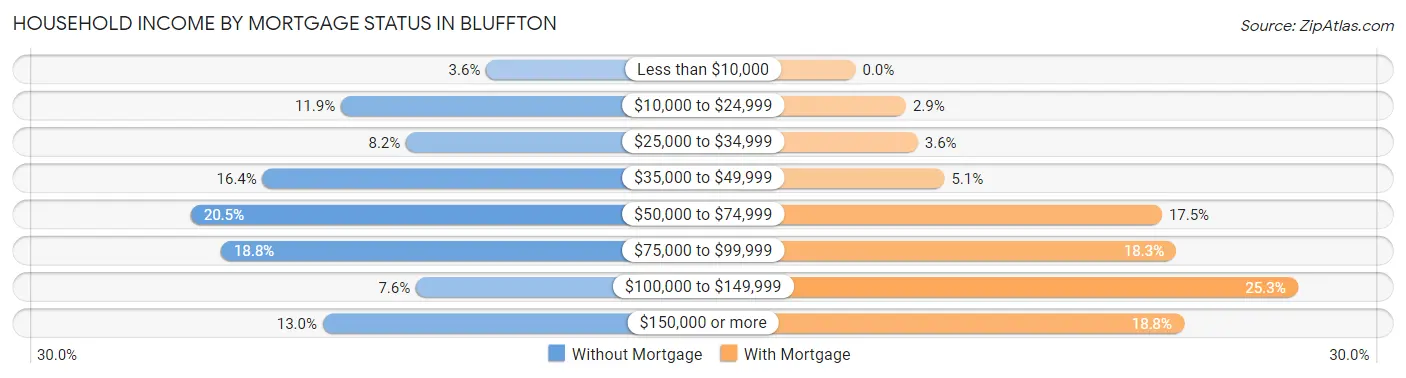
| Household Income | Without Mortgage | With Mortgage |
| Less than $10,000 | 38 (3.6%) | 0 (0.0%) |
| $10,000 to $24,999 | 125 (11.9%) | 51 (2.9%) |
| $25,000 to $34,999 | 86 (8.2%) | 63 (3.6%) |
| $35,000 to $49,999 | 172 (16.4%) | 90 (5.1%) |
| $50,000 to $74,999 | 215 (20.5%) | 310 (17.5%) |
| $75,000 to $99,999 | 197 (18.8%) | 324 (18.3%) |
| $100,000 to $149,999 | 80 (7.6%) | 447 (25.3%) |
| $150,000 or more | 136 (13.0%) | 332 (18.8%) |
| Total | 1,049 (100.0%) | 1,770 (100.0%) |
Property Value to Household Income Ratio in Bluffton
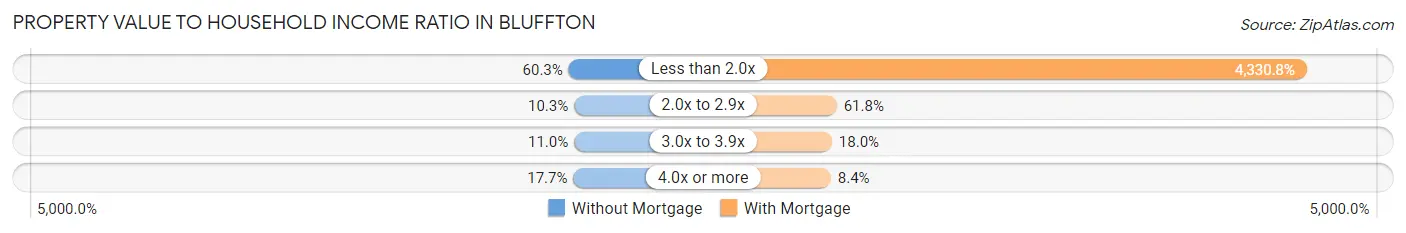
| Value-to-Income Ratio | Without Mortgage | With Mortgage |
| Less than 2.0x | 632 (60.3%) | 76,655 (4,330.8%) |
| 2.0x to 2.9x | 108 (10.3%) | 1,094 (61.8%) |
| 3.0x to 3.9x | 115 (11.0%) | 318 (18.0%) |
| 4.0x or more | 186 (17.7%) | 148 (8.4%) |
| Total | 1,049 (100.0%) | 1,770 (100.0%) |
Real Estate Taxes by Mortgage Status in Bluffton
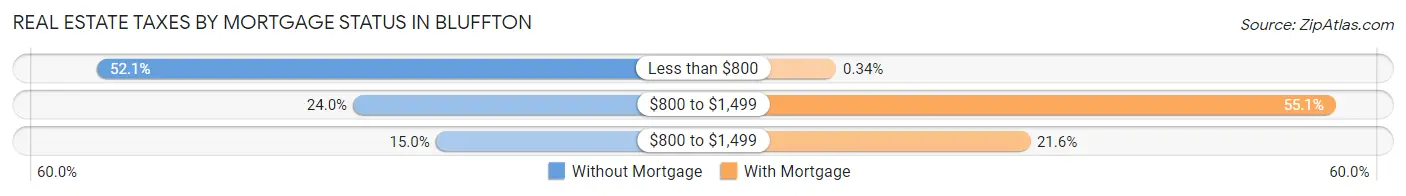
| Property Taxes | Without Mortgage | With Mortgage |
| Less than $800 | 546 (52.0%) | 6 (0.3%) |
| $800 to $1,499 | 252 (24.0%) | 975 (55.1%) |
| $800 to $1,499 | 157 (15.0%) | 382 (21.6%) |
| Total | 1,049 (100.0%) | 1,770 (100.0%) |
Health & Disability in Bluffton
Health Insurance Coverage by Age in Bluffton
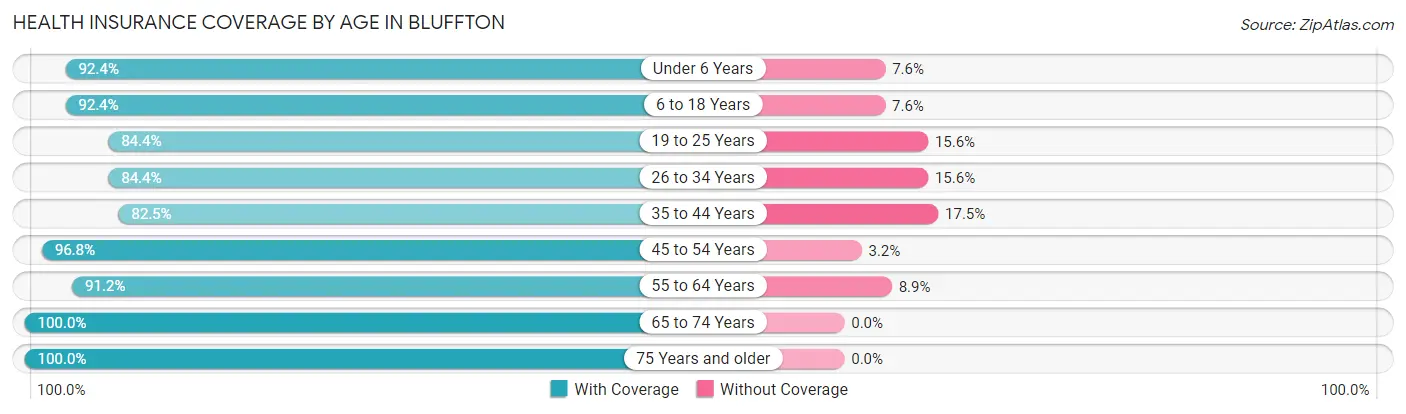
| Age Bracket | With Coverage | Without Coverage |
| Under 6 Years | 751 (92.4%) | 62 (7.6%) |
| 6 to 18 Years | 1,821 (92.4%) | 150 (7.6%) |
| 19 to 25 Years | 817 (84.4%) | 151 (15.6%) |
| 26 to 34 Years | 854 (84.4%) | 158 (15.6%) |
| 35 to 44 Years | 1,014 (82.5%) | 215 (17.5%) |
| 45 to 54 Years | 1,237 (96.8%) | 41 (3.2%) |
| 55 to 64 Years | 1,143 (91.1%) | 111 (8.8%) |
| 65 to 74 Years | 1,061 (100.0%) | 0 (0.0%) |
| 75 Years and older | 617 (100.0%) | 0 (0.0%) |
| Total | 9,315 (91.3%) | 888 (8.7%) |
Health Insurance Coverage by Citizenship Status in Bluffton
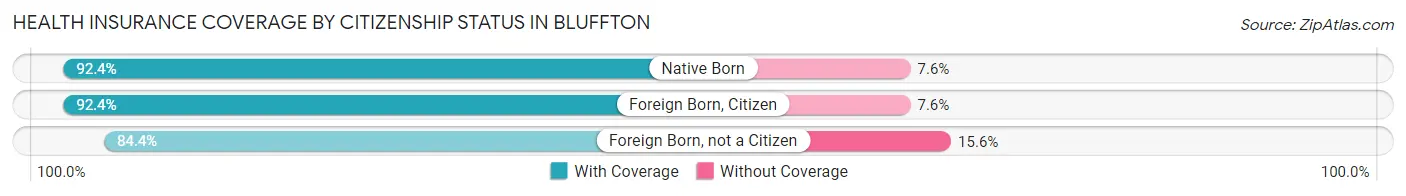
| Citizenship Status | With Coverage | Without Coverage |
| Native Born | 751 (92.4%) | 62 (7.6%) |
| Foreign Born, Citizen | 1,821 (92.4%) | 150 (7.6%) |
| Foreign Born, not a Citizen | 817 (84.4%) | 151 (15.6%) |
Health Insurance Coverage by Household Income in Bluffton
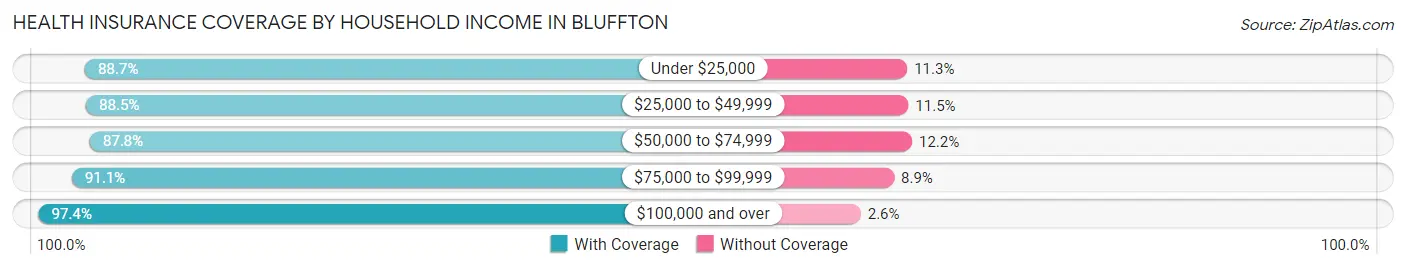
| Household Income | With Coverage | Without Coverage |
| Under $25,000 | 1,034 (88.7%) | 132 (11.3%) |
| $25,000 to $49,999 | 1,632 (88.5%) | 213 (11.5%) |
| $50,000 to $74,999 | 1,931 (87.8%) | 269 (12.2%) |
| $75,000 to $99,999 | 2,097 (91.1%) | 204 (8.9%) |
| $100,000 and over | 2,600 (97.4%) | 70 (2.6%) |
Public vs Private Health Insurance Coverage by Age in Bluffton
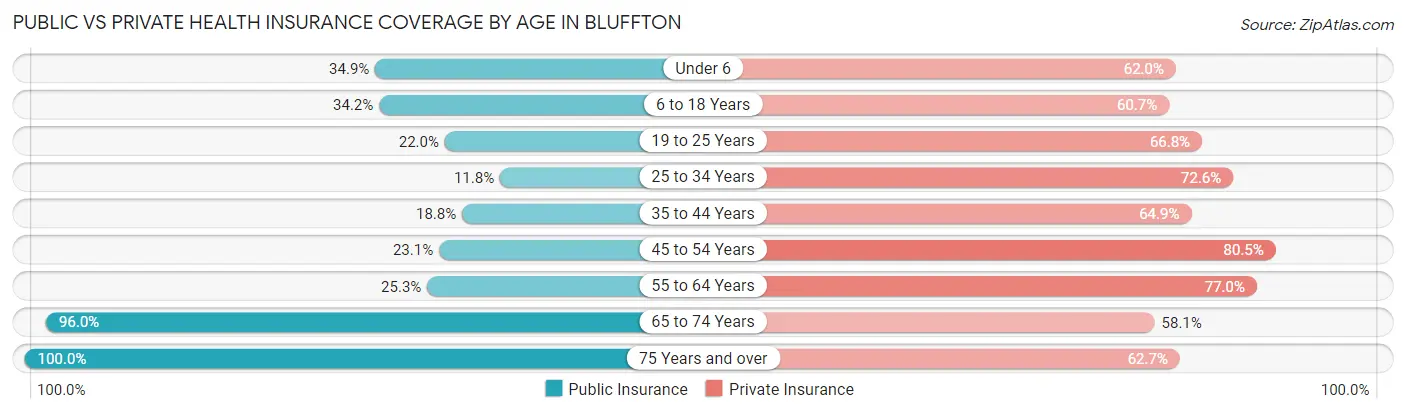
| Age Bracket | Public Insurance | Private Insurance |
| Under 6 | 284 (34.9%) | 504 (62.0%) |
| 6 to 18 Years | 674 (34.2%) | 1,197 (60.7%) |
| 19 to 25 Years | 213 (22.0%) | 647 (66.8%) |
| 25 to 34 Years | 119 (11.8%) | 735 (72.6%) |
| 35 to 44 Years | 231 (18.8%) | 797 (64.8%) |
| 45 to 54 Years | 295 (23.1%) | 1,029 (80.5%) |
| 55 to 64 Years | 317 (25.3%) | 966 (77.0%) |
| 65 to 74 Years | 1,019 (96.0%) | 616 (58.1%) |
| 75 Years and over | 617 (100.0%) | 387 (62.7%) |
| Total | 3,769 (36.9%) | 6,878 (67.4%) |
Disability Status by Sex by Age in Bluffton
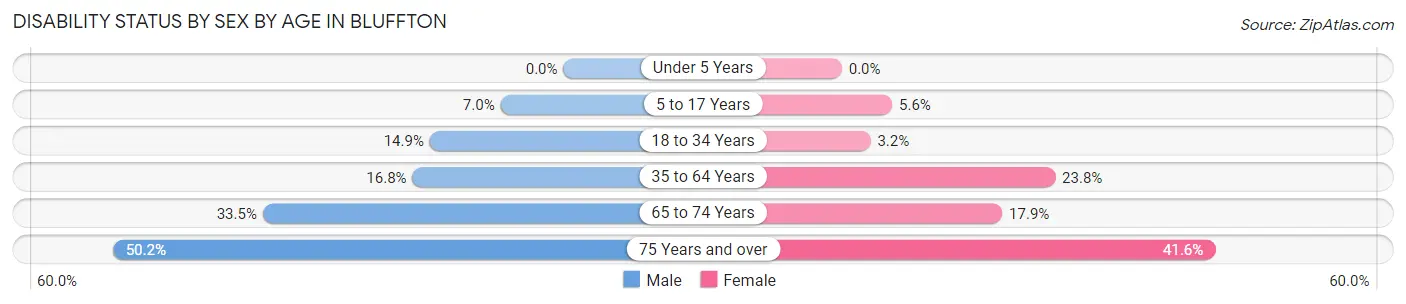
| Age Bracket | Male | Female |
| Under 5 Years | 0 (0.0%) | 0 (0.0%) |
| 5 to 17 Years | 61 (7.0%) | 63 (5.6%) |
| 18 to 34 Years | 176 (14.9%) | 31 (3.2%) |
| 35 to 64 Years | 299 (16.8%) | 471 (23.8%) |
| 65 to 74 Years | 149 (33.5%) | 110 (17.9%) |
| 75 Years and over | 137 (50.2%) | 143 (41.6%) |
Disability Class by Sex by Age in Bluffton
Disability Class: Hearing Difficulty
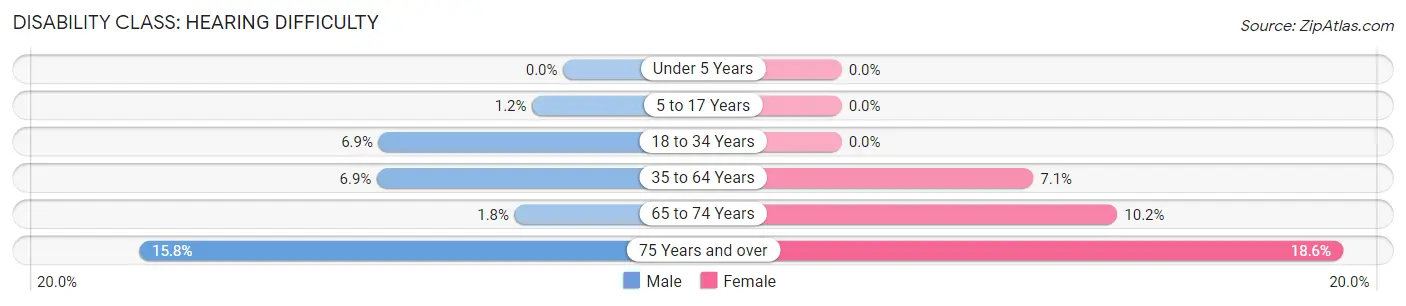
| Age Bracket | Male | Female |
| Under 5 Years | 0 (0.0%) | 0 (0.0%) |
| 5 to 17 Years | 10 (1.1%) | 0 (0.0%) |
| 18 to 34 Years | 81 (6.9%) | 0 (0.0%) |
| 35 to 64 Years | 123 (6.9%) | 141 (7.1%) |
| 65 to 74 Years | 8 (1.8%) | 63 (10.2%) |
| 75 Years and over | 43 (15.8%) | 64 (18.6%) |
Disability Class: Vision Difficulty
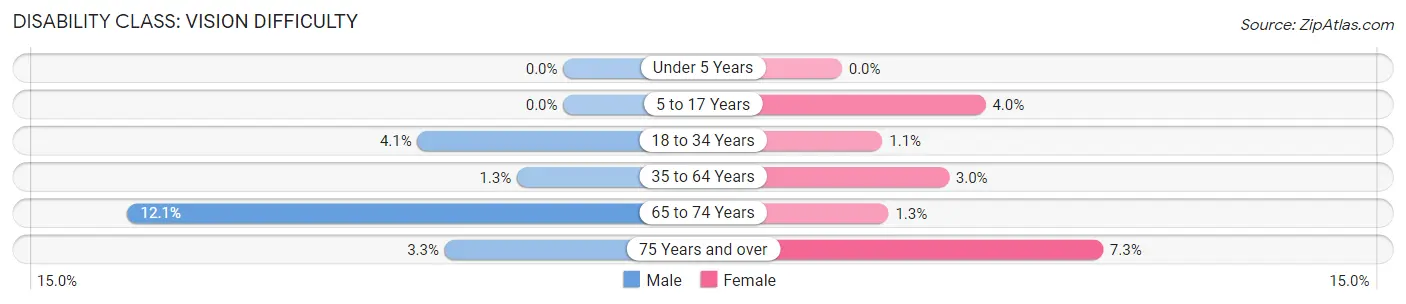
| Age Bracket | Male | Female |
| Under 5 Years | 0 (0.0%) | 0 (0.0%) |
| 5 to 17 Years | 0 (0.0%) | 45 (4.0%) |
| 18 to 34 Years | 48 (4.1%) | 11 (1.1%) |
| 35 to 64 Years | 23 (1.3%) | 59 (3.0%) |
| 65 to 74 Years | 54 (12.1%) | 8 (1.3%) |
| 75 Years and over | 9 (3.3%) | 25 (7.3%) |
Disability Class: Cognitive Difficulty
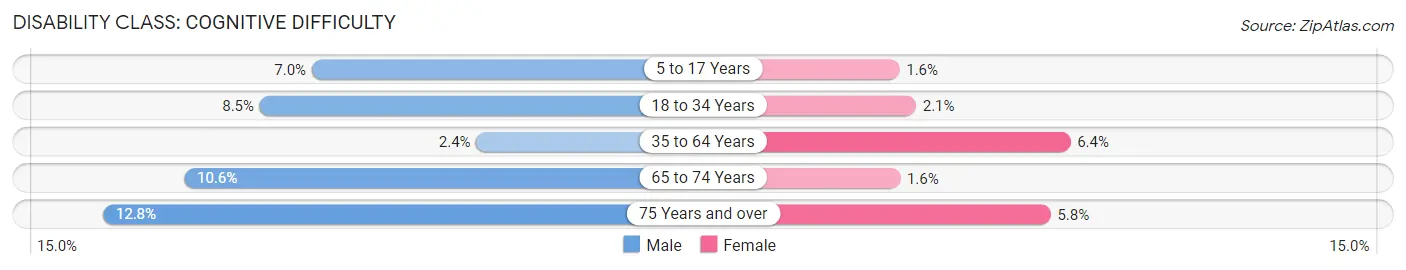
| Age Bracket | Male | Female |
| 5 to 17 Years | 61 (7.0%) | 18 (1.6%) |
| 18 to 34 Years | 100 (8.5%) | 20 (2.1%) |
| 35 to 64 Years | 43 (2.4%) | 126 (6.4%) |
| 65 to 74 Years | 47 (10.6%) | 10 (1.6%) |
| 75 Years and over | 35 (12.8%) | 20 (5.8%) |
Disability Class: Ambulatory Difficulty
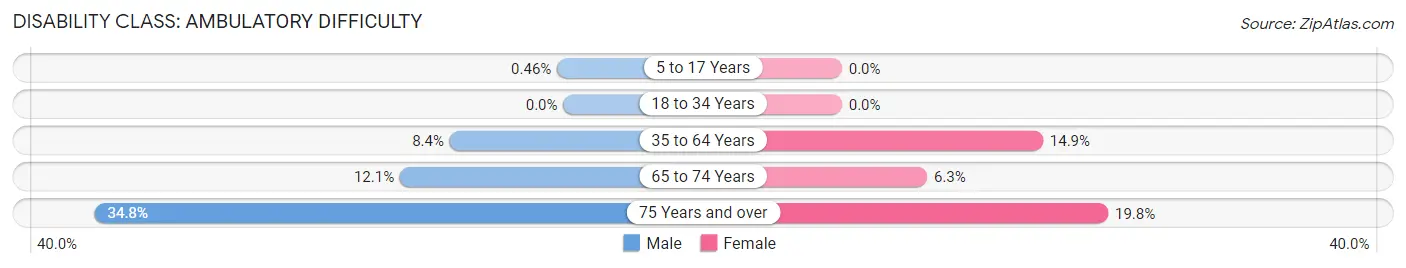
| Age Bracket | Male | Female |
| 5 to 17 Years | 4 (0.5%) | 0 (0.0%) |
| 18 to 34 Years | 0 (0.0%) | 0 (0.0%) |
| 35 to 64 Years | 150 (8.4%) | 296 (14.9%) |
| 65 to 74 Years | 54 (12.1%) | 39 (6.3%) |
| 75 Years and over | 95 (34.8%) | 68 (19.8%) |
Disability Class: Self-Care Difficulty
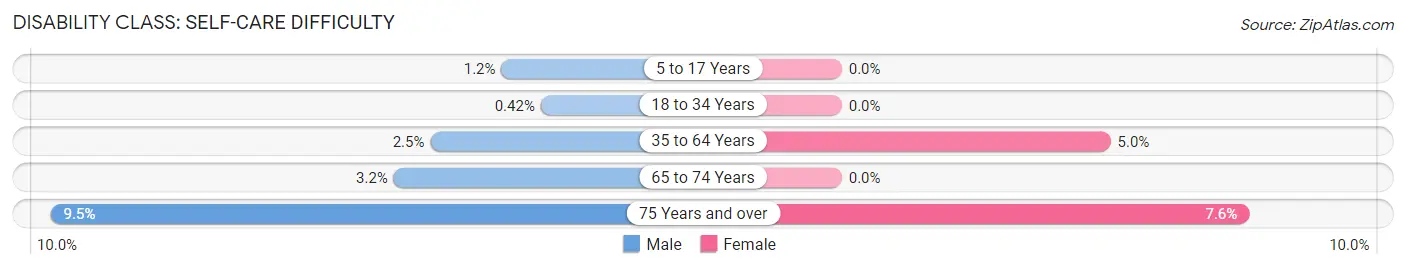
| Age Bracket | Male | Female |
| 5 to 17 Years | 10 (1.1%) | 0 (0.0%) |
| 18 to 34 Years | 5 (0.4%) | 0 (0.0%) |
| 35 to 64 Years | 44 (2.5%) | 99 (5.0%) |
| 65 to 74 Years | 14 (3.2%) | 0 (0.0%) |
| 75 Years and over | 26 (9.5%) | 26 (7.6%) |
Technology Access in Bluffton
Computing Device Access in Bluffton
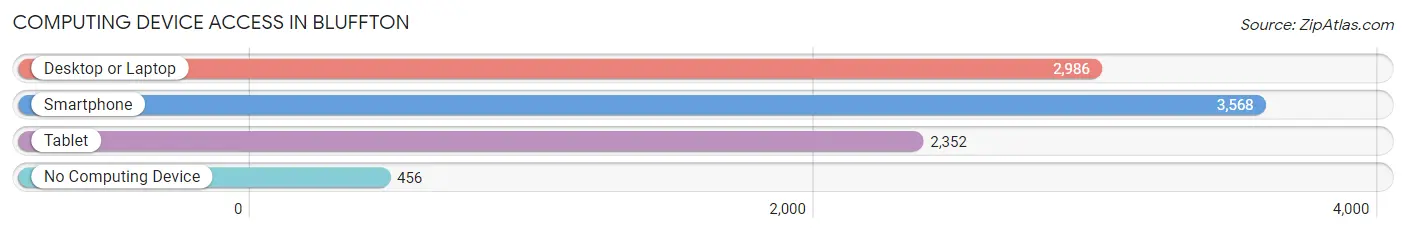
| Device Type | # Households | % Households |
| Desktop or Laptop | 2,986 | 69.5% |
| Smartphone | 3,568 | 83.0% |
| Tablet | 2,352 | 54.7% |
| No Computing Device | 456 | 10.6% |
| Total | 4,298 | 100.0% |
Internet Access in Bluffton
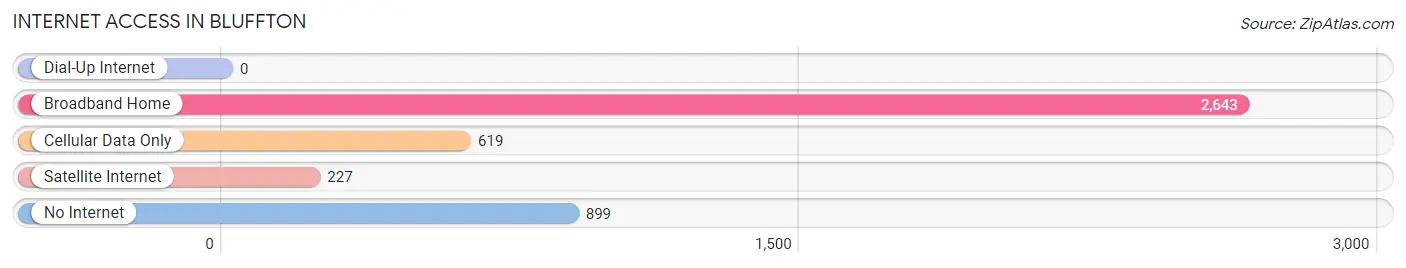
| Internet Type | # Households | % Households |
| Dial-Up Internet | 0 | 0.0% |
| Broadband Home | 2,643 | 61.5% |
| Cellular Data Only | 619 | 14.4% |
| Satellite Internet | 227 | 5.3% |
| No Internet | 899 | 20.9% |
| Total | 4,298 | 100.0% |
Bluffton Summary
Bluffton, Indiana is a small town located in Wells County, Indiana. It is situated in the northeastern part of the state, about 40 miles south of Fort Wayne. The town has a population of around 4,000 people and is known for its rural charm and friendly atmosphere.
History
Bluffton was founded in 1838 by a group of settlers from Ohio. The town was named after the nearby Bluffton Creek, which was named for its steep banks. The town was originally a farming community, but it soon developed into a manufacturing center. In 1845, the first sawmill was built in Bluffton, and by the late 1800s, the town had become a major producer of furniture and other wood products.
In the early 1900s, Bluffton began to diversify its economy. The town became a center for the production of agricultural equipment, and several factories were built in the area. The town also became a popular tourist destination, with several hotels and resorts being built in the area.
Geography
Bluffton is located in the northeastern part of Indiana, about 40 miles south of Fort Wayne. The town is situated in a rural area, surrounded by farmland and woodlands. The town is located on the banks of the Bluffton Creek, which flows through the town and into the nearby Wabash River.
The town has a total area of 2.2 square miles, all of which is land. The town has a humid continental climate, with hot summers and cold winters. The average annual temperature is around 50 degrees Fahrenheit.
Economy
Bluffton’s economy is largely based on agriculture and manufacturing. The town is home to several factories that produce agricultural equipment, furniture, and other wood products. The town is also home to several small businesses, including restaurants, shops, and other services.
The town is also home to several tourist attractions, including the Bluffton Historical Museum, the Bluffton Arts Center, and the Bluffton Aquatic Center. The town also hosts several annual festivals, including the Bluffton Summer Festival and the Bluffton Fall Festival.
Demographics
As of the 2010 census, Bluffton had a population of 4,000 people. The town has a median household income of $41,000, and the median age is 38. The town is predominantly white, with about 90% of the population being white. The town also has a small Hispanic population, with about 5% of the population being Hispanic. The town also has a small African American population, with about 2% of the population being African American.
Common Questions
What is Per Capita Income in Bluffton?
Per Capita income in Bluffton is $28,031.
What is the Median Family Income in Bluffton?
Median Family Income in Bluffton is $76,031.
What is the Median Household income in Bluffton?
Median Household Income in Bluffton is $56,955.
What is Income or Wage Gap in Bluffton?
Income or Wage Gap in Bluffton is 29.0%.
Women in Bluffton earn 71.0 cents for every dollar earned by a man.
What is Inequality or Gini Index in Bluffton?
Inequality or Gini Index in Bluffton is 0.39.
What is the Total Population of Bluffton?
Total Population of Bluffton is 10,461.
What is the Total Male Population of Bluffton?
Total Male Population of Bluffton is 4,925.
What is the Total Female Population of Bluffton?
Total Female Population of Bluffton is 5,536.
What is the Ratio of Males per 100 Females in Bluffton?
There are 88.96 Males per 100 Females in Bluffton.
What is the Ratio of Females per 100 Males in Bluffton?
There are 112.41 Females per 100 Males in Bluffton.
What is the Median Population Age in Bluffton?
Median Population Age in Bluffton is 38.7 Years.
What is the Average Family Size in Bluffton
Average Family Size in Bluffton is 3.2 People.
What is the Average Household Size in Bluffton
Average Household Size in Bluffton is 2.4 People.
How Large is the Labor Force in Bluffton?
There are 5,509 People in the Labor Forcein in Bluffton.
What is the Percentage of People in the Labor Force in Bluffton?
67.4% of People are in the Labor Force in Bluffton.
What is the Unemployment Rate in Bluffton?
Unemployment Rate in Bluffton is 4.0%.