Battle Ground, IN Map & Demographics
Battle Ground Map
Battle Ground Overview
$38,835
PER CAPITA INCOME
$113,393
AVG FAMILY INCOME
$94,205
AVG HOUSEHOLD INCOME
50.2%
WAGE / INCOME GAP [ % ]
49.8¢/ $1
WAGE / INCOME GAP [ $ ]
0.34
INEQUALITY / GINI INDEX
2,073
TOTAL POPULATION
1,006
MALE POPULATION
1,067
FEMALE POPULATION
94.28
MALES / 100 FEMALES
106.06
FEMALES / 100 MALES
32.0
MEDIAN AGE
3.0
AVG FAMILY SIZE
2.7
AVG HOUSEHOLD SIZE
1,123
LABOR FORCE [ PEOPLE ]
74.0%
PERCENT IN LABOR FORCE
4.8%
UNEMPLOYMENT RATE
Battle Ground Zip Codes
Battle Ground Area Codes
Income in Battle Ground
Income Overview in Battle Ground
Per Capita Income in Battle Ground is $38,835, while median incomes of families and households are $113,393 and $94,205 respectively.
| Characteristic | Number | Measure |
| Per Capita Income | 2,073 | $38,835 |
| Median Family Income | 622 | $113,393 |
| Mean Family Income | 622 | $112,873 |
| Median Household Income | 769 | $94,205 |
| Mean Household Income | 769 | $105,121 |
| Income Deficit | 622 | $0 |
| Wage / Income Gap (%) | 2,073 | 50.17% |
| Wage / Income Gap ($) | 2,073 | 49.83¢ per $1 |
| Gini / Inequality Index | 2,073 | 0.34 |
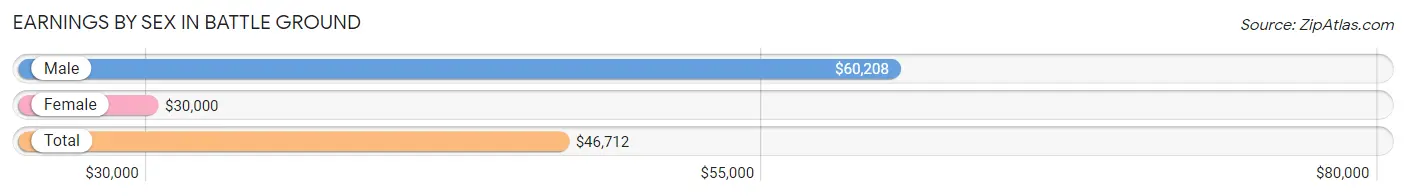
Earnings by Sex in Battle Ground
Average Earnings in Battle Ground are $46,712, $60,208 for men and $30,000 for women, a difference of 50.2%.
| Sex | Number | Average Earnings |
| Male | 601 (52.1%) | $60,208 |
| Female | 552 (47.9%) | $30,000 |
| Total | 1,153 (100.0%) | $46,712 |
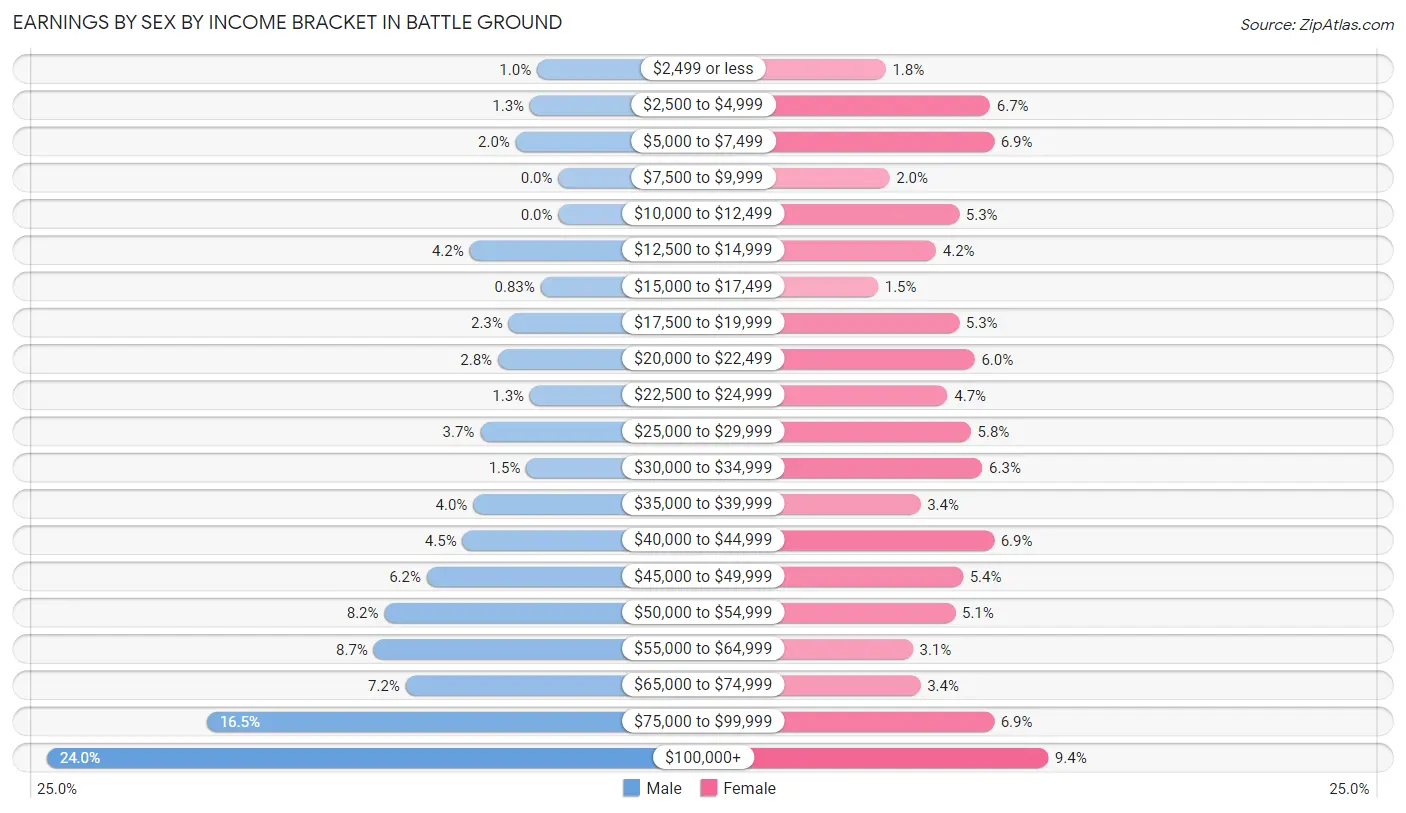
Earnings by Sex by Income Bracket in Battle Ground
The most common earnings brackets in Battle Ground are $100,000+ for men (144 | 24.0%) and $100,000+ for women (52 | 9.4%).
| Income | Male | Female |
| $2,499 or less | 6 (1.0%) | 10 (1.8%) |
| $2,500 to $4,999 | 8 (1.3%) | 37 (6.7%) |
| $5,000 to $7,499 | 12 (2.0%) | 38 (6.9%) |
| $7,500 to $9,999 | 0 (0.0%) | 11 (2.0%) |
| $10,000 to $12,499 | 0 (0.0%) | 29 (5.2%) |
| $12,500 to $14,999 | 25 (4.2%) | 23 (4.2%) |
| $15,000 to $17,499 | 5 (0.8%) | 8 (1.5%) |
| $17,500 to $19,999 | 14 (2.3%) | 29 (5.2%) |
| $20,000 to $22,499 | 17 (2.8%) | 33 (6.0%) |
| $22,500 to $24,999 | 8 (1.3%) | 26 (4.7%) |
| $25,000 to $29,999 | 22 (3.7%) | 32 (5.8%) |
| $30,000 to $34,999 | 9 (1.5%) | 35 (6.3%) |
| $35,000 to $39,999 | 24 (4.0%) | 19 (3.4%) |
| $40,000 to $44,999 | 27 (4.5%) | 38 (6.9%) |
| $45,000 to $49,999 | 37 (6.2%) | 30 (5.4%) |
| $50,000 to $54,999 | 49 (8.2%) | 28 (5.1%) |
| $55,000 to $64,999 | 52 (8.6%) | 17 (3.1%) |
| $65,000 to $74,999 | 43 (7.1%) | 19 (3.4%) |
| $75,000 to $99,999 | 99 (16.5%) | 38 (6.9%) |
| $100,000+ | 144 (24.0%) | 52 (9.4%) |
| Total | 601 (100.0%) | 552 (100.0%) |
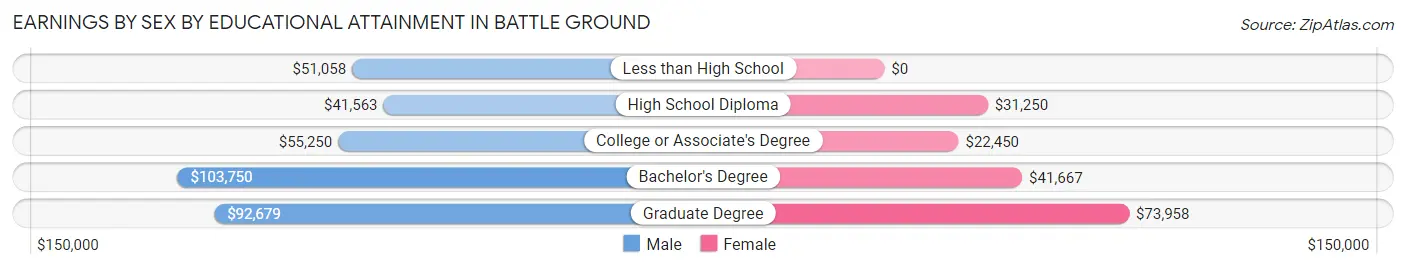
Earnings by Sex by Educational Attainment in Battle Ground
Average earnings in Battle Ground are $69,583 for men and $36,625 for women, a difference of 47.4%. Men with an educational attainment of bachelor's degree enjoy the highest average annual earnings of $103,750, while those with high school diploma education earn the least with $41,563. Women with an educational attainment of graduate degree earn the most with the average annual earnings of $73,958, while those with college or associate's degree education have the smallest earnings of $22,450.
| Educational Attainment | Male Income | Female Income |
| Less than High School | $51,058 | $0 |
| High School Diploma | $41,563 | $31,250 |
| College or Associate's Degree | $55,250 | $22,450 |
| Bachelor's Degree | $103,750 | $41,667 |
| Graduate Degree | $92,679 | $73,958 |
| Total | $69,583 | $36,625 |
Family Income in Battle Ground
Family Income Brackets in Battle Ground
According to the Battle Ground family income data, there are 212 families falling into the $100,000 to $149,999 income range, which is the most common income bracket and makes up 34.1% of all families.
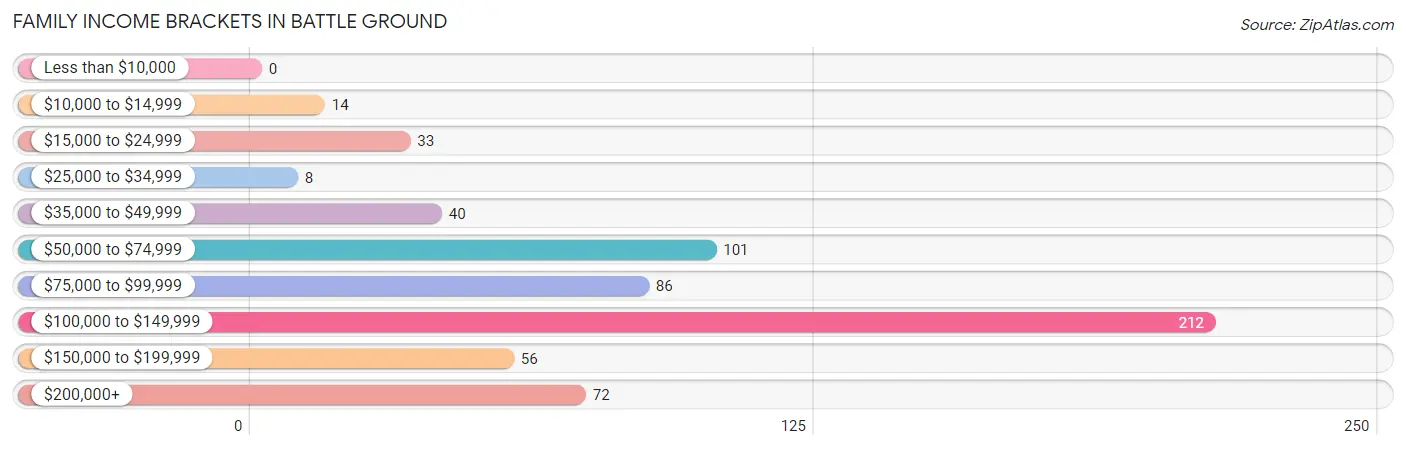
| Income Bracket | # Families | % Families |
| Less than $10,000 | 0 | 0.0% |
| $10,000 to $14,999 | 14 | 2.3% |
| $15,000 to $24,999 | 33 | 5.3% |
| $25,000 to $34,999 | 8 | 1.3% |
| $35,000 to $49,999 | 40 | 6.4% |
| $50,000 to $74,999 | 101 | 16.2% |
| $75,000 to $99,999 | 86 | 13.8% |
| $100,000 to $149,999 | 212 | 34.1% |
| $150,000 to $199,999 | 56 | 9.0% |
| $200,000+ | 72 | 11.6% |
Family Income by Famaliy Size in Battle Ground
4-person families (151 | 24.3%) account for the highest median family income in Battle Ground with $141,042 per family, while 2-person families (279 | 44.9%) have the highest median income of $48,958 per family member.
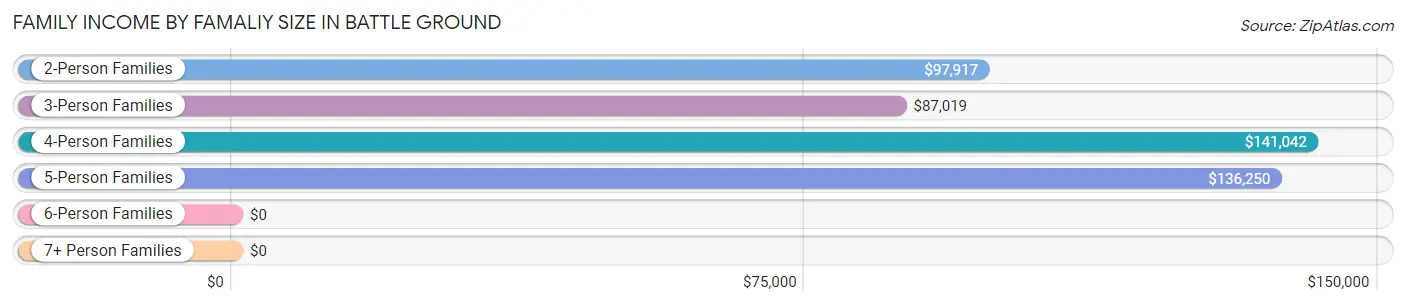
| Income Bracket | # Families | Median Income |
| 2-Person Families | 279 (44.9%) | $97,917 |
| 3-Person Families | 115 (18.5%) | $87,019 |
| 4-Person Families | 151 (24.3%) | $141,042 |
| 5-Person Families | 54 (8.7%) | $136,250 |
| 6-Person Families | 13 (2.1%) | $0 |
| 7+ Person Families | 10 (1.6%) | $0 |
| Total | 622 (100.0%) | $113,393 |
Family Income by Number of Earners in Battle Ground
The median family income in Battle Ground is $113,393, with families comprising 2 earners (281) having the highest median family income of $121,161, while families with 1 earner (203) have the lowest median family income of $76,250, accounting for 45.2% and 32.6% of families, respectively.
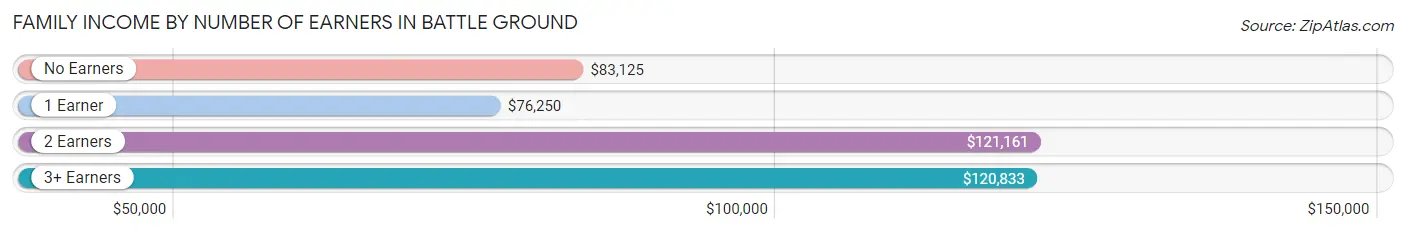
| Number of Earners | # Families | Median Income |
| No Earners | 80 (12.9%) | $83,125 |
| 1 Earner | 203 (32.6%) | $76,250 |
| 2 Earners | 281 (45.2%) | $121,161 |
| 3+ Earners | 58 (9.3%) | $120,833 |
| Total | 622 (100.0%) | $113,393 |
Household Income in Battle Ground
Household Income Brackets in Battle Ground
With 220 households falling in the category, the $100,000 to $149,999 income range is the most frequent in Battle Ground, accounting for 28.6% of all households. In contrast, only 3 households (0.4%) fall into the $10,000 to $14,999 income bracket, making it the least populous group.
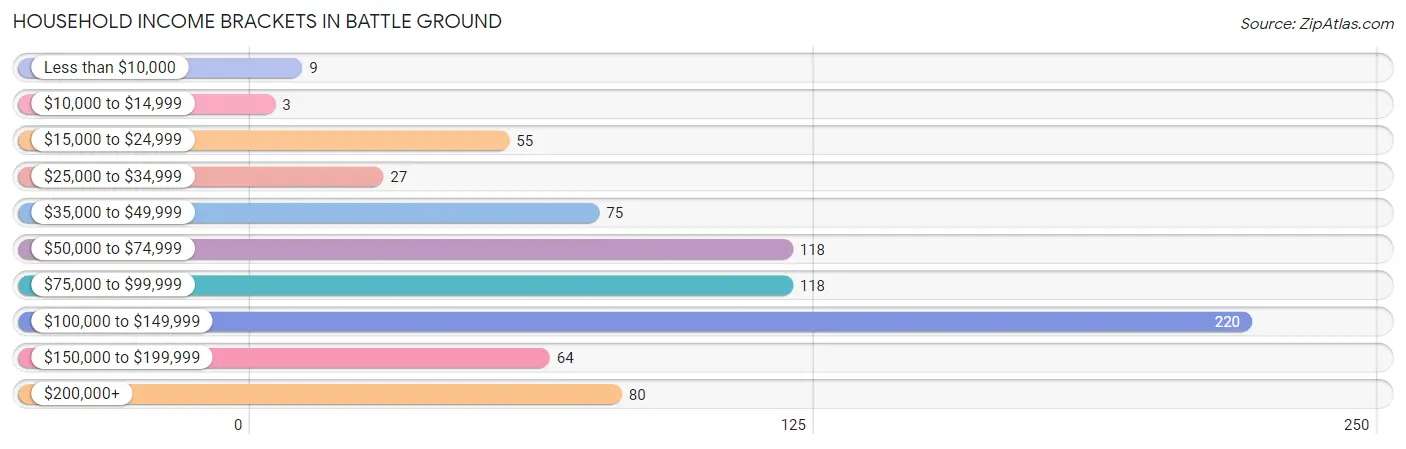
| Income Bracket | # Households | % Households |
| Less than $10,000 | 9 | 1.2% |
| $10,000 to $14,999 | 3 | 0.4% |
| $15,000 to $24,999 | 55 | 7.2% |
| $25,000 to $34,999 | 27 | 3.5% |
| $35,000 to $49,999 | 75 | 9.8% |
| $50,000 to $74,999 | 118 | 15.3% |
| $75,000 to $99,999 | 118 | 15.3% |
| $100,000 to $149,999 | 220 | 28.6% |
| $150,000 to $199,999 | 64 | 8.3% |
| $200,000+ | 80 | 10.4% |
Household Income by Householder Age in Battle Ground
The median household income in Battle Ground is $94,205, with the highest median household income of $115,469 found in the 45 to 64 years age bracket for the primary householder. A total of 230 households (29.9%) fall into this category. Meanwhile, the 65+ years age bracket for the primary householder has the lowest median household income of $80,357, with 184 households (23.9%) in this group.
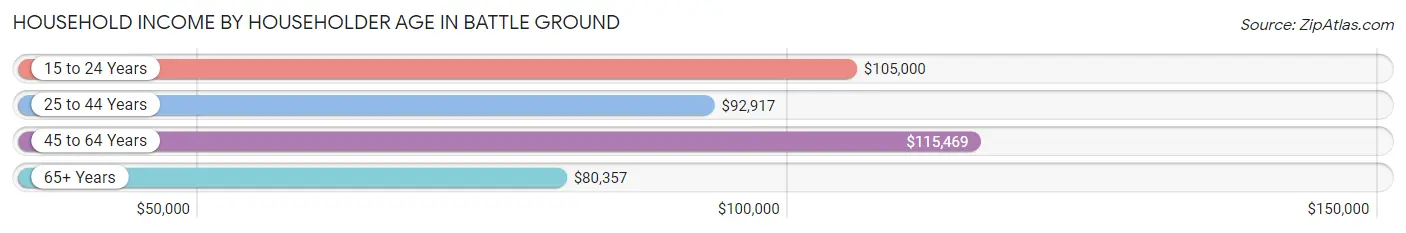
| Income Bracket | # Households | Median Income |
| 15 to 24 Years | 26 (3.4%) | $105,000 |
| 25 to 44 Years | 329 (42.8%) | $92,917 |
| 45 to 64 Years | 230 (29.9%) | $115,469 |
| 65+ Years | 184 (23.9%) | $80,357 |
| Total | 769 (100.0%) | $94,205 |
Poverty in Battle Ground
Income Below Poverty by Sex and Age in Battle Ground
With 2.2% poverty level for males and 6.2% for females among the residents of Battle Ground, 16 and 17 year old males and 25 to 34 year old females are the most vulnerable to poverty, with 3 males (10.0%) and 24 females (14.5%) in their respective age groups living below the poverty level.
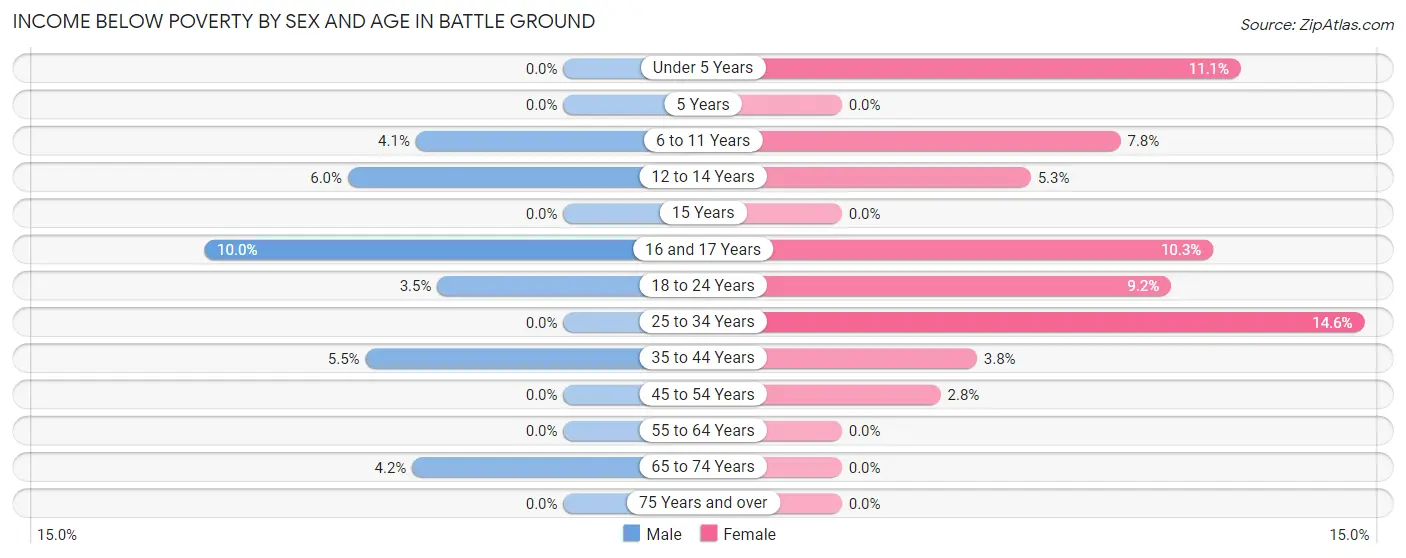
| Age Bracket | Male | Female |
| Under 5 Years | 0 (0.0%) | 10 (11.1%) |
| 5 Years | 0 (0.0%) | 0 (0.0%) |
| 6 to 11 Years | 3 (4.1%) | 9 (7.8%) |
| 12 to 14 Years | 3 (6.0%) | 2 (5.3%) |
| 15 Years | 0 (0.0%) | 0 (0.0%) |
| 16 and 17 Years | 3 (10.0%) | 3 (10.3%) |
| 18 to 24 Years | 2 (3.5%) | 10 (9.2%) |
| 25 to 34 Years | 0 (0.0%) | 24 (14.5%) |
| 35 to 44 Years | 7 (5.5%) | 5 (3.8%) |
| 45 to 54 Years | 0 (0.0%) | 3 (2.8%) |
| 55 to 64 Years | 0 (0.0%) | 0 (0.0%) |
| 65 to 74 Years | 4 (4.2%) | 0 (0.0%) |
| 75 Years and over | 0 (0.0%) | 0 (0.0%) |
| Total | 22 (2.2%) | 66 (6.2%) |
Income Above Poverty by Sex and Age in Battle Ground
According to the poverty statistics in Battle Ground, males aged under 5 years and females aged 5 years are the age groups that are most secure financially, with 100.0% of males and 100.0% of females in these age groups living above the poverty line.
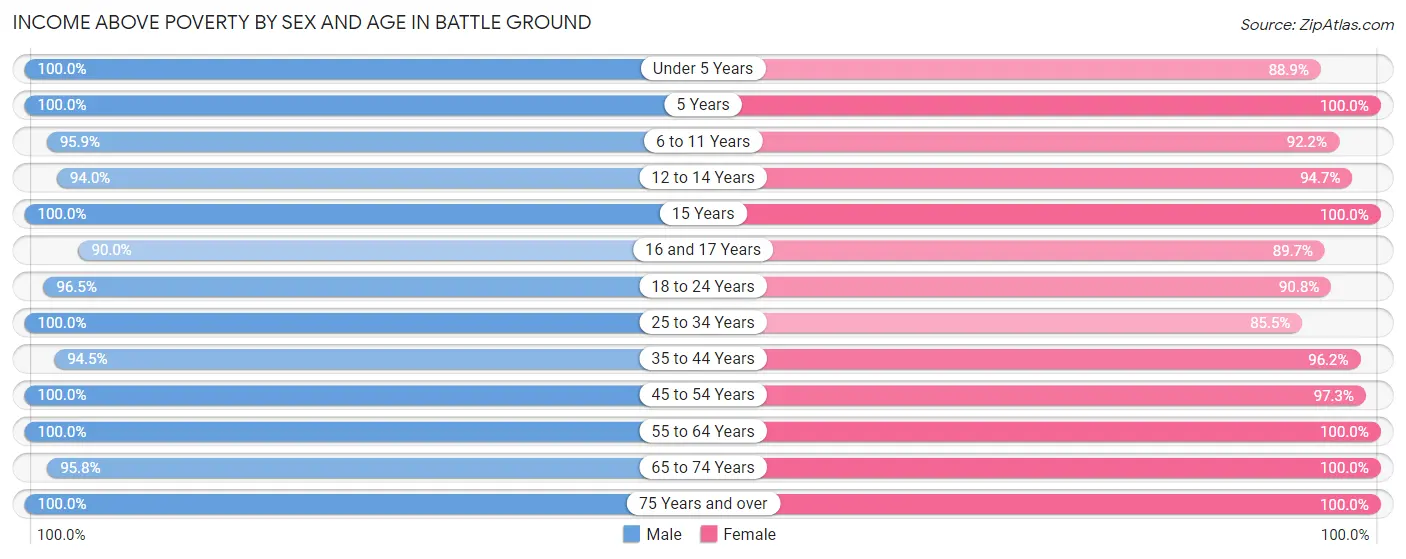
| Age Bracket | Male | Female |
| Under 5 Years | 105 (100.0%) | 80 (88.9%) |
| 5 Years | 11 (100.0%) | 39 (100.0%) |
| 6 to 11 Years | 70 (95.9%) | 107 (92.2%) |
| 12 to 14 Years | 47 (94.0%) | 36 (94.7%) |
| 15 Years | 21 (100.0%) | 12 (100.0%) |
| 16 and 17 Years | 27 (90.0%) | 26 (89.7%) |
| 18 to 24 Years | 55 (96.5%) | 99 (90.8%) |
| 25 to 34 Years | 195 (100.0%) | 141 (85.5%) |
| 35 to 44 Years | 120 (94.5%) | 128 (96.2%) |
| 45 to 54 Years | 111 (100.0%) | 106 (97.3%) |
| 55 to 64 Years | 84 (100.0%) | 72 (100.0%) |
| 65 to 74 Years | 91 (95.8%) | 107 (100.0%) |
| 75 Years and over | 47 (100.0%) | 48 (100.0%) |
| Total | 984 (97.8%) | 1,001 (93.8%) |
Income Below Poverty Among Married-Couple Families in Battle Ground
The poverty statistics for married-couple families in Battle Ground show that 0.4% or 2 of the total 485 families live below the poverty line. Families with 1 or 2 children have the highest poverty rate of 0.9%, comprising of 2 families. On the other hand, families with no children have the lowest poverty rate of 0.0%, which includes 0 families.
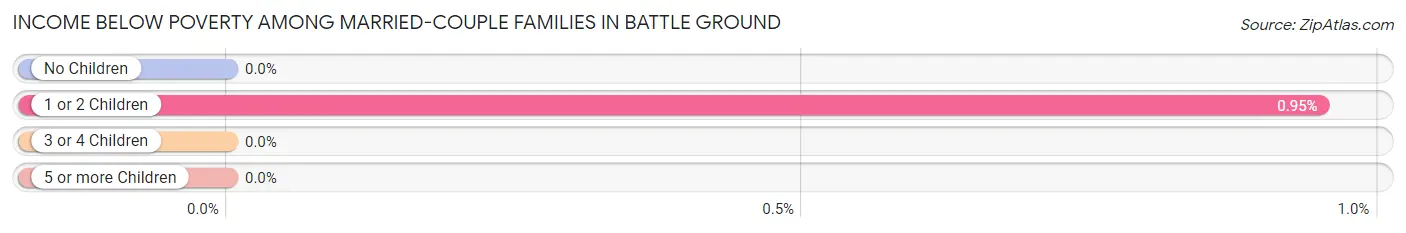
| Children | Above Poverty | Below Poverty |
| No Children | 224 (100.0%) | 0 (0.0%) |
| 1 or 2 Children | 208 (99.1%) | 2 (0.9%) |
| 3 or 4 Children | 44 (100.0%) | 0 (0.0%) |
| 5 or more Children | 7 (100.0%) | 0 (0.0%) |
| Total | 483 (99.6%) | 2 (0.4%) |
Income Below Poverty Among Single-Parent Households in Battle Ground
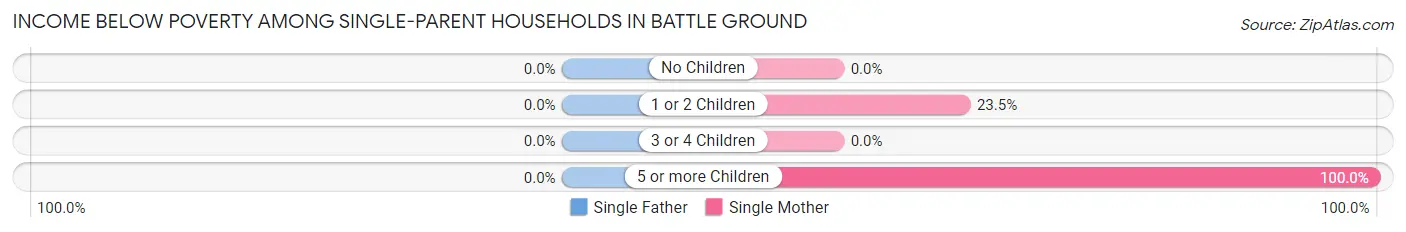
| Children | Single Father | Single Mother |
| No Children | 0 (0.0%) | 0 (0.0%) |
| 1 or 2 Children | 0 (0.0%) | 16 (23.5%) |
| 3 or 4 Children | 0 (0.0%) | 0 (0.0%) |
| 5 or more Children | 0 (0.0%) | 3 (100.0%) |
| Total | 0 (0.0%) | 19 (18.1%) |
Income Below Poverty Among Married-Couple vs Single-Parent Households in Battle Ground
The poverty data for Battle Ground shows that 2 of the married-couple family households (0.4%) and 19 of the single-parent households (13.9%) are living below the poverty level. Within the married-couple family households, those with 1 or 2 children have the highest poverty rate, with 2 households (0.9%) falling below the poverty line. Among the single-parent households, those with 5 or more children have the highest poverty rate, with 3 household (100.0%) living below poverty.
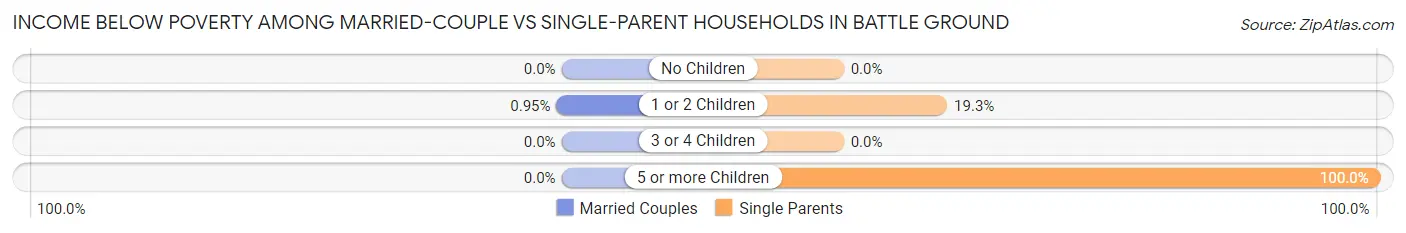
| Children | Married-Couple Families | Single-Parent Households |
| No Children | 0 (0.0%) | 0 (0.0%) |
| 1 or 2 Children | 2 (0.9%) | 16 (19.3%) |
| 3 or 4 Children | 0 (0.0%) | 0 (0.0%) |
| 5 or more Children | 0 (0.0%) | 3 (100.0%) |
| Total | 2 (0.4%) | 19 (13.9%) |
Race in Battle Ground
The most populous races in Battle Ground are White / Caucasian (1,924 | 92.8%), Hispanic or Latino (129 | 6.2%), and Two or more Races (104 | 5.0%).
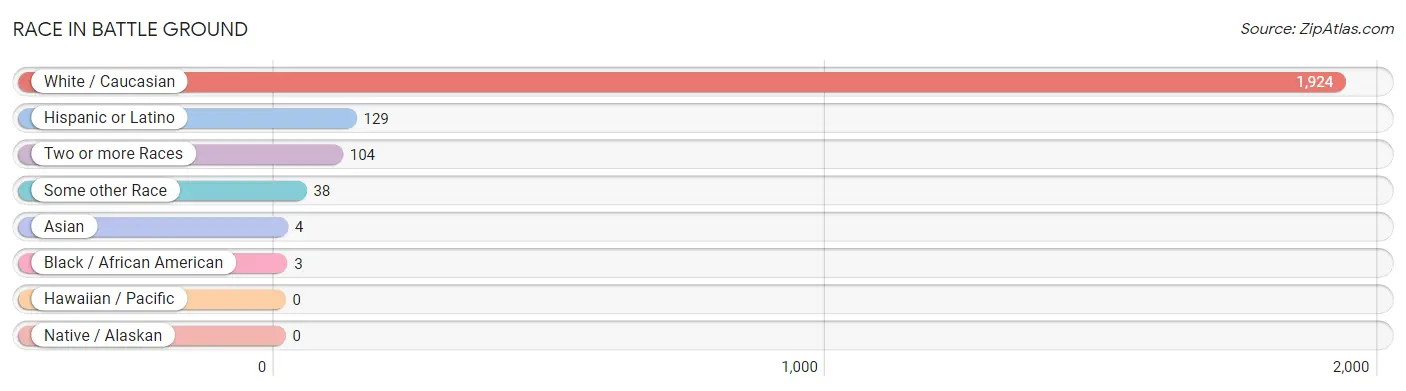
| Race | # Population | % Population |
| Asian | 4 | 0.2% |
| Black / African American | 3 | 0.1% |
| Hawaiian / Pacific | 0 | 0.0% |
| Hispanic or Latino | 129 | 6.2% |
| Native / Alaskan | 0 | 0.0% |
| White / Caucasian | 1,924 | 92.8% |
| Two or more Races | 104 | 5.0% |
| Some other Race | 38 | 1.8% |
| Total | 2,073 | 100.0% |
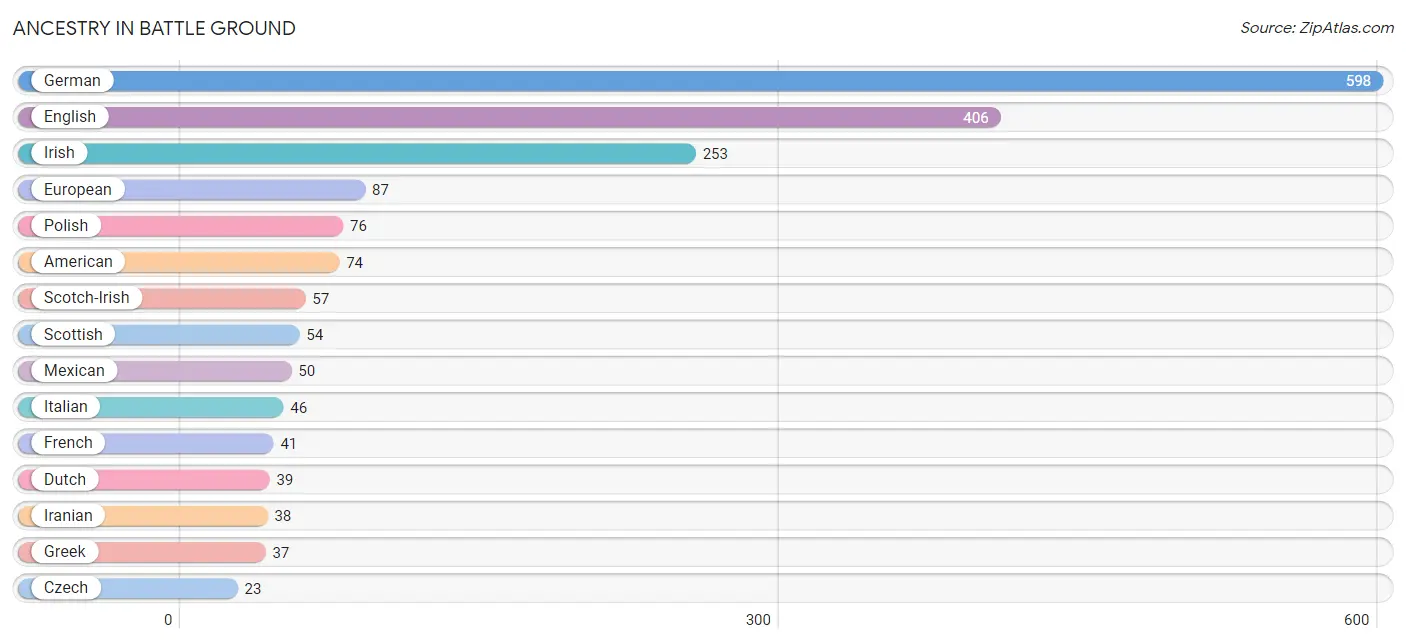
Ancestry in Battle Ground
The most populous ancestries reported in Battle Ground are German (598 | 28.8%), English (406 | 19.6%), Irish (253 | 12.2%), European (87 | 4.2%), and Polish (76 | 3.7%), together accounting for 68.5% of all Battle Ground residents.
| Ancestry | # Population | % Population |
| African | 3 | 0.1% |
| American | 74 | 3.6% |
| Arab | 4 | 0.2% |
| Austrian | 3 | 0.1% |
| British | 9 | 0.4% |
| Chinese | 4 | 0.2% |
| Colombian | 8 | 0.4% |
| Czech | 23 | 1.1% |
| Czechoslovakian | 2 | 0.1% |
| Danish | 4 | 0.2% |
| Dutch | 39 | 1.9% |
| Eastern European | 11 | 0.5% |
| English | 406 | 19.6% |
| European | 87 | 4.2% |
| French | 41 | 2.0% |
| French Canadian | 2 | 0.1% |
| German | 598 | 28.8% |
| Greek | 37 | 1.8% |
| Hungarian | 11 | 0.5% |
| Indian (Asian) | 4 | 0.2% |
| Iranian | 38 | 1.8% |
| Irish | 253 | 12.2% |
| Italian | 46 | 2.2% |
| Lebanese | 4 | 0.2% |
| Macedonian | 11 | 0.5% |
| Mexican | 50 | 2.4% |
| Norwegian | 10 | 0.5% |
| Polish | 76 | 3.7% |
| Puerto Rican | 7 | 0.3% |
| Scotch-Irish | 57 | 2.8% |
| Scottish | 54 | 2.6% |
| Slovak | 4 | 0.2% |
| South African | 3 | 0.1% |
| South American | 8 | 0.4% |
| Subsaharan African | 6 | 0.3% |
| Swedish | 14 | 0.7% |
| Swiss | 17 | 0.8% |
| Welsh | 22 | 1.1% | View All 38 Rows |
Immigrants in Battle Ground
The most numerous immigrant groups reported in Battle Ground came from Latin America (18 | 0.9%), Europe (17 | 0.8%), Northern Europe (17 | 0.8%), South America (16 | 0.8%), and Colombia (8 | 0.4%), together accounting for 3.7% of all Battle Ground residents.
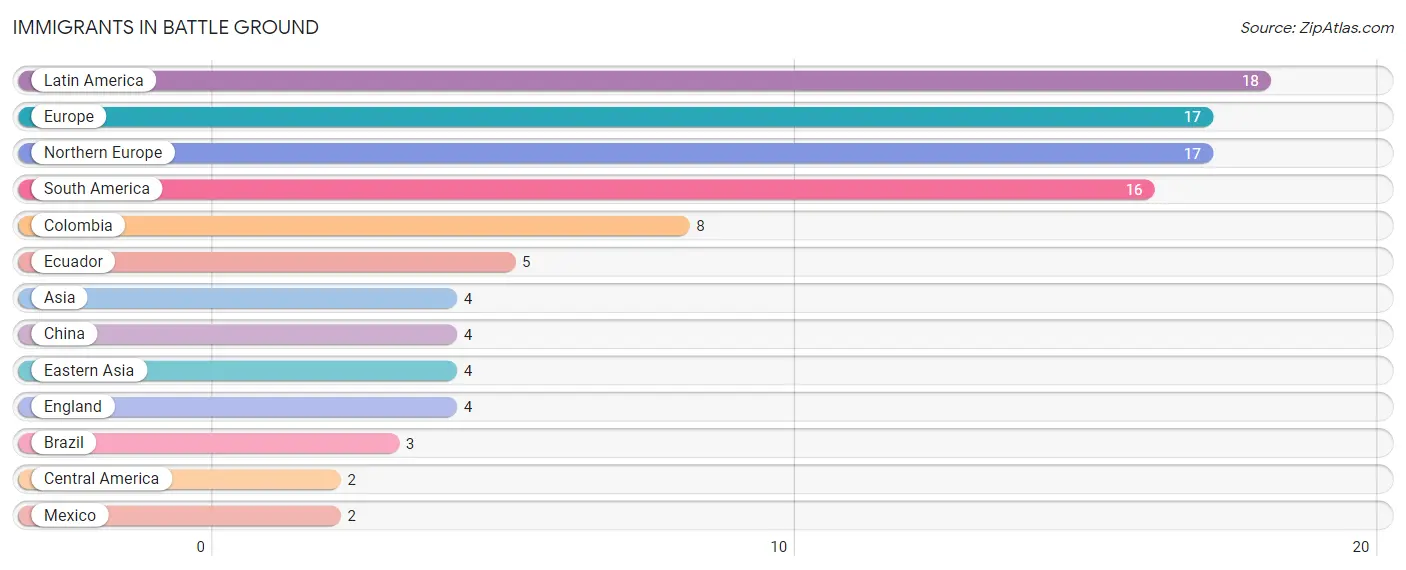
| Immigration Origin | # Population | % Population |
| Asia | 4 | 0.2% |
| Brazil | 3 | 0.1% |
| Central America | 2 | 0.1% |
| China | 4 | 0.2% |
| Colombia | 8 | 0.4% |
| Eastern Asia | 4 | 0.2% |
| Ecuador | 5 | 0.2% |
| England | 4 | 0.2% |
| Europe | 17 | 0.8% |
| Latin America | 18 | 0.9% |
| Mexico | 2 | 0.1% |
| Northern Europe | 17 | 0.8% |
| South America | 16 | 0.8% | View All 13 Rows |
Sex and Age in Battle Ground
Sex and Age in Battle Ground
The most populous age groups in Battle Ground are Under 5 Years (105 | 10.4%) for men and 5 to 9 Years (115 | 10.8%) for women.
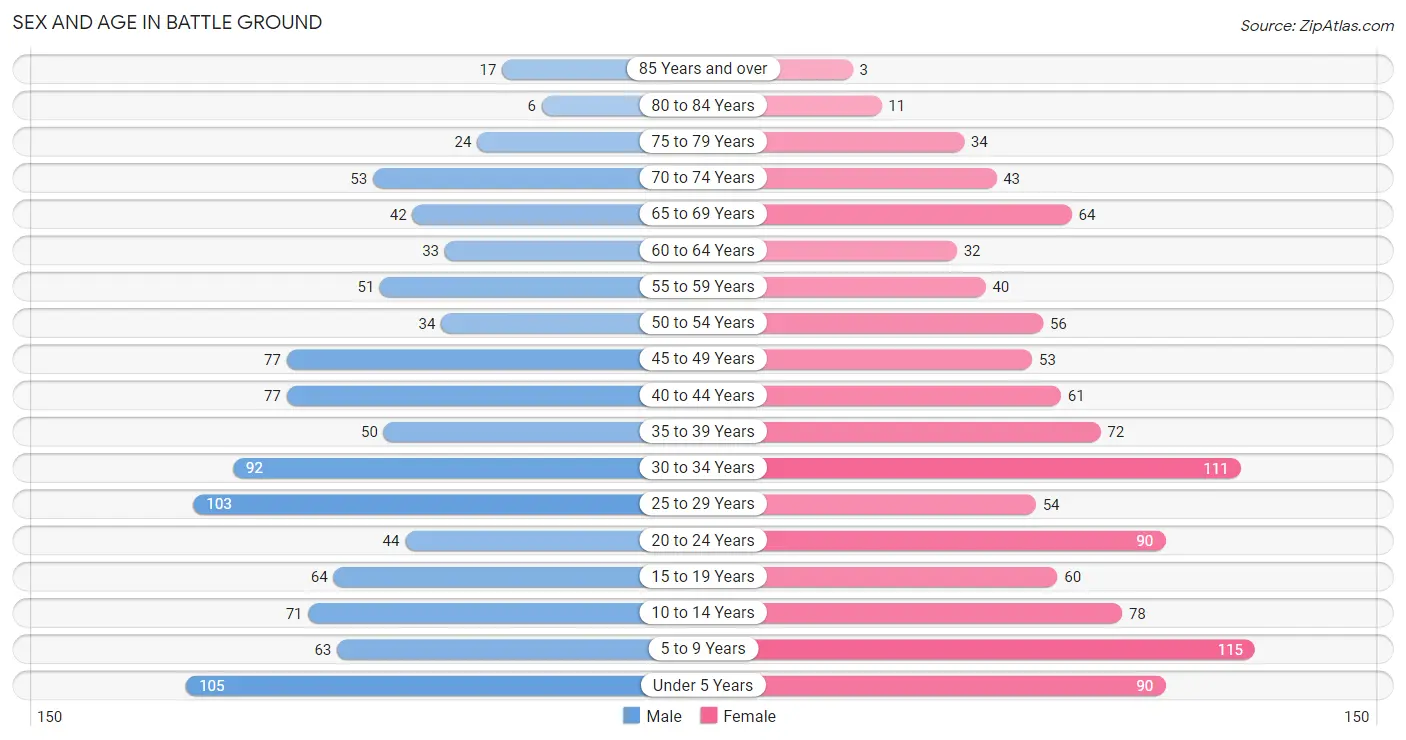
| Age Bracket | Male | Female |
| Under 5 Years | 105 (10.4%) | 90 (8.4%) |
| 5 to 9 Years | 63 (6.3%) | 115 (10.8%) |
| 10 to 14 Years | 71 (7.1%) | 78 (7.3%) |
| 15 to 19 Years | 64 (6.4%) | 60 (5.6%) |
| 20 to 24 Years | 44 (4.4%) | 90 (8.4%) |
| 25 to 29 Years | 103 (10.2%) | 54 (5.1%) |
| 30 to 34 Years | 92 (9.1%) | 111 (10.4%) |
| 35 to 39 Years | 50 (5.0%) | 72 (6.8%) |
| 40 to 44 Years | 77 (7.6%) | 61 (5.7%) |
| 45 to 49 Years | 77 (7.6%) | 53 (5.0%) |
| 50 to 54 Years | 34 (3.4%) | 56 (5.2%) |
| 55 to 59 Years | 51 (5.1%) | 40 (3.7%) |
| 60 to 64 Years | 33 (3.3%) | 32 (3.0%) |
| 65 to 69 Years | 42 (4.2%) | 64 (6.0%) |
| 70 to 74 Years | 53 (5.3%) | 43 (4.0%) |
| 75 to 79 Years | 24 (2.4%) | 34 (3.2%) |
| 80 to 84 Years | 6 (0.6%) | 11 (1.0%) |
| 85 Years and over | 17 (1.7%) | 3 (0.3%) |
| Total | 1,006 (100.0%) | 1,067 (100.0%) |
Families and Households in Battle Ground
Median Family Size in Battle Ground
The median family size in Battle Ground is 3.00 persons per family, with married-couple families (485 | 78.0%) accounting for the largest median family size of 3.12 persons per family. On the other hand, single female/mother families (105 | 16.9%) represent the smallest median family size with 2.56 persons per family.
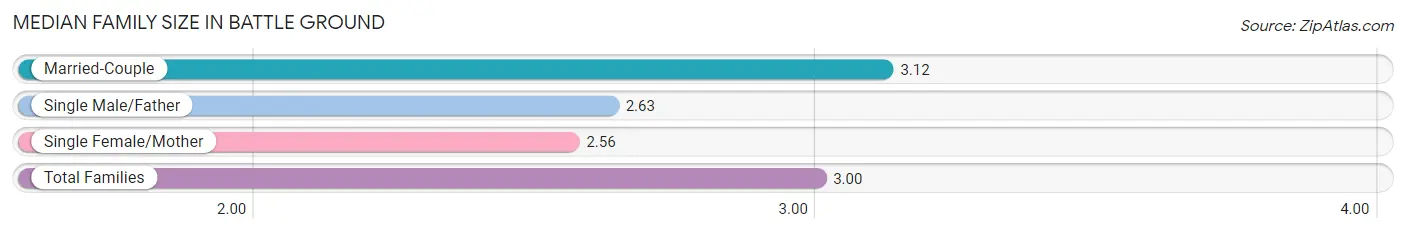
| Family Type | # Families | Family Size |
| Married-Couple | 485 (78.0%) | 3.12 |
| Single Male/Father | 32 (5.1%) | 2.63 |
| Single Female/Mother | 105 (16.9%) | 2.56 |
| Total Families | 622 (100.0%) | 3.00 |
Median Household Size in Battle Ground
The median household size in Battle Ground is 2.70 persons per household, with single male/father households (32 | 4.2%) accounting for the largest median household size of 3.22 persons per household. non-family households (147 | 19.1%) represent the smallest median household size with 1.08 persons per household.
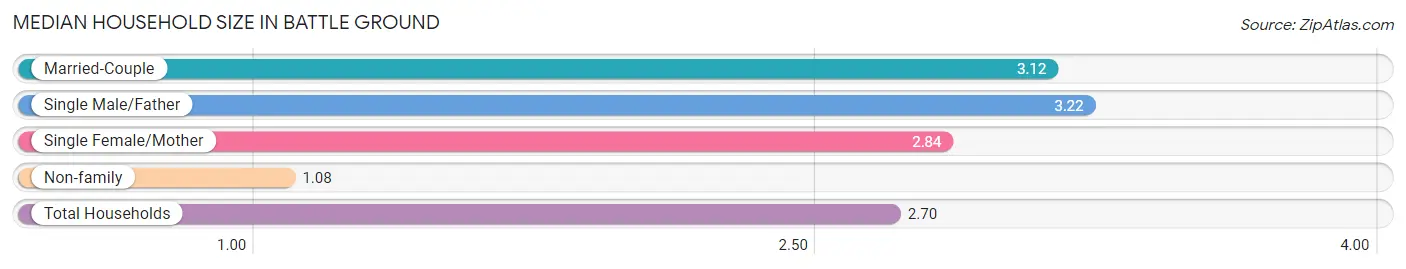
| Household Type | # Households | Household Size |
| Married-Couple | 485 (63.1%) | 3.12 |
| Single Male/Father | 32 (4.2%) | 3.22 |
| Single Female/Mother | 105 (13.7%) | 2.84 |
| Non-family | 147 (19.1%) | 1.08 |
| Total Households | 769 (100.0%) | 2.70 |
Household Size by Marriage Status in Battle Ground
Out of a total of 769 households in Battle Ground, 622 (80.9%) are family households, while 147 (19.1%) are nonfamily households. The most numerous type of family households are 2-person households, comprising 253, and the most common type of nonfamily households are 1-person households, comprising 135.
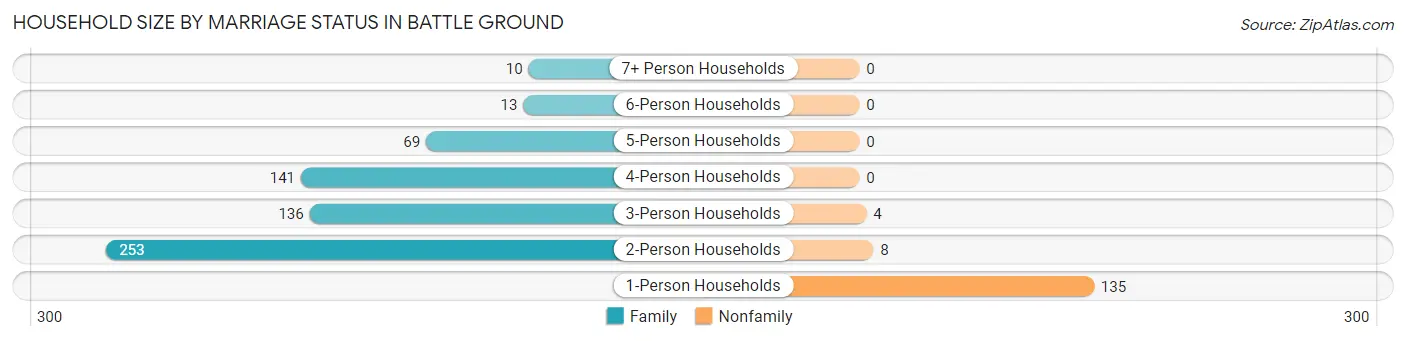
| Household Size | Family Households | Nonfamily Households |
| 1-Person Households | - | 135 (17.6%) |
| 2-Person Households | 253 (32.9%) | 8 (1.0%) |
| 3-Person Households | 136 (17.7%) | 4 (0.5%) |
| 4-Person Households | 141 (18.3%) | 0 (0.0%) |
| 5-Person Households | 69 (9.0%) | 0 (0.0%) |
| 6-Person Households | 13 (1.7%) | 0 (0.0%) |
| 7+ Person Households | 10 (1.3%) | 0 (0.0%) |
| Total | 622 (80.9%) | 147 (19.1%) |
Female Fertility in Battle Ground
Fertility by Age in Battle Ground
Average fertility rate in Battle Ground is 41.0 births per 1,000 women. Women in the age bracket of 20 to 34 years have the highest fertility rate with 63.0 births per 1,000 women. Women in the age bracket of 20 to 34 years acount for 76.2% of all women with births.
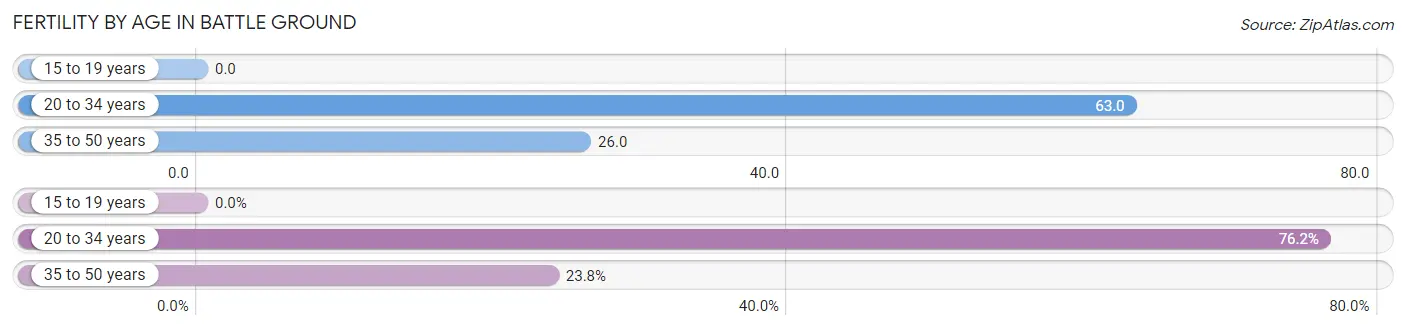
| Age Bracket | Women with Births | Births / 1,000 Women |
| 15 to 19 years | 0 (0.0%) | 0.0 |
| 20 to 34 years | 16 (76.2%) | 63.0 |
| 35 to 50 years | 5 (23.8%) | 26.0 |
| Total | 21 (100.0%) | 41.0 |
Fertility by Age by Marriage Status in Battle Ground
42.9% of women with births (21) in Battle Ground are married. The highest percentage of unmarried women with births falls into 20 to 34 years age bracket with 62.5% of them unmarried at the time of birth, while the lowest percentage of unmarried women with births belong to 35 to 50 years age bracket with 40.0% of them unmarried.
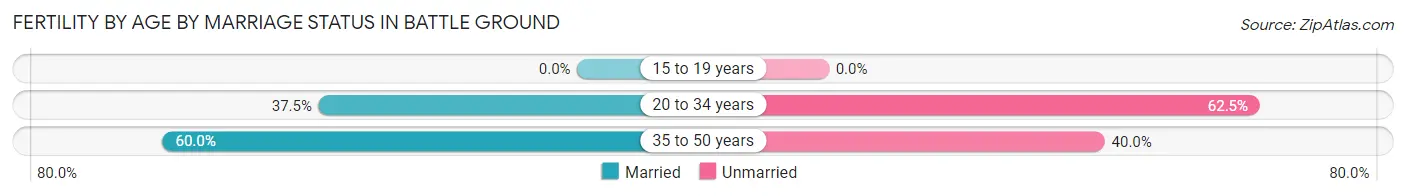
| Age Bracket | Married | Unmarried |
| 15 to 19 years | 0 (0.0%) | 0 (0.0%) |
| 20 to 34 years | 6 (37.5%) | 10 (62.5%) |
| 35 to 50 years | 3 (60.0%) | 2 (40.0%) |
| Total | 9 (42.9%) | 12 (57.1%) |
Fertility by Education in Battle Ground
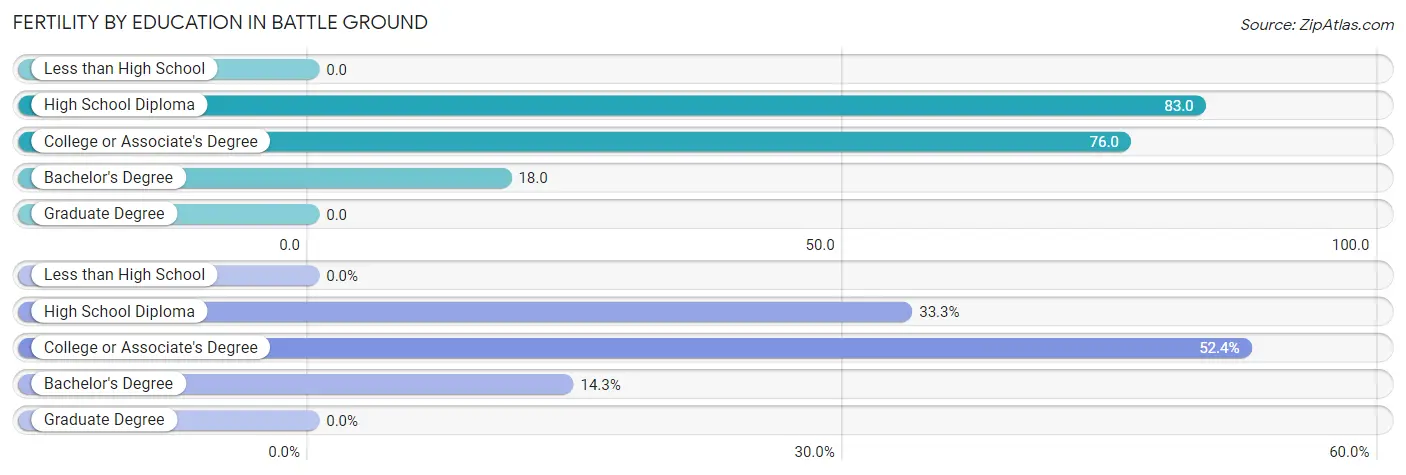
| Educational Attainment | Women with Births | Births / 1,000 Women |
| Less than High School | 0 (0.0%) | 0.0 |
| High School Diploma | 7 (33.3%) | 83.0 |
| College or Associate's Degree | 11 (52.4%) | 76.0 |
| Bachelor's Degree | 3 (14.3%) | 18.0 |
| Graduate Degree | 0 (0.0%) | 0.0 |
| Total | 21 (100.0%) | 41.0 |
Fertility by Education by Marriage Status in Battle Ground
57.1% of women with births in Battle Ground are unmarried. Women with the educational attainment of bachelor's degree are most likely to be married with 100.0% of them married at childbirth, while women with the educational attainment of high school diploma are least likely to be married with 100.0% of them unmarried at childbirth.
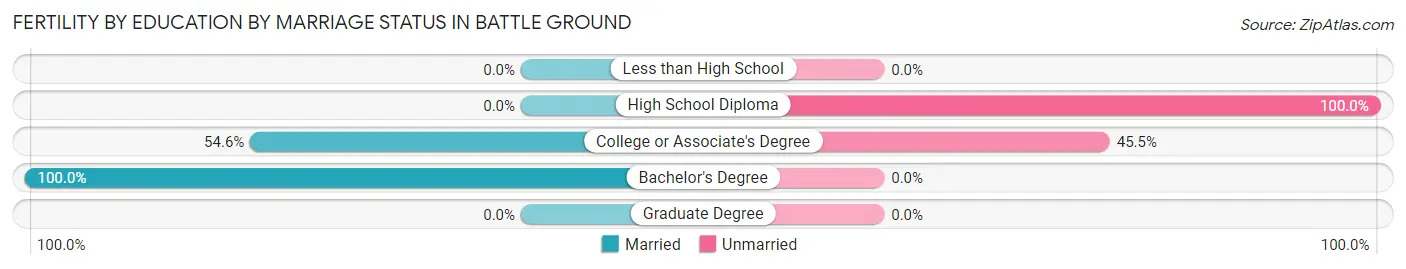
| Educational Attainment | Married | Unmarried |
| Less than High School | 0 (0.0%) | 0 (0.0%) |
| High School Diploma | 0 (0.0%) | 7 (100.0%) |
| College or Associate's Degree | 6 (54.5%) | 5 (45.5%) |
| Bachelor's Degree | 3 (100.0%) | 0 (0.0%) |
| Graduate Degree | 0 (0.0%) | 0 (0.0%) |
| Total | 9 (42.9%) | 12 (57.1%) |
Employment Characteristics in Battle Ground
Employment by Class of Employer in Battle Ground
Among the 1,059 employed individuals in Battle Ground, private company employees (603 | 56.9%), state government employees (156 | 14.7%), and not-for-profit organizations (104 | 9.8%) make up the most common classes of employment.
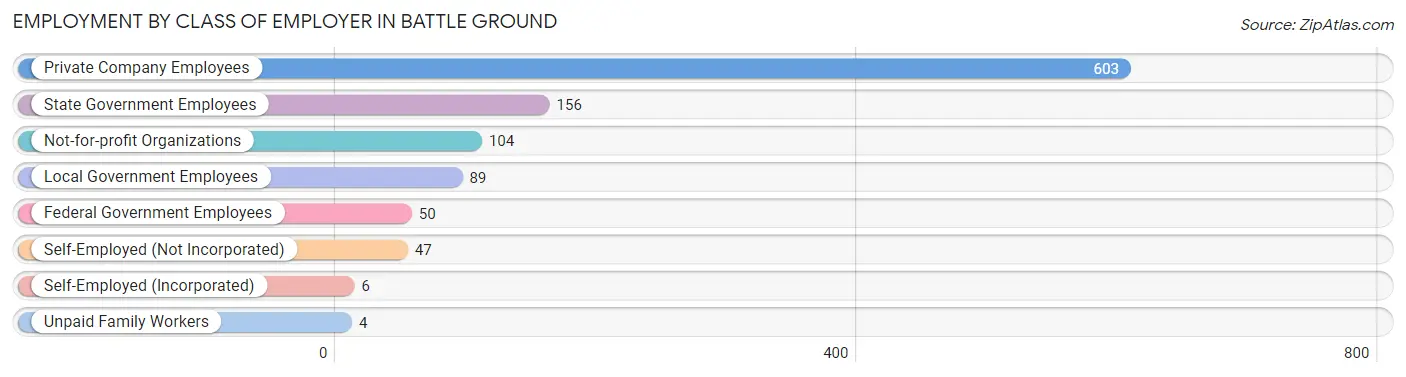
| Employer Class | # Employees | % Employees |
| Private Company Employees | 603 | 56.9% |
| Self-Employed (Incorporated) | 6 | 0.6% |
| Self-Employed (Not Incorporated) | 47 | 4.4% |
| Not-for-profit Organizations | 104 | 9.8% |
| Local Government Employees | 89 | 8.4% |
| State Government Employees | 156 | 14.7% |
| Federal Government Employees | 50 | 4.7% |
| Unpaid Family Workers | 4 | 0.4% |
| Total | 1,059 | 100.0% |
Employment Status by Age in Battle Ground
According to the labor force statistics for Battle Ground, out of the total population over 16 years of age (1,518), 74.0% or 1,123 individuals are in the labor force, with 4.8% or 54 of them unemployed. The age group with the highest labor force participation rate is 45 to 54 years, with 93.2% or 205 individuals in the labor force. Within the labor force, the 16 to 19 years age range has the highest percentage of unemployed individuals, with 17.9% or 7 of them being unemployed.
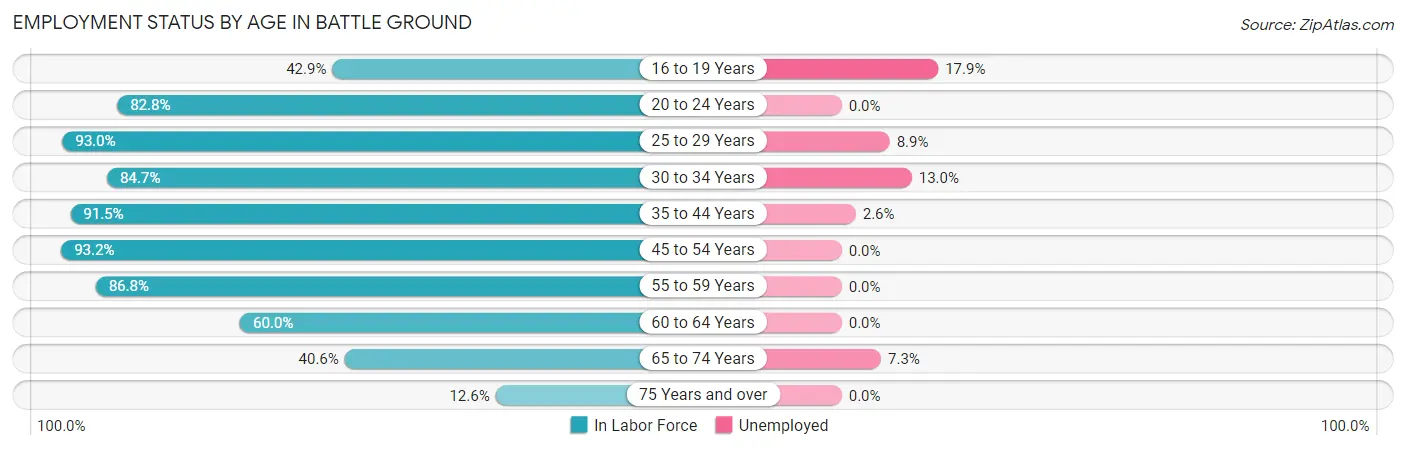
| Age Bracket | In Labor Force | Unemployed |
| 16 to 19 Years | 39 (42.9%) | 7 (17.9%) |
| 20 to 24 Years | 111 (82.8%) | 0 (0.0%) |
| 25 to 29 Years | 146 (93.0%) | 13 (8.9%) |
| 30 to 34 Years | 172 (84.7%) | 22 (13.0%) |
| 35 to 44 Years | 238 (91.5%) | 6 (2.6%) |
| 45 to 54 Years | 205 (93.2%) | 0 (0.0%) |
| 55 to 59 Years | 79 (86.8%) | 0 (0.0%) |
| 60 to 64 Years | 39 (60.0%) | 0 (0.0%) |
| 65 to 74 Years | 82 (40.6%) | 6 (7.3%) |
| 75 Years and over | 12 (12.6%) | 0 (0.0%) |
| Total | 1,123 (74.0%) | 54 (4.8%) |
Employment Status by Educational Attainment in Battle Ground
According to labor force statistics for Battle Ground, 88.3% of individuals (879) out of the total population between 25 and 64 years of age (996) are in the labor force, with 4.6% or 40 of them being unemployed. The group with the highest labor force participation rate are those with the educational attainment of high school diploma, with 94.6% or 176 individuals in the labor force. Within the labor force, individuals with bachelor's degree or higher education have the highest percentage of unemployment, with 6.9% or 32 of them being unemployed.
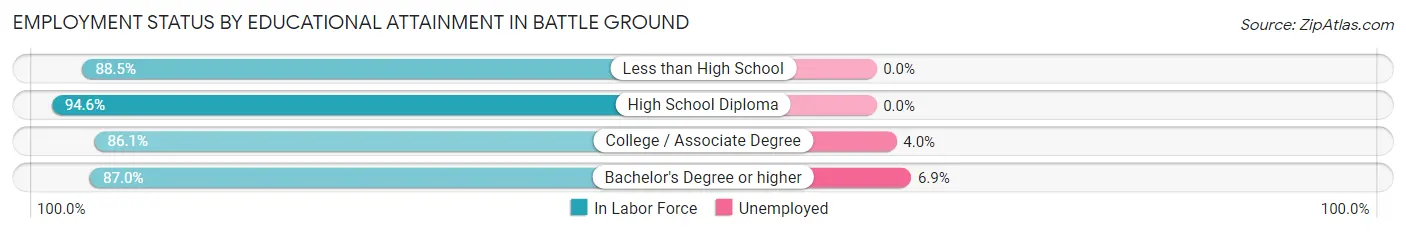
| Educational Attainment | In Labor Force | Unemployed |
| Less than High School | 23 (88.5%) | 0 (0.0%) |
| High School Diploma | 176 (94.6%) | 0 (0.0%) |
| College / Associate Degree | 211 (86.1%) | 10 (4.0%) |
| Bachelor's Degree or higher | 469 (87.0%) | 37 (6.9%) |
| Total | 879 (88.3%) | 46 (4.6%) |
Employment Occupations by Sex in Battle Ground
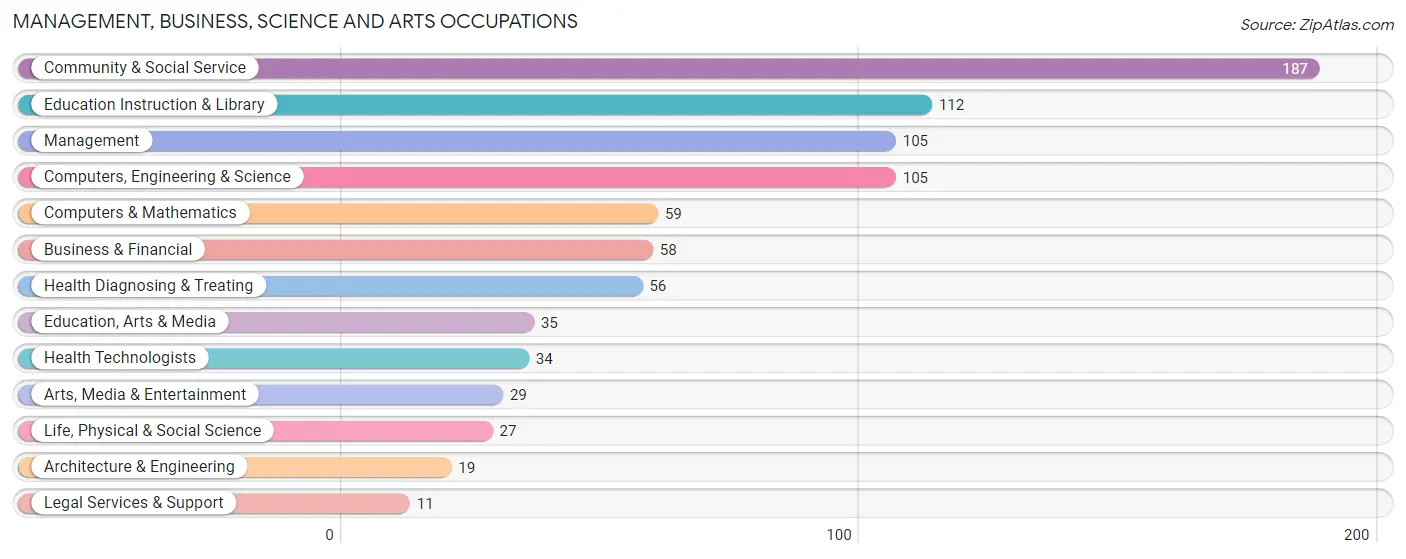
Management, Business, Science and Arts Occupations
The most common Management, Business, Science and Arts occupations in Battle Ground are Community & Social Service (187 | 17.7%), Education Instruction & Library (112 | 10.6%), Management (105 | 9.9%), Computers, Engineering & Science (105 | 9.9%), and Computers & Mathematics (59 | 5.6%).
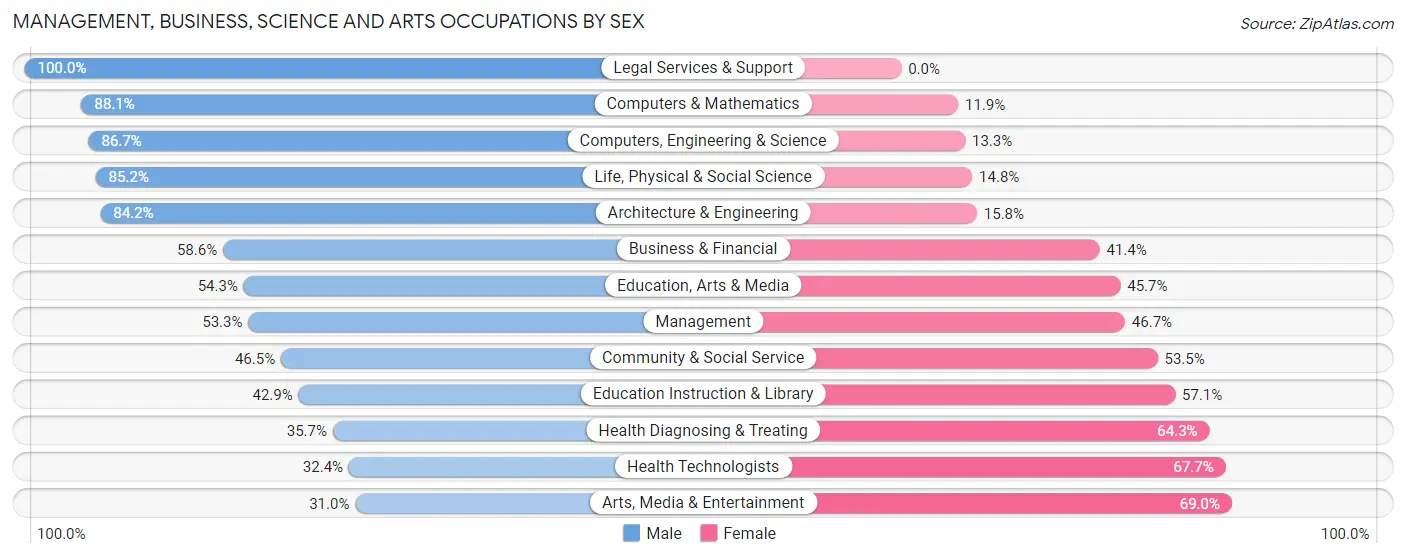
Management, Business, Science and Arts Occupations by Sex
Within the Management, Business, Science and Arts occupations in Battle Ground, the most male-oriented occupations are Legal Services & Support (100.0%), Computers & Mathematics (88.1%), and Computers, Engineering & Science (86.7%), while the most female-oriented occupations are Arts, Media & Entertainment (69.0%), Health Technologists (67.6%), and Health Diagnosing & Treating (64.3%).
| Occupation | Male | Female |
| Management | 56 (53.3%) | 49 (46.7%) |
| Business & Financial | 34 (58.6%) | 24 (41.4%) |
| Computers, Engineering & Science | 91 (86.7%) | 14 (13.3%) |
| Computers & Mathematics | 52 (88.1%) | 7 (11.9%) |
| Architecture & Engineering | 16 (84.2%) | 3 (15.8%) |
| Life, Physical & Social Science | 23 (85.2%) | 4 (14.8%) |
| Community & Social Service | 87 (46.5%) | 100 (53.5%) |
| Education, Arts & Media | 19 (54.3%) | 16 (45.7%) |
| Legal Services & Support | 11 (100.0%) | 0 (0.0%) |
| Education Instruction & Library | 48 (42.9%) | 64 (57.1%) |
| Arts, Media & Entertainment | 9 (31.0%) | 20 (69.0%) |
| Health Diagnosing & Treating | 20 (35.7%) | 36 (64.3%) |
| Health Technologists | 11 (32.4%) | 23 (67.6%) |
| Total (Category) | 288 (56.4%) | 223 (43.6%) |
| Total (Overall) | 554 (52.4%) | 503 (47.6%) |
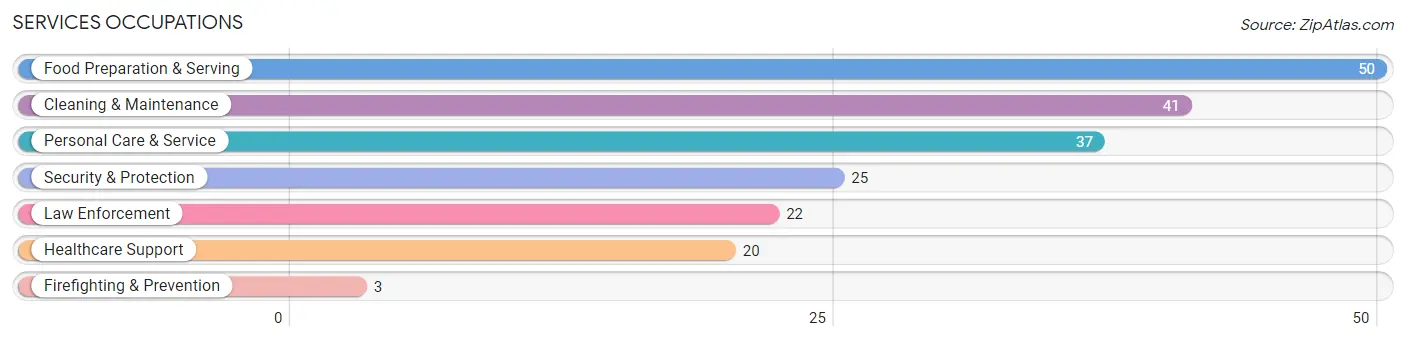
Services Occupations
The most common Services occupations in Battle Ground are Food Preparation & Serving (50 | 4.7%), Cleaning & Maintenance (41 | 3.9%), Personal Care & Service (37 | 3.5%), Security & Protection (25 | 2.4%), and Law Enforcement (22 | 2.1%).
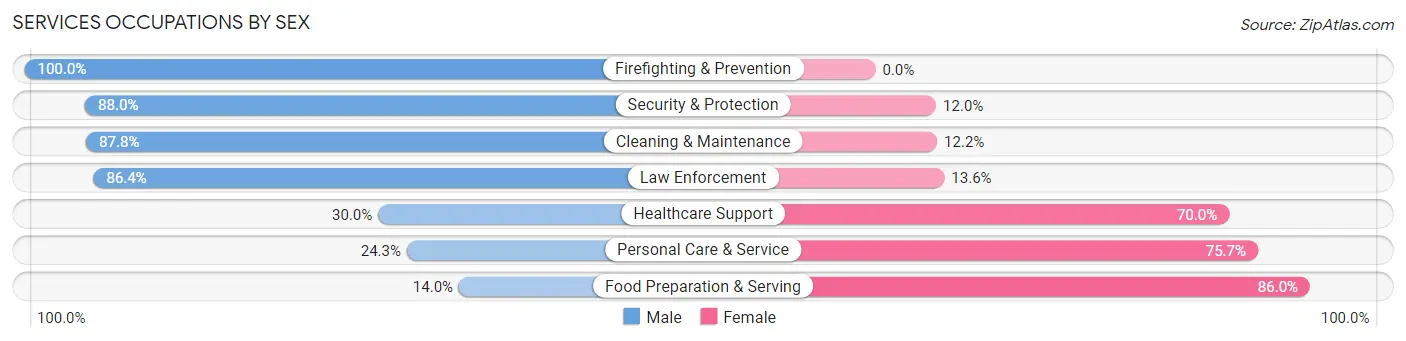
Services Occupations by Sex
Within the Services occupations in Battle Ground, the most male-oriented occupations are Firefighting & Prevention (100.0%), Security & Protection (88.0%), and Cleaning & Maintenance (87.8%), while the most female-oriented occupations are Food Preparation & Serving (86.0%), Personal Care & Service (75.7%), and Healthcare Support (70.0%).
| Occupation | Male | Female |
| Healthcare Support | 6 (30.0%) | 14 (70.0%) |
| Security & Protection | 22 (88.0%) | 3 (12.0%) |
| Firefighting & Prevention | 3 (100.0%) | 0 (0.0%) |
| Law Enforcement | 19 (86.4%) | 3 (13.6%) |
| Food Preparation & Serving | 7 (14.0%) | 43 (86.0%) |
| Cleaning & Maintenance | 36 (87.8%) | 5 (12.2%) |
| Personal Care & Service | 9 (24.3%) | 28 (75.7%) |
| Total (Category) | 80 (46.2%) | 93 (53.8%) |
| Total (Overall) | 554 (52.4%) | 503 (47.6%) |
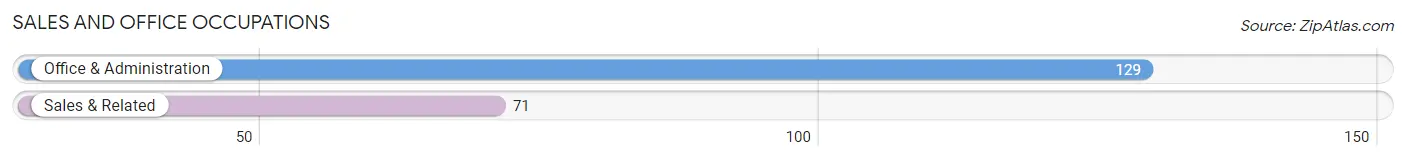
Sales and Office Occupations
The most common Sales and Office occupations in Battle Ground are Office & Administration (129 | 12.2%), and Sales & Related (71 | 6.7%).
Sales and Office Occupations by Sex
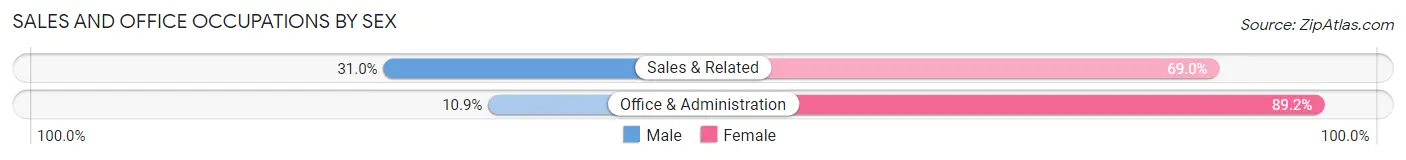
| Occupation | Male | Female |
| Sales & Related | 22 (31.0%) | 49 (69.0%) |
| Office & Administration | 14 (10.8%) | 115 (89.1%) |
| Total (Category) | 36 (18.0%) | 164 (82.0%) |
| Total (Overall) | 554 (52.4%) | 503 (47.6%) |
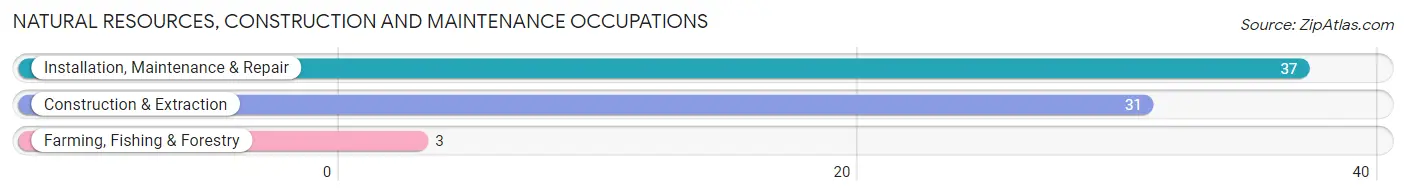
Natural Resources, Construction and Maintenance Occupations
The most common Natural Resources, Construction and Maintenance occupations in Battle Ground are Installation, Maintenance & Repair (37 | 3.5%), Construction & Extraction (31 | 2.9%), and Farming, Fishing & Forestry (3 | 0.3%).
Natural Resources, Construction and Maintenance Occupations by Sex
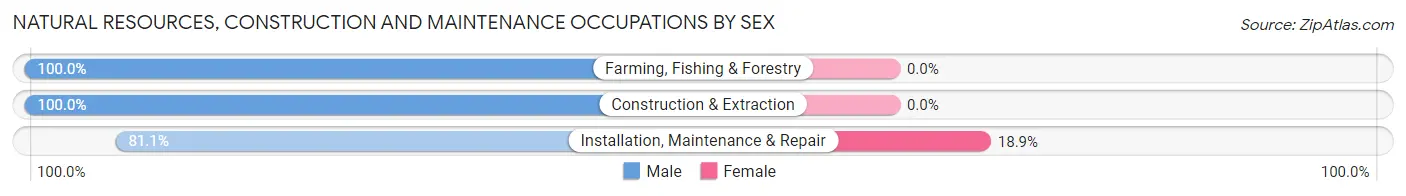
| Occupation | Male | Female |
| Farming, Fishing & Forestry | 3 (100.0%) | 0 (0.0%) |
| Construction & Extraction | 31 (100.0%) | 0 (0.0%) |
| Installation, Maintenance & Repair | 30 (81.1%) | 7 (18.9%) |
| Total (Category) | 64 (90.1%) | 7 (9.9%) |
| Total (Overall) | 554 (52.4%) | 503 (47.6%) |
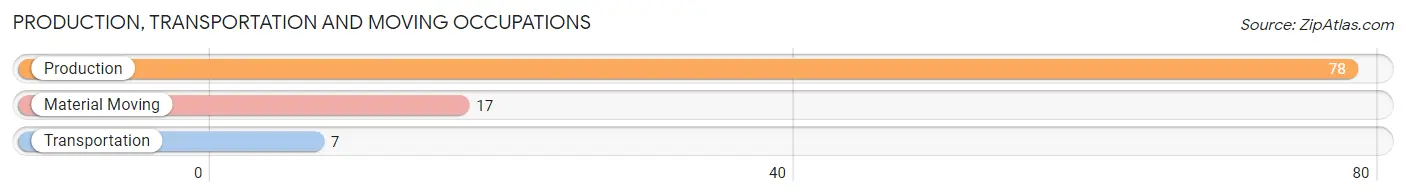
Production, Transportation and Moving Occupations
The most common Production, Transportation and Moving occupations in Battle Ground are Production (78 | 7.4%), Material Moving (17 | 1.6%), and Transportation (7 | 0.7%).
Production, Transportation and Moving Occupations by Sex
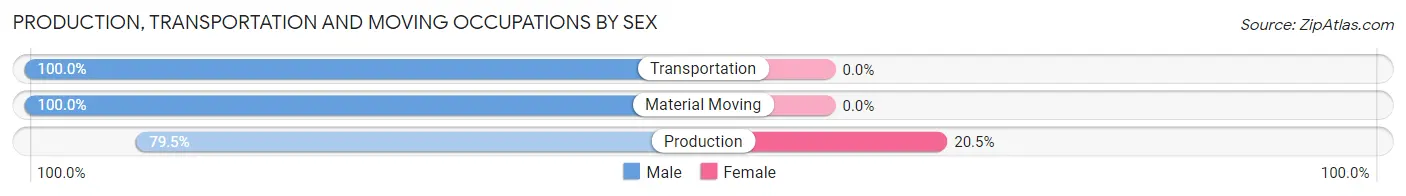
| Occupation | Male | Female |
| Production | 62 (79.5%) | 16 (20.5%) |
| Transportation | 7 (100.0%) | 0 (0.0%) |
| Material Moving | 17 (100.0%) | 0 (0.0%) |
| Total (Category) | 86 (84.3%) | 16 (15.7%) |
| Total (Overall) | 554 (52.4%) | 503 (47.6%) |
Employment Industries by Sex in Battle Ground
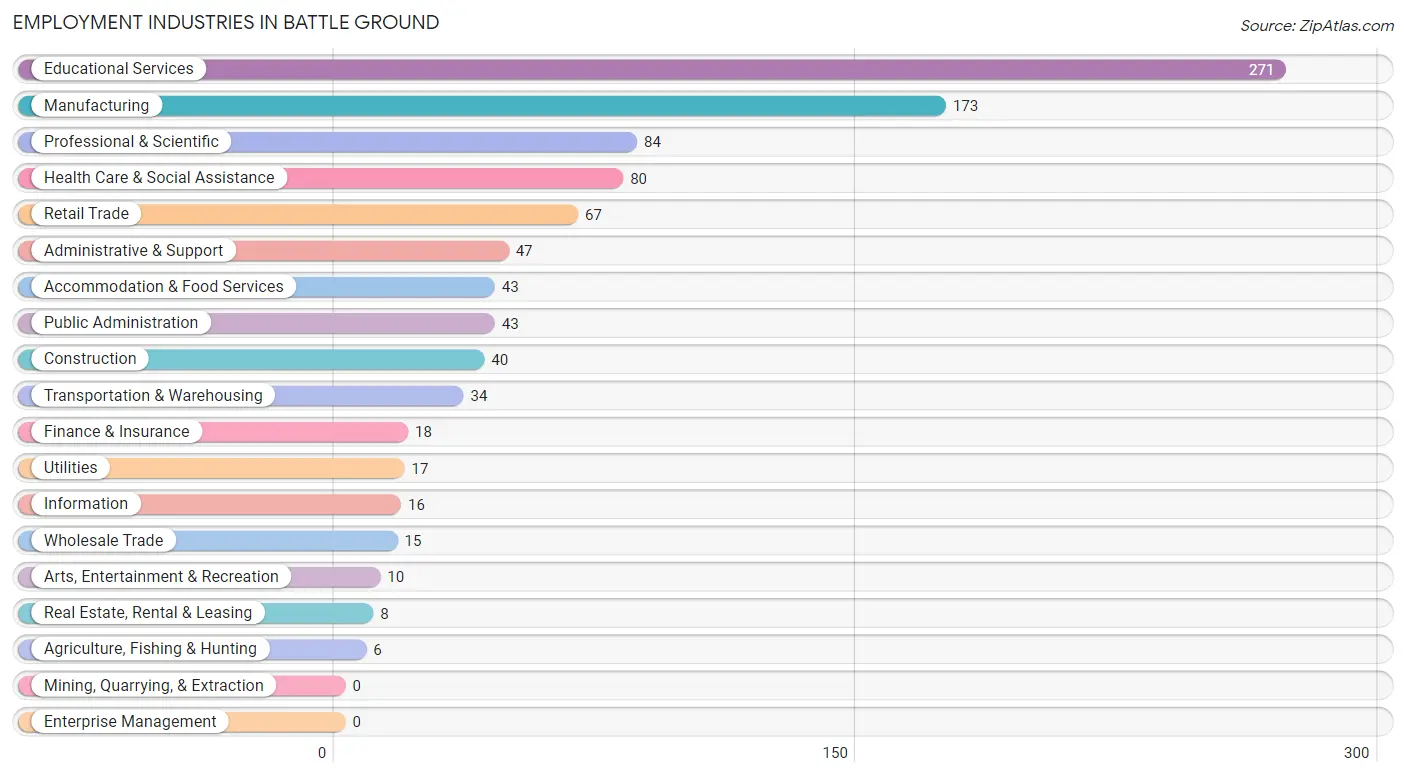
Employment Industries in Battle Ground
The major employment industries in Battle Ground include Educational Services (271 | 25.6%), Manufacturing (173 | 16.4%), Professional & Scientific (84 | 8.0%), Health Care & Social Assistance (80 | 7.6%), and Retail Trade (67 | 6.3%).
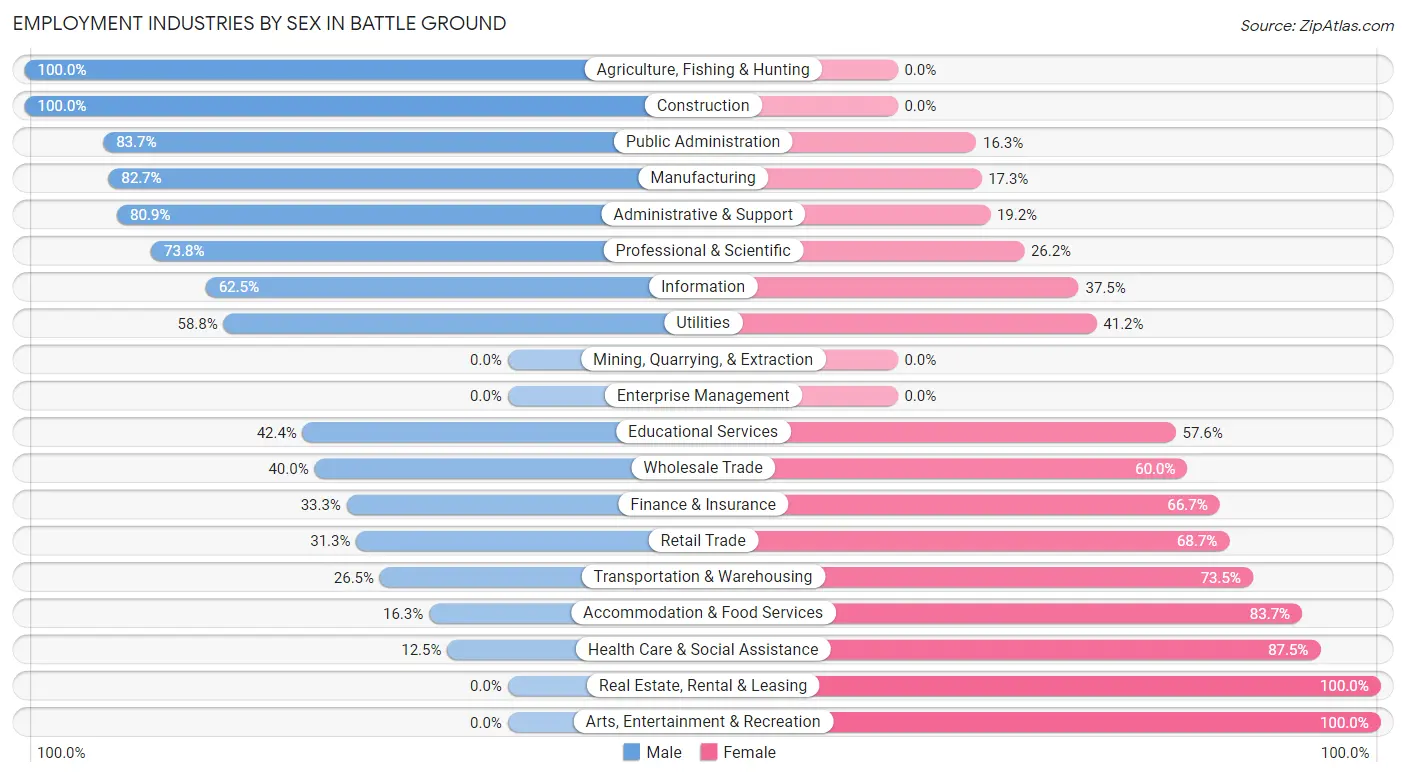
Employment Industries by Sex in Battle Ground
The Battle Ground industries that see more men than women are Agriculture, Fishing & Hunting (100.0%), Construction (100.0%), and Public Administration (83.7%), whereas the industries that tend to have a higher number of women are Real Estate, Rental & Leasing (100.0%), Arts, Entertainment & Recreation (100.0%), and Health Care & Social Assistance (87.5%).
| Industry | Male | Female |
| Agriculture, Fishing & Hunting | 6 (100.0%) | 0 (0.0%) |
| Mining, Quarrying, & Extraction | 0 (0.0%) | 0 (0.0%) |
| Construction | 40 (100.0%) | 0 (0.0%) |
| Manufacturing | 143 (82.7%) | 30 (17.3%) |
| Wholesale Trade | 6 (40.0%) | 9 (60.0%) |
| Retail Trade | 21 (31.3%) | 46 (68.7%) |
| Transportation & Warehousing | 9 (26.5%) | 25 (73.5%) |
| Utilities | 10 (58.8%) | 7 (41.2%) |
| Information | 10 (62.5%) | 6 (37.5%) |
| Finance & Insurance | 6 (33.3%) | 12 (66.7%) |
| Real Estate, Rental & Leasing | 0 (0.0%) | 8 (100.0%) |
| Professional & Scientific | 62 (73.8%) | 22 (26.2%) |
| Enterprise Management | 0 (0.0%) | 0 (0.0%) |
| Administrative & Support | 38 (80.8%) | 9 (19.2%) |
| Educational Services | 115 (42.4%) | 156 (57.6%) |
| Health Care & Social Assistance | 10 (12.5%) | 70 (87.5%) |
| Arts, Entertainment & Recreation | 0 (0.0%) | 10 (100.0%) |
| Accommodation & Food Services | 7 (16.3%) | 36 (83.7%) |
| Public Administration | 36 (83.7%) | 7 (16.3%) |
| Total | 554 (52.4%) | 503 (47.6%) |
Education in Battle Ground
School Enrollment in Battle Ground
The most common levels of schooling among the 534 students in Battle Ground are middle school (128 | 24.0%), high school (100 | 18.7%), and elementary school (92 | 17.2%).
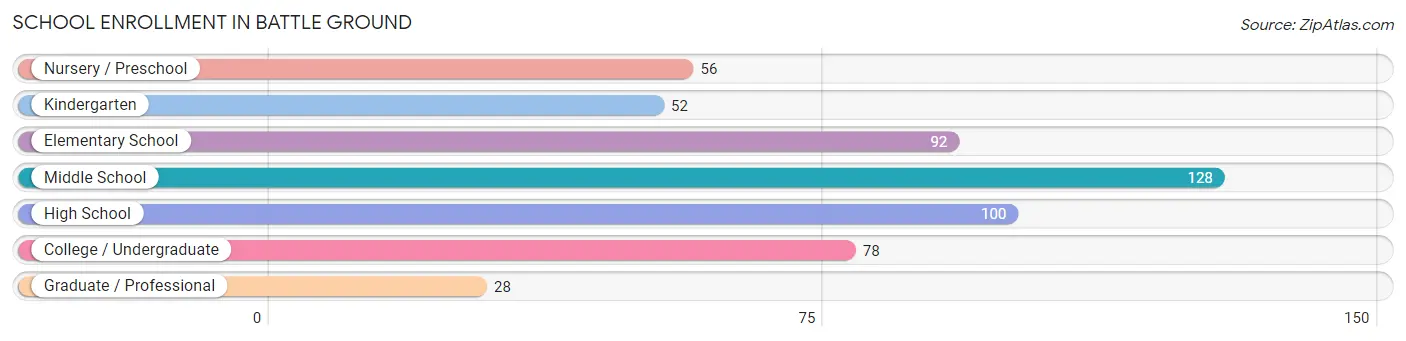
| School Level | # Students | % Students |
| Nursery / Preschool | 56 | 10.5% |
| Kindergarten | 52 | 9.7% |
| Elementary School | 92 | 17.2% |
| Middle School | 128 | 24.0% |
| High School | 100 | 18.7% |
| College / Undergraduate | 78 | 14.6% |
| Graduate / Professional | 28 | 5.2% |
| Total | 534 | 100.0% |
School Enrollment by Age by Funding Source in Battle Ground
Out of a total of 534 students who are enrolled in schools in Battle Ground, 93 (17.4%) attend a private institution, while the remaining 441 (82.6%) are enrolled in public schools. The age group of 3 to 4 year olds has the highest likelihood of being enrolled in private schools, with 29 (78.4% in the age bracket) enrolled. Conversely, the age group of 25 to 34 year olds has the lowest likelihood of being enrolled in a private school, with 21 (100.0% in the age bracket) attending a public institution.
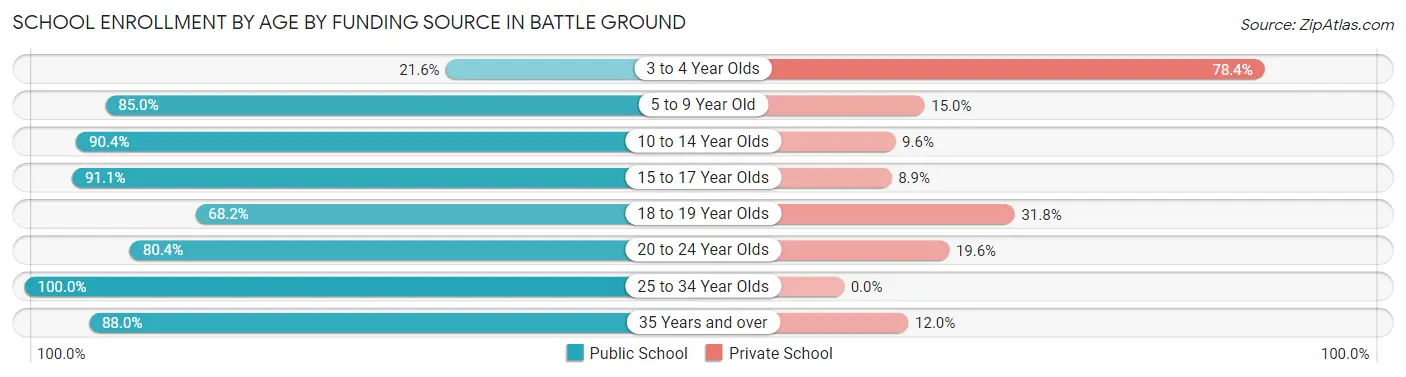
| Age Bracket | Public School | Private School |
| 3 to 4 Year Olds | 8 (21.6%) | 29 (78.4%) |
| 5 to 9 Year Old | 130 (85.0%) | 23 (15.0%) |
| 10 to 14 Year Olds | 132 (90.4%) | 14 (9.6%) |
| 15 to 17 Year Olds | 72 (91.1%) | 7 (8.9%) |
| 18 to 19 Year Olds | 15 (68.2%) | 7 (31.8%) |
| 20 to 24 Year Olds | 41 (80.4%) | 10 (19.6%) |
| 25 to 34 Year Olds | 21 (100.0%) | 0 (0.0%) |
| 35 Years and over | 22 (88.0%) | 3 (12.0%) |
| Total | 441 (82.6%) | 93 (17.4%) |
Educational Attainment by Field of Study in Battle Ground
Education (118 | 16.1%), business (99 | 13.5%), science & technology (83 | 11.4%), computers & mathematics (65 | 8.9%), and bio, nature & agricultural (63 | 8.6%) are the most common fields of study among 731 individuals in Battle Ground who have obtained a bachelor's degree or higher.
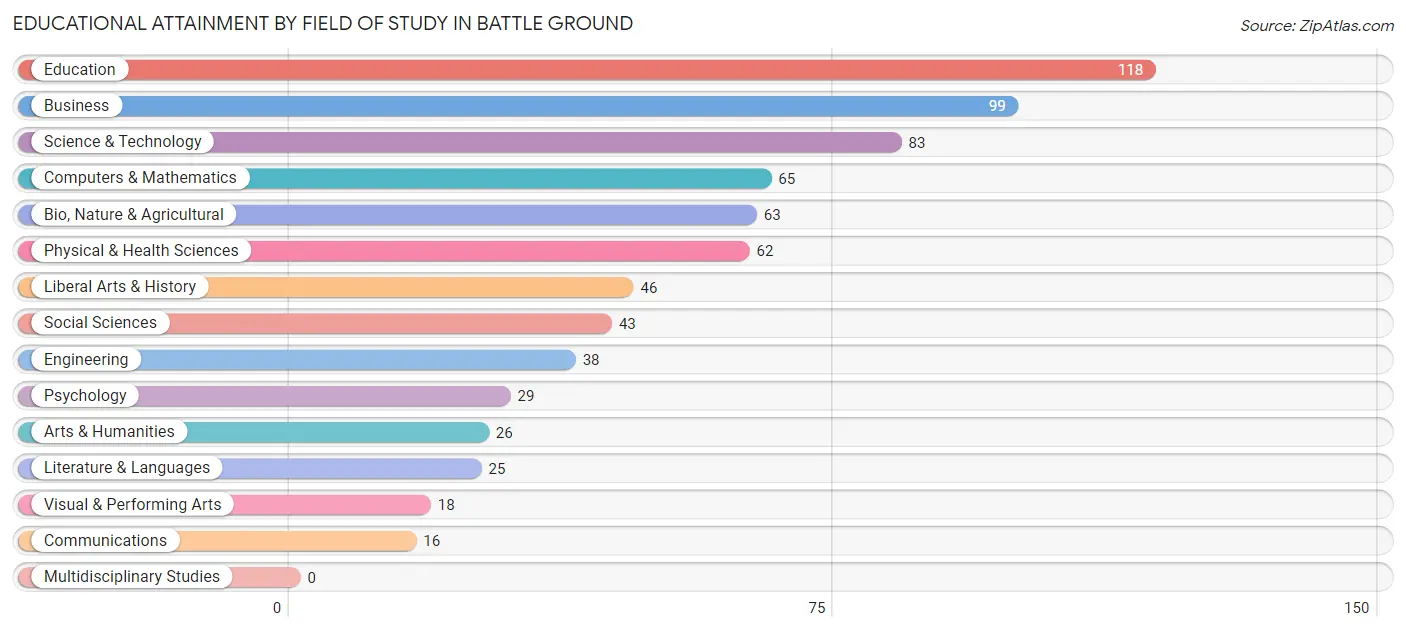
| Field of Study | # Graduates | % Graduates |
| Computers & Mathematics | 65 | 8.9% |
| Bio, Nature & Agricultural | 63 | 8.6% |
| Physical & Health Sciences | 62 | 8.5% |
| Psychology | 29 | 4.0% |
| Social Sciences | 43 | 5.9% |
| Engineering | 38 | 5.2% |
| Multidisciplinary Studies | 0 | 0.0% |
| Science & Technology | 83 | 11.4% |
| Business | 99 | 13.5% |
| Education | 118 | 16.1% |
| Literature & Languages | 25 | 3.4% |
| Liberal Arts & History | 46 | 6.3% |
| Visual & Performing Arts | 18 | 2.5% |
| Communications | 16 | 2.2% |
| Arts & Humanities | 26 | 3.6% |
| Total | 731 | 100.0% |
Transportation & Commute in Battle Ground
Vehicle Availability by Sex in Battle Ground
The most prevalent vehicle ownership categories in Battle Ground are males with 2 vehicles (365, accounting for 65.2%) and females with 2 vehicles (246, making up 73.2%).
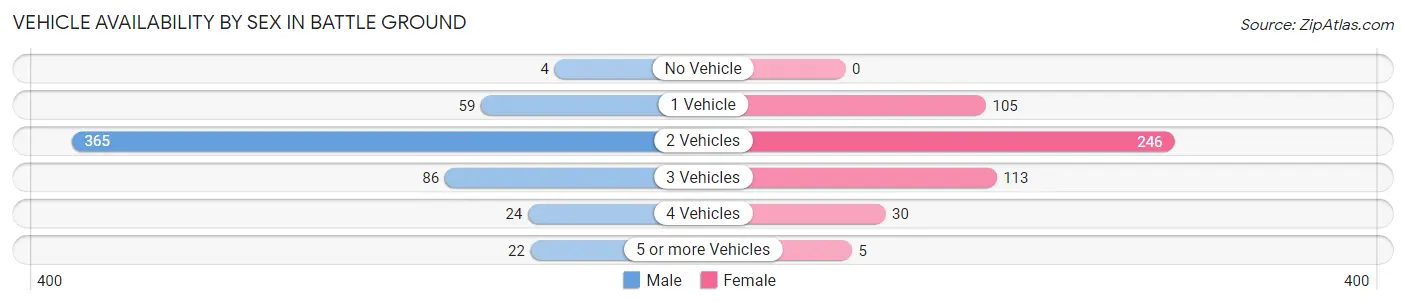
| Vehicles Available | Male | Female |
| No Vehicle | 4 (0.7%) | 0 (0.0%) |
| 1 Vehicle | 59 (10.5%) | 105 (21.0%) |
| 2 Vehicles | 365 (65.2%) | 246 (49.3%) |
| 3 Vehicles | 86 (15.4%) | 113 (22.7%) |
| 4 Vehicles | 24 (4.3%) | 30 (6.0%) |
| 5 or more Vehicles | 22 (3.9%) | 5 (1.0%) |
| Total | 560 (100.0%) | 499 (100.0%) |
Commute Time in Battle Ground
The most frequently occuring commute durations in Battle Ground are 15 to 19 minutes (372 commuters, 39.2%), 20 to 24 minutes (194 commuters, 20.4%), and 10 to 14 minutes (140 commuters, 14.7%).
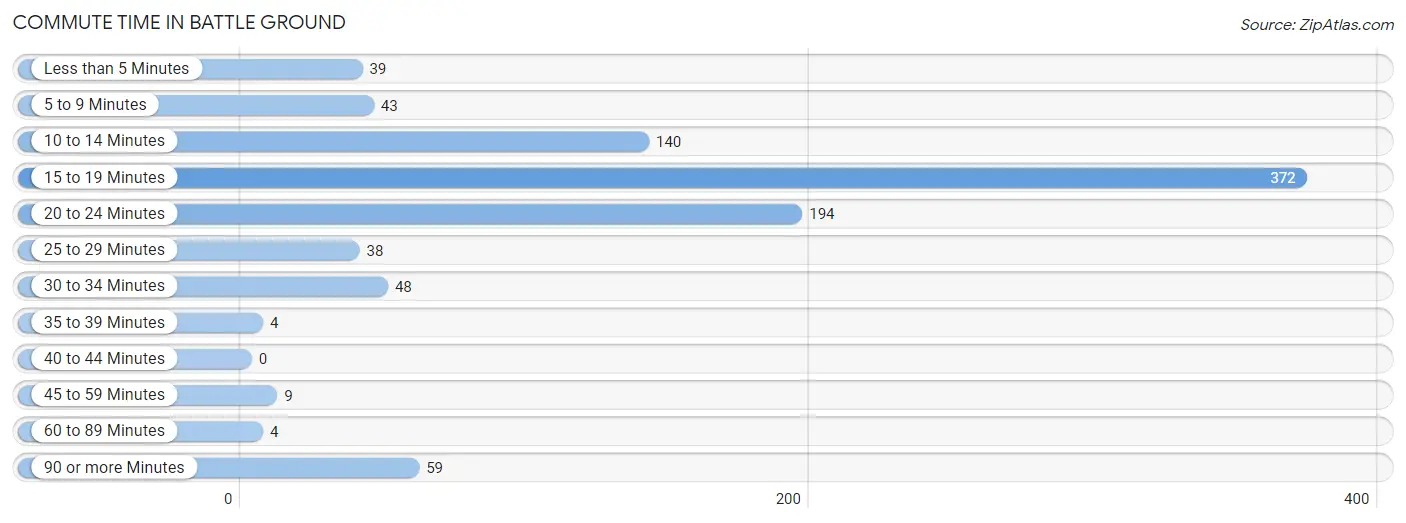
| Commute Time | # Commuters | % Commuters |
| Less than 5 Minutes | 39 | 4.1% |
| 5 to 9 Minutes | 43 | 4.5% |
| 10 to 14 Minutes | 140 | 14.7% |
| 15 to 19 Minutes | 372 | 39.2% |
| 20 to 24 Minutes | 194 | 20.4% |
| 25 to 29 Minutes | 38 | 4.0% |
| 30 to 34 Minutes | 48 | 5.1% |
| 35 to 39 Minutes | 4 | 0.4% |
| 40 to 44 Minutes | 0 | 0.0% |
| 45 to 59 Minutes | 9 | 0.9% |
| 60 to 89 Minutes | 4 | 0.4% |
| 90 or more Minutes | 59 | 6.2% |
Commute Time by Sex in Battle Ground
The most common commute times in Battle Ground are 15 to 19 minutes (218 commuters, 41.6%) for males and 15 to 19 minutes (154 commuters, 36.1%) for females.
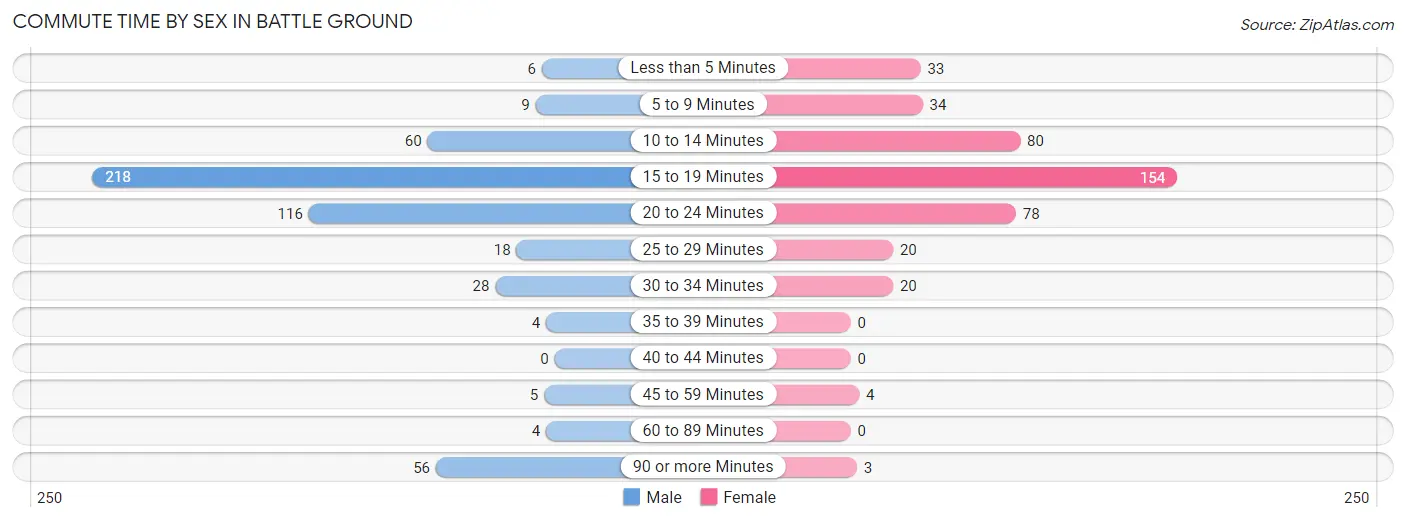
| Commute Time | Male | Female |
| Less than 5 Minutes | 6 (1.1%) | 33 (7.7%) |
| 5 to 9 Minutes | 9 (1.7%) | 34 (8.0%) |
| 10 to 14 Minutes | 60 (11.5%) | 80 (18.8%) |
| 15 to 19 Minutes | 218 (41.6%) | 154 (36.1%) |
| 20 to 24 Minutes | 116 (22.1%) | 78 (18.3%) |
| 25 to 29 Minutes | 18 (3.4%) | 20 (4.7%) |
| 30 to 34 Minutes | 28 (5.3%) | 20 (4.7%) |
| 35 to 39 Minutes | 4 (0.8%) | 0 (0.0%) |
| 40 to 44 Minutes | 0 (0.0%) | 0 (0.0%) |
| 45 to 59 Minutes | 5 (0.9%) | 4 (0.9%) |
| 60 to 89 Minutes | 4 (0.8%) | 0 (0.0%) |
| 90 or more Minutes | 56 (10.7%) | 3 (0.7%) |
Time of Departure to Work by Sex in Battle Ground
The most frequent times of departure to work in Battle Ground are 7:30 AM to 7:59 AM (89, 17.0%) for males and 7:30 AM to 7:59 AM (96, 22.5%) for females.
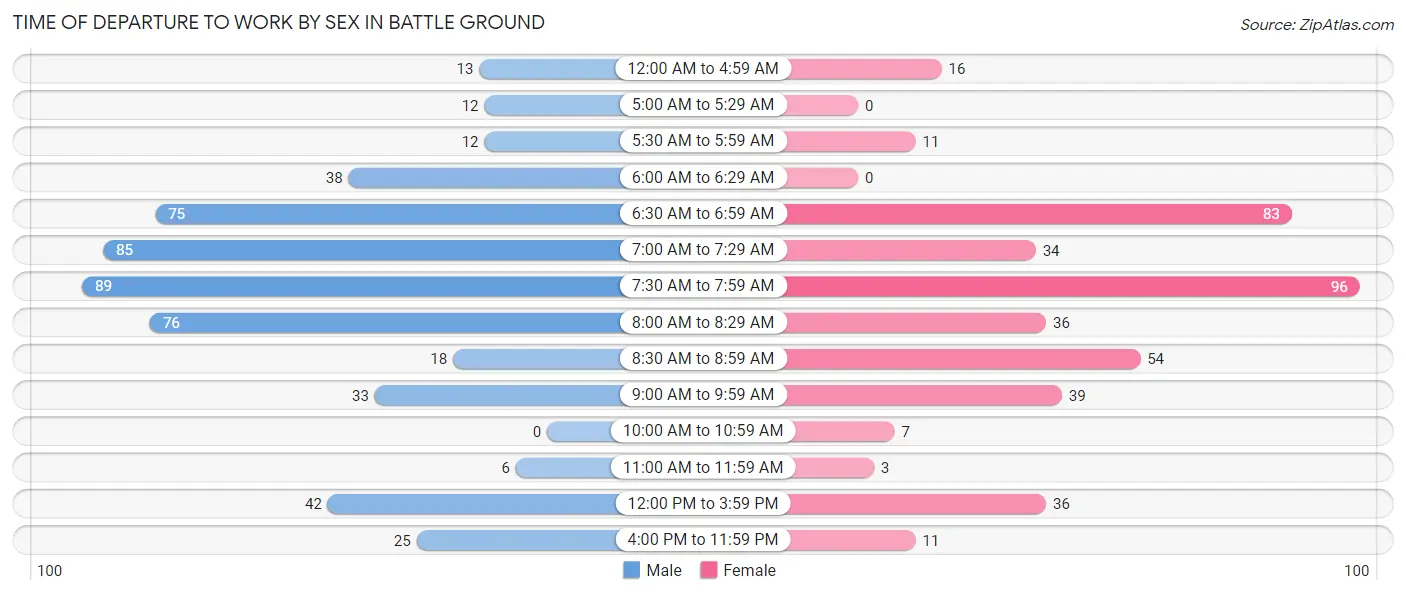
| Time of Departure | Male | Female |
| 12:00 AM to 4:59 AM | 13 (2.5%) | 16 (3.8%) |
| 5:00 AM to 5:29 AM | 12 (2.3%) | 0 (0.0%) |
| 5:30 AM to 5:59 AM | 12 (2.3%) | 11 (2.6%) |
| 6:00 AM to 6:29 AM | 38 (7.2%) | 0 (0.0%) |
| 6:30 AM to 6:59 AM | 75 (14.3%) | 83 (19.5%) |
| 7:00 AM to 7:29 AM | 85 (16.2%) | 34 (8.0%) |
| 7:30 AM to 7:59 AM | 89 (17.0%) | 96 (22.5%) |
| 8:00 AM to 8:29 AM | 76 (14.5%) | 36 (8.5%) |
| 8:30 AM to 8:59 AM | 18 (3.4%) | 54 (12.7%) |
| 9:00 AM to 9:59 AM | 33 (6.3%) | 39 (9.1%) |
| 10:00 AM to 10:59 AM | 0 (0.0%) | 7 (1.6%) |
| 11:00 AM to 11:59 AM | 6 (1.1%) | 3 (0.7%) |
| 12:00 PM to 3:59 PM | 42 (8.0%) | 36 (8.5%) |
| 4:00 PM to 11:59 PM | 25 (4.8%) | 11 (2.6%) |
| Total | 524 (100.0%) | 426 (100.0%) |
Housing Occupancy in Battle Ground
Occupancy by Ownership in Battle Ground
Of the total 769 dwellings in Battle Ground, owner-occupied units account for 667 (86.7%), while renter-occupied units make up 102 (13.3%).
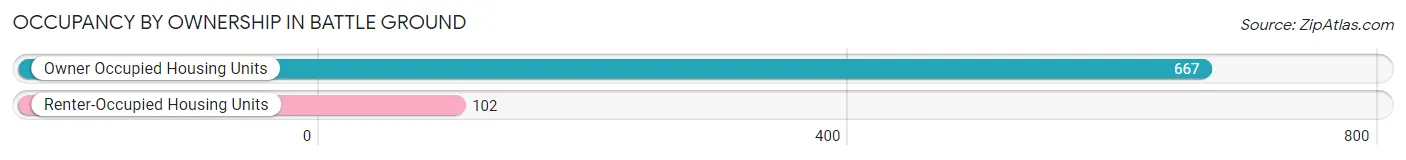
| Occupancy | # Housing Units | % Housing Units |
| Owner Occupied Housing Units | 667 | 86.7% |
| Renter-Occupied Housing Units | 102 | 13.3% |
| Total Occupied Housing Units | 769 | 100.0% |
Occupancy by Household Size in Battle Ground
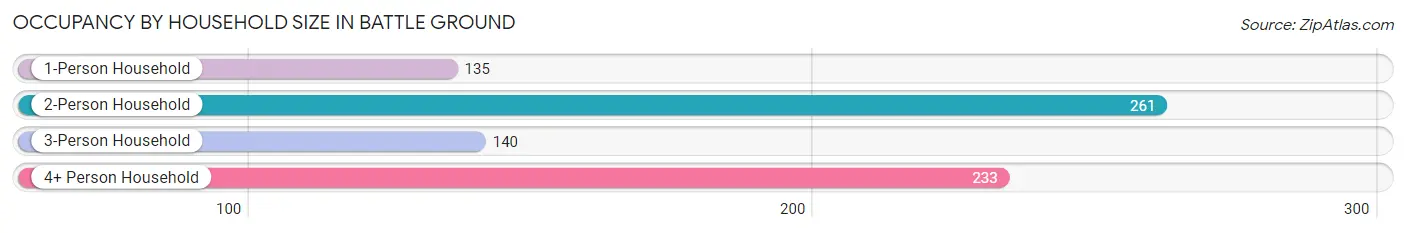
| Household Size | # Housing Units | % Housing Units |
| 1-Person Household | 135 | 17.6% |
| 2-Person Household | 261 | 33.9% |
| 3-Person Household | 140 | 18.2% |
| 4+ Person Household | 233 | 30.3% |
| Total Housing Units | 769 | 100.0% |
Occupancy by Ownership by Household Size in Battle Ground
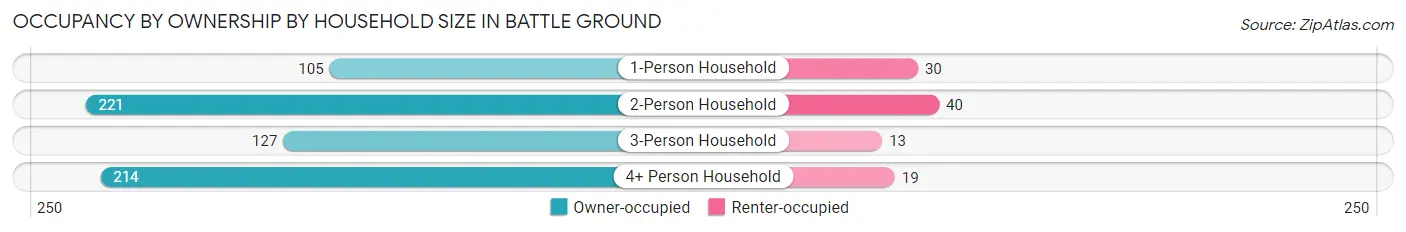
| Household Size | Owner-occupied | Renter-occupied |
| 1-Person Household | 105 (77.8%) | 30 (22.2%) |
| 2-Person Household | 221 (84.7%) | 40 (15.3%) |
| 3-Person Household | 127 (90.7%) | 13 (9.3%) |
| 4+ Person Household | 214 (91.8%) | 19 (8.2%) |
| Total Housing Units | 667 (86.7%) | 102 (13.3%) |
Occupancy by Educational Attainment in Battle Ground
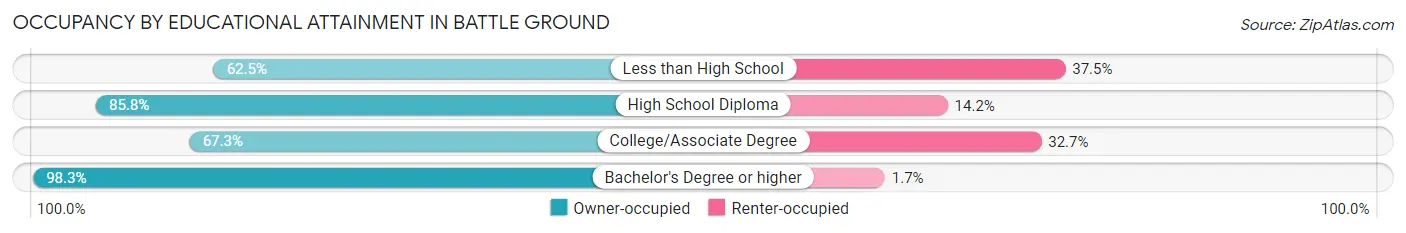
| Household Size | Owner-occupied | Renter-occupied |
| Less than High School | 5 (62.5%) | 3 (37.5%) |
| High School Diploma | 109 (85.8%) | 18 (14.2%) |
| College/Associate Degree | 152 (67.3%) | 74 (32.7%) |
| Bachelor's Degree or higher | 401 (98.3%) | 7 (1.7%) |
Occupancy by Age of Householder in Battle Ground
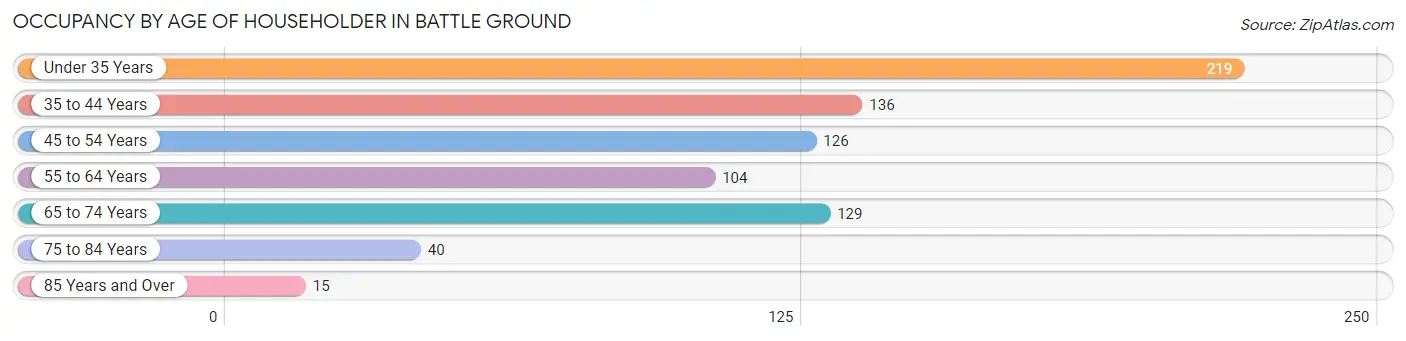
| Age Bracket | # Households | % Households |
| Under 35 Years | 219 | 28.5% |
| 35 to 44 Years | 136 | 17.7% |
| 45 to 54 Years | 126 | 16.4% |
| 55 to 64 Years | 104 | 13.5% |
| 65 to 74 Years | 129 | 16.8% |
| 75 to 84 Years | 40 | 5.2% |
| 85 Years and Over | 15 | 1.9% |
| Total | 769 | 100.0% |
Housing Finances in Battle Ground
Median Income by Occupancy in Battle Ground
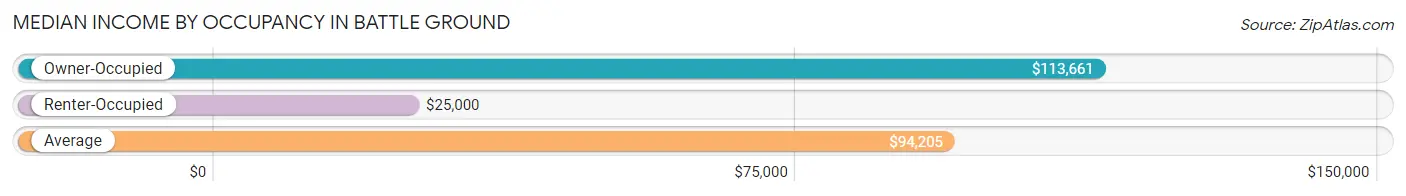
| Occupancy Type | # Households | Median Income |
| Owner-Occupied | 667 (86.7%) | $113,661 |
| Renter-Occupied | 102 (13.3%) | $25,000 |
| Average | 769 (100.0%) | $94,205 |
Occupancy by Householder Income Bracket in Battle Ground
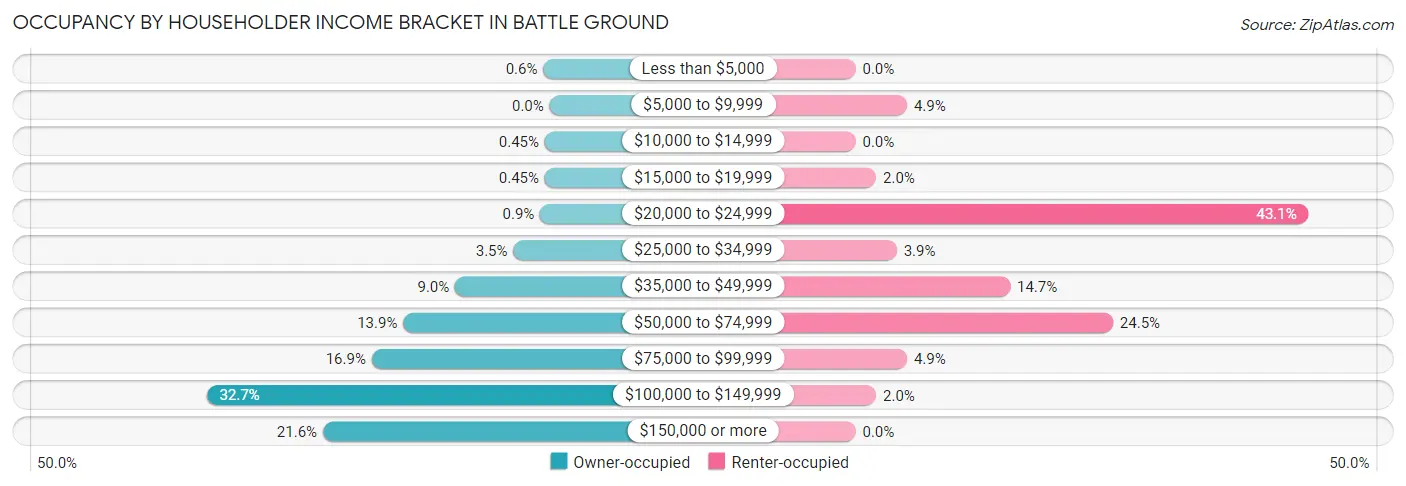
| Income Bracket | Owner-occupied | Renter-occupied |
| Less than $5,000 | 4 (0.6%) | 0 (0.0%) |
| $5,000 to $9,999 | 0 (0.0%) | 5 (4.9%) |
| $10,000 to $14,999 | 3 (0.4%) | 0 (0.0%) |
| $15,000 to $19,999 | 3 (0.4%) | 2 (2.0%) |
| $20,000 to $24,999 | 6 (0.9%) | 44 (43.1%) |
| $25,000 to $34,999 | 23 (3.5%) | 4 (3.9%) |
| $35,000 to $49,999 | 60 (9.0%) | 15 (14.7%) |
| $50,000 to $74,999 | 93 (13.9%) | 25 (24.5%) |
| $75,000 to $99,999 | 113 (16.9%) | 5 (4.9%) |
| $100,000 to $149,999 | 218 (32.7%) | 2 (2.0%) |
| $150,000 or more | 144 (21.6%) | 0 (0.0%) |
| Total | 667 (100.0%) | 102 (100.0%) |
Monthly Housing Cost Tiers in Battle Ground
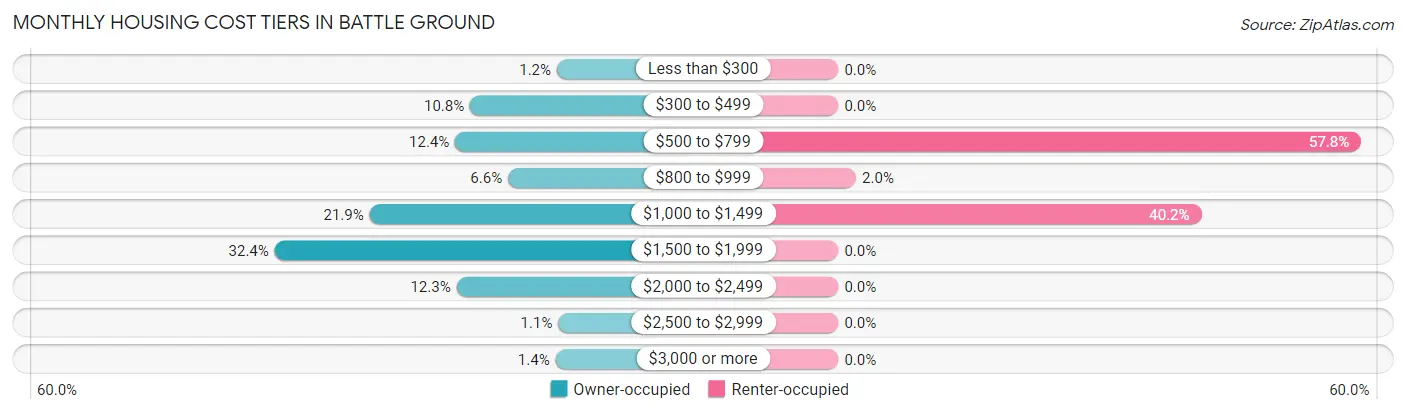
| Monthly Cost | Owner-occupied | Renter-occupied |
| Less than $300 | 8 (1.2%) | 0 (0.0%) |
| $300 to $499 | 72 (10.8%) | 0 (0.0%) |
| $500 to $799 | 83 (12.4%) | 59 (57.8%) |
| $800 to $999 | 44 (6.6%) | 2 (2.0%) |
| $1,000 to $1,499 | 146 (21.9%) | 41 (40.2%) |
| $1,500 to $1,999 | 216 (32.4%) | 0 (0.0%) |
| $2,000 to $2,499 | 82 (12.3%) | 0 (0.0%) |
| $2,500 to $2,999 | 7 (1.1%) | 0 (0.0%) |
| $3,000 or more | 9 (1.3%) | 0 (0.0%) |
| Total | 667 (100.0%) | 102 (100.0%) |
Physical Housing Characteristics in Battle Ground
Housing Structures in Battle Ground
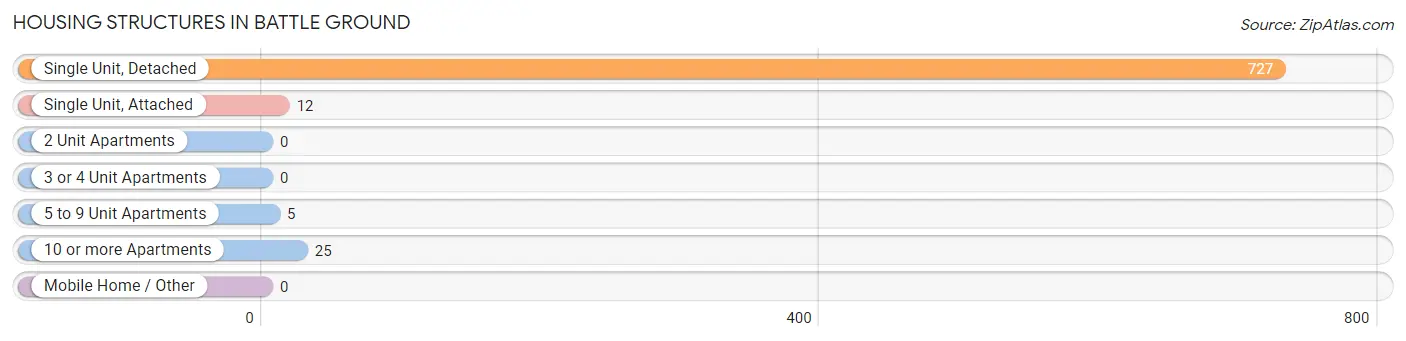
| Structure Type | # Housing Units | % Housing Units |
| Single Unit, Detached | 727 | 94.5% |
| Single Unit, Attached | 12 | 1.6% |
| 2 Unit Apartments | 0 | 0.0% |
| 3 or 4 Unit Apartments | 0 | 0.0% |
| 5 to 9 Unit Apartments | 5 | 0.6% |
| 10 or more Apartments | 25 | 3.3% |
| Mobile Home / Other | 0 | 0.0% |
| Total | 769 | 100.0% |
Housing Structures by Occupancy in Battle Ground
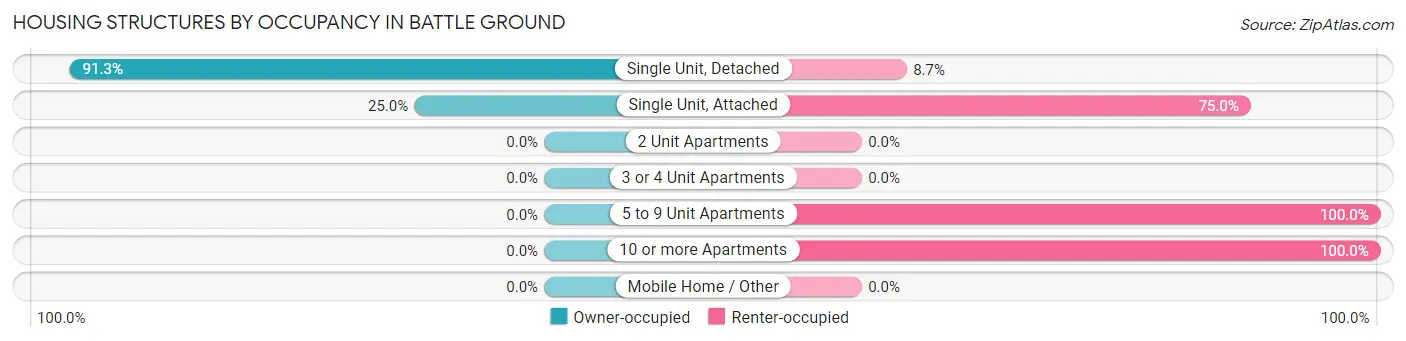
| Structure Type | Owner-occupied | Renter-occupied |
| Single Unit, Detached | 664 (91.3%) | 63 (8.7%) |
| Single Unit, Attached | 3 (25.0%) | 9 (75.0%) |
| 2 Unit Apartments | 0 (0.0%) | 0 (0.0%) |
| 3 or 4 Unit Apartments | 0 (0.0%) | 0 (0.0%) |
| 5 to 9 Unit Apartments | 0 (0.0%) | 5 (100.0%) |
| 10 or more Apartments | 0 (0.0%) | 25 (100.0%) |
| Mobile Home / Other | 0 (0.0%) | 0 (0.0%) |
| Total | 667 (86.7%) | 102 (13.3%) |
Housing Structures by Number of Rooms in Battle Ground
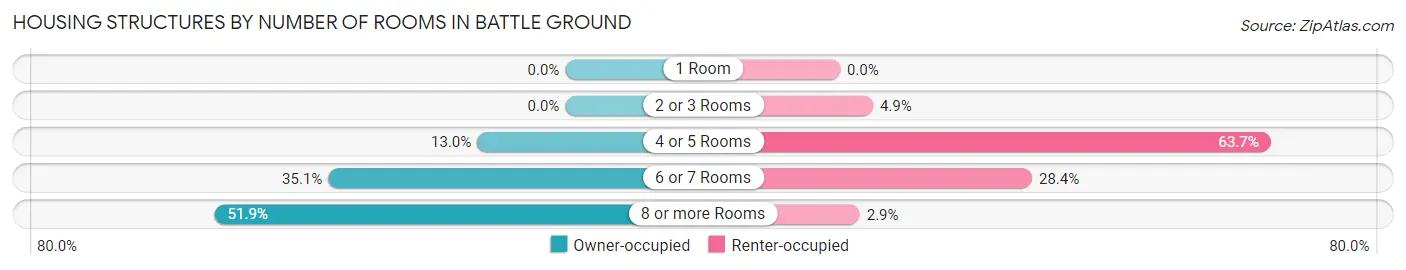
| Number of Rooms | Owner-occupied | Renter-occupied |
| 1 Room | 0 (0.0%) | 0 (0.0%) |
| 2 or 3 Rooms | 0 (0.0%) | 5 (4.9%) |
| 4 or 5 Rooms | 87 (13.0%) | 65 (63.7%) |
| 6 or 7 Rooms | 234 (35.1%) | 29 (28.4%) |
| 8 or more Rooms | 346 (51.9%) | 3 (2.9%) |
| Total | 667 (100.0%) | 102 (100.0%) |
Housing Structure by Heating Type in Battle Ground
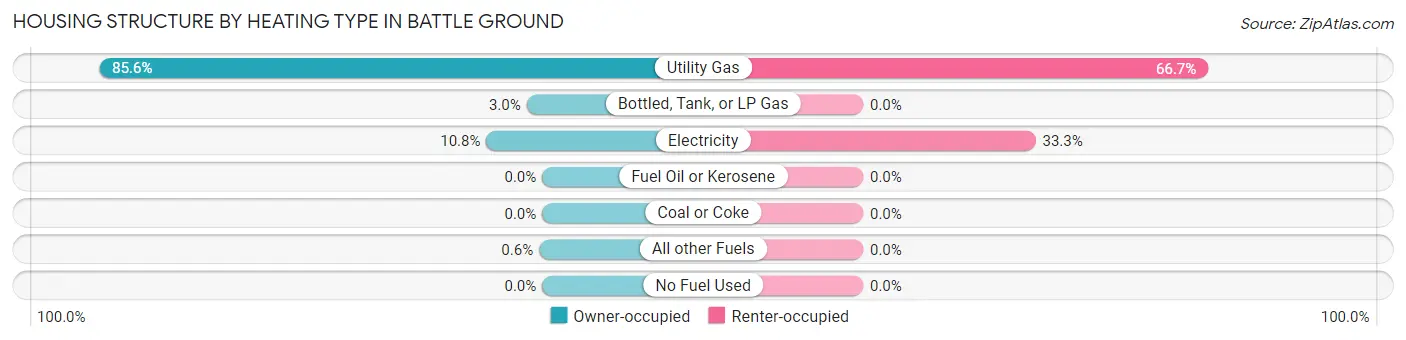
| Heating Type | Owner-occupied | Renter-occupied |
| Utility Gas | 571 (85.6%) | 68 (66.7%) |
| Bottled, Tank, or LP Gas | 20 (3.0%) | 0 (0.0%) |
| Electricity | 72 (10.8%) | 34 (33.3%) |
| Fuel Oil or Kerosene | 0 (0.0%) | 0 (0.0%) |
| Coal or Coke | 0 (0.0%) | 0 (0.0%) |
| All other Fuels | 4 (0.6%) | 0 (0.0%) |
| No Fuel Used | 0 (0.0%) | 0 (0.0%) |
| Total | 667 (100.0%) | 102 (100.0%) |
Household Vehicle Usage in Battle Ground
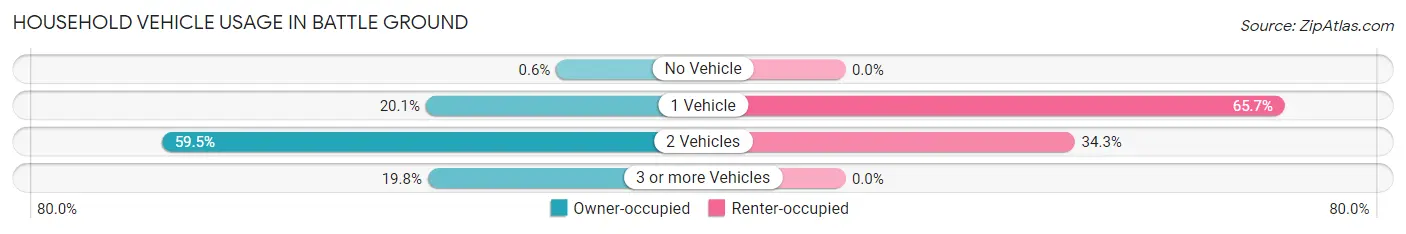
| Vehicles per Household | Owner-occupied | Renter-occupied |
| No Vehicle | 4 (0.6%) | 0 (0.0%) |
| 1 Vehicle | 134 (20.1%) | 67 (65.7%) |
| 2 Vehicles | 397 (59.5%) | 35 (34.3%) |
| 3 or more Vehicles | 132 (19.8%) | 0 (0.0%) |
| Total | 667 (100.0%) | 102 (100.0%) |
Real Estate & Mortgages in Battle Ground
Real Estate and Mortgage Overview in Battle Ground
| Characteristic | Without Mortgage | With Mortgage |
| Housing Units | 144 | 523 |
| Median Property Value | $226,200 | $259,100 |
| Median Household Income | $82,045 | $136 |
| Monthly Housing Costs | $480 | $9 |
| Real Estate Taxes | $1,476 | $10 |
Property Value by Mortgage Status in Battle Ground
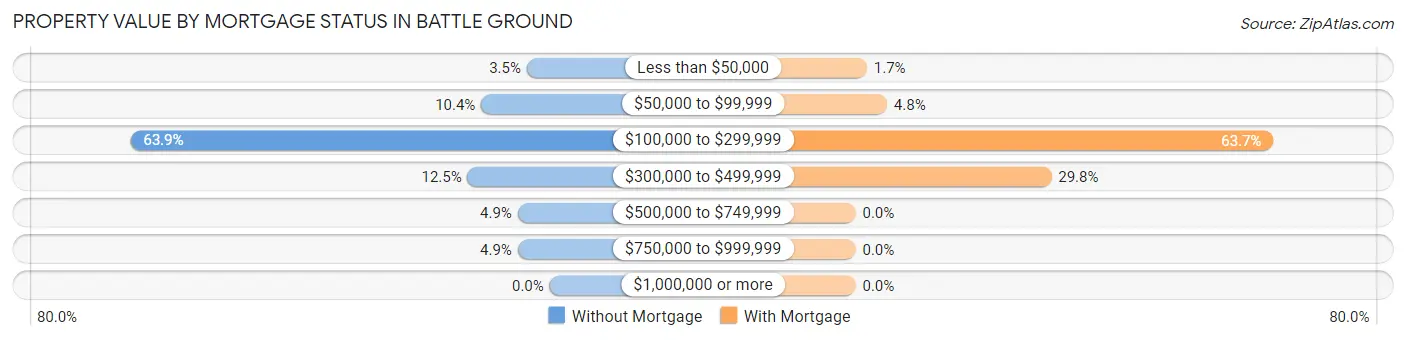
| Property Value | Without Mortgage | With Mortgage |
| Less than $50,000 | 5 (3.5%) | 9 (1.7%) |
| $50,000 to $99,999 | 15 (10.4%) | 25 (4.8%) |
| $100,000 to $299,999 | 92 (63.9%) | 333 (63.7%) |
| $300,000 to $499,999 | 18 (12.5%) | 156 (29.8%) |
| $500,000 to $749,999 | 7 (4.9%) | 0 (0.0%) |
| $750,000 to $999,999 | 7 (4.9%) | 0 (0.0%) |
| $1,000,000 or more | 0 (0.0%) | 0 (0.0%) |
| Total | 144 (100.0%) | 523 (100.0%) |
Household Income by Mortgage Status in Battle Ground
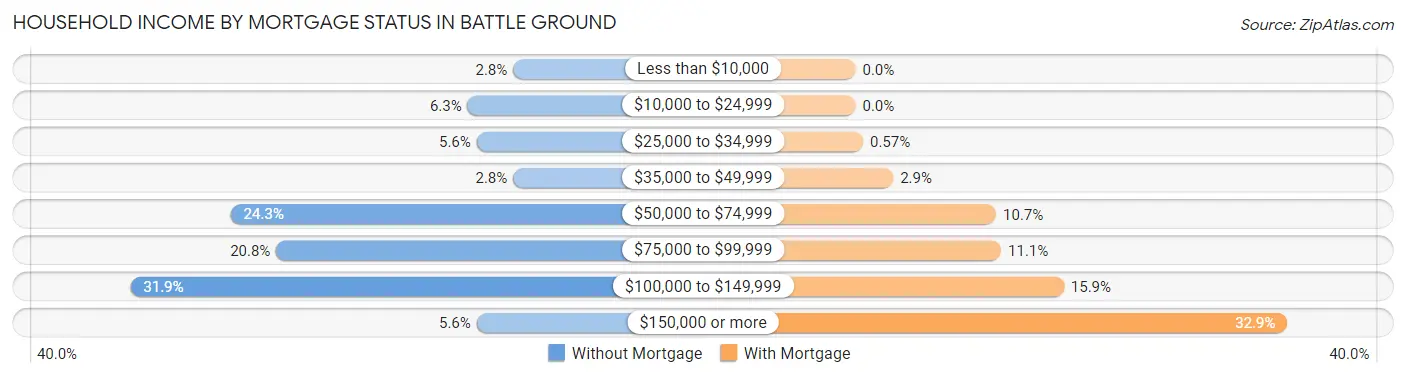
| Household Income | Without Mortgage | With Mortgage |
| Less than $10,000 | 4 (2.8%) | 0 (0.0%) |
| $10,000 to $24,999 | 9 (6.2%) | 0 (0.0%) |
| $25,000 to $34,999 | 8 (5.6%) | 3 (0.6%) |
| $35,000 to $49,999 | 4 (2.8%) | 15 (2.9%) |
| $50,000 to $74,999 | 35 (24.3%) | 56 (10.7%) |
| $75,000 to $99,999 | 30 (20.8%) | 58 (11.1%) |
| $100,000 to $149,999 | 46 (31.9%) | 83 (15.9%) |
| $150,000 or more | 8 (5.6%) | 172 (32.9%) |
| Total | 144 (100.0%) | 523 (100.0%) |
Property Value to Household Income Ratio in Battle Ground
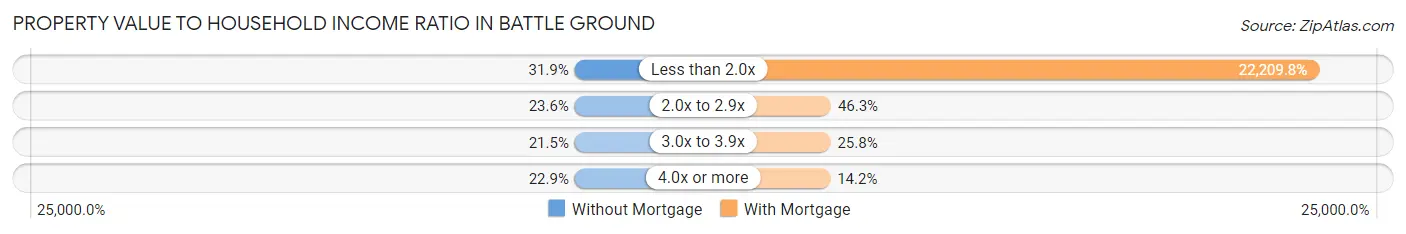
| Value-to-Income Ratio | Without Mortgage | With Mortgage |
| Less than 2.0x | 46 (31.9%) | 116,157 (22,209.7%) |
| 2.0x to 2.9x | 34 (23.6%) | 242 (46.3%) |
| 3.0x to 3.9x | 31 (21.5%) | 135 (25.8%) |
| 4.0x or more | 33 (22.9%) | 74 (14.1%) |
| Total | 144 (100.0%) | 523 (100.0%) |
Real Estate Taxes by Mortgage Status in Battle Ground
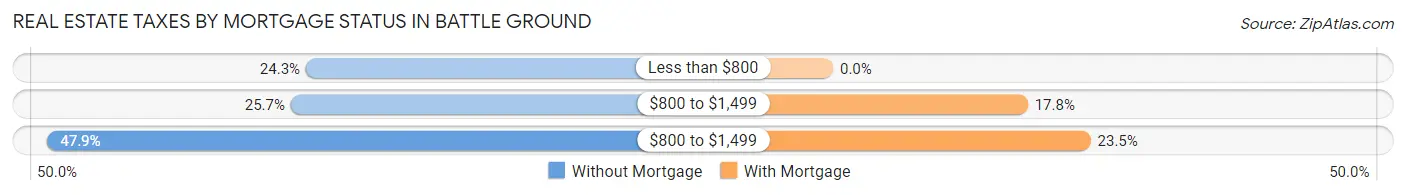
| Property Taxes | Without Mortgage | With Mortgage |
| Less than $800 | 35 (24.3%) | 0 (0.0%) |
| $800 to $1,499 | 37 (25.7%) | 93 (17.8%) |
| $800 to $1,499 | 69 (47.9%) | 123 (23.5%) |
| Total | 144 (100.0%) | 523 (100.0%) |
Health & Disability in Battle Ground
Health Insurance Coverage by Age in Battle Ground
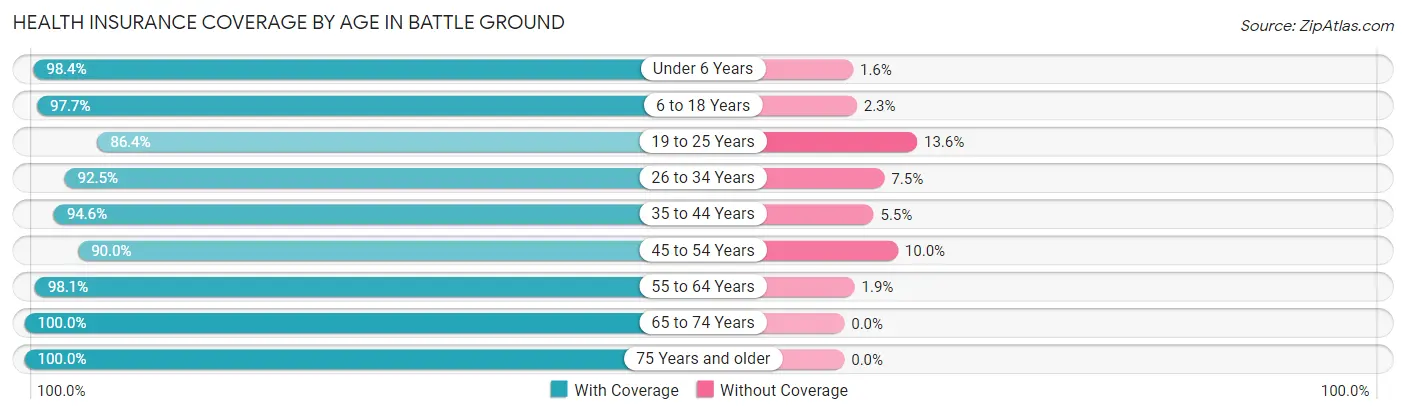
| Age Bracket | With Coverage | Without Coverage |
| Under 6 Years | 241 (98.4%) | 4 (1.6%) |
| 6 to 18 Years | 378 (97.7%) | 9 (2.3%) |
| 19 to 25 Years | 153 (86.4%) | 24 (13.6%) |
| 26 to 34 Years | 297 (92.5%) | 24 (7.5%) |
| 35 to 44 Years | 243 (94.6%) | 14 (5.4%) |
| 45 to 54 Years | 198 (90.0%) | 22 (10.0%) |
| 55 to 64 Years | 153 (98.1%) | 3 (1.9%) |
| 65 to 74 Years | 202 (100.0%) | 0 (0.0%) |
| 75 Years and older | 95 (100.0%) | 0 (0.0%) |
| Total | 1,960 (95.2%) | 100 (4.9%) |
Health Insurance Coverage by Citizenship Status in Battle Ground
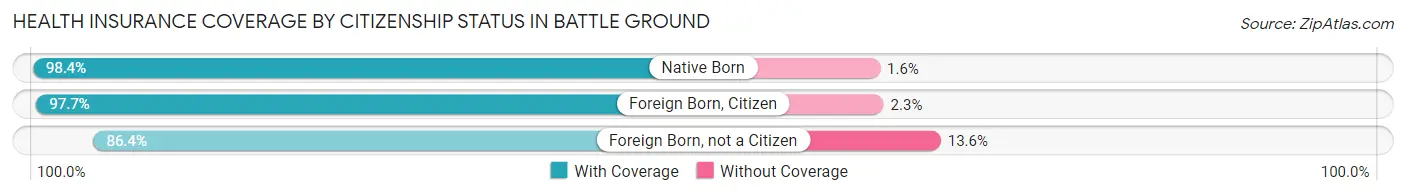
| Citizenship Status | With Coverage | Without Coverage |
| Native Born | 241 (98.4%) | 4 (1.6%) |
| Foreign Born, Citizen | 378 (97.7%) | 9 (2.3%) |
| Foreign Born, not a Citizen | 153 (86.4%) | 24 (13.6%) |
Health Insurance Coverage by Household Income in Battle Ground
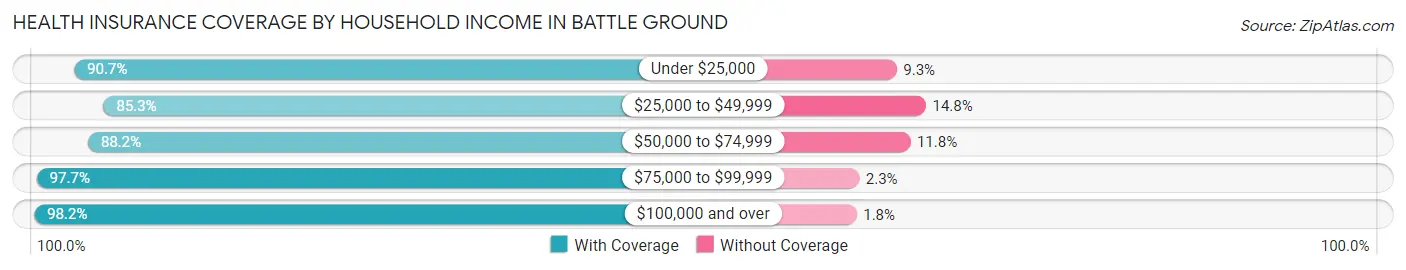
| Household Income | With Coverage | Without Coverage |
| Under $25,000 | 88 (90.7%) | 9 (9.3%) |
| $25,000 to $49,999 | 156 (85.3%) | 27 (14.7%) |
| $50,000 to $74,999 | 268 (88.2%) | 36 (11.8%) |
| $75,000 to $99,999 | 346 (97.7%) | 8 (2.3%) |
| $100,000 and over | 1,102 (98.2%) | 20 (1.8%) |
Public vs Private Health Insurance Coverage by Age in Battle Ground
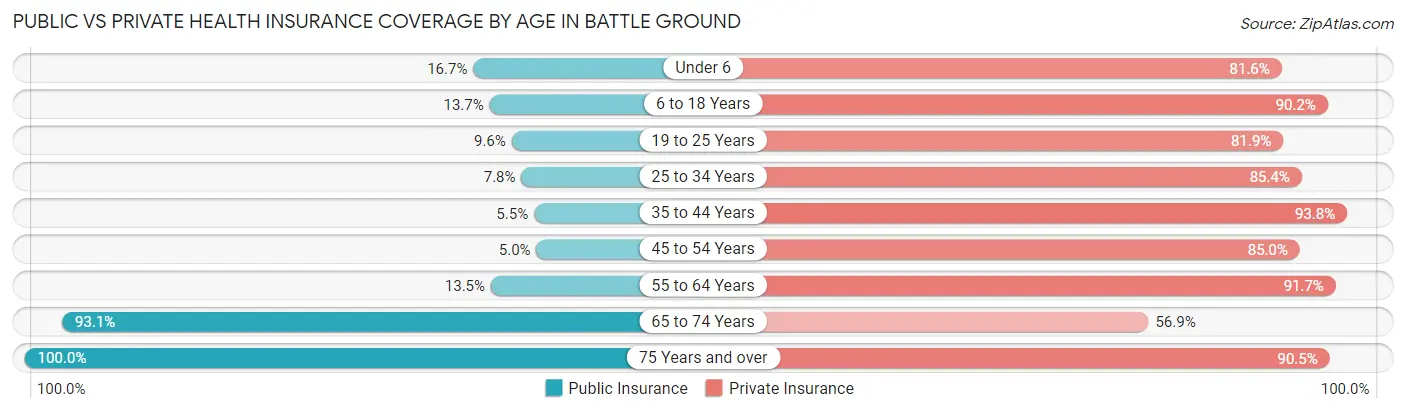
| Age Bracket | Public Insurance | Private Insurance |
| Under 6 | 41 (16.7%) | 200 (81.6%) |
| 6 to 18 Years | 53 (13.7%) | 349 (90.2%) |
| 19 to 25 Years | 17 (9.6%) | 145 (81.9%) |
| 25 to 34 Years | 25 (7.8%) | 274 (85.4%) |
| 35 to 44 Years | 14 (5.4%) | 241 (93.8%) |
| 45 to 54 Years | 11 (5.0%) | 187 (85.0%) |
| 55 to 64 Years | 21 (13.5%) | 143 (91.7%) |
| 65 to 74 Years | 188 (93.1%) | 115 (56.9%) |
| 75 Years and over | 95 (100.0%) | 86 (90.5%) |
| Total | 465 (22.6%) | 1,740 (84.5%) |
Disability Status by Sex by Age in Battle Ground
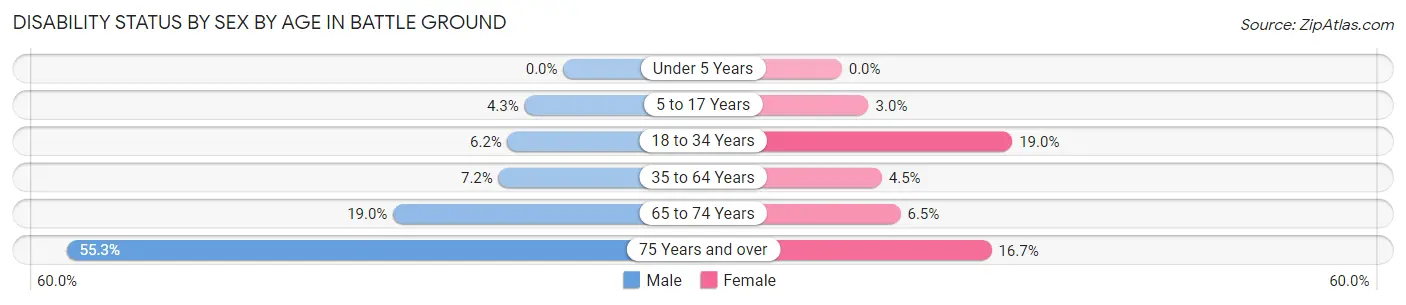
| Age Bracket | Male | Female |
| Under 5 Years | 0 (0.0%) | 0 (0.0%) |
| 5 to 17 Years | 8 (4.3%) | 7 (3.0%) |
| 18 to 34 Years | 15 (6.2%) | 52 (19.0%) |
| 35 to 64 Years | 23 (7.2%) | 14 (4.5%) |
| 65 to 74 Years | 18 (19.0%) | 7 (6.5%) |
| 75 Years and over | 26 (55.3%) | 8 (16.7%) |
Disability Class by Sex by Age in Battle Ground
Disability Class: Hearing Difficulty
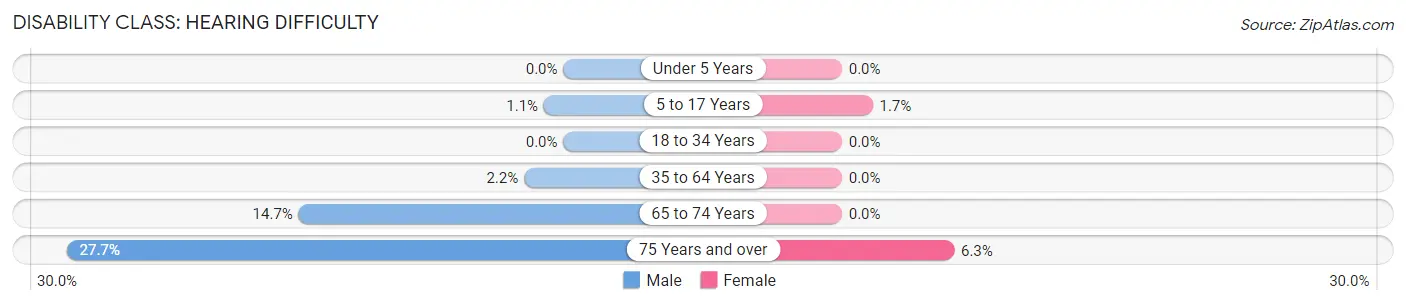
| Age Bracket | Male | Female |
| Under 5 Years | 0 (0.0%) | 0 (0.0%) |
| 5 to 17 Years | 2 (1.1%) | 4 (1.7%) |
| 18 to 34 Years | 0 (0.0%) | 0 (0.0%) |
| 35 to 64 Years | 7 (2.2%) | 0 (0.0%) |
| 65 to 74 Years | 14 (14.7%) | 0 (0.0%) |
| 75 Years and over | 13 (27.7%) | 3 (6.2%) |
Disability Class: Vision Difficulty
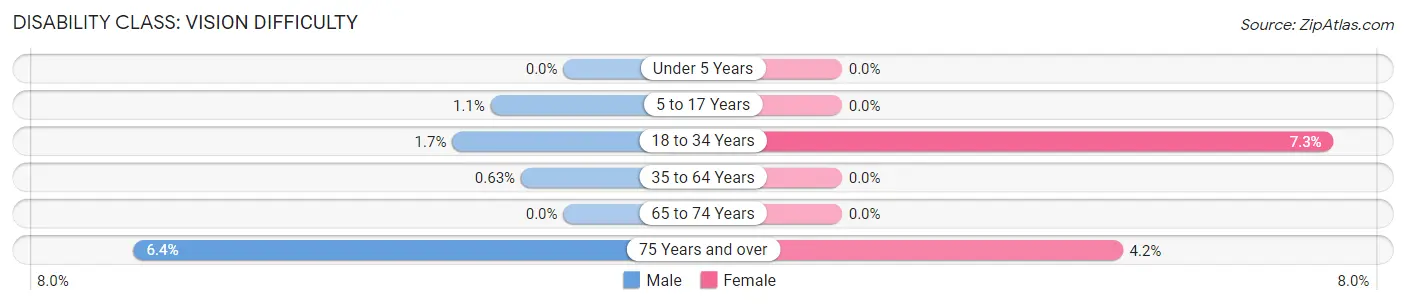
| Age Bracket | Male | Female |
| Under 5 Years | 0 (0.0%) | 0 (0.0%) |
| 5 to 17 Years | 2 (1.1%) | 0 (0.0%) |
| 18 to 34 Years | 4 (1.7%) | 20 (7.3%) |
| 35 to 64 Years | 2 (0.6%) | 0 (0.0%) |
| 65 to 74 Years | 0 (0.0%) | 0 (0.0%) |
| 75 Years and over | 3 (6.4%) | 2 (4.2%) |
Disability Class: Cognitive Difficulty
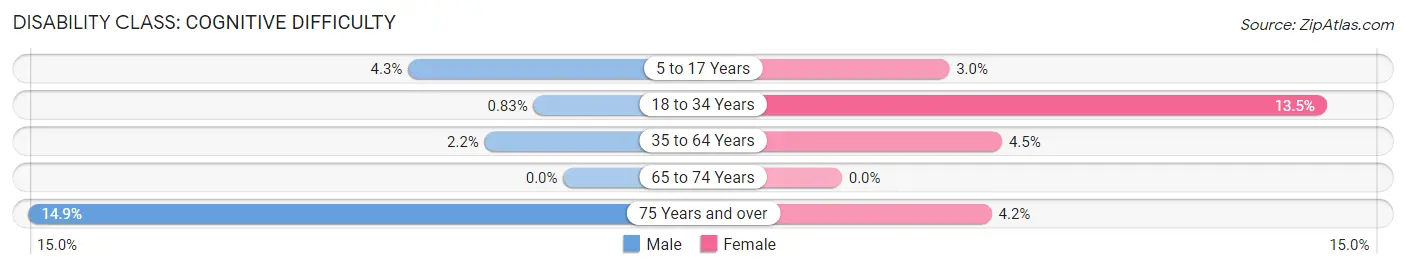
| Age Bracket | Male | Female |
| 5 to 17 Years | 8 (4.3%) | 7 (3.0%) |
| 18 to 34 Years | 2 (0.8%) | 37 (13.5%) |
| 35 to 64 Years | 7 (2.2%) | 14 (4.5%) |
| 65 to 74 Years | 0 (0.0%) | 0 (0.0%) |
| 75 Years and over | 7 (14.9%) | 2 (4.2%) |
Disability Class: Ambulatory Difficulty
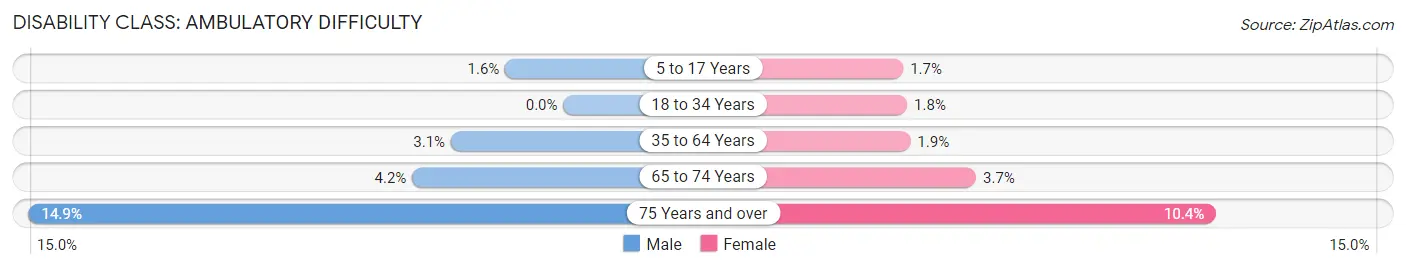
| Age Bracket | Male | Female |
| 5 to 17 Years | 3 (1.6%) | 4 (1.7%) |
| 18 to 34 Years | 0 (0.0%) | 5 (1.8%) |
| 35 to 64 Years | 10 (3.1%) | 6 (1.9%) |
| 65 to 74 Years | 4 (4.2%) | 4 (3.7%) |
| 75 Years and over | 7 (14.9%) | 5 (10.4%) |
Disability Class: Self-Care Difficulty
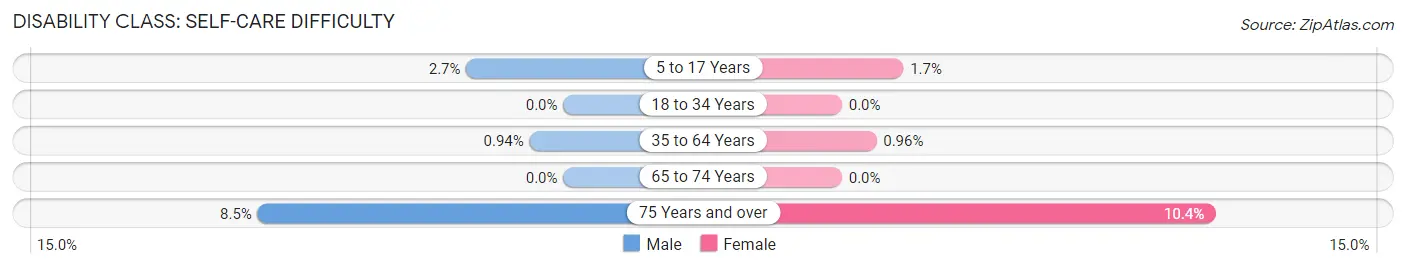
| Age Bracket | Male | Female |
| 5 to 17 Years | 5 (2.7%) | 4 (1.7%) |
| 18 to 34 Years | 0 (0.0%) | 0 (0.0%) |
| 35 to 64 Years | 3 (0.9%) | 3 (1.0%) |
| 65 to 74 Years | 0 (0.0%) | 0 (0.0%) |
| 75 Years and over | 4 (8.5%) | 5 (10.4%) |
Technology Access in Battle Ground
Computing Device Access in Battle Ground
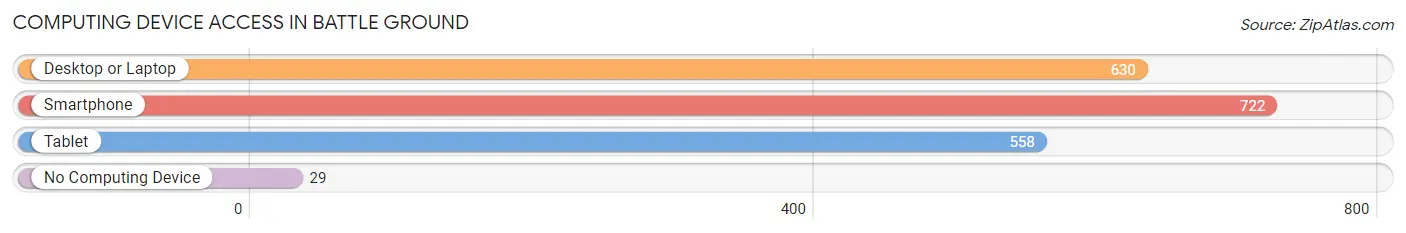
| Device Type | # Households | % Households |
| Desktop or Laptop | 630 | 81.9% |
| Smartphone | 722 | 93.9% |
| Tablet | 558 | 72.6% |
| No Computing Device | 29 | 3.8% |
| Total | 769 | 100.0% |
Internet Access in Battle Ground
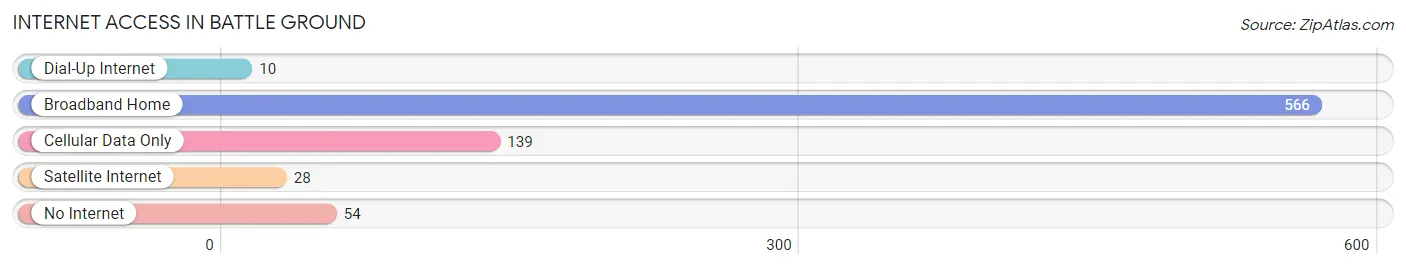
| Internet Type | # Households | % Households |
| Dial-Up Internet | 10 | 1.3% |
| Broadband Home | 566 | 73.6% |
| Cellular Data Only | 139 | 18.1% |
| Satellite Internet | 28 | 3.6% |
| No Internet | 54 | 7.0% |
| Total | 769 | 100.0% |
Battle Ground Summary
Battle Ground is a small town located in Tippecanoe County, Indiana. It is situated in the northwest corner of the state, about 25 miles northwest of Lafayette. The town has a population of 1,717 people, according to the 2010 census.
History
Battle Ground was founded in 1836 by a group of settlers from Ohio. The town was named after a nearby battle that had taken place between Native Americans and settlers in 1811. The town was originally a farming community, but it soon became a center for industry. In 1851, the first railroad line was built through the town, connecting it to Lafayette. This allowed for the transportation of goods and people, and the town began to grow.
In the late 19th century, Battle Ground became a popular tourist destination. The town was known for its mineral springs, which were believed to have healing properties. People from all over the country would come to take the waters and enjoy the scenery.
In the early 20th century, Battle Ground began to decline. The railroad line was abandoned and the mineral springs dried up. The town was no longer a popular tourist destination and the population began to decline.
Geography
Battle Ground is located in the northwest corner of Indiana, about 25 miles northwest of Lafayette. The town is situated in a rural area, surrounded by farmland and woodlands. The town is located on the banks of the Wabash River, which flows through the area.
The climate in Battle Ground is humid continental, with hot summers and cold winters. The average temperature in the summer is around 75 degrees Fahrenheit, and the average temperature in the winter is around 30 degrees Fahrenheit.
Economy
The economy of Battle Ground is largely based on agriculture. The town is surrounded by farmland, and many of the residents are involved in farming. The town also has a few small businesses, including a grocery store, a hardware store, and a few restaurants.
Demographics
According to the 2010 census, the population of Battle Ground is 1,717 people. The town is predominantly white, with 92.3% of the population identifying as white. The median household income is $45,938, and the median age is 40.7 years.
Conclusion
Battle Ground is a small town located in Tippecanoe County, Indiana. It was founded in 1836 and was originally a farming community. In the late 19th century, it became a popular tourist destination due to its mineral springs. In the early 20th century, the town began to decline and the population began to decrease. Today, the economy of Battle Ground is largely based on agriculture, and the town has a population of 1,717 people.
Common Questions
What is Per Capita Income in Battle Ground?
Per Capita income in Battle Ground is $38,835.
What is the Median Family Income in Battle Ground?
Median Family Income in Battle Ground is $113,393.
What is the Median Household income in Battle Ground?
Median Household Income in Battle Ground is $94,205.
What is Income or Wage Gap in Battle Ground?
Income or Wage Gap in Battle Ground is 50.2%.
Women in Battle Ground earn 49.8 cents for every dollar earned by a man.
What is Inequality or Gini Index in Battle Ground?
Inequality or Gini Index in Battle Ground is 0.34.
What is the Total Population of Battle Ground?
Total Population of Battle Ground is 2,073.
What is the Total Male Population of Battle Ground?
Total Male Population of Battle Ground is 1,006.
What is the Total Female Population of Battle Ground?
Total Female Population of Battle Ground is 1,067.
What is the Ratio of Males per 100 Females in Battle Ground?
There are 94.28 Males per 100 Females in Battle Ground.
What is the Ratio of Females per 100 Males in Battle Ground?
There are 106.06 Females per 100 Males in Battle Ground.
What is the Median Population Age in Battle Ground?
Median Population Age in Battle Ground is 32.0 Years.
What is the Average Family Size in Battle Ground
Average Family Size in Battle Ground is 3.0 People.
What is the Average Household Size in Battle Ground
Average Household Size in Battle Ground is 2.7 People.
How Large is the Labor Force in Battle Ground?
There are 1,123 People in the Labor Forcein in Battle Ground.
What is the Percentage of People in the Labor Force in Battle Ground?
74.0% of People are in the Labor Force in Battle Ground.
What is the Unemployment Rate in Battle Ground?
Unemployment Rate in Battle Ground is 4.8%.