Bainbridge, IN Map & Demographics
Bainbridge Map
Bainbridge Overview
$29,997
PER CAPITA INCOME
$64,688
AVG FAMILY INCOME
$56,250
AVG HOUSEHOLD INCOME
48.2%
WAGE / INCOME GAP [ % ]
51.8¢/ $1
WAGE / INCOME GAP [ $ ]
0.39
INEQUALITY / GINI INDEX
592
TOTAL POPULATION
314
MALE POPULATION
278
FEMALE POPULATION
112.95
MALES / 100 FEMALES
88.54
FEMALES / 100 MALES
36.9
MEDIAN AGE
2.7
AVG FAMILY SIZE
2.1
AVG HOUSEHOLD SIZE
267
LABOR FORCE [ PEOPLE ]
58.6%
PERCENT IN LABOR FORCE
1.1%
UNEMPLOYMENT RATE
Bainbridge Zip Codes
Bainbridge Area Codes
Income in Bainbridge
Income Overview in Bainbridge
Per Capita Income in Bainbridge is $29,997, while median incomes of families and households are $64,688 and $56,250 respectively.
| Characteristic | Number | Measure |
| Per Capita Income | 592 | $29,997 |
| Median Family Income | 167 | $64,688 |
| Mean Family Income | 167 | $80,434 |
| Median Household Income | 275 | $56,250 |
| Mean Household Income | 275 | $69,433 |
| Income Deficit | 167 | $0 |
| Wage / Income Gap (%) | 592 | 48.18% |
| Wage / Income Gap ($) | 592 | 51.82¢ per $1 |
| Gini / Inequality Index | 592 | 0.39 |
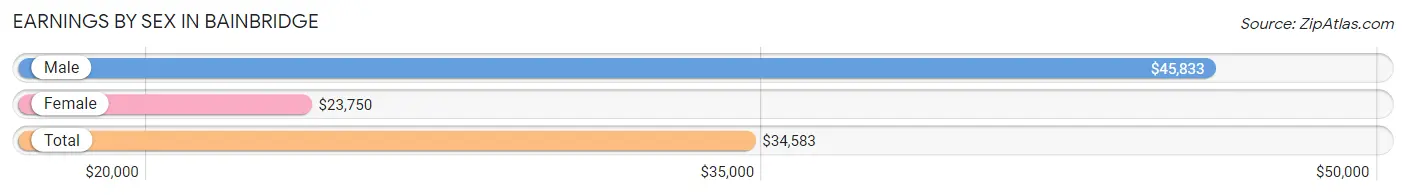
Earnings by Sex in Bainbridge
Average Earnings in Bainbridge are $34,583, $45,833 for men and $23,750 for women, a difference of 48.2%.
| Sex | Number | Average Earnings |
| Male | 184 (62.4%) | $45,833 |
| Female | 111 (37.6%) | $23,750 |
| Total | 295 (100.0%) | $34,583 |
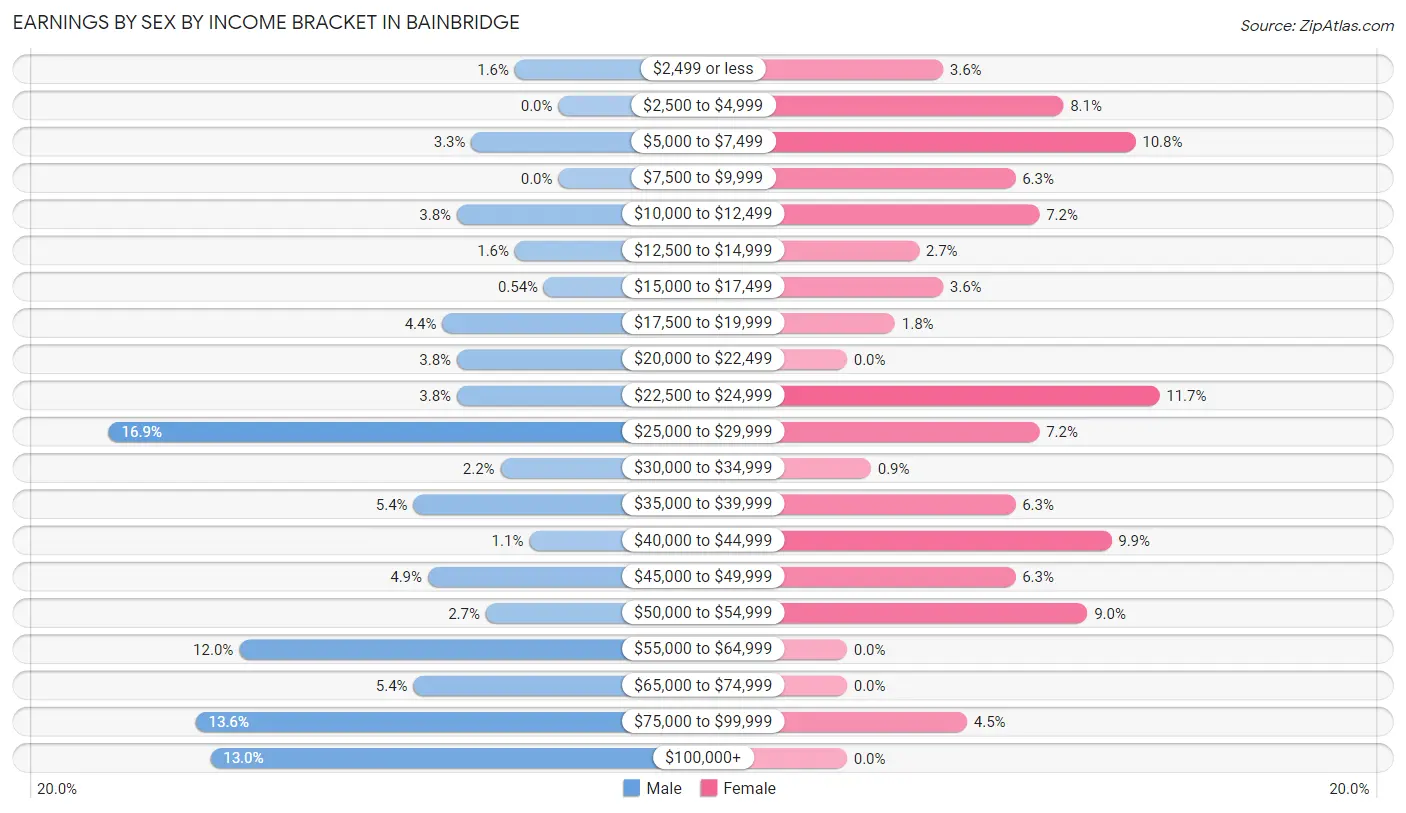
Earnings by Sex by Income Bracket in Bainbridge
The most common earnings brackets in Bainbridge are $25,000 to $29,999 for men (31 | 16.9%) and $22,500 to $24,999 for women (13 | 11.7%).
| Income | Male | Female |
| $2,499 or less | 3 (1.6%) | 4 (3.6%) |
| $2,500 to $4,999 | 0 (0.0%) | 9 (8.1%) |
| $5,000 to $7,499 | 6 (3.3%) | 12 (10.8%) |
| $7,500 to $9,999 | 0 (0.0%) | 7 (6.3%) |
| $10,000 to $12,499 | 7 (3.8%) | 8 (7.2%) |
| $12,500 to $14,999 | 3 (1.6%) | 3 (2.7%) |
| $15,000 to $17,499 | 1 (0.5%) | 4 (3.6%) |
| $17,500 to $19,999 | 8 (4.3%) | 2 (1.8%) |
| $20,000 to $22,499 | 7 (3.8%) | 0 (0.0%) |
| $22,500 to $24,999 | 7 (3.8%) | 13 (11.7%) |
| $25,000 to $29,999 | 31 (16.9%) | 8 (7.2%) |
| $30,000 to $34,999 | 4 (2.2%) | 1 (0.9%) |
| $35,000 to $39,999 | 10 (5.4%) | 7 (6.3%) |
| $40,000 to $44,999 | 2 (1.1%) | 11 (9.9%) |
| $45,000 to $49,999 | 9 (4.9%) | 7 (6.3%) |
| $50,000 to $54,999 | 5 (2.7%) | 10 (9.0%) |
| $55,000 to $64,999 | 22 (12.0%) | 0 (0.0%) |
| $65,000 to $74,999 | 10 (5.4%) | 0 (0.0%) |
| $75,000 to $99,999 | 25 (13.6%) | 5 (4.5%) |
| $100,000+ | 24 (13.0%) | 0 (0.0%) |
| Total | 184 (100.0%) | 111 (100.0%) |
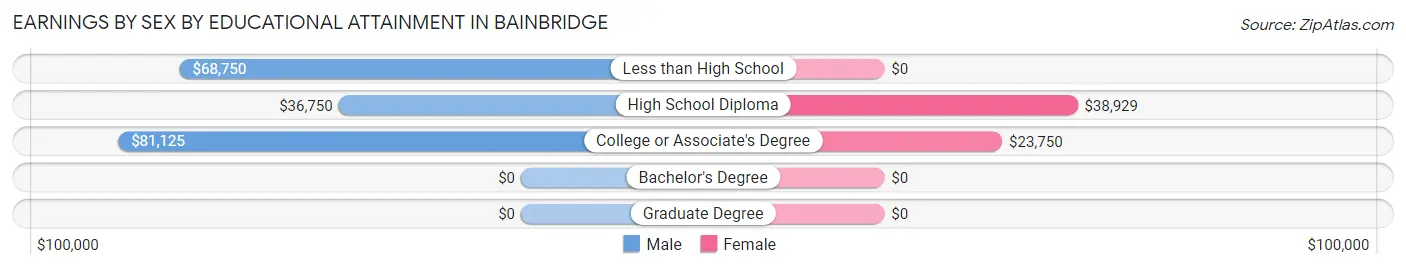
Earnings by Sex by Educational Attainment in Bainbridge
Average earnings in Bainbridge are $56,833 for men and $28,438 for women, a difference of 50.0%. Men with an educational attainment of college or associate's degree enjoy the highest average annual earnings of $81,125, while those with high school diploma education earn the least with $36,750. Women with an educational attainment of high school diploma earn the most with the average annual earnings of $38,929, while those with college or associate's degree education have the smallest earnings of $23,750.
| Educational Attainment | Male Income | Female Income |
| Less than High School | $68,750 | $0 |
| High School Diploma | $36,750 | $38,929 |
| College or Associate's Degree | $81,125 | $23,750 |
| Bachelor's Degree | - | - |
| Graduate Degree | - | - |
| Total | $56,833 | $28,438 |
Family Income in Bainbridge
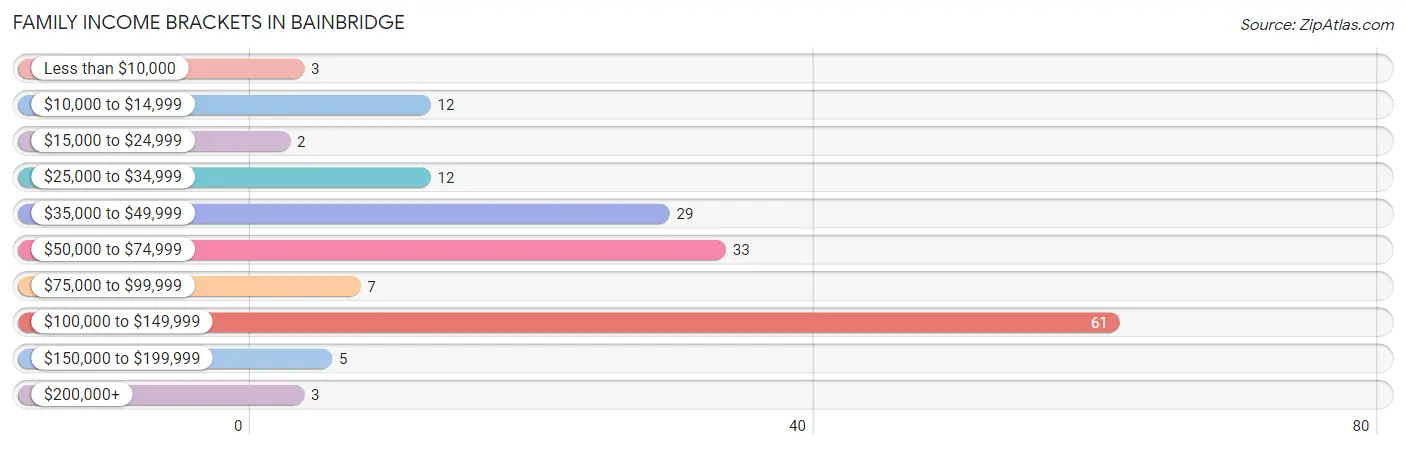
Family Income Brackets in Bainbridge
According to the Bainbridge family income data, there are 61 families falling into the $100,000 to $149,999 income range, which is the most common income bracket and makes up 36.5% of all families. Conversely, the $15,000 to $24,999 income bracket is the least frequent group with only 2 families (1.2%) belonging to this category.
| Income Bracket | # Families | % Families |
| Less than $10,000 | 3 | 1.8% |
| $10,000 to $14,999 | 12 | 7.2% |
| $15,000 to $24,999 | 2 | 1.2% |
| $25,000 to $34,999 | 12 | 7.2% |
| $35,000 to $49,999 | 29 | 17.4% |
| $50,000 to $74,999 | 33 | 19.8% |
| $75,000 to $99,999 | 7 | 4.2% |
| $100,000 to $149,999 | 61 | 36.5% |
| $150,000 to $199,999 | 5 | 3.0% |
| $200,000+ | 3 | 1.8% |
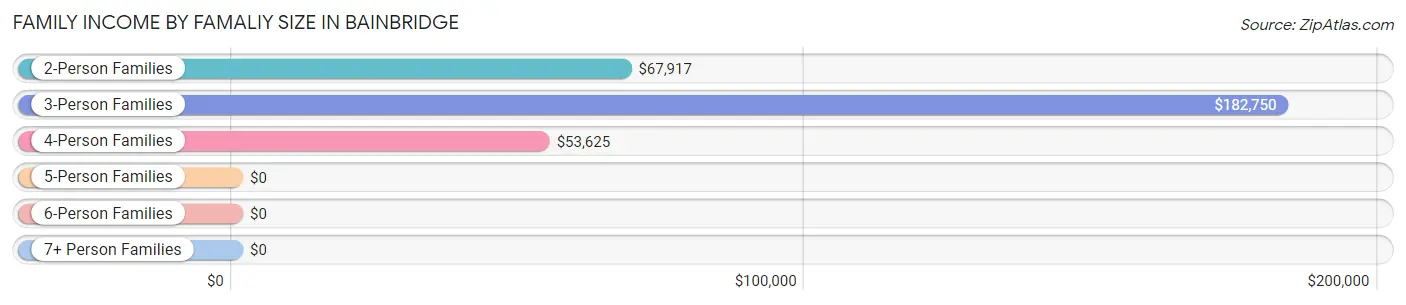
Family Income by Famaliy Size in Bainbridge
3-person families (15 | 9.0%) account for the highest median family income in Bainbridge with $182,750 per family, while 3-person families (15 | 9.0%) have the highest median income of $60,917 per family member.
| Income Bracket | # Families | Median Income |
| 2-Person Families | 92 (55.1%) | $67,917 |
| 3-Person Families | 15 (9.0%) | $182,750 |
| 4-Person Families | 37 (22.2%) | $53,625 |
| 5-Person Families | 16 (9.6%) | $0 |
| 6-Person Families | 0 (0.0%) | $0 |
| 7+ Person Families | 7 (4.2%) | $0 |
| Total | 167 (100.0%) | $64,688 |
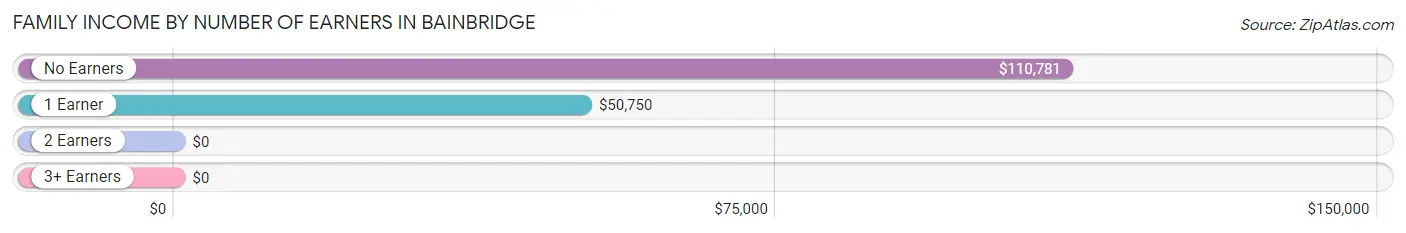
Family Income by Number of Earners in Bainbridge
| Number of Earners | # Families | Median Income |
| No Earners | 61 (36.5%) | $110,781 |
| 1 Earner | 47 (28.1%) | $50,750 |
| 2 Earners | 40 (23.9%) | $0 |
| 3+ Earners | 19 (11.4%) | $0 |
| Total | 167 (100.0%) | $64,688 |
Household Income in Bainbridge
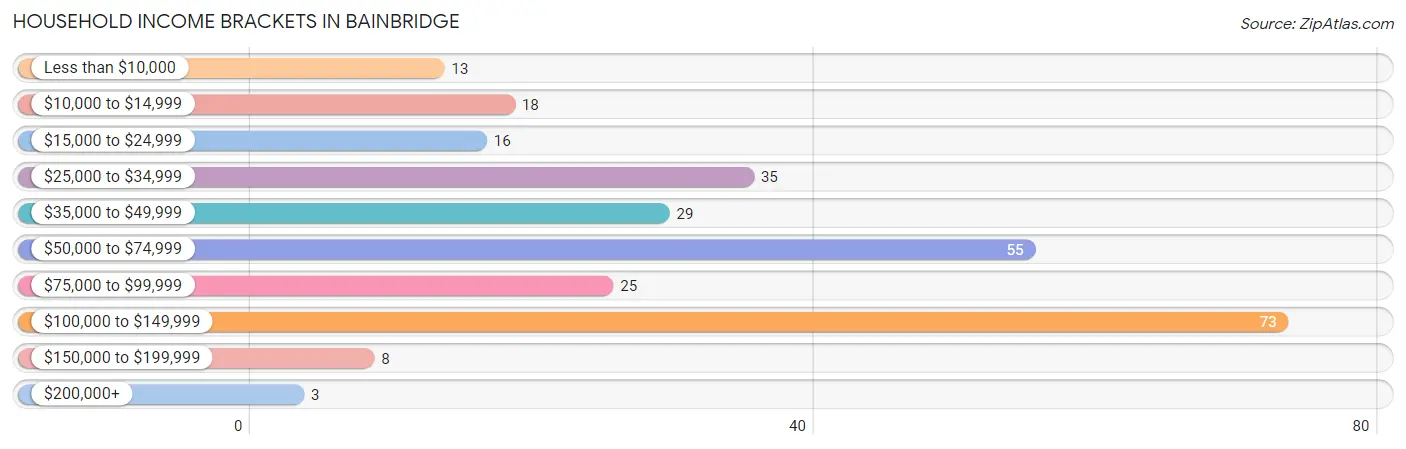
Household Income Brackets in Bainbridge
With 73 households falling in the category, the $100,000 to $149,999 income range is the most frequent in Bainbridge, accounting for 26.6% of all households. In contrast, only 3 households (1.1%) fall into the $200,000+ income bracket, making it the least populous group.
| Income Bracket | # Households | % Households |
| Less than $10,000 | 13 | 4.7% |
| $10,000 to $14,999 | 18 | 6.5% |
| $15,000 to $24,999 | 16 | 5.8% |
| $25,000 to $34,999 | 35 | 12.7% |
| $35,000 to $49,999 | 29 | 10.5% |
| $50,000 to $74,999 | 55 | 20.0% |
| $75,000 to $99,999 | 25 | 9.1% |
| $100,000 to $149,999 | 73 | 26.5% |
| $150,000 to $199,999 | 8 | 2.9% |
| $200,000+ | 3 | 1.1% |
Household Income by Householder Age in Bainbridge
The median household income in Bainbridge is $56,250, with the highest median household income of $62,344 found in the 25 to 44 years age bracket for the primary householder. A total of 67 households (24.4%) fall into this category. Meanwhile, the 65+ years age bracket for the primary householder has the lowest median household income of $0, with 70 households (25.5%) in this group.
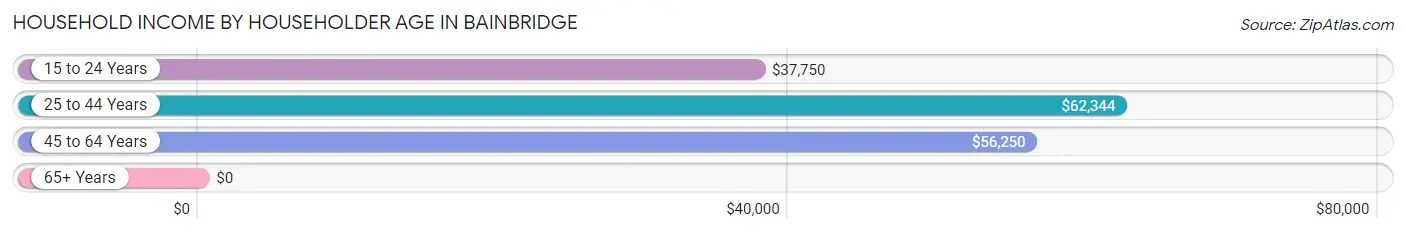
| Income Bracket | # Households | Median Income |
| 15 to 24 Years | 43 (15.6%) | $37,750 |
| 25 to 44 Years | 67 (24.4%) | $62,344 |
| 45 to 64 Years | 95 (34.5%) | $56,250 |
| 65+ Years | 70 (25.5%) | $0 |
| Total | 275 (100.0%) | $56,250 |
Poverty in Bainbridge
Income Below Poverty by Sex and Age in Bainbridge
With 15.0% poverty level for males and 20.1% for females among the residents of Bainbridge, 12 to 14 year old males and 6 to 11 year old females are the most vulnerable to poverty, with 10 males (83.3%) and 12 females (46.2%) in their respective age groups living below the poverty level.
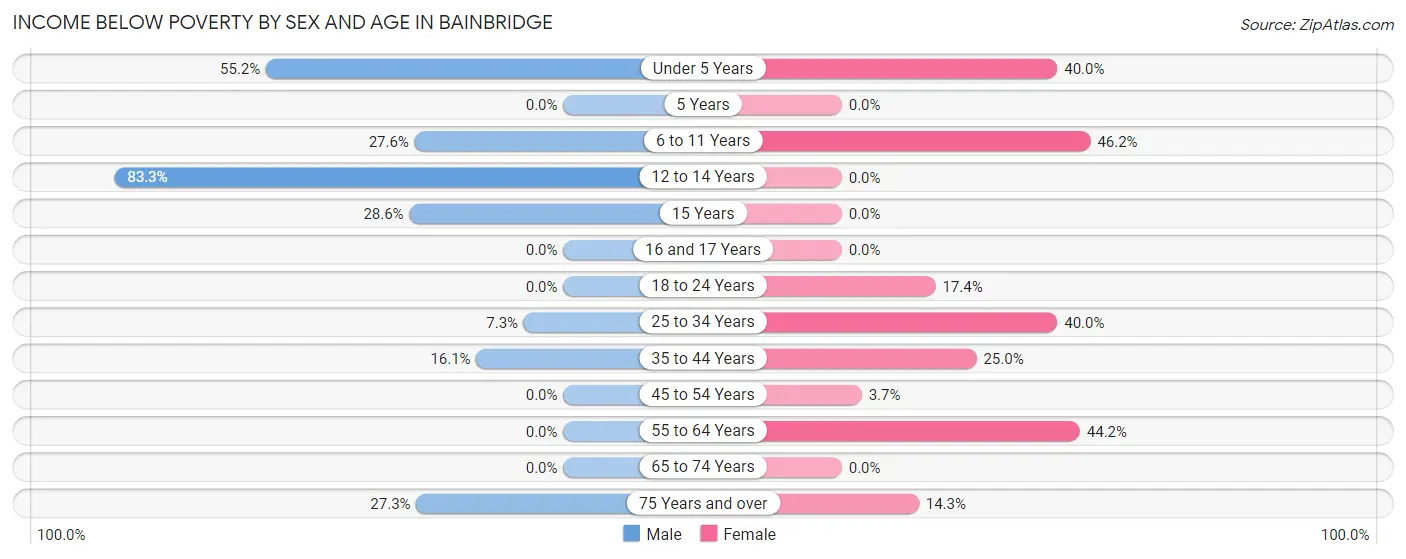
| Age Bracket | Male | Female |
| Under 5 Years | 16 (55.2%) | 4 (40.0%) |
| 5 Years | 0 (0.0%) | 0 (0.0%) |
| 6 to 11 Years | 8 (27.6%) | 12 (46.2%) |
| 12 to 14 Years | 10 (83.3%) | 0 (0.0%) |
| 15 Years | 2 (28.6%) | 0 (0.0%) |
| 16 and 17 Years | 0 (0.0%) | 0 (0.0%) |
| 18 to 24 Years | 0 (0.0%) | 4 (17.4%) |
| 25 to 34 Years | 3 (7.3%) | 6 (40.0%) |
| 35 to 44 Years | 5 (16.1%) | 8 (25.0%) |
| 45 to 54 Years | 0 (0.0%) | 1 (3.7%) |
| 55 to 64 Years | 0 (0.0%) | 19 (44.2%) |
| 65 to 74 Years | 0 (0.0%) | 0 (0.0%) |
| 75 Years and over | 3 (27.3%) | 2 (14.3%) |
| Total | 47 (15.0%) | 56 (20.1%) |
Income Above Poverty by Sex and Age in Bainbridge
According to the poverty statistics in Bainbridge, males aged 16 and 17 years and females aged 12 to 14 years are the age groups that are most secure financially, with 100.0% of males and 100.0% of females in these age groups living above the poverty line.
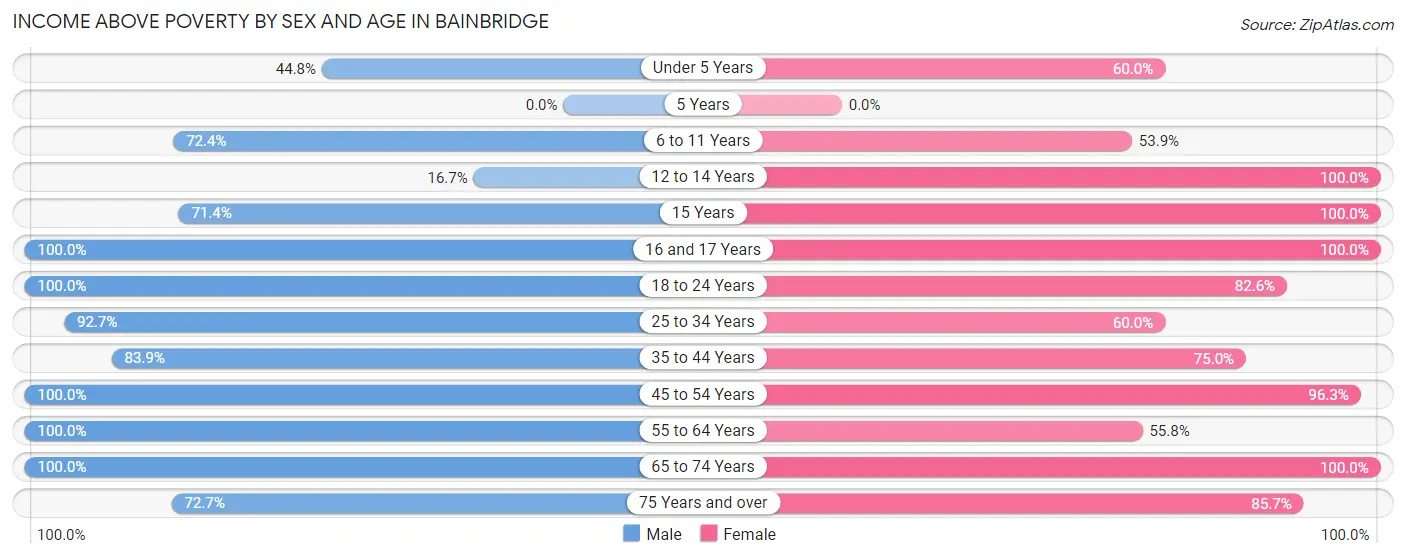
| Age Bracket | Male | Female |
| Under 5 Years | 13 (44.8%) | 6 (60.0%) |
| 5 Years | 0 (0.0%) | 0 (0.0%) |
| 6 to 11 Years | 21 (72.4%) | 14 (53.8%) |
| 12 to 14 Years | 2 (16.7%) | 13 (100.0%) |
| 15 Years | 5 (71.4%) | 10 (100.0%) |
| 16 and 17 Years | 3 (100.0%) | 4 (100.0%) |
| 18 to 24 Years | 56 (100.0%) | 19 (82.6%) |
| 25 to 34 Years | 38 (92.7%) | 9 (60.0%) |
| 35 to 44 Years | 26 (83.9%) | 24 (75.0%) |
| 45 to 54 Years | 35 (100.0%) | 26 (96.3%) |
| 55 to 64 Years | 24 (100.0%) | 24 (55.8%) |
| 65 to 74 Years | 36 (100.0%) | 61 (100.0%) |
| 75 Years and over | 8 (72.7%) | 12 (85.7%) |
| Total | 267 (85.0%) | 222 (79.9%) |
Income Below Poverty Among Married-Couple Families in Bainbridge
The poverty statistics for married-couple families in Bainbridge show that 6.2% or 7 of the total 113 families live below the poverty line. Families with 1 or 2 children have the highest poverty rate of 25.0%, comprising of 7 families. On the other hand, families with no children have the lowest poverty rate of 0.0%, which includes 0 families.
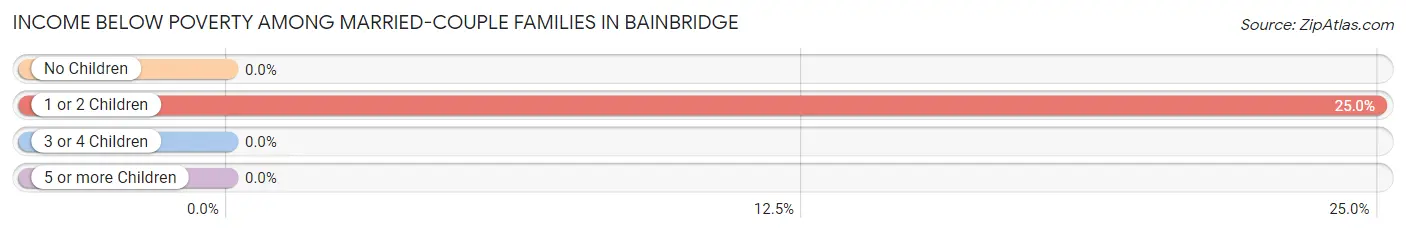
| Children | Above Poverty | Below Poverty |
| No Children | 85 (100.0%) | 0 (0.0%) |
| 1 or 2 Children | 21 (75.0%) | 7 (25.0%) |
| 3 or 4 Children | 0 (0.0%) | 0 (0.0%) |
| 5 or more Children | 0 (0.0%) | 0 (0.0%) |
| Total | 106 (93.8%) | 7 (6.2%) |
Income Below Poverty Among Single-Parent Households in Bainbridge
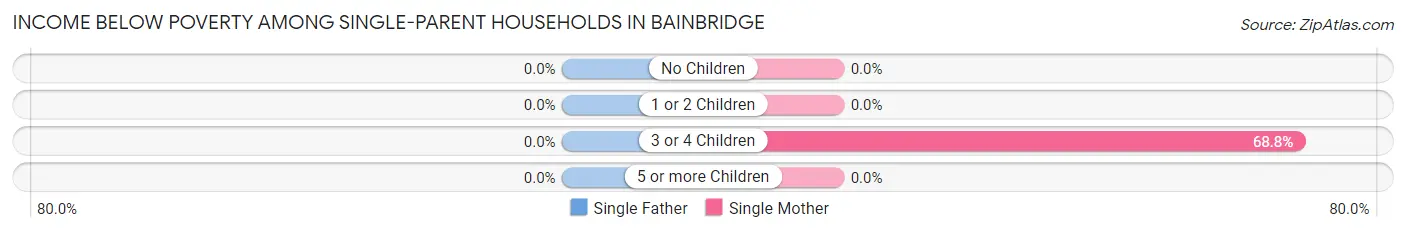
| Children | Single Father | Single Mother |
| No Children | 0 (0.0%) | 0 (0.0%) |
| 1 or 2 Children | 0 (0.0%) | 0 (0.0%) |
| 3 or 4 Children | 0 (0.0%) | 11 (68.8%) |
| 5 or more Children | 0 (0.0%) | 0 (0.0%) |
| Total | 0 (0.0%) | 11 (39.3%) |
Income Below Poverty Among Married-Couple vs Single-Parent Households in Bainbridge
The poverty data for Bainbridge shows that 7 of the married-couple family households (6.2%) and 11 of the single-parent households (20.4%) are living below the poverty level. Within the married-couple family households, those with 1 or 2 children have the highest poverty rate, with 7 households (25.0%) falling below the poverty line. Among the single-parent households, those with 3 or 4 children have the highest poverty rate, with 11 household (68.8%) living below poverty.
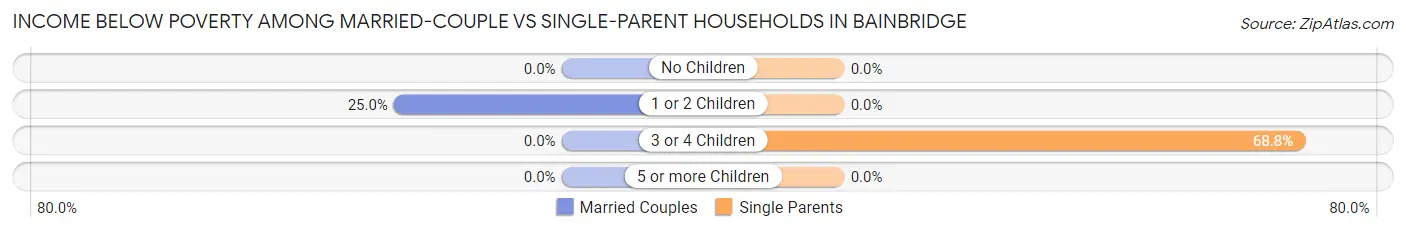
| Children | Married-Couple Families | Single-Parent Households |
| No Children | 0 (0.0%) | 0 (0.0%) |
| 1 or 2 Children | 7 (25.0%) | 0 (0.0%) |
| 3 or 4 Children | 0 (0.0%) | 11 (68.8%) |
| 5 or more Children | 0 (0.0%) | 0 (0.0%) |
| Total | 7 (6.2%) | 11 (20.4%) |
Race in Bainbridge
The most populous races in Bainbridge are White / Caucasian (560 | 94.6%), Asian (25 | 4.2%), and Two or more Races (7 | 1.2%).
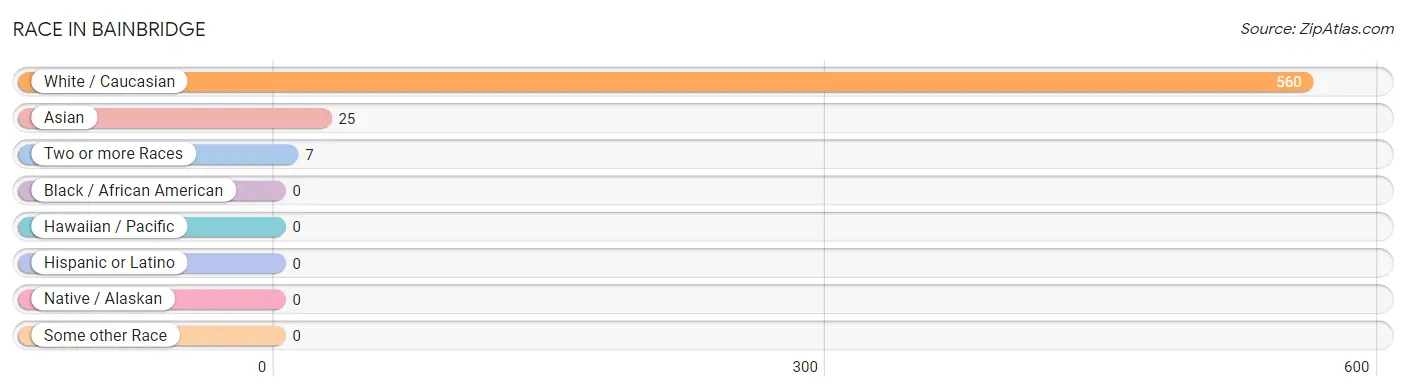
| Race | # Population | % Population |
| Asian | 25 | 4.2% |
| Black / African American | 0 | 0.0% |
| Hawaiian / Pacific | 0 | 0.0% |
| Hispanic or Latino | 0 | 0.0% |
| Native / Alaskan | 0 | 0.0% |
| White / Caucasian | 560 | 94.6% |
| Two or more Races | 7 | 1.2% |
| Some other Race | 0 | 0.0% |
| Total | 592 | 100.0% |
Ancestry in Bainbridge
The most populous ancestries reported in Bainbridge are American (134 | 22.6%), German (51 | 8.6%), English (26 | 4.4%), Sri Lankan (25 | 4.2%), and Irish (23 | 3.9%), together accounting for 43.8% of all Bainbridge residents.
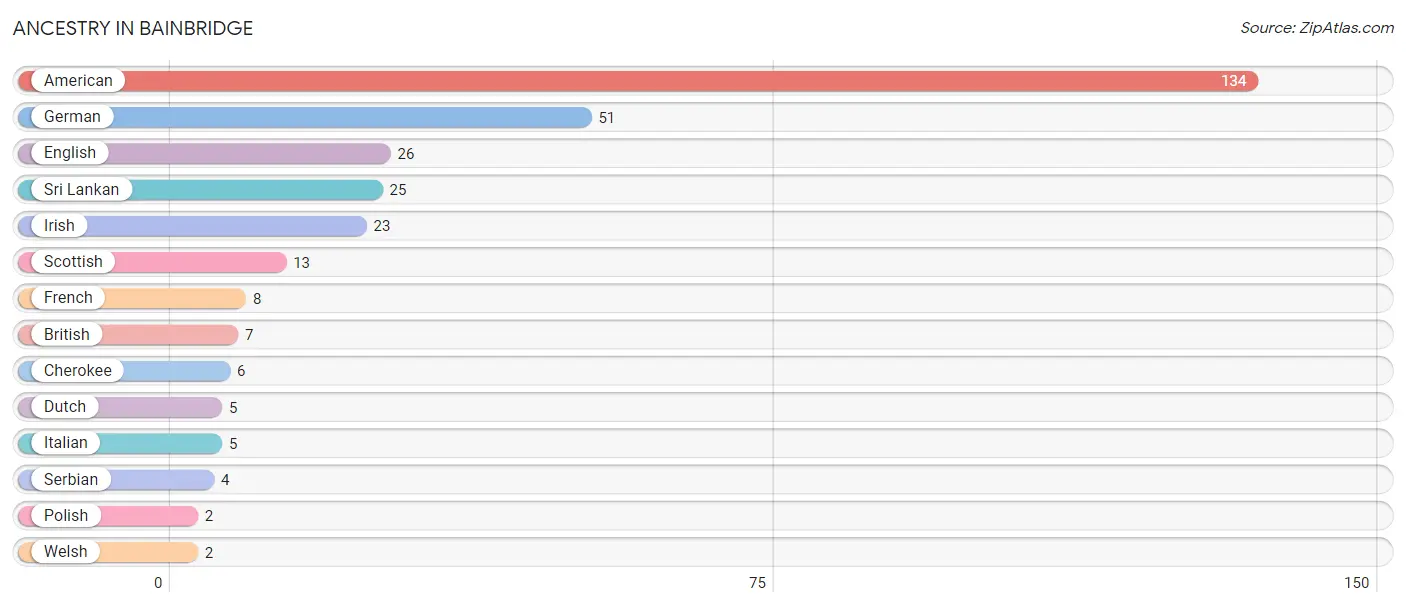
| Ancestry | # Population | % Population |
| American | 134 | 22.6% |
| British | 7 | 1.2% |
| Cherokee | 6 | 1.0% |
| Dutch | 5 | 0.8% |
| English | 26 | 4.4% |
| French | 8 | 1.3% |
| German | 51 | 8.6% |
| Irish | 23 | 3.9% |
| Italian | 5 | 0.8% |
| Polish | 2 | 0.3% |
| Scottish | 13 | 2.2% |
| Serbian | 4 | 0.7% |
| Sri Lankan | 25 | 4.2% |
| Welsh | 2 | 0.3% | View All 14 Rows |
Immigrants in Bainbridge
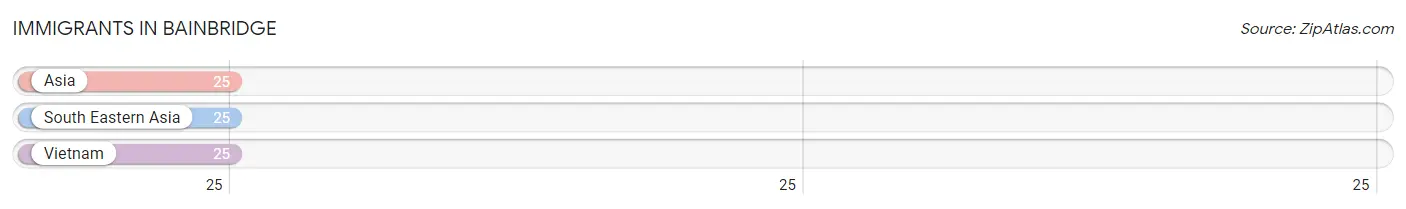
The most numerous immigrant groups reported in Bainbridge came from Asia (25 | 4.2%), South Eastern Asia (25 | 4.2%), and Vietnam (25 | 4.2%), together accounting for 12.7% of all Bainbridge residents.
| Immigration Origin | # Population | % Population |
| Asia | 25 | 4.2% |
| South Eastern Asia | 25 | 4.2% |
| Vietnam | 25 | 4.2% | View All 3 Rows |
Sex and Age in Bainbridge
Sex and Age in Bainbridge
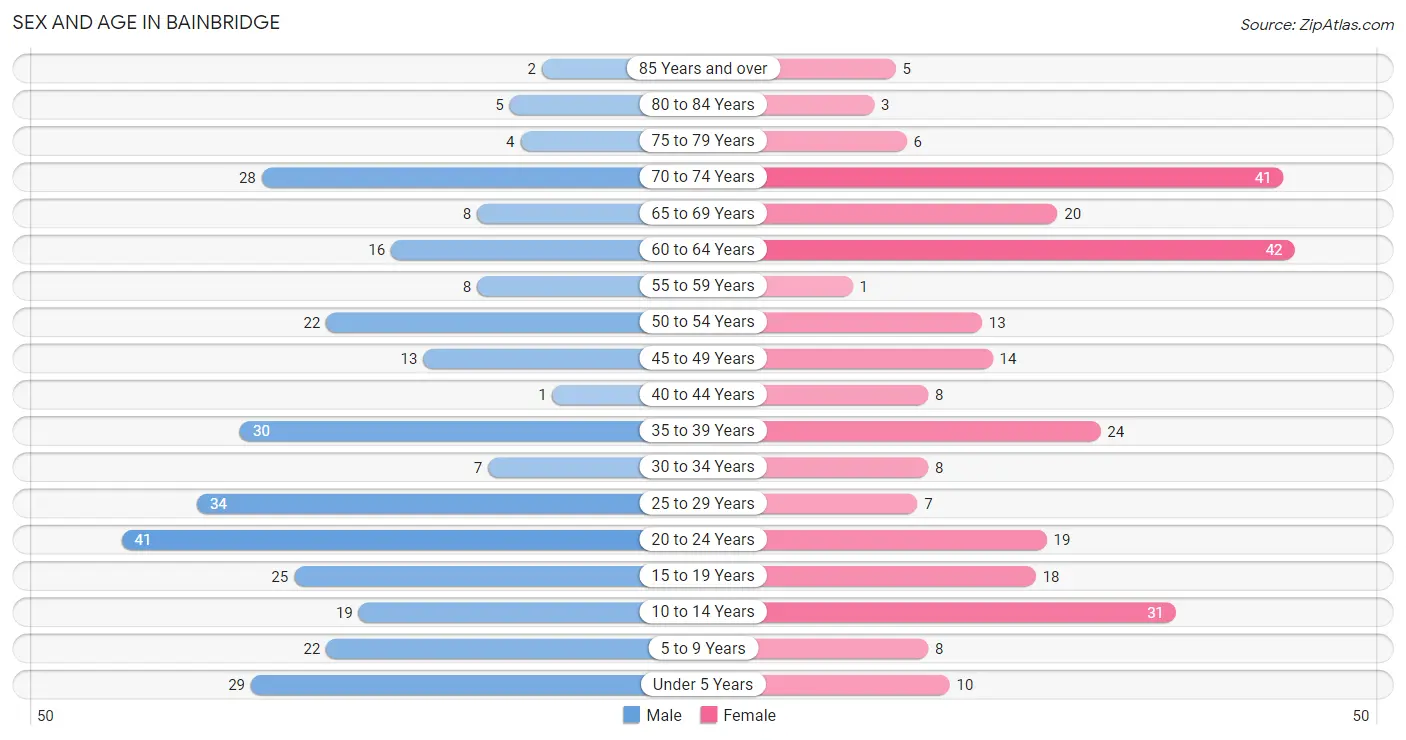
The most populous age groups in Bainbridge are 20 to 24 Years (41 | 13.1%) for men and 60 to 64 Years (42 | 15.1%) for women.
| Age Bracket | Male | Female |
| Under 5 Years | 29 (9.2%) | 10 (3.6%) |
| 5 to 9 Years | 22 (7.0%) | 8 (2.9%) |
| 10 to 14 Years | 19 (6.0%) | 31 (11.2%) |
| 15 to 19 Years | 25 (8.0%) | 18 (6.5%) |
| 20 to 24 Years | 41 (13.1%) | 19 (6.8%) |
| 25 to 29 Years | 34 (10.8%) | 7 (2.5%) |
| 30 to 34 Years | 7 (2.2%) | 8 (2.9%) |
| 35 to 39 Years | 30 (9.6%) | 24 (8.6%) |
| 40 to 44 Years | 1 (0.3%) | 8 (2.9%) |
| 45 to 49 Years | 13 (4.1%) | 14 (5.0%) |
| 50 to 54 Years | 22 (7.0%) | 13 (4.7%) |
| 55 to 59 Years | 8 (2.5%) | 1 (0.4%) |
| 60 to 64 Years | 16 (5.1%) | 42 (15.1%) |
| 65 to 69 Years | 8 (2.5%) | 20 (7.2%) |
| 70 to 74 Years | 28 (8.9%) | 41 (14.7%) |
| 75 to 79 Years | 4 (1.3%) | 6 (2.2%) |
| 80 to 84 Years | 5 (1.6%) | 3 (1.1%) |
| 85 Years and over | 2 (0.6%) | 5 (1.8%) |
| Total | 314 (100.0%) | 278 (100.0%) |
Families and Households in Bainbridge
Median Family Size in Bainbridge
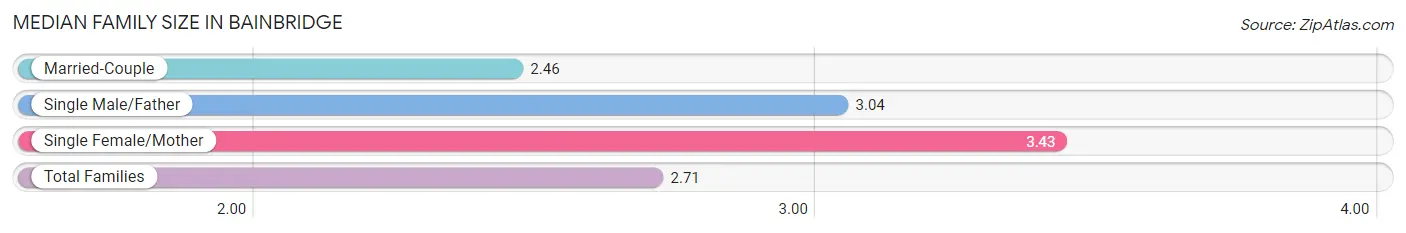
The median family size in Bainbridge is 2.71 persons per family, with single female/mother families (28 | 16.8%) accounting for the largest median family size of 3.43 persons per family. On the other hand, married-couple families (113 | 67.7%) represent the smallest median family size with 2.46 persons per family.
| Family Type | # Families | Family Size |
| Married-Couple | 113 (67.7%) | 2.46 |
| Single Male/Father | 26 (15.6%) | 3.04 |
| Single Female/Mother | 28 (16.8%) | 3.43 |
| Total Families | 167 (100.0%) | 2.71 |
Median Household Size in Bainbridge
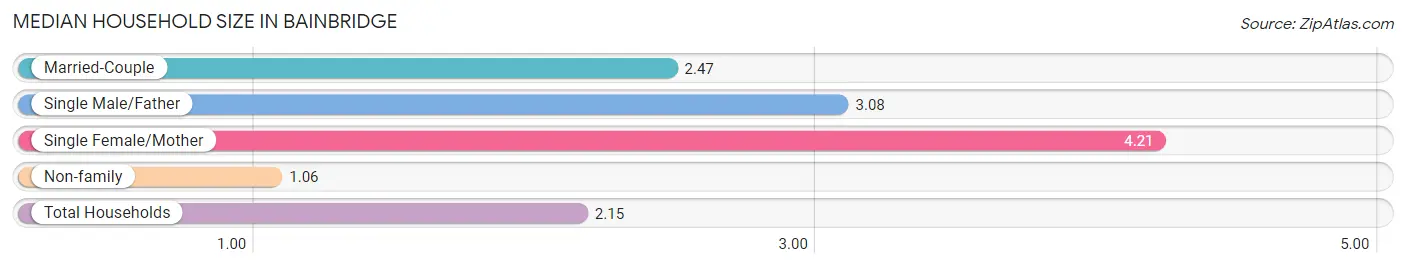
The median household size in Bainbridge is 2.15 persons per household, with single female/mother households (28 | 10.2%) accounting for the largest median household size of 4.21 persons per household. non-family households (108 | 39.3%) represent the smallest median household size with 1.06 persons per household.
| Household Type | # Households | Household Size |
| Married-Couple | 113 (41.1%) | 2.47 |
| Single Male/Father | 26 (9.5%) | 3.08 |
| Single Female/Mother | 28 (10.2%) | 4.21 |
| Non-family | 108 (39.3%) | 1.06 |
| Total Households | 275 (100.0%) | 2.15 |
Household Size by Marriage Status in Bainbridge
Out of a total of 275 households in Bainbridge, 167 (60.7%) are family households, while 108 (39.3%) are nonfamily households. The most numerous type of family households are 2-person households, comprising 90, and the most common type of nonfamily households are 1-person households, comprising 101.
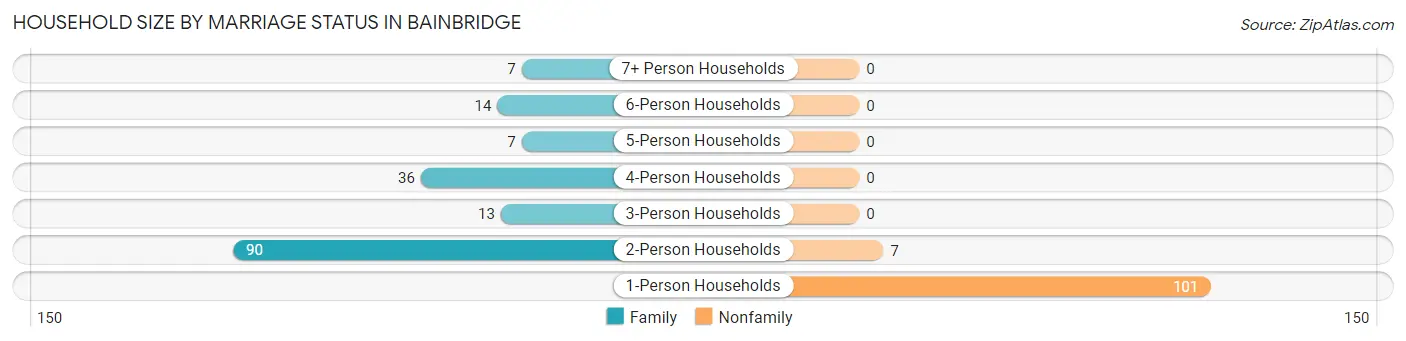
| Household Size | Family Households | Nonfamily Households |
| 1-Person Households | - | 101 (36.7%) |
| 2-Person Households | 90 (32.7%) | 7 (2.5%) |
| 3-Person Households | 13 (4.7%) | 0 (0.0%) |
| 4-Person Households | 36 (13.1%) | 0 (0.0%) |
| 5-Person Households | 7 (2.5%) | 0 (0.0%) |
| 6-Person Households | 14 (5.1%) | 0 (0.0%) |
| 7+ Person Households | 7 (2.5%) | 0 (0.0%) |
| Total | 167 (60.7%) | 108 (39.3%) |
Female Fertility in Bainbridge
Fertility by Age in Bainbridge
Average fertility rate in Bainbridge is 151.0 births per 1,000 women. Women in the age bracket of 20 to 34 years have the highest fertility rate with 235.0 births per 1,000 women. Women in the age bracket of 20 to 34 years acount for 50.0% of all women with births.
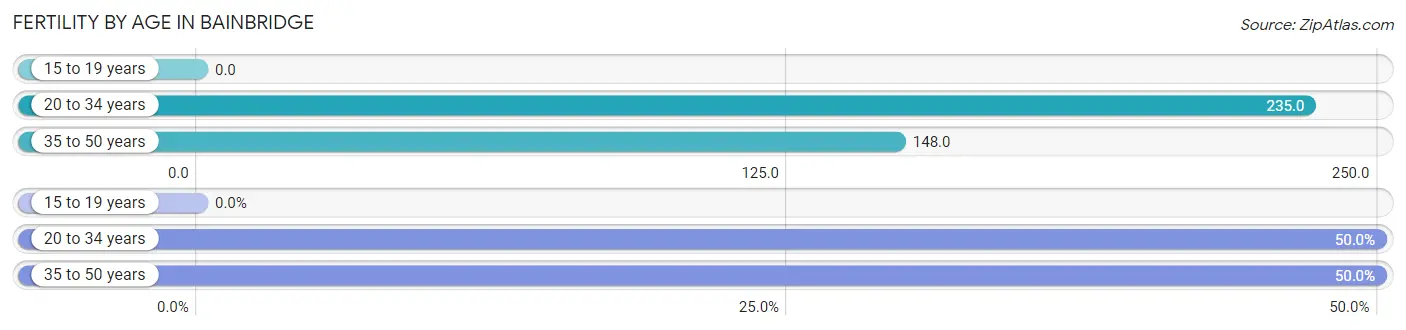
| Age Bracket | Women with Births | Births / 1,000 Women |
| 15 to 19 years | 0 (0.0%) | 0.0 |
| 20 to 34 years | 8 (50.0%) | 235.0 |
| 35 to 50 years | 8 (50.0%) | 148.0 |
| Total | 16 (100.0%) | 151.0 |
Fertility by Age by Marriage Status in Bainbridge
25.0% of women with births (16) in Bainbridge are married. The highest percentage of unmarried women with births falls into 35 to 50 years age bracket with 100.0% of them unmarried at the time of birth, while the lowest percentage of unmarried women with births belong to 20 to 34 years age bracket with 50.0% of them unmarried.
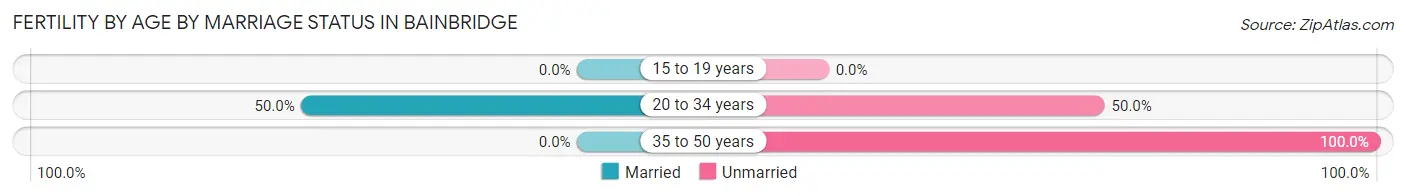
| Age Bracket | Married | Unmarried |
| 15 to 19 years | 0 (0.0%) | 0 (0.0%) |
| 20 to 34 years | 4 (50.0%) | 4 (50.0%) |
| 35 to 50 years | 0 (0.0%) | 8 (100.0%) |
| Total | 4 (25.0%) | 12 (75.0%) |
Fertility by Education in Bainbridge
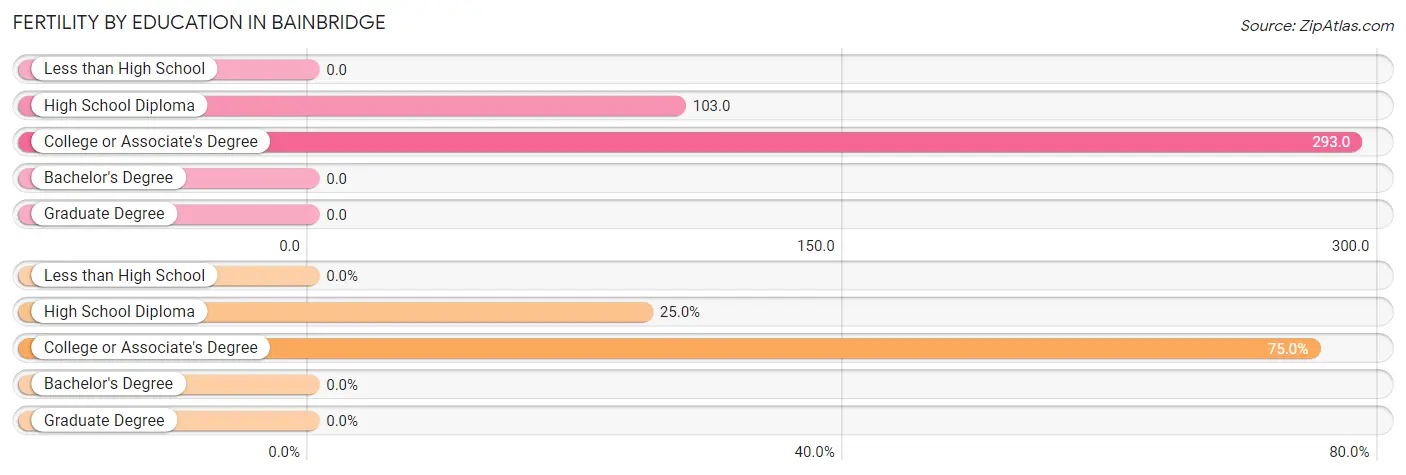
| Educational Attainment | Women with Births | Births / 1,000 Women |
| Less than High School | 0 (0.0%) | 0.0 |
| High School Diploma | 4 (25.0%) | 103.0 |
| College or Associate's Degree | 12 (75.0%) | 293.0 |
| Bachelor's Degree | 0 (0.0%) | 0.0 |
| Graduate Degree | 0 (0.0%) | 0.0 |
| Total | 16 (100.0%) | 151.0 |
Fertility by Education by Marriage Status in Bainbridge
75.0% of women with births in Bainbridge are unmarried. Women with the educational attainment of college or associate's degree are most likely to be married with 33.3% of them married at childbirth, while women with the educational attainment of high school diploma are least likely to be married with 100.0% of them unmarried at childbirth.
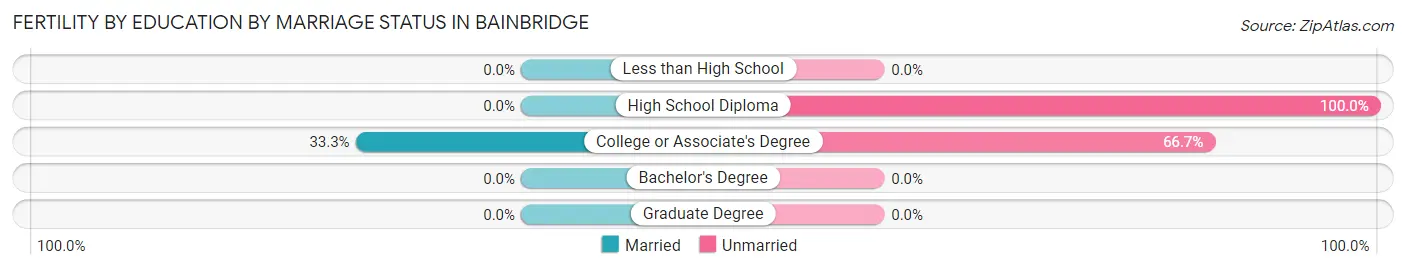
| Educational Attainment | Married | Unmarried |
| Less than High School | 0 (0.0%) | 0 (0.0%) |
| High School Diploma | 0 (0.0%) | 4 (100.0%) |
| College or Associate's Degree | 4 (33.3%) | 8 (66.7%) |
| Bachelor's Degree | 0 (0.0%) | 0 (0.0%) |
| Graduate Degree | 0 (0.0%) | 0 (0.0%) |
| Total | 4 (25.0%) | 12 (75.0%) |
Employment Characteristics in Bainbridge
Employment by Class of Employer in Bainbridge
Among the 254 employed individuals in Bainbridge, private company employees (198 | 77.9%), not-for-profit organizations (23 | 9.1%), and self-employed (not incorporated) (14 | 5.5%) make up the most common classes of employment.
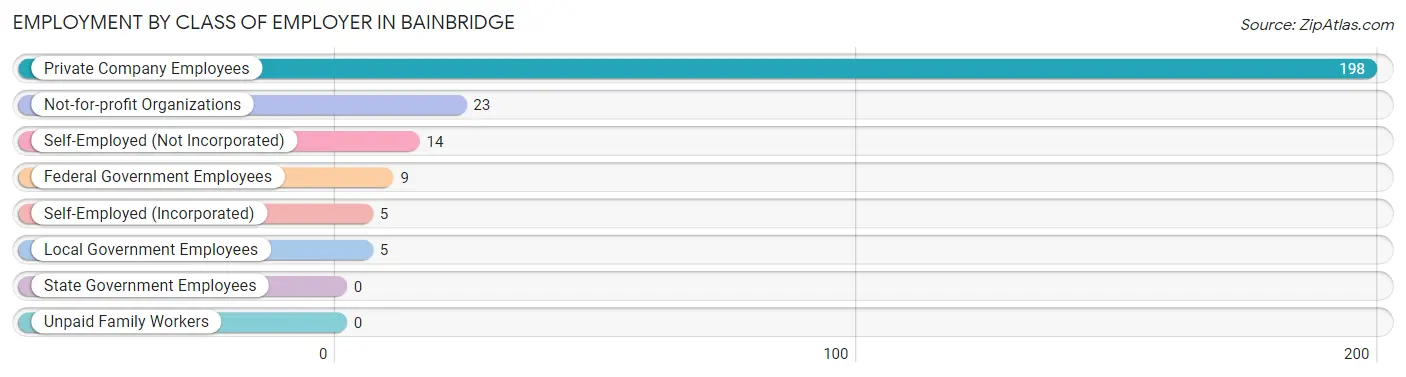
| Employer Class | # Employees | % Employees |
| Private Company Employees | 198 | 77.9% |
| Self-Employed (Incorporated) | 5 | 2.0% |
| Self-Employed (Not Incorporated) | 14 | 5.5% |
| Not-for-profit Organizations | 23 | 9.1% |
| Local Government Employees | 5 | 2.0% |
| State Government Employees | 0 | 0.0% |
| Federal Government Employees | 9 | 3.5% |
| Unpaid Family Workers | 0 | 0.0% |
| Total | 254 | 100.0% |
Employment Status by Age in Bainbridge
According to the labor force statistics for Bainbridge, out of the total population over 16 years of age (456), 58.6% or 267 individuals are in the labor force, with 1.1% or 3 of them unemployed. The age group with the highest labor force participation rate is 25 to 29 years, with 100.0% or 41 individuals in the labor force. Within the labor force, the 35 to 44 years age range has the highest percentage of unemployed individuals, with 4.2% or 2 of them being unemployed.
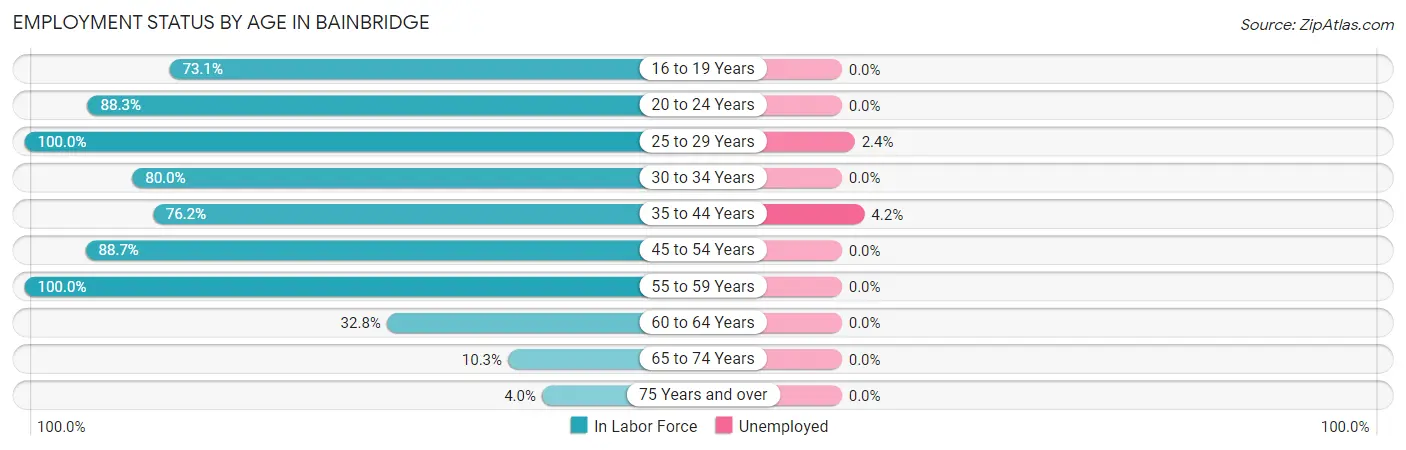
| Age Bracket | In Labor Force | Unemployed |
| 16 to 19 Years | 19 (73.1%) | 0 (0.0%) |
| 20 to 24 Years | 53 (88.3%) | 0 (0.0%) |
| 25 to 29 Years | 41 (100.0%) | 1 (2.4%) |
| 30 to 34 Years | 12 (80.0%) | 0 (0.0%) |
| 35 to 44 Years | 48 (76.2%) | 2 (4.2%) |
| 45 to 54 Years | 55 (88.7%) | 0 (0.0%) |
| 55 to 59 Years | 9 (100.0%) | 0 (0.0%) |
| 60 to 64 Years | 19 (32.8%) | 0 (0.0%) |
| 65 to 74 Years | 10 (10.3%) | 0 (0.0%) |
| 75 Years and over | 1 (4.0%) | 0 (0.0%) |
| Total | 267 (58.6%) | 3 (1.1%) |
Employment Status by Educational Attainment in Bainbridge
According to labor force statistics for Bainbridge, 74.2% of individuals (184) out of the total population between 25 and 64 years of age (248) are in the labor force, with 1.6% or 3 of them being unemployed. The group with the highest labor force participation rate are those with the educational attainment of bachelor's degree or higher, with 100.0% or 15 individuals in the labor force. Within the labor force, individuals with less than high school education have the highest percentage of unemployment, with 8.0% or 2 of them being unemployed.
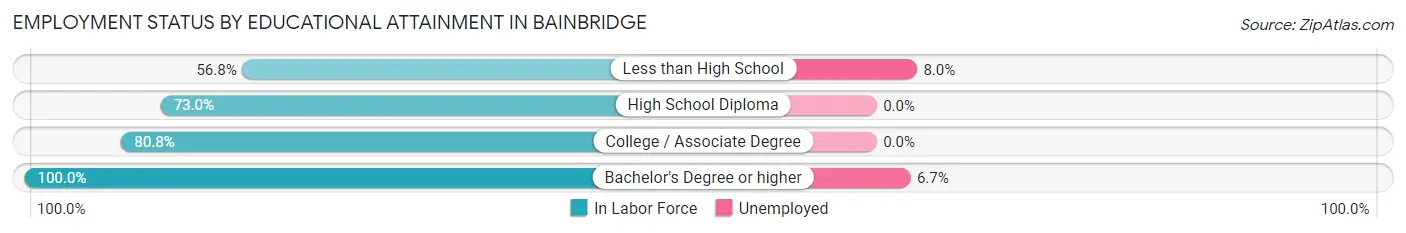
| Educational Attainment | In Labor Force | Unemployed |
| Less than High School | 25 (56.8%) | 4 (8.0%) |
| High School Diploma | 81 (73.0%) | 0 (0.0%) |
| College / Associate Degree | 63 (80.8%) | 0 (0.0%) |
| Bachelor's Degree or higher | 15 (100.0%) | 1 (6.7%) |
| Total | 184 (74.2%) | 4 (1.6%) |
Employment Occupations by Sex in Bainbridge
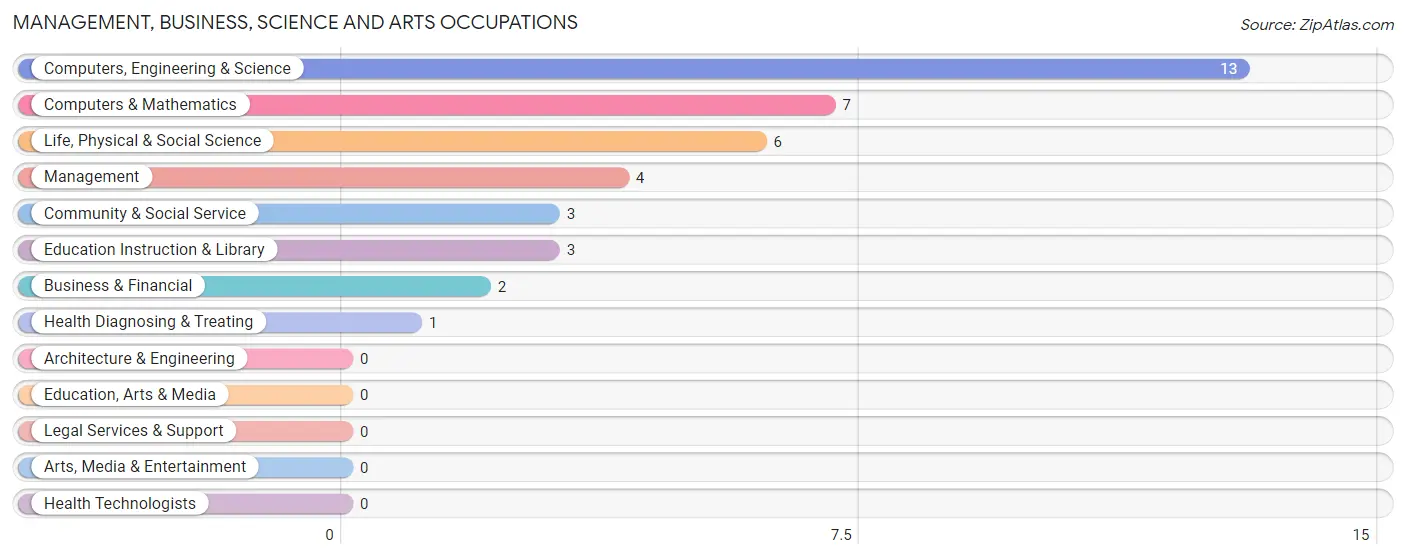
Management, Business, Science and Arts Occupations
The most common Management, Business, Science and Arts occupations in Bainbridge are Computers, Engineering & Science (13 | 4.9%), Computers & Mathematics (7 | 2.6%), Life, Physical & Social Science (6 | 2.3%), Management (4 | 1.5%), and Community & Social Service (3 | 1.1%).
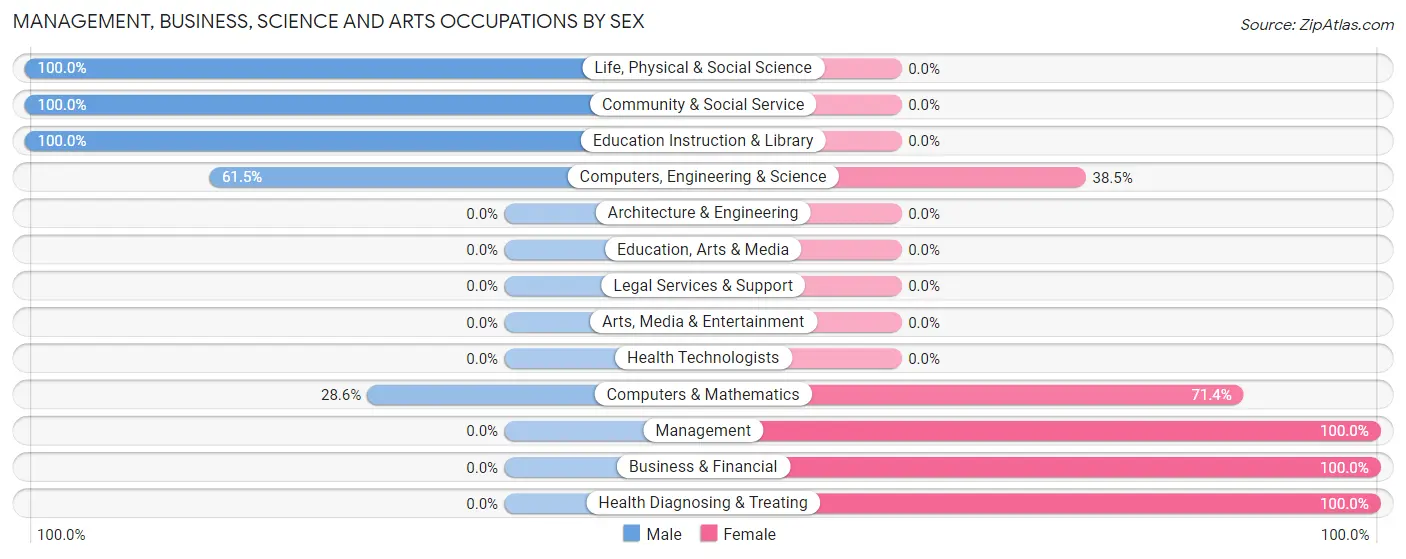
Management, Business, Science and Arts Occupations by Sex
Within the Management, Business, Science and Arts occupations in Bainbridge, the most male-oriented occupations are Life, Physical & Social Science (100.0%), Community & Social Service (100.0%), and Education Instruction & Library (100.0%), while the most female-oriented occupations are Management (100.0%), Business & Financial (100.0%), and Health Diagnosing & Treating (100.0%).
| Occupation | Male | Female |
| Management | 0 (0.0%) | 4 (100.0%) |
| Business & Financial | 0 (0.0%) | 2 (100.0%) |
| Computers, Engineering & Science | 8 (61.5%) | 5 (38.5%) |
| Computers & Mathematics | 2 (28.6%) | 5 (71.4%) |
| Architecture & Engineering | 0 (0.0%) | 0 (0.0%) |
| Life, Physical & Social Science | 6 (100.0%) | 0 (0.0%) |
| Community & Social Service | 3 (100.0%) | 0 (0.0%) |
| Education, Arts & Media | 0 (0.0%) | 0 (0.0%) |
| Legal Services & Support | 0 (0.0%) | 0 (0.0%) |
| Education Instruction & Library | 3 (100.0%) | 0 (0.0%) |
| Arts, Media & Entertainment | 0 (0.0%) | 0 (0.0%) |
| Health Diagnosing & Treating | 0 (0.0%) | 1 (100.0%) |
| Health Technologists | 0 (0.0%) | 0 (0.0%) |
| Total (Category) | 11 (47.8%) | 12 (52.2%) |
| Total (Overall) | 178 (67.4%) | 86 (32.6%) |
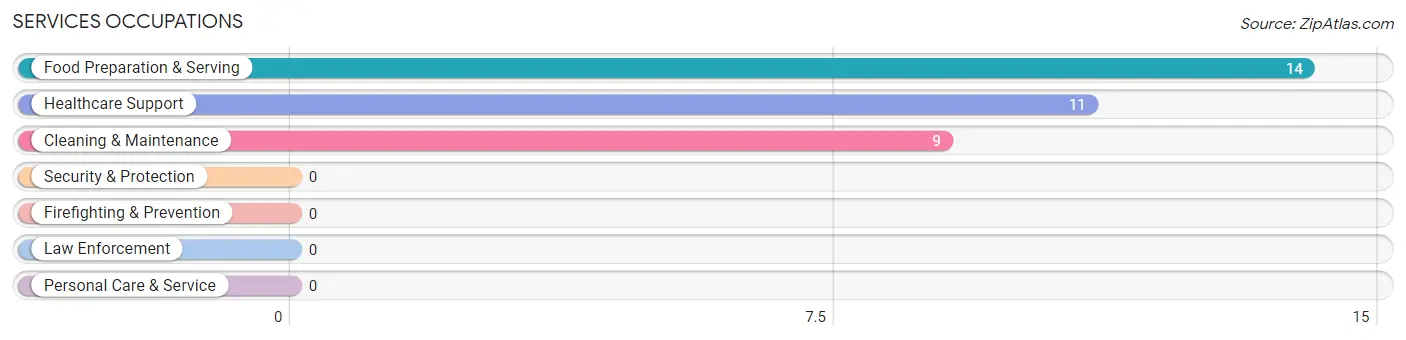
Services Occupations
The most common Services occupations in Bainbridge are Food Preparation & Serving (14 | 5.3%), Healthcare Support (11 | 4.2%), and Cleaning & Maintenance (9 | 3.4%).
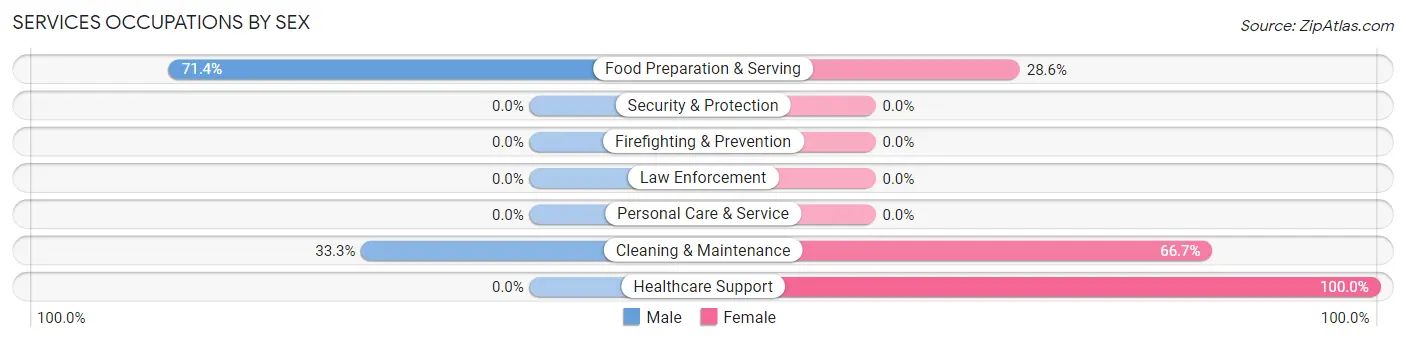
Services Occupations by Sex
Within the Services occupations in Bainbridge, the most male-oriented occupations are Food Preparation & Serving (71.4%), and Cleaning & Maintenance (33.3%), while the most female-oriented occupations are Healthcare Support (100.0%), Cleaning & Maintenance (66.7%), and Food Preparation & Serving (28.6%).
| Occupation | Male | Female |
| Healthcare Support | 0 (0.0%) | 11 (100.0%) |
| Security & Protection | 0 (0.0%) | 0 (0.0%) |
| Firefighting & Prevention | 0 (0.0%) | 0 (0.0%) |
| Law Enforcement | 0 (0.0%) | 0 (0.0%) |
| Food Preparation & Serving | 10 (71.4%) | 4 (28.6%) |
| Cleaning & Maintenance | 3 (33.3%) | 6 (66.7%) |
| Personal Care & Service | 0 (0.0%) | 0 (0.0%) |
| Total (Category) | 13 (38.2%) | 21 (61.8%) |
| Total (Overall) | 178 (67.4%) | 86 (32.6%) |
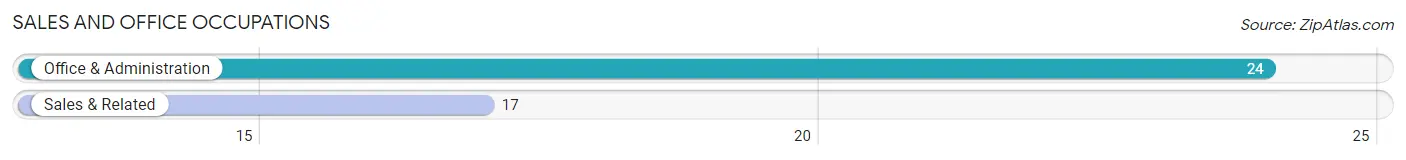
Sales and Office Occupations
The most common Sales and Office occupations in Bainbridge are Office & Administration (24 | 9.1%), and Sales & Related (17 | 6.4%).
Sales and Office Occupations by Sex
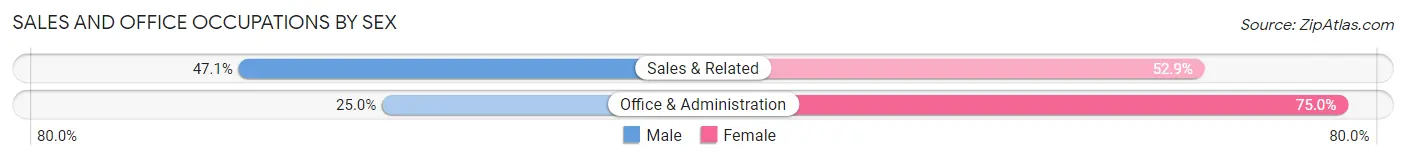
| Occupation | Male | Female |
| Sales & Related | 8 (47.1%) | 9 (52.9%) |
| Office & Administration | 6 (25.0%) | 18 (75.0%) |
| Total (Category) | 14 (34.2%) | 27 (65.8%) |
| Total (Overall) | 178 (67.4%) | 86 (32.6%) |
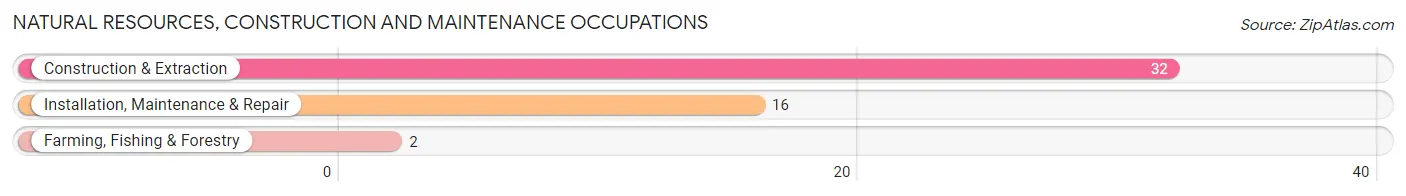
Natural Resources, Construction and Maintenance Occupations
The most common Natural Resources, Construction and Maintenance occupations in Bainbridge are Construction & Extraction (32 | 12.1%), Installation, Maintenance & Repair (16 | 6.1%), and Farming, Fishing & Forestry (2 | 0.8%).
Natural Resources, Construction and Maintenance Occupations by Sex
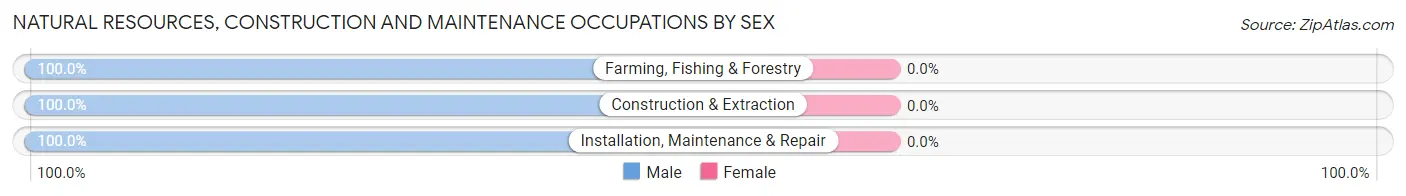
| Occupation | Male | Female |
| Farming, Fishing & Forestry | 2 (100.0%) | 0 (0.0%) |
| Construction & Extraction | 32 (100.0%) | 0 (0.0%) |
| Installation, Maintenance & Repair | 16 (100.0%) | 0 (0.0%) |
| Total (Category) | 50 (100.0%) | 0 (0.0%) |
| Total (Overall) | 178 (67.4%) | 86 (32.6%) |
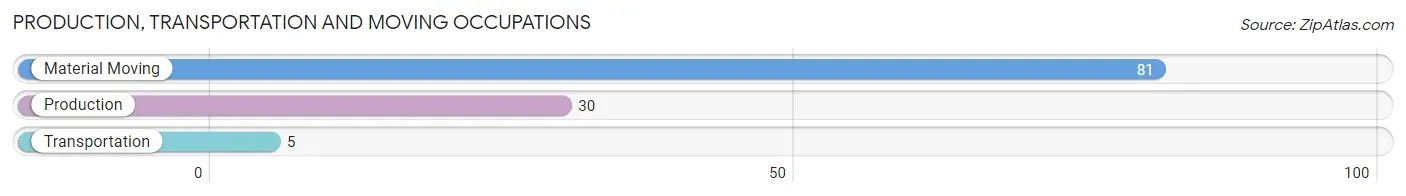
Production, Transportation and Moving Occupations
The most common Production, Transportation and Moving occupations in Bainbridge are Material Moving (81 | 30.7%), Production (30 | 11.4%), and Transportation (5 | 1.9%).
Production, Transportation and Moving Occupations by Sex
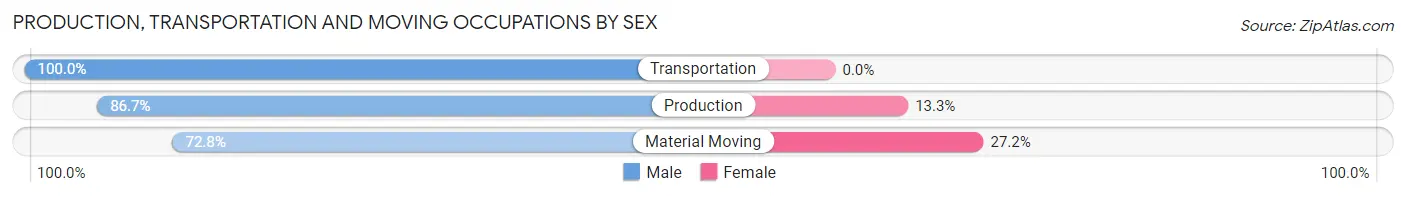
| Occupation | Male | Female |
| Production | 26 (86.7%) | 4 (13.3%) |
| Transportation | 5 (100.0%) | 0 (0.0%) |
| Material Moving | 59 (72.8%) | 22 (27.2%) |
| Total (Category) | 90 (77.6%) | 26 (22.4%) |
| Total (Overall) | 178 (67.4%) | 86 (32.6%) |
Employment Industries by Sex in Bainbridge
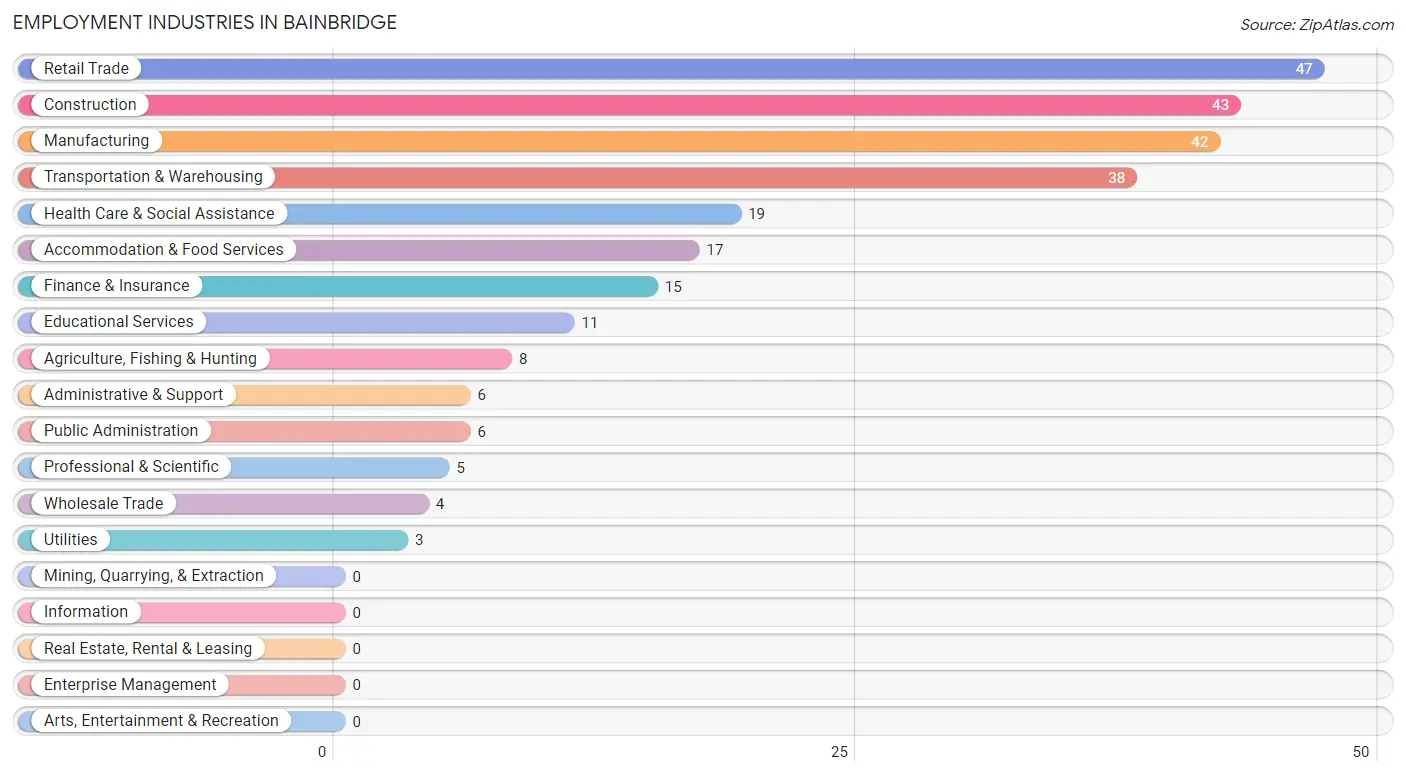
Employment Industries in Bainbridge
The major employment industries in Bainbridge include Retail Trade (47 | 17.8%), Construction (43 | 16.3%), Manufacturing (42 | 15.9%), Transportation & Warehousing (38 | 14.4%), and Health Care & Social Assistance (19 | 7.2%).
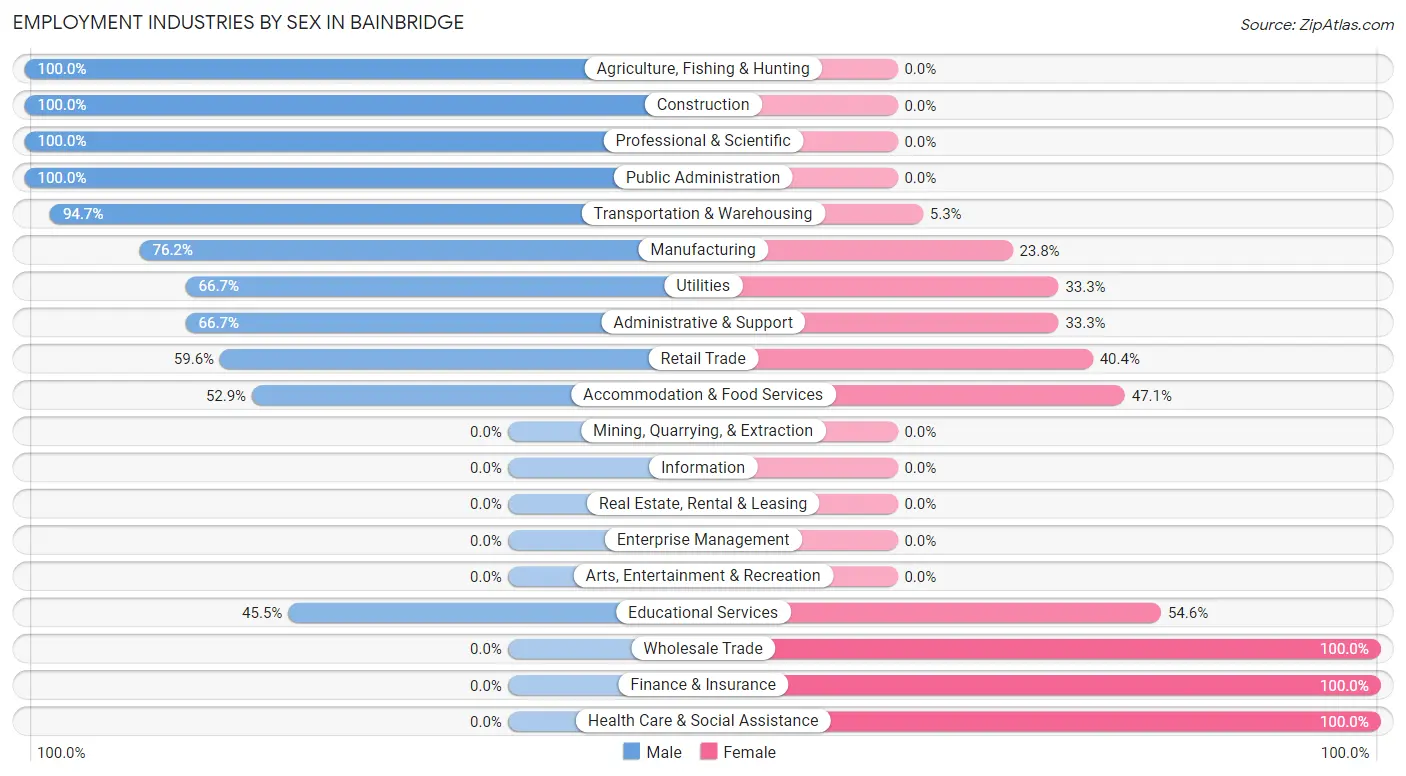
Employment Industries by Sex in Bainbridge
The Bainbridge industries that see more men than women are Agriculture, Fishing & Hunting (100.0%), Construction (100.0%), and Professional & Scientific (100.0%), whereas the industries that tend to have a higher number of women are Wholesale Trade (100.0%), Finance & Insurance (100.0%), and Health Care & Social Assistance (100.0%).
| Industry | Male | Female |
| Agriculture, Fishing & Hunting | 8 (100.0%) | 0 (0.0%) |
| Mining, Quarrying, & Extraction | 0 (0.0%) | 0 (0.0%) |
| Construction | 43 (100.0%) | 0 (0.0%) |
| Manufacturing | 32 (76.2%) | 10 (23.8%) |
| Wholesale Trade | 0 (0.0%) | 4 (100.0%) |
| Retail Trade | 28 (59.6%) | 19 (40.4%) |
| Transportation & Warehousing | 36 (94.7%) | 2 (5.3%) |
| Utilities | 2 (66.7%) | 1 (33.3%) |
| Information | 0 (0.0%) | 0 (0.0%) |
| Finance & Insurance | 0 (0.0%) | 15 (100.0%) |
| Real Estate, Rental & Leasing | 0 (0.0%) | 0 (0.0%) |
| Professional & Scientific | 5 (100.0%) | 0 (0.0%) |
| Enterprise Management | 0 (0.0%) | 0 (0.0%) |
| Administrative & Support | 4 (66.7%) | 2 (33.3%) |
| Educational Services | 5 (45.5%) | 6 (54.5%) |
| Health Care & Social Assistance | 0 (0.0%) | 19 (100.0%) |
| Arts, Entertainment & Recreation | 0 (0.0%) | 0 (0.0%) |
| Accommodation & Food Services | 9 (52.9%) | 8 (47.1%) |
| Public Administration | 6 (100.0%) | 0 (0.0%) |
| Total | 178 (67.4%) | 86 (32.6%) |
Education in Bainbridge
School Enrollment in Bainbridge
The most common levels of schooling among the 128 students in Bainbridge are middle school (47 | 36.7%), high school (31 | 24.2%), and elementary school (28 | 21.9%).
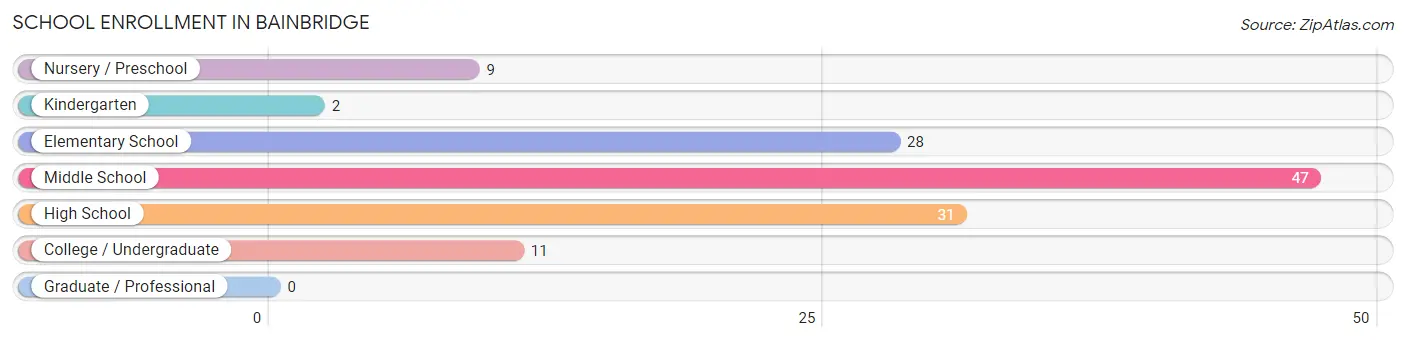
| School Level | # Students | % Students |
| Nursery / Preschool | 9 | 7.0% |
| Kindergarten | 2 | 1.6% |
| Elementary School | 28 | 21.9% |
| Middle School | 47 | 36.7% |
| High School | 31 | 24.2% |
| College / Undergraduate | 11 | 8.6% |
| Graduate / Professional | 0 | 0.0% |
| Total | 128 | 100.0% |
School Enrollment by Age by Funding Source in Bainbridge
Out of a total of 128 students who are enrolled in schools in Bainbridge, 1 (0.8%) attend a private institution, while the remaining 127 (99.2%) are enrolled in public schools. The age group of 5 to 9 year old has the highest likelihood of being enrolled in private schools, with 1 (3.3% in the age bracket) enrolled. Conversely, the age group of 3 to 4 year olds has the lowest likelihood of being enrolled in a private school, with 9 (100.0% in the age bracket) attending a public institution.
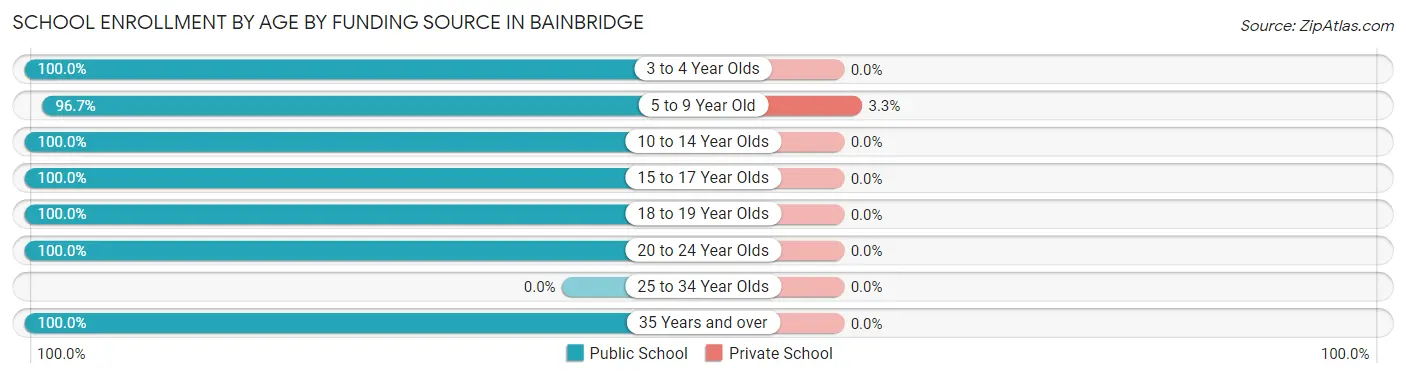
| Age Bracket | Public School | Private School |
| 3 to 4 Year Olds | 9 (100.0%) | 0 (0.0%) |
| 5 to 9 Year Old | 29 (96.7%) | 1 (3.3%) |
| 10 to 14 Year Olds | 48 (100.0%) | 0 (0.0%) |
| 15 to 17 Year Olds | 24 (100.0%) | 0 (0.0%) |
| 18 to 19 Year Olds | 4 (100.0%) | 0 (0.0%) |
| 20 to 24 Year Olds | 4 (100.0%) | 0 (0.0%) |
| 25 to 34 Year Olds | 0 (0.0%) | 0 (0.0%) |
| 35 Years and over | 9 (100.0%) | 0 (0.0%) |
| Total | 127 (99.2%) | 1 (0.8%) |
Educational Attainment by Field of Study in Bainbridge
Computers & mathematics (9 | 47.4%), science & technology (4 | 21.0%), bio, nature & agricultural (2 | 10.5%), engineering (2 | 10.5%), and education (1 | 5.3%) are the most common fields of study among 19 individuals in Bainbridge who have obtained a bachelor's degree or higher.
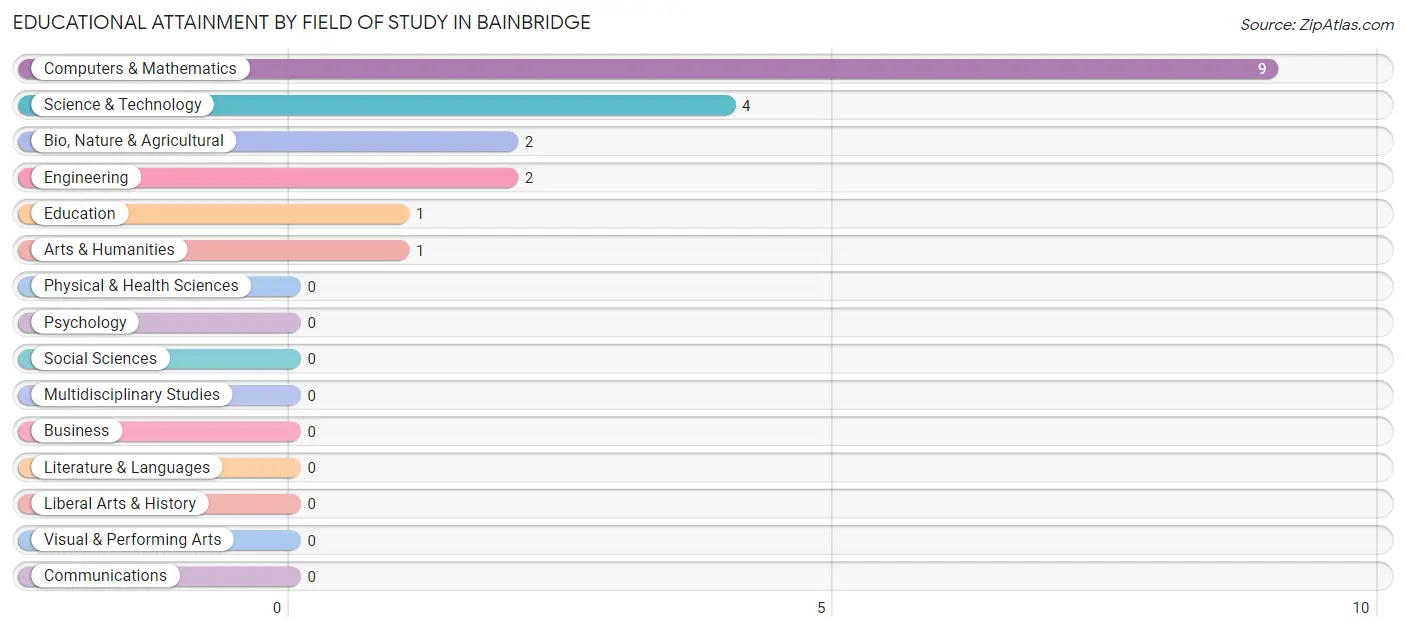
| Field of Study | # Graduates | % Graduates |
| Computers & Mathematics | 9 | 47.4% |
| Bio, Nature & Agricultural | 2 | 10.5% |
| Physical & Health Sciences | 0 | 0.0% |
| Psychology | 0 | 0.0% |
| Social Sciences | 0 | 0.0% |
| Engineering | 2 | 10.5% |
| Multidisciplinary Studies | 0 | 0.0% |
| Science & Technology | 4 | 21.0% |
| Business | 0 | 0.0% |
| Education | 1 | 5.3% |
| Literature & Languages | 0 | 0.0% |
| Liberal Arts & History | 0 | 0.0% |
| Visual & Performing Arts | 0 | 0.0% |
| Communications | 0 | 0.0% |
| Arts & Humanities | 1 | 5.3% |
| Total | 19 | 100.0% |
Transportation & Commute in Bainbridge
Vehicle Availability by Sex in Bainbridge
The most prevalent vehicle ownership categories in Bainbridge are males with 2 vehicles (79, accounting for 46.5%) and females with 2 vehicles (23, making up 94.1%).
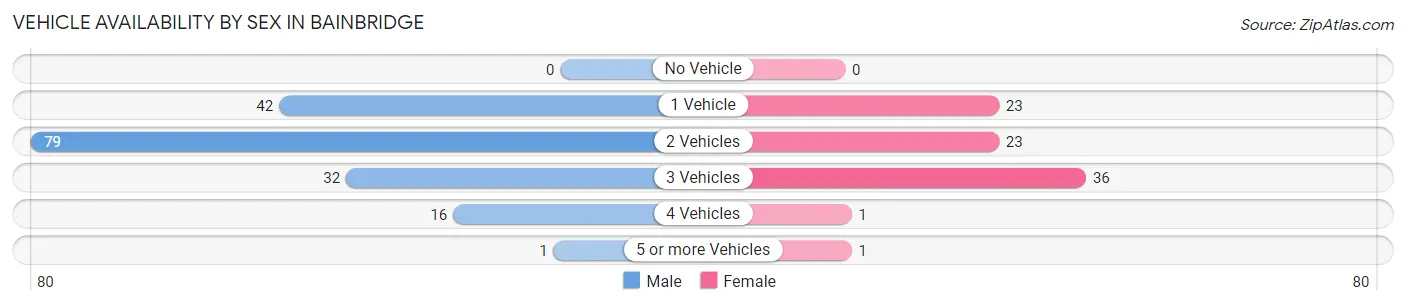
| Vehicles Available | Male | Female |
| No Vehicle | 0 (0.0%) | 0 (0.0%) |
| 1 Vehicle | 42 (24.7%) | 23 (27.4%) |
| 2 Vehicles | 79 (46.5%) | 23 (27.4%) |
| 3 Vehicles | 32 (18.8%) | 36 (42.9%) |
| 4 Vehicles | 16 (9.4%) | 1 (1.2%) |
| 5 or more Vehicles | 1 (0.6%) | 1 (1.2%) |
| Total | 170 (100.0%) | 84 (100.0%) |
Commute Time in Bainbridge
The most frequently occuring commute durations in Bainbridge are 20 to 24 minutes (52 commuters, 21.5%), 35 to 39 minutes (37 commuters, 15.3%), and 30 to 34 minutes (31 commuters, 12.8%).
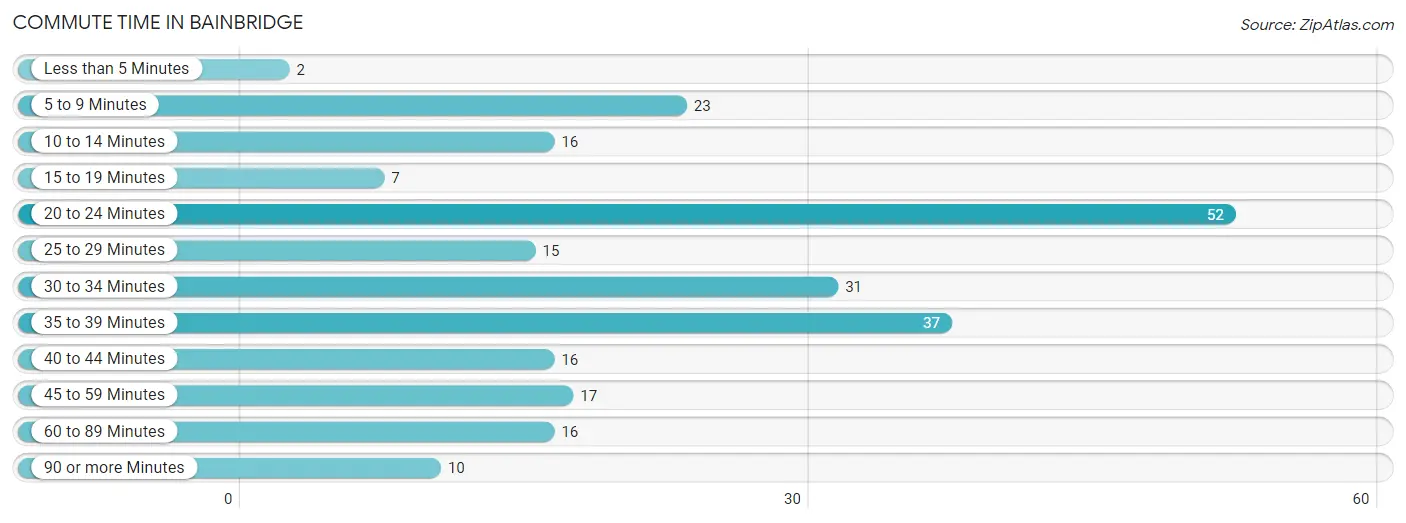
| Commute Time | # Commuters | % Commuters |
| Less than 5 Minutes | 2 | 0.8% |
| 5 to 9 Minutes | 23 | 9.5% |
| 10 to 14 Minutes | 16 | 6.6% |
| 15 to 19 Minutes | 7 | 2.9% |
| 20 to 24 Minutes | 52 | 21.5% |
| 25 to 29 Minutes | 15 | 6.2% |
| 30 to 34 Minutes | 31 | 12.8% |
| 35 to 39 Minutes | 37 | 15.3% |
| 40 to 44 Minutes | 16 | 6.6% |
| 45 to 59 Minutes | 17 | 7.0% |
| 60 to 89 Minutes | 16 | 6.6% |
| 90 or more Minutes | 10 | 4.1% |
Commute Time by Sex in Bainbridge
The most common commute times in Bainbridge are 20 to 24 minutes (33 commuters, 19.4%) for males and 20 to 24 minutes (19 commuters, 26.4%) for females.
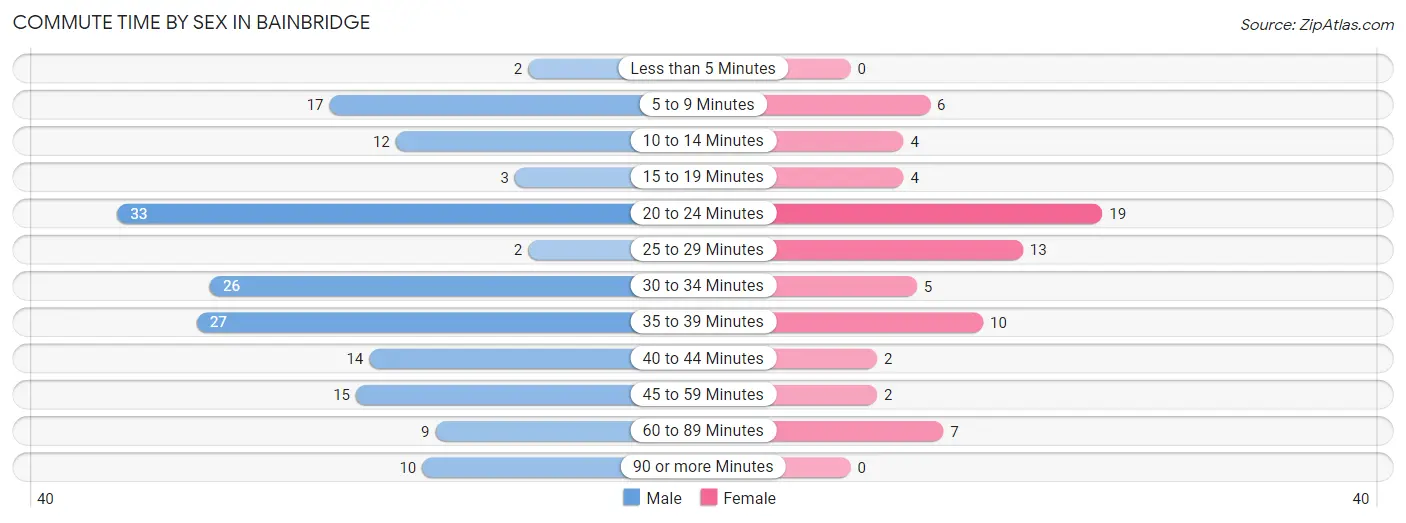
| Commute Time | Male | Female |
| Less than 5 Minutes | 2 (1.2%) | 0 (0.0%) |
| 5 to 9 Minutes | 17 (10.0%) | 6 (8.3%) |
| 10 to 14 Minutes | 12 (7.1%) | 4 (5.6%) |
| 15 to 19 Minutes | 3 (1.8%) | 4 (5.6%) |
| 20 to 24 Minutes | 33 (19.4%) | 19 (26.4%) |
| 25 to 29 Minutes | 2 (1.2%) | 13 (18.1%) |
| 30 to 34 Minutes | 26 (15.3%) | 5 (6.9%) |
| 35 to 39 Minutes | 27 (15.9%) | 10 (13.9%) |
| 40 to 44 Minutes | 14 (8.2%) | 2 (2.8%) |
| 45 to 59 Minutes | 15 (8.8%) | 2 (2.8%) |
| 60 to 89 Minutes | 9 (5.3%) | 7 (9.7%) |
| 90 or more Minutes | 10 (5.9%) | 0 (0.0%) |
Time of Departure to Work by Sex in Bainbridge
The most frequent times of departure to work in Bainbridge are 6:00 AM to 6:29 AM (35, 20.6%) for males and 7:30 AM to 7:59 AM (13, 18.1%) for females.
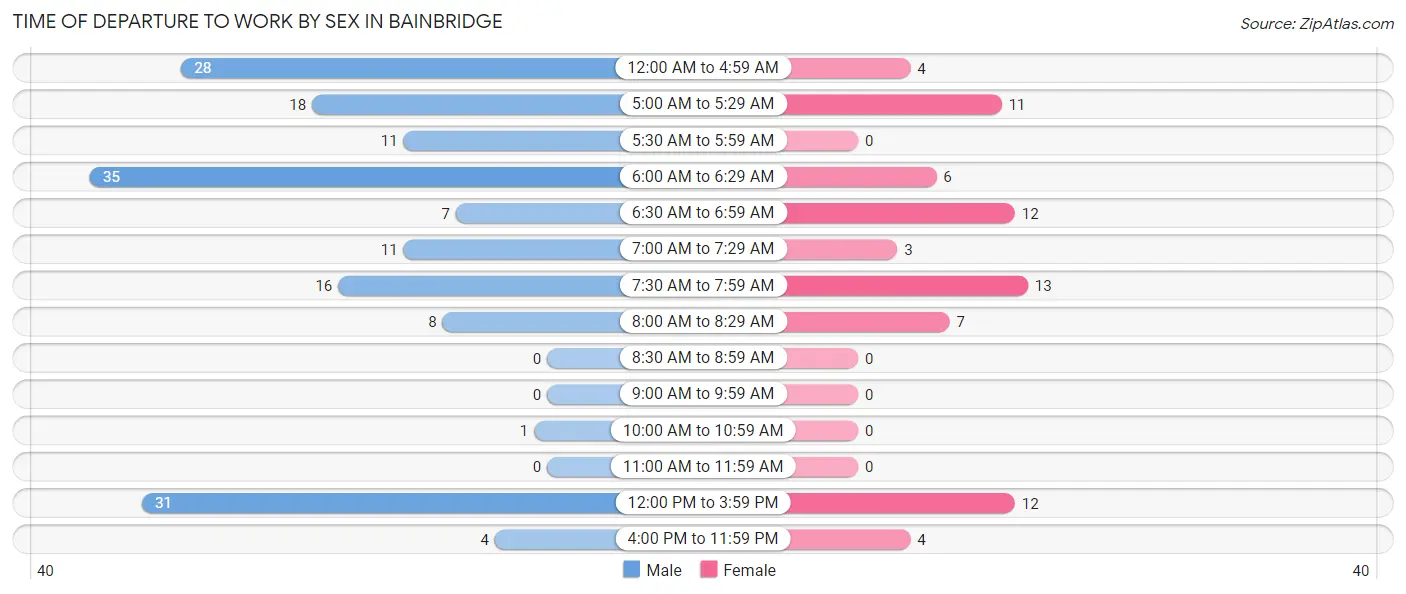
| Time of Departure | Male | Female |
| 12:00 AM to 4:59 AM | 28 (16.5%) | 4 (5.6%) |
| 5:00 AM to 5:29 AM | 18 (10.6%) | 11 (15.3%) |
| 5:30 AM to 5:59 AM | 11 (6.5%) | 0 (0.0%) |
| 6:00 AM to 6:29 AM | 35 (20.6%) | 6 (8.3%) |
| 6:30 AM to 6:59 AM | 7 (4.1%) | 12 (16.7%) |
| 7:00 AM to 7:29 AM | 11 (6.5%) | 3 (4.2%) |
| 7:30 AM to 7:59 AM | 16 (9.4%) | 13 (18.1%) |
| 8:00 AM to 8:29 AM | 8 (4.7%) | 7 (9.7%) |
| 8:30 AM to 8:59 AM | 0 (0.0%) | 0 (0.0%) |
| 9:00 AM to 9:59 AM | 0 (0.0%) | 0 (0.0%) |
| 10:00 AM to 10:59 AM | 1 (0.6%) | 0 (0.0%) |
| 11:00 AM to 11:59 AM | 0 (0.0%) | 0 (0.0%) |
| 12:00 PM to 3:59 PM | 31 (18.2%) | 12 (16.7%) |
| 4:00 PM to 11:59 PM | 4 (2.4%) | 4 (5.6%) |
| Total | 170 (100.0%) | 72 (100.0%) |
Housing Occupancy in Bainbridge
Occupancy by Ownership in Bainbridge
Of the total 275 dwellings in Bainbridge, owner-occupied units account for 183 (66.5%), while renter-occupied units make up 92 (33.5%).
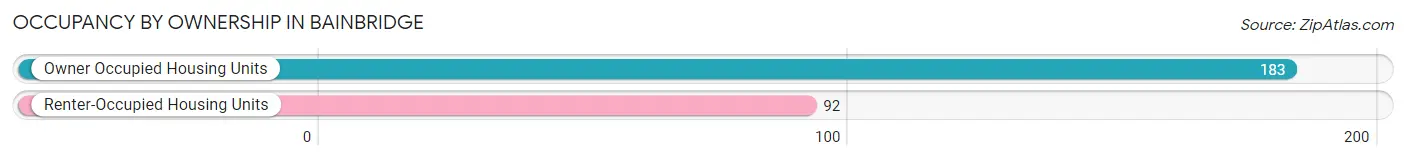
| Occupancy | # Housing Units | % Housing Units |
| Owner Occupied Housing Units | 183 | 66.5% |
| Renter-Occupied Housing Units | 92 | 33.5% |
| Total Occupied Housing Units | 275 | 100.0% |
Occupancy by Household Size in Bainbridge
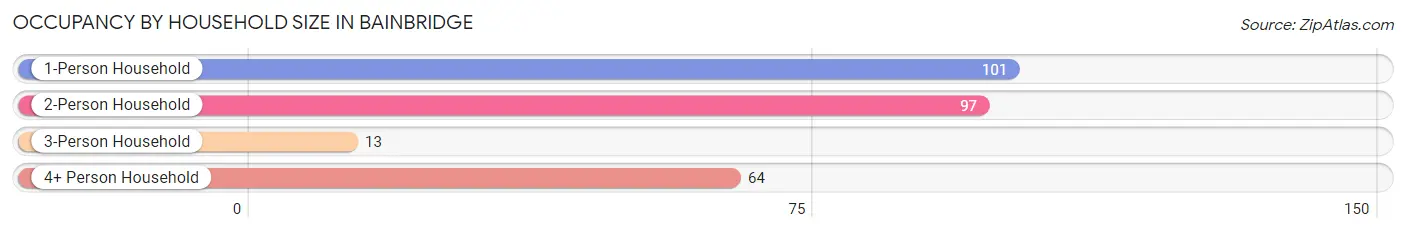
| Household Size | # Housing Units | % Housing Units |
| 1-Person Household | 101 | 36.7% |
| 2-Person Household | 97 | 35.3% |
| 3-Person Household | 13 | 4.7% |
| 4+ Person Household | 64 | 23.3% |
| Total Housing Units | 275 | 100.0% |
Occupancy by Ownership by Household Size in Bainbridge
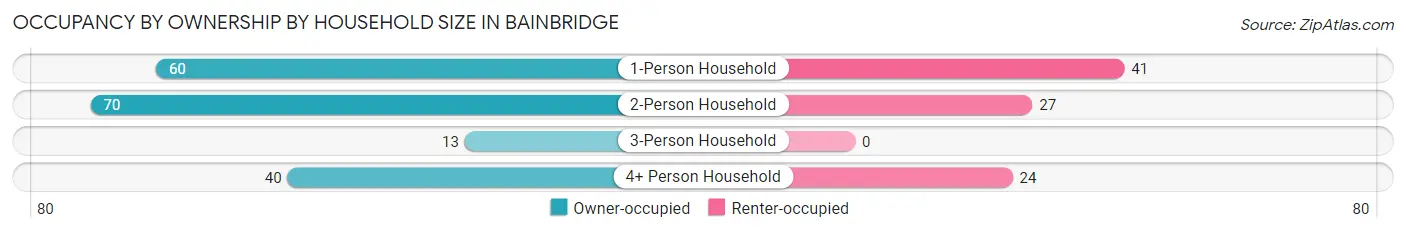
| Household Size | Owner-occupied | Renter-occupied |
| 1-Person Household | 60 (59.4%) | 41 (40.6%) |
| 2-Person Household | 70 (72.2%) | 27 (27.8%) |
| 3-Person Household | 13 (100.0%) | 0 (0.0%) |
| 4+ Person Household | 40 (62.5%) | 24 (37.5%) |
| Total Housing Units | 183 (66.5%) | 92 (33.5%) |
Occupancy by Educational Attainment in Bainbridge
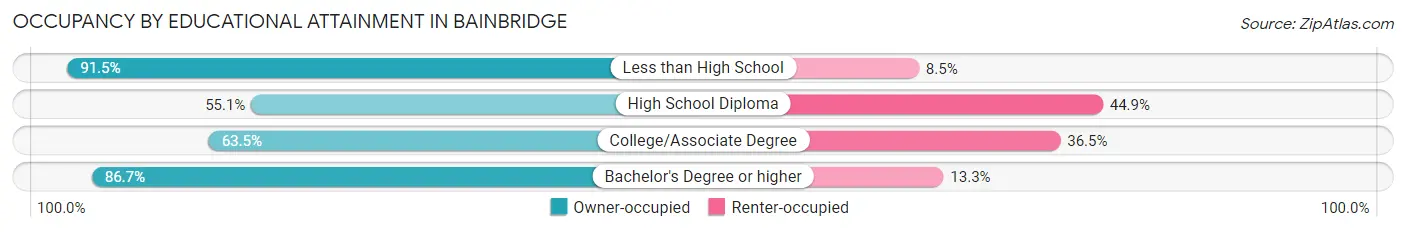
| Household Size | Owner-occupied | Renter-occupied |
| Less than High School | 54 (91.5%) | 5 (8.5%) |
| High School Diploma | 76 (55.1%) | 62 (44.9%) |
| College/Associate Degree | 40 (63.5%) | 23 (36.5%) |
| Bachelor's Degree or higher | 13 (86.7%) | 2 (13.3%) |
Occupancy by Age of Householder in Bainbridge
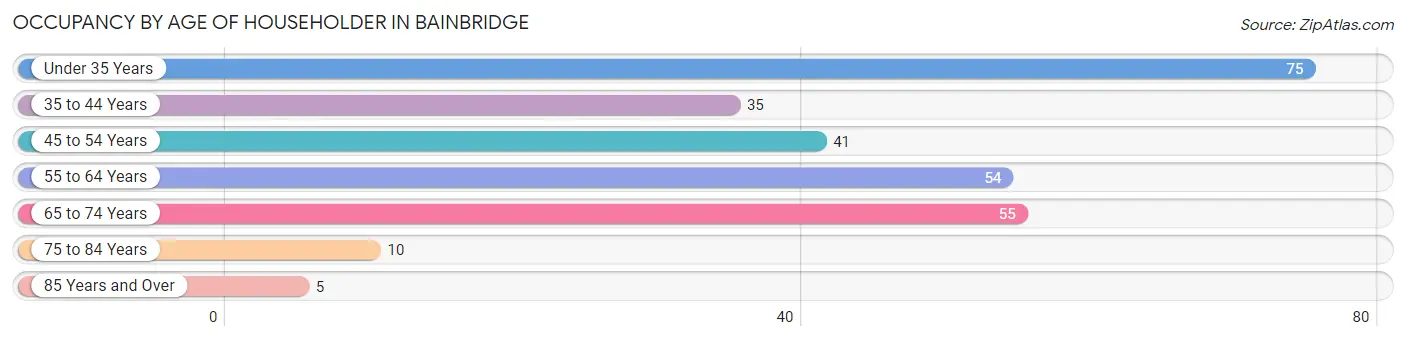
| Age Bracket | # Households | % Households |
| Under 35 Years | 75 | 27.3% |
| 35 to 44 Years | 35 | 12.7% |
| 45 to 54 Years | 41 | 14.9% |
| 55 to 64 Years | 54 | 19.6% |
| 65 to 74 Years | 55 | 20.0% |
| 75 to 84 Years | 10 | 3.6% |
| 85 Years and Over | 5 | 1.8% |
| Total | 275 | 100.0% |
Housing Finances in Bainbridge
Median Income by Occupancy in Bainbridge
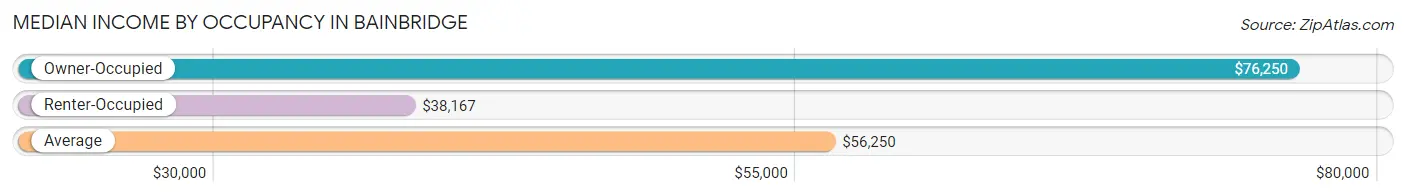
| Occupancy Type | # Households | Median Income |
| Owner-Occupied | 183 (66.5%) | $76,250 |
| Renter-Occupied | 92 (33.5%) | $38,167 |
| Average | 275 (100.0%) | $56,250 |
Occupancy by Householder Income Bracket in Bainbridge
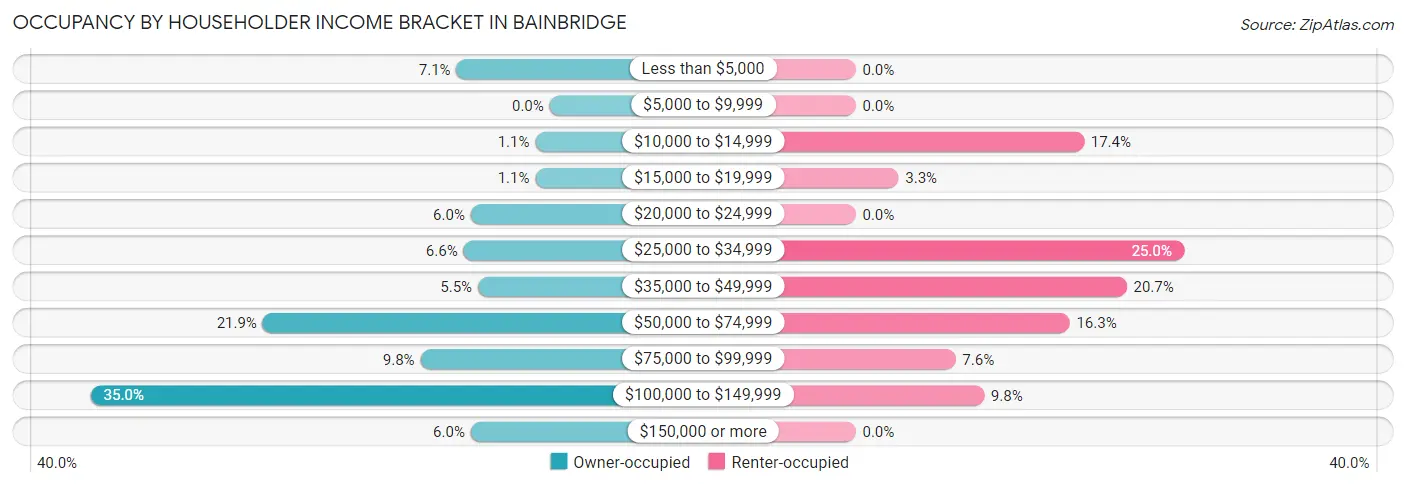
| Income Bracket | Owner-occupied | Renter-occupied |
| Less than $5,000 | 13 (7.1%) | 0 (0.0%) |
| $5,000 to $9,999 | 0 (0.0%) | 0 (0.0%) |
| $10,000 to $14,999 | 2 (1.1%) | 16 (17.4%) |
| $15,000 to $19,999 | 2 (1.1%) | 3 (3.3%) |
| $20,000 to $24,999 | 11 (6.0%) | 0 (0.0%) |
| $25,000 to $34,999 | 12 (6.6%) | 23 (25.0%) |
| $35,000 to $49,999 | 10 (5.5%) | 19 (20.6%) |
| $50,000 to $74,999 | 40 (21.9%) | 15 (16.3%) |
| $75,000 to $99,999 | 18 (9.8%) | 7 (7.6%) |
| $100,000 to $149,999 | 64 (35.0%) | 9 (9.8%) |
| $150,000 or more | 11 (6.0%) | 0 (0.0%) |
| Total | 183 (100.0%) | 92 (100.0%) |
Monthly Housing Cost Tiers in Bainbridge
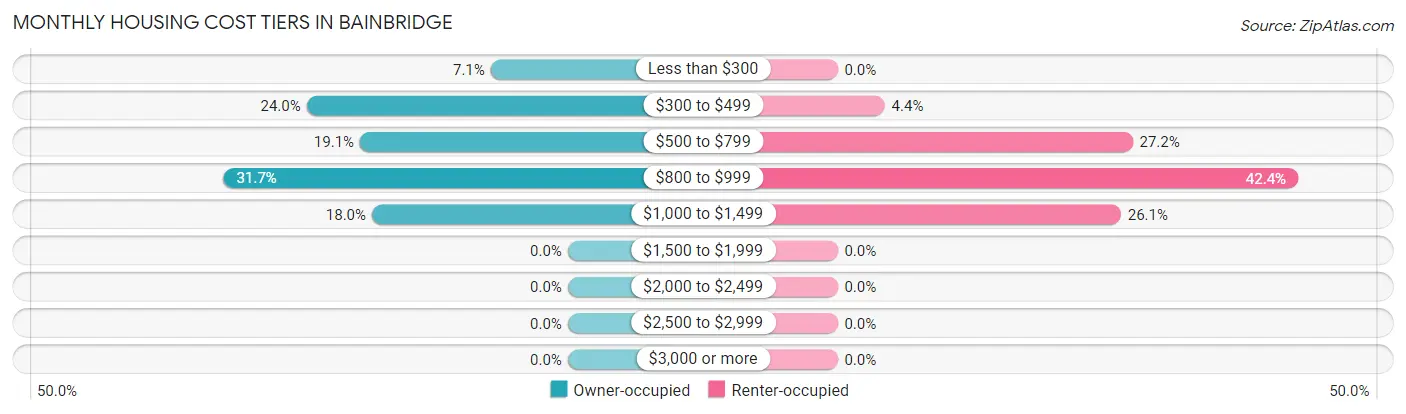
| Monthly Cost | Owner-occupied | Renter-occupied |
| Less than $300 | 13 (7.1%) | 0 (0.0%) |
| $300 to $499 | 44 (24.0%) | 4 (4.3%) |
| $500 to $799 | 35 (19.1%) | 25 (27.2%) |
| $800 to $999 | 58 (31.7%) | 39 (42.4%) |
| $1,000 to $1,499 | 33 (18.0%) | 24 (26.1%) |
| $1,500 to $1,999 | 0 (0.0%) | 0 (0.0%) |
| $2,000 to $2,499 | 0 (0.0%) | 0 (0.0%) |
| $2,500 to $2,999 | 0 (0.0%) | 0 (0.0%) |
| $3,000 or more | 0 (0.0%) | 0 (0.0%) |
| Total | 183 (100.0%) | 92 (100.0%) |
Physical Housing Characteristics in Bainbridge
Housing Structures in Bainbridge
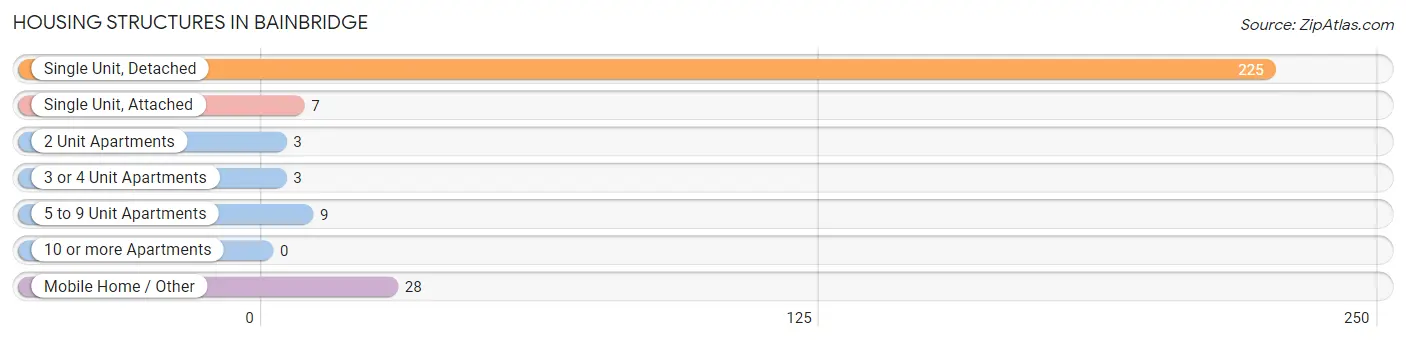
| Structure Type | # Housing Units | % Housing Units |
| Single Unit, Detached | 225 | 81.8% |
| Single Unit, Attached | 7 | 2.5% |
| 2 Unit Apartments | 3 | 1.1% |
| 3 or 4 Unit Apartments | 3 | 1.1% |
| 5 to 9 Unit Apartments | 9 | 3.3% |
| 10 or more Apartments | 0 | 0.0% |
| Mobile Home / Other | 28 | 10.2% |
| Total | 275 | 100.0% |
Housing Structures by Occupancy in Bainbridge
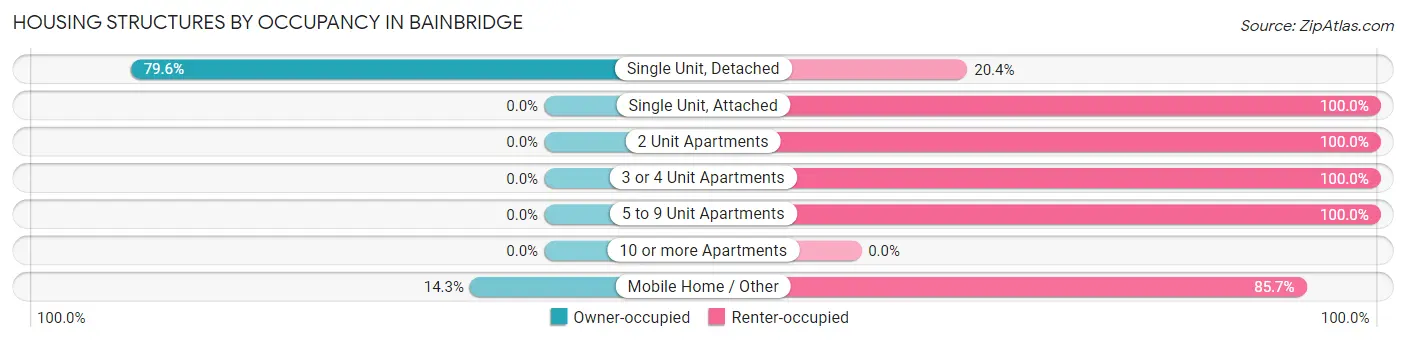
| Structure Type | Owner-occupied | Renter-occupied |
| Single Unit, Detached | 179 (79.6%) | 46 (20.4%) |
| Single Unit, Attached | 0 (0.0%) | 7 (100.0%) |
| 2 Unit Apartments | 0 (0.0%) | 3 (100.0%) |
| 3 or 4 Unit Apartments | 0 (0.0%) | 3 (100.0%) |
| 5 to 9 Unit Apartments | 0 (0.0%) | 9 (100.0%) |
| 10 or more Apartments | 0 (0.0%) | 0 (0.0%) |
| Mobile Home / Other | 4 (14.3%) | 24 (85.7%) |
| Total | 183 (66.5%) | 92 (33.5%) |
Housing Structures by Number of Rooms in Bainbridge
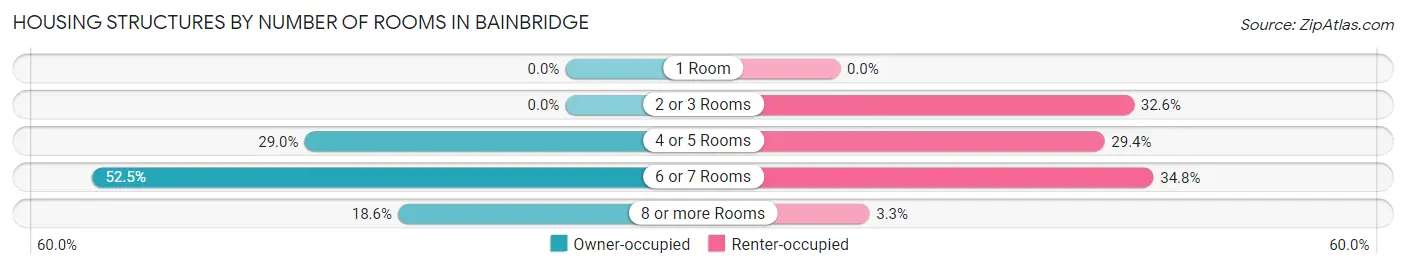
| Number of Rooms | Owner-occupied | Renter-occupied |
| 1 Room | 0 (0.0%) | 0 (0.0%) |
| 2 or 3 Rooms | 0 (0.0%) | 30 (32.6%) |
| 4 or 5 Rooms | 53 (29.0%) | 27 (29.3%) |
| 6 or 7 Rooms | 96 (52.5%) | 32 (34.8%) |
| 8 or more Rooms | 34 (18.6%) | 3 (3.3%) |
| Total | 183 (100.0%) | 92 (100.0%) |
Housing Structure by Heating Type in Bainbridge
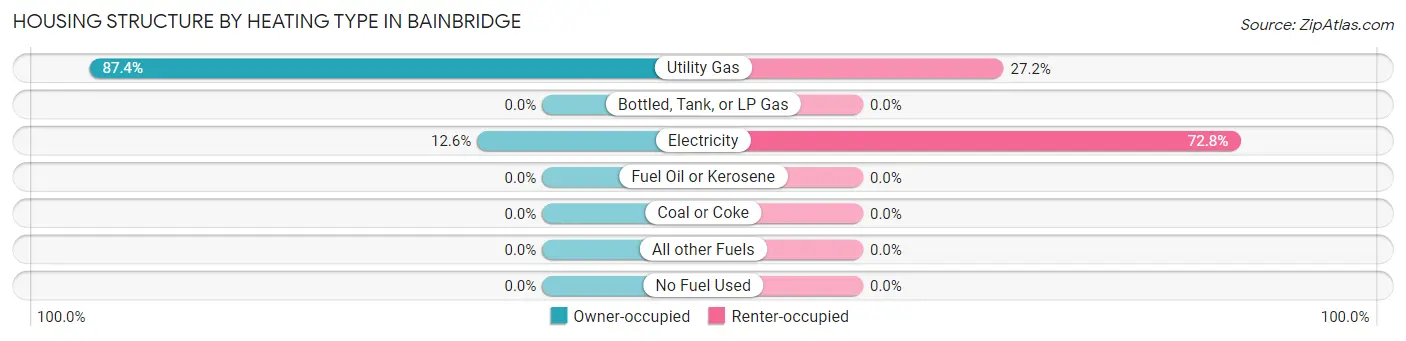
| Heating Type | Owner-occupied | Renter-occupied |
| Utility Gas | 160 (87.4%) | 25 (27.2%) |
| Bottled, Tank, or LP Gas | 0 (0.0%) | 0 (0.0%) |
| Electricity | 23 (12.6%) | 67 (72.8%) |
| Fuel Oil or Kerosene | 0 (0.0%) | 0 (0.0%) |
| Coal or Coke | 0 (0.0%) | 0 (0.0%) |
| All other Fuels | 0 (0.0%) | 0 (0.0%) |
| No Fuel Used | 0 (0.0%) | 0 (0.0%) |
| Total | 183 (100.0%) | 92 (100.0%) |
Household Vehicle Usage in Bainbridge
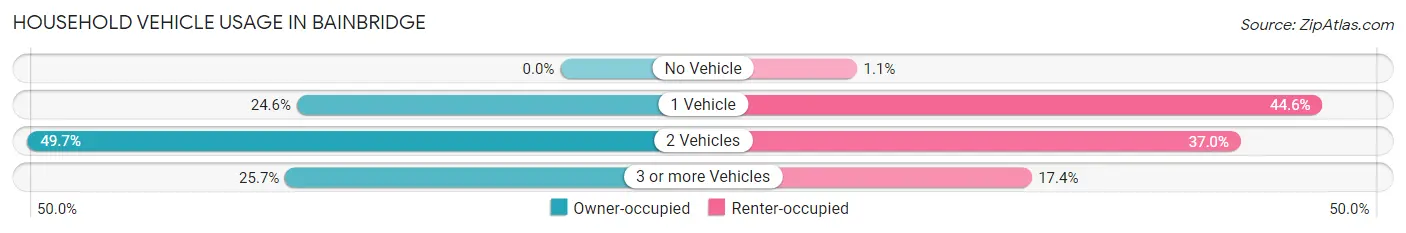
| Vehicles per Household | Owner-occupied | Renter-occupied |
| No Vehicle | 0 (0.0%) | 1 (1.1%) |
| 1 Vehicle | 45 (24.6%) | 41 (44.6%) |
| 2 Vehicles | 91 (49.7%) | 34 (37.0%) |
| 3 or more Vehicles | 47 (25.7%) | 16 (17.4%) |
| Total | 183 (100.0%) | 92 (100.0%) |
Real Estate & Mortgages in Bainbridge
Real Estate and Mortgage Overview in Bainbridge
| Characteristic | Without Mortgage | With Mortgage |
| Housing Units | 68 | 115 |
| Median Property Value | $115,900 | $141,400 |
| Median Household Income | $111,875 | $11 |
| Monthly Housing Costs | $336 | $0 |
| Real Estate Taxes | $393 | $13 |
Property Value by Mortgage Status in Bainbridge
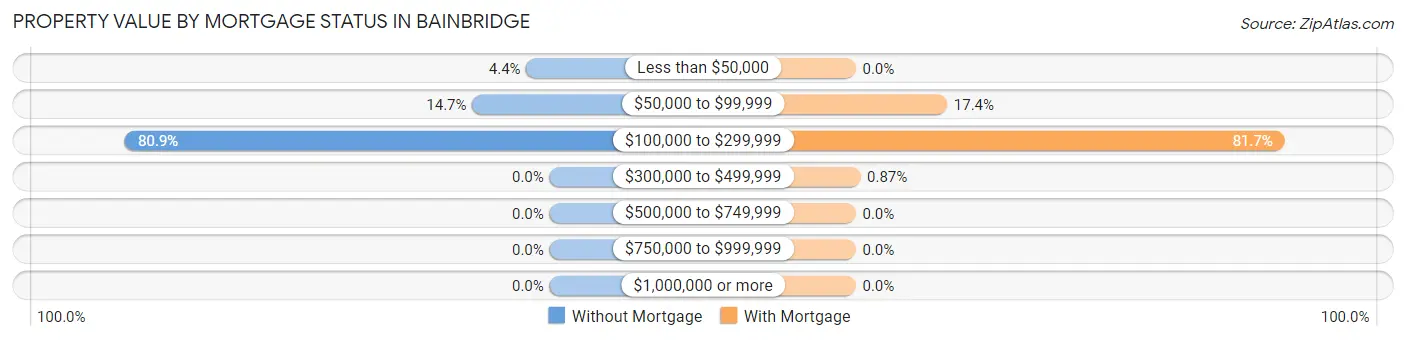
| Property Value | Without Mortgage | With Mortgage |
| Less than $50,000 | 3 (4.4%) | 0 (0.0%) |
| $50,000 to $99,999 | 10 (14.7%) | 20 (17.4%) |
| $100,000 to $299,999 | 55 (80.9%) | 94 (81.7%) |
| $300,000 to $499,999 | 0 (0.0%) | 1 (0.9%) |
| $500,000 to $749,999 | 0 (0.0%) | 0 (0.0%) |
| $750,000 to $999,999 | 0 (0.0%) | 0 (0.0%) |
| $1,000,000 or more | 0 (0.0%) | 0 (0.0%) |
| Total | 68 (100.0%) | 115 (100.0%) |
Household Income by Mortgage Status in Bainbridge
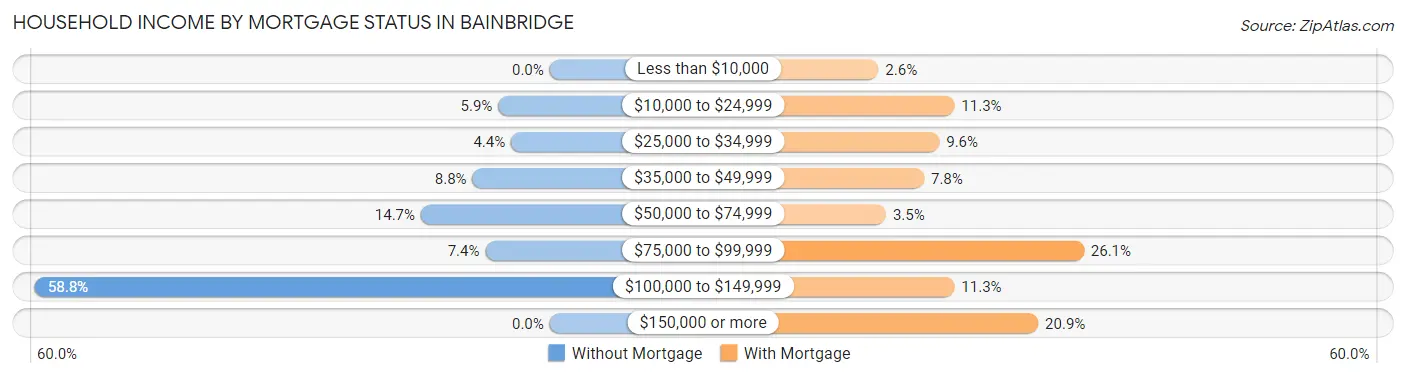
| Household Income | Without Mortgage | With Mortgage |
| Less than $10,000 | 0 (0.0%) | 3 (2.6%) |
| $10,000 to $24,999 | 4 (5.9%) | 13 (11.3%) |
| $25,000 to $34,999 | 3 (4.4%) | 11 (9.6%) |
| $35,000 to $49,999 | 6 (8.8%) | 9 (7.8%) |
| $50,000 to $74,999 | 10 (14.7%) | 4 (3.5%) |
| $75,000 to $99,999 | 5 (7.3%) | 30 (26.1%) |
| $100,000 to $149,999 | 40 (58.8%) | 13 (11.3%) |
| $150,000 or more | 0 (0.0%) | 24 (20.9%) |
| Total | 68 (100.0%) | 115 (100.0%) |
Property Value to Household Income Ratio in Bainbridge
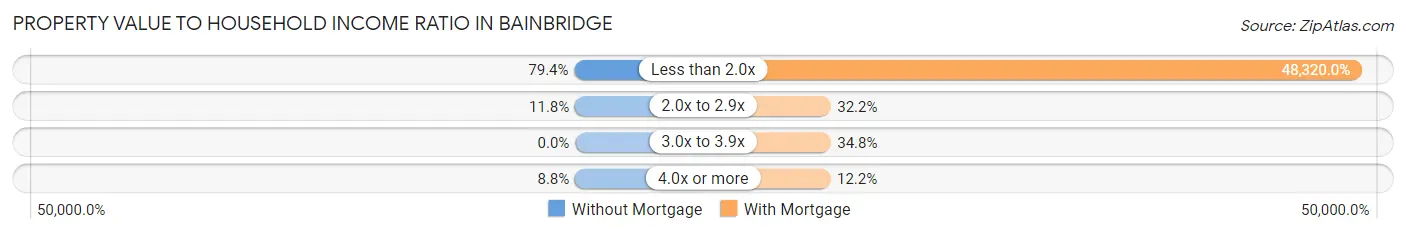
| Value-to-Income Ratio | Without Mortgage | With Mortgage |
| Less than 2.0x | 54 (79.4%) | 55,568 (48,320.0%) |
| 2.0x to 2.9x | 8 (11.8%) | 37 (32.2%) |
| 3.0x to 3.9x | 0 (0.0%) | 40 (34.8%) |
| 4.0x or more | 6 (8.8%) | 14 (12.2%) |
| Total | 68 (100.0%) | 115 (100.0%) |
Real Estate Taxes by Mortgage Status in Bainbridge
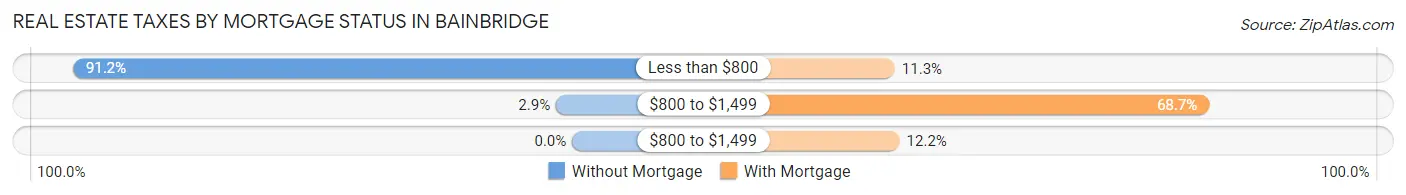
| Property Taxes | Without Mortgage | With Mortgage |
| Less than $800 | 62 (91.2%) | 13 (11.3%) |
| $800 to $1,499 | 2 (2.9%) | 79 (68.7%) |
| $800 to $1,499 | 0 (0.0%) | 14 (12.2%) |
| Total | 68 (100.0%) | 115 (100.0%) |
Health & Disability in Bainbridge
Health Insurance Coverage by Age in Bainbridge
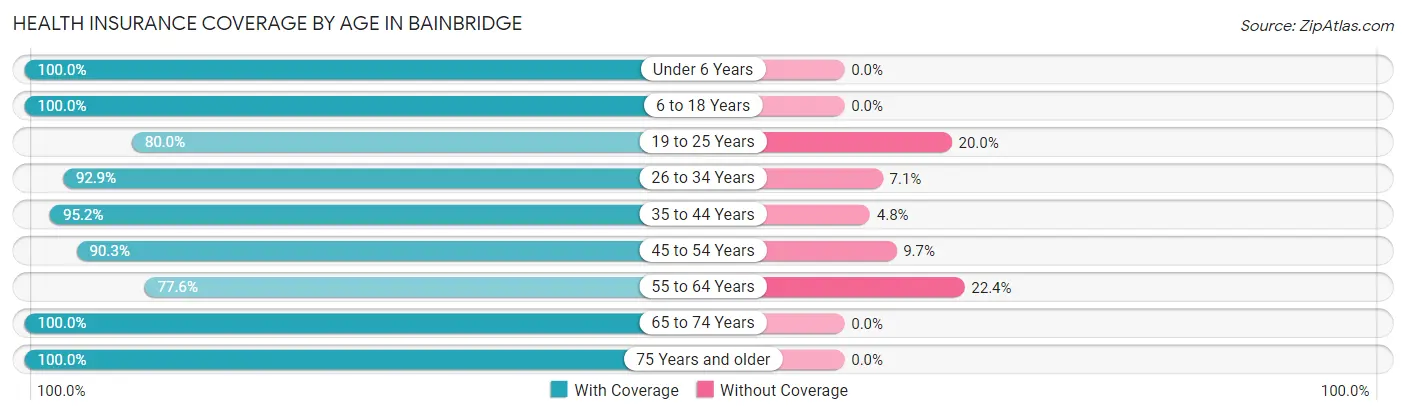
| Age Bracket | With Coverage | Without Coverage |
| Under 6 Years | 39 (100.0%) | 0 (0.0%) |
| 6 to 18 Years | 108 (100.0%) | 0 (0.0%) |
| 19 to 25 Years | 60 (80.0%) | 15 (20.0%) |
| 26 to 34 Years | 52 (92.9%) | 4 (7.1%) |
| 35 to 44 Years | 60 (95.2%) | 3 (4.8%) |
| 45 to 54 Years | 56 (90.3%) | 6 (9.7%) |
| 55 to 64 Years | 52 (77.6%) | 15 (22.4%) |
| 65 to 74 Years | 97 (100.0%) | 0 (0.0%) |
| 75 Years and older | 25 (100.0%) | 0 (0.0%) |
| Total | 549 (92.7%) | 43 (7.3%) |
Health Insurance Coverage by Citizenship Status in Bainbridge
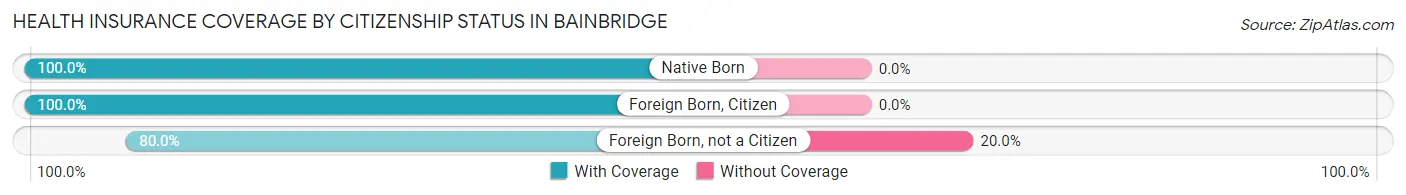
| Citizenship Status | With Coverage | Without Coverage |
| Native Born | 39 (100.0%) | 0 (0.0%) |
| Foreign Born, Citizen | 108 (100.0%) | 0 (0.0%) |
| Foreign Born, not a Citizen | 60 (80.0%) | 15 (20.0%) |
Health Insurance Coverage by Household Income in Bainbridge
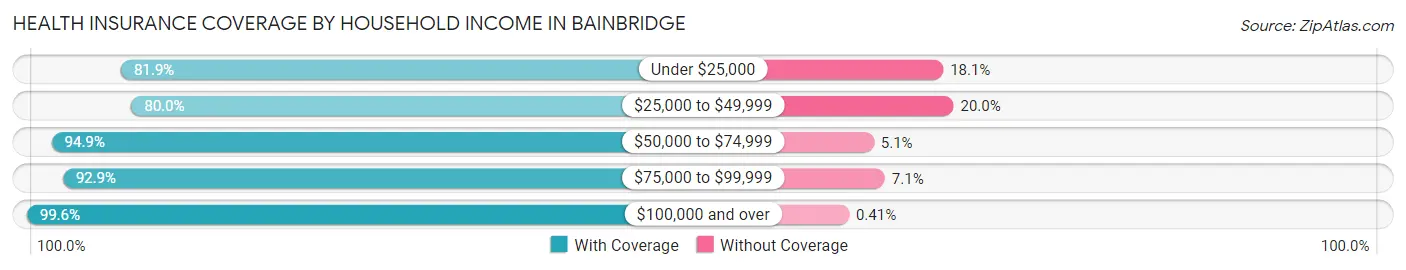
| Household Income | With Coverage | Without Coverage |
| Under $25,000 | 59 (81.9%) | 13 (18.1%) |
| $25,000 to $49,999 | 76 (80.0%) | 19 (20.0%) |
| $50,000 to $74,999 | 131 (94.9%) | 7 (5.1%) |
| $75,000 to $99,999 | 39 (92.9%) | 3 (7.1%) |
| $100,000 and over | 244 (99.6%) | 1 (0.4%) |
Public vs Private Health Insurance Coverage by Age in Bainbridge
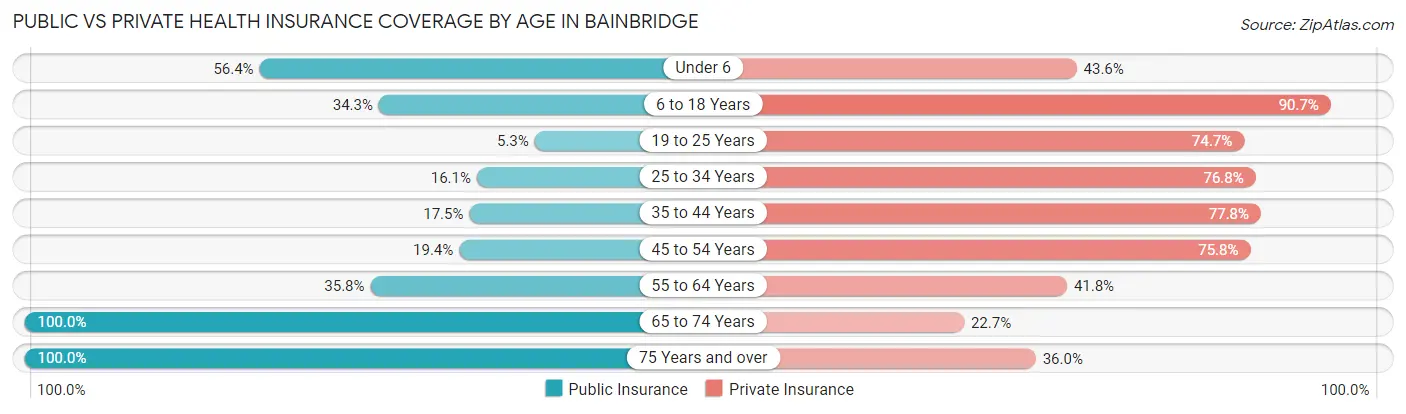
| Age Bracket | Public Insurance | Private Insurance |
| Under 6 | 22 (56.4%) | 17 (43.6%) |
| 6 to 18 Years | 37 (34.3%) | 98 (90.7%) |
| 19 to 25 Years | 4 (5.3%) | 56 (74.7%) |
| 25 to 34 Years | 9 (16.1%) | 43 (76.8%) |
| 35 to 44 Years | 11 (17.5%) | 49 (77.8%) |
| 45 to 54 Years | 12 (19.4%) | 47 (75.8%) |
| 55 to 64 Years | 24 (35.8%) | 28 (41.8%) |
| 65 to 74 Years | 97 (100.0%) | 22 (22.7%) |
| 75 Years and over | 25 (100.0%) | 9 (36.0%) |
| Total | 241 (40.7%) | 369 (62.3%) |
Disability Status by Sex by Age in Bainbridge
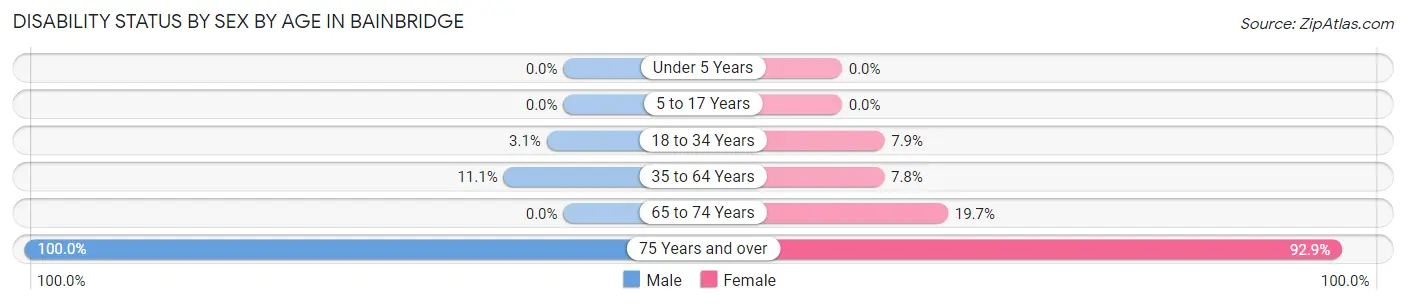
| Age Bracket | Male | Female |
| Under 5 Years | 0 (0.0%) | 0 (0.0%) |
| 5 to 17 Years | 0 (0.0%) | 0 (0.0%) |
| 18 to 34 Years | 3 (3.1%) | 3 (7.9%) |
| 35 to 64 Years | 10 (11.1%) | 8 (7.8%) |
| 65 to 74 Years | 0 (0.0%) | 12 (19.7%) |
| 75 Years and over | 11 (100.0%) | 13 (92.9%) |
Disability Class by Sex by Age in Bainbridge
Disability Class: Hearing Difficulty
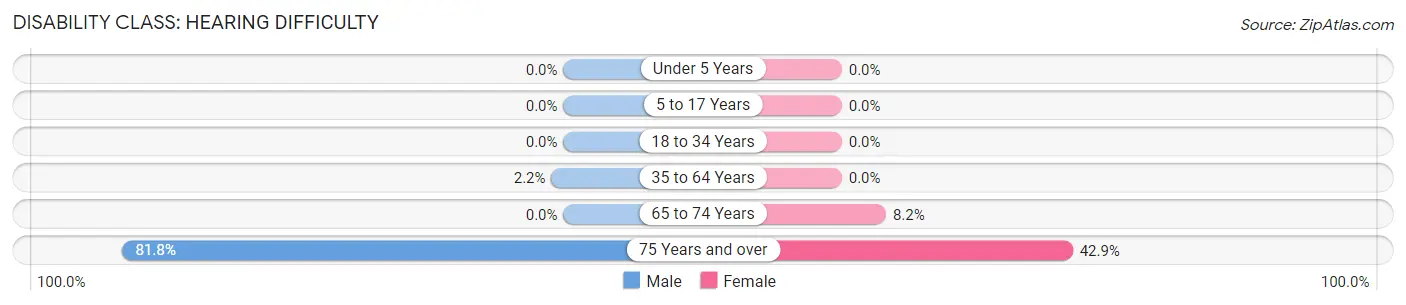
| Age Bracket | Male | Female |
| Under 5 Years | 0 (0.0%) | 0 (0.0%) |
| 5 to 17 Years | 0 (0.0%) | 0 (0.0%) |
| 18 to 34 Years | 0 (0.0%) | 0 (0.0%) |
| 35 to 64 Years | 2 (2.2%) | 0 (0.0%) |
| 65 to 74 Years | 0 (0.0%) | 5 (8.2%) |
| 75 Years and over | 9 (81.8%) | 6 (42.9%) |
Disability Class: Vision Difficulty
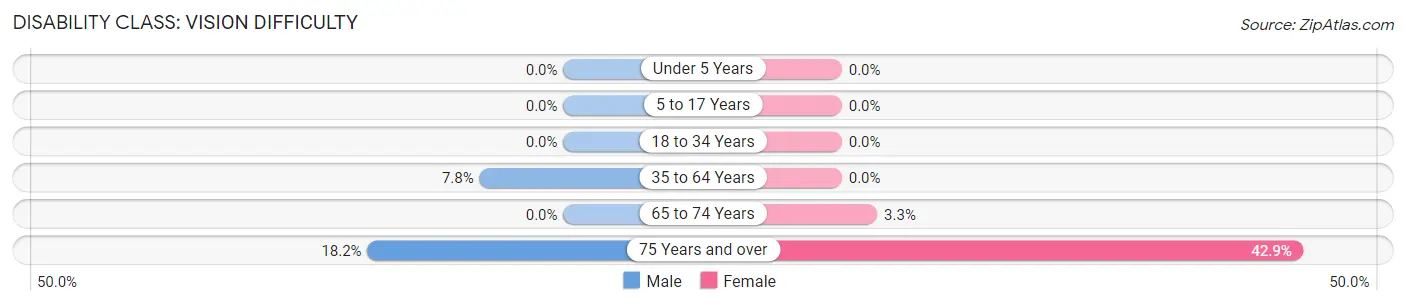
| Age Bracket | Male | Female |
| Under 5 Years | 0 (0.0%) | 0 (0.0%) |
| 5 to 17 Years | 0 (0.0%) | 0 (0.0%) |
| 18 to 34 Years | 0 (0.0%) | 0 (0.0%) |
| 35 to 64 Years | 7 (7.8%) | 0 (0.0%) |
| 65 to 74 Years | 0 (0.0%) | 2 (3.3%) |
| 75 Years and over | 2 (18.2%) | 6 (42.9%) |
Disability Class: Cognitive Difficulty
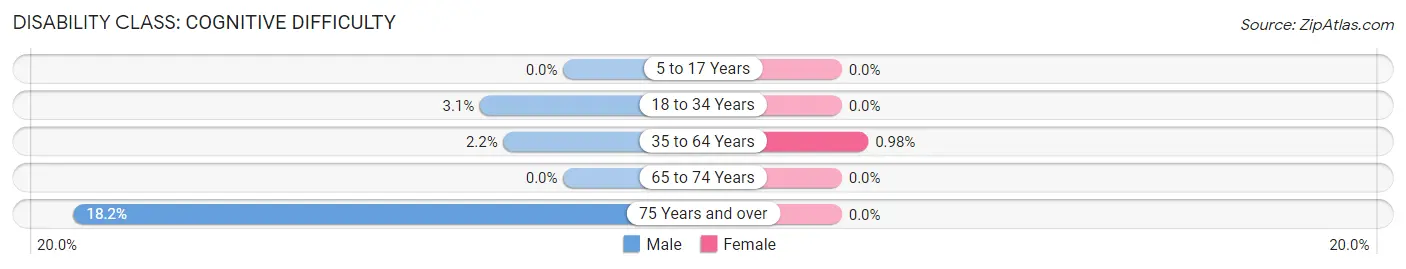
| Age Bracket | Male | Female |
| 5 to 17 Years | 0 (0.0%) | 0 (0.0%) |
| 18 to 34 Years | 3 (3.1%) | 0 (0.0%) |
| 35 to 64 Years | 2 (2.2%) | 1 (1.0%) |
| 65 to 74 Years | 0 (0.0%) | 0 (0.0%) |
| 75 Years and over | 2 (18.2%) | 0 (0.0%) |
Disability Class: Ambulatory Difficulty
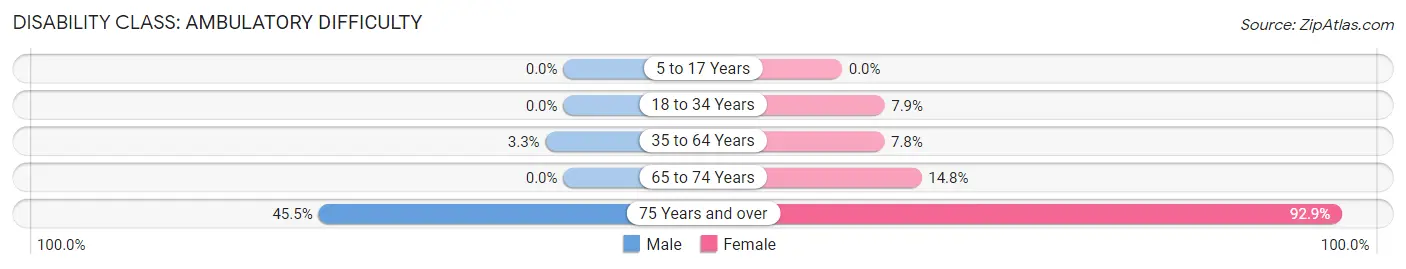
| Age Bracket | Male | Female |
| 5 to 17 Years | 0 (0.0%) | 0 (0.0%) |
| 18 to 34 Years | 0 (0.0%) | 3 (7.9%) |
| 35 to 64 Years | 3 (3.3%) | 8 (7.8%) |
| 65 to 74 Years | 0 (0.0%) | 9 (14.7%) |
| 75 Years and over | 5 (45.5%) | 13 (92.9%) |
Disability Class: Self-Care Difficulty
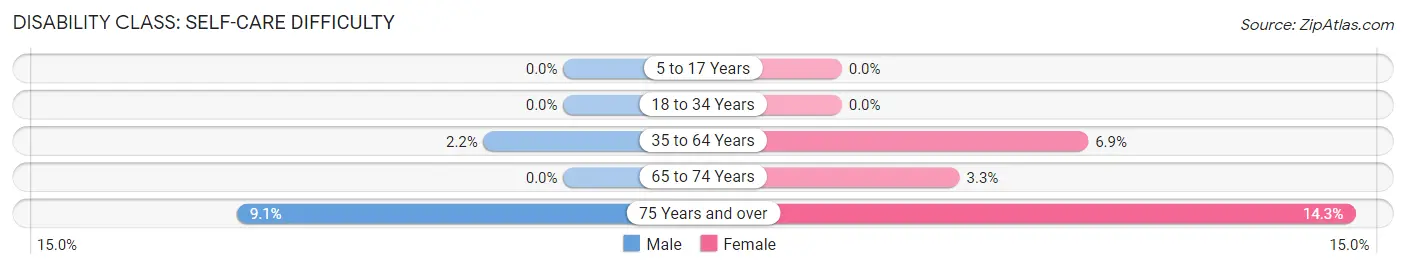
| Age Bracket | Male | Female |
| 5 to 17 Years | 0 (0.0%) | 0 (0.0%) |
| 18 to 34 Years | 0 (0.0%) | 0 (0.0%) |
| 35 to 64 Years | 2 (2.2%) | 7 (6.9%) |
| 65 to 74 Years | 0 (0.0%) | 2 (3.3%) |
| 75 Years and over | 1 (9.1%) | 2 (14.3%) |
Technology Access in Bainbridge
Computing Device Access in Bainbridge
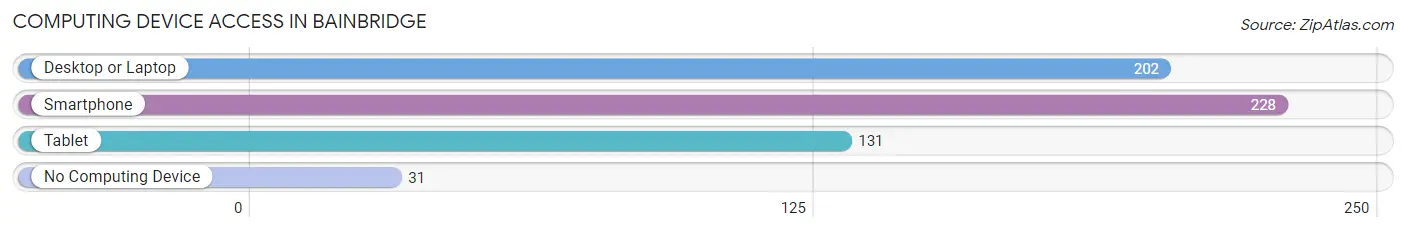
| Device Type | # Households | % Households |
| Desktop or Laptop | 202 | 73.5% |
| Smartphone | 228 | 82.9% |
| Tablet | 131 | 47.6% |
| No Computing Device | 31 | 11.3% |
| Total | 275 | 100.0% |
Internet Access in Bainbridge
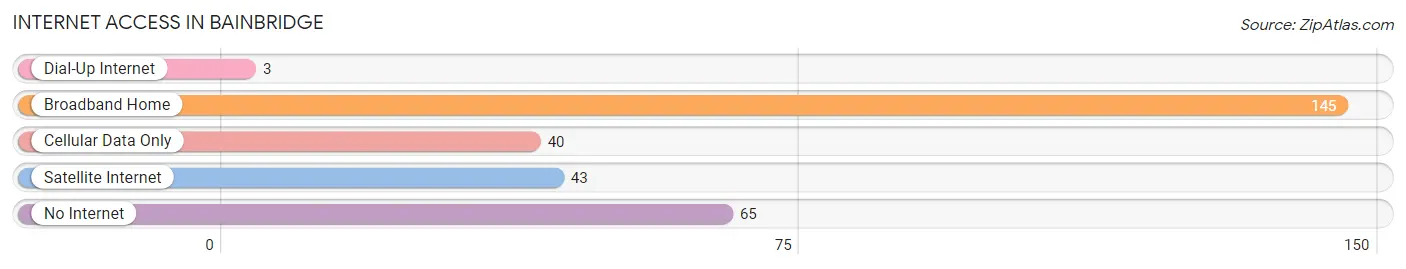
| Internet Type | # Households | % Households |
| Dial-Up Internet | 3 | 1.1% |
| Broadband Home | 145 | 52.7% |
| Cellular Data Only | 40 | 14.5% |
| Satellite Internet | 43 | 15.6% |
| No Internet | 65 | 23.6% |
| Total | 275 | 100.0% |
Bainbridge Summary
Bainbridge is a small town located in Putnam County, Indiana. It is situated on the banks of the Wabash River, approximately 40 miles west of Indianapolis. The town was founded in 1837 and has a population of approximately 1,000 people.
History
Bainbridge was founded in 1837 by William Bainbridge, a local landowner. The town was named after him and was originally a small farming community. In the late 19th century, the town began to grow as a result of the railroad industry. The railroad brought new businesses and industries to the area, and the town began to thrive.
In the early 20th century, the town experienced a period of growth and prosperity. The population increased and new businesses opened up. The town also became a popular tourist destination, with many people visiting the area to take advantage of the scenic views of the Wabash River.
In the late 20th century, the town experienced a period of decline. Many of the businesses and industries that had been established in the early 20th century closed down, and the population began to decline. In recent years, the town has seen a resurgence in population and economic activity.
Geography
Bainbridge is located in Putnam County, Indiana. It is situated on the banks of the Wabash River, approximately 40 miles west of Indianapolis. The town is surrounded by rolling hills and farmland. The climate is generally mild, with hot summers and cold winters.
Economy
The economy of Bainbridge is largely based on agriculture and tourism. The town is home to several farms, which produce a variety of crops, including corn, soybeans, and wheat. The town is also home to several tourist attractions, including the Wabash River Museum and the Putnam County Historical Society.
Demographics
As of the 2010 census, the population of Bainbridge was 1,000. The racial makeup of the town was 97.2% White, 0.7% African American, 0.3% Native American, 0.2% Asian, 0.1% Pacific Islander, 0.7% from other races, and 0.9% from two or more races. The median household income was $37,500, and the median family income was $45,000.
Conclusion
Bainbridge is a small town located in Putnam County, Indiana. It was founded in 1837 and has a population of approximately 1,000 people. The town is situated on the banks of the Wabash River and is surrounded by rolling hills and farmland. The economy of Bainbridge is largely based on agriculture and tourism. The racial makeup of the town is predominantly White, with a small percentage of African American, Native American, Asian, and Pacific Islander residents. The median household income is $37,500, and the median family income is $45,000.
Common Questions
What is Per Capita Income in Bainbridge?
Per Capita income in Bainbridge is $29,997.
What is the Median Family Income in Bainbridge?
Median Family Income in Bainbridge is $64,688.
What is the Median Household income in Bainbridge?
Median Household Income in Bainbridge is $56,250.
What is Income or Wage Gap in Bainbridge?
Income or Wage Gap in Bainbridge is 48.2%.
Women in Bainbridge earn 51.8 cents for every dollar earned by a man.
What is Inequality or Gini Index in Bainbridge?
Inequality or Gini Index in Bainbridge is 0.39.
What is the Total Population of Bainbridge?
Total Population of Bainbridge is 592.
What is the Total Male Population of Bainbridge?
Total Male Population of Bainbridge is 314.
What is the Total Female Population of Bainbridge?
Total Female Population of Bainbridge is 278.
What is the Ratio of Males per 100 Females in Bainbridge?
There are 112.95 Males per 100 Females in Bainbridge.
What is the Ratio of Females per 100 Males in Bainbridge?
There are 88.54 Females per 100 Males in Bainbridge.
What is the Median Population Age in Bainbridge?
Median Population Age in Bainbridge is 36.9 Years.
What is the Average Family Size in Bainbridge
Average Family Size in Bainbridge is 2.7 People.
What is the Average Household Size in Bainbridge
Average Household Size in Bainbridge is 2.1 People.
How Large is the Labor Force in Bainbridge?
There are 267 People in the Labor Forcein in Bainbridge.
What is the Percentage of People in the Labor Force in Bainbridge?
58.6% of People are in the Labor Force in Bainbridge.
What is the Unemployment Rate in Bainbridge?
Unemployment Rate in Bainbridge is 1.1%.