Auburn, IN Map & Demographics
Auburn Map
Auburn Overview
$30,593
PER CAPITA INCOME
$79,278
AVG FAMILY INCOME
$58,635
AVG HOUSEHOLD INCOME
30.1%
WAGE / INCOME GAP [ % ]
69.9¢/ $1
WAGE / INCOME GAP [ $ ]
$11,423
FAMILY INCOME DEFICIT
0.39
INEQUALITY / GINI INDEX
13,316
TOTAL POPULATION
6,534
MALE POPULATION
6,782
FEMALE POPULATION
96.34
MALES / 100 FEMALES
103.80
FEMALES / 100 MALES
35.6
MEDIAN AGE
3.0
AVG FAMILY SIZE
2.4
AVG HOUSEHOLD SIZE
7,139
LABOR FORCE [ PEOPLE ]
69.3%
PERCENT IN LABOR FORCE
5.5%
UNEMPLOYMENT RATE
Auburn Zip Codes
Auburn Area Codes
Income in Auburn
Income Overview in Auburn
Per Capita Income in Auburn is $30,593, while median incomes of families and households are $79,278 and $58,635 respectively.
| Characteristic | Number | Measure |
| Per Capita Income | 13,316 | $30,593 |
| Median Family Income | 3,445 | $79,278 |
| Mean Family Income | 3,445 | $86,018 |
| Median Household Income | 5,578 | $58,635 |
| Mean Household Income | 5,578 | $72,156 |
| Income Deficit | 3,445 | $11,423 |
| Wage / Income Gap (%) | 13,316 | 30.10% |
| Wage / Income Gap ($) | 13,316 | 69.90¢ per $1 |
| Gini / Inequality Index | 13,316 | 0.39 |
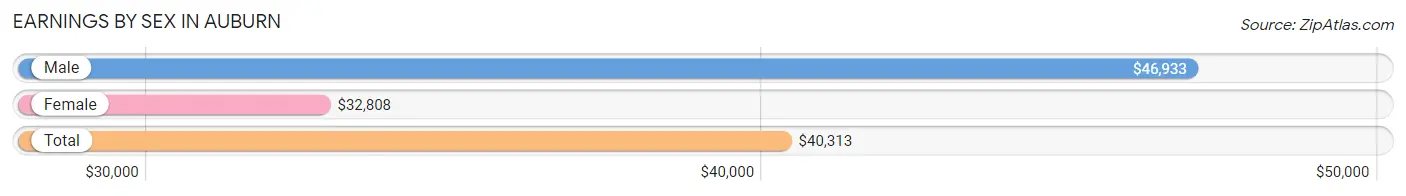
Earnings by Sex in Auburn
Average Earnings in Auburn are $40,313, $46,933 for men and $32,808 for women, a difference of 30.1%.
| Sex | Number | Average Earnings |
| Male | 3,962 (54.3%) | $46,933 |
| Female | 3,329 (45.7%) | $32,808 |
| Total | 7,291 (100.0%) | $40,313 |
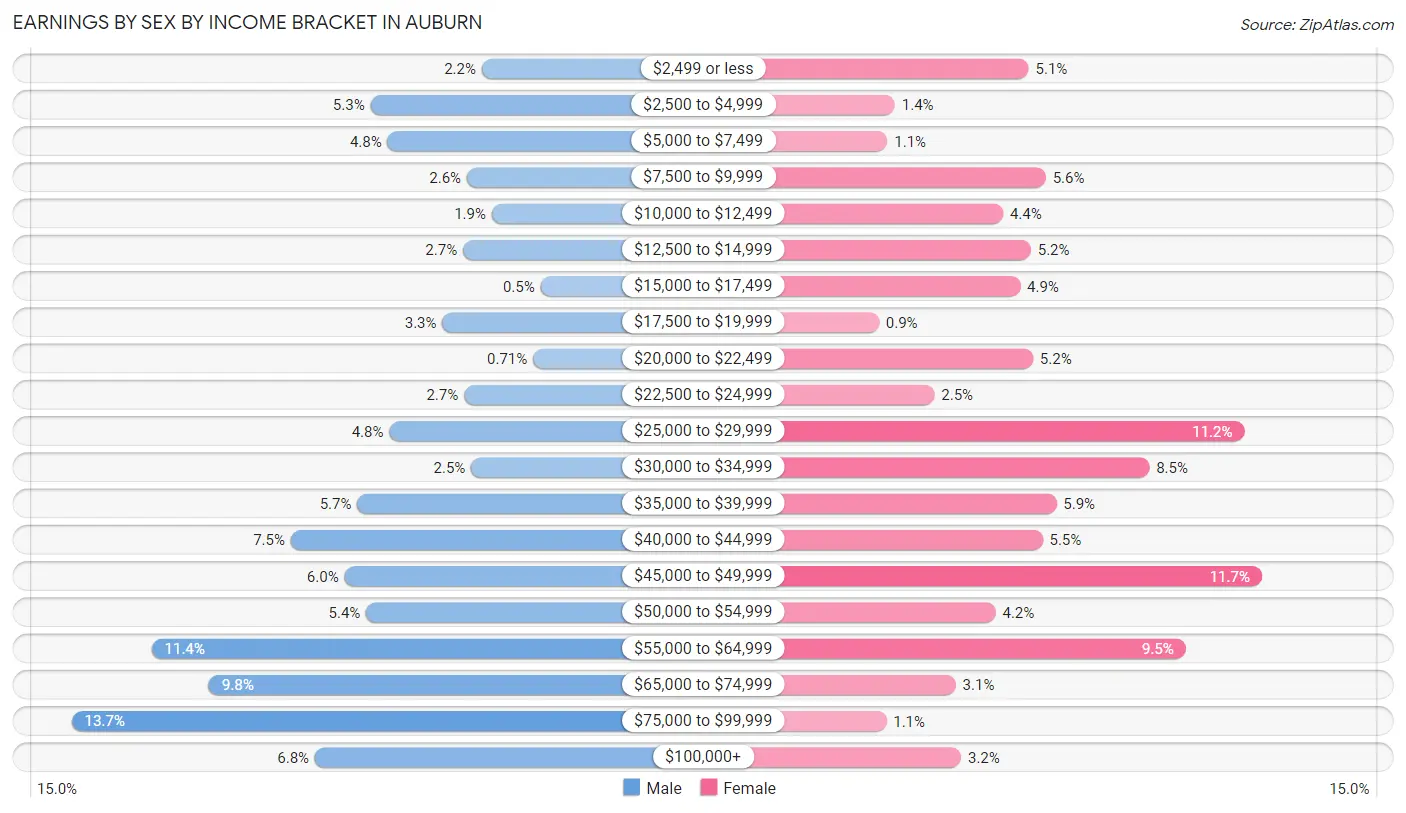
Earnings by Sex by Income Bracket in Auburn
The most common earnings brackets in Auburn are $75,000 to $99,999 for men (542 | 13.7%) and $45,000 to $49,999 for women (388 | 11.7%).
| Income | Male | Female |
| $2,499 or less | 85 (2.1%) | 170 (5.1%) |
| $2,500 to $4,999 | 209 (5.3%) | 45 (1.3%) |
| $5,000 to $7,499 | 190 (4.8%) | 38 (1.1%) |
| $7,500 to $9,999 | 102 (2.6%) | 186 (5.6%) |
| $10,000 to $12,499 | 74 (1.9%) | 146 (4.4%) |
| $12,500 to $14,999 | 106 (2.7%) | 172 (5.2%) |
| $15,000 to $17,499 | 20 (0.5%) | 162 (4.9%) |
| $17,500 to $19,999 | 129 (3.3%) | 30 (0.9%) |
| $20,000 to $22,499 | 28 (0.7%) | 174 (5.2%) |
| $22,500 to $24,999 | 105 (2.6%) | 82 (2.5%) |
| $25,000 to $29,999 | 188 (4.8%) | 372 (11.2%) |
| $30,000 to $34,999 | 97 (2.5%) | 283 (8.5%) |
| $35,000 to $39,999 | 224 (5.7%) | 196 (5.9%) |
| $40,000 to $44,999 | 298 (7.5%) | 183 (5.5%) |
| $45,000 to $49,999 | 238 (6.0%) | 388 (11.7%) |
| $50,000 to $54,999 | 214 (5.4%) | 139 (4.2%) |
| $55,000 to $64,999 | 453 (11.4%) | 317 (9.5%) |
| $65,000 to $74,999 | 389 (9.8%) | 102 (3.1%) |
| $75,000 to $99,999 | 542 (13.7%) | 37 (1.1%) |
| $100,000+ | 271 (6.8%) | 107 (3.2%) |
| Total | 3,962 (100.0%) | 3,329 (100.0%) |
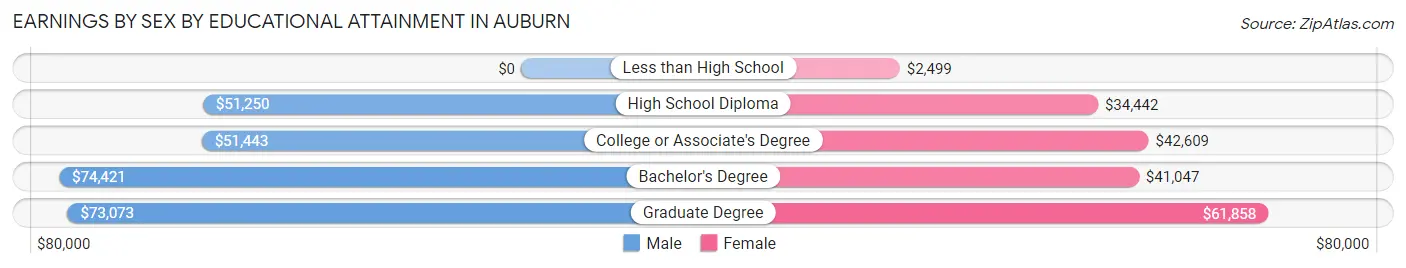
Earnings by Sex by Educational Attainment in Auburn
Average earnings in Auburn are $54,304 for men and $37,895 for women, a difference of 30.2%. Men with an educational attainment of bachelor's degree enjoy the highest average annual earnings of $74,421, while those with high school diploma education earn the least with $51,250. Women with an educational attainment of graduate degree earn the most with the average annual earnings of $61,858, while those with less than high school education have the smallest earnings of $2,499.
| Educational Attainment | Male Income | Female Income |
| Less than High School | - | - |
| High School Diploma | $51,250 | $34,442 |
| College or Associate's Degree | $51,443 | $42,609 |
| Bachelor's Degree | $74,421 | $41,047 |
| Graduate Degree | $73,073 | $61,858 |
| Total | $54,304 | $37,895 |
Family Income in Auburn
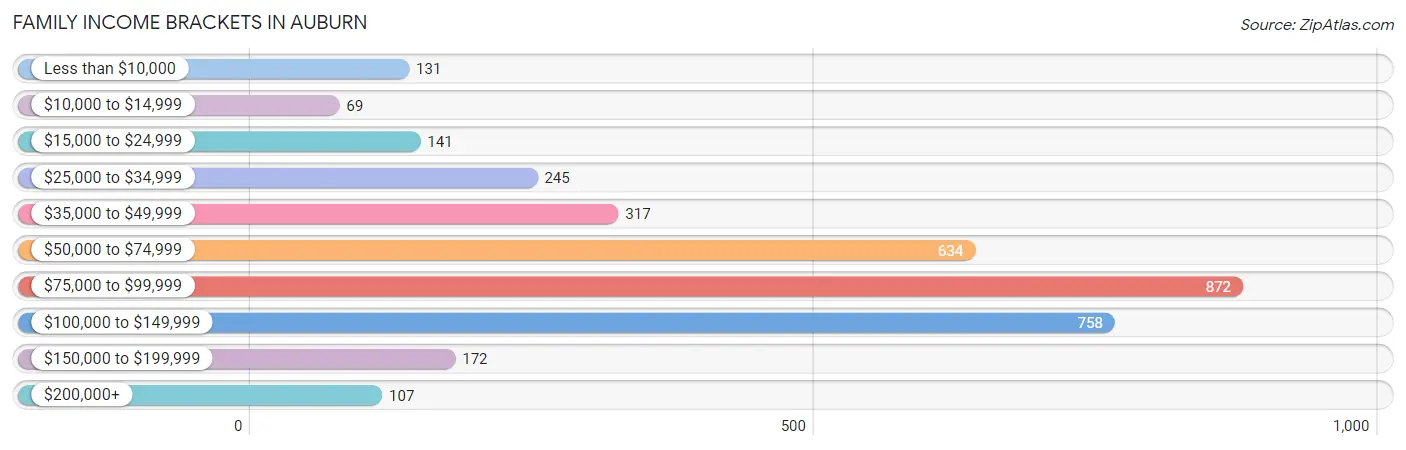
Family Income Brackets in Auburn
According to the Auburn family income data, there are 872 families falling into the $75,000 to $99,999 income range, which is the most common income bracket and makes up 25.3% of all families. Conversely, the $10,000 to $14,999 income bracket is the least frequent group with only 69 families (2.0%) belonging to this category.
| Income Bracket | # Families | % Families |
| Less than $10,000 | 131 | 3.8% |
| $10,000 to $14,999 | 69 | 2.0% |
| $15,000 to $24,999 | 141 | 4.1% |
| $25,000 to $34,999 | 245 | 7.1% |
| $35,000 to $49,999 | 317 | 9.2% |
| $50,000 to $74,999 | 634 | 18.4% |
| $75,000 to $99,999 | 872 | 25.3% |
| $100,000 to $149,999 | 758 | 22.0% |
| $150,000 to $199,999 | 172 | 5.0% |
| $200,000+ | 107 | 3.1% |
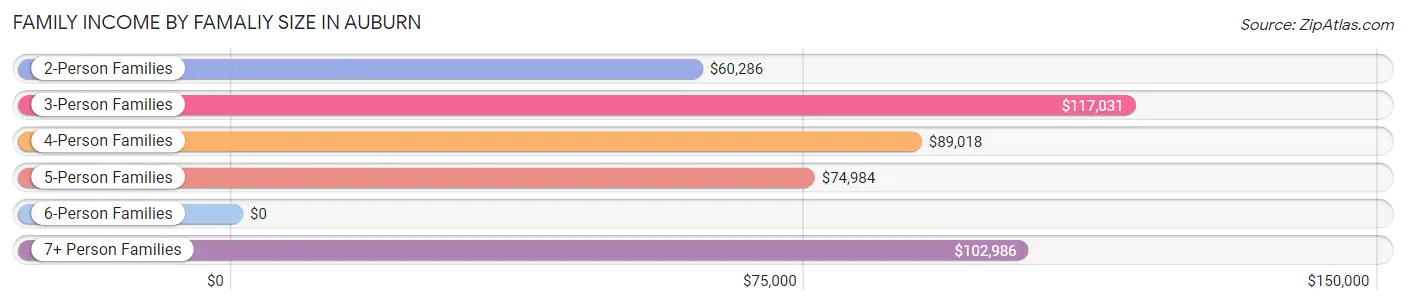
Family Income by Famaliy Size in Auburn
3-person families (712 | 20.7%) account for the highest median family income in Auburn with $117,031 per family, while 3-person families (712 | 20.7%) have the highest median income of $39,010 per family member.
| Income Bracket | # Families | Median Income |
| 2-Person Families | 1,670 (48.5%) | $60,286 |
| 3-Person Families | 712 (20.7%) | $117,031 |
| 4-Person Families | 680 (19.7%) | $89,018 |
| 5-Person Families | 235 (6.8%) | $74,984 |
| 6-Person Families | 90 (2.6%) | $0 |
| 7+ Person Families | 58 (1.7%) | $102,986 |
| Total | 3,445 (100.0%) | $79,278 |
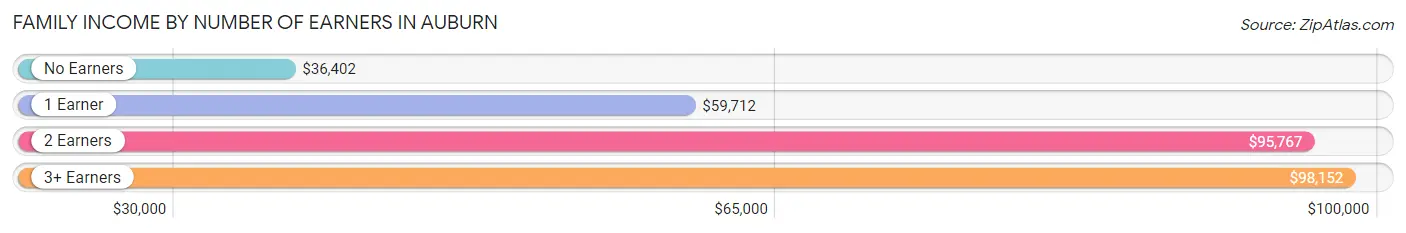
Family Income by Number of Earners in Auburn
The median family income in Auburn is $79,278, with families comprising 3+ earners (298) having the highest median family income of $98,152, while families with no earners (438) have the lowest median family income of $36,402, accounting for 8.6% and 12.7% of families, respectively.
| Number of Earners | # Families | Median Income |
| No Earners | 438 (12.7%) | $36,402 |
| 1 Earner | 960 (27.9%) | $59,712 |
| 2 Earners | 1,749 (50.8%) | $95,767 |
| 3+ Earners | 298 (8.6%) | $98,152 |
| Total | 3,445 (100.0%) | $79,278 |
Household Income in Auburn
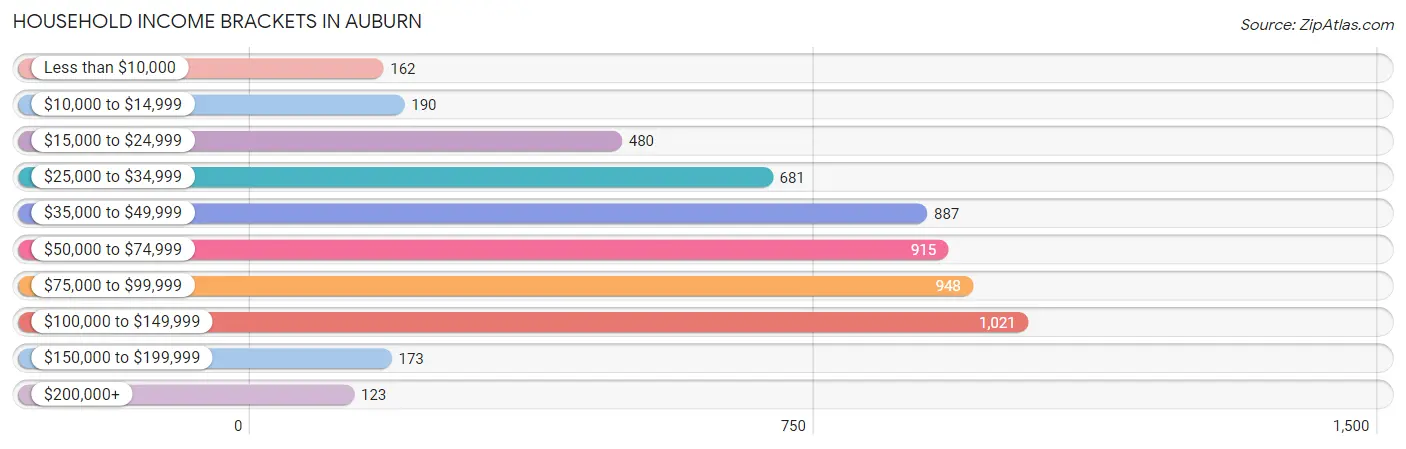
Household Income Brackets in Auburn
With 1,021 households falling in the category, the $100,000 to $149,999 income range is the most frequent in Auburn, accounting for 18.3% of all households. In contrast, only 123 households (2.2%) fall into the $200,000+ income bracket, making it the least populous group.
| Income Bracket | # Households | % Households |
| Less than $10,000 | 162 | 2.9% |
| $10,000 to $14,999 | 190 | 3.4% |
| $15,000 to $24,999 | 480 | 8.6% |
| $25,000 to $34,999 | 681 | 12.2% |
| $35,000 to $49,999 | 887 | 15.9% |
| $50,000 to $74,999 | 915 | 16.4% |
| $75,000 to $99,999 | 948 | 17.0% |
| $100,000 to $149,999 | 1,021 | 18.3% |
| $150,000 to $199,999 | 173 | 3.1% |
| $200,000+ | 123 | 2.2% |
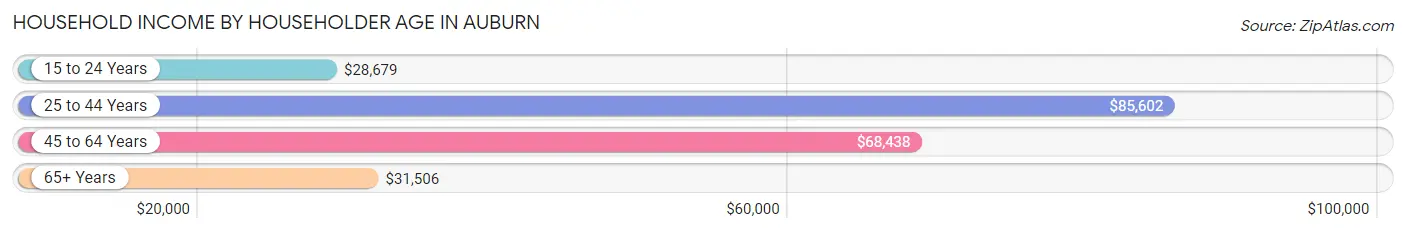
Household Income by Householder Age in Auburn
The median household income in Auburn is $58,635, with the highest median household income of $85,602 found in the 25 to 44 years age bracket for the primary householder. A total of 1,829 households (32.8%) fall into this category. Meanwhile, the 15 to 24 years age bracket for the primary householder has the lowest median household income of $28,679, with 312 households (5.6%) in this group.
| Income Bracket | # Households | Median Income |
| 15 to 24 Years | 312 (5.6%) | $28,679 |
| 25 to 44 Years | 1,829 (32.8%) | $85,602 |
| 45 to 64 Years | 1,872 (33.6%) | $68,438 |
| 65+ Years | 1,565 (28.1%) | $31,506 |
| Total | 5,578 (100.0%) | $58,635 |
Poverty in Auburn
Income Below Poverty by Sex and Age in Auburn
With 9.5% poverty level for males and 13.4% for females among the residents of Auburn, under 5 year old males and 16 and 17 year old females are the most vulnerable to poverty, with 244 males (47.8%) and 49 females (41.2%) in their respective age groups living below the poverty level.
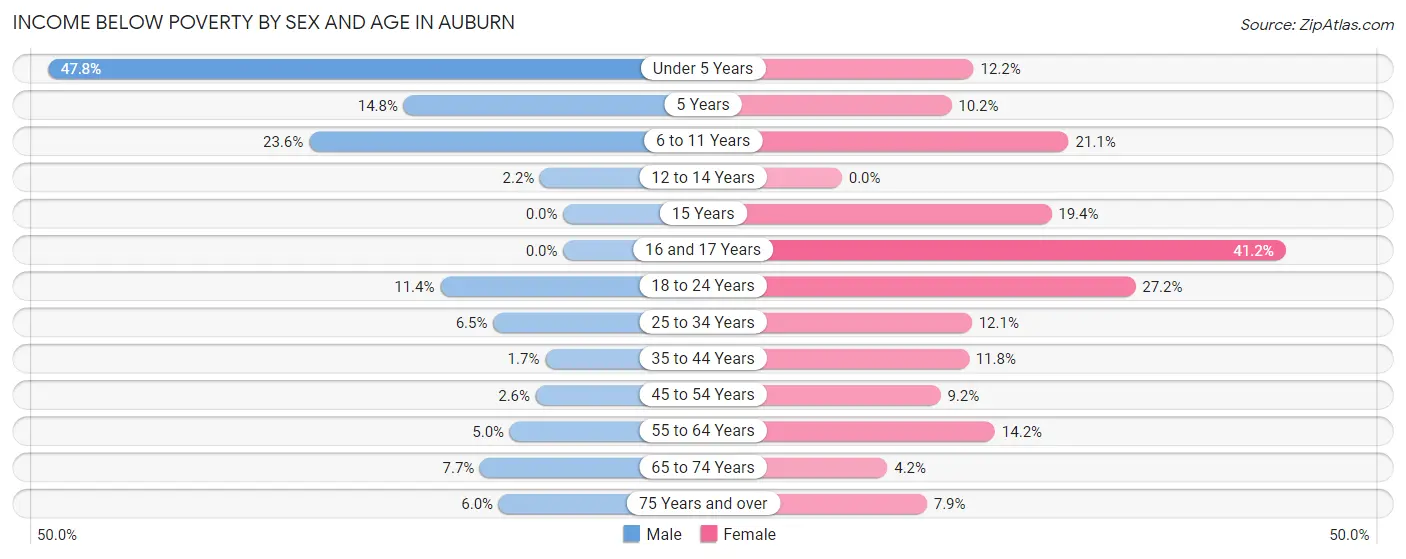
| Age Bracket | Male | Female |
| Under 5 Years | 244 (47.8%) | 56 (12.2%) |
| 5 Years | 8 (14.8%) | 6 (10.2%) |
| 6 to 11 Years | 84 (23.6%) | 173 (21.0%) |
| 12 to 14 Years | 7 (2.1%) | 0 (0.0%) |
| 15 Years | 0 (0.0%) | 7 (19.4%) |
| 16 and 17 Years | 0 (0.0%) | 49 (41.2%) |
| 18 to 24 Years | 74 (11.4%) | 155 (27.2%) |
| 25 to 34 Years | 61 (6.5%) | 110 (12.1%) |
| 35 to 44 Years | 14 (1.7%) | 90 (11.8%) |
| 45 to 54 Years | 17 (2.5%) | 71 (9.2%) |
| 55 to 64 Years | 37 (5.0%) | 114 (14.2%) |
| 65 to 74 Years | 43 (7.7%) | 25 (4.2%) |
| 75 Years and over | 22 (6.0%) | 44 (7.9%) |
| Total | 611 (9.5%) | 900 (13.4%) |
Income Above Poverty by Sex and Age in Auburn
According to the poverty statistics in Auburn, males aged 15 years and females aged 12 to 14 years are the age groups that are most secure financially, with 100.0% of males and 100.0% of females in these age groups living above the poverty line.
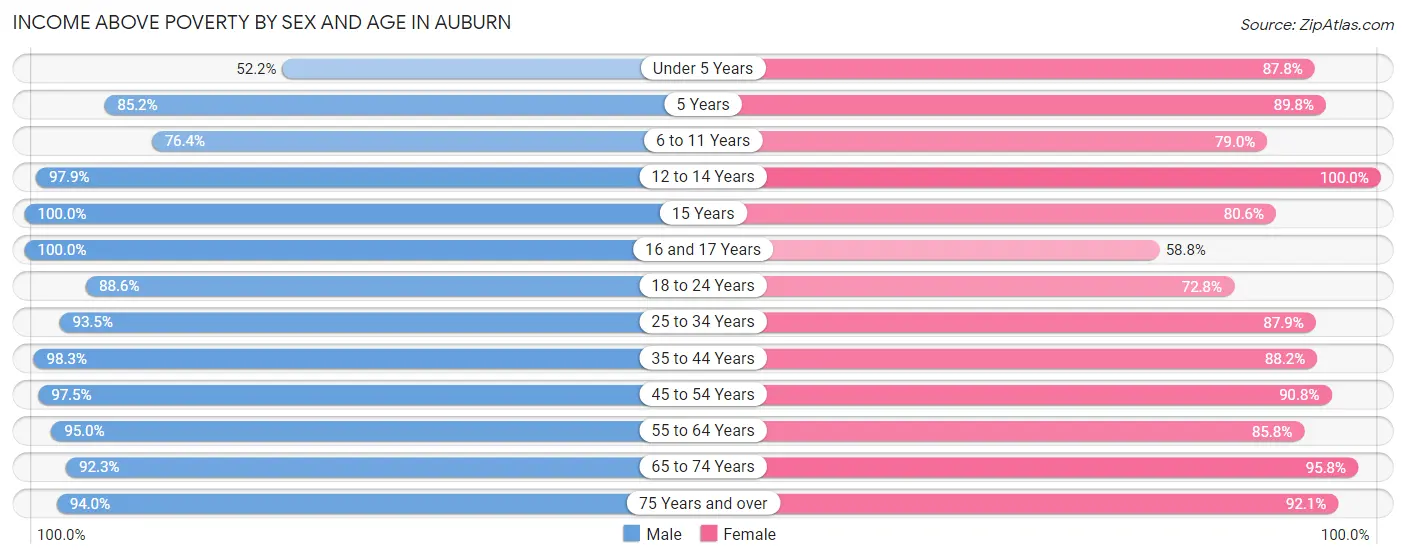
| Age Bracket | Male | Female |
| Under 5 Years | 266 (52.2%) | 402 (87.8%) |
| 5 Years | 46 (85.2%) | 53 (89.8%) |
| 6 to 11 Years | 272 (76.4%) | 649 (78.9%) |
| 12 to 14 Years | 319 (97.9%) | 232 (100.0%) |
| 15 Years | 162 (100.0%) | 29 (80.6%) |
| 16 and 17 Years | 277 (100.0%) | 70 (58.8%) |
| 18 to 24 Years | 574 (88.6%) | 414 (72.8%) |
| 25 to 34 Years | 877 (93.5%) | 802 (87.9%) |
| 35 to 44 Years | 817 (98.3%) | 674 (88.2%) |
| 45 to 54 Years | 649 (97.5%) | 704 (90.8%) |
| 55 to 64 Years | 709 (95.0%) | 688 (85.8%) |
| 65 to 74 Years | 514 (92.3%) | 567 (95.8%) |
| 75 Years and over | 346 (94.0%) | 514 (92.1%) |
| Total | 5,828 (90.5%) | 5,798 (86.6%) |
Income Below Poverty Among Married-Couple Families in Auburn
The poverty statistics for married-couple families in Auburn show that 3.7% or 91 of the total 2,430 families live below the poverty line. Families with 1 or 2 children have the highest poverty rate of 7.2%, comprising of 71 families. On the other hand, families with 3 or 4 children have the lowest poverty rate of 0.0%, which includes 0 families.
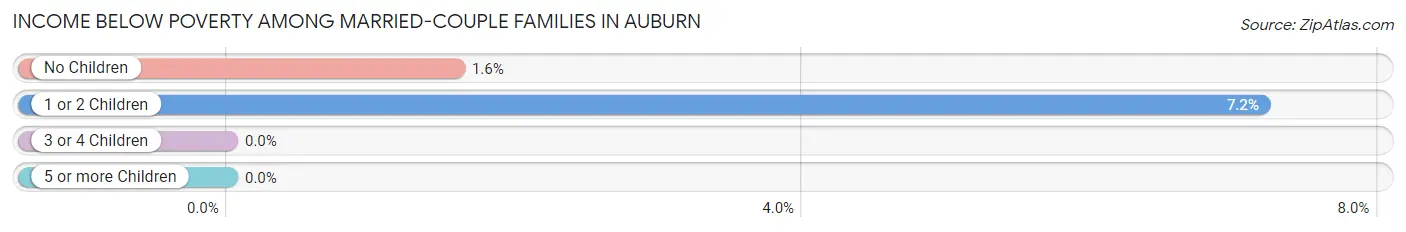
| Children | Above Poverty | Below Poverty |
| No Children | 1,243 (98.4%) | 20 (1.6%) |
| 1 or 2 Children | 916 (92.8%) | 71 (7.2%) |
| 3 or 4 Children | 144 (100.0%) | 0 (0.0%) |
| 5 or more Children | 36 (100.0%) | 0 (0.0%) |
| Total | 2,339 (96.3%) | 91 (3.7%) |
Income Below Poverty Among Single-Parent Households in Auburn
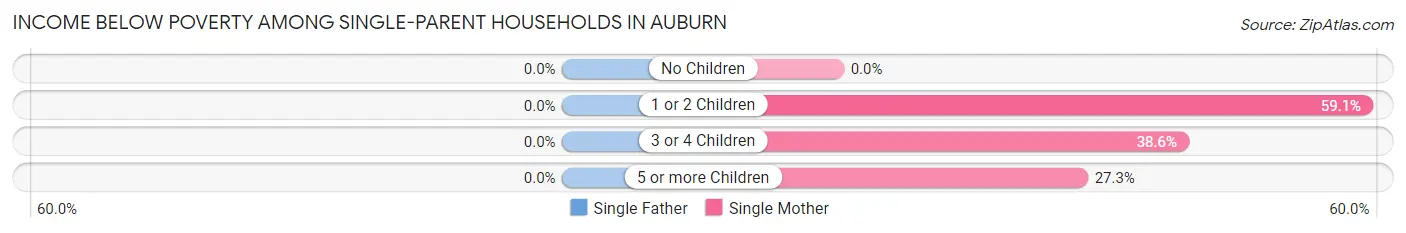
| Children | Single Father | Single Mother |
| No Children | 0 (0.0%) | 0 (0.0%) |
| 1 or 2 Children | 0 (0.0%) | 220 (59.1%) |
| 3 or 4 Children | 0 (0.0%) | 59 (38.6%) |
| 5 or more Children | 0 (0.0%) | 6 (27.3%) |
| Total | 0 (0.0%) | 285 (39.4%) |
Income Below Poverty Among Married-Couple vs Single-Parent Households in Auburn
The poverty data for Auburn shows that 91 of the married-couple family households (3.7%) and 285 of the single-parent households (28.1%) are living below the poverty level. Within the married-couple family households, those with 1 or 2 children have the highest poverty rate, with 71 households (7.2%) falling below the poverty line. Among the single-parent households, those with 1 or 2 children have the highest poverty rate, with 220 household (37.9%) living below poverty.
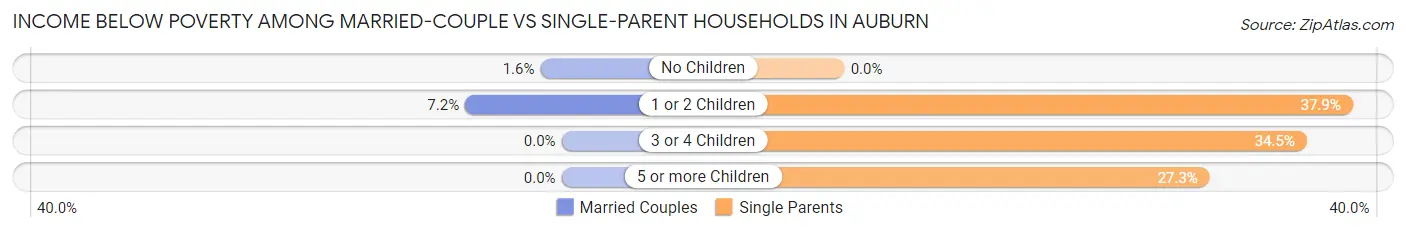
| Children | Married-Couple Families | Single-Parent Households |
| No Children | 20 (1.6%) | 0 (0.0%) |
| 1 or 2 Children | 71 (7.2%) | 220 (37.9%) |
| 3 or 4 Children | 0 (0.0%) | 59 (34.5%) |
| 5 or more Children | 0 (0.0%) | 6 (27.3%) |
| Total | 91 (3.7%) | 285 (28.1%) |
Race in Auburn
The most populous races in Auburn are White / Caucasian (12,833 | 96.4%), Two or more Races (443 | 3.3%), and Hispanic or Latino (148 | 1.1%).
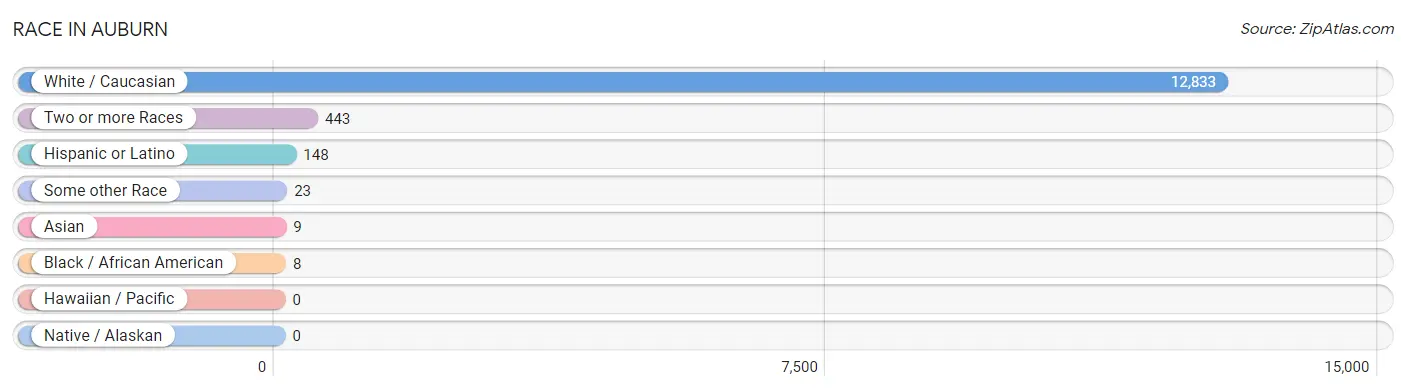
| Race | # Population | % Population |
| Asian | 9 | 0.1% |
| Black / African American | 8 | 0.1% |
| Hawaiian / Pacific | 0 | 0.0% |
| Hispanic or Latino | 148 | 1.1% |
| Native / Alaskan | 0 | 0.0% |
| White / Caucasian | 12,833 | 96.4% |
| Two or more Races | 443 | 3.3% |
| Some other Race | 23 | 0.2% |
| Total | 13,316 | 100.0% |
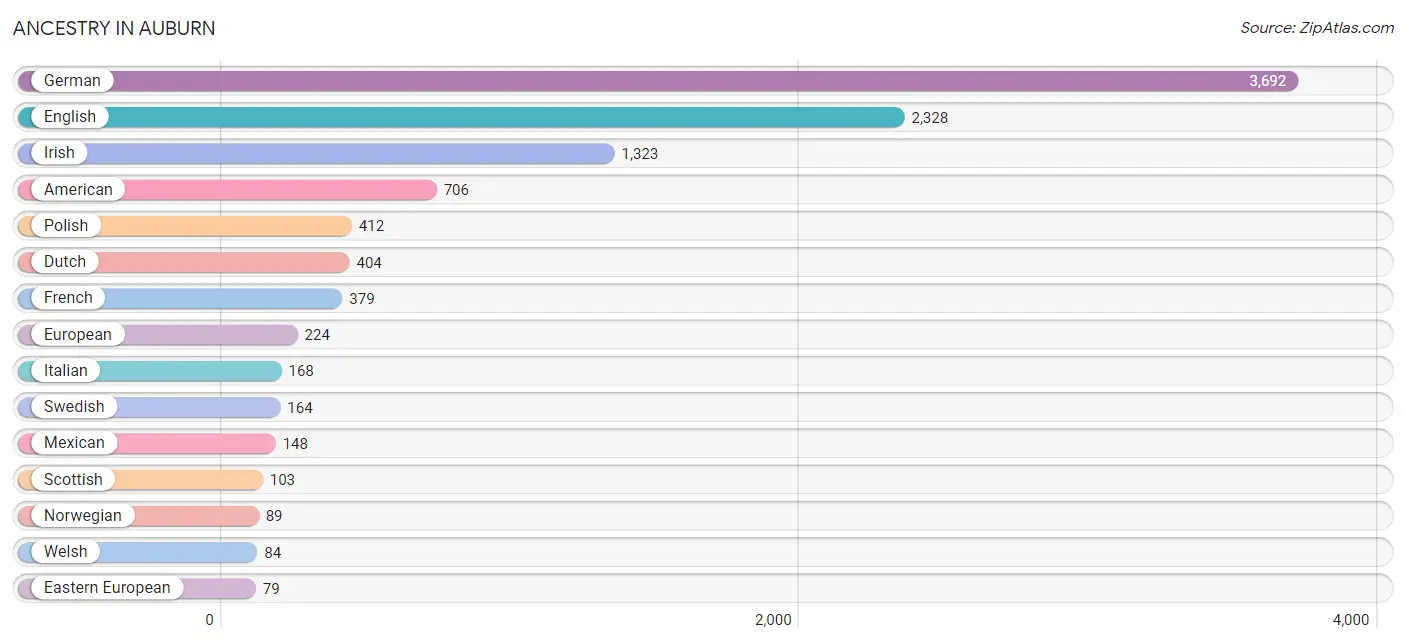
Ancestry in Auburn
The most populous ancestries reported in Auburn are German (3,692 | 27.7%), English (2,328 | 17.5%), Irish (1,323 | 9.9%), American (706 | 5.3%), and Polish (412 | 3.1%), together accounting for 63.5% of all Auburn residents.
| Ancestry | # Population | % Population |
| American | 706 | 5.3% |
| Apache | 38 | 0.3% |
| Arab | 7 | 0.1% |
| Canadian | 47 | 0.4% |
| Cherokee | 10 | 0.1% |
| Czechoslovakian | 12 | 0.1% |
| Dutch | 404 | 3.0% |
| Eastern European | 79 | 0.6% |
| Egyptian | 7 | 0.1% |
| English | 2,328 | 17.5% |
| European | 224 | 1.7% |
| French | 379 | 2.9% |
| French Canadian | 50 | 0.4% |
| German | 3,692 | 27.7% |
| Hungarian | 13 | 0.1% |
| Indian (Asian) | 9 | 0.1% |
| Irish | 1,323 | 9.9% |
| Italian | 168 | 1.3% |
| Korean | 31 | 0.2% |
| Lithuanian | 18 | 0.1% |
| Malaysian | 26 | 0.2% |
| Mexican | 148 | 1.1% |
| Northern European | 47 | 0.4% |
| Norwegian | 89 | 0.7% |
| Pennsylvania German | 37 | 0.3% |
| Polish | 412 | 3.1% |
| Russian | 11 | 0.1% |
| Scandinavian | 32 | 0.2% |
| Scotch-Irish | 63 | 0.5% |
| Scottish | 103 | 0.8% |
| Swedish | 164 | 1.2% |
| Swiss | 68 | 0.5% |
| Welsh | 84 | 0.6% | View All 33 Rows |
Immigrants in Auburn
The most numerous immigrant groups reported in Auburn came from Europe (68 | 0.5%), Northern Europe (45 | 0.3%), Central America (34 | 0.3%), Latin America (34 | 0.3%), and Mexico (34 | 0.3%), together accounting for 1.6% of all Auburn residents.
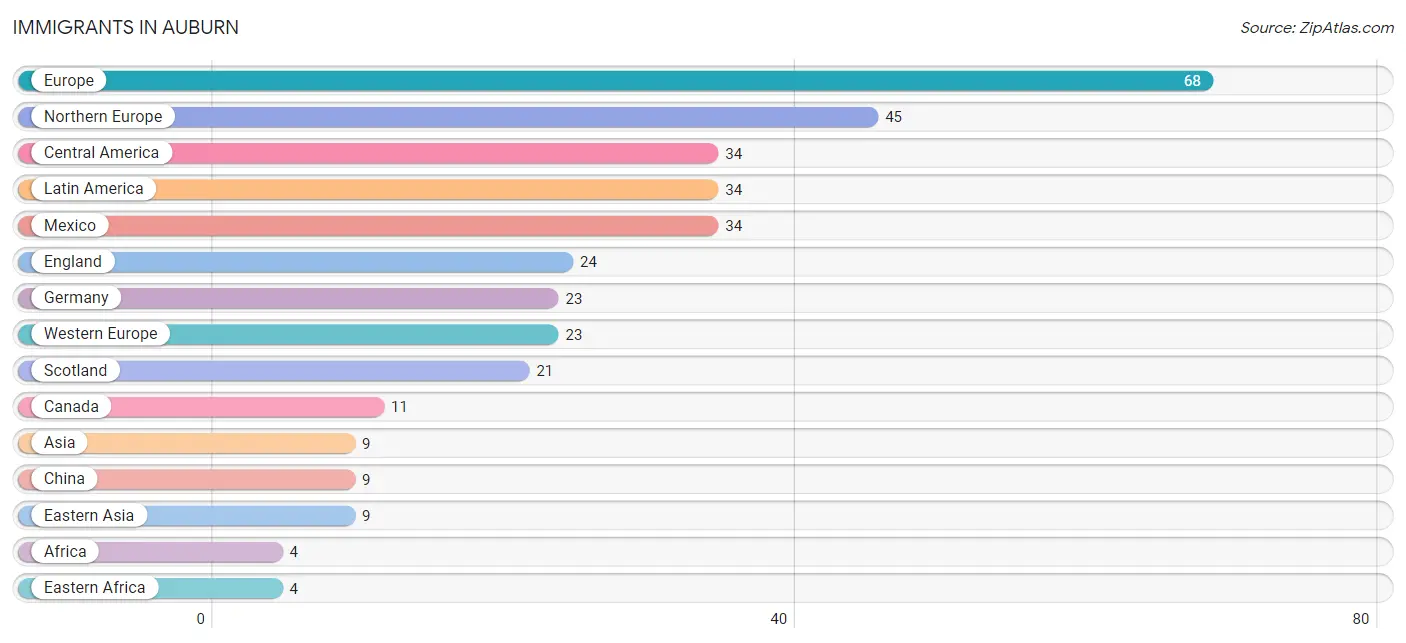
| Immigration Origin | # Population | % Population |
| Africa | 4 | 0.0% |
| Asia | 9 | 0.1% |
| Canada | 11 | 0.1% |
| Central America | 34 | 0.3% |
| China | 9 | 0.1% |
| Eastern Africa | 4 | 0.0% |
| Eastern Asia | 9 | 0.1% |
| England | 24 | 0.2% |
| Europe | 68 | 0.5% |
| Germany | 23 | 0.2% |
| Kenya | 4 | 0.0% |
| Latin America | 34 | 0.3% |
| Mexico | 34 | 0.3% |
| Northern Europe | 45 | 0.3% |
| Scotland | 21 | 0.2% |
| Western Europe | 23 | 0.2% | View All 16 Rows |
Sex and Age in Auburn
Sex and Age in Auburn
The most populous age groups in Auburn are 35 to 39 Years (599 | 9.2%) for men and 35 to 39 Years (676 | 10.0%) for women.
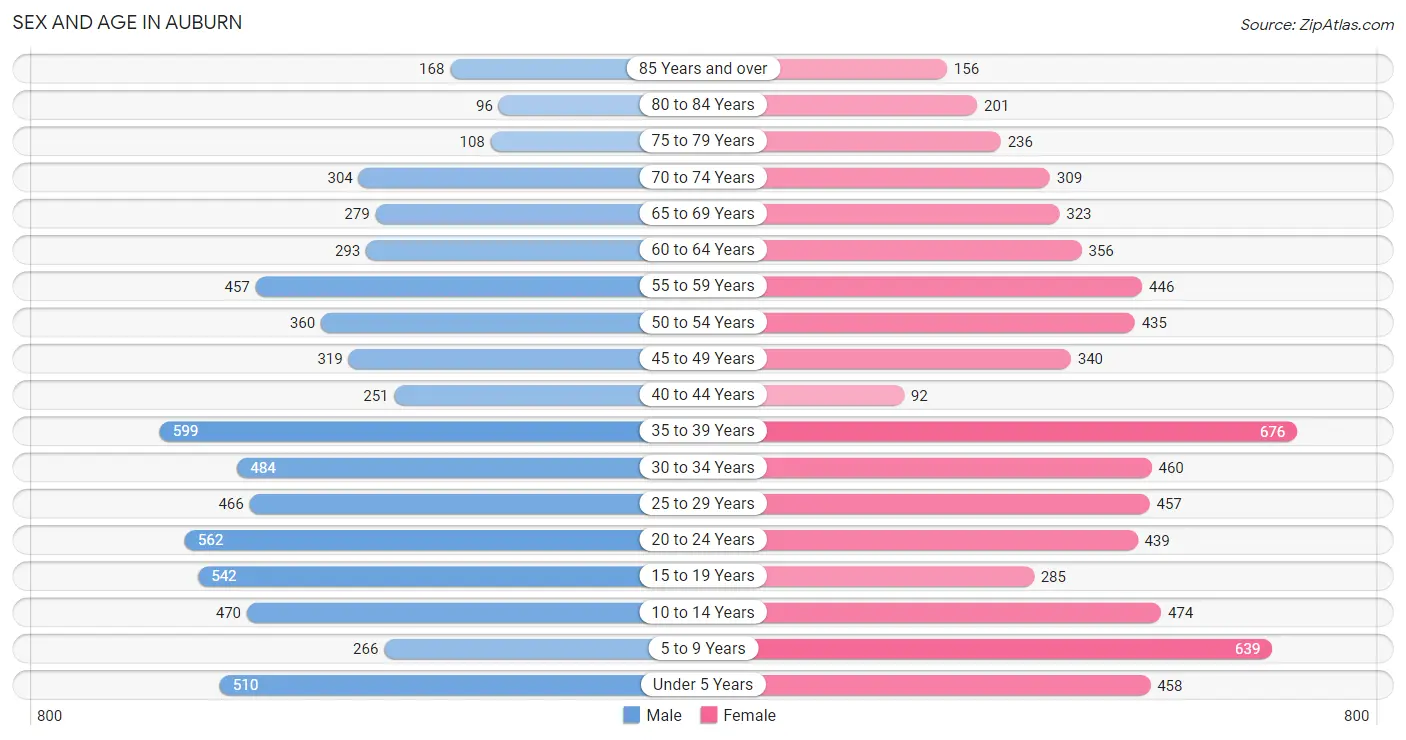
| Age Bracket | Male | Female |
| Under 5 Years | 510 (7.8%) | 458 (6.8%) |
| 5 to 9 Years | 266 (4.1%) | 639 (9.4%) |
| 10 to 14 Years | 470 (7.2%) | 474 (7.0%) |
| 15 to 19 Years | 542 (8.3%) | 285 (4.2%) |
| 20 to 24 Years | 562 (8.6%) | 439 (6.5%) |
| 25 to 29 Years | 466 (7.1%) | 457 (6.7%) |
| 30 to 34 Years | 484 (7.4%) | 460 (6.8%) |
| 35 to 39 Years | 599 (9.2%) | 676 (10.0%) |
| 40 to 44 Years | 251 (3.8%) | 92 (1.4%) |
| 45 to 49 Years | 319 (4.9%) | 340 (5.0%) |
| 50 to 54 Years | 360 (5.5%) | 435 (6.4%) |
| 55 to 59 Years | 457 (7.0%) | 446 (6.6%) |
| 60 to 64 Years | 293 (4.5%) | 356 (5.2%) |
| 65 to 69 Years | 279 (4.3%) | 323 (4.8%) |
| 70 to 74 Years | 304 (4.6%) | 309 (4.6%) |
| 75 to 79 Years | 108 (1.7%) | 236 (3.5%) |
| 80 to 84 Years | 96 (1.5%) | 201 (3.0%) |
| 85 Years and over | 168 (2.6%) | 156 (2.3%) |
| Total | 6,534 (100.0%) | 6,782 (100.0%) |
Families and Households in Auburn
Median Family Size in Auburn
The median family size in Auburn is 3.02 persons per family, with single female/mother families (724 | 21.0%) accounting for the largest median family size of 3.21 persons per family. On the other hand, single male/father families (291 | 8.5%) represent the smallest median family size with 2.25 persons per family.
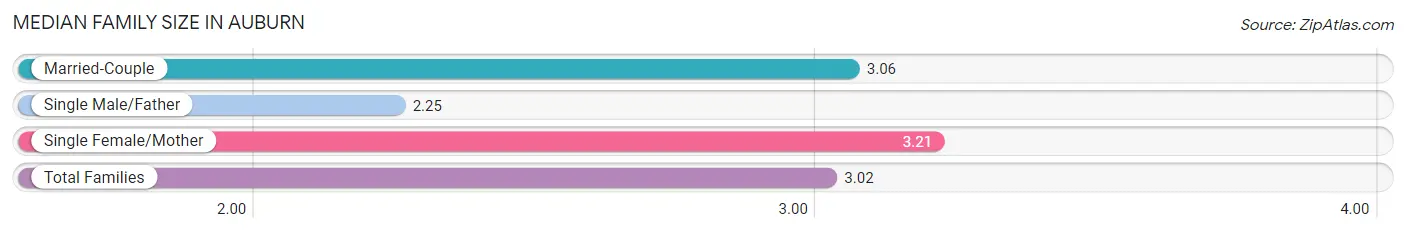
| Family Type | # Families | Family Size |
| Married-Couple | 2,430 (70.5%) | 3.06 |
| Single Male/Father | 291 (8.5%) | 2.25 |
| Single Female/Mother | 724 (21.0%) | 3.21 |
| Total Families | 3,445 (100.0%) | 3.02 |
Median Household Size in Auburn
The median household size in Auburn is 2.35 persons per household, with single female/mother households (724 | 13.0%) accounting for the largest median household size of 3.69 persons per household. non-family households (2,133 | 38.2%) represent the smallest median household size with 1.06 persons per household.
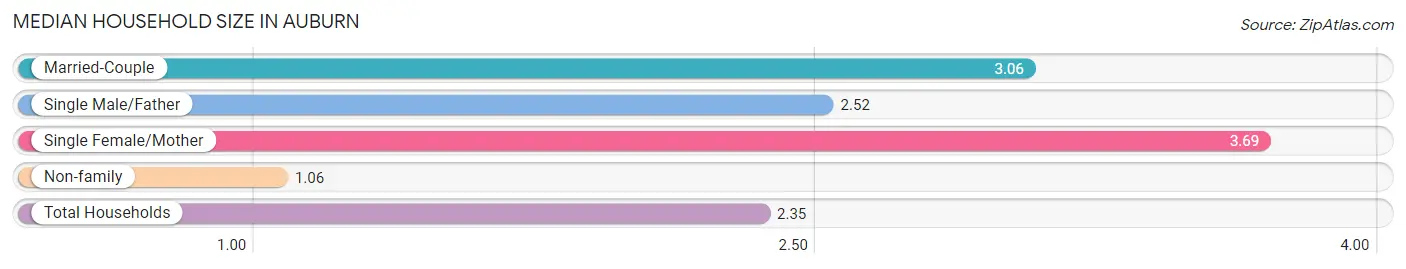
| Household Type | # Households | Household Size |
| Married-Couple | 2,430 (43.6%) | 3.06 |
| Single Male/Father | 291 (5.2%) | 2.52 |
| Single Female/Mother | 724 (13.0%) | 3.69 |
| Non-family | 2,133 (38.2%) | 1.06 |
| Total Households | 5,578 (100.0%) | 2.35 |
Household Size by Marriage Status in Auburn
Out of a total of 5,578 households in Auburn, 3,445 (61.8%) are family households, while 2,133 (38.2%) are nonfamily households. The most numerous type of family households are 2-person households, comprising 1,440, and the most common type of nonfamily households are 1-person households, comprising 2,004.
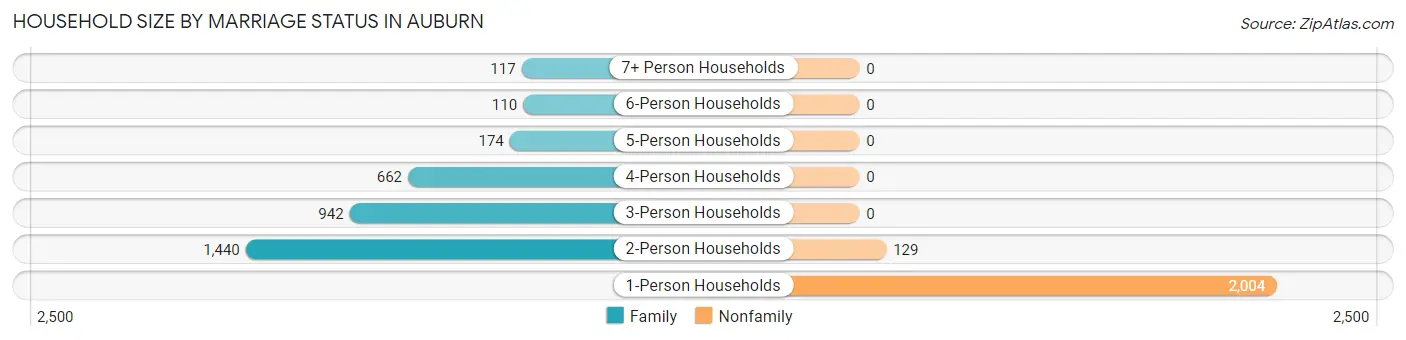
| Household Size | Family Households | Nonfamily Households |
| 1-Person Households | - | 2,004 (35.9%) |
| 2-Person Households | 1,440 (25.8%) | 129 (2.3%) |
| 3-Person Households | 942 (16.9%) | 0 (0.0%) |
| 4-Person Households | 662 (11.9%) | 0 (0.0%) |
| 5-Person Households | 174 (3.1%) | 0 (0.0%) |
| 6-Person Households | 110 (2.0%) | 0 (0.0%) |
| 7+ Person Households | 117 (2.1%) | 0 (0.0%) |
| Total | 3,445 (61.8%) | 2,133 (38.2%) |
Female Fertility in Auburn
Fertility by Age in Auburn
Average fertility rate in Auburn is 46.0 births per 1,000 women. Women in the age bracket of 20 to 34 years have the highest fertility rate with 78.0 births per 1,000 women. Women in the age bracket of 20 to 34 years acount for 80.3% of all women with births.
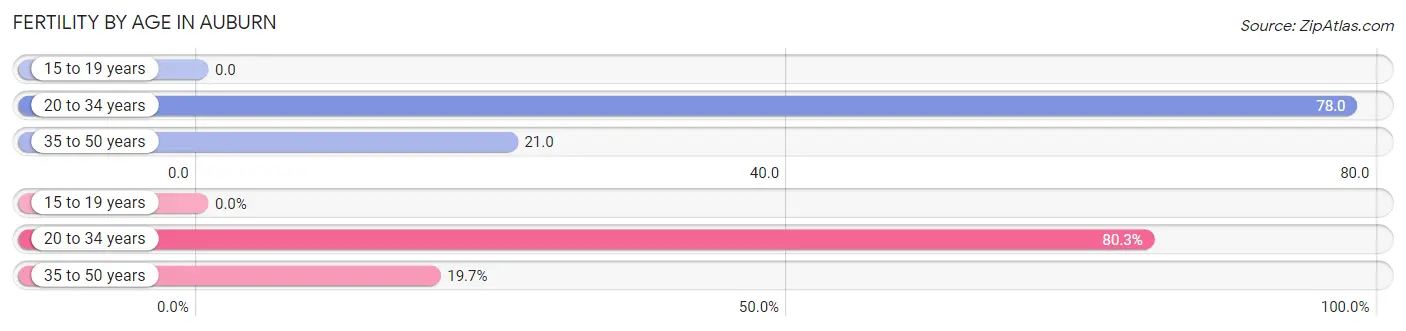
| Age Bracket | Women with Births | Births / 1,000 Women |
| 15 to 19 years | 0 (0.0%) | 0.0 |
| 20 to 34 years | 106 (80.3%) | 78.0 |
| 35 to 50 years | 26 (19.7%) | 21.0 |
| Total | 132 (100.0%) | 46.0 |
Fertility by Age by Marriage Status in Auburn
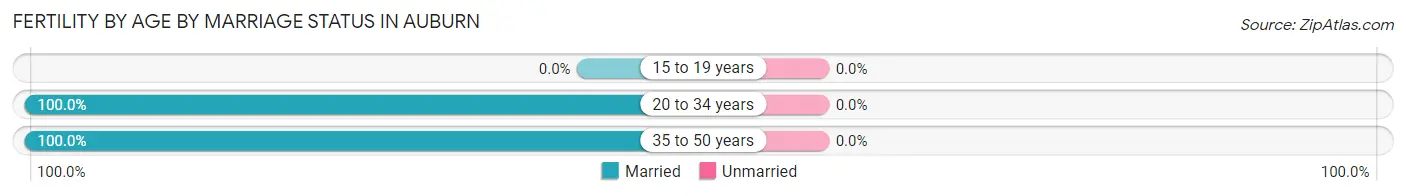
| Age Bracket | Married | Unmarried |
| 15 to 19 years | 0 (0.0%) | 0 (0.0%) |
| 20 to 34 years | 106 (100.0%) | 0 (0.0%) |
| 35 to 50 years | 26 (100.0%) | 0 (0.0%) |
| Total | 132 (100.0%) | 0 (0.0%) |
Fertility by Education in Auburn
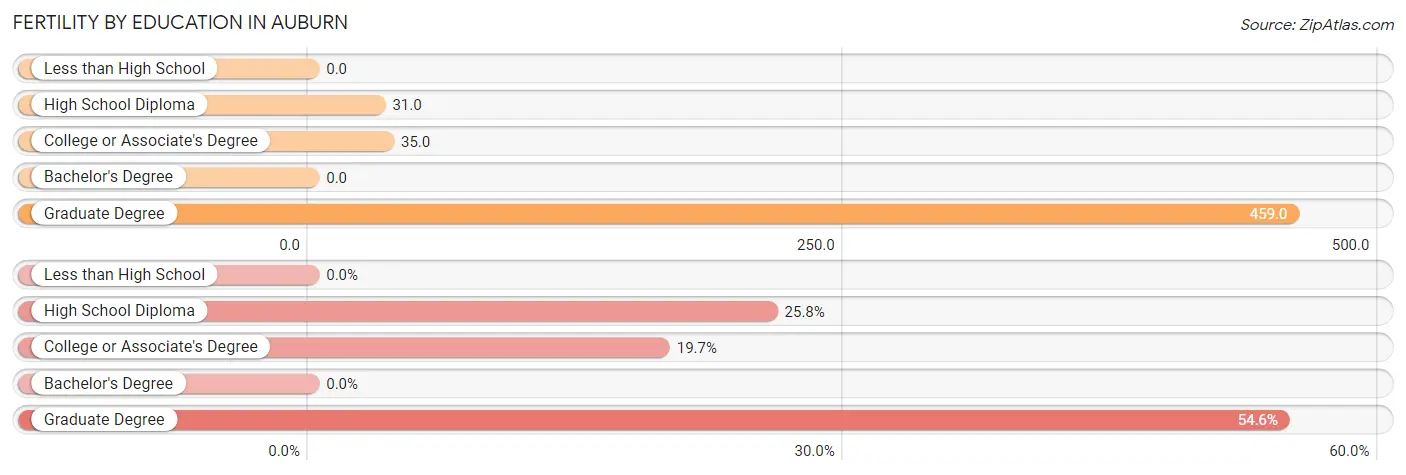
| Educational Attainment | Women with Births | Births / 1,000 Women |
| Less than High School | 0 (0.0%) | 0.0 |
| High School Diploma | 34 (25.8%) | 31.0 |
| College or Associate's Degree | 26 (19.7%) | 35.0 |
| Bachelor's Degree | 0 (0.0%) | 0.0 |
| Graduate Degree | 72 (54.5%) | 459.0 |
| Total | 132 (100.0%) | 46.0 |
Fertility by Education by Marriage Status in Auburn
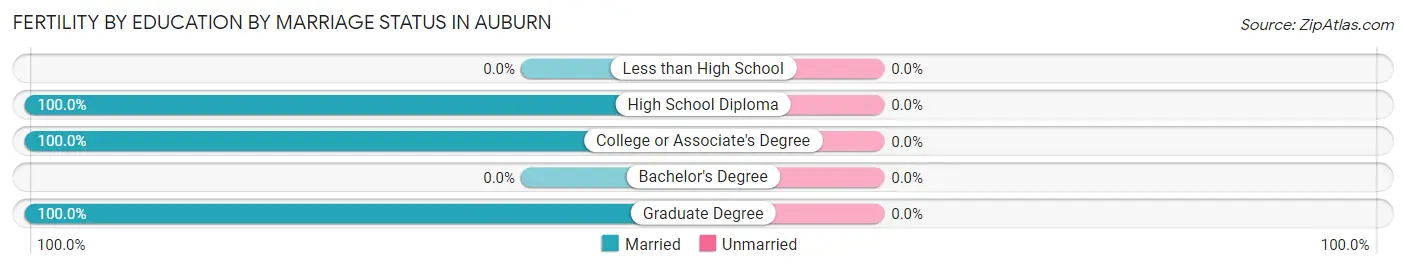
| Educational Attainment | Married | Unmarried |
| Less than High School | 0 (0.0%) | 0 (0.0%) |
| High School Diploma | 34 (100.0%) | 0 (0.0%) |
| College or Associate's Degree | 26 (100.0%) | 0 (0.0%) |
| Bachelor's Degree | 0 (0.0%) | 0 (0.0%) |
| Graduate Degree | 72 (100.0%) | 0 (0.0%) |
| Total | 132 (100.0%) | 0 (0.0%) |
Employment Characteristics in Auburn
Employment by Class of Employer in Auburn
Among the 6,656 employed individuals in Auburn, private company employees (4,934 | 74.1%), not-for-profit organizations (747 | 11.2%), and local government employees (443 | 6.7%) make up the most common classes of employment.
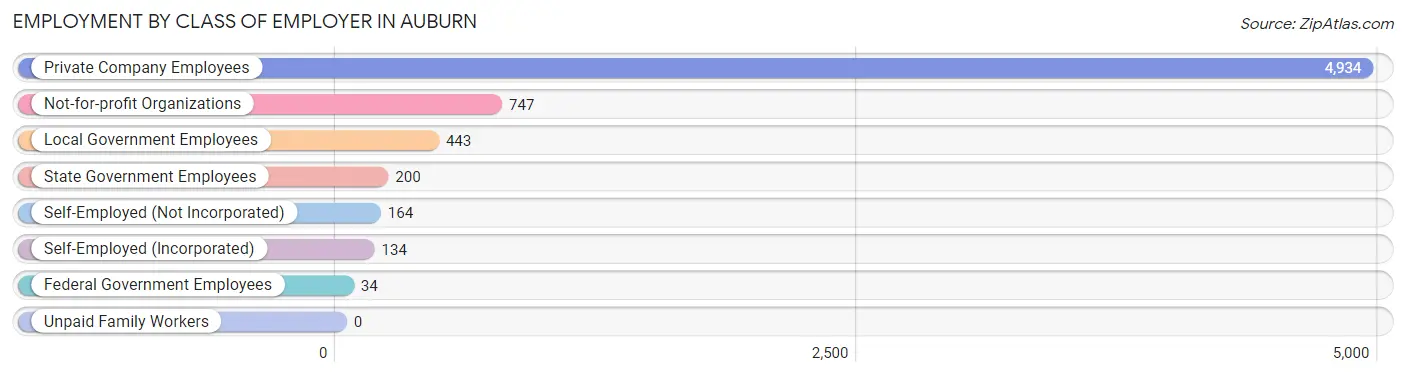
| Employer Class | # Employees | % Employees |
| Private Company Employees | 4,934 | 74.1% |
| Self-Employed (Incorporated) | 134 | 2.0% |
| Self-Employed (Not Incorporated) | 164 | 2.5% |
| Not-for-profit Organizations | 747 | 11.2% |
| Local Government Employees | 443 | 6.7% |
| State Government Employees | 200 | 3.0% |
| Federal Government Employees | 34 | 0.5% |
| Unpaid Family Workers | 0 | 0.0% |
| Total | 6,656 | 100.0% |
Employment Status by Age in Auburn
According to the labor force statistics for Auburn, out of the total population over 16 years of age (10,301), 69.3% or 7,139 individuals are in the labor force, with 5.5% or 393 of them unemployed. The age group with the highest labor force participation rate is 35 to 44 years, with 92.6% or 1,498 individuals in the labor force. Within the labor force, the 16 to 19 years age range has the highest percentage of unemployed individuals, with 18.9% or 65 of them being unemployed.
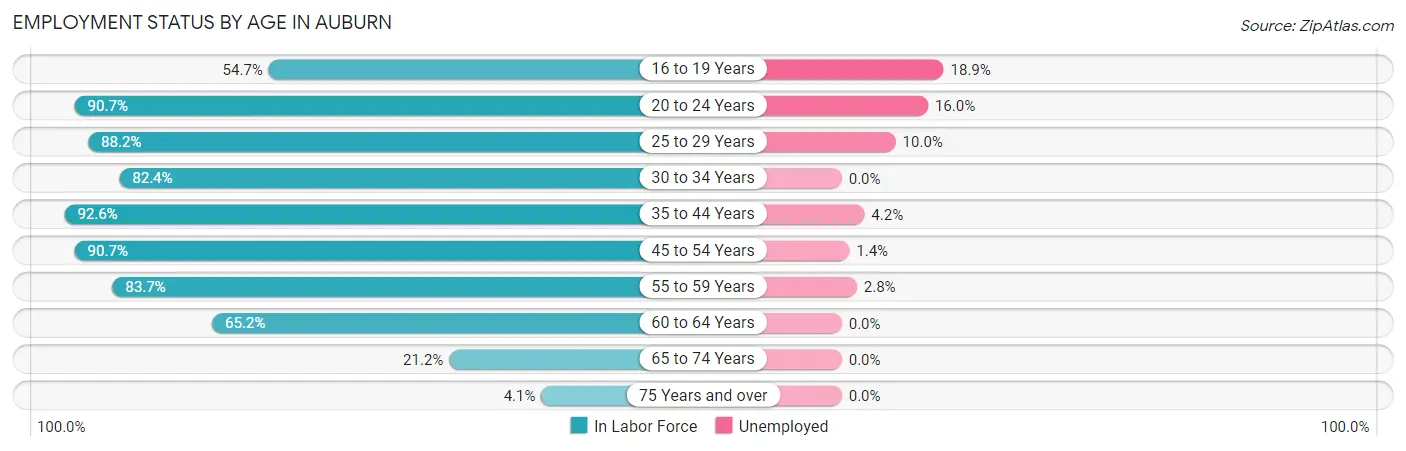
| Age Bracket | In Labor Force | Unemployed |
| 16 to 19 Years | 344 (54.7%) | 65 (18.9%) |
| 20 to 24 Years | 908 (90.7%) | 145 (16.0%) |
| 25 to 29 Years | 814 (88.2%) | 81 (10.0%) |
| 30 to 34 Years | 778 (82.4%) | 0 (0.0%) |
| 35 to 44 Years | 1,498 (92.6%) | 63 (4.2%) |
| 45 to 54 Years | 1,319 (90.7%) | 18 (1.4%) |
| 55 to 59 Years | 756 (83.7%) | 21 (2.8%) |
| 60 to 64 Years | 423 (65.2%) | 0 (0.0%) |
| 65 to 74 Years | 258 (21.2%) | 0 (0.0%) |
| 75 Years and over | 40 (4.1%) | 0 (0.0%) |
| Total | 7,139 (69.3%) | 393 (5.5%) |
Employment Status by Educational Attainment in Auburn
According to labor force statistics for Auburn, 86.1% of individuals (5,589) out of the total population between 25 and 64 years of age (6,491) are in the labor force, with 3.3% or 184 of them being unemployed. The group with the highest labor force participation rate are those with the educational attainment of bachelor's degree or higher, with 96.1% or 1,282 individuals in the labor force. Within the labor force, individuals with less than high school education have the highest percentage of unemployment, with 54.8% or 144 of them being unemployed.
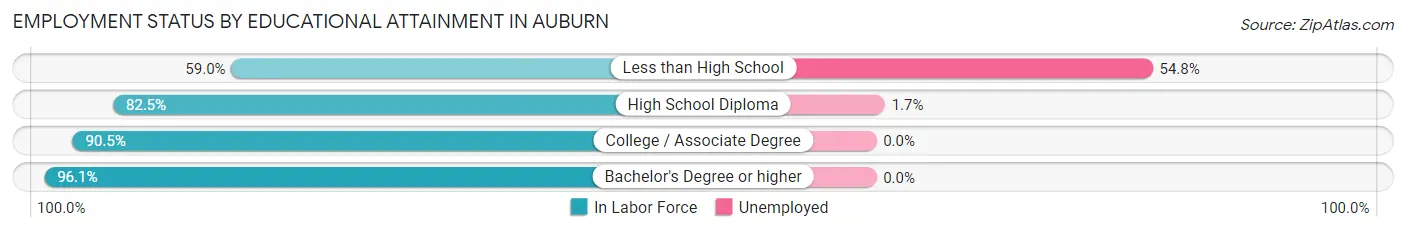
| Educational Attainment | In Labor Force | Unemployed |
| Less than High School | 263 (59.0%) | 244 (54.8%) |
| High School Diploma | 2,287 (82.5%) | 47 (1.7%) |
| College / Associate Degree | 1,755 (90.5%) | 0 (0.0%) |
| Bachelor's Degree or higher | 1,282 (96.1%) | 0 (0.0%) |
| Total | 5,589 (86.1%) | 214 (3.3%) |
Employment Occupations by Sex in Auburn
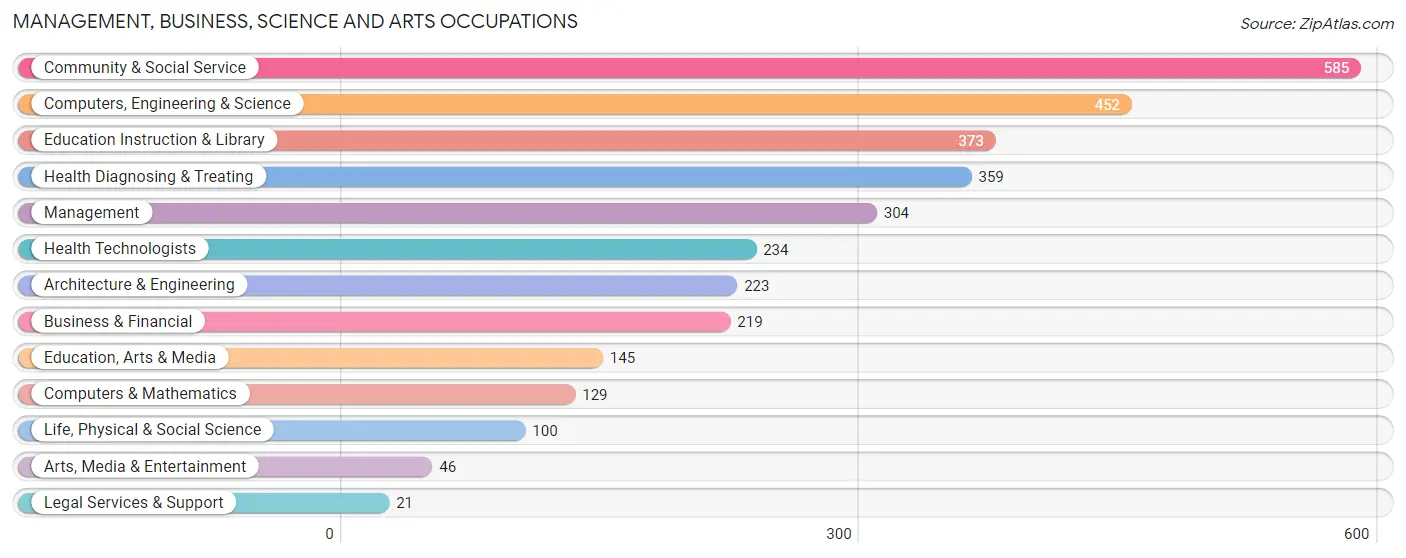
Management, Business, Science and Arts Occupations
The most common Management, Business, Science and Arts occupations in Auburn are Community & Social Service (585 | 8.7%), Computers, Engineering & Science (452 | 6.7%), Education Instruction & Library (373 | 5.5%), Health Diagnosing & Treating (359 | 5.3%), and Management (304 | 4.5%).
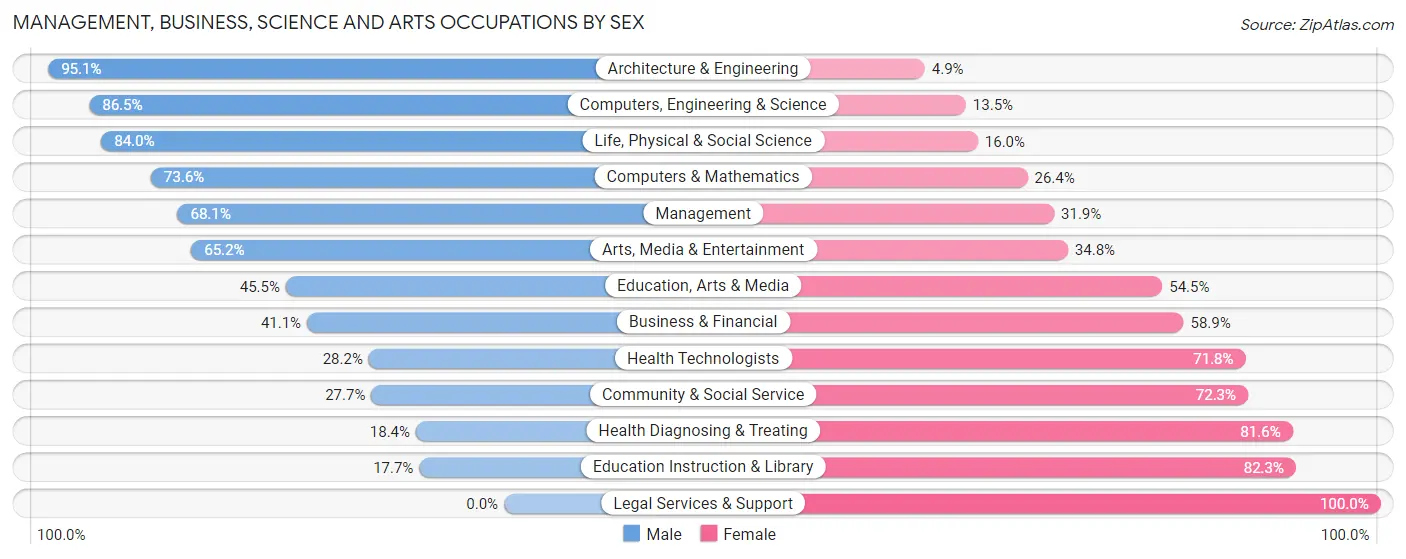
Management, Business, Science and Arts Occupations by Sex
Within the Management, Business, Science and Arts occupations in Auburn, the most male-oriented occupations are Architecture & Engineering (95.1%), Computers, Engineering & Science (86.5%), and Life, Physical & Social Science (84.0%), while the most female-oriented occupations are Legal Services & Support (100.0%), Education Instruction & Library (82.3%), and Health Diagnosing & Treating (81.6%).
| Occupation | Male | Female |
| Management | 207 (68.1%) | 97 (31.9%) |
| Business & Financial | 90 (41.1%) | 129 (58.9%) |
| Computers, Engineering & Science | 391 (86.5%) | 61 (13.5%) |
| Computers & Mathematics | 95 (73.6%) | 34 (26.4%) |
| Architecture & Engineering | 212 (95.1%) | 11 (4.9%) |
| Life, Physical & Social Science | 84 (84.0%) | 16 (16.0%) |
| Community & Social Service | 162 (27.7%) | 423 (72.3%) |
| Education, Arts & Media | 66 (45.5%) | 79 (54.5%) |
| Legal Services & Support | 0 (0.0%) | 21 (100.0%) |
| Education Instruction & Library | 66 (17.7%) | 307 (82.3%) |
| Arts, Media & Entertainment | 30 (65.2%) | 16 (34.8%) |
| Health Diagnosing & Treating | 66 (18.4%) | 293 (81.6%) |
| Health Technologists | 66 (28.2%) | 168 (71.8%) |
| Total (Category) | 916 (47.7%) | 1,003 (52.3%) |
| Total (Overall) | 3,571 (52.9%) | 3,174 (47.1%) |
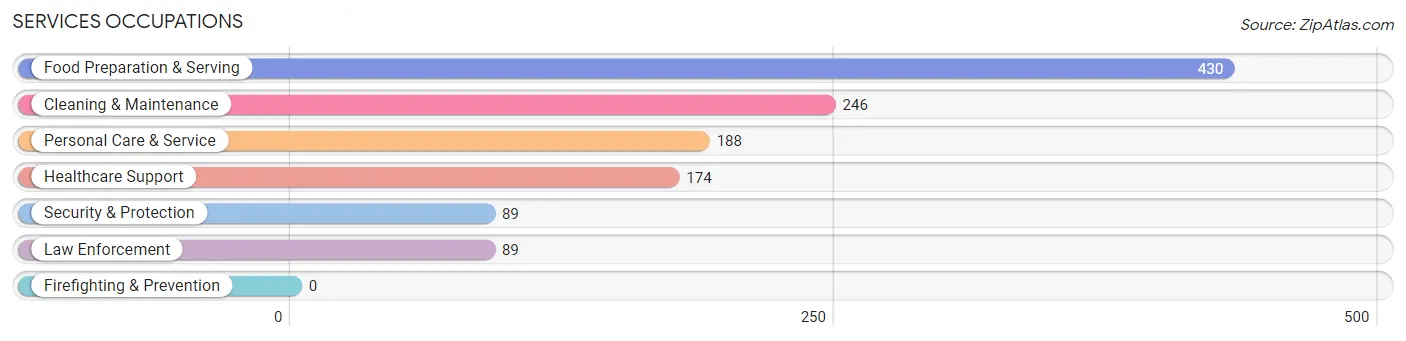
Services Occupations
The most common Services occupations in Auburn are Food Preparation & Serving (430 | 6.4%), Cleaning & Maintenance (246 | 3.6%), Personal Care & Service (188 | 2.8%), Healthcare Support (174 | 2.6%), and Security & Protection (89 | 1.3%).
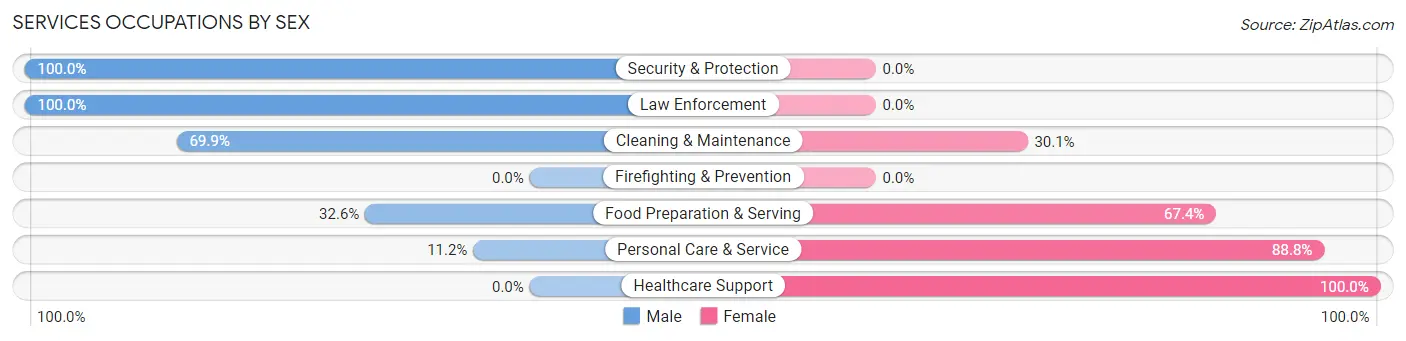
Services Occupations by Sex
Within the Services occupations in Auburn, the most male-oriented occupations are Security & Protection (100.0%), Law Enforcement (100.0%), and Cleaning & Maintenance (69.9%), while the most female-oriented occupations are Healthcare Support (100.0%), Personal Care & Service (88.8%), and Food Preparation & Serving (67.4%).
| Occupation | Male | Female |
| Healthcare Support | 0 (0.0%) | 174 (100.0%) |
| Security & Protection | 89 (100.0%) | 0 (0.0%) |
| Firefighting & Prevention | 0 (0.0%) | 0 (0.0%) |
| Law Enforcement | 89 (100.0%) | 0 (0.0%) |
| Food Preparation & Serving | 140 (32.6%) | 290 (67.4%) |
| Cleaning & Maintenance | 172 (69.9%) | 74 (30.1%) |
| Personal Care & Service | 21 (11.2%) | 167 (88.8%) |
| Total (Category) | 422 (37.4%) | 705 (62.6%) |
| Total (Overall) | 3,571 (52.9%) | 3,174 (47.1%) |
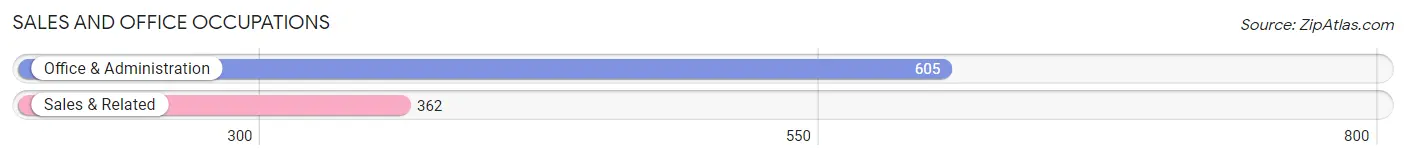
Sales and Office Occupations
The most common Sales and Office occupations in Auburn are Office & Administration (605 | 9.0%), and Sales & Related (362 | 5.4%).
Sales and Office Occupations by Sex
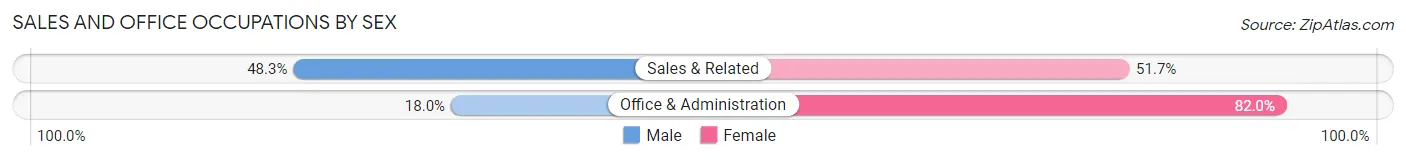
| Occupation | Male | Female |
| Sales & Related | 175 (48.3%) | 187 (51.7%) |
| Office & Administration | 109 (18.0%) | 496 (82.0%) |
| Total (Category) | 284 (29.4%) | 683 (70.6%) |
| Total (Overall) | 3,571 (52.9%) | 3,174 (47.1%) |
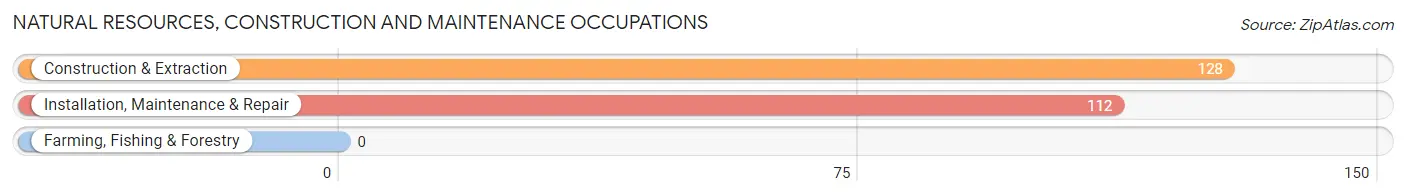
Natural Resources, Construction and Maintenance Occupations
The most common Natural Resources, Construction and Maintenance occupations in Auburn are Construction & Extraction (128 | 1.9%), and Installation, Maintenance & Repair (112 | 1.7%).
Natural Resources, Construction and Maintenance Occupations by Sex
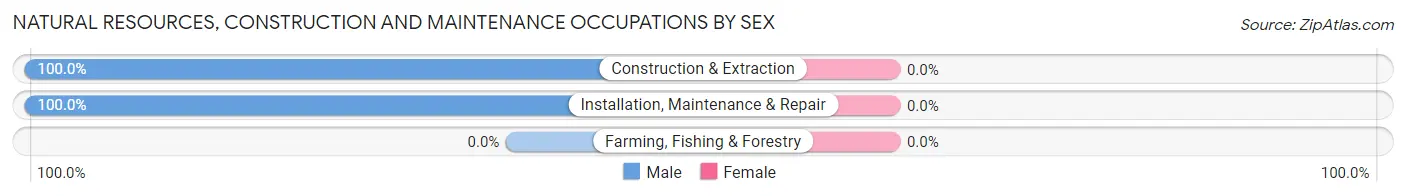
| Occupation | Male | Female |
| Farming, Fishing & Forestry | 0 (0.0%) | 0 (0.0%) |
| Construction & Extraction | 128 (100.0%) | 0 (0.0%) |
| Installation, Maintenance & Repair | 112 (100.0%) | 0 (0.0%) |
| Total (Category) | 240 (100.0%) | 0 (0.0%) |
| Total (Overall) | 3,571 (52.9%) | 3,174 (47.1%) |
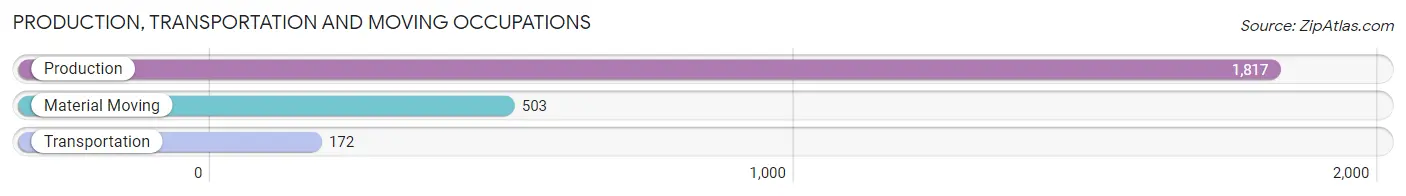
Production, Transportation and Moving Occupations
The most common Production, Transportation and Moving occupations in Auburn are Production (1,817 | 26.9%), Material Moving (503 | 7.5%), and Transportation (172 | 2.5%).
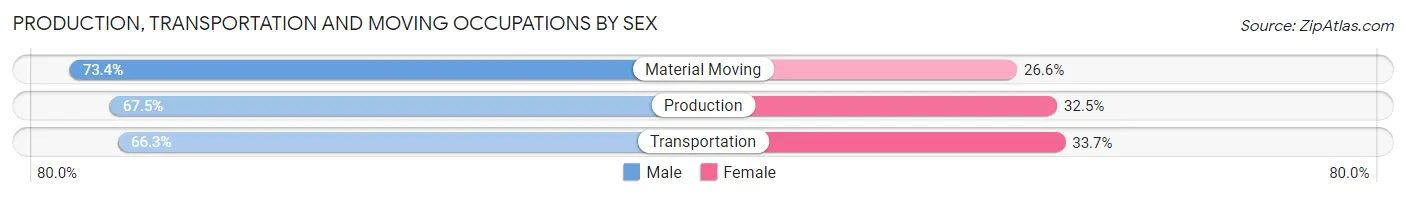
Production, Transportation and Moving Occupations by Sex
| Occupation | Male | Female |
| Production | 1,226 (67.5%) | 591 (32.5%) |
| Transportation | 114 (66.3%) | 58 (33.7%) |
| Material Moving | 369 (73.4%) | 134 (26.6%) |
| Total (Category) | 1,709 (68.6%) | 783 (31.4%) |
| Total (Overall) | 3,571 (52.9%) | 3,174 (47.1%) |
Employment Industries by Sex in Auburn
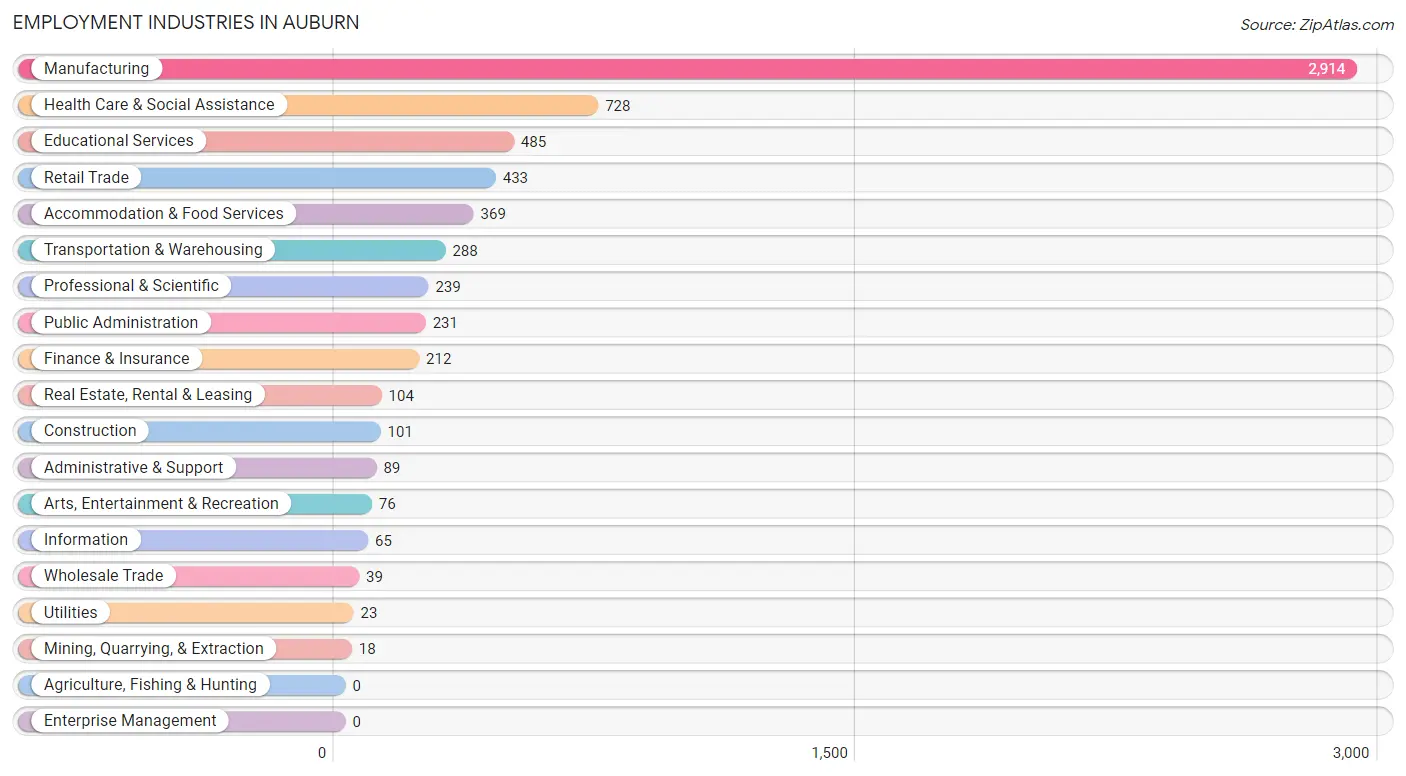
Employment Industries in Auburn
The major employment industries in Auburn include Manufacturing (2,914 | 43.2%), Health Care & Social Assistance (728 | 10.8%), Educational Services (485 | 7.2%), Retail Trade (433 | 6.4%), and Accommodation & Food Services (369 | 5.5%).
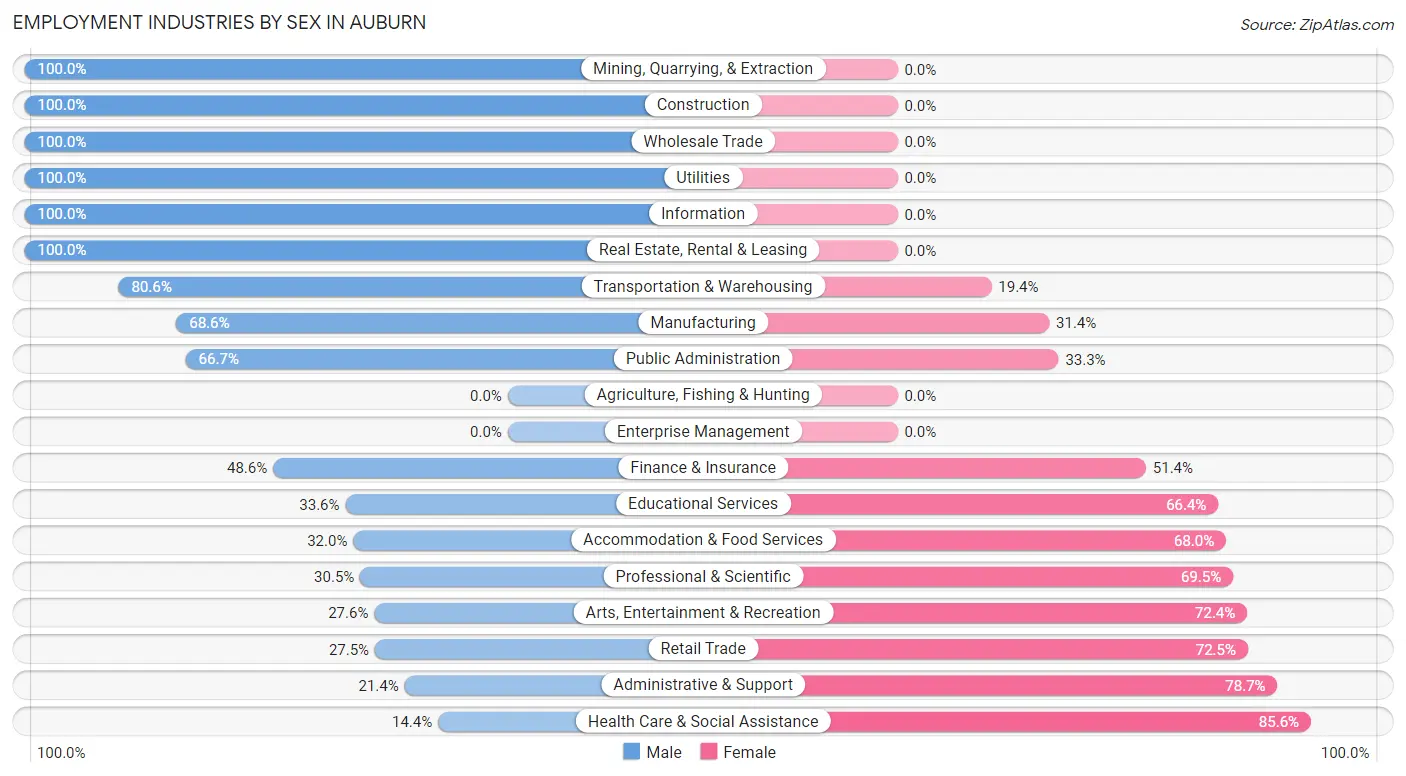
Employment Industries by Sex in Auburn
The Auburn industries that see more men than women are Mining, Quarrying, & Extraction (100.0%), Construction (100.0%), and Wholesale Trade (100.0%), whereas the industries that tend to have a higher number of women are Health Care & Social Assistance (85.6%), Administrative & Support (78.6%), and Retail Trade (72.5%).
| Industry | Male | Female |
| Agriculture, Fishing & Hunting | 0 (0.0%) | 0 (0.0%) |
| Mining, Quarrying, & Extraction | 18 (100.0%) | 0 (0.0%) |
| Construction | 101 (100.0%) | 0 (0.0%) |
| Manufacturing | 1,999 (68.6%) | 915 (31.4%) |
| Wholesale Trade | 39 (100.0%) | 0 (0.0%) |
| Retail Trade | 119 (27.5%) | 314 (72.5%) |
| Transportation & Warehousing | 232 (80.6%) | 56 (19.4%) |
| Utilities | 23 (100.0%) | 0 (0.0%) |
| Information | 65 (100.0%) | 0 (0.0%) |
| Finance & Insurance | 103 (48.6%) | 109 (51.4%) |
| Real Estate, Rental & Leasing | 104 (100.0%) | 0 (0.0%) |
| Professional & Scientific | 73 (30.5%) | 166 (69.5%) |
| Enterprise Management | 0 (0.0%) | 0 (0.0%) |
| Administrative & Support | 19 (21.3%) | 70 (78.6%) |
| Educational Services | 163 (33.6%) | 322 (66.4%) |
| Health Care & Social Assistance | 105 (14.4%) | 623 (85.6%) |
| Arts, Entertainment & Recreation | 21 (27.6%) | 55 (72.4%) |
| Accommodation & Food Services | 118 (32.0%) | 251 (68.0%) |
| Public Administration | 154 (66.7%) | 77 (33.3%) |
| Total | 3,571 (52.9%) | 3,174 (47.1%) |
Education in Auburn
School Enrollment in Auburn
The most common levels of schooling among the 3,069 students in Auburn are high school (891 | 29.0%), elementary school (712 | 23.2%), and middle school (600 | 19.6%).
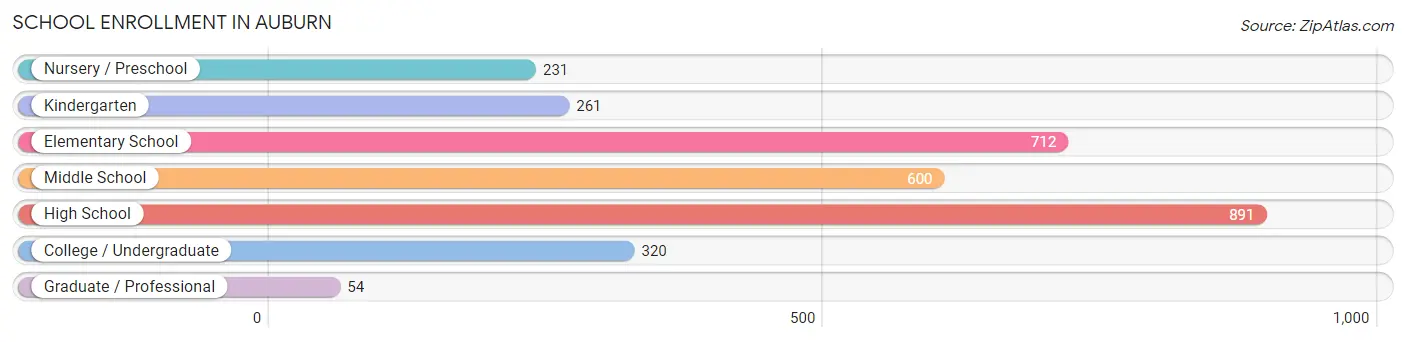
| School Level | # Students | % Students |
| Nursery / Preschool | 231 | 7.5% |
| Kindergarten | 261 | 8.5% |
| Elementary School | 712 | 23.2% |
| Middle School | 600 | 19.6% |
| High School | 891 | 29.0% |
| College / Undergraduate | 320 | 10.4% |
| Graduate / Professional | 54 | 1.8% |
| Total | 3,069 | 100.0% |
School Enrollment by Age by Funding Source in Auburn
Out of a total of 3,069 students who are enrolled in schools in Auburn, 648 (21.1%) attend a private institution, while the remaining 2,421 (78.9%) are enrolled in public schools. The age group of 3 to 4 year olds has the highest likelihood of being enrolled in private schools, with 106 (46.5% in the age bracket) enrolled. Conversely, the age group of 10 to 14 year olds has the lowest likelihood of being enrolled in a private school, with 804 (88.8% in the age bracket) attending a public institution.
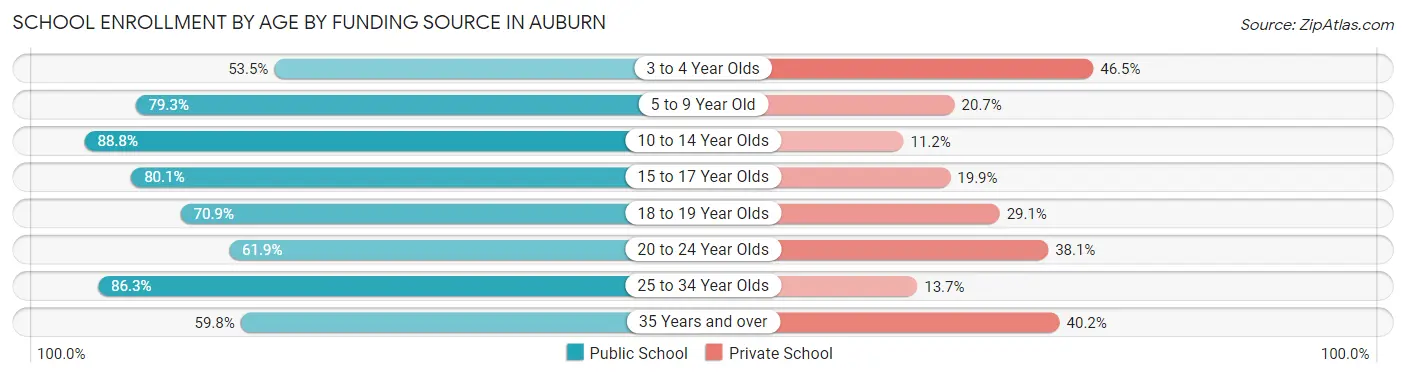
| Age Bracket | Public School | Private School |
| 3 to 4 Year Olds | 122 (53.5%) | 106 (46.5%) |
| 5 to 9 Year Old | 649 (79.3%) | 169 (20.7%) |
| 10 to 14 Year Olds | 804 (88.8%) | 101 (11.2%) |
| 15 to 17 Year Olds | 476 (80.1%) | 118 (19.9%) |
| 18 to 19 Year Olds | 144 (70.9%) | 59 (29.1%) |
| 20 to 24 Year Olds | 65 (61.9%) | 40 (38.1%) |
| 25 to 34 Year Olds | 107 (86.3%) | 17 (13.7%) |
| 35 Years and over | 55 (59.8%) | 37 (40.2%) |
| Total | 2,421 (78.9%) | 648 (21.1%) |
Educational Attainment by Field of Study in Auburn
Business (455 | 24.0%), education (330 | 17.4%), arts & humanities (167 | 8.8%), science & technology (161 | 8.5%), and psychology (144 | 7.6%) are the most common fields of study among 1,893 individuals in Auburn who have obtained a bachelor's degree or higher.
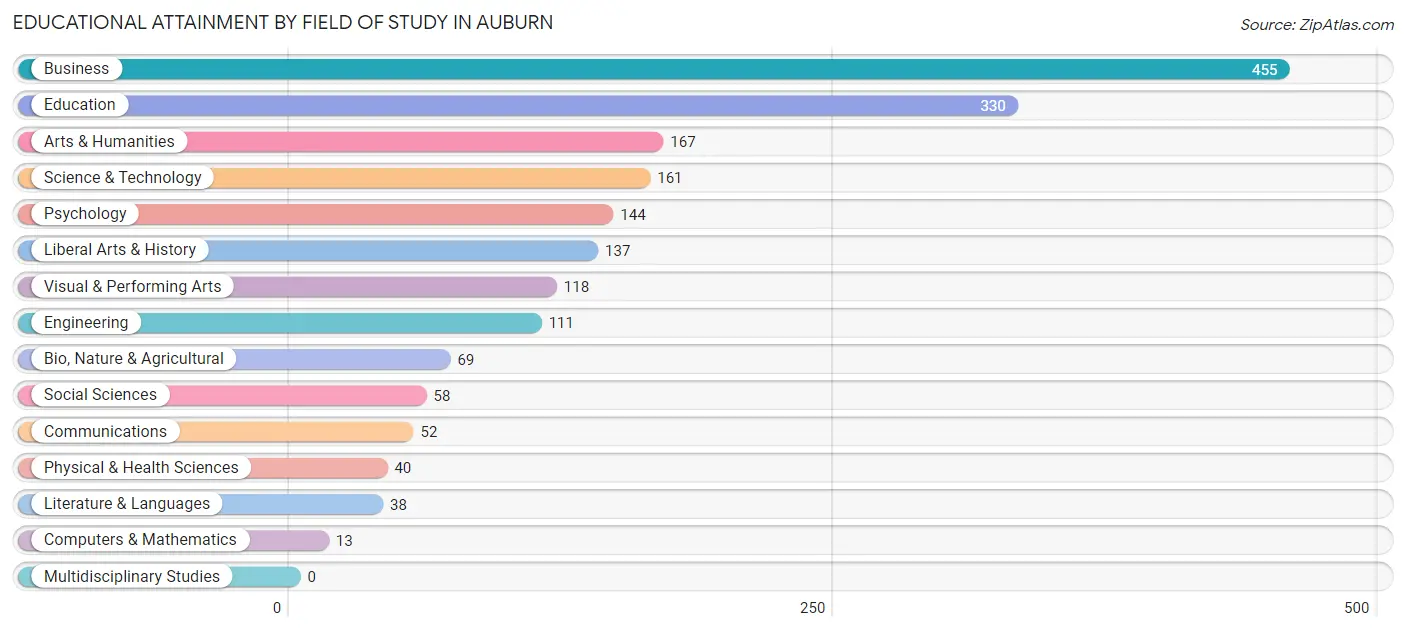
| Field of Study | # Graduates | % Graduates |
| Computers & Mathematics | 13 | 0.7% |
| Bio, Nature & Agricultural | 69 | 3.6% |
| Physical & Health Sciences | 40 | 2.1% |
| Psychology | 144 | 7.6% |
| Social Sciences | 58 | 3.1% |
| Engineering | 111 | 5.9% |
| Multidisciplinary Studies | 0 | 0.0% |
| Science & Technology | 161 | 8.5% |
| Business | 455 | 24.0% |
| Education | 330 | 17.4% |
| Literature & Languages | 38 | 2.0% |
| Liberal Arts & History | 137 | 7.2% |
| Visual & Performing Arts | 118 | 6.2% |
| Communications | 52 | 2.8% |
| Arts & Humanities | 167 | 8.8% |
| Total | 1,893 | 100.0% |
Transportation & Commute in Auburn
Vehicle Availability by Sex in Auburn
The most prevalent vehicle ownership categories in Auburn are males with 2 vehicles (1,437, accounting for 40.7%) and females with 2 vehicles (1,439, making up 46.1%).
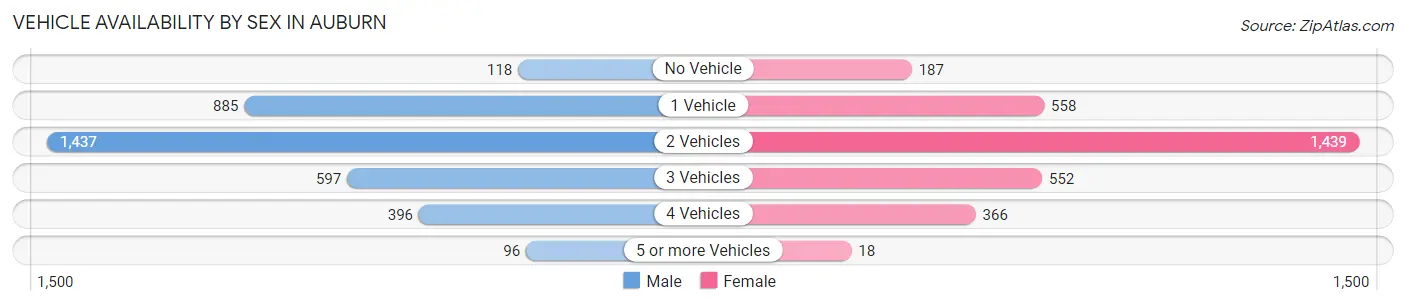
| Vehicles Available | Male | Female |
| No Vehicle | 118 (3.3%) | 187 (6.0%) |
| 1 Vehicle | 885 (25.1%) | 558 (17.9%) |
| 2 Vehicles | 1,437 (40.7%) | 1,439 (46.1%) |
| 3 Vehicles | 597 (16.9%) | 552 (17.7%) |
| 4 Vehicles | 396 (11.2%) | 366 (11.7%) |
| 5 or more Vehicles | 96 (2.7%) | 18 (0.6%) |
| Total | 3,529 (100.0%) | 3,120 (100.0%) |
Commute Time in Auburn
The most frequently occuring commute durations in Auburn are 5 to 9 minutes (1,616 commuters, 24.8%), 10 to 14 minutes (1,272 commuters, 19.5%), and 25 to 29 minutes (811 commuters, 12.4%).
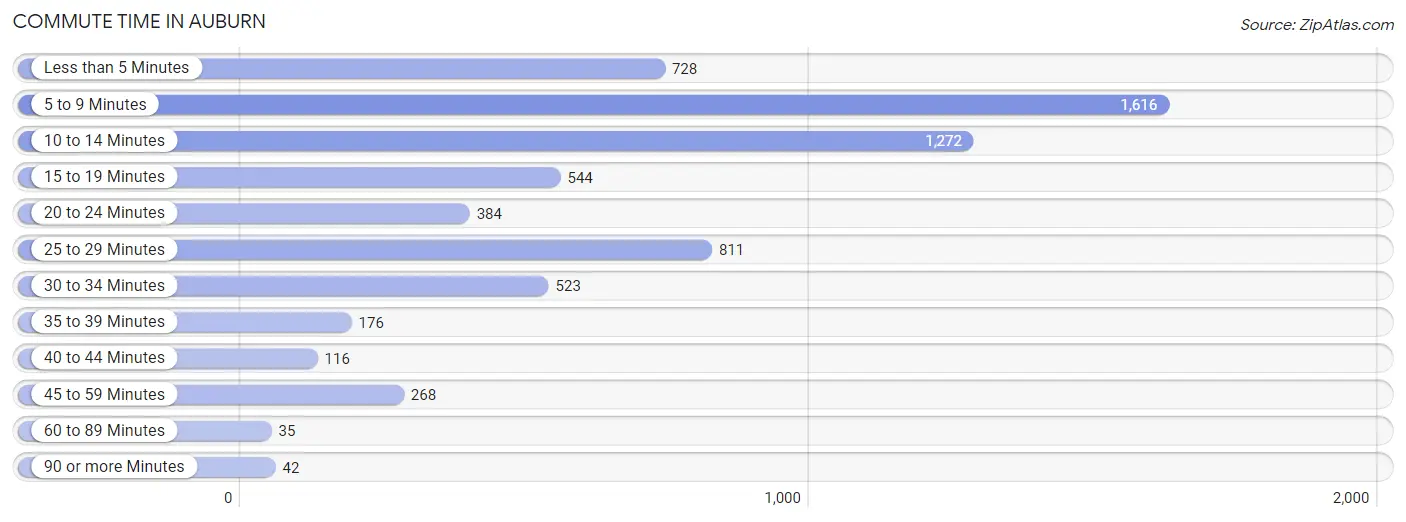
| Commute Time | # Commuters | % Commuters |
| Less than 5 Minutes | 728 | 11.2% |
| 5 to 9 Minutes | 1,616 | 24.8% |
| 10 to 14 Minutes | 1,272 | 19.5% |
| 15 to 19 Minutes | 544 | 8.4% |
| 20 to 24 Minutes | 384 | 5.9% |
| 25 to 29 Minutes | 811 | 12.4% |
| 30 to 34 Minutes | 523 | 8.0% |
| 35 to 39 Minutes | 176 | 2.7% |
| 40 to 44 Minutes | 116 | 1.8% |
| 45 to 59 Minutes | 268 | 4.1% |
| 60 to 89 Minutes | 35 | 0.5% |
| 90 or more Minutes | 42 | 0.6% |
Commute Time by Sex in Auburn
The most common commute times in Auburn are 5 to 9 minutes (894 commuters, 25.3%) for males and 5 to 9 minutes (722 commuters, 24.2%) for females.
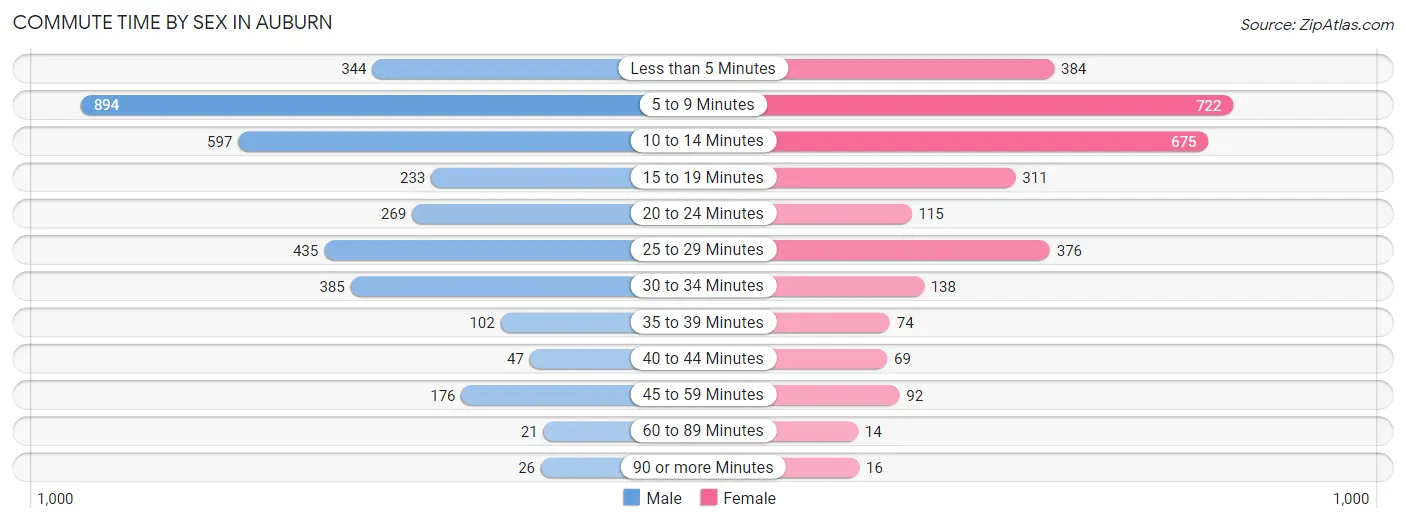
| Commute Time | Male | Female |
| Less than 5 Minutes | 344 (9.8%) | 384 (12.9%) |
| 5 to 9 Minutes | 894 (25.3%) | 722 (24.2%) |
| 10 to 14 Minutes | 597 (16.9%) | 675 (22.6%) |
| 15 to 19 Minutes | 233 (6.6%) | 311 (10.4%) |
| 20 to 24 Minutes | 269 (7.6%) | 115 (3.8%) |
| 25 to 29 Minutes | 435 (12.3%) | 376 (12.6%) |
| 30 to 34 Minutes | 385 (10.9%) | 138 (4.6%) |
| 35 to 39 Minutes | 102 (2.9%) | 74 (2.5%) |
| 40 to 44 Minutes | 47 (1.3%) | 69 (2.3%) |
| 45 to 59 Minutes | 176 (5.0%) | 92 (3.1%) |
| 60 to 89 Minutes | 21 (0.6%) | 14 (0.5%) |
| 90 or more Minutes | 26 (0.7%) | 16 (0.5%) |
Time of Departure to Work by Sex in Auburn
The most frequent times of departure to work in Auburn are 4:00 PM to 11:59 PM (496, 14.1%) for males and 7:30 AM to 7:59 AM (443, 14.8%) for females.
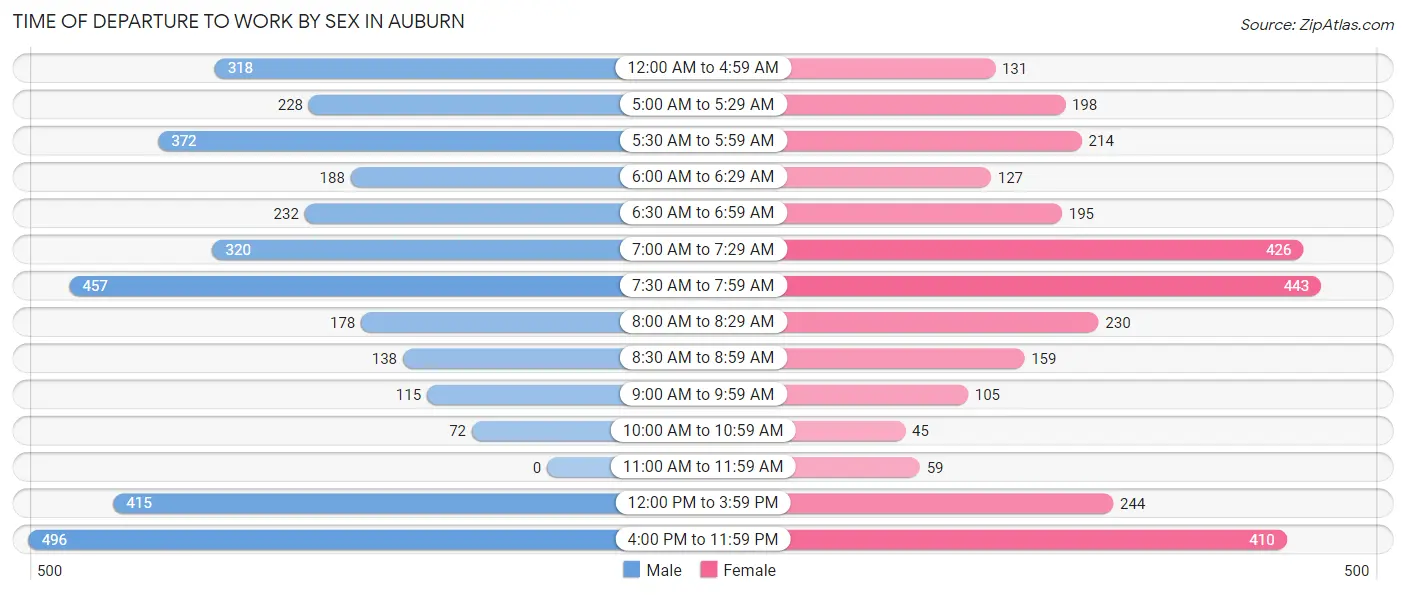
| Time of Departure | Male | Female |
| 12:00 AM to 4:59 AM | 318 (9.0%) | 131 (4.4%) |
| 5:00 AM to 5:29 AM | 228 (6.5%) | 198 (6.6%) |
| 5:30 AM to 5:59 AM | 372 (10.5%) | 214 (7.2%) |
| 6:00 AM to 6:29 AM | 188 (5.3%) | 127 (4.3%) |
| 6:30 AM to 6:59 AM | 232 (6.6%) | 195 (6.5%) |
| 7:00 AM to 7:29 AM | 320 (9.1%) | 426 (14.3%) |
| 7:30 AM to 7:59 AM | 457 (13.0%) | 443 (14.8%) |
| 8:00 AM to 8:29 AM | 178 (5.0%) | 230 (7.7%) |
| 8:30 AM to 8:59 AM | 138 (3.9%) | 159 (5.3%) |
| 9:00 AM to 9:59 AM | 115 (3.3%) | 105 (3.5%) |
| 10:00 AM to 10:59 AM | 72 (2.0%) | 45 (1.5%) |
| 11:00 AM to 11:59 AM | 0 (0.0%) | 59 (2.0%) |
| 12:00 PM to 3:59 PM | 415 (11.8%) | 244 (8.2%) |
| 4:00 PM to 11:59 PM | 496 (14.1%) | 410 (13.7%) |
| Total | 3,529 (100.0%) | 2,986 (100.0%) |
Housing Occupancy in Auburn
Occupancy by Ownership in Auburn
Of the total 5,578 dwellings in Auburn, owner-occupied units account for 4,069 (73.0%), while renter-occupied units make up 1,509 (27.1%).
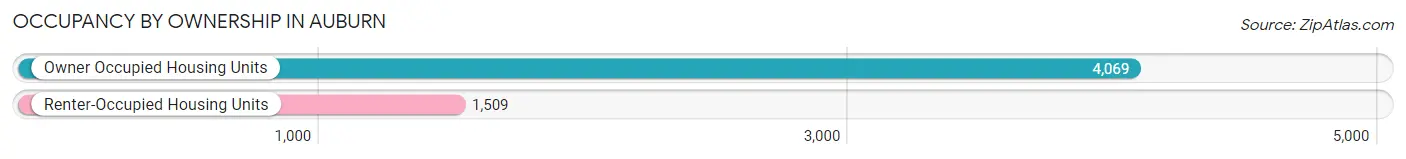
| Occupancy | # Housing Units | % Housing Units |
| Owner Occupied Housing Units | 4,069 | 73.0% |
| Renter-Occupied Housing Units | 1,509 | 27.1% |
| Total Occupied Housing Units | 5,578 | 100.0% |
Occupancy by Household Size in Auburn
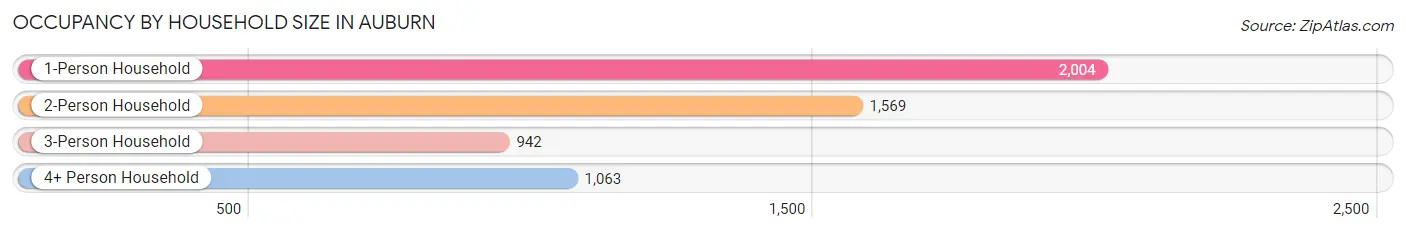
| Household Size | # Housing Units | % Housing Units |
| 1-Person Household | 2,004 | 35.9% |
| 2-Person Household | 1,569 | 28.1% |
| 3-Person Household | 942 | 16.9% |
| 4+ Person Household | 1,063 | 19.1% |
| Total Housing Units | 5,578 | 100.0% |
Occupancy by Ownership by Household Size in Auburn
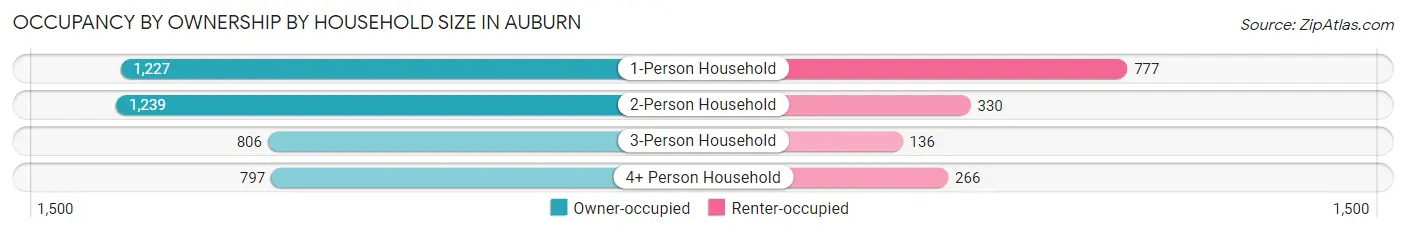
| Household Size | Owner-occupied | Renter-occupied |
| 1-Person Household | 1,227 (61.2%) | 777 (38.8%) |
| 2-Person Household | 1,239 (79.0%) | 330 (21.0%) |
| 3-Person Household | 806 (85.6%) | 136 (14.4%) |
| 4+ Person Household | 797 (75.0%) | 266 (25.0%) |
| Total Housing Units | 4,069 (73.0%) | 1,509 (27.1%) |
Occupancy by Educational Attainment in Auburn
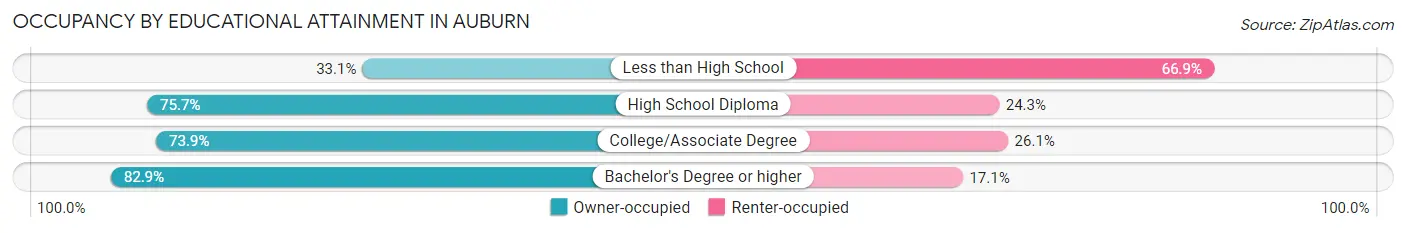
| Household Size | Owner-occupied | Renter-occupied |
| Less than High School | 160 (33.1%) | 324 (66.9%) |
| High School Diploma | 1,772 (75.7%) | 569 (24.3%) |
| College/Associate Degree | 1,197 (73.9%) | 422 (26.1%) |
| Bachelor's Degree or higher | 940 (82.9%) | 194 (17.1%) |
Occupancy by Age of Householder in Auburn
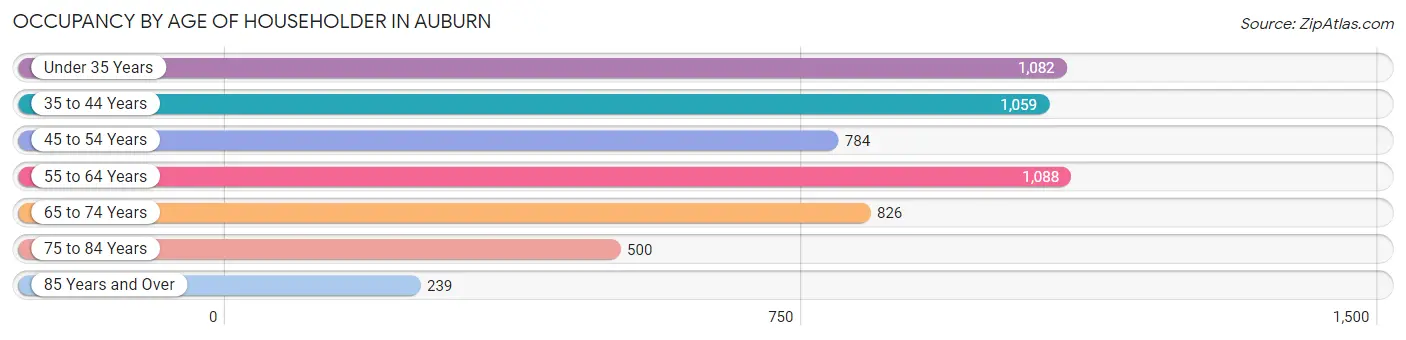
| Age Bracket | # Households | % Households |
| Under 35 Years | 1,082 | 19.4% |
| 35 to 44 Years | 1,059 | 19.0% |
| 45 to 54 Years | 784 | 14.1% |
| 55 to 64 Years | 1,088 | 19.5% |
| 65 to 74 Years | 826 | 14.8% |
| 75 to 84 Years | 500 | 9.0% |
| 85 Years and Over | 239 | 4.3% |
| Total | 5,578 | 100.0% |
Housing Finances in Auburn
Median Income by Occupancy in Auburn
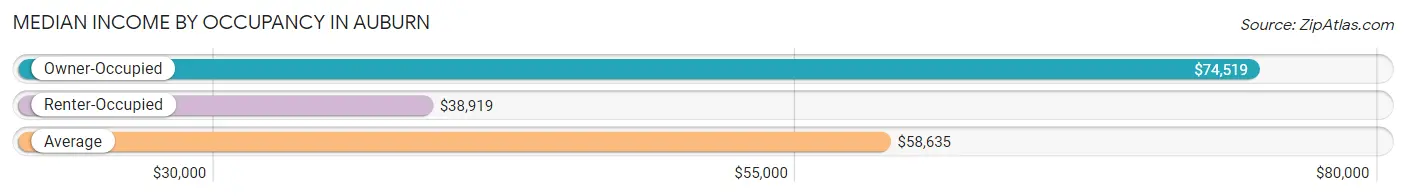
| Occupancy Type | # Households | Median Income |
| Owner-Occupied | 4,069 (73.0%) | $74,519 |
| Renter-Occupied | 1,509 (27.1%) | $38,919 |
| Average | 5,578 (100.0%) | $58,635 |
Occupancy by Householder Income Bracket in Auburn
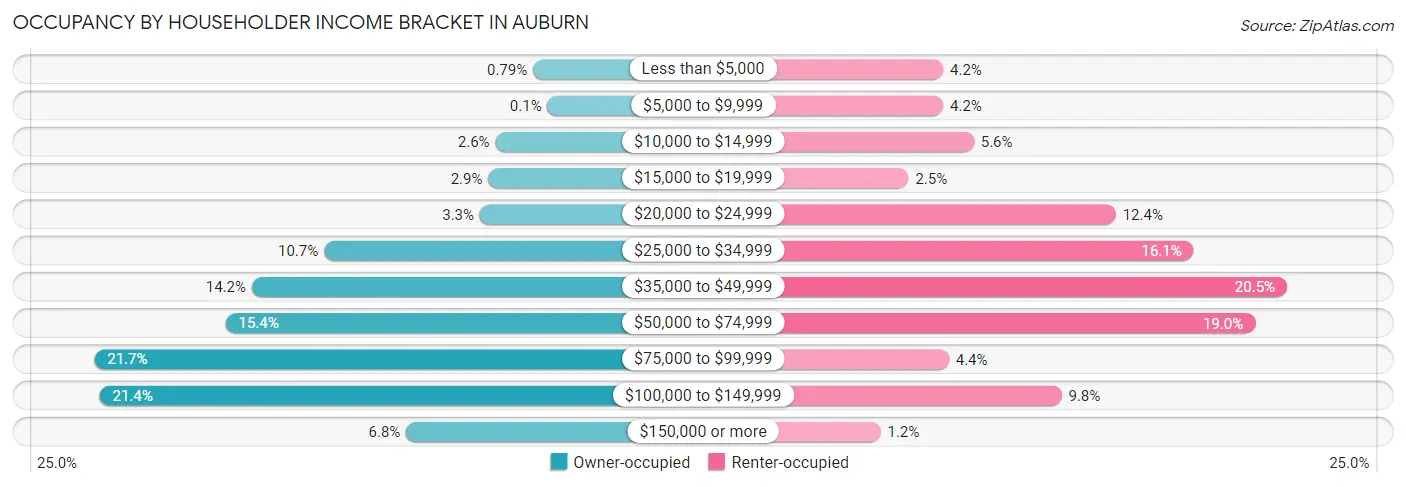
| Income Bracket | Owner-occupied | Renter-occupied |
| Less than $5,000 | 32 (0.8%) | 63 (4.2%) |
| $5,000 to $9,999 | 4 (0.1%) | 63 (4.2%) |
| $10,000 to $14,999 | 105 (2.6%) | 85 (5.6%) |
| $15,000 to $19,999 | 119 (2.9%) | 38 (2.5%) |
| $20,000 to $24,999 | 135 (3.3%) | 187 (12.4%) |
| $25,000 to $34,999 | 437 (10.7%) | 243 (16.1%) |
| $35,000 to $49,999 | 577 (14.2%) | 310 (20.5%) |
| $50,000 to $74,999 | 628 (15.4%) | 287 (19.0%) |
| $75,000 to $99,999 | 882 (21.7%) | 67 (4.4%) |
| $100,000 to $149,999 | 872 (21.4%) | 148 (9.8%) |
| $150,000 or more | 278 (6.8%) | 18 (1.2%) |
| Total | 4,069 (100.0%) | 1,509 (100.0%) |
Monthly Housing Cost Tiers in Auburn
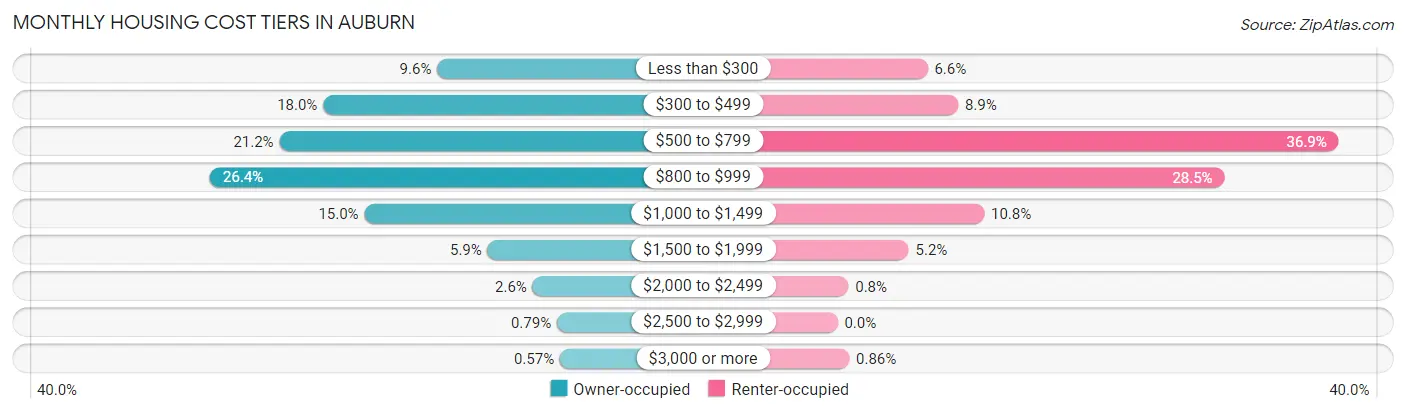
| Monthly Cost | Owner-occupied | Renter-occupied |
| Less than $300 | 391 (9.6%) | 100 (6.6%) |
| $300 to $499 | 733 (18.0%) | 134 (8.9%) |
| $500 to $799 | 864 (21.2%) | 557 (36.9%) |
| $800 to $999 | 1,072 (26.4%) | 430 (28.5%) |
| $1,000 to $1,499 | 609 (15.0%) | 163 (10.8%) |
| $1,500 to $1,999 | 240 (5.9%) | 79 (5.2%) |
| $2,000 to $2,499 | 105 (2.6%) | 12 (0.8%) |
| $2,500 to $2,999 | 32 (0.8%) | 0 (0.0%) |
| $3,000 or more | 23 (0.6%) | 13 (0.9%) |
| Total | 4,069 (100.0%) | 1,509 (100.0%) |
Physical Housing Characteristics in Auburn
Housing Structures in Auburn
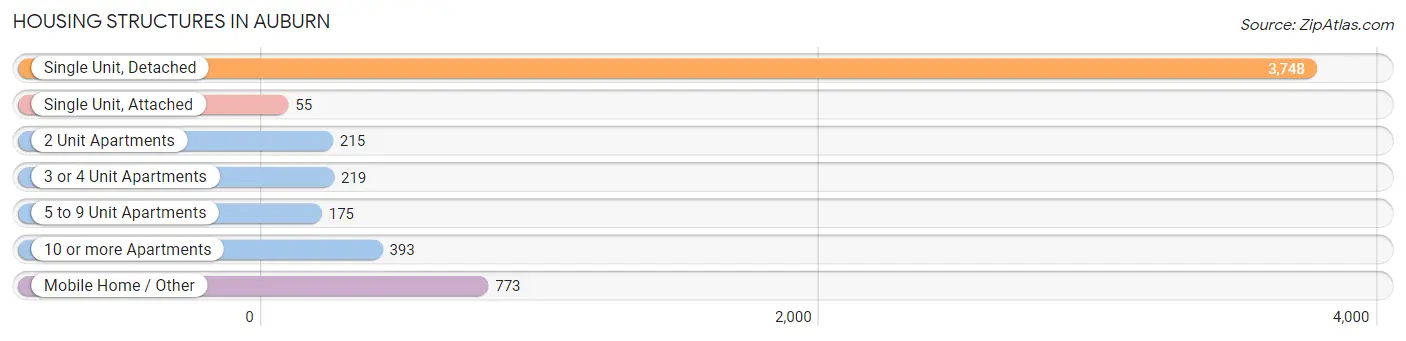
| Structure Type | # Housing Units | % Housing Units |
| Single Unit, Detached | 3,748 | 67.2% |
| Single Unit, Attached | 55 | 1.0% |
| 2 Unit Apartments | 215 | 3.8% |
| 3 or 4 Unit Apartments | 219 | 3.9% |
| 5 to 9 Unit Apartments | 175 | 3.1% |
| 10 or more Apartments | 393 | 7.0% |
| Mobile Home / Other | 773 | 13.9% |
| Total | 5,578 | 100.0% |
Housing Structures by Occupancy in Auburn
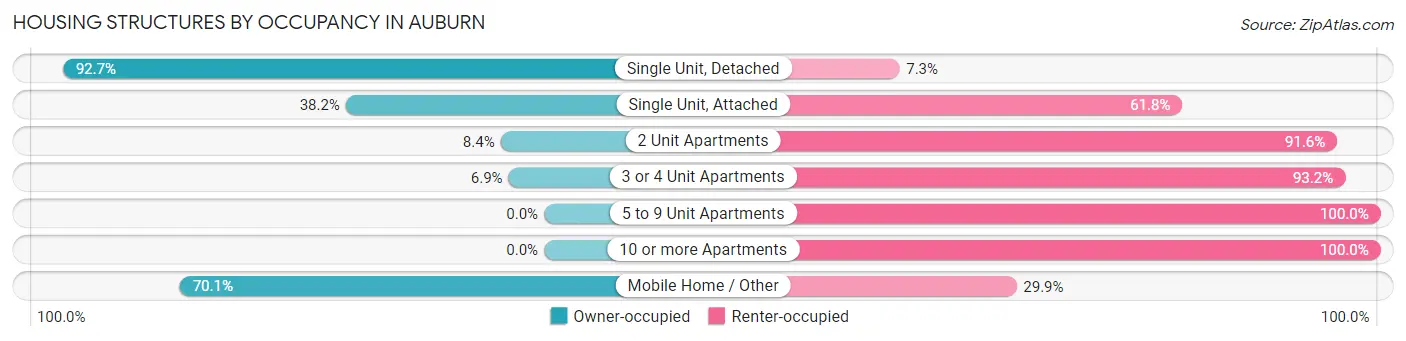
| Structure Type | Owner-occupied | Renter-occupied |
| Single Unit, Detached | 3,473 (92.7%) | 275 (7.3%) |
| Single Unit, Attached | 21 (38.2%) | 34 (61.8%) |
| 2 Unit Apartments | 18 (8.4%) | 197 (91.6%) |
| 3 or 4 Unit Apartments | 15 (6.9%) | 204 (93.1%) |
| 5 to 9 Unit Apartments | 0 (0.0%) | 175 (100.0%) |
| 10 or more Apartments | 0 (0.0%) | 393 (100.0%) |
| Mobile Home / Other | 542 (70.1%) | 231 (29.9%) |
| Total | 4,069 (73.0%) | 1,509 (27.1%) |
Housing Structures by Number of Rooms in Auburn
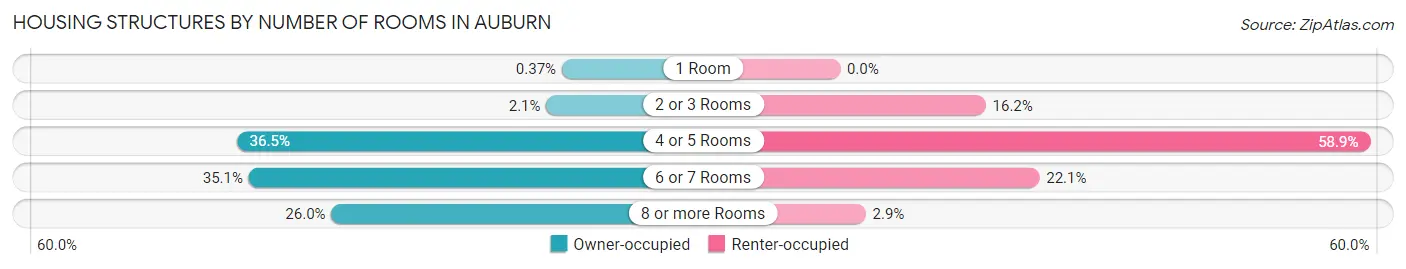
| Number of Rooms | Owner-occupied | Renter-occupied |
| 1 Room | 15 (0.4%) | 0 (0.0%) |
| 2 or 3 Rooms | 85 (2.1%) | 244 (16.2%) |
| 4 or 5 Rooms | 1,484 (36.5%) | 888 (58.9%) |
| 6 or 7 Rooms | 1,429 (35.1%) | 334 (22.1%) |
| 8 or more Rooms | 1,056 (26.0%) | 43 (2.9%) |
| Total | 4,069 (100.0%) | 1,509 (100.0%) |
Housing Structure by Heating Type in Auburn
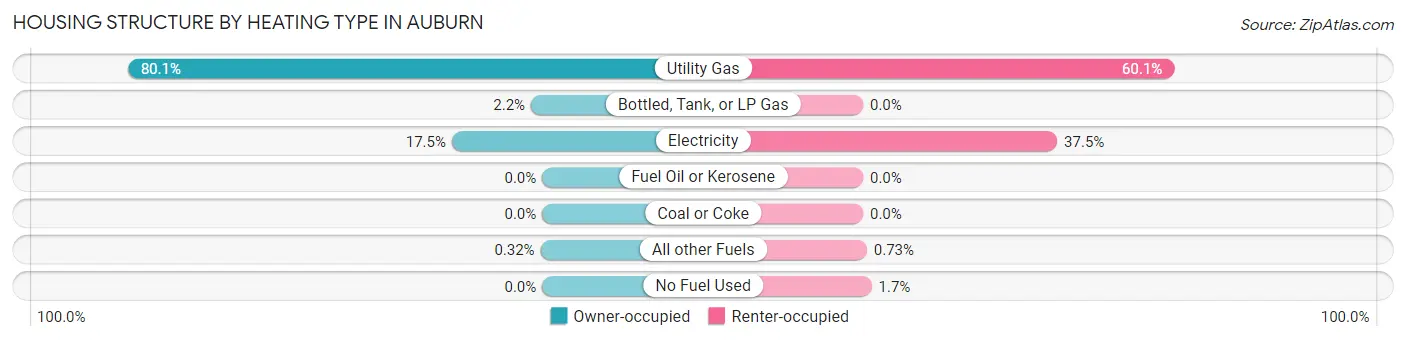
| Heating Type | Owner-occupied | Renter-occupied |
| Utility Gas | 3,258 (80.1%) | 907 (60.1%) |
| Bottled, Tank, or LP Gas | 88 (2.2%) | 0 (0.0%) |
| Electricity | 710 (17.4%) | 566 (37.5%) |
| Fuel Oil or Kerosene | 0 (0.0%) | 0 (0.0%) |
| Coal or Coke | 0 (0.0%) | 0 (0.0%) |
| All other Fuels | 13 (0.3%) | 11 (0.7%) |
| No Fuel Used | 0 (0.0%) | 25 (1.7%) |
| Total | 4,069 (100.0%) | 1,509 (100.0%) |
Household Vehicle Usage in Auburn
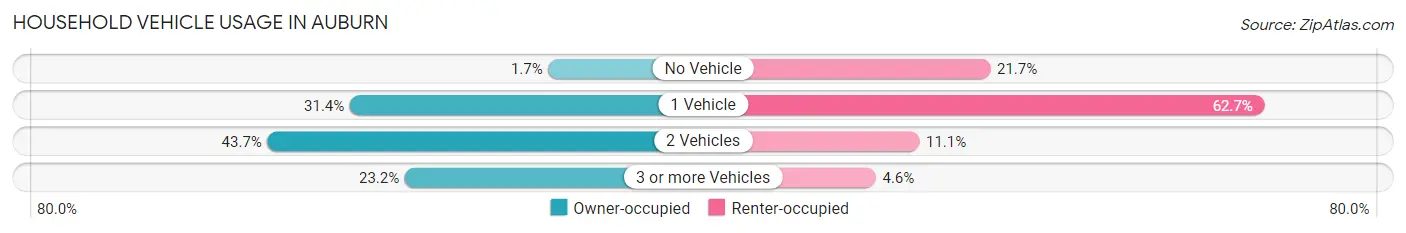
| Vehicles per Household | Owner-occupied | Renter-occupied |
| No Vehicle | 71 (1.7%) | 327 (21.7%) |
| 1 Vehicle | 1,277 (31.4%) | 946 (62.7%) |
| 2 Vehicles | 1,778 (43.7%) | 167 (11.1%) |
| 3 or more Vehicles | 943 (23.2%) | 69 (4.6%) |
| Total | 4,069 (100.0%) | 1,509 (100.0%) |
Real Estate & Mortgages in Auburn
Real Estate and Mortgage Overview in Auburn
| Characteristic | Without Mortgage | With Mortgage |
| Housing Units | 1,440 | 2,629 |
| Median Property Value | $147,300 | $147,300 |
| Median Household Income | $52,500 | $147 |
| Monthly Housing Costs | $401 | $23 |
| Real Estate Taxes | $1,064 | $123 |
Property Value by Mortgage Status in Auburn
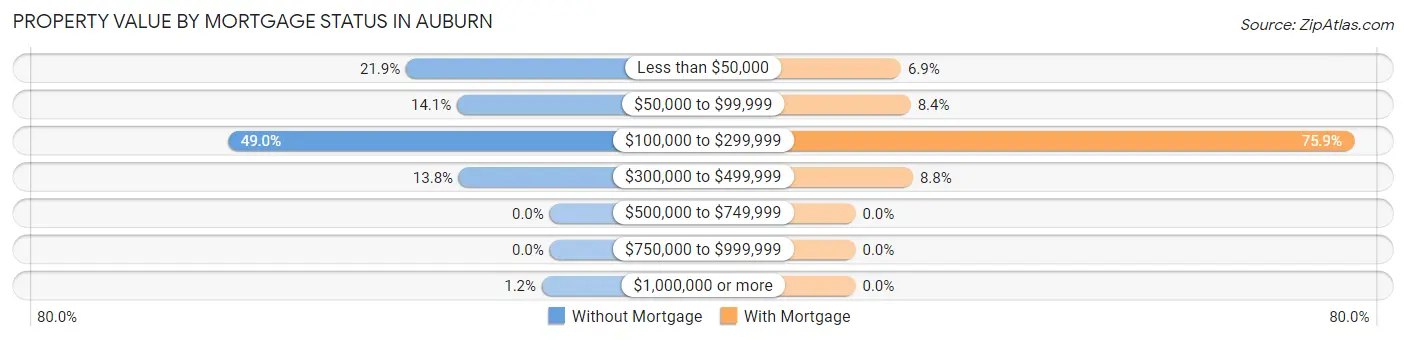
| Property Value | Without Mortgage | With Mortgage |
| Less than $50,000 | 315 (21.9%) | 182 (6.9%) |
| $50,000 to $99,999 | 203 (14.1%) | 221 (8.4%) |
| $100,000 to $299,999 | 706 (49.0%) | 1,996 (75.9%) |
| $300,000 to $499,999 | 199 (13.8%) | 230 (8.7%) |
| $500,000 to $749,999 | 0 (0.0%) | 0 (0.0%) |
| $750,000 to $999,999 | 0 (0.0%) | 0 (0.0%) |
| $1,000,000 or more | 17 (1.2%) | 0 (0.0%) |
| Total | 1,440 (100.0%) | 2,629 (100.0%) |
Household Income by Mortgage Status in Auburn
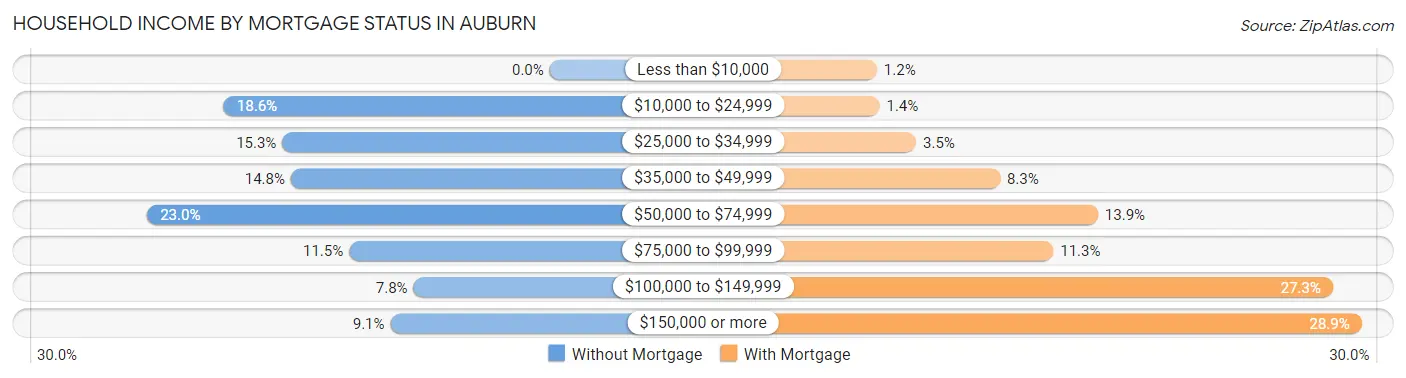
| Household Income | Without Mortgage | With Mortgage |
| Less than $10,000 | 0 (0.0%) | 32 (1.2%) |
| $10,000 to $24,999 | 268 (18.6%) | 36 (1.4%) |
| $25,000 to $34,999 | 220 (15.3%) | 91 (3.5%) |
| $35,000 to $49,999 | 213 (14.8%) | 217 (8.3%) |
| $50,000 to $74,999 | 331 (23.0%) | 364 (13.9%) |
| $75,000 to $99,999 | 165 (11.5%) | 297 (11.3%) |
| $100,000 to $149,999 | 112 (7.8%) | 717 (27.3%) |
| $150,000 or more | 131 (9.1%) | 760 (28.9%) |
| Total | 1,440 (100.0%) | 2,629 (100.0%) |
Property Value to Household Income Ratio in Auburn
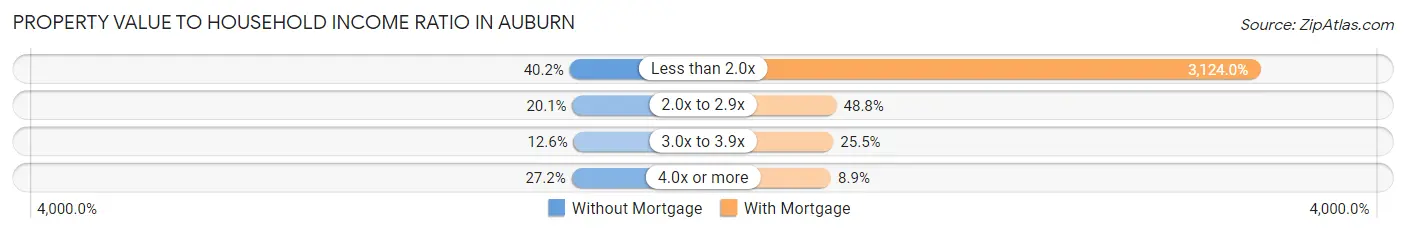
| Value-to-Income Ratio | Without Mortgage | With Mortgage |
| Less than 2.0x | 579 (40.2%) | 82,129 (3,124.0%) |
| 2.0x to 2.9x | 289 (20.1%) | 1,283 (48.8%) |
| 3.0x to 3.9x | 181 (12.6%) | 670 (25.5%) |
| 4.0x or more | 391 (27.2%) | 234 (8.9%) |
| Total | 1,440 (100.0%) | 2,629 (100.0%) |
Real Estate Taxes by Mortgage Status in Auburn
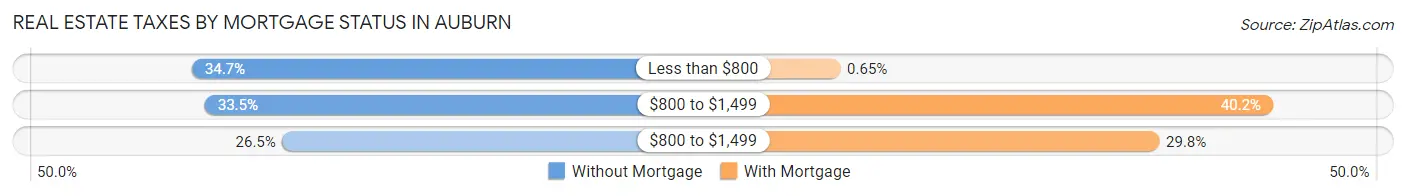
| Property Taxes | Without Mortgage | With Mortgage |
| Less than $800 | 500 (34.7%) | 17 (0.6%) |
| $800 to $1,499 | 483 (33.5%) | 1,056 (40.2%) |
| $800 to $1,499 | 382 (26.5%) | 783 (29.8%) |
| Total | 1,440 (100.0%) | 2,629 (100.0%) |
Health & Disability in Auburn
Health Insurance Coverage by Age in Auburn
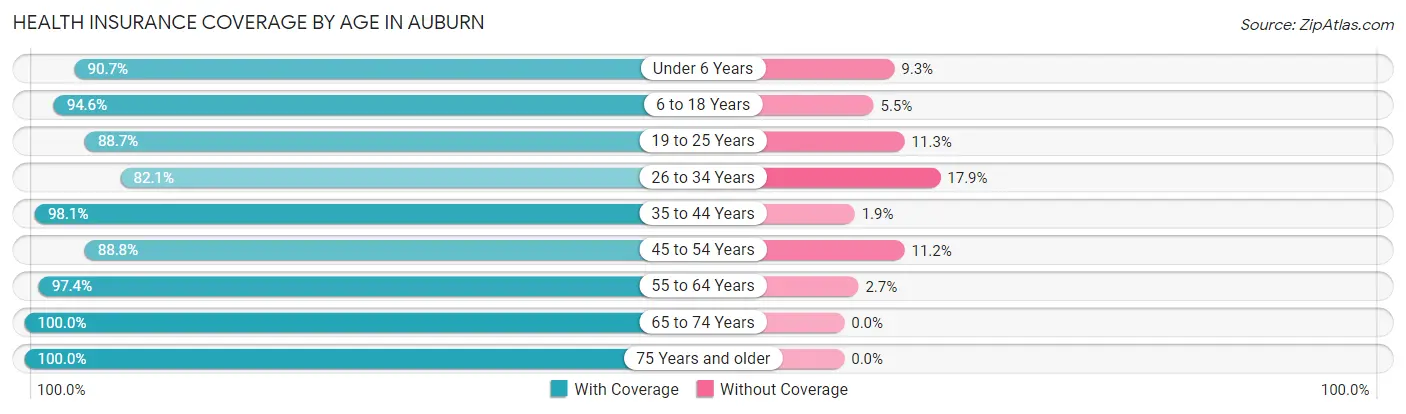
| Age Bracket | With Coverage | Without Coverage |
| Under 6 Years | 980 (90.7%) | 101 (9.3%) |
| 6 to 18 Years | 2,340 (94.6%) | 135 (5.4%) |
| 19 to 25 Years | 1,017 (88.7%) | 129 (11.3%) |
| 26 to 34 Years | 1,458 (82.1%) | 318 (17.9%) |
| 35 to 44 Years | 1,564 (98.1%) | 31 (1.9%) |
| 45 to 54 Years | 1,279 (88.8%) | 162 (11.2%) |
| 55 to 64 Years | 1,507 (97.4%) | 41 (2.6%) |
| 65 to 74 Years | 1,149 (100.0%) | 0 (0.0%) |
| 75 Years and older | 926 (100.0%) | 0 (0.0%) |
| Total | 12,220 (93.0%) | 917 (7.0%) |
Health Insurance Coverage by Citizenship Status in Auburn
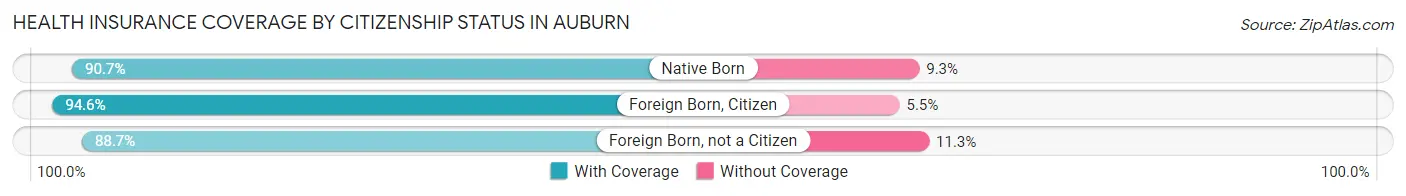
| Citizenship Status | With Coverage | Without Coverage |
| Native Born | 980 (90.7%) | 101 (9.3%) |
| Foreign Born, Citizen | 2,340 (94.6%) | 135 (5.4%) |
| Foreign Born, not a Citizen | 1,017 (88.7%) | 129 (11.3%) |
Health Insurance Coverage by Household Income in Auburn
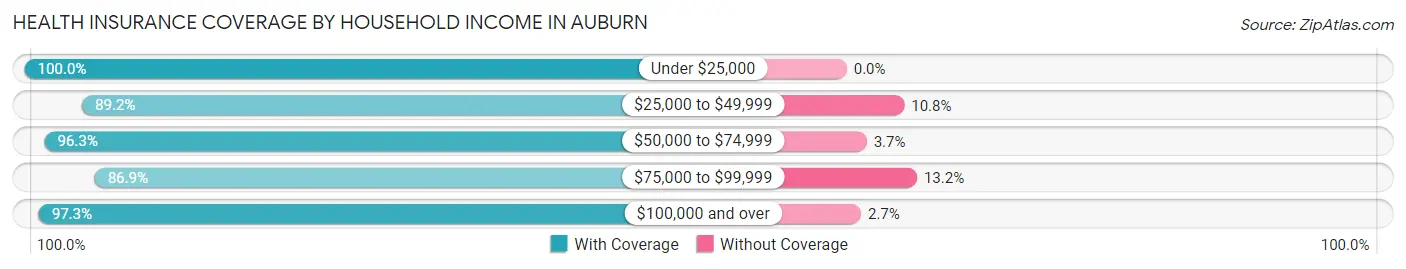
| Household Income | With Coverage | Without Coverage |
| Under $25,000 | 1,154 (100.0%) | 0 (0.0%) |
| $25,000 to $49,999 | 2,730 (89.2%) | 330 (10.8%) |
| $50,000 to $74,999 | 1,652 (96.3%) | 64 (3.7%) |
| $75,000 to $99,999 | 2,748 (86.9%) | 416 (13.2%) |
| $100,000 and over | 3,907 (97.3%) | 107 (2.7%) |
Public vs Private Health Insurance Coverage by Age in Auburn
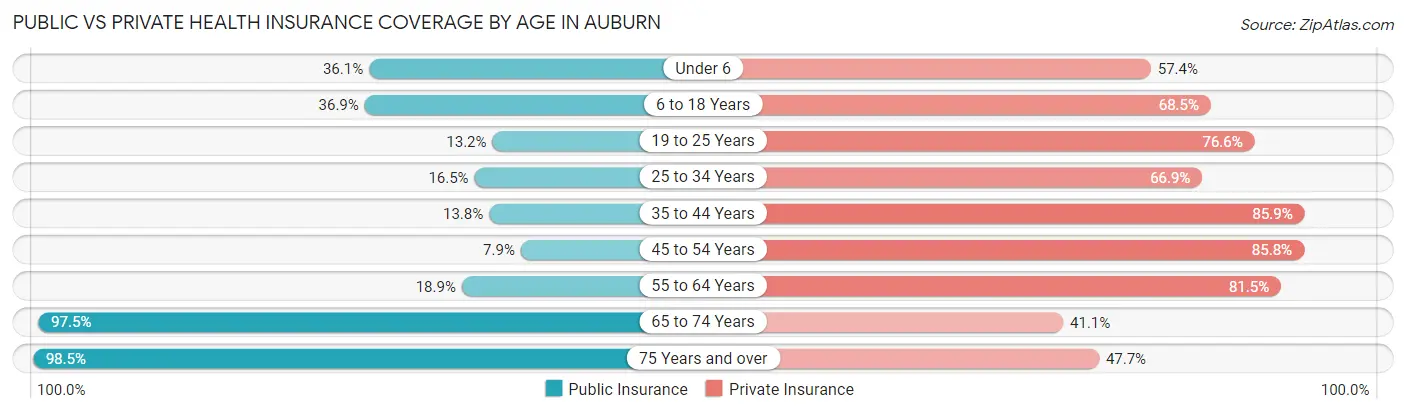
| Age Bracket | Public Insurance | Private Insurance |
| Under 6 | 390 (36.1%) | 620 (57.4%) |
| 6 to 18 Years | 913 (36.9%) | 1,695 (68.5%) |
| 19 to 25 Years | 151 (13.2%) | 878 (76.6%) |
| 25 to 34 Years | 293 (16.5%) | 1,188 (66.9%) |
| 35 to 44 Years | 220 (13.8%) | 1,370 (85.9%) |
| 45 to 54 Years | 114 (7.9%) | 1,236 (85.8%) |
| 55 to 64 Years | 292 (18.9%) | 1,262 (81.5%) |
| 65 to 74 Years | 1,120 (97.5%) | 472 (41.1%) |
| 75 Years and over | 912 (98.5%) | 442 (47.7%) |
| Total | 4,405 (33.5%) | 9,163 (69.8%) |
Disability Status by Sex by Age in Auburn
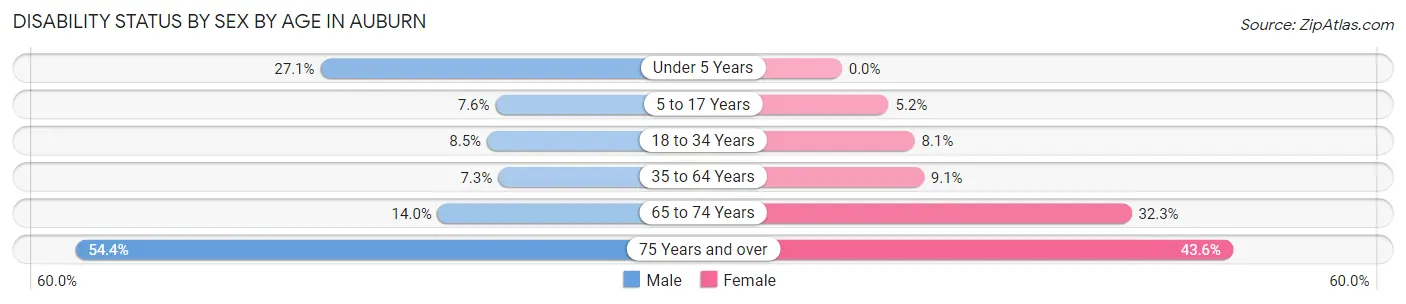
| Age Bracket | Male | Female |
| Under 5 Years | 138 (27.1%) | 0 (0.0%) |
| 5 to 17 Years | 89 (7.6%) | 66 (5.2%) |
| 18 to 34 Years | 135 (8.5%) | 120 (8.1%) |
| 35 to 64 Years | 163 (7.3%) | 214 (9.1%) |
| 65 to 74 Years | 78 (14.0%) | 191 (32.3%) |
| 75 Years and over | 200 (54.3%) | 243 (43.5%) |
Disability Class by Sex by Age in Auburn
Disability Class: Hearing Difficulty
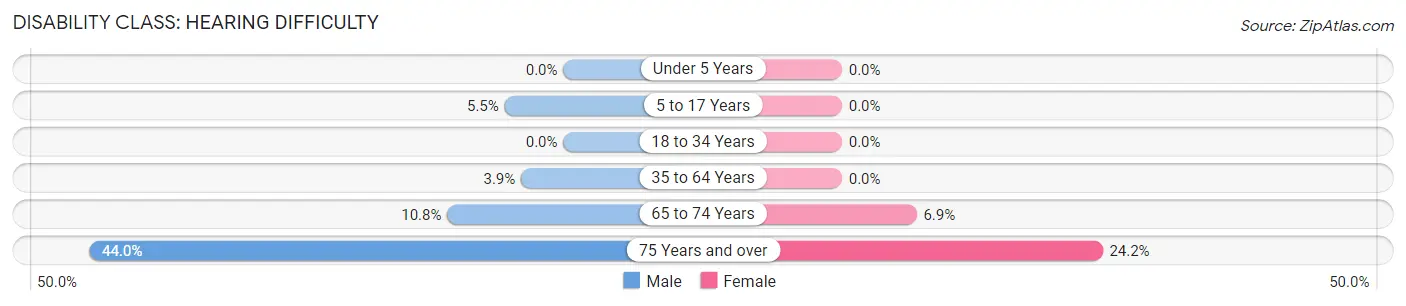
| Age Bracket | Male | Female |
| Under 5 Years | 0 (0.0%) | 0 (0.0%) |
| 5 to 17 Years | 64 (5.4%) | 0 (0.0%) |
| 18 to 34 Years | 0 (0.0%) | 0 (0.0%) |
| 35 to 64 Years | 88 (3.9%) | 0 (0.0%) |
| 65 to 74 Years | 60 (10.8%) | 41 (6.9%) |
| 75 Years and over | 162 (44.0%) | 135 (24.2%) |
Disability Class: Vision Difficulty
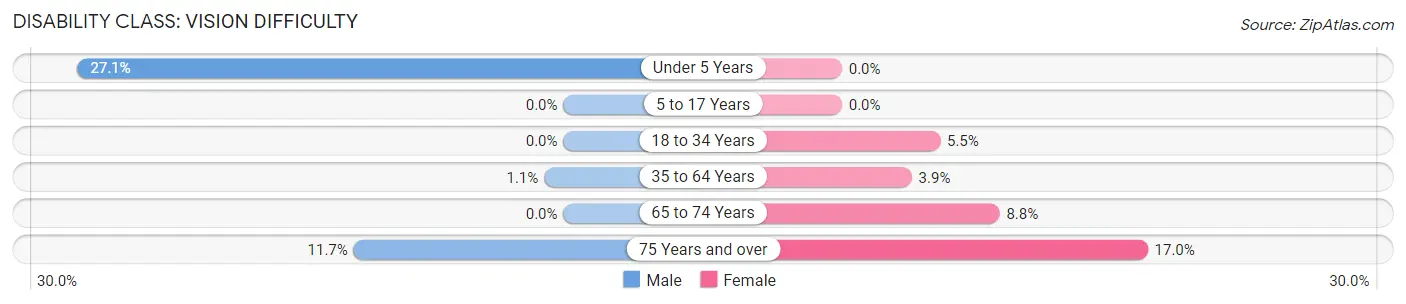
| Age Bracket | Male | Female |
| Under 5 Years | 138 (27.1%) | 0 (0.0%) |
| 5 to 17 Years | 0 (0.0%) | 0 (0.0%) |
| 18 to 34 Years | 0 (0.0%) | 81 (5.5%) |
| 35 to 64 Years | 24 (1.1%) | 91 (3.9%) |
| 65 to 74 Years | 0 (0.0%) | 52 (8.8%) |
| 75 Years and over | 43 (11.7%) | 95 (17.0%) |
Disability Class: Cognitive Difficulty
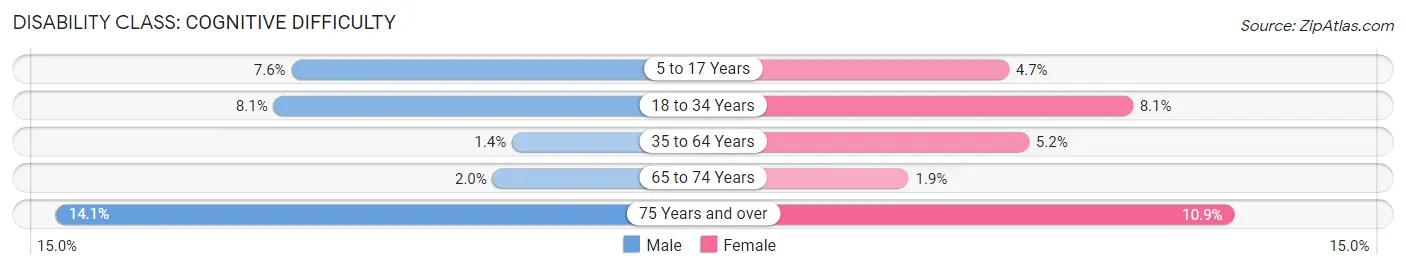
| Age Bracket | Male | Female |
| 5 to 17 Years | 89 (7.6%) | 59 (4.6%) |
| 18 to 34 Years | 128 (8.1%) | 120 (8.1%) |
| 35 to 64 Years | 32 (1.4%) | 122 (5.2%) |
| 65 to 74 Years | 11 (2.0%) | 11 (1.9%) |
| 75 Years and over | 52 (14.1%) | 61 (10.9%) |
Disability Class: Ambulatory Difficulty
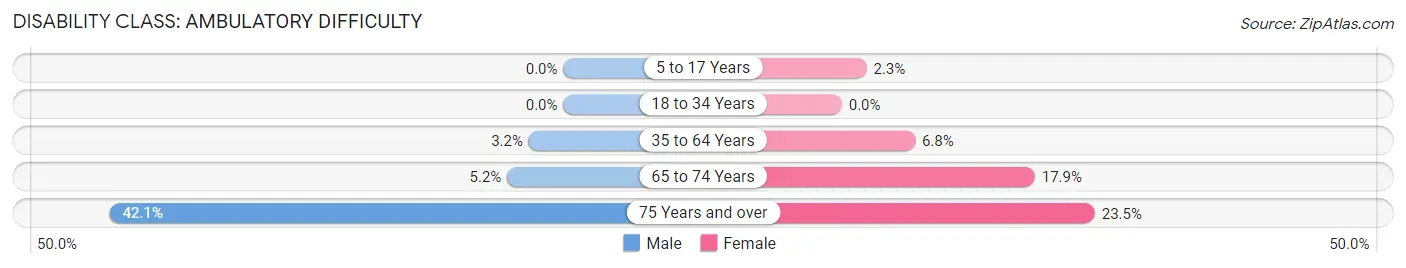
| Age Bracket | Male | Female |
| 5 to 17 Years | 0 (0.0%) | 29 (2.3%) |
| 18 to 34 Years | 0 (0.0%) | 0 (0.0%) |
| 35 to 64 Years | 72 (3.2%) | 159 (6.8%) |
| 65 to 74 Years | 29 (5.2%) | 106 (17.9%) |
| 75 Years and over | 155 (42.1%) | 131 (23.5%) |
Disability Class: Self-Care Difficulty
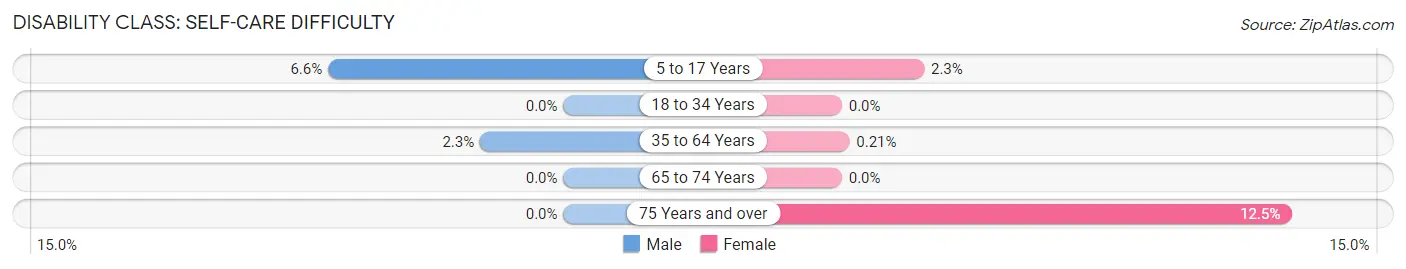
| Age Bracket | Male | Female |
| 5 to 17 Years | 77 (6.6%) | 29 (2.3%) |
| 18 to 34 Years | 0 (0.0%) | 0 (0.0%) |
| 35 to 64 Years | 52 (2.3%) | 5 (0.2%) |
| 65 to 74 Years | 0 (0.0%) | 0 (0.0%) |
| 75 Years and over | 0 (0.0%) | 70 (12.5%) |
Technology Access in Auburn
Computing Device Access in Auburn
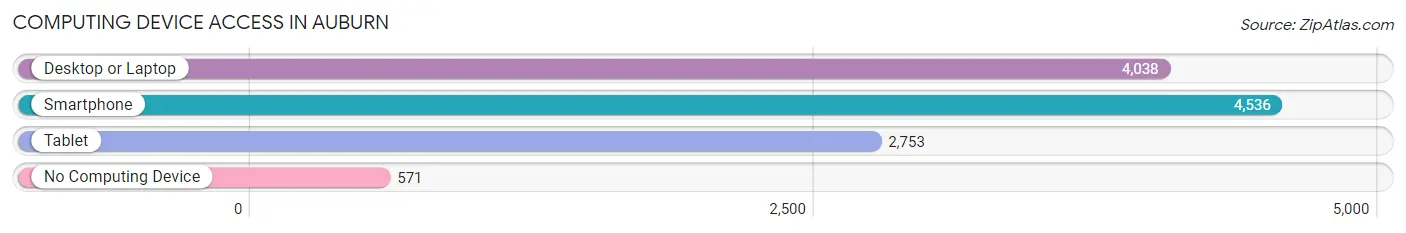
| Device Type | # Households | % Households |
| Desktop or Laptop | 4,038 | 72.4% |
| Smartphone | 4,536 | 81.3% |
| Tablet | 2,753 | 49.3% |
| No Computing Device | 571 | 10.2% |
| Total | 5,578 | 100.0% |
Internet Access in Auburn
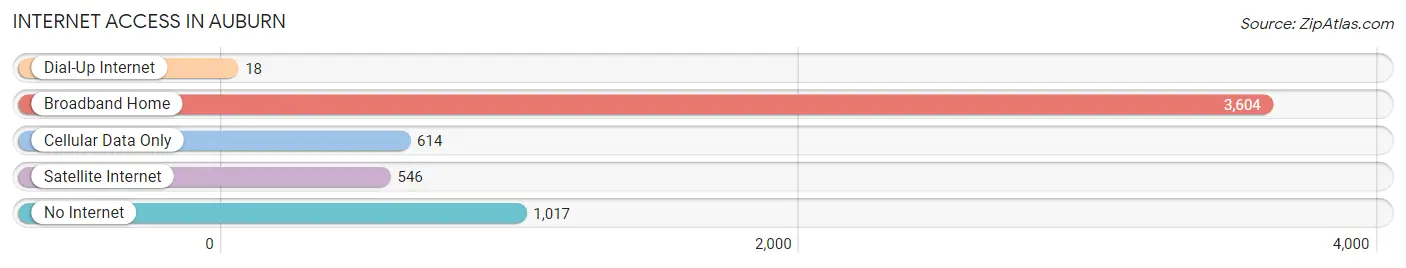
| Internet Type | # Households | % Households |
| Dial-Up Internet | 18 | 0.3% |
| Broadband Home | 3,604 | 64.6% |
| Cellular Data Only | 614 | 11.0% |
| Satellite Internet | 546 | 9.8% |
| No Internet | 1,017 | 18.2% |
| Total | 5,578 | 100.0% |
Auburn Summary
Auburn, Indiana is a city located in DeKalb County, Indiana, United States. The population was 13,086 at the 2010 census. Auburn is located in the heart of the Midwest, approximately halfway between Fort Wayne, Indiana and Toledo, Ohio. It is also located in the northeastern corner of Indiana, approximately 20 miles from the Michigan border.
Geography
Auburn is located at 41°24'25" North, 84°56'17" West (41.406944, -84.938056). According to the United States Census Bureau, the city has a total area of 8.2 square miles (21.2 km2), all land.
History
Auburn was founded in 1836 by William H. and Mary E. Haines. The city was named after Auburn, New York, where the Haines family had previously lived. The first post office in Auburn was established in 1837. The city was incorporated in 1854.
In the late 19th century, Auburn was a major center for the production of carriages and wagons. The Auburn Automobile Company was founded in 1900 and produced cars until 1937. The Auburn Cord Duesenberg Automobile Museum is located in the city and is dedicated to the history of the Auburn Automobile Company.
Economy
Auburn is home to a variety of businesses and industries. The city is home to several manufacturing companies, including Auburn Gear, Inc., a manufacturer of automotive and industrial gears, and Auburn Foundry, Inc., a manufacturer of castings for the automotive and industrial markets. The city is also home to several retail stores, restaurants, and other businesses.
Demographics
As of the census of 2010, there were 13,086 people, 5,093 households, and 3,521 families residing in the city. The population density was 1,588.2 people per square mile (613.7/km2). There were 5,541 housing units at an average density of 676.2 per square mile (261.2/km2). The racial makeup of the city was 95.2% White, 0.7% African American, 0.3% Native American, 0.7% Asian, 0.1% Pacific Islander, 1.3% from other races, and 1.7% from two or more races. Hispanic or Latino of any race were 3.3% of the population.
There were 5,093 households, out of which 32.2% had children under the age of 18 living with them, 51.2% were married couples living together, 12.2% had a female householder with no husband present, and 32.2% were non-families. 27.2% of all households were made up of individuals, and 11.2% had someone living alone who was 65 years of age or older. The average household size was 2.50 and the average family size was 3.03.
In the city, the population was spread out, with 25.2% under the age of 18, 8.3% from 18 to 24, 28.2% from 25 to 44, 22.7% from 45 to 64, and 15.6% who were 65 years of age or older. The median age was 37 years. For every 100 females, there were 93.2 males. For every 100 females age 18 and over, there were 89.7 males.
The median income for a household in the city was $41,945, and the median income for a family was $50,945. Males had a median income of $37,945 versus $25,945 for females. The per capita income for the city was $20,945. About 6.2% of families and 8.3% of the population were below the poverty line, including 11.2% of those under age 18 and 6.2% of those age 65 or over.
Common Questions
What is Per Capita Income in Auburn?
Per Capita income in Auburn is $30,593.
What is the Median Family Income in Auburn?
Median Family Income in Auburn is $79,278.
What is the Median Household income in Auburn?
Median Household Income in Auburn is $58,635.
What is Income or Wage Gap in Auburn?
Income or Wage Gap in Auburn is 30.1%.
Women in Auburn earn 69.9 cents for every dollar earned by a man.
What is Family Income Deficit in Auburn?
Family Income Deficit in Auburn is $11,423.
Families that are below poverty line in Auburn earn $11,423 less on average than the poverty threshold level.
What is Inequality or Gini Index in Auburn?
Inequality or Gini Index in Auburn is 0.39.
What is the Total Population of Auburn?
Total Population of Auburn is 13,316.
What is the Total Male Population of Auburn?
Total Male Population of Auburn is 6,534.
What is the Total Female Population of Auburn?
Total Female Population of Auburn is 6,782.
What is the Ratio of Males per 100 Females in Auburn?
There are 96.34 Males per 100 Females in Auburn.
What is the Ratio of Females per 100 Males in Auburn?
There are 103.80 Females per 100 Males in Auburn.
What is the Median Population Age in Auburn?
Median Population Age in Auburn is 35.6 Years.
What is the Average Family Size in Auburn
Average Family Size in Auburn is 3.0 People.
What is the Average Household Size in Auburn
Average Household Size in Auburn is 2.4 People.
How Large is the Labor Force in Auburn?
There are 7,139 People in the Labor Forcein in Auburn.
What is the Percentage of People in the Labor Force in Auburn?
69.3% of People are in the Labor Force in Auburn.
What is the Unemployment Rate in Auburn?
Unemployment Rate in Auburn is 5.5%.