Zip Codes with the Highest Percentage of Population Employed in Agriculture, Fishing & Hunting in Anderson, IN
RELATED REPORTS & OPTIONS
Agriculture, Fishing & Hunting
Anderson
Compare Zip Codes
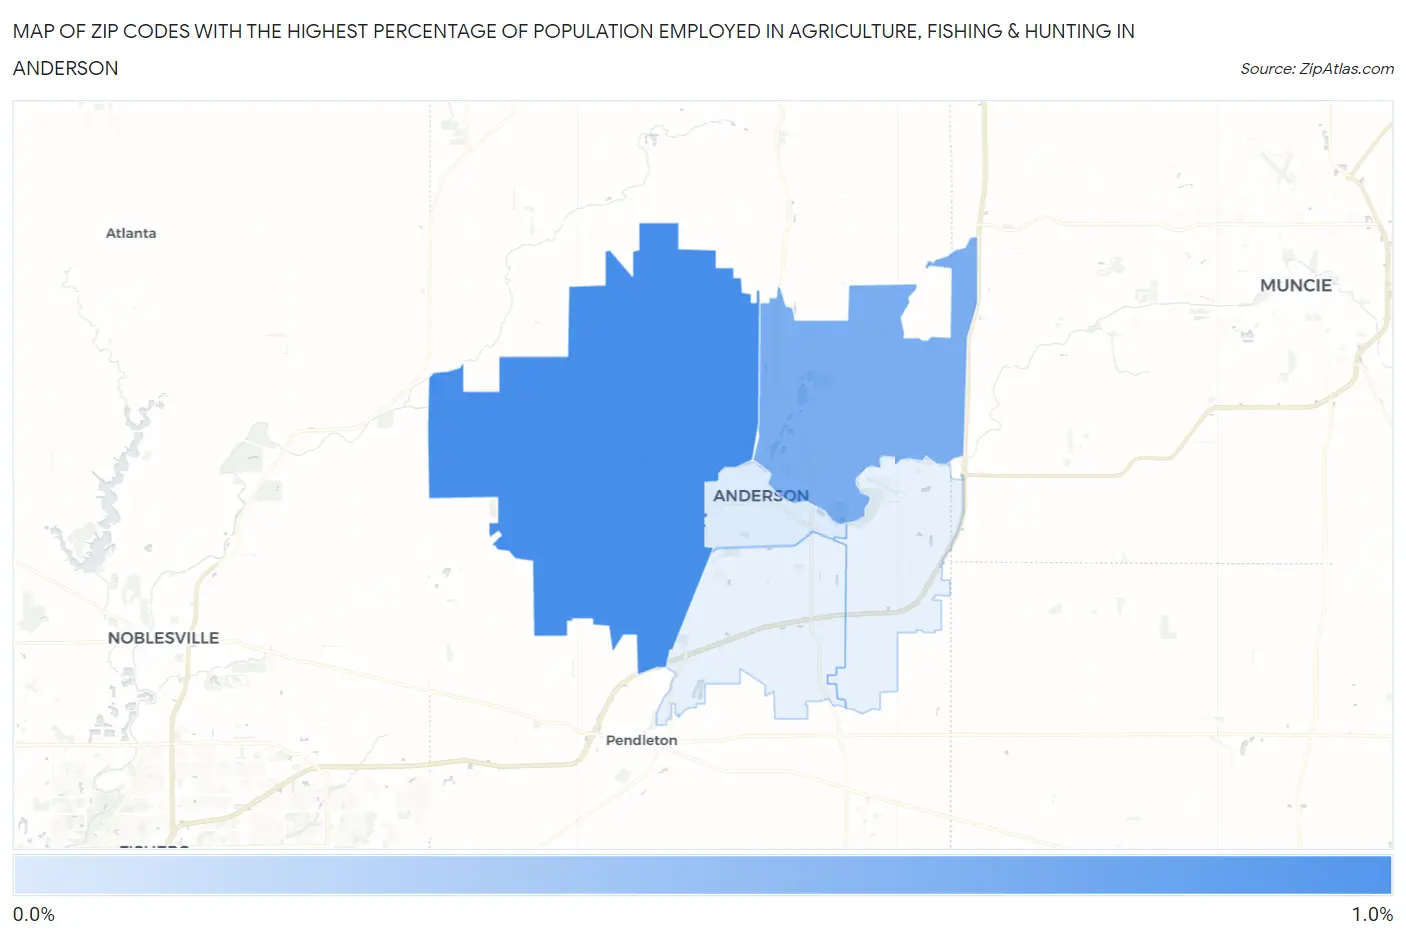
Map of Zip Codes with the Highest Percentage of Population Employed in Agriculture, Fishing & Hunting in Anderson
0.0%
1.0%
Zip Codes with the Highest Percentage of Population Employed in Agriculture, Fishing & Hunting in Anderson, IN
| Zip Code | % Employed | vs State | vs National | |
| 1. | 46011 | 0.93% | 1.1%(-0.127)#397 | 1.2%(-0.270)#16,559 |
| 2. | 46012 | 0.63% | 1.1%(-0.431)#448 | 1.2%(-0.573)#18,301 |
| 3. | 46016 | 0.027% | 1.1%(-1.03)#595 | 1.2%(-1.17)#24,549 |
1
Common Questions
What are the Top 3 Zip Codes with the Highest Percentage of Population Employed in Agriculture, Fishing & Hunting in Anderson, IN?
Top 3 Zip Codes with the Highest Percentage of Population Employed in Agriculture, Fishing & Hunting in Anderson, IN are:
What zip code has the Highest Percentage of Population Employed in Agriculture, Fishing & Hunting in Anderson, IN?
46011 has the Highest Percentage of Population Employed in Agriculture, Fishing & Hunting in Anderson, IN with 0.93%.
What is the Percentage of Population Employed in Agriculture, Fishing & Hunting in Anderson, IN?
Percentage of Population Employed in Agriculture, Fishing & Hunting in Anderson is 0.13%.
What is the Percentage of Population Employed in Agriculture, Fishing & Hunting in Indiana?
Percentage of Population Employed in Agriculture, Fishing & Hunting in Indiana is 1.1%.
What is the Percentage of Population Employed in Agriculture, Fishing & Hunting in the United States?
Percentage of Population Employed in Agriculture, Fishing & Hunting in the United States is 1.2%.