Alexandria, IN Map & Demographics
Alexandria Map
Alexandria Overview
$28,610
PER CAPITA INCOME
$79,130
AVG FAMILY INCOME
$58,269
AVG HOUSEHOLD INCOME
37.6%
WAGE / INCOME GAP [ % ]
62.4¢/ $1
WAGE / INCOME GAP [ $ ]
0.36
INEQUALITY / GINI INDEX
5,144
TOTAL POPULATION
2,605
MALE POPULATION
2,539
FEMALE POPULATION
102.60
MALES / 100 FEMALES
97.47
FEMALES / 100 MALES
39.1
MEDIAN AGE
3.0
AVG FAMILY SIZE
2.5
AVG HOUSEHOLD SIZE
2,587
LABOR FORCE [ PEOPLE ]
63.6%
PERCENT IN LABOR FORCE
8.0%
UNEMPLOYMENT RATE
Alexandria Zip Codes
Alexandria Area Codes
Income in Alexandria
Income Overview in Alexandria
Per Capita Income in Alexandria is $28,610, while median incomes of families and households are $79,130 and $58,269 respectively.
| Characteristic | Number | Measure |
| Per Capita Income | 5,144 | $28,610 |
| Median Family Income | 1,380 | $79,130 |
| Mean Family Income | 1,380 | $80,094 |
| Median Household Income | 2,034 | $58,269 |
| Mean Household Income | 2,034 | $69,635 |
| Income Deficit | 1,380 | $0 |
| Wage / Income Gap (%) | 5,144 | 37.56% |
| Wage / Income Gap ($) | 5,144 | 62.44¢ per $1 |
| Gini / Inequality Index | 5,144 | 0.36 |
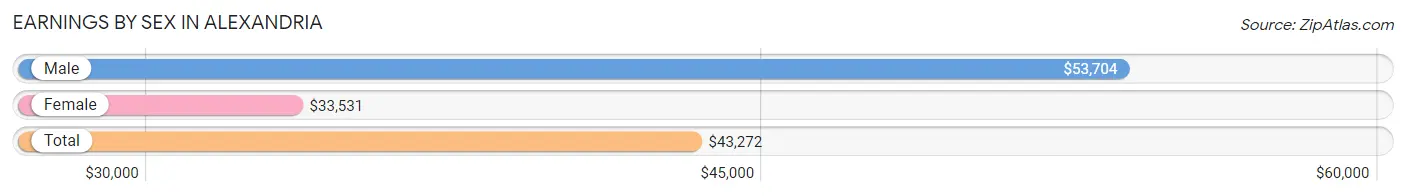
Earnings by Sex in Alexandria
Average Earnings in Alexandria are $43,272, $53,704 for men and $33,531 for women, a difference of 37.6%.
| Sex | Number | Average Earnings |
| Male | 1,250 (47.8%) | $53,704 |
| Female | 1,363 (52.2%) | $33,531 |
| Total | 2,613 (100.0%) | $43,272 |
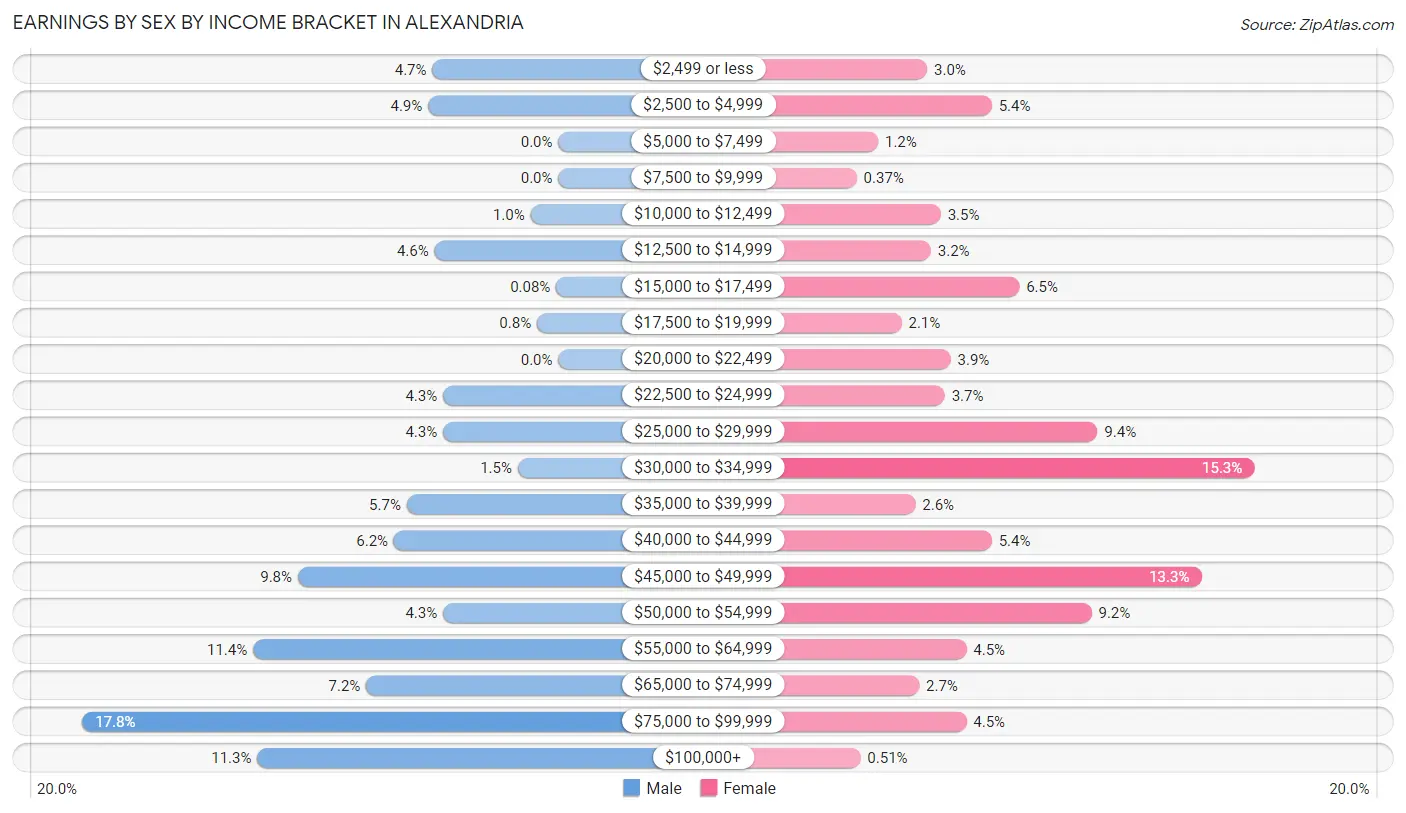
Earnings by Sex by Income Bracket in Alexandria
The most common earnings brackets in Alexandria are $75,000 to $99,999 for men (223 | 17.8%) and $30,000 to $34,999 for women (208 | 15.3%).
| Income | Male | Female |
| $2,499 or less | 59 (4.7%) | 41 (3.0%) |
| $2,500 to $4,999 | 61 (4.9%) | 74 (5.4%) |
| $5,000 to $7,499 | 0 (0.0%) | 16 (1.2%) |
| $7,500 to $9,999 | 0 (0.0%) | 5 (0.4%) |
| $10,000 to $12,499 | 13 (1.0%) | 48 (3.5%) |
| $12,500 to $14,999 | 58 (4.6%) | 43 (3.2%) |
| $15,000 to $17,499 | 1 (0.1%) | 88 (6.5%) |
| $17,500 to $19,999 | 10 (0.8%) | 28 (2.1%) |
| $20,000 to $22,499 | 0 (0.0%) | 53 (3.9%) |
| $22,500 to $24,999 | 54 (4.3%) | 50 (3.7%) |
| $25,000 to $29,999 | 54 (4.3%) | 128 (9.4%) |
| $30,000 to $34,999 | 19 (1.5%) | 208 (15.3%) |
| $35,000 to $39,999 | 71 (5.7%) | 35 (2.6%) |
| $40,000 to $44,999 | 77 (6.2%) | 74 (5.4%) |
| $45,000 to $49,999 | 122 (9.8%) | 181 (13.3%) |
| $50,000 to $54,999 | 54 (4.3%) | 125 (9.2%) |
| $55,000 to $64,999 | 143 (11.4%) | 61 (4.5%) |
| $65,000 to $74,999 | 90 (7.2%) | 37 (2.7%) |
| $75,000 to $99,999 | 223 (17.8%) | 61 (4.5%) |
| $100,000+ | 141 (11.3%) | 7 (0.5%) |
| Total | 1,250 (100.0%) | 1,363 (100.0%) |
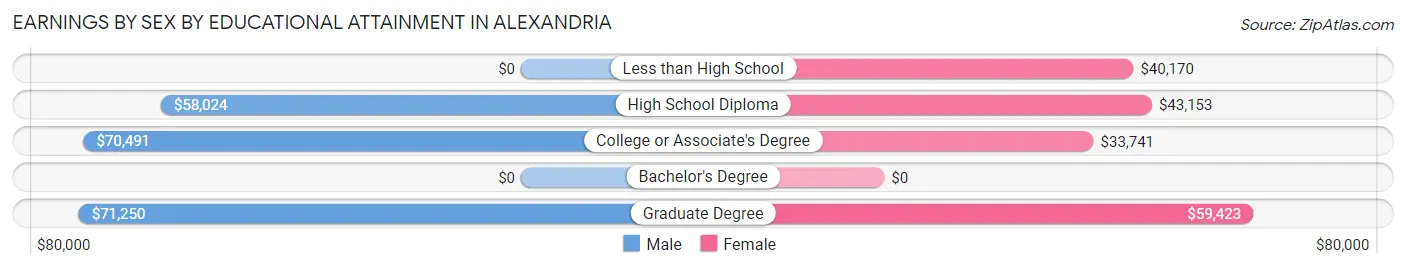
Earnings by Sex by Educational Attainment in Alexandria
Average earnings in Alexandria are $58,322 for men and $34,357 for women, a difference of 41.1%. Men with an educational attainment of graduate degree enjoy the highest average annual earnings of $71,250, while those with high school diploma education earn the least with $58,024. Women with an educational attainment of graduate degree earn the most with the average annual earnings of $59,423, while those with college or associate's degree education have the smallest earnings of $33,741.
| Educational Attainment | Male Income | Female Income |
| Less than High School | - | - |
| High School Diploma | $58,024 | $43,153 |
| College or Associate's Degree | $70,491 | $33,741 |
| Bachelor's Degree | - | - |
| Graduate Degree | $71,250 | $59,423 |
| Total | $58,322 | $34,357 |
Family Income in Alexandria
Family Income Brackets in Alexandria
According to the Alexandria family income data, there are 367 families falling into the $100,000 to $149,999 income range, which is the most common income bracket and makes up 26.6% of all families.
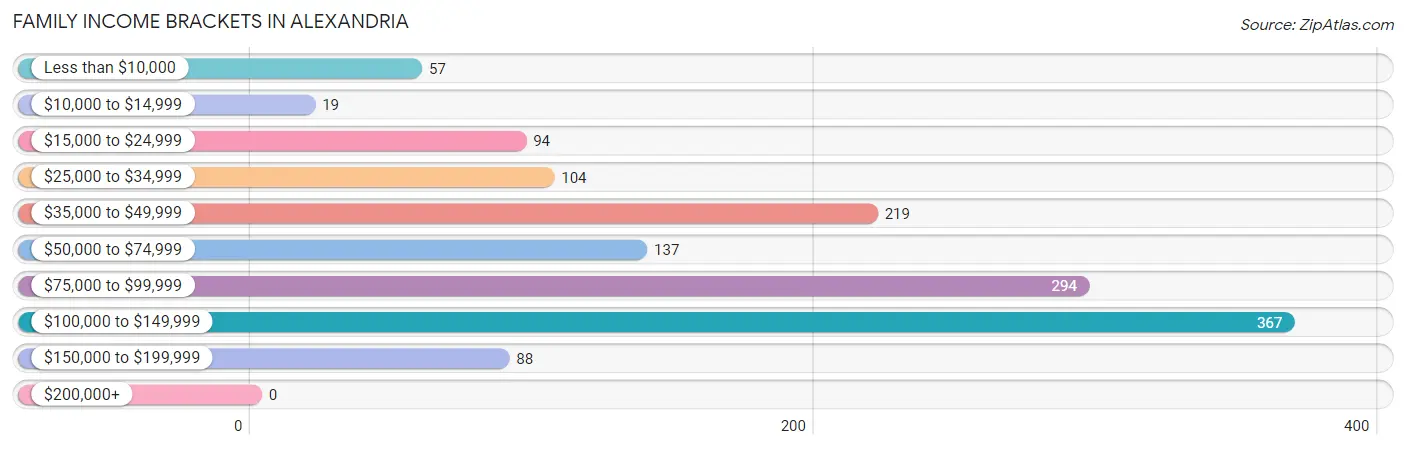
| Income Bracket | # Families | % Families |
| Less than $10,000 | 57 | 4.1% |
| $10,000 to $14,999 | 19 | 1.4% |
| $15,000 to $24,999 | 94 | 6.8% |
| $25,000 to $34,999 | 104 | 7.5% |
| $35,000 to $49,999 | 219 | 15.9% |
| $50,000 to $74,999 | 137 | 9.9% |
| $75,000 to $99,999 | 294 | 21.3% |
| $100,000 to $149,999 | 367 | 26.6% |
| $150,000 to $199,999 | 88 | 6.4% |
| $200,000+ | 0 | 0.0% |
Family Income by Famaliy Size in Alexandria
5-person families (31 | 2.2%) account for the highest median family income in Alexandria with $155,221 per family, while 5-person families (31 | 2.2%) have the highest median income of $31,044 per family member.
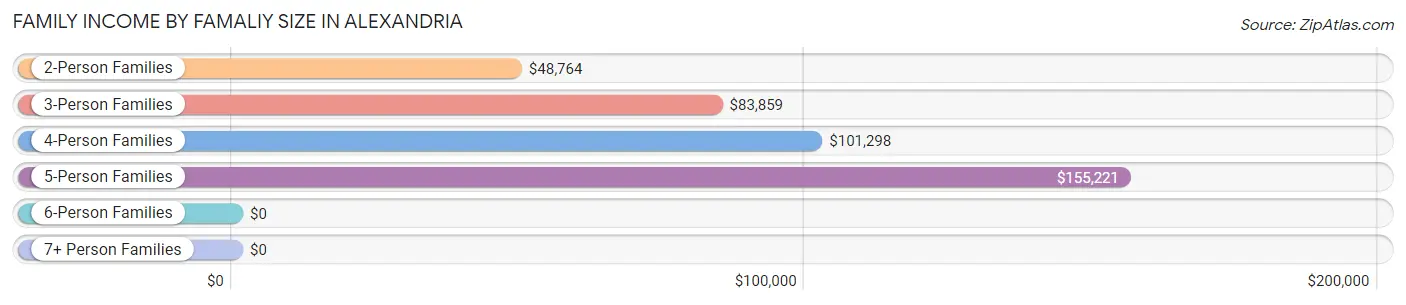
| Income Bracket | # Families | Median Income |
| 2-Person Families | 653 (47.3%) | $48,764 |
| 3-Person Families | 383 (27.8%) | $83,859 |
| 4-Person Families | 207 (15.0%) | $101,298 |
| 5-Person Families | 31 (2.2%) | $155,221 |
| 6-Person Families | 106 (7.7%) | $0 |
| 7+ Person Families | 0 (0.0%) | $0 |
| Total | 1,380 (100.0%) | $79,130 |
Family Income by Number of Earners in Alexandria
The median family income in Alexandria is $79,130, with families comprising 3+ earners (181) having the highest median family income of $131,703, while families with 1 earner (499) have the lowest median family income of $40,980, accounting for 13.1% and 36.2% of families, respectively.
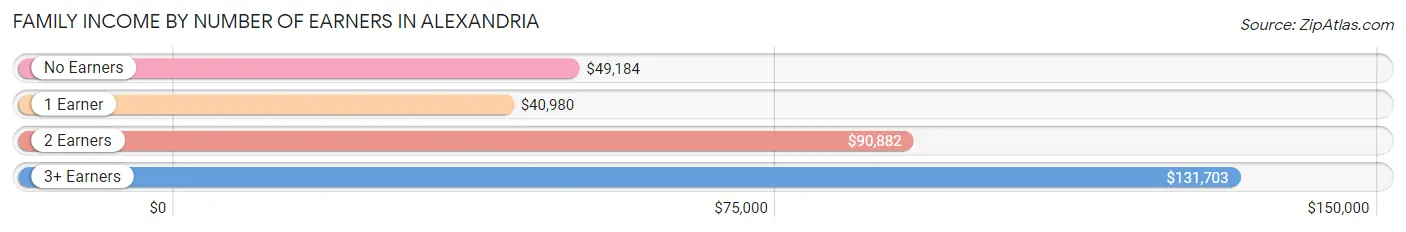
| Number of Earners | # Families | Median Income |
| No Earners | 246 (17.8%) | $49,184 |
| 1 Earner | 499 (36.2%) | $40,980 |
| 2 Earners | 454 (32.9%) | $90,882 |
| 3+ Earners | 181 (13.1%) | $131,703 |
| Total | 1,380 (100.0%) | $79,130 |
Household Income in Alexandria
Household Income Brackets in Alexandria
With 391 households falling in the category, the $100,000 to $149,999 income range is the most frequent in Alexandria, accounting for 19.2% of all households.
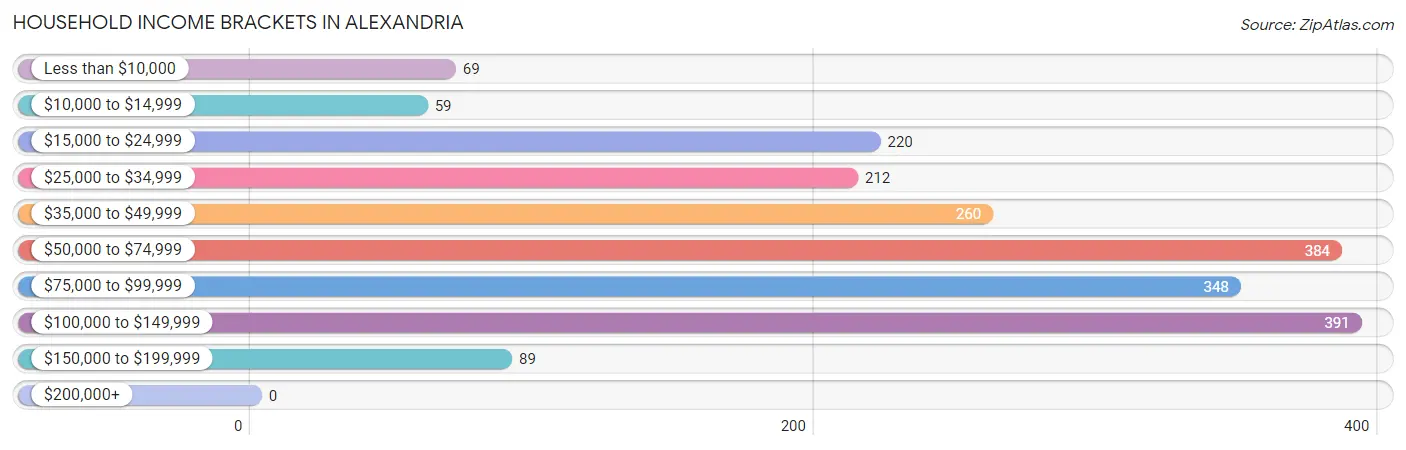
| Income Bracket | # Households | % Households |
| Less than $10,000 | 69 | 3.4% |
| $10,000 to $14,999 | 59 | 2.9% |
| $15,000 to $24,999 | 220 | 10.8% |
| $25,000 to $34,999 | 212 | 10.4% |
| $35,000 to $49,999 | 260 | 12.8% |
| $50,000 to $74,999 | 384 | 18.9% |
| $75,000 to $99,999 | 348 | 17.1% |
| $100,000 to $149,999 | 391 | 19.2% |
| $150,000 to $199,999 | 89 | 4.4% |
| $200,000+ | 0 | 0.0% |
Household Income by Householder Age in Alexandria
The median household income in Alexandria is $58,269, with the highest median household income of $77,554 found in the 25 to 44 years age bracket for the primary householder. A total of 792 households (38.9%) fall into this category. Meanwhile, the 15 to 24 years age bracket for the primary householder has the lowest median household income of $0, with 94 households (4.6%) in this group.
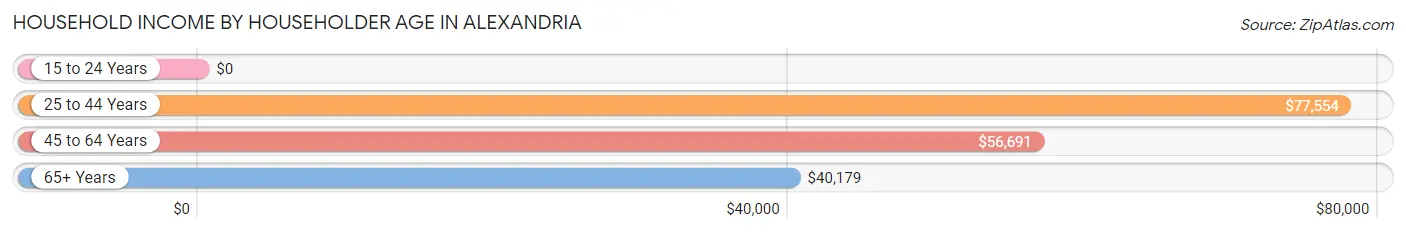
| Income Bracket | # Households | Median Income |
| 15 to 24 Years | 94 (4.6%) | $0 |
| 25 to 44 Years | 792 (38.9%) | $77,554 |
| 45 to 64 Years | 636 (31.3%) | $56,691 |
| 65+ Years | 512 (25.2%) | $40,179 |
| Total | 2,034 (100.0%) | $58,269 |
Poverty in Alexandria
Income Below Poverty by Sex and Age in Alexandria
With 9.0% poverty level for males and 12.8% for females among the residents of Alexandria, 5 year old males and 6 to 11 year old females are the most vulnerable to poverty, with 47 males (50.0%) and 88 females (52.1%) in their respective age groups living below the poverty level.
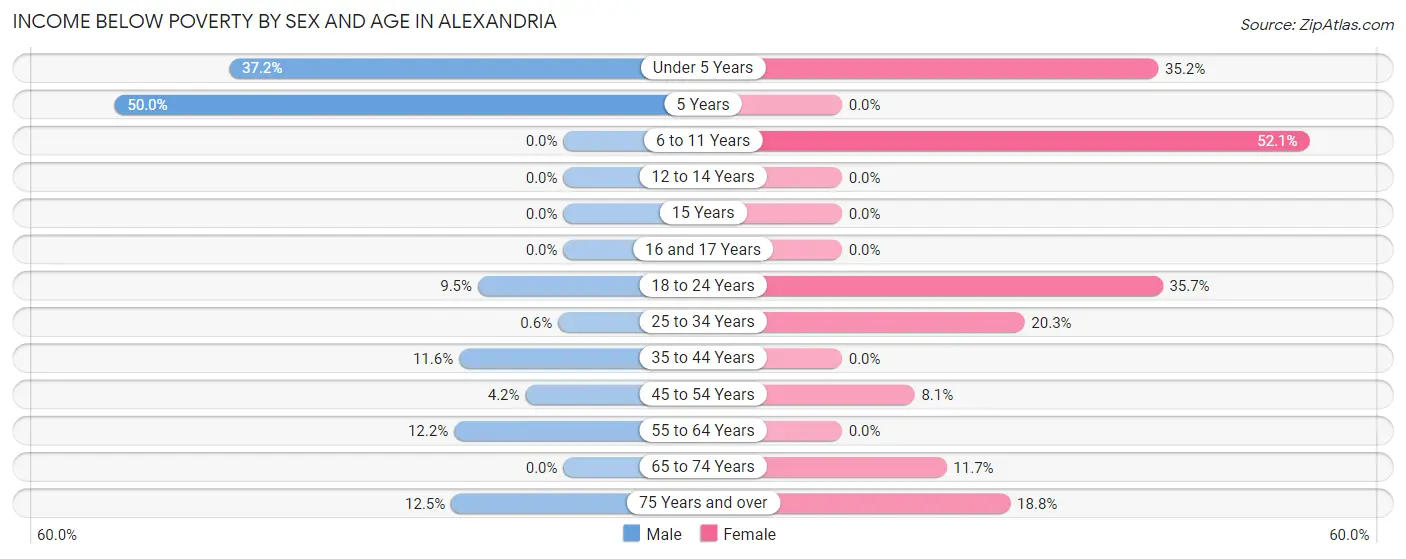
| Age Bracket | Male | Female |
| Under 5 Years | 51 (37.2%) | 31 (35.2%) |
| 5 Years | 47 (50.0%) | 0 (0.0%) |
| 6 to 11 Years | 0 (0.0%) | 88 (52.1%) |
| 12 to 14 Years | 0 (0.0%) | 0 (0.0%) |
| 15 Years | 0 (0.0%) | 0 (0.0%) |
| 16 and 17 Years | 0 (0.0%) | 0 (0.0%) |
| 18 to 24 Years | 12 (9.5%) | 45 (35.7%) |
| 25 to 34 Years | 2 (0.6%) | 48 (20.3%) |
| 35 to 44 Years | 63 (11.6%) | 0 (0.0%) |
| 45 to 54 Years | 13 (4.2%) | 28 (8.1%) |
| 55 to 64 Years | 24 (12.2%) | 0 (0.0%) |
| 65 to 74 Years | 0 (0.0%) | 24 (11.7%) |
| 75 Years and over | 19 (12.5%) | 45 (18.8%) |
| Total | 231 (9.0%) | 309 (12.8%) |
Income Above Poverty by Sex and Age in Alexandria
According to the poverty statistics in Alexandria, males aged 6 to 11 years and females aged 12 to 14 years are the age groups that are most secure financially, with 100.0% of males and 100.0% of females in these age groups living above the poverty line.
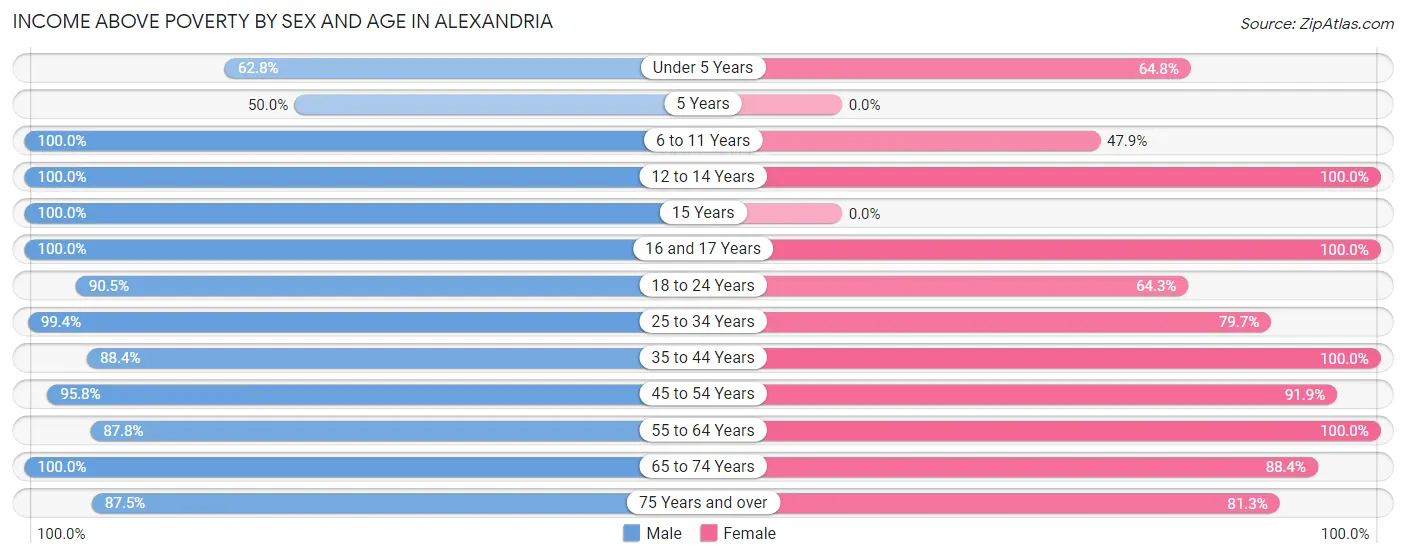
| Age Bracket | Male | Female |
| Under 5 Years | 86 (62.8%) | 57 (64.8%) |
| 5 Years | 47 (50.0%) | 0 (0.0%) |
| 6 to 11 Years | 175 (100.0%) | 81 (47.9%) |
| 12 to 14 Years | 152 (100.0%) | 167 (100.0%) |
| 15 Years | 7 (100.0%) | 0 (0.0%) |
| 16 and 17 Years | 144 (100.0%) | 69 (100.0%) |
| 18 to 24 Years | 114 (90.5%) | 81 (64.3%) |
| 25 to 34 Years | 331 (99.4%) | 188 (79.7%) |
| 35 to 44 Years | 479 (88.4%) | 395 (100.0%) |
| 45 to 54 Years | 294 (95.8%) | 318 (91.9%) |
| 55 to 64 Years | 173 (87.8%) | 375 (100.0%) |
| 65 to 74 Years | 204 (100.0%) | 182 (88.3%) |
| 75 Years and over | 133 (87.5%) | 195 (81.2%) |
| Total | 2,339 (91.0%) | 2,108 (87.2%) |
Income Below Poverty Among Married-Couple Families in Alexandria
The poverty statistics for married-couple families in Alexandria show that 6.8% or 67 of the total 984 families live below the poverty line. Families with 3 or 4 children have the highest poverty rate of 35.0%, comprising of 48 families. On the other hand, families with 1 or 2 children have the lowest poverty rate of 0.0%, which includes 0 families.
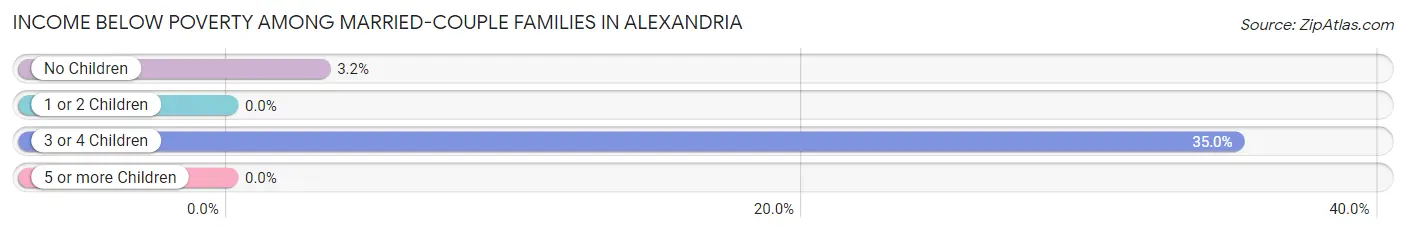
| Children | Above Poverty | Below Poverty |
| No Children | 573 (96.8%) | 19 (3.2%) |
| 1 or 2 Children | 255 (100.0%) | 0 (0.0%) |
| 3 or 4 Children | 89 (65.0%) | 48 (35.0%) |
| 5 or more Children | 0 (0.0%) | 0 (0.0%) |
| Total | 917 (93.2%) | 67 (6.8%) |
Income Below Poverty Among Single-Parent Households in Alexandria
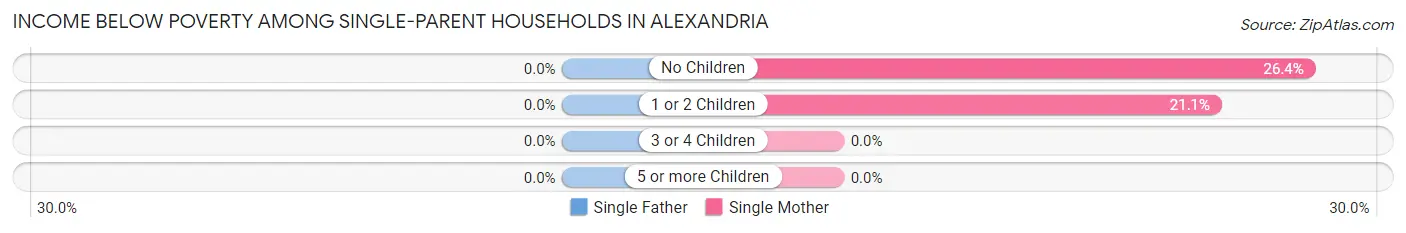
| Children | Single Father | Single Mother |
| No Children | 0 (0.0%) | 24 (26.4%) |
| 1 or 2 Children | 0 (0.0%) | 45 (21.1%) |
| 3 or 4 Children | 0 (0.0%) | 0 (0.0%) |
| 5 or more Children | 0 (0.0%) | 0 (0.0%) |
| Total | 0 (0.0%) | 69 (22.7%) |
Income Below Poverty Among Married-Couple vs Single-Parent Households in Alexandria
The poverty data for Alexandria shows that 67 of the married-couple family households (6.8%) and 69 of the single-parent households (17.4%) are living below the poverty level. Within the married-couple family households, those with 3 or 4 children have the highest poverty rate, with 48 households (35.0%) falling below the poverty line. Among the single-parent households, those with no children have the highest poverty rate, with 24 household (18.8%) living below poverty.
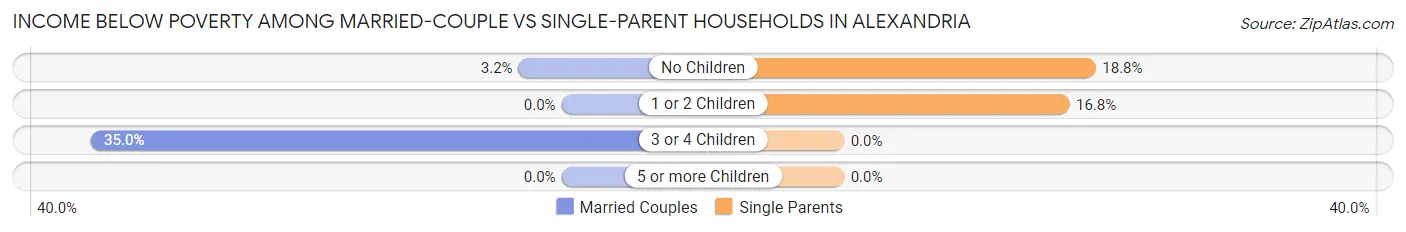
| Children | Married-Couple Families | Single-Parent Households |
| No Children | 19 (3.2%) | 24 (18.8%) |
| 1 or 2 Children | 0 (0.0%) | 45 (16.8%) |
| 3 or 4 Children | 48 (35.0%) | 0 (0.0%) |
| 5 or more Children | 0 (0.0%) | 0 (0.0%) |
| Total | 67 (6.8%) | 69 (17.4%) |
Race in Alexandria
The most populous races in Alexandria are White / Caucasian (4,935 | 95.9%), Black / African American (115 | 2.2%), and Two or more Races (72 | 1.4%).
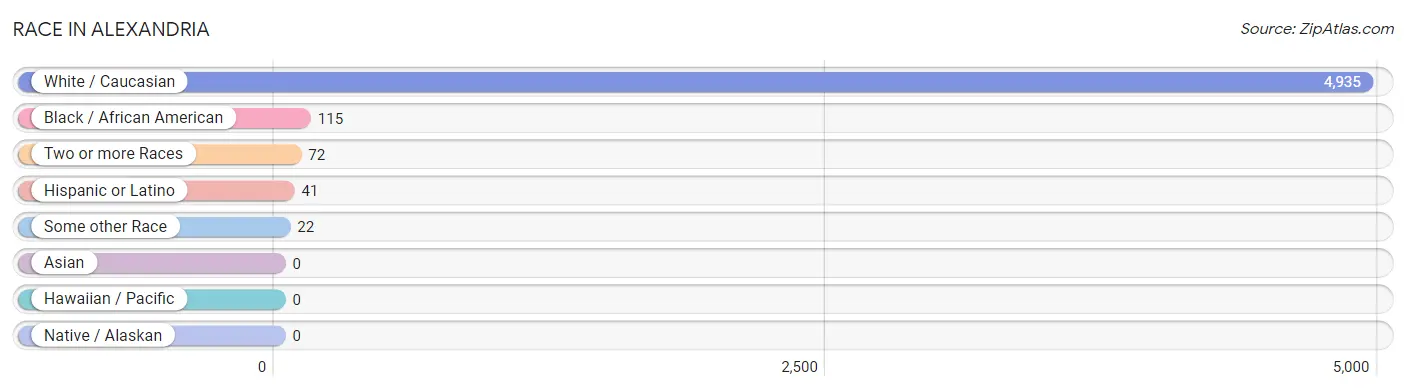
| Race | # Population | % Population |
| Asian | 0 | 0.0% |
| Black / African American | 115 | 2.2% |
| Hawaiian / Pacific | 0 | 0.0% |
| Hispanic or Latino | 41 | 0.8% |
| Native / Alaskan | 0 | 0.0% |
| White / Caucasian | 4,935 | 95.9% |
| Two or more Races | 72 | 1.4% |
| Some other Race | 22 | 0.4% |
| Total | 5,144 | 100.0% |
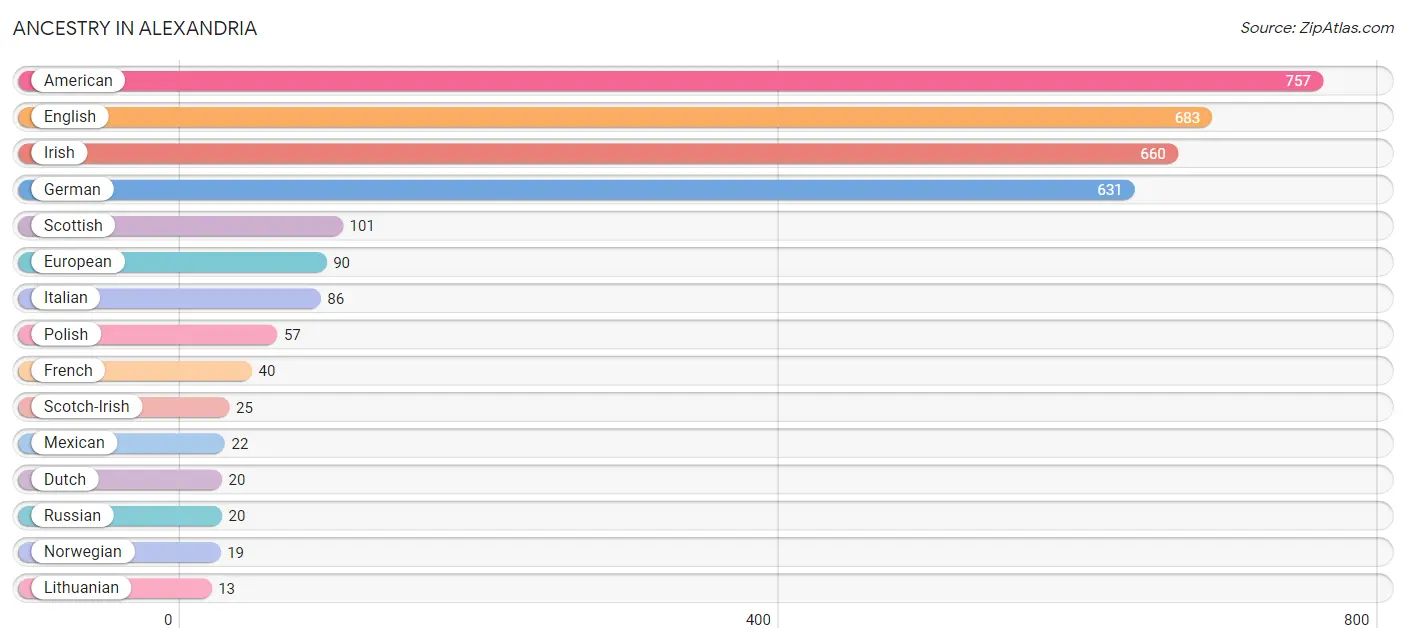
Ancestry in Alexandria
The most populous ancestries reported in Alexandria are American (757 | 14.7%), English (683 | 13.3%), Irish (660 | 12.8%), German (631 | 12.3%), and Scottish (101 | 2.0%), together accounting for 55.1% of all Alexandria residents.
| Ancestry | # Population | % Population |
| African | 1 | 0.0% |
| American | 757 | 14.7% |
| Austrian | 1 | 0.0% |
| Dutch | 20 | 0.4% |
| English | 683 | 13.3% |
| European | 90 | 1.8% |
| French | 40 | 0.8% |
| German | 631 | 12.3% |
| Irish | 660 | 12.8% |
| Italian | 86 | 1.7% |
| Lithuanian | 13 | 0.3% |
| Mexican | 22 | 0.4% |
| Norwegian | 19 | 0.4% |
| Polish | 57 | 1.1% |
| Puerto Rican | 9 | 0.2% |
| Russian | 20 | 0.4% |
| Scotch-Irish | 25 | 0.5% |
| Scottish | 101 | 2.0% |
| Slavic | 13 | 0.3% |
| Subsaharan African | 1 | 0.0% |
| Swedish | 2 | 0.0% |
| Welsh | 7 | 0.1% | View All 22 Rows |
Immigrants in Alexandria

| Immigration Origin | # Population | % Population | View All 0 Rows |
Sex and Age in Alexandria
Sex and Age in Alexandria
The most populous age groups in Alexandria are 40 to 44 Years (274 | 10.5%) for men and 35 to 39 Years (336 | 13.2%) for women.
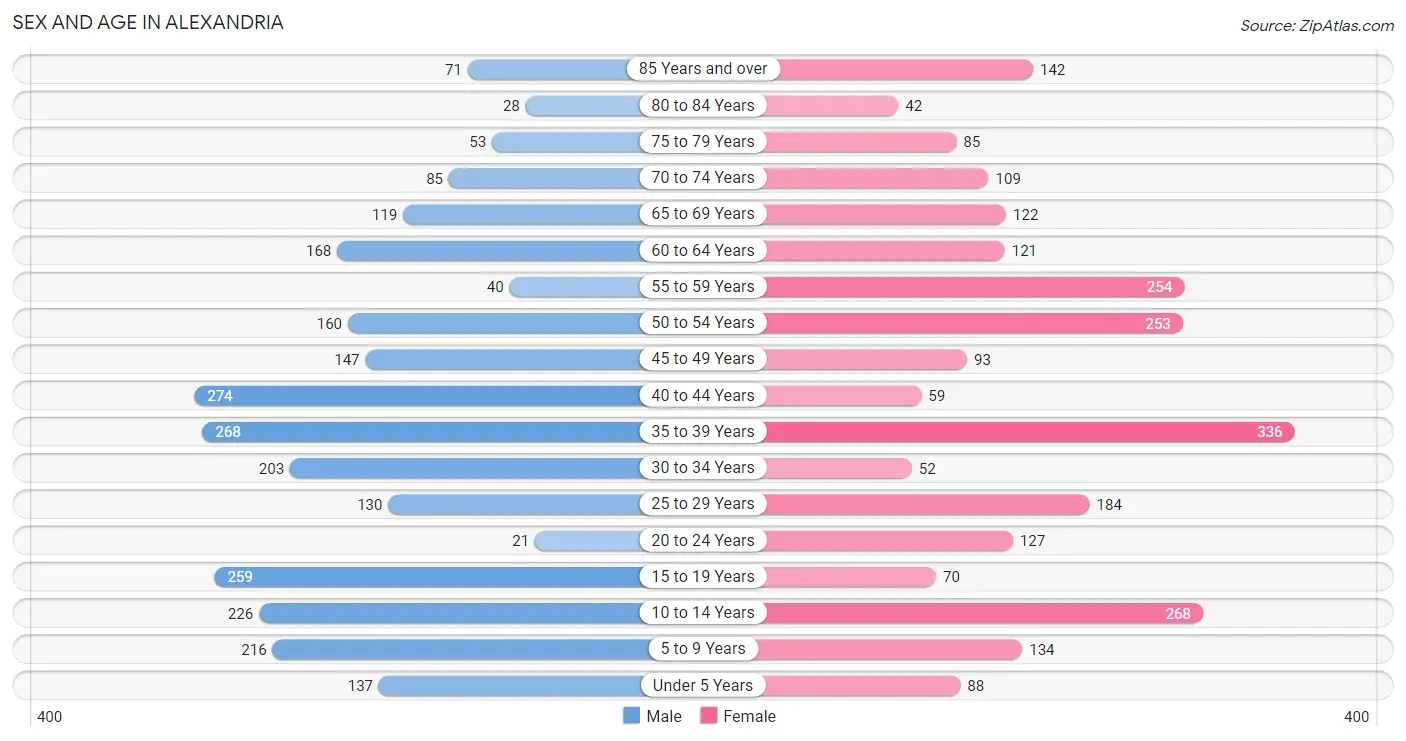
| Age Bracket | Male | Female |
| Under 5 Years | 137 (5.3%) | 88 (3.5%) |
| 5 to 9 Years | 216 (8.3%) | 134 (5.3%) |
| 10 to 14 Years | 226 (8.7%) | 268 (10.6%) |
| 15 to 19 Years | 259 (9.9%) | 70 (2.8%) |
| 20 to 24 Years | 21 (0.8%) | 127 (5.0%) |
| 25 to 29 Years | 130 (5.0%) | 184 (7.2%) |
| 30 to 34 Years | 203 (7.8%) | 52 (2.1%) |
| 35 to 39 Years | 268 (10.3%) | 336 (13.2%) |
| 40 to 44 Years | 274 (10.5%) | 59 (2.3%) |
| 45 to 49 Years | 147 (5.6%) | 93 (3.7%) |
| 50 to 54 Years | 160 (6.1%) | 253 (10.0%) |
| 55 to 59 Years | 40 (1.5%) | 254 (10.0%) |
| 60 to 64 Years | 168 (6.5%) | 121 (4.8%) |
| 65 to 69 Years | 119 (4.6%) | 122 (4.8%) |
| 70 to 74 Years | 85 (3.3%) | 109 (4.3%) |
| 75 to 79 Years | 53 (2.0%) | 85 (3.4%) |
| 80 to 84 Years | 28 (1.1%) | 42 (1.7%) |
| 85 Years and over | 71 (2.7%) | 142 (5.6%) |
| Total | 2,605 (100.0%) | 2,539 (100.0%) |
Families and Households in Alexandria
Median Family Size in Alexandria
The median family size in Alexandria is 3.00 persons per family, with married-couple families (984 | 71.3%) accounting for the largest median family size of 3.21 persons per family. On the other hand, single male/father families (92 | 6.7%) represent the smallest median family size with 1.99 persons per family.
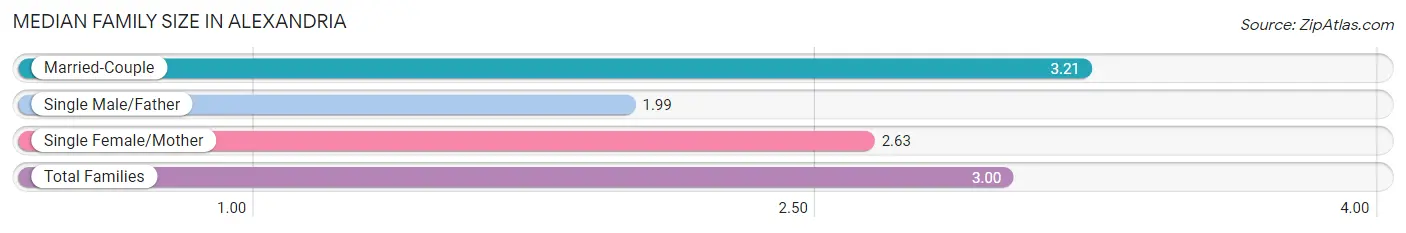
| Family Type | # Families | Family Size |
| Married-Couple | 984 (71.3%) | 3.21 |
| Single Male/Father | 92 (6.7%) | 1.99 |
| Single Female/Mother | 304 (22.0%) | 2.63 |
| Total Families | 1,380 (100.0%) | 3.00 |
Median Household Size in Alexandria
The median household size in Alexandria is 2.49 persons per household, with married-couple households (984 | 48.4%) accounting for the largest median household size of 3.32 persons per household. non-family households (654 | 32.2%) represent the smallest median household size with 1.14 persons per household.
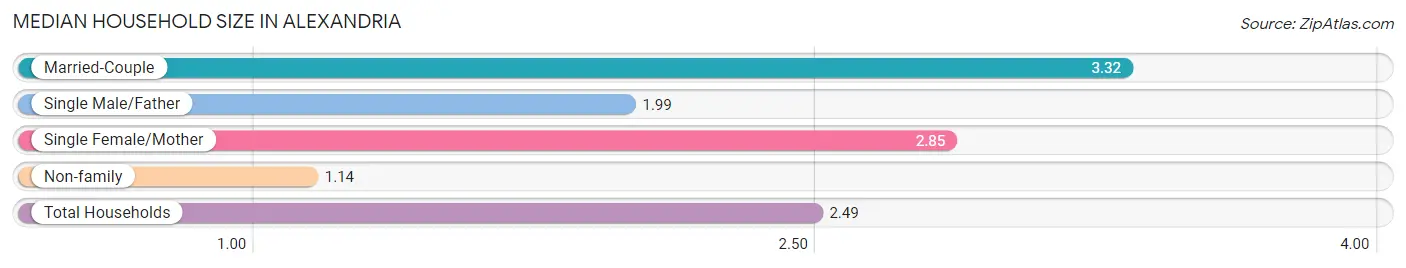
| Household Type | # Households | Household Size |
| Married-Couple | 984 (48.4%) | 3.32 |
| Single Male/Father | 92 (4.5%) | 1.99 |
| Single Female/Mother | 304 (14.9%) | 2.85 |
| Non-family | 654 (32.2%) | 1.14 |
| Total Households | 2,034 (100.0%) | 2.49 |
Household Size by Marriage Status in Alexandria
Out of a total of 2,034 households in Alexandria, 1,380 (67.8%) are family households, while 654 (32.2%) are nonfamily households. The most numerous type of family households are 2-person households, comprising 618, and the most common type of nonfamily households are 1-person households, comprising 568.
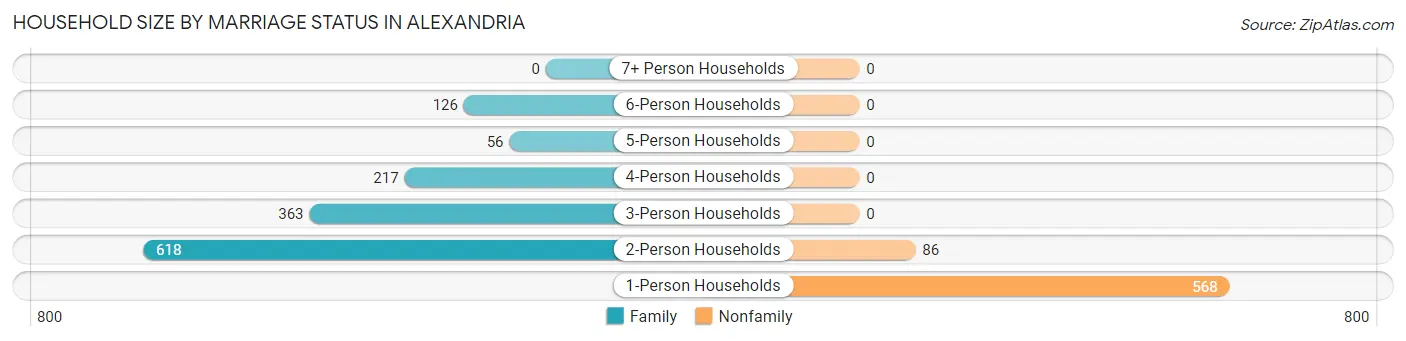
| Household Size | Family Households | Nonfamily Households |
| 1-Person Households | - | 568 (27.9%) |
| 2-Person Households | 618 (30.4%) | 86 (4.2%) |
| 3-Person Households | 363 (17.8%) | 0 (0.0%) |
| 4-Person Households | 217 (10.7%) | 0 (0.0%) |
| 5-Person Households | 56 (2.8%) | 0 (0.0%) |
| 6-Person Households | 126 (6.2%) | 0 (0.0%) |
| 7+ Person Households | 0 (0.0%) | 0 (0.0%) |
| Total | 1,380 (67.8%) | 654 (32.2%) |
Female Fertility in Alexandria
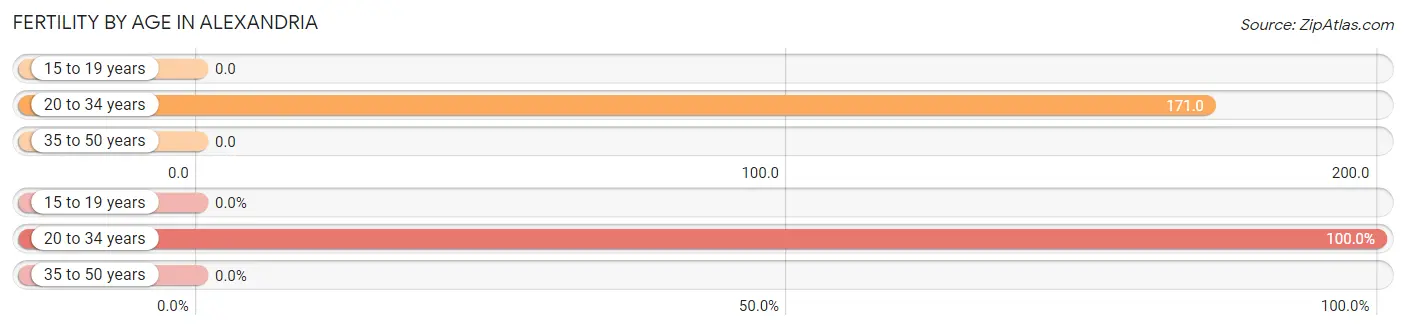
Fertility by Age in Alexandria
Average fertility rate in Alexandria is 67.0 births per 1,000 women. Women in the age bracket of 20 to 34 years have the highest fertility rate with 171.0 births per 1,000 women. Women in the age bracket of 20 to 34 years acount for 100.0% of all women with births.
| Age Bracket | Women with Births | Births / 1,000 Women |
| 15 to 19 years | 0 (0.0%) | 0.0 |
| 20 to 34 years | 62 (100.0%) | 171.0 |
| 35 to 50 years | 0 (0.0%) | 0.0 |
| Total | 62 (100.0%) | 67.0 |
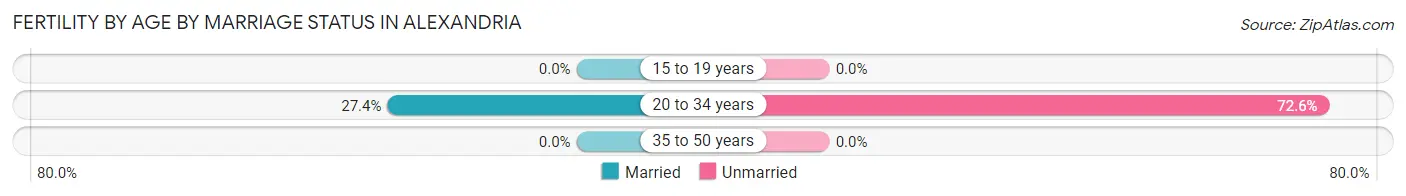
Fertility by Age by Marriage Status in Alexandria
27.4% of women with births (62) in Alexandria are married. The highest percentage of unmarried women with births falls into 20 to 34 years age bracket with 72.6% of them unmarried at the time of birth, while the lowest percentage of unmarried women with births belong to 20 to 34 years age bracket with 72.6% of them unmarried.
| Age Bracket | Married | Unmarried |
| 15 to 19 years | 0 (0.0%) | 0 (0.0%) |
| 20 to 34 years | 17 (27.4%) | 45 (72.6%) |
| 35 to 50 years | 0 (0.0%) | 0 (0.0%) |
| Total | 17 (27.4%) | 45 (72.6%) |
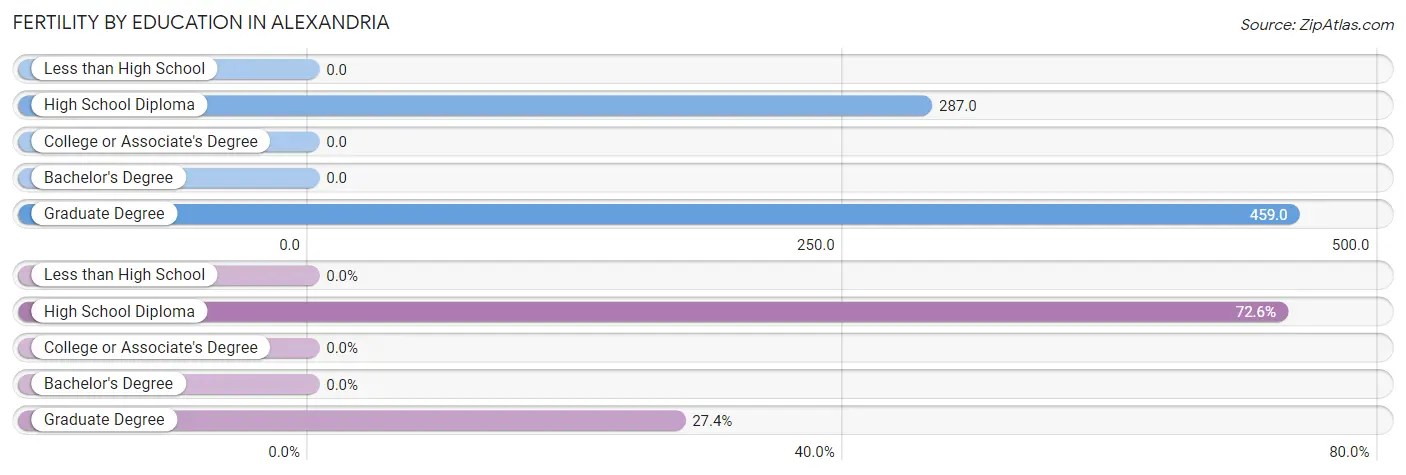
Fertility by Education in Alexandria
| Educational Attainment | Women with Births | Births / 1,000 Women |
| Less than High School | 0 (0.0%) | 0.0 |
| High School Diploma | 45 (72.6%) | 287.0 |
| College or Associate's Degree | 0 (0.0%) | 0.0 |
| Bachelor's Degree | 0 (0.0%) | 0.0 |
| Graduate Degree | 17 (27.4%) | 459.0 |
| Total | 62 (100.0%) | 67.0 |
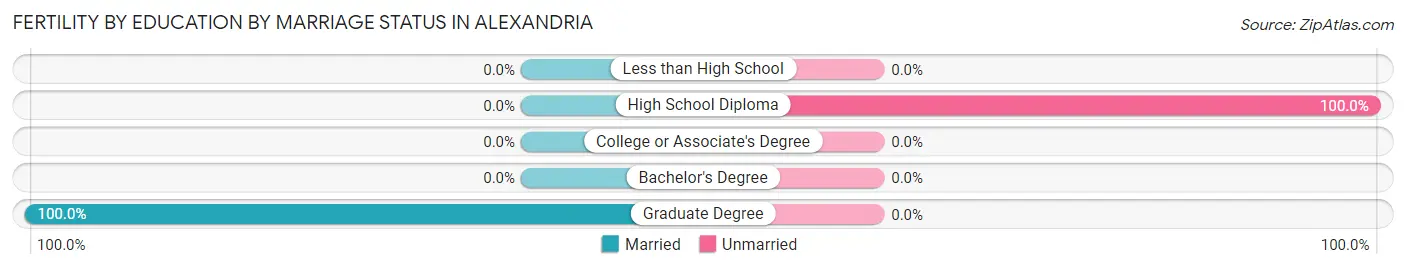
Fertility by Education by Marriage Status in Alexandria
72.6% of women with births in Alexandria are unmarried. Women with the educational attainment of graduate degree are most likely to be married with 100.0% of them married at childbirth, while women with the educational attainment of high school diploma are least likely to be married with 100.0% of them unmarried at childbirth.
| Educational Attainment | Married | Unmarried |
| Less than High School | 0 (0.0%) | 0 (0.0%) |
| High School Diploma | 0 (0.0%) | 45 (100.0%) |
| College or Associate's Degree | 0 (0.0%) | 0 (0.0%) |
| Bachelor's Degree | 0 (0.0%) | 0 (0.0%) |
| Graduate Degree | 17 (100.0%) | 0 (0.0%) |
| Total | 17 (27.4%) | 45 (72.6%) |
Employment Characteristics in Alexandria
Employment by Class of Employer in Alexandria
Among the 2,348 employed individuals in Alexandria, private company employees (1,756 | 74.8%), not-for-profit organizations (199 | 8.5%), and local government employees (194 | 8.3%) make up the most common classes of employment.
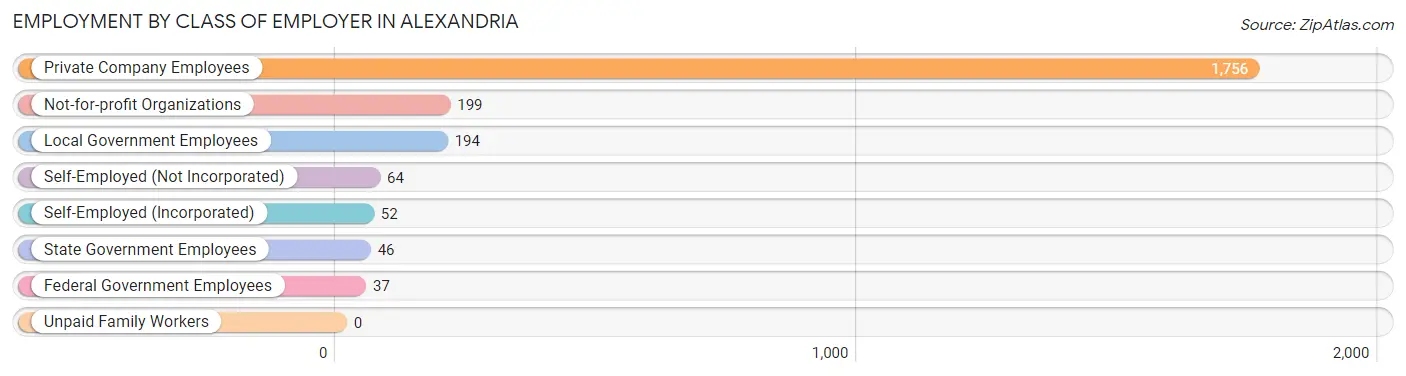
| Employer Class | # Employees | % Employees |
| Private Company Employees | 1,756 | 74.8% |
| Self-Employed (Incorporated) | 52 | 2.2% |
| Self-Employed (Not Incorporated) | 64 | 2.7% |
| Not-for-profit Organizations | 199 | 8.5% |
| Local Government Employees | 194 | 8.3% |
| State Government Employees | 46 | 2.0% |
| Federal Government Employees | 37 | 1.6% |
| Unpaid Family Workers | 0 | 0.0% |
| Total | 2,348 | 100.0% |
Employment Status by Age in Alexandria
According to the labor force statistics for Alexandria, out of the total population over 16 years of age (4,068), 63.6% or 2,587 individuals are in the labor force, with 8.0% or 207 of them unemployed. The age group with the highest labor force participation rate is 25 to 29 years, with 93.6% or 294 individuals in the labor force. Within the labor force, the 16 to 19 years age range has the highest percentage of unemployed individuals, with 29.6% or 29 of them being unemployed.
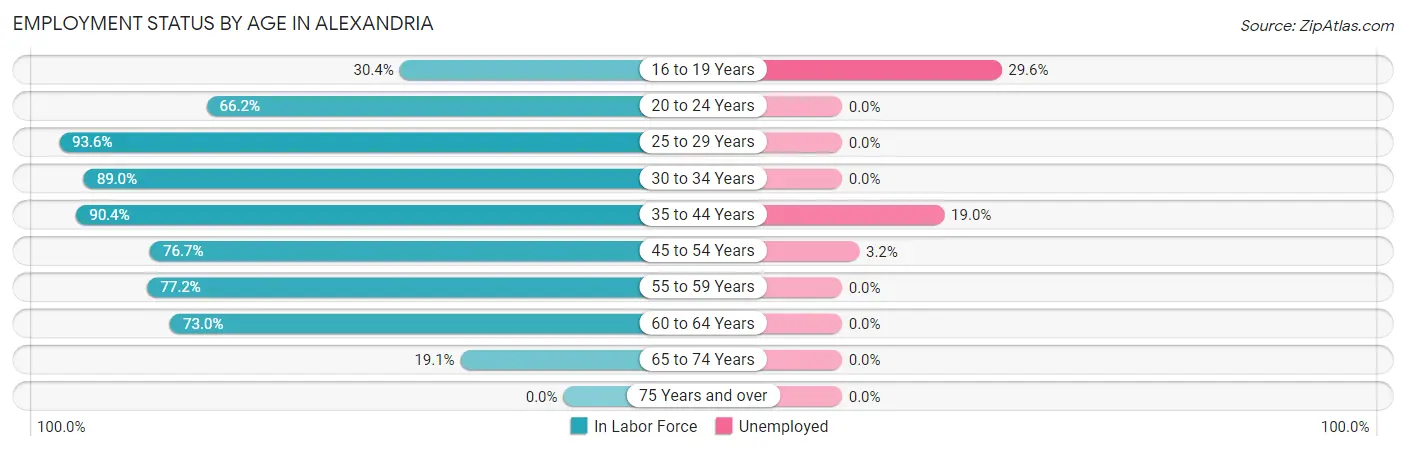
| Age Bracket | In Labor Force | Unemployed |
| 16 to 19 Years | 98 (30.4%) | 29 (29.6%) |
| 20 to 24 Years | 98 (66.2%) | 0 (0.0%) |
| 25 to 29 Years | 294 (93.6%) | 0 (0.0%) |
| 30 to 34 Years | 227 (89.0%) | 0 (0.0%) |
| 35 to 44 Years | 847 (90.4%) | 161 (19.0%) |
| 45 to 54 Years | 501 (76.7%) | 16 (3.2%) |
| 55 to 59 Years | 227 (77.2%) | 0 (0.0%) |
| 60 to 64 Years | 211 (73.0%) | 0 (0.0%) |
| 65 to 74 Years | 83 (19.1%) | 0 (0.0%) |
| 75 Years and over | 0 (0.0%) | 0 (0.0%) |
| Total | 2,587 (63.6%) | 207 (8.0%) |
Employment Status by Educational Attainment in Alexandria
According to labor force statistics for Alexandria, 84.1% of individuals (2,306) out of the total population between 25 and 64 years of age (2,742) are in the labor force, with 7.7% or 178 of them being unemployed. The group with the highest labor force participation rate are those with the educational attainment of college / associate degree, with 95.4% or 1,132 individuals in the labor force. Within the labor force, individuals with less than high school education have the highest percentage of unemployment, with 13.9% or 16 of them being unemployed.
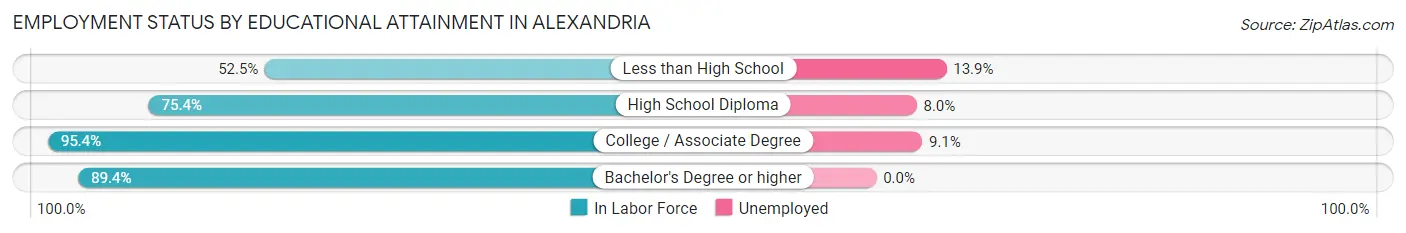
| Educational Attainment | In Labor Force | Unemployed |
| Less than High School | 115 (52.5%) | 30 (13.9%) |
| High School Diploma | 722 (75.4%) | 77 (8.0%) |
| College / Associate Degree | 1,132 (95.4%) | 108 (9.1%) |
| Bachelor's Degree or higher | 338 (89.4%) | 0 (0.0%) |
| Total | 2,306 (84.1%) | 211 (7.7%) |
Employment Occupations by Sex in Alexandria
Management, Business, Science and Arts Occupations
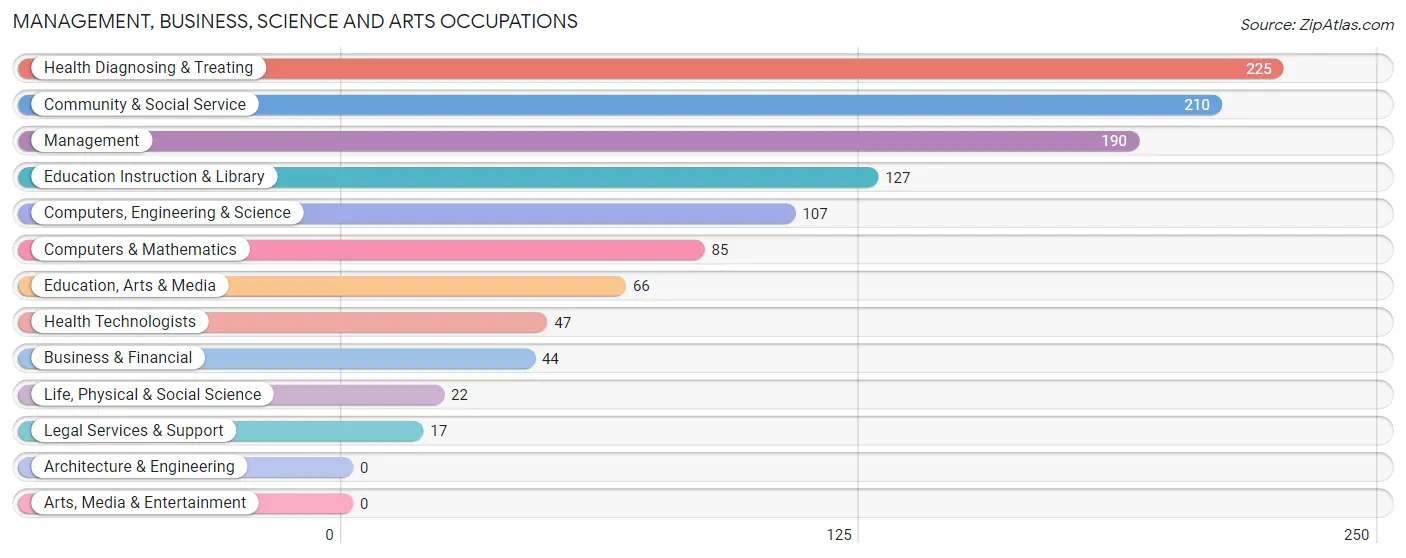
The most common Management, Business, Science and Arts occupations in Alexandria are Health Diagnosing & Treating (225 | 9.5%), Community & Social Service (210 | 8.8%), Management (190 | 8.0%), Education Instruction & Library (127 | 5.3%), and Computers, Engineering & Science (107 | 4.5%).
Management, Business, Science and Arts Occupations by Sex
Within the Management, Business, Science and Arts occupations in Alexandria, the most male-oriented occupations are Computers & Mathematics (100.0%), Computers, Engineering & Science (79.4%), and Management (66.3%), while the most female-oriented occupations are Life, Physical & Social Science (100.0%), Legal Services & Support (100.0%), and Health Technologists (100.0%).
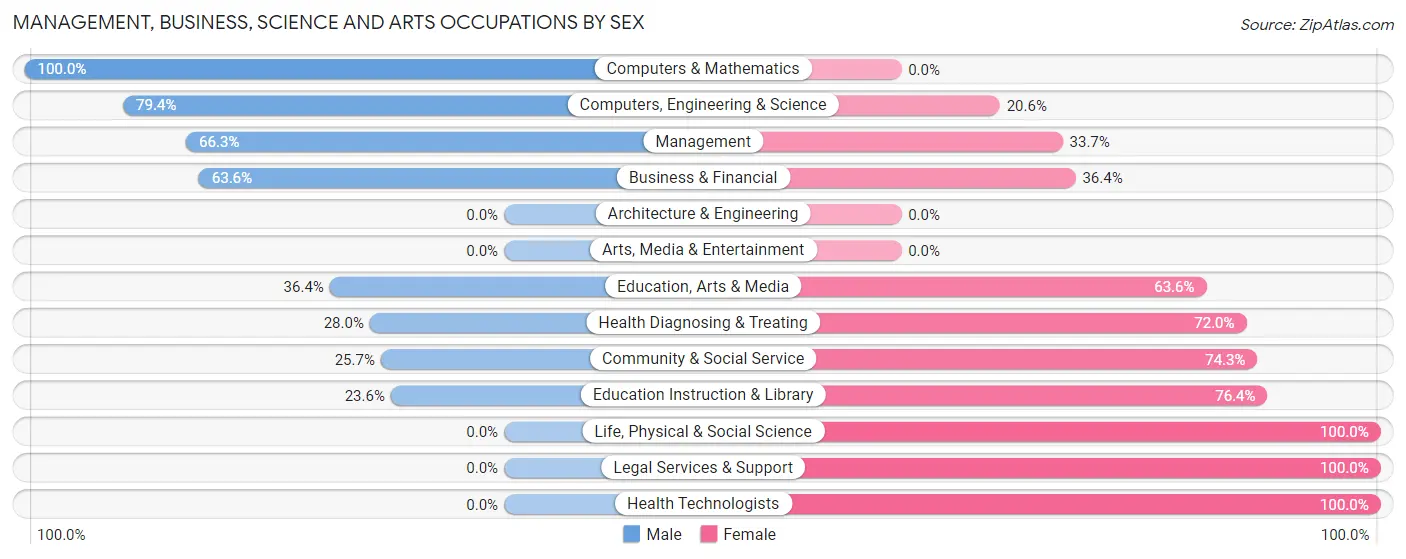
| Occupation | Male | Female |
| Management | 126 (66.3%) | 64 (33.7%) |
| Business & Financial | 28 (63.6%) | 16 (36.4%) |
| Computers, Engineering & Science | 85 (79.4%) | 22 (20.6%) |
| Computers & Mathematics | 85 (100.0%) | 0 (0.0%) |
| Architecture & Engineering | 0 (0.0%) | 0 (0.0%) |
| Life, Physical & Social Science | 0 (0.0%) | 22 (100.0%) |
| Community & Social Service | 54 (25.7%) | 156 (74.3%) |
| Education, Arts & Media | 24 (36.4%) | 42 (63.6%) |
| Legal Services & Support | 0 (0.0%) | 17 (100.0%) |
| Education Instruction & Library | 30 (23.6%) | 97 (76.4%) |
| Arts, Media & Entertainment | 0 (0.0%) | 0 (0.0%) |
| Health Diagnosing & Treating | 63 (28.0%) | 162 (72.0%) |
| Health Technologists | 0 (0.0%) | 47 (100.0%) |
| Total (Category) | 356 (45.9%) | 420 (54.1%) |
| Total (Overall) | 1,131 (47.5%) | 1,249 (52.5%) |
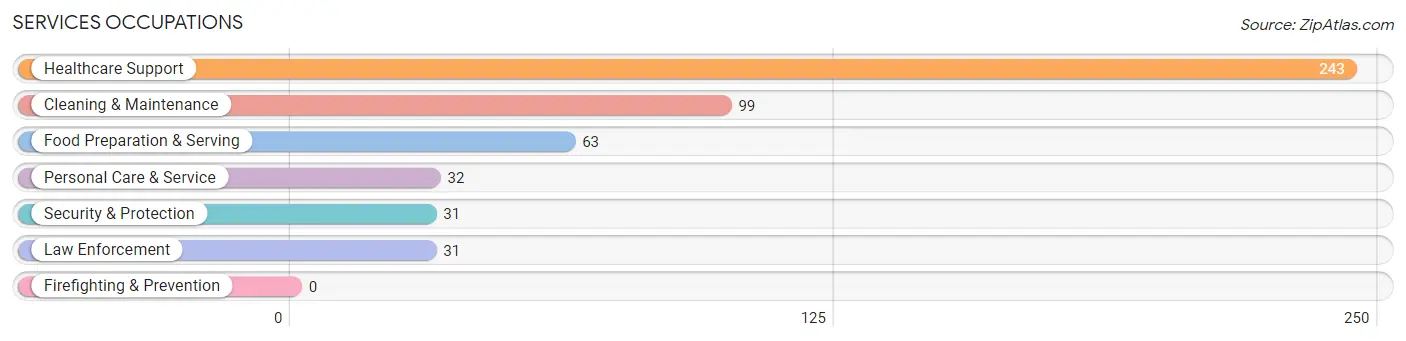
Services Occupations
The most common Services occupations in Alexandria are Healthcare Support (243 | 10.2%), Cleaning & Maintenance (99 | 4.2%), Food Preparation & Serving (63 | 2.6%), Personal Care & Service (32 | 1.3%), and Security & Protection (31 | 1.3%).
Services Occupations by Sex
Within the Services occupations in Alexandria, the most male-oriented occupations are Security & Protection (100.0%), Law Enforcement (100.0%), and Cleaning & Maintenance (26.3%), while the most female-oriented occupations are Healthcare Support (99.6%), Personal Care & Service (75.0%), and Food Preparation & Serving (74.6%).
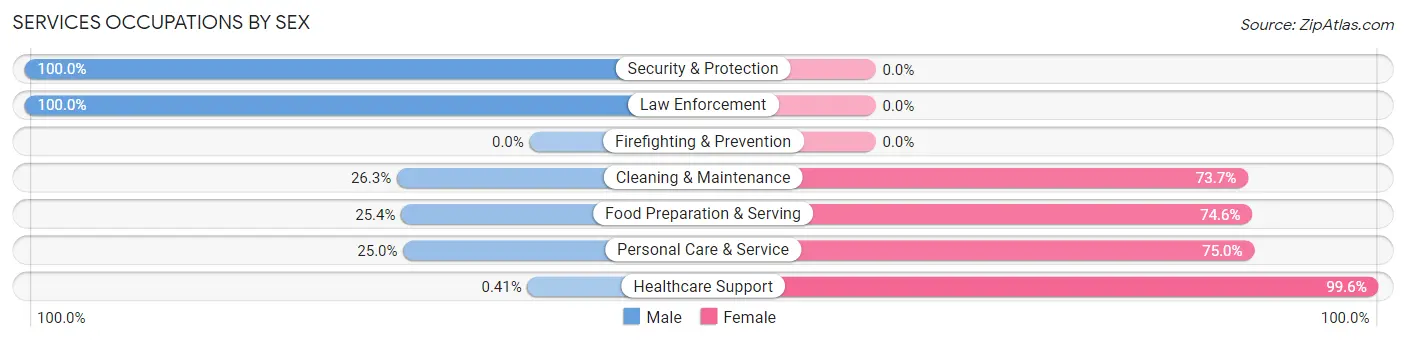
| Occupation | Male | Female |
| Healthcare Support | 1 (0.4%) | 242 (99.6%) |
| Security & Protection | 31 (100.0%) | 0 (0.0%) |
| Firefighting & Prevention | 0 (0.0%) | 0 (0.0%) |
| Law Enforcement | 31 (100.0%) | 0 (0.0%) |
| Food Preparation & Serving | 16 (25.4%) | 47 (74.6%) |
| Cleaning & Maintenance | 26 (26.3%) | 73 (73.7%) |
| Personal Care & Service | 8 (25.0%) | 24 (75.0%) |
| Total (Category) | 82 (17.5%) | 386 (82.5%) |
| Total (Overall) | 1,131 (47.5%) | 1,249 (52.5%) |
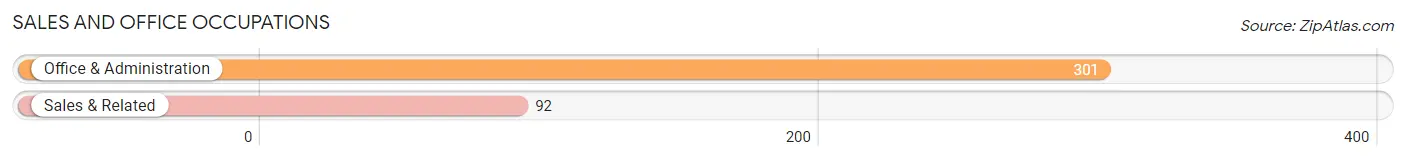
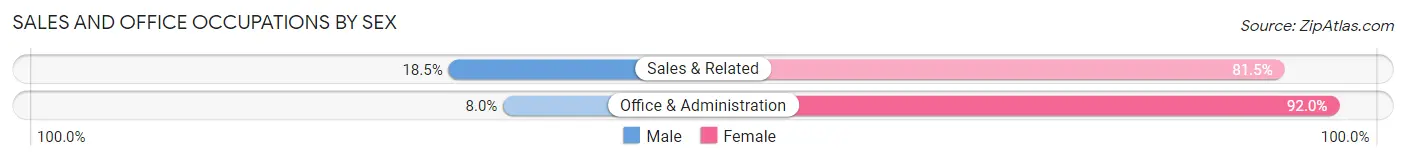
Sales and Office Occupations
The most common Sales and Office occupations in Alexandria are Office & Administration (301 | 12.7%), and Sales & Related (92 | 3.9%).
Sales and Office Occupations by Sex
| Occupation | Male | Female |
| Sales & Related | 17 (18.5%) | 75 (81.5%) |
| Office & Administration | 24 (8.0%) | 277 (92.0%) |
| Total (Category) | 41 (10.4%) | 352 (89.6%) |
| Total (Overall) | 1,131 (47.5%) | 1,249 (52.5%) |
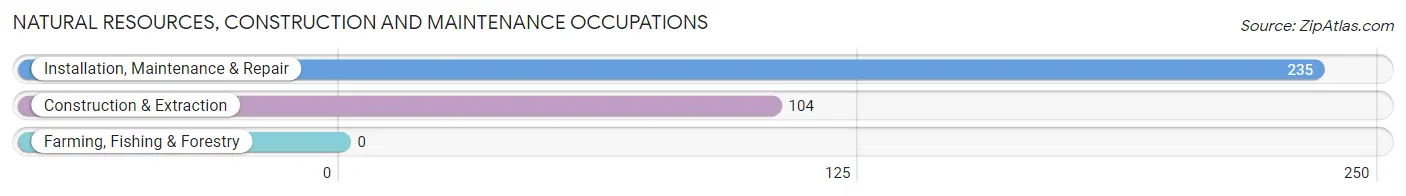
Natural Resources, Construction and Maintenance Occupations
The most common Natural Resources, Construction and Maintenance occupations in Alexandria are Installation, Maintenance & Repair (235 | 9.9%), and Construction & Extraction (104 | 4.4%).
Natural Resources, Construction and Maintenance Occupations by Sex
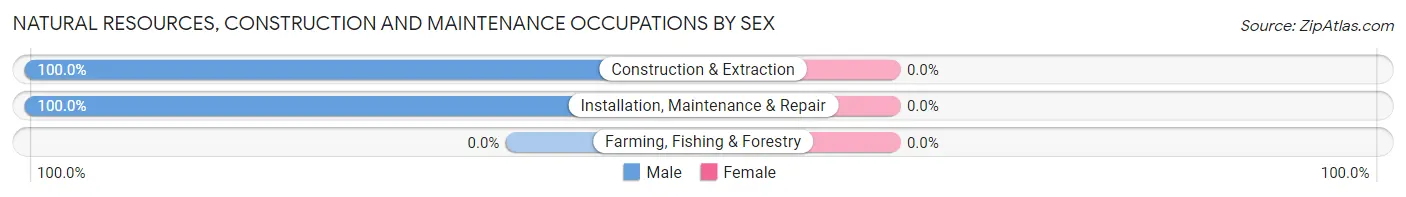
| Occupation | Male | Female |
| Farming, Fishing & Forestry | 0 (0.0%) | 0 (0.0%) |
| Construction & Extraction | 104 (100.0%) | 0 (0.0%) |
| Installation, Maintenance & Repair | 235 (100.0%) | 0 (0.0%) |
| Total (Category) | 339 (100.0%) | 0 (0.0%) |
| Total (Overall) | 1,131 (47.5%) | 1,249 (52.5%) |
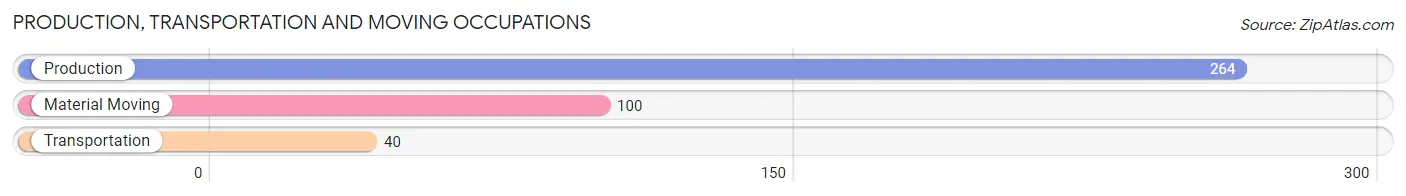
Production, Transportation and Moving Occupations
The most common Production, Transportation and Moving occupations in Alexandria are Production (264 | 11.1%), Material Moving (100 | 4.2%), and Transportation (40 | 1.7%).
Production, Transportation and Moving Occupations by Sex
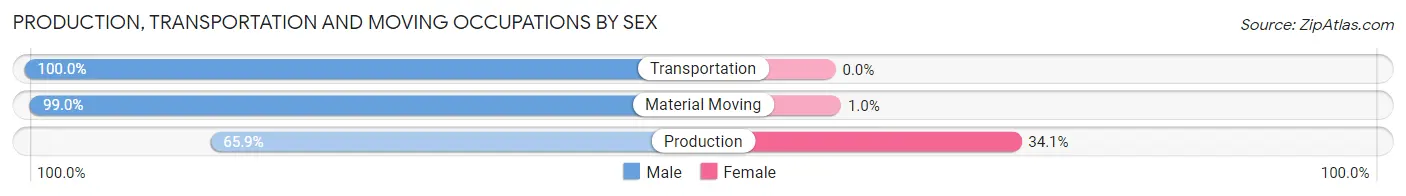
| Occupation | Male | Female |
| Production | 174 (65.9%) | 90 (34.1%) |
| Transportation | 40 (100.0%) | 0 (0.0%) |
| Material Moving | 99 (99.0%) | 1 (1.0%) |
| Total (Category) | 313 (77.5%) | 91 (22.5%) |
| Total (Overall) | 1,131 (47.5%) | 1,249 (52.5%) |
Employment Industries by Sex in Alexandria
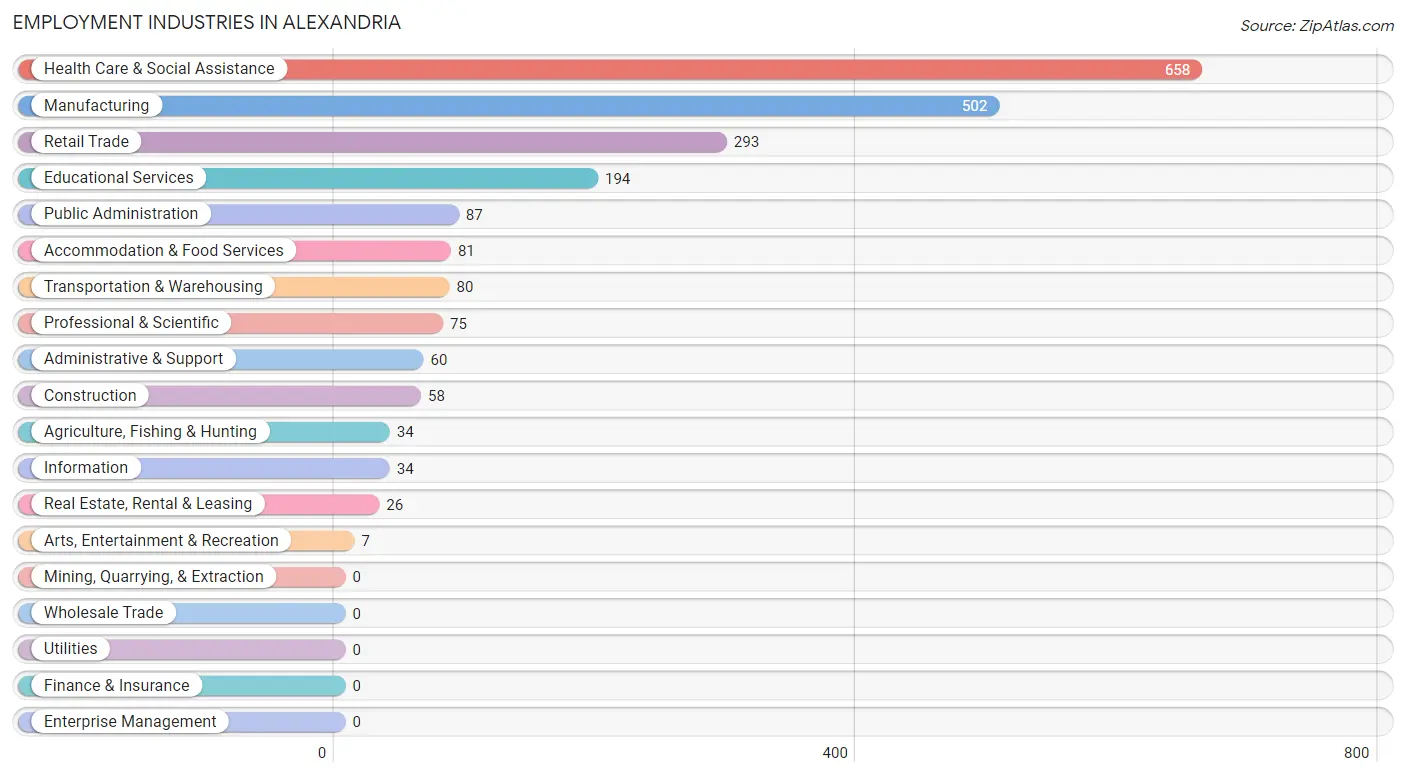
Employment Industries in Alexandria
The major employment industries in Alexandria include Health Care & Social Assistance (658 | 27.7%), Manufacturing (502 | 21.1%), Retail Trade (293 | 12.3%), Educational Services (194 | 8.2%), and Public Administration (87 | 3.7%).
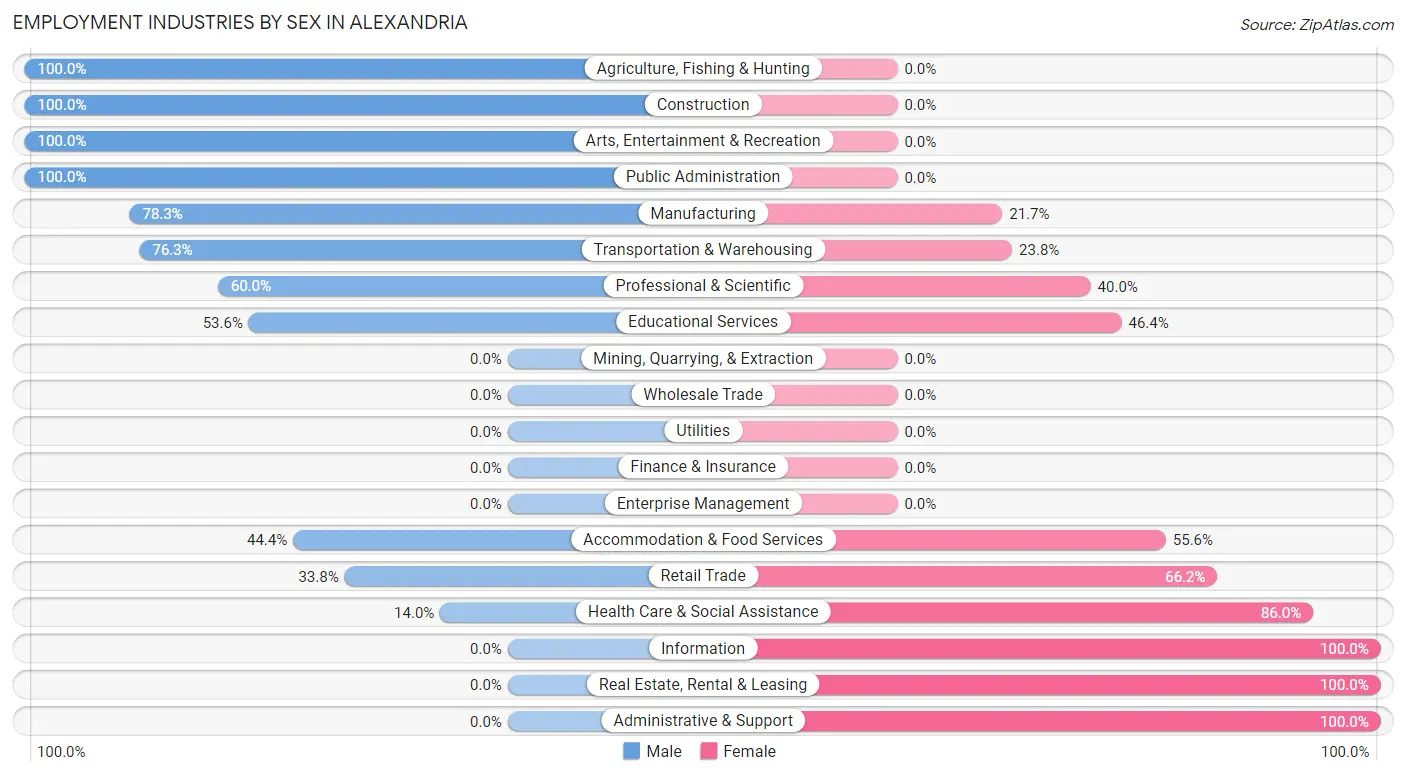
Employment Industries by Sex in Alexandria
The Alexandria industries that see more men than women are Agriculture, Fishing & Hunting (100.0%), Construction (100.0%), and Arts, Entertainment & Recreation (100.0%), whereas the industries that tend to have a higher number of women are Information (100.0%), Real Estate, Rental & Leasing (100.0%), and Administrative & Support (100.0%).
| Industry | Male | Female |
| Agriculture, Fishing & Hunting | 34 (100.0%) | 0 (0.0%) |
| Mining, Quarrying, & Extraction | 0 (0.0%) | 0 (0.0%) |
| Construction | 58 (100.0%) | 0 (0.0%) |
| Manufacturing | 393 (78.3%) | 109 (21.7%) |
| Wholesale Trade | 0 (0.0%) | 0 (0.0%) |
| Retail Trade | 99 (33.8%) | 194 (66.2%) |
| Transportation & Warehousing | 61 (76.2%) | 19 (23.7%) |
| Utilities | 0 (0.0%) | 0 (0.0%) |
| Information | 0 (0.0%) | 34 (100.0%) |
| Finance & Insurance | 0 (0.0%) | 0 (0.0%) |
| Real Estate, Rental & Leasing | 0 (0.0%) | 26 (100.0%) |
| Professional & Scientific | 45 (60.0%) | 30 (40.0%) |
| Enterprise Management | 0 (0.0%) | 0 (0.0%) |
| Administrative & Support | 0 (0.0%) | 60 (100.0%) |
| Educational Services | 104 (53.6%) | 90 (46.4%) |
| Health Care & Social Assistance | 92 (14.0%) | 566 (86.0%) |
| Arts, Entertainment & Recreation | 7 (100.0%) | 0 (0.0%) |
| Accommodation & Food Services | 36 (44.4%) | 45 (55.6%) |
| Public Administration | 87 (100.0%) | 0 (0.0%) |
| Total | 1,131 (47.5%) | 1,249 (52.5%) |
Education in Alexandria
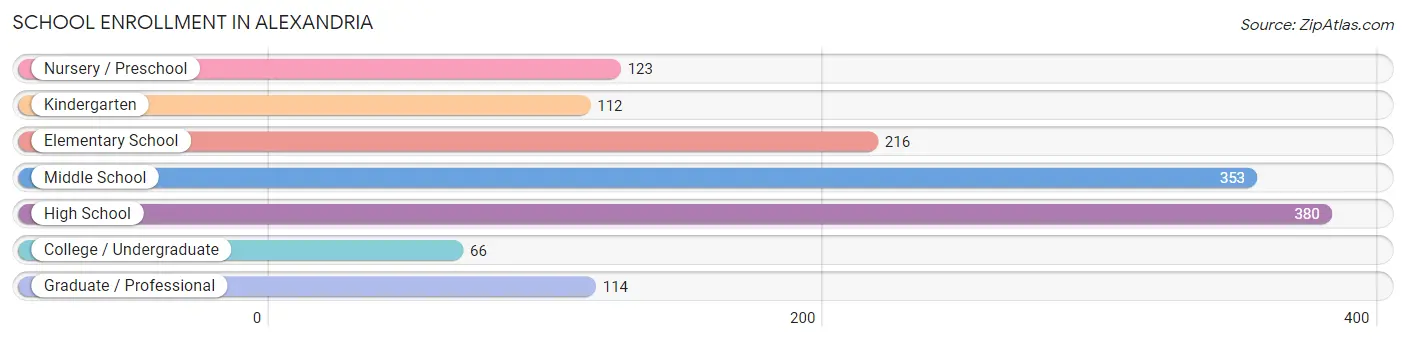
School Enrollment in Alexandria
The most common levels of schooling among the 1,364 students in Alexandria are high school (380 | 27.9%), middle school (353 | 25.9%), and elementary school (216 | 15.8%).
| School Level | # Students | % Students |
| Nursery / Preschool | 123 | 9.0% |
| Kindergarten | 112 | 8.2% |
| Elementary School | 216 | 15.8% |
| Middle School | 353 | 25.9% |
| High School | 380 | 27.9% |
| College / Undergraduate | 66 | 4.8% |
| Graduate / Professional | 114 | 8.4% |
| Total | 1,364 | 100.0% |
School Enrollment by Age by Funding Source in Alexandria
Out of a total of 1,364 students who are enrolled in schools in Alexandria, 112 (8.2%) attend a private institution, while the remaining 1,252 (91.8%) are enrolled in public schools. The age group of 20 to 24 year olds has the highest likelihood of being enrolled in private schools, with 2 (66.7% in the age bracket) enrolled. Conversely, the age group of 15 to 17 year olds has the lowest likelihood of being enrolled in a private school, with 220 (100.0% in the age bracket) attending a public institution.
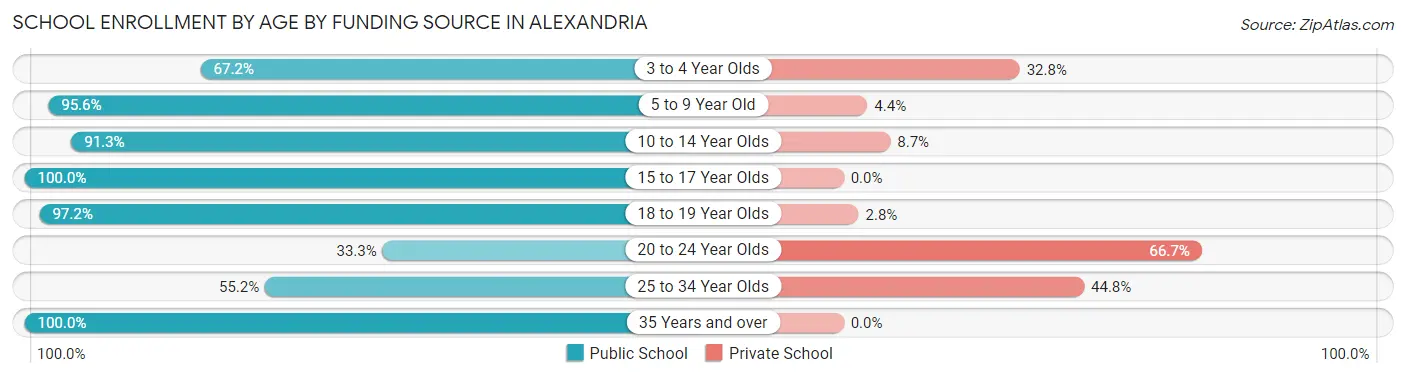
| Age Bracket | Public School | Private School |
| 3 to 4 Year Olds | 41 (67.2%) | 20 (32.8%) |
| 5 to 9 Year Old | 324 (95.6%) | 15 (4.4%) |
| 10 to 14 Year Olds | 451 (91.3%) | 43 (8.7%) |
| 15 to 17 Year Olds | 220 (100.0%) | 0 (0.0%) |
| 18 to 19 Year Olds | 70 (97.2%) | 2 (2.8%) |
| 20 to 24 Year Olds | 1 (33.3%) | 2 (66.7%) |
| 25 to 34 Year Olds | 37 (55.2%) | 30 (44.8%) |
| 35 Years and over | 108 (100.0%) | 0 (0.0%) |
| Total | 1,252 (91.8%) | 112 (8.2%) |
Educational Attainment by Field of Study in Alexandria
Education (148 | 30.6%), business (84 | 17.4%), computers & mathematics (52 | 10.8%), bio, nature & agricultural (40 | 8.3%), and psychology (39 | 8.1%) are the most common fields of study among 483 individuals in Alexandria who have obtained a bachelor's degree or higher.
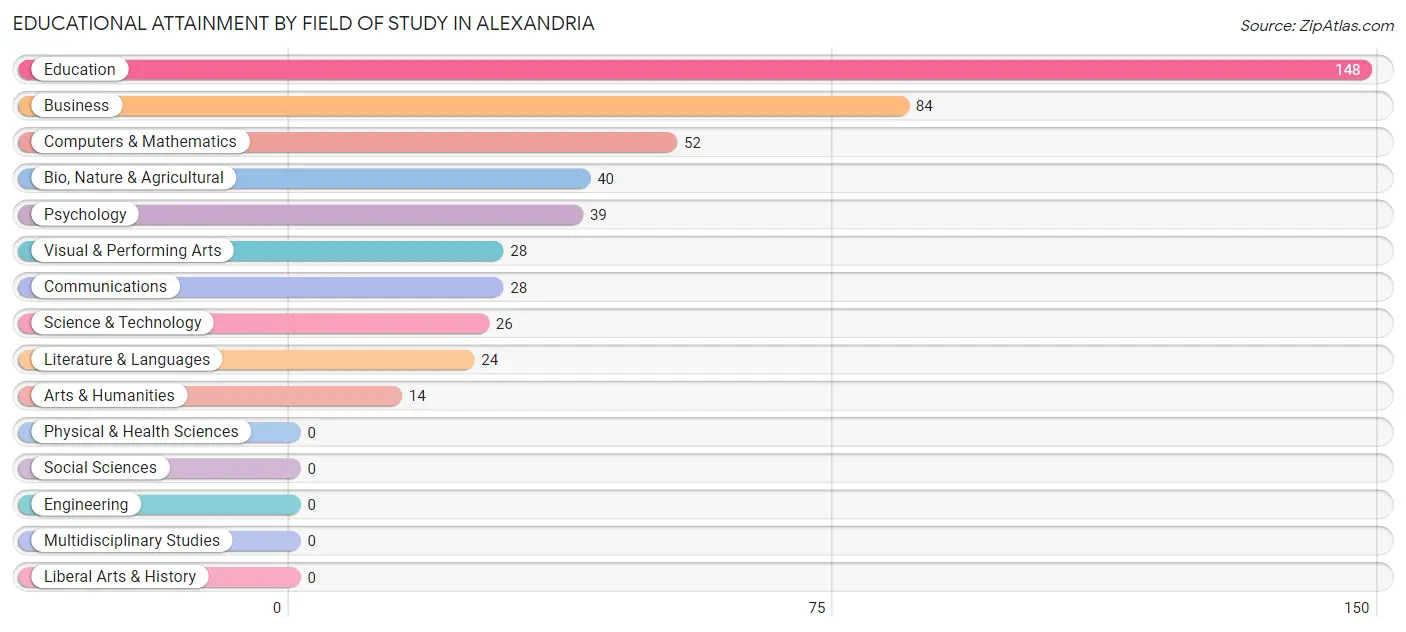
| Field of Study | # Graduates | % Graduates |
| Computers & Mathematics | 52 | 10.8% |
| Bio, Nature & Agricultural | 40 | 8.3% |
| Physical & Health Sciences | 0 | 0.0% |
| Psychology | 39 | 8.1% |
| Social Sciences | 0 | 0.0% |
| Engineering | 0 | 0.0% |
| Multidisciplinary Studies | 0 | 0.0% |
| Science & Technology | 26 | 5.4% |
| Business | 84 | 17.4% |
| Education | 148 | 30.6% |
| Literature & Languages | 24 | 5.0% |
| Liberal Arts & History | 0 | 0.0% |
| Visual & Performing Arts | 28 | 5.8% |
| Communications | 28 | 5.8% |
| Arts & Humanities | 14 | 2.9% |
| Total | 483 | 100.0% |
Transportation & Commute in Alexandria
Vehicle Availability by Sex in Alexandria
The most prevalent vehicle ownership categories in Alexandria are males with 2 vehicles (391, accounting for 35.7%) and females with 2 vehicles (299, making up 31.4%).
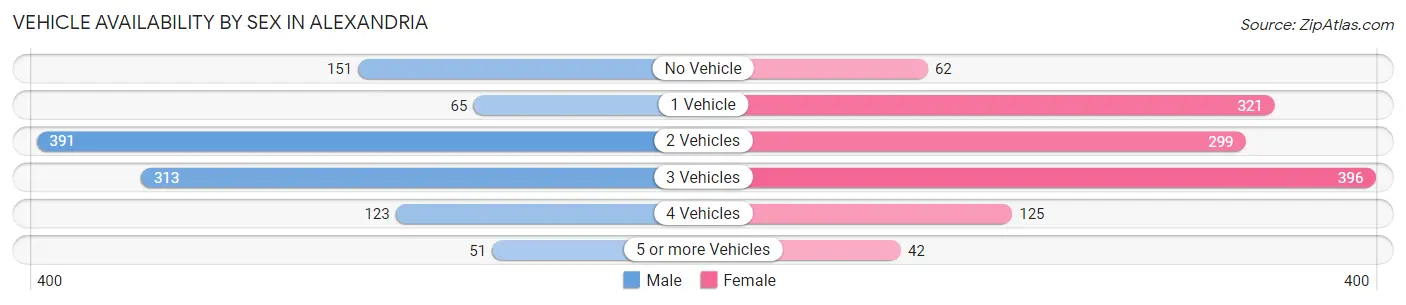
| Vehicles Available | Male | Female |
| No Vehicle | 151 (13.8%) | 62 (5.0%) |
| 1 Vehicle | 65 (5.9%) | 321 (25.8%) |
| 2 Vehicles | 391 (35.7%) | 299 (24.0%) |
| 3 Vehicles | 313 (28.6%) | 396 (31.8%) |
| 4 Vehicles | 123 (11.2%) | 125 (10.0%) |
| 5 or more Vehicles | 51 (4.7%) | 42 (3.4%) |
| Total | 1,094 (100.0%) | 1,245 (100.0%) |
Commute Time in Alexandria
The most frequently occuring commute durations in Alexandria are 30 to 34 minutes (422 commuters, 18.4%), 20 to 24 minutes (416 commuters, 18.1%), and 45 to 59 minutes (272 commuters, 11.8%).
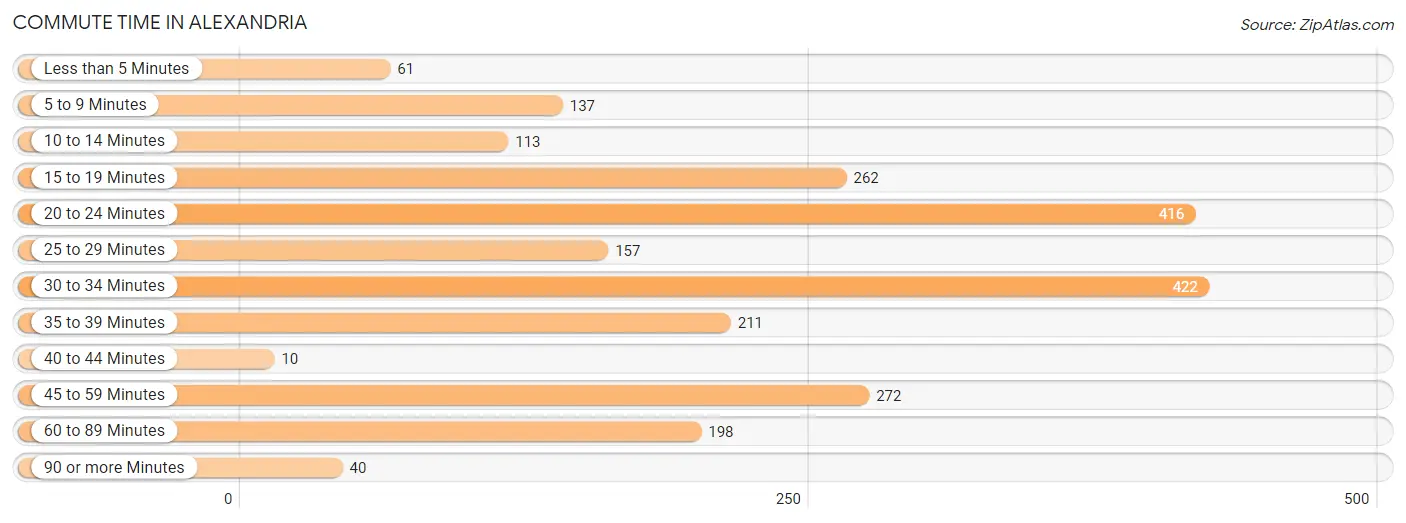
| Commute Time | # Commuters | % Commuters |
| Less than 5 Minutes | 61 | 2.6% |
| 5 to 9 Minutes | 137 | 6.0% |
| 10 to 14 Minutes | 113 | 4.9% |
| 15 to 19 Minutes | 262 | 11.4% |
| 20 to 24 Minutes | 416 | 18.1% |
| 25 to 29 Minutes | 157 | 6.8% |
| 30 to 34 Minutes | 422 | 18.4% |
| 35 to 39 Minutes | 211 | 9.2% |
| 40 to 44 Minutes | 10 | 0.4% |
| 45 to 59 Minutes | 272 | 11.8% |
| 60 to 89 Minutes | 198 | 8.6% |
| 90 or more Minutes | 40 | 1.7% |
Commute Time by Sex in Alexandria
The most common commute times in Alexandria are 30 to 34 minutes (208 commuters, 19.0%) for males and 20 to 24 minutes (218 commuters, 18.1%) for females.
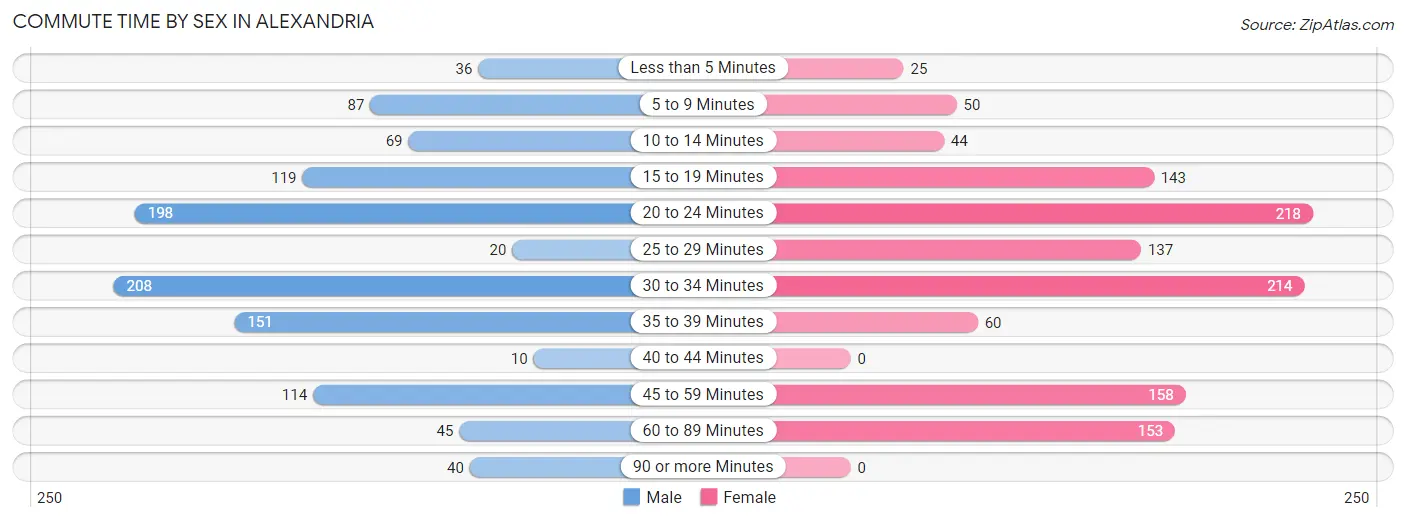
| Commute Time | Male | Female |
| Less than 5 Minutes | 36 (3.3%) | 25 (2.1%) |
| 5 to 9 Minutes | 87 (7.9%) | 50 (4.2%) |
| 10 to 14 Minutes | 69 (6.3%) | 44 (3.7%) |
| 15 to 19 Minutes | 119 (10.8%) | 143 (11.9%) |
| 20 to 24 Minutes | 198 (18.0%) | 218 (18.1%) |
| 25 to 29 Minutes | 20 (1.8%) | 137 (11.4%) |
| 30 to 34 Minutes | 208 (19.0%) | 214 (17.8%) |
| 35 to 39 Minutes | 151 (13.8%) | 60 (5.0%) |
| 40 to 44 Minutes | 10 (0.9%) | 0 (0.0%) |
| 45 to 59 Minutes | 114 (10.4%) | 158 (13.1%) |
| 60 to 89 Minutes | 45 (4.1%) | 153 (12.7%) |
| 90 or more Minutes | 40 (3.6%) | 0 (0.0%) |
Time of Departure to Work by Sex in Alexandria
The most frequent times of departure to work in Alexandria are 6:30 AM to 6:59 AM (180, 16.4%) for males and 6:30 AM to 6:59 AM (184, 15.3%) for females.
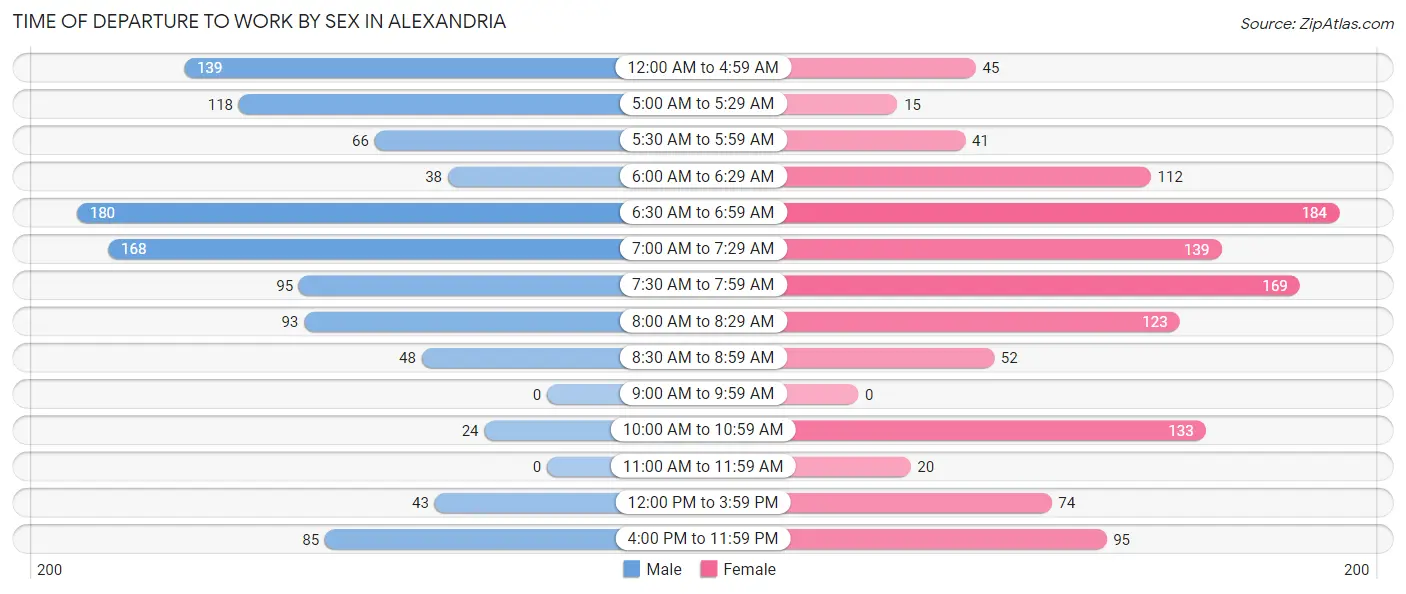
| Time of Departure | Male | Female |
| 12:00 AM to 4:59 AM | 139 (12.7%) | 45 (3.7%) |
| 5:00 AM to 5:29 AM | 118 (10.8%) | 15 (1.3%) |
| 5:30 AM to 5:59 AM | 66 (6.0%) | 41 (3.4%) |
| 6:00 AM to 6:29 AM | 38 (3.5%) | 112 (9.3%) |
| 6:30 AM to 6:59 AM | 180 (16.4%) | 184 (15.3%) |
| 7:00 AM to 7:29 AM | 168 (15.3%) | 139 (11.6%) |
| 7:30 AM to 7:59 AM | 95 (8.7%) | 169 (14.1%) |
| 8:00 AM to 8:29 AM | 93 (8.5%) | 123 (10.2%) |
| 8:30 AM to 8:59 AM | 48 (4.4%) | 52 (4.3%) |
| 9:00 AM to 9:59 AM | 0 (0.0%) | 0 (0.0%) |
| 10:00 AM to 10:59 AM | 24 (2.2%) | 133 (11.1%) |
| 11:00 AM to 11:59 AM | 0 (0.0%) | 20 (1.7%) |
| 12:00 PM to 3:59 PM | 43 (3.9%) | 74 (6.2%) |
| 4:00 PM to 11:59 PM | 85 (7.7%) | 95 (7.9%) |
| Total | 1,097 (100.0%) | 1,202 (100.0%) |
Housing Occupancy in Alexandria
Occupancy by Ownership in Alexandria
Of the total 2,034 dwellings in Alexandria, owner-occupied units account for 1,392 (68.4%), while renter-occupied units make up 642 (31.6%).
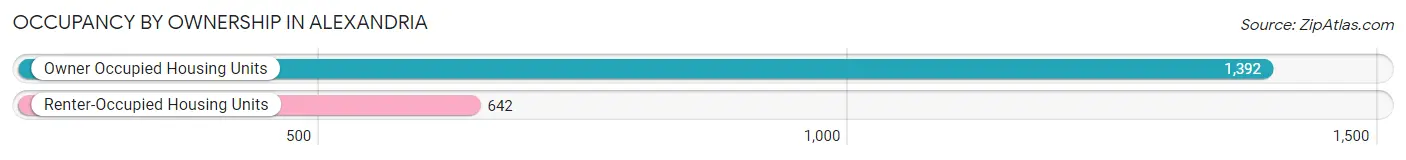
| Occupancy | # Housing Units | % Housing Units |
| Owner Occupied Housing Units | 1,392 | 68.4% |
| Renter-Occupied Housing Units | 642 | 31.6% |
| Total Occupied Housing Units | 2,034 | 100.0% |
Occupancy by Household Size in Alexandria
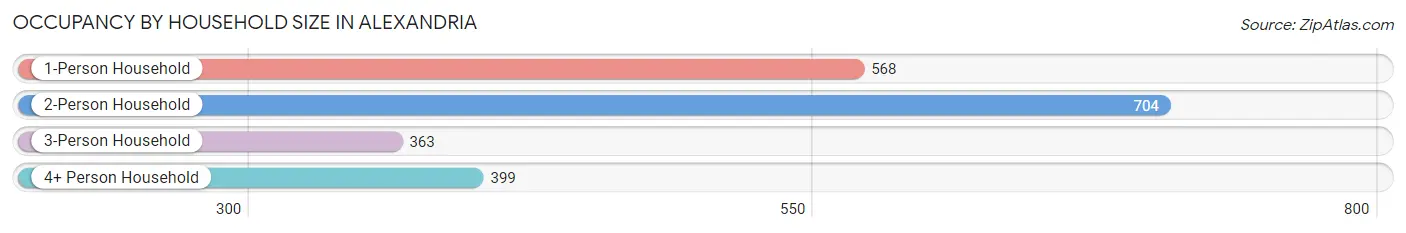
| Household Size | # Housing Units | % Housing Units |
| 1-Person Household | 568 | 27.9% |
| 2-Person Household | 704 | 34.6% |
| 3-Person Household | 363 | 17.8% |
| 4+ Person Household | 399 | 19.6% |
| Total Housing Units | 2,034 | 100.0% |
Occupancy by Ownership by Household Size in Alexandria
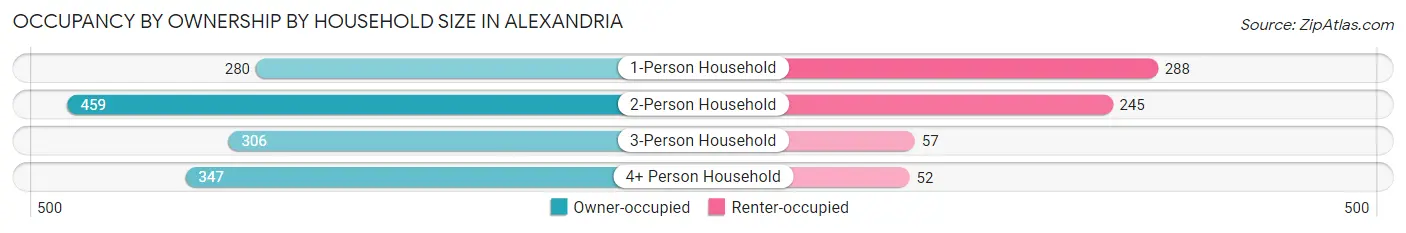
| Household Size | Owner-occupied | Renter-occupied |
| 1-Person Household | 280 (49.3%) | 288 (50.7%) |
| 2-Person Household | 459 (65.2%) | 245 (34.8%) |
| 3-Person Household | 306 (84.3%) | 57 (15.7%) |
| 4+ Person Household | 347 (87.0%) | 52 (13.0%) |
| Total Housing Units | 1,392 (68.4%) | 642 (31.6%) |
Occupancy by Educational Attainment in Alexandria
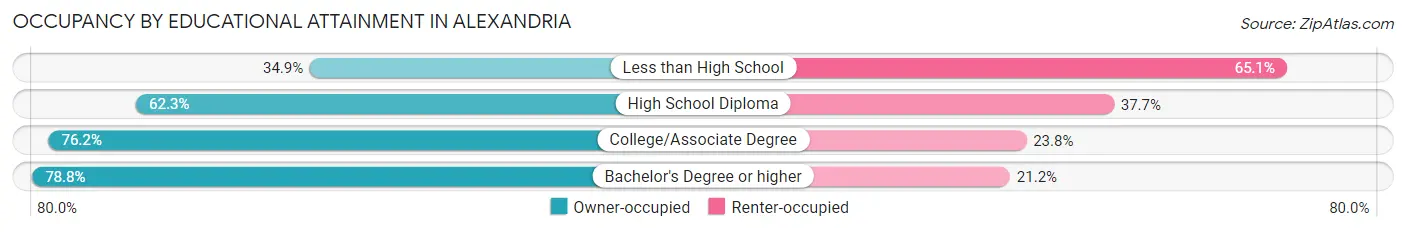
| Household Size | Owner-occupied | Renter-occupied |
| Less than High School | 45 (34.9%) | 84 (65.1%) |
| High School Diploma | 496 (62.3%) | 300 (37.7%) |
| College/Associate Degree | 669 (76.2%) | 209 (23.8%) |
| Bachelor's Degree or higher | 182 (78.8%) | 49 (21.2%) |
Occupancy by Age of Householder in Alexandria
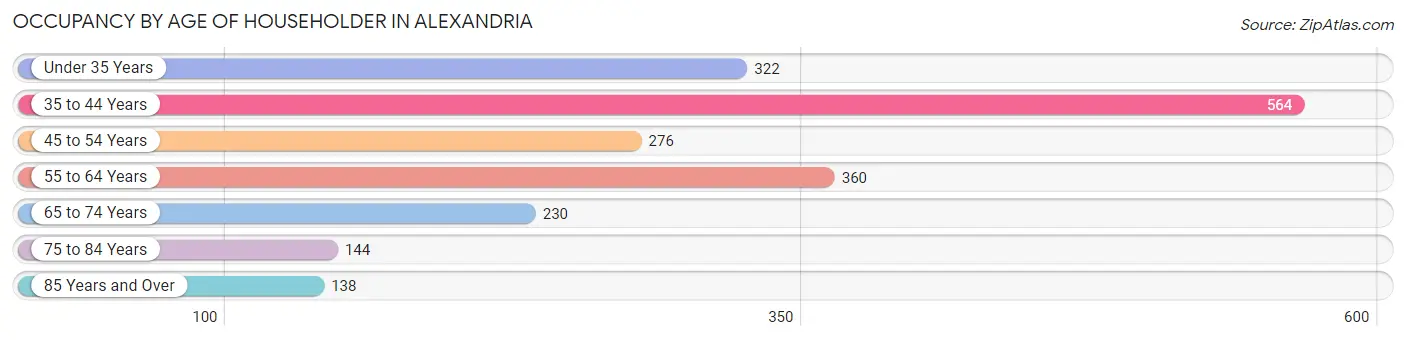
| Age Bracket | # Households | % Households |
| Under 35 Years | 322 | 15.8% |
| 35 to 44 Years | 564 | 27.7% |
| 45 to 54 Years | 276 | 13.6% |
| 55 to 64 Years | 360 | 17.7% |
| 65 to 74 Years | 230 | 11.3% |
| 75 to 84 Years | 144 | 7.1% |
| 85 Years and Over | 138 | 6.8% |
| Total | 2,034 | 100.0% |
Housing Finances in Alexandria
Median Income by Occupancy in Alexandria
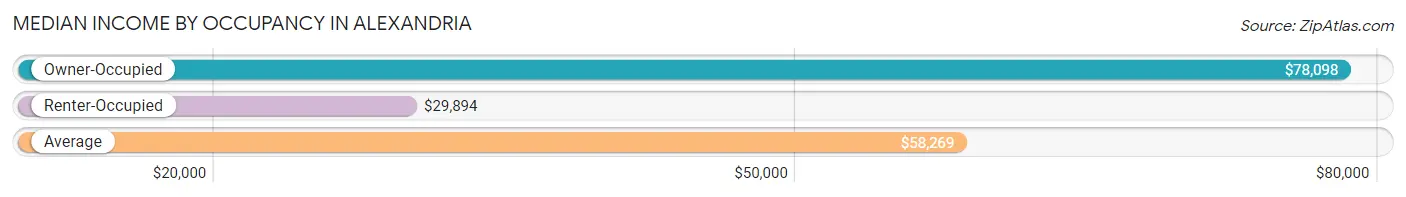
| Occupancy Type | # Households | Median Income |
| Owner-Occupied | 1,392 (68.4%) | $78,098 |
| Renter-Occupied | 642 (31.6%) | $29,894 |
| Average | 2,034 (100.0%) | $58,269 |
Occupancy by Householder Income Bracket in Alexandria
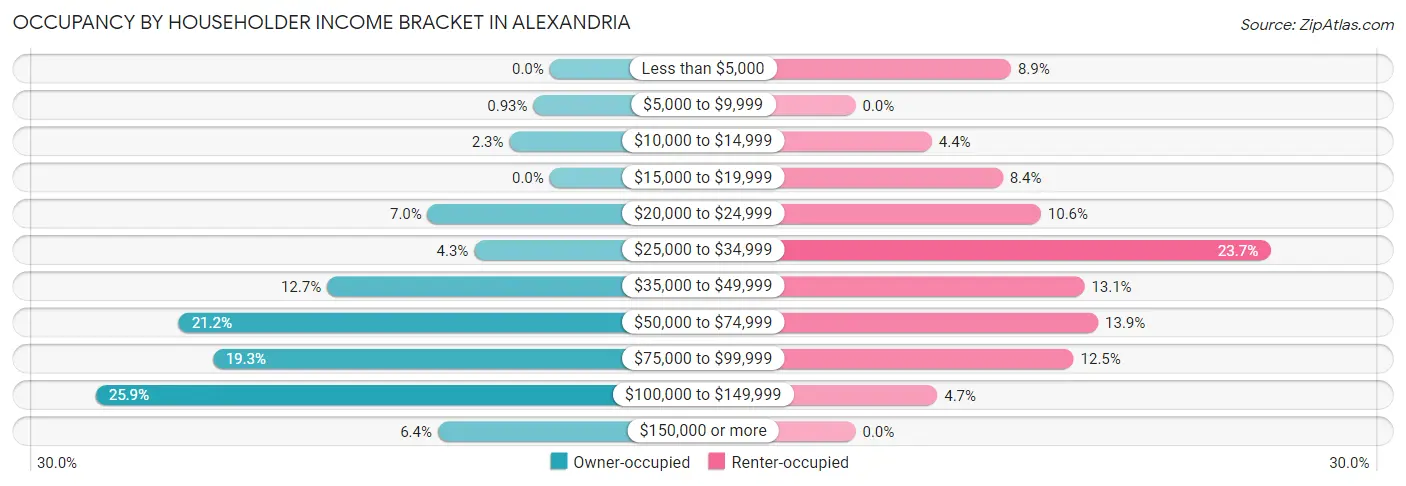
| Income Bracket | Owner-occupied | Renter-occupied |
| Less than $5,000 | 0 (0.0%) | 57 (8.9%) |
| $5,000 to $9,999 | 13 (0.9%) | 0 (0.0%) |
| $10,000 to $14,999 | 32 (2.3%) | 28 (4.4%) |
| $15,000 to $19,999 | 0 (0.0%) | 54 (8.4%) |
| $20,000 to $24,999 | 97 (7.0%) | 68 (10.6%) |
| $25,000 to $34,999 | 60 (4.3%) | 152 (23.7%) |
| $35,000 to $49,999 | 177 (12.7%) | 84 (13.1%) |
| $50,000 to $74,999 | 295 (21.2%) | 89 (13.9%) |
| $75,000 to $99,999 | 268 (19.3%) | 80 (12.5%) |
| $100,000 to $149,999 | 361 (25.9%) | 30 (4.7%) |
| $150,000 or more | 89 (6.4%) | 0 (0.0%) |
| Total | 1,392 (100.0%) | 642 (100.0%) |
Monthly Housing Cost Tiers in Alexandria
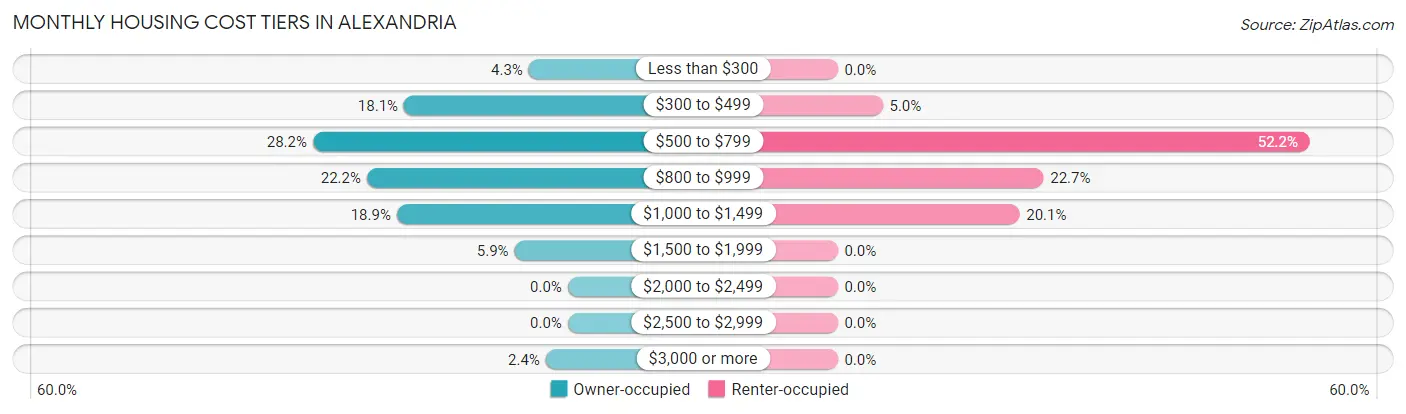
| Monthly Cost | Owner-occupied | Renter-occupied |
| Less than $300 | 60 (4.3%) | 0 (0.0%) |
| $300 to $499 | 252 (18.1%) | 32 (5.0%) |
| $500 to $799 | 392 (28.2%) | 335 (52.2%) |
| $800 to $999 | 309 (22.2%) | 146 (22.7%) |
| $1,000 to $1,499 | 263 (18.9%) | 129 (20.1%) |
| $1,500 to $1,999 | 82 (5.9%) | 0 (0.0%) |
| $2,000 to $2,499 | 0 (0.0%) | 0 (0.0%) |
| $2,500 to $2,999 | 0 (0.0%) | 0 (0.0%) |
| $3,000 or more | 34 (2.4%) | 0 (0.0%) |
| Total | 1,392 (100.0%) | 642 (100.0%) |
Physical Housing Characteristics in Alexandria
Housing Structures in Alexandria
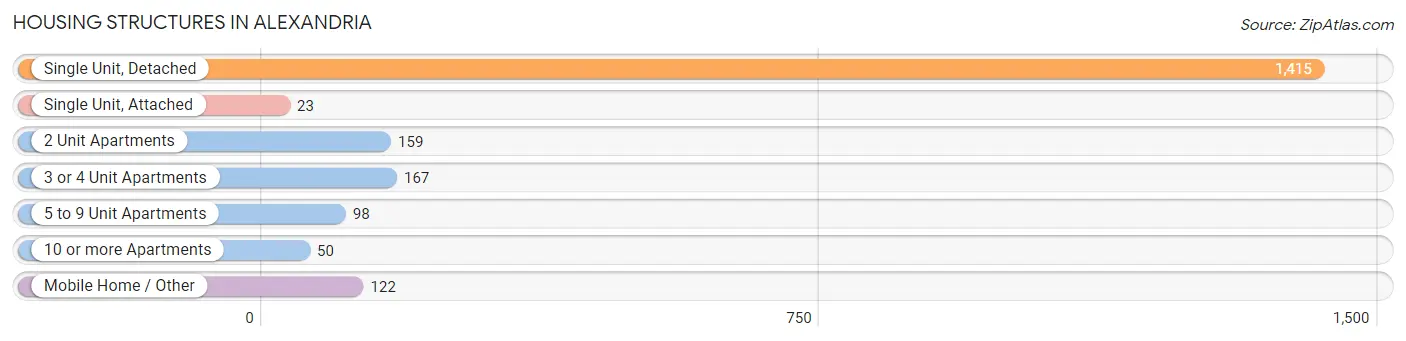
| Structure Type | # Housing Units | % Housing Units |
| Single Unit, Detached | 1,415 | 69.6% |
| Single Unit, Attached | 23 | 1.1% |
| 2 Unit Apartments | 159 | 7.8% |
| 3 or 4 Unit Apartments | 167 | 8.2% |
| 5 to 9 Unit Apartments | 98 | 4.8% |
| 10 or more Apartments | 50 | 2.5% |
| Mobile Home / Other | 122 | 6.0% |
| Total | 2,034 | 100.0% |
Housing Structures by Occupancy in Alexandria
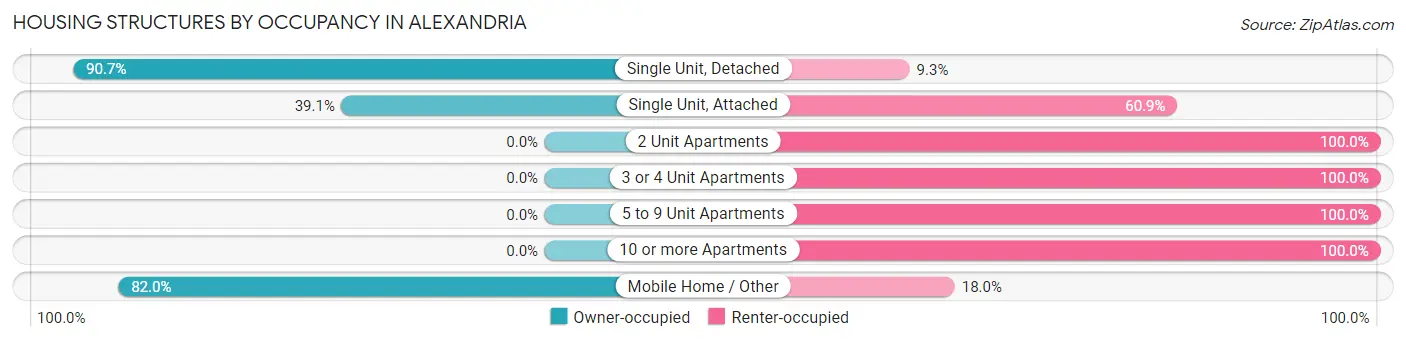
| Structure Type | Owner-occupied | Renter-occupied |
| Single Unit, Detached | 1,283 (90.7%) | 132 (9.3%) |
| Single Unit, Attached | 9 (39.1%) | 14 (60.9%) |
| 2 Unit Apartments | 0 (0.0%) | 159 (100.0%) |
| 3 or 4 Unit Apartments | 0 (0.0%) | 167 (100.0%) |
| 5 to 9 Unit Apartments | 0 (0.0%) | 98 (100.0%) |
| 10 or more Apartments | 0 (0.0%) | 50 (100.0%) |
| Mobile Home / Other | 100 (82.0%) | 22 (18.0%) |
| Total | 1,392 (68.4%) | 642 (31.6%) |
Housing Structures by Number of Rooms in Alexandria
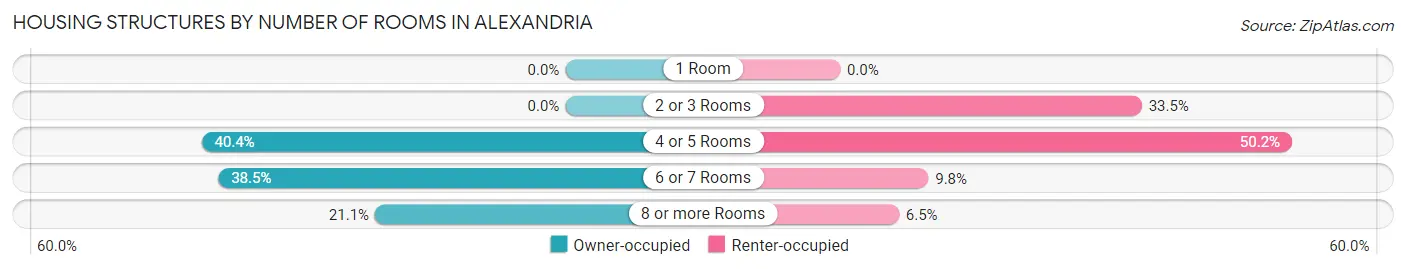
| Number of Rooms | Owner-occupied | Renter-occupied |
| 1 Room | 0 (0.0%) | 0 (0.0%) |
| 2 or 3 Rooms | 0 (0.0%) | 215 (33.5%) |
| 4 or 5 Rooms | 562 (40.4%) | 322 (50.2%) |
| 6 or 7 Rooms | 536 (38.5%) | 63 (9.8%) |
| 8 or more Rooms | 294 (21.1%) | 42 (6.5%) |
| Total | 1,392 (100.0%) | 642 (100.0%) |
Housing Structure by Heating Type in Alexandria
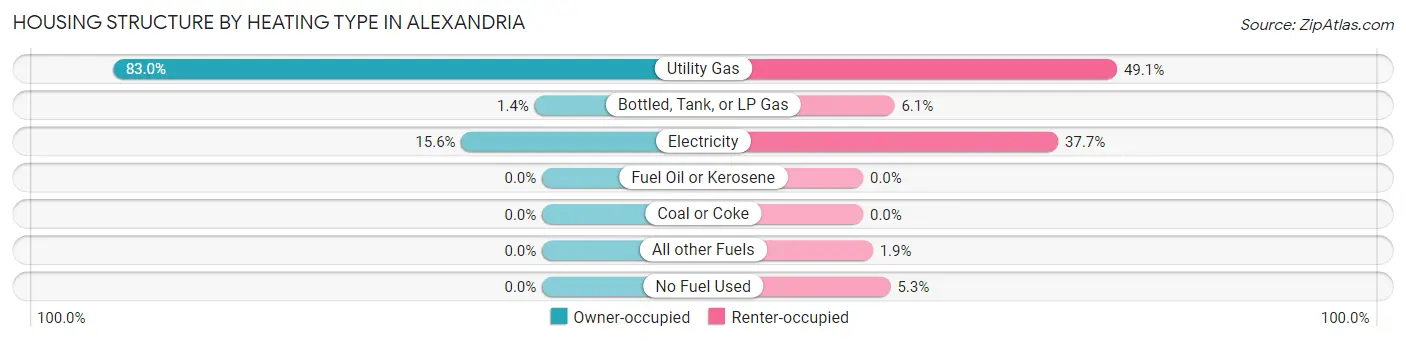
| Heating Type | Owner-occupied | Renter-occupied |
| Utility Gas | 1,155 (83.0%) | 315 (49.1%) |
| Bottled, Tank, or LP Gas | 20 (1.4%) | 39 (6.1%) |
| Electricity | 217 (15.6%) | 242 (37.7%) |
| Fuel Oil or Kerosene | 0 (0.0%) | 0 (0.0%) |
| Coal or Coke | 0 (0.0%) | 0 (0.0%) |
| All other Fuels | 0 (0.0%) | 12 (1.9%) |
| No Fuel Used | 0 (0.0%) | 34 (5.3%) |
| Total | 1,392 (100.0%) | 642 (100.0%) |
Household Vehicle Usage in Alexandria
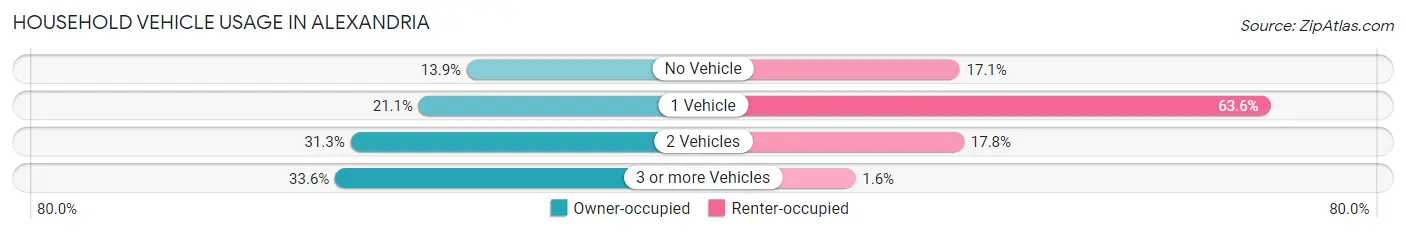
| Vehicles per Household | Owner-occupied | Renter-occupied |
| No Vehicle | 194 (13.9%) | 110 (17.1%) |
| 1 Vehicle | 294 (21.1%) | 408 (63.5%) |
| 2 Vehicles | 436 (31.3%) | 114 (17.8%) |
| 3 or more Vehicles | 468 (33.6%) | 10 (1.6%) |
| Total | 1,392 (100.0%) | 642 (100.0%) |
Real Estate & Mortgages in Alexandria
Real Estate and Mortgage Overview in Alexandria
| Characteristic | Without Mortgage | With Mortgage |
| Housing Units | 466 | 926 |
| Median Property Value | $90,800 | $85,700 |
| Median Household Income | $77,853 | $69 |
| Monthly Housing Costs | $441 | $34 |
| Real Estate Taxes | $1,171 | $74 |
Property Value by Mortgage Status in Alexandria
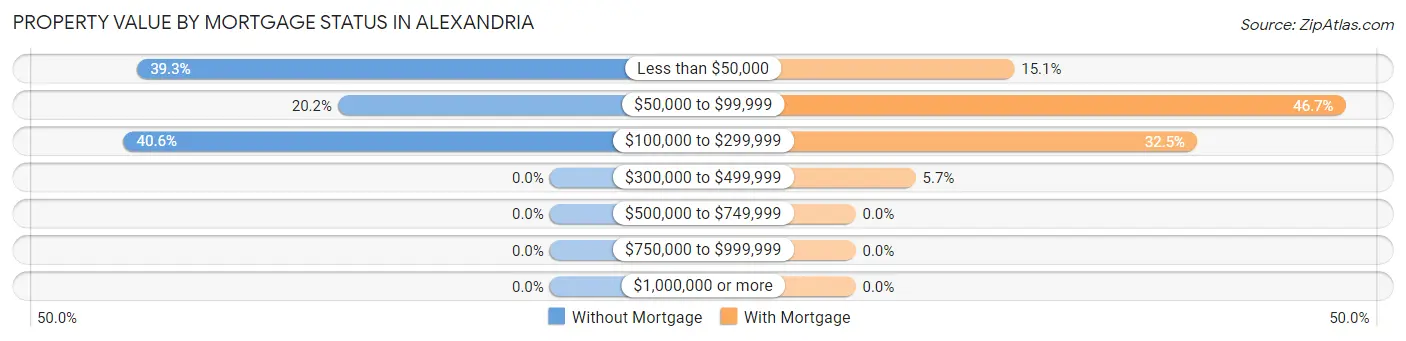
| Property Value | Without Mortgage | With Mortgage |
| Less than $50,000 | 183 (39.3%) | 140 (15.1%) |
| $50,000 to $99,999 | 94 (20.2%) | 432 (46.7%) |
| $100,000 to $299,999 | 189 (40.6%) | 301 (32.5%) |
| $300,000 to $499,999 | 0 (0.0%) | 53 (5.7%) |
| $500,000 to $749,999 | 0 (0.0%) | 0 (0.0%) |
| $750,000 to $999,999 | 0 (0.0%) | 0 (0.0%) |
| $1,000,000 or more | 0 (0.0%) | 0 (0.0%) |
| Total | 466 (100.0%) | 926 (100.0%) |
Household Income by Mortgage Status in Alexandria
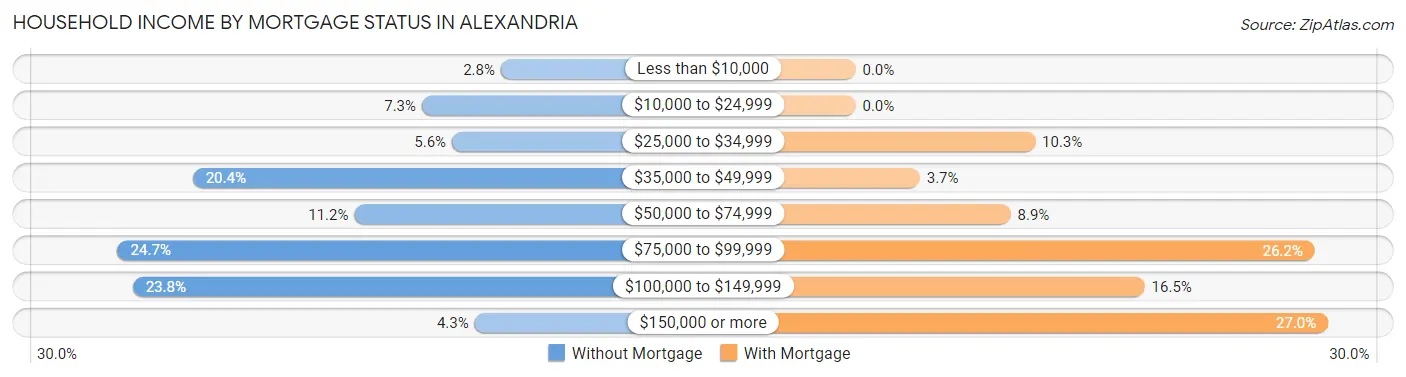
| Household Income | Without Mortgage | With Mortgage |
| Less than $10,000 | 13 (2.8%) | 0 (0.0%) |
| $10,000 to $24,999 | 34 (7.3%) | 0 (0.0%) |
| $25,000 to $34,999 | 26 (5.6%) | 95 (10.3%) |
| $35,000 to $49,999 | 95 (20.4%) | 34 (3.7%) |
| $50,000 to $74,999 | 52 (11.2%) | 82 (8.9%) |
| $75,000 to $99,999 | 115 (24.7%) | 243 (26.2%) |
| $100,000 to $149,999 | 111 (23.8%) | 153 (16.5%) |
| $150,000 or more | 20 (4.3%) | 250 (27.0%) |
| Total | 466 (100.0%) | 926 (100.0%) |
Property Value to Household Income Ratio in Alexandria
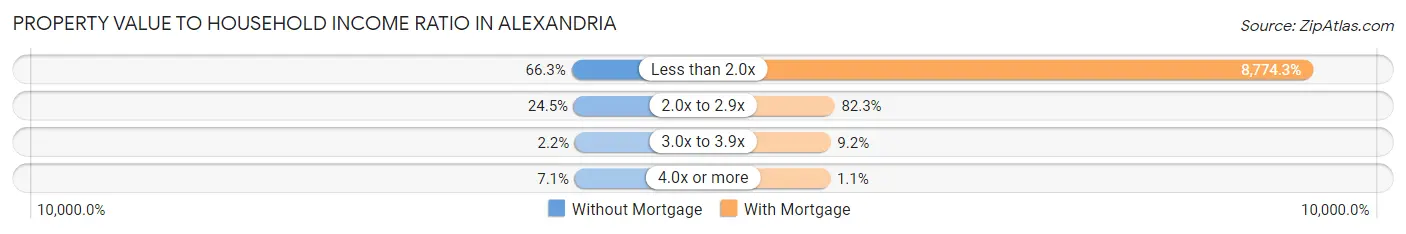
| Value-to-Income Ratio | Without Mortgage | With Mortgage |
| Less than 2.0x | 309 (66.3%) | 81,250 (8,774.3%) |
| 2.0x to 2.9x | 114 (24.5%) | 762 (82.3%) |
| 3.0x to 3.9x | 10 (2.1%) | 85 (9.2%) |
| 4.0x or more | 33 (7.1%) | 10 (1.1%) |
| Total | 466 (100.0%) | 926 (100.0%) |
Real Estate Taxes by Mortgage Status in Alexandria
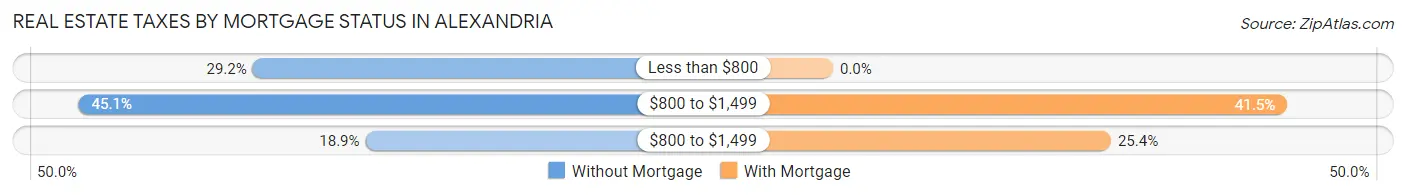
| Property Taxes | Without Mortgage | With Mortgage |
| Less than $800 | 136 (29.2%) | 0 (0.0%) |
| $800 to $1,499 | 210 (45.1%) | 384 (41.5%) |
| $800 to $1,499 | 88 (18.9%) | 235 (25.4%) |
| Total | 466 (100.0%) | 926 (100.0%) |
Health & Disability in Alexandria
Health Insurance Coverage by Age in Alexandria
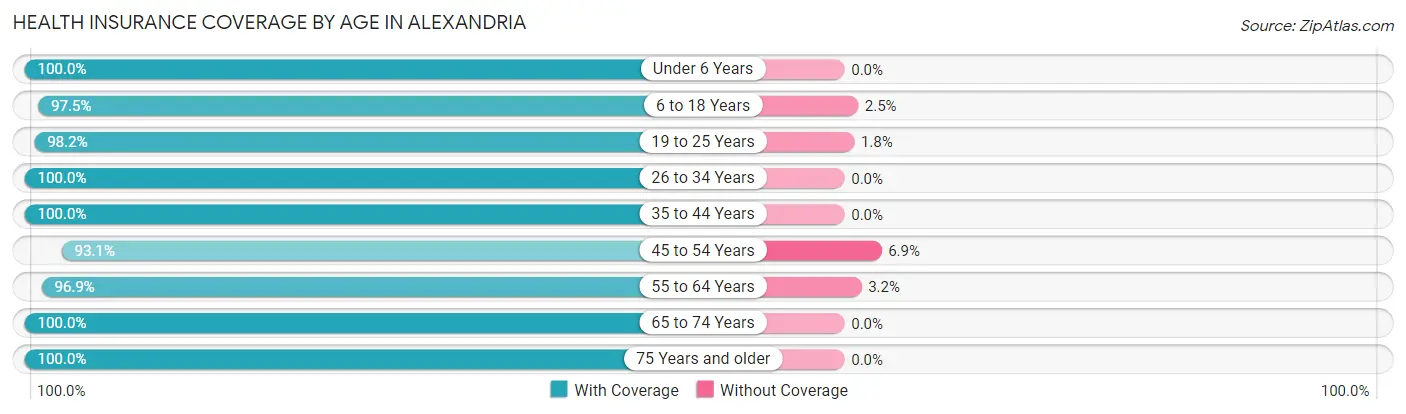
| Age Bracket | With Coverage | Without Coverage |
| Under 6 Years | 319 (100.0%) | 0 (0.0%) |
| 6 to 18 Years | 1,002 (97.5%) | 26 (2.5%) |
| 19 to 25 Years | 218 (98.2%) | 4 (1.8%) |
| 26 to 34 Years | 546 (100.0%) | 0 (0.0%) |
| 35 to 44 Years | 937 (100.0%) | 0 (0.0%) |
| 45 to 54 Years | 608 (93.1%) | 45 (6.9%) |
| 55 to 64 Years | 554 (96.9%) | 18 (3.2%) |
| 65 to 74 Years | 410 (100.0%) | 0 (0.0%) |
| 75 Years and older | 392 (100.0%) | 0 (0.0%) |
| Total | 4,986 (98.2%) | 93 (1.8%) |
Health Insurance Coverage by Citizenship Status in Alexandria
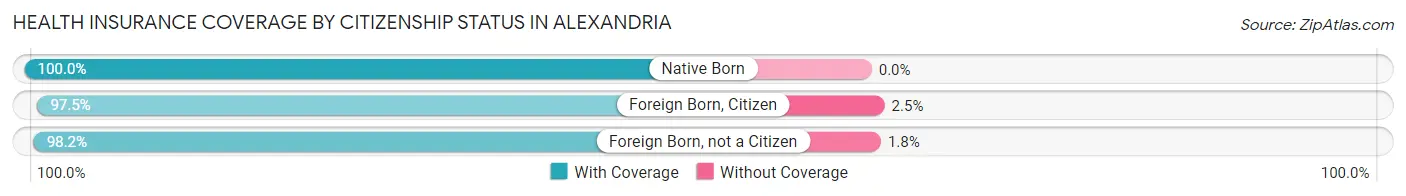
| Citizenship Status | With Coverage | Without Coverage |
| Native Born | 319 (100.0%) | 0 (0.0%) |
| Foreign Born, Citizen | 1,002 (97.5%) | 26 (2.5%) |
| Foreign Born, not a Citizen | 218 (98.2%) | 4 (1.8%) |
Health Insurance Coverage by Household Income in Alexandria
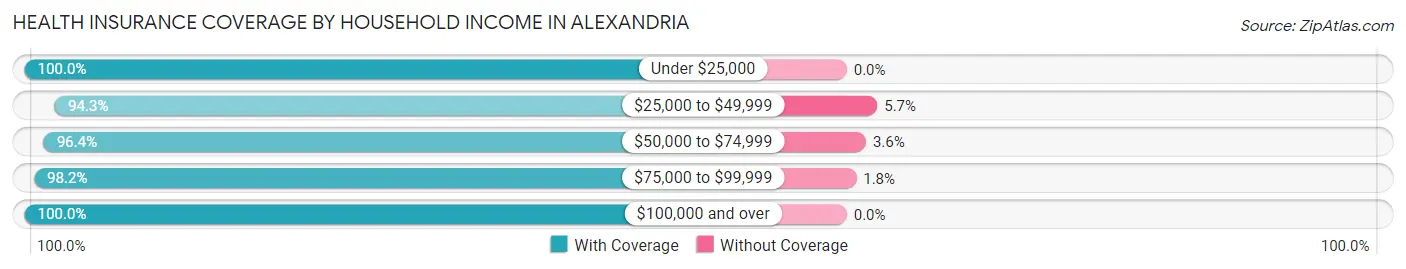
| Household Income | With Coverage | Without Coverage |
| Under $25,000 | 705 (100.0%) | 0 (0.0%) |
| $25,000 to $49,999 | 809 (94.3%) | 49 (5.7%) |
| $50,000 to $74,999 | 698 (96.4%) | 26 (3.6%) |
| $75,000 to $99,999 | 996 (98.2%) | 18 (1.8%) |
| $100,000 and over | 1,765 (100.0%) | 0 (0.0%) |
Public vs Private Health Insurance Coverage by Age in Alexandria
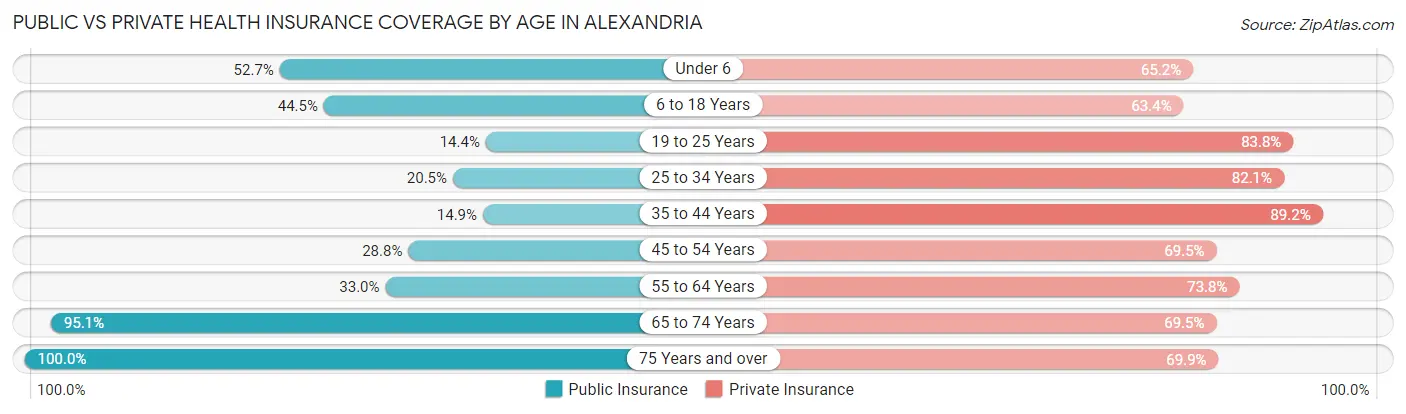
| Age Bracket | Public Insurance | Private Insurance |
| Under 6 | 168 (52.7%) | 208 (65.2%) |
| 6 to 18 Years | 457 (44.5%) | 652 (63.4%) |
| 19 to 25 Years | 32 (14.4%) | 186 (83.8%) |
| 25 to 34 Years | 112 (20.5%) | 448 (82.1%) |
| 35 to 44 Years | 140 (14.9%) | 836 (89.2%) |
| 45 to 54 Years | 188 (28.8%) | 454 (69.5%) |
| 55 to 64 Years | 189 (33.0%) | 422 (73.8%) |
| 65 to 74 Years | 390 (95.1%) | 285 (69.5%) |
| 75 Years and over | 392 (100.0%) | 274 (69.9%) |
| Total | 2,068 (40.7%) | 3,765 (74.1%) |
Disability Status by Sex by Age in Alexandria
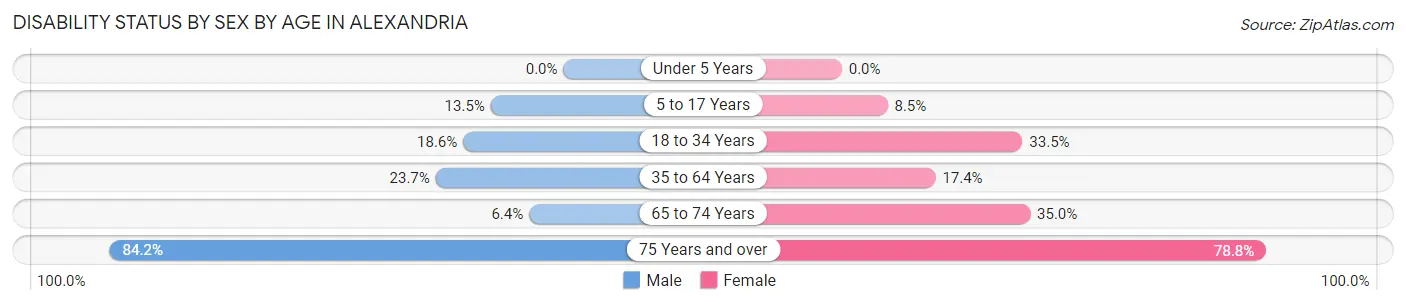
| Age Bracket | Male | Female |
| Under 5 Years | 0 (0.0%) | 0 (0.0%) |
| 5 to 17 Years | 80 (13.5%) | 40 (8.5%) |
| 18 to 34 Years | 86 (18.6%) | 122 (33.5%) |
| 35 to 64 Years | 248 (23.7%) | 194 (17.4%) |
| 65 to 74 Years | 13 (6.4%) | 72 (34.9%) |
| 75 Years and over | 128 (84.2%) | 189 (78.7%) |
Disability Class by Sex by Age in Alexandria
Disability Class: Hearing Difficulty
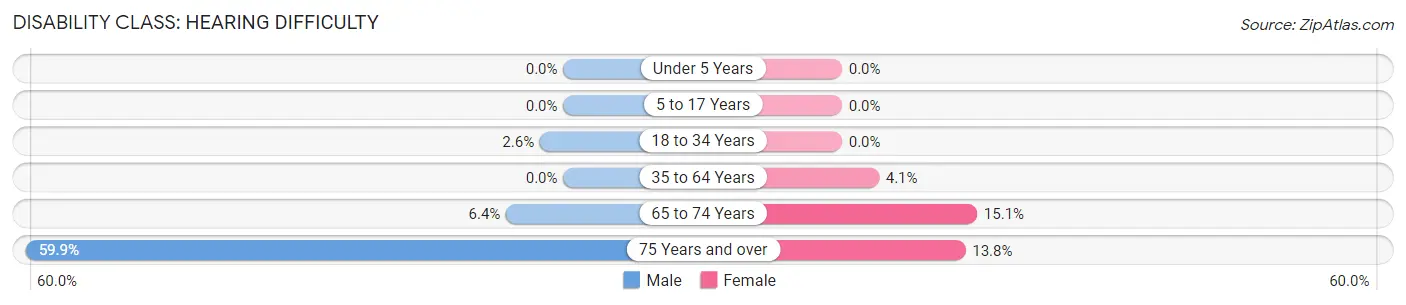
| Age Bracket | Male | Female |
| Under 5 Years | 0 (0.0%) | 0 (0.0%) |
| 5 to 17 Years | 0 (0.0%) | 0 (0.0%) |
| 18 to 34 Years | 12 (2.6%) | 0 (0.0%) |
| 35 to 64 Years | 0 (0.0%) | 46 (4.1%) |
| 65 to 74 Years | 13 (6.4%) | 31 (15.0%) |
| 75 Years and over | 91 (59.9%) | 33 (13.8%) |
Disability Class: Vision Difficulty
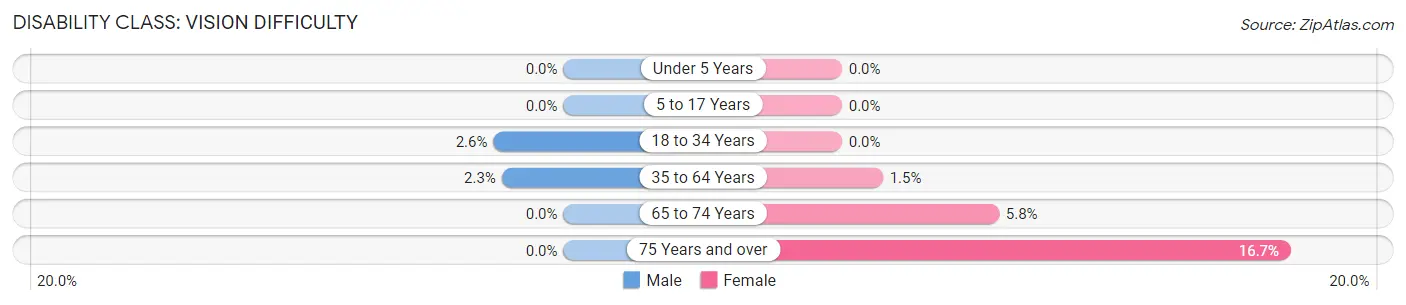
| Age Bracket | Male | Female |
| Under 5 Years | 0 (0.0%) | 0 (0.0%) |
| 5 to 17 Years | 0 (0.0%) | 0 (0.0%) |
| 18 to 34 Years | 12 (2.6%) | 0 (0.0%) |
| 35 to 64 Years | 24 (2.3%) | 17 (1.5%) |
| 65 to 74 Years | 0 (0.0%) | 12 (5.8%) |
| 75 Years and over | 0 (0.0%) | 40 (16.7%) |
Disability Class: Cognitive Difficulty
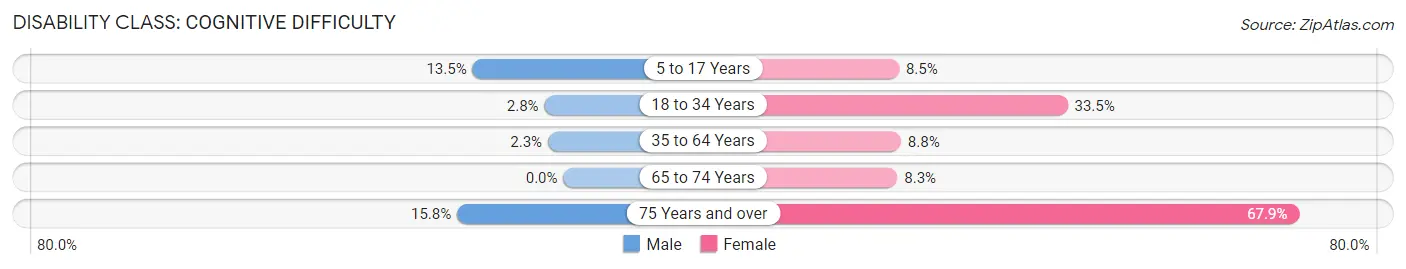
| Age Bracket | Male | Female |
| 5 to 17 Years | 80 (13.5%) | 40 (8.5%) |
| 18 to 34 Years | 13 (2.8%) | 122 (33.5%) |
| 35 to 64 Years | 24 (2.3%) | 98 (8.8%) |
| 65 to 74 Years | 0 (0.0%) | 17 (8.3%) |
| 75 Years and over | 24 (15.8%) | 163 (67.9%) |
Disability Class: Ambulatory Difficulty
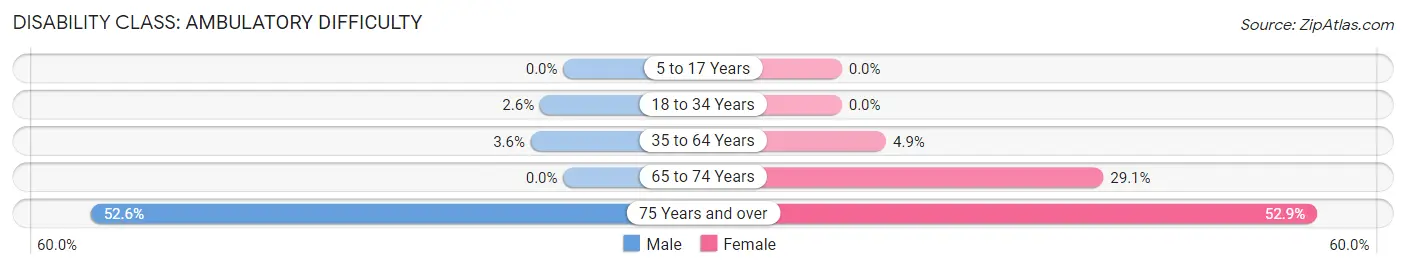
| Age Bracket | Male | Female |
| 5 to 17 Years | 0 (0.0%) | 0 (0.0%) |
| 18 to 34 Years | 12 (2.6%) | 0 (0.0%) |
| 35 to 64 Years | 38 (3.6%) | 55 (4.9%) |
| 65 to 74 Years | 0 (0.0%) | 60 (29.1%) |
| 75 Years and over | 80 (52.6%) | 127 (52.9%) |
Disability Class: Self-Care Difficulty
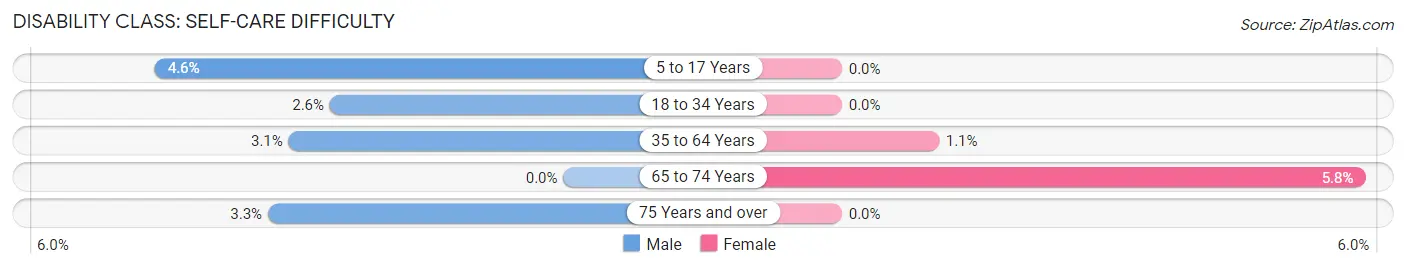
| Age Bracket | Male | Female |
| 5 to 17 Years | 27 (4.5%) | 0 (0.0%) |
| 18 to 34 Years | 12 (2.6%) | 0 (0.0%) |
| 35 to 64 Years | 32 (3.1%) | 12 (1.1%) |
| 65 to 74 Years | 0 (0.0%) | 12 (5.8%) |
| 75 Years and over | 5 (3.3%) | 0 (0.0%) |
Technology Access in Alexandria
Computing Device Access in Alexandria
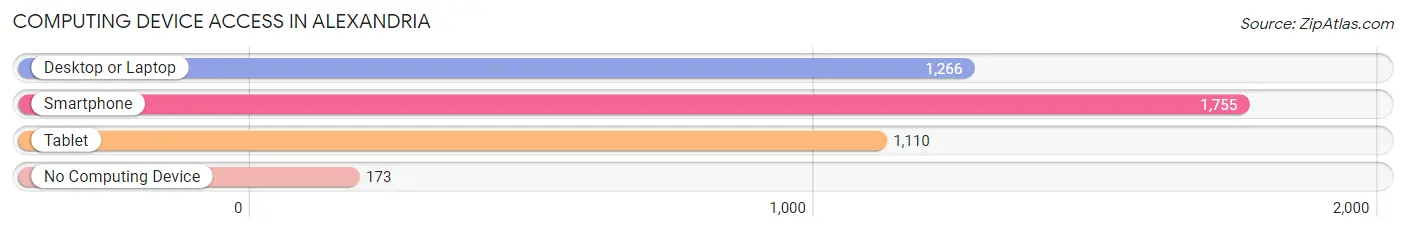
| Device Type | # Households | % Households |
| Desktop or Laptop | 1,266 | 62.2% |
| Smartphone | 1,755 | 86.3% |
| Tablet | 1,110 | 54.6% |
| No Computing Device | 173 | 8.5% |
| Total | 2,034 | 100.0% |
Internet Access in Alexandria
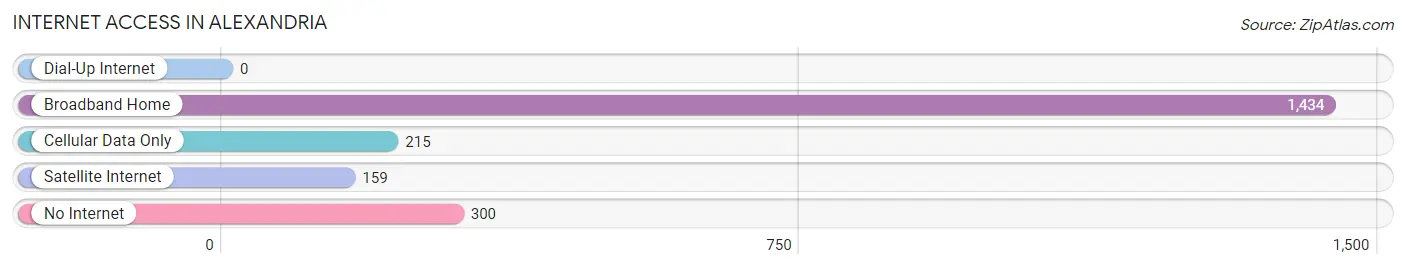
| Internet Type | # Households | % Households |
| Dial-Up Internet | 0 | 0.0% |
| Broadband Home | 1,434 | 70.5% |
| Cellular Data Only | 215 | 10.6% |
| Satellite Internet | 159 | 7.8% |
| No Internet | 300 | 14.7% |
| Total | 2,034 | 100.0% |
Alexandria Summary
Alexandria is a small town located in Madison County, Indiana, United States. It is situated along the White River, approximately 20 miles northeast of Indianapolis. The town was founded in 1819 and has a population of approximately 5,000 people.
History
Alexandria was founded in 1819 by a group of settlers from North Carolina. The town was named after Alexander Hamilton, the first Secretary of the Treasury. The town was originally a farming community, but it soon developed into a manufacturing center. The first industry in Alexandria was a sawmill, which was built in 1820. The town also had a gristmill, a tannery, and a woolen mill.
In 1832, the first railroad line was built in Alexandria, connecting the town to Indianapolis. This allowed the town to become a major shipping center for the surrounding area. The railroad also allowed the town to become a major hub for the production of agricultural products.
In the late 19th century, Alexandria became a major center for the production of furniture. The town was home to several furniture factories, including the Alexandria Furniture Company, which was founded in 1887. The company was one of the largest furniture manufacturers in the state.
Geography
Alexandria is located in Madison County, Indiana, approximately 20 miles northeast of Indianapolis. The town is situated along the White River, which flows through the town. The town is surrounded by rolling hills and farmland. The climate in Alexandria is humid continental, with hot summers and cold winters.
Economy
The economy of Alexandria is largely based on manufacturing and agriculture. The town is home to several furniture factories, as well as a number of agricultural businesses. The town is also home to several small businesses, including restaurants, retail stores, and service providers.
Demographics
As of the 2010 census, the population of Alexandria was 5,000. The racial makeup of the town was 95.2% White, 1.2% African American, 0.4% Native American, 0.6% Asian, 0.1% Pacific Islander, and 2.5% from other races. The median household income in Alexandria was $41,000, and the median family income was $50,000.
Conclusion
Alexandria is a small town located in Madison County, Indiana, United States. It was founded in 1819 and has a population of approximately 5,000 people. The town is situated along the White River and is surrounded by rolling hills and farmland. The economy of Alexandria is largely based on manufacturing and agriculture, and the town is home to several furniture factories and agricultural businesses. The racial makeup of the town is 95.2% White, 1.2% African American, 0.4% Native American, 0.6% Asian, 0.1% Pacific Islander, and 2.5% from other races. The median household income in Alexandria was $41,000, and the median family income was $50,000.
Common Questions
What is Per Capita Income in Alexandria?
Per Capita income in Alexandria is $28,610.
What is the Median Family Income in Alexandria?
Median Family Income in Alexandria is $79,130.
What is the Median Household income in Alexandria?
Median Household Income in Alexandria is $58,269.
What is Income or Wage Gap in Alexandria?
Income or Wage Gap in Alexandria is 37.6%.
Women in Alexandria earn 62.4 cents for every dollar earned by a man.
What is Inequality or Gini Index in Alexandria?
Inequality or Gini Index in Alexandria is 0.36.
What is the Total Population of Alexandria?
Total Population of Alexandria is 5,144.
What is the Total Male Population of Alexandria?
Total Male Population of Alexandria is 2,605.
What is the Total Female Population of Alexandria?
Total Female Population of Alexandria is 2,539.
What is the Ratio of Males per 100 Females in Alexandria?
There are 102.60 Males per 100 Females in Alexandria.
What is the Ratio of Females per 100 Males in Alexandria?
There are 97.47 Females per 100 Males in Alexandria.
What is the Median Population Age in Alexandria?
Median Population Age in Alexandria is 39.1 Years.
What is the Average Family Size in Alexandria
Average Family Size in Alexandria is 3.0 People.
What is the Average Household Size in Alexandria
Average Household Size in Alexandria is 2.5 People.
How Large is the Labor Force in Alexandria?
There are 2,587 People in the Labor Forcein in Alexandria.
What is the Percentage of People in the Labor Force in Alexandria?
63.6% of People are in the Labor Force in Alexandria.
What is the Unemployment Rate in Alexandria?
Unemployment Rate in Alexandria is 8.0%.