Albion, IN Map & Demographics
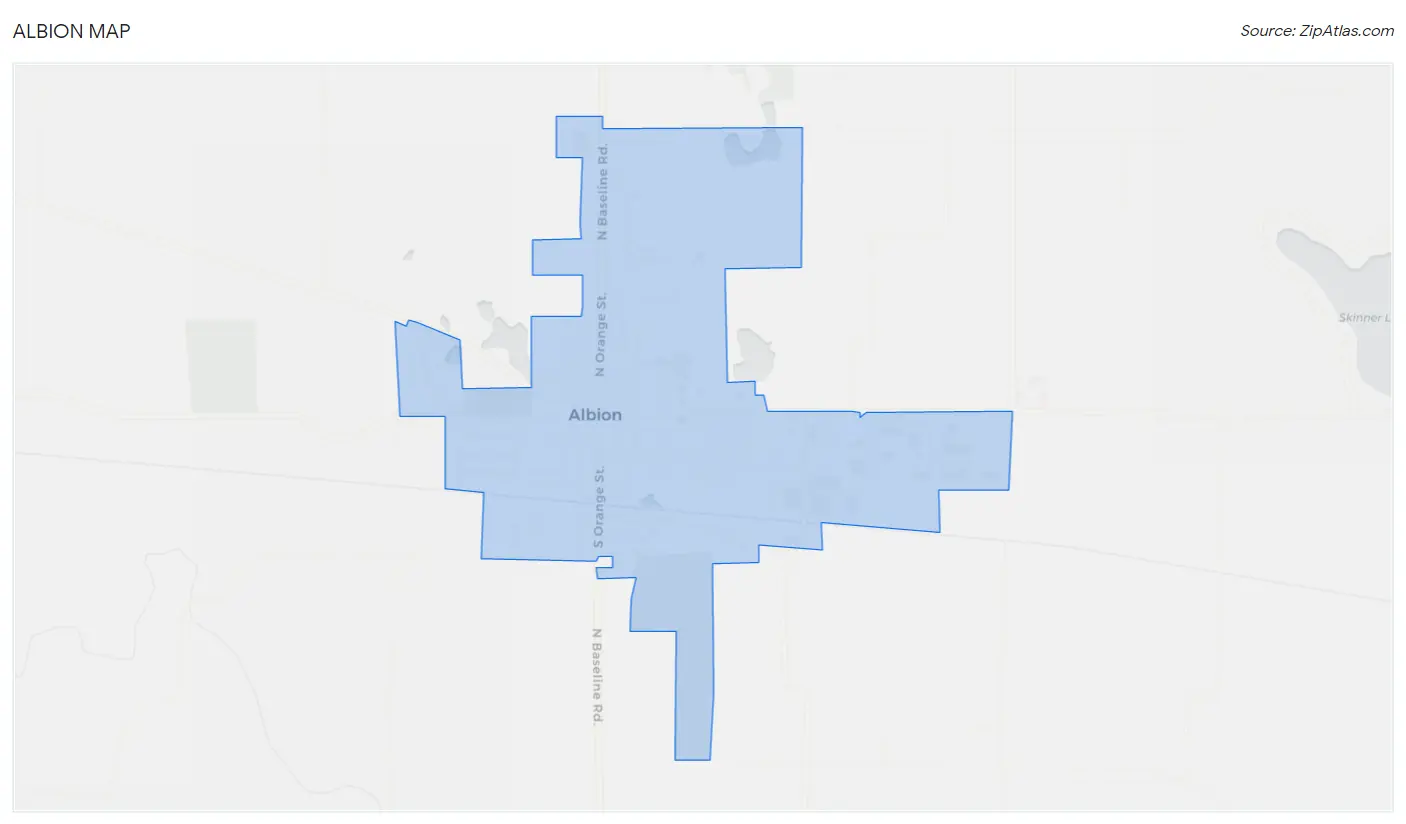
Albion Map
Albion Overview
$23,512
PER CAPITA INCOME
$77,554
AVG FAMILY INCOME
$62,813
AVG HOUSEHOLD INCOME
10.0%
WAGE / INCOME GAP [ % ]
90.0¢/ $1
WAGE / INCOME GAP [ $ ]
$11,016
FAMILY INCOME DEFICIT
0.34
INEQUALITY / GINI INDEX
2,835
TOTAL POPULATION
1,432
MALE POPULATION
1,403
FEMALE POPULATION
102.07
MALES / 100 FEMALES
97.97
FEMALES / 100 MALES
29.5
MEDIAN AGE
3.6
AVG FAMILY SIZE
3.0
AVG HOUSEHOLD SIZE
1,300
LABOR FORCE [ PEOPLE ]
66.1%
PERCENT IN LABOR FORCE
1.2%
UNEMPLOYMENT RATE
Albion Zip Codes
Albion Area Codes
Income in Albion
Income Overview in Albion
Per Capita Income in Albion is $23,512, while median incomes of families and households are $77,554 and $62,813 respectively.
| Characteristic | Number | Measure |
| Per Capita Income | 2,835 | $23,512 |
| Median Family Income | 577 | $77,554 |
| Mean Family Income | 577 | $80,386 |
| Median Household Income | 865 | $62,813 |
| Mean Household Income | 865 | $73,559 |
| Income Deficit | 577 | $11,016 |
| Wage / Income Gap (%) | 2,835 | 10.03% |
| Wage / Income Gap ($) | 2,835 | 89.97¢ per $1 |
| Gini / Inequality Index | 2,835 | 0.34 |
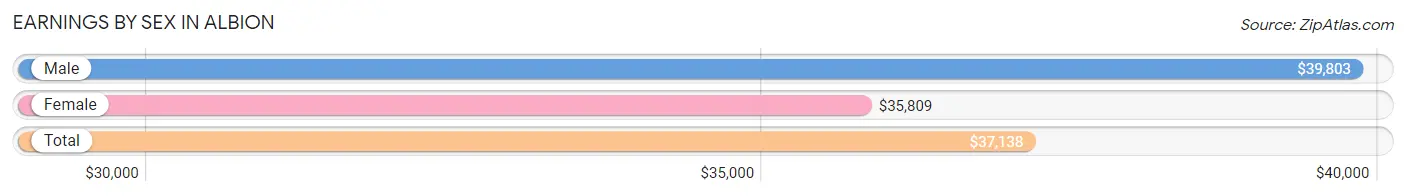
Earnings by Sex in Albion
Average Earnings in Albion are $37,138, $39,803 for men and $35,809 for women, a difference of 10.0%.
| Sex | Number | Average Earnings |
| Male | 761 (55.1%) | $39,803 |
| Female | 620 (44.9%) | $35,809 |
| Total | 1,381 (100.0%) | $37,138 |
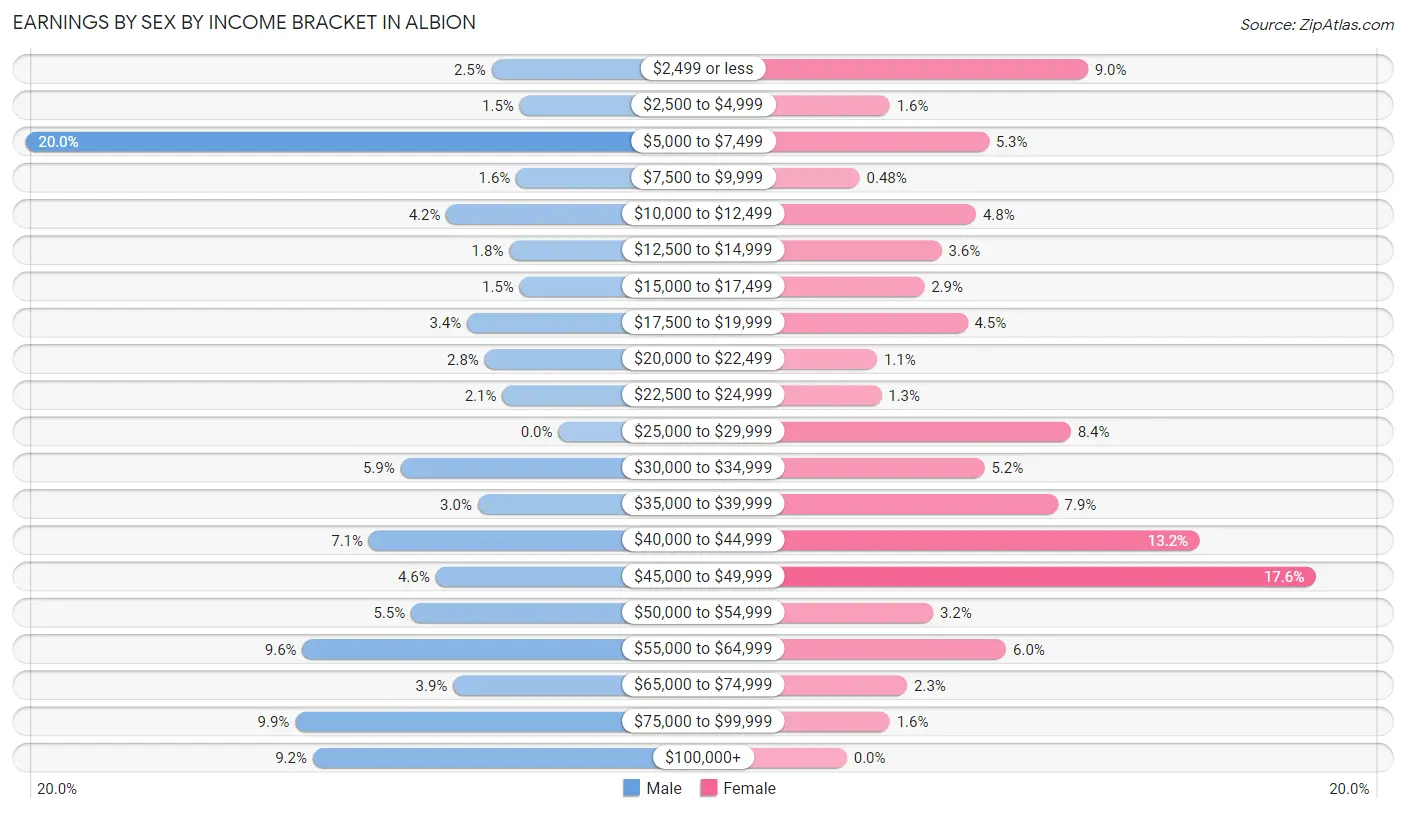
Earnings by Sex by Income Bracket in Albion
The most common earnings brackets in Albion are $5,000 to $7,499 for men (152 | 20.0%) and $45,000 to $49,999 for women (109 | 17.6%).
| Income | Male | Female |
| $2,499 or less | 19 (2.5%) | 56 (9.0%) |
| $2,500 to $4,999 | 11 (1.5%) | 10 (1.6%) |
| $5,000 to $7,499 | 152 (20.0%) | 33 (5.3%) |
| $7,500 to $9,999 | 12 (1.6%) | 3 (0.5%) |
| $10,000 to $12,499 | 32 (4.2%) | 30 (4.8%) |
| $12,500 to $14,999 | 14 (1.8%) | 22 (3.5%) |
| $15,000 to $17,499 | 11 (1.5%) | 18 (2.9%) |
| $17,500 to $19,999 | 26 (3.4%) | 28 (4.5%) |
| $20,000 to $22,499 | 21 (2.8%) | 7 (1.1%) |
| $22,500 to $24,999 | 16 (2.1%) | 8 (1.3%) |
| $25,000 to $29,999 | 0 (0.0%) | 52 (8.4%) |
| $30,000 to $34,999 | 45 (5.9%) | 32 (5.2%) |
| $35,000 to $39,999 | 23 (3.0%) | 49 (7.9%) |
| $40,000 to $44,999 | 54 (7.1%) | 82 (13.2%) |
| $45,000 to $49,999 | 35 (4.6%) | 109 (17.6%) |
| $50,000 to $54,999 | 42 (5.5%) | 20 (3.2%) |
| $55,000 to $64,999 | 73 (9.6%) | 37 (6.0%) |
| $65,000 to $74,999 | 30 (3.9%) | 14 (2.3%) |
| $75,000 to $99,999 | 75 (9.9%) | 10 (1.6%) |
| $100,000+ | 70 (9.2%) | 0 (0.0%) |
| Total | 761 (100.0%) | 620 (100.0%) |
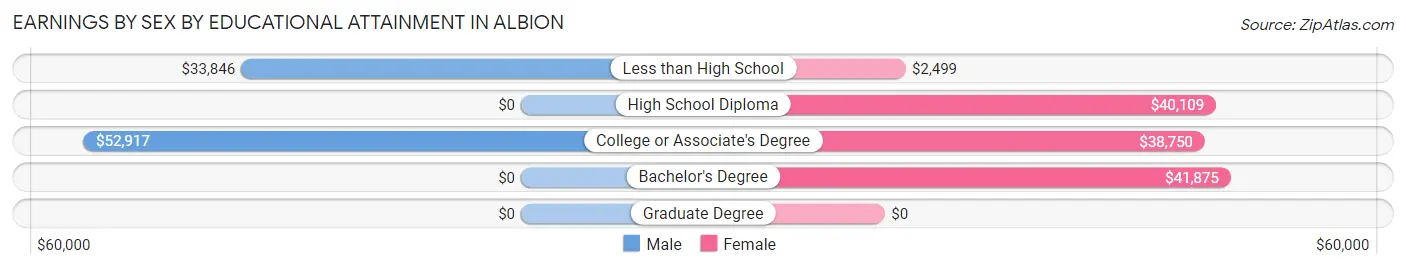
Earnings by Sex by Educational Attainment in Albion
Average earnings in Albion are $41,875 for men and $38,833 for women, a difference of 7.3%. Men with an educational attainment of college or associate's degree enjoy the highest average annual earnings of $52,917, while those with less than high school education earn the least with $33,846. Women with an educational attainment of bachelor's degree earn the most with the average annual earnings of $41,875, while those with less than high school education have the smallest earnings of $2,499.
| Educational Attainment | Male Income | Female Income |
| Less than High School | $33,846 | $2,499 |
| High School Diploma | - | - |
| College or Associate's Degree | $52,917 | $38,750 |
| Bachelor's Degree | - | - |
| Graduate Degree | - | - |
| Total | $41,875 | $38,833 |
Family Income in Albion
Family Income Brackets in Albion
According to the Albion family income data, there are 152 families falling into the $100,000 to $149,999 income range, which is the most common income bracket and makes up 26.3% of all families. Conversely, the $10,000 to $14,999 income bracket is the least frequent group with only 12 families (2.1%) belonging to this category.
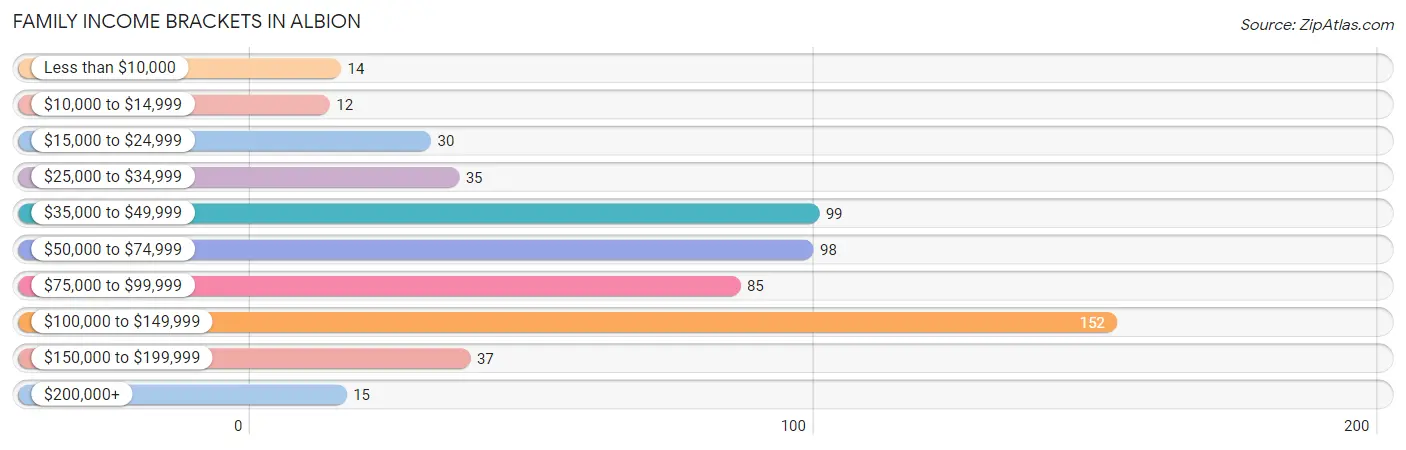
| Income Bracket | # Families | % Families |
| Less than $10,000 | 14 | 2.4% |
| $10,000 to $14,999 | 12 | 2.1% |
| $15,000 to $24,999 | 30 | 5.2% |
| $25,000 to $34,999 | 35 | 6.1% |
| $35,000 to $49,999 | 99 | 17.2% |
| $50,000 to $74,999 | 98 | 17.0% |
| $75,000 to $99,999 | 85 | 14.7% |
| $100,000 to $149,999 | 152 | 26.3% |
| $150,000 to $199,999 | 37 | 6.4% |
| $200,000+ | 15 | 2.6% |
Family Income by Famaliy Size in Albion
5-person families (42 | 7.3%) account for the highest median family income in Albion with $117,059 per family, while 2-person families (236 | 40.9%) have the highest median income of $33,125 per family member.
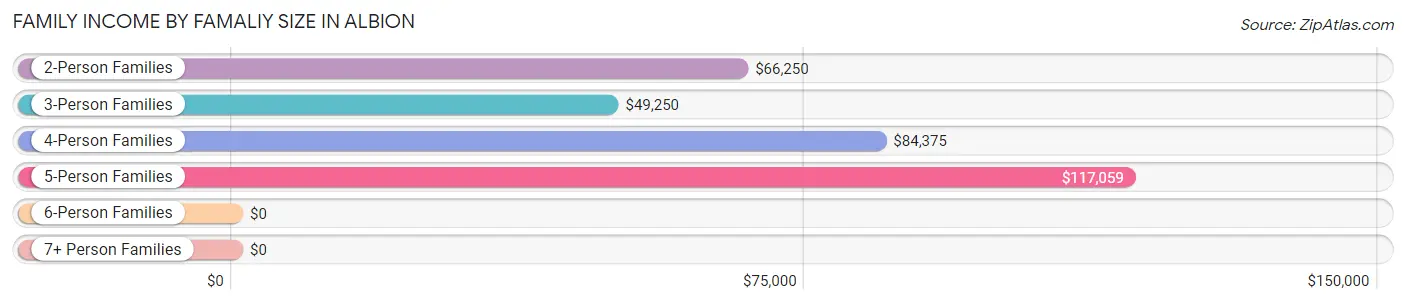
| Income Bracket | # Families | Median Income |
| 2-Person Families | 236 (40.9%) | $66,250 |
| 3-Person Families | 103 (17.8%) | $49,250 |
| 4-Person Families | 126 (21.8%) | $84,375 |
| 5-Person Families | 42 (7.3%) | $117,059 |
| 6-Person Families | 22 (3.8%) | $0 |
| 7+ Person Families | 48 (8.3%) | $0 |
| Total | 577 (100.0%) | $77,554 |
Family Income by Number of Earners in Albion
The median family income in Albion is $77,554, with families comprising 3+ earners (86) having the highest median family income of $111,611, while families with no earners (40) have the lowest median family income of $33,500, accounting for 14.9% and 6.9% of families, respectively.
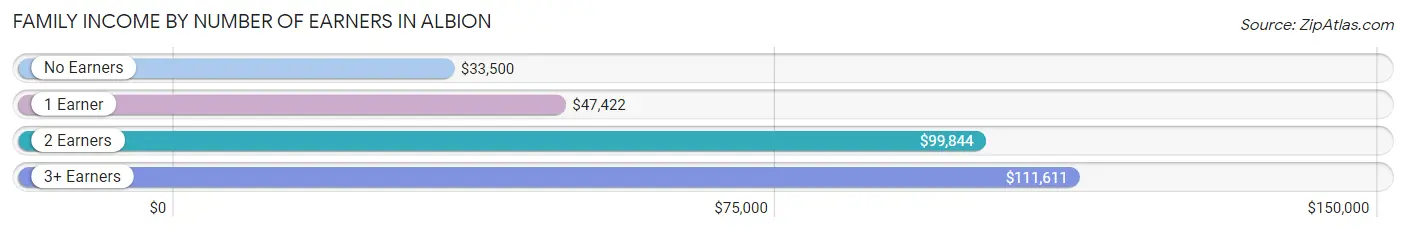
| Number of Earners | # Families | Median Income |
| No Earners | 40 (6.9%) | $33,500 |
| 1 Earner | 231 (40.0%) | $47,422 |
| 2 Earners | 220 (38.1%) | $99,844 |
| 3+ Earners | 86 (14.9%) | $111,611 |
| Total | 577 (100.0%) | $77,554 |
Household Income in Albion
Household Income Brackets in Albion
With 202 households falling in the category, the $50,000 to $74,999 income range is the most frequent in Albion, accounting for 23.4% of all households. In contrast, only 15 households (1.7%) fall into the $200,000+ income bracket, making it the least populous group.
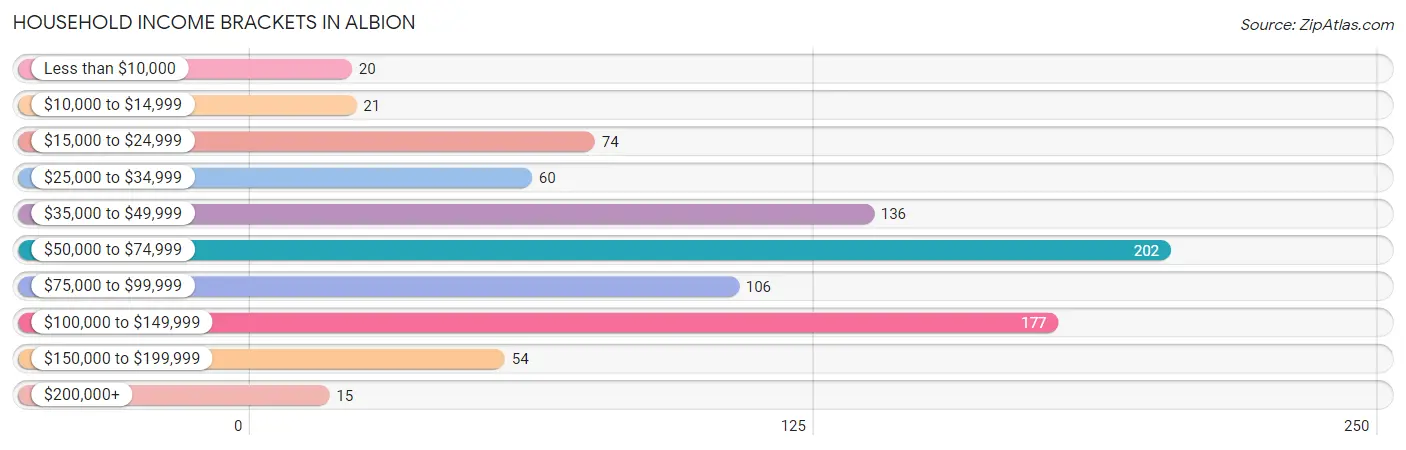
| Income Bracket | # Households | % Households |
| Less than $10,000 | 20 | 2.3% |
| $10,000 to $14,999 | 21 | 2.4% |
| $15,000 to $24,999 | 74 | 8.6% |
| $25,000 to $34,999 | 60 | 6.9% |
| $35,000 to $49,999 | 136 | 15.7% |
| $50,000 to $74,999 | 202 | 23.4% |
| $75,000 to $99,999 | 106 | 12.3% |
| $100,000 to $149,999 | 177 | 20.5% |
| $150,000 to $199,999 | 54 | 6.2% |
| $200,000+ | 15 | 1.7% |
Household Income by Householder Age in Albion
The median household income in Albion is $62,813, with the highest median household income of $77,639 found in the 45 to 64 years age bracket for the primary householder. A total of 257 households (29.7%) fall into this category. Meanwhile, the 65+ years age bracket for the primary householder has the lowest median household income of $50,250, with 170 households (19.7%) in this group.
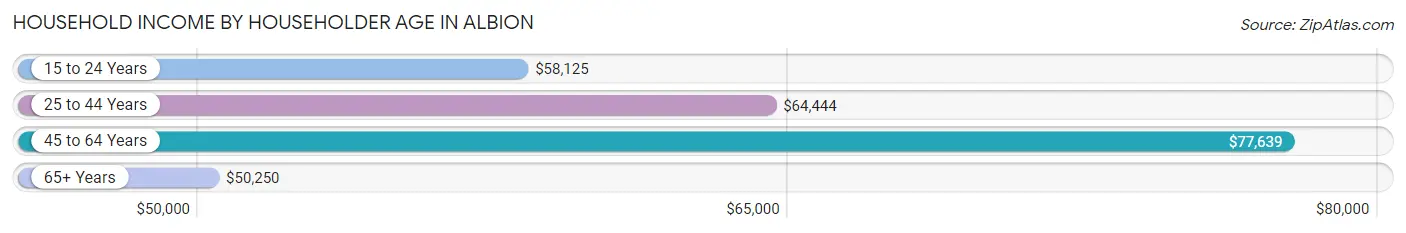
| Income Bracket | # Households | Median Income |
| 15 to 24 Years | 48 (5.6%) | $58,125 |
| 25 to 44 Years | 390 (45.1%) | $64,444 |
| 45 to 64 Years | 257 (29.7%) | $77,639 |
| 65+ Years | 170 (19.7%) | $50,250 |
| Total | 865 (100.0%) | $62,813 |
Poverty in Albion
Income Below Poverty by Sex and Age in Albion
With 9.5% poverty level for males and 12.9% for females among the residents of Albion, 15 year old males and 25 to 34 year old females are the most vulnerable to poverty, with 16 males (50.0%) and 44 females (37.6%) in their respective age groups living below the poverty level.
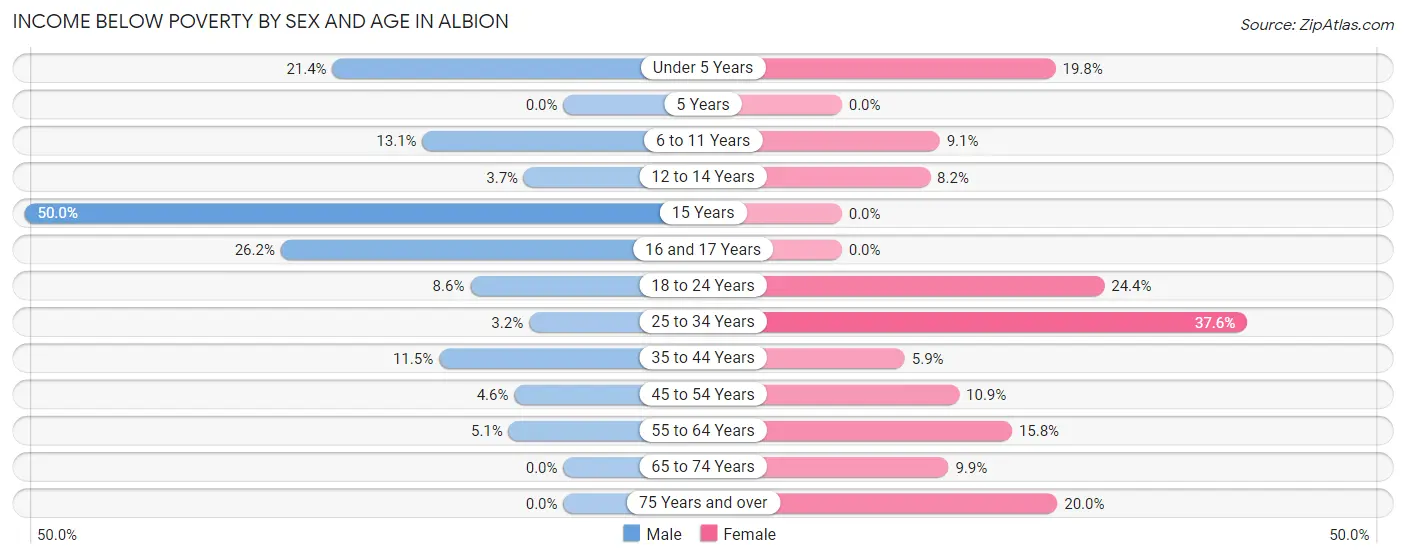
| Age Bracket | Male | Female |
| Under 5 Years | 24 (21.4%) | 25 (19.8%) |
| 5 Years | 0 (0.0%) | 0 (0.0%) |
| 6 to 11 Years | 17 (13.1%) | 10 (9.1%) |
| 12 to 14 Years | 3 (3.7%) | 5 (8.2%) |
| 15 Years | 16 (50.0%) | 0 (0.0%) |
| 16 and 17 Years | 16 (26.2%) | 0 (0.0%) |
| 18 to 24 Years | 7 (8.6%) | 19 (24.4%) |
| 25 to 34 Years | 9 (3.2%) | 44 (37.6%) |
| 35 to 44 Years | 18 (11.5%) | 12 (5.9%) |
| 45 to 54 Years | 6 (4.5%) | 22 (10.9%) |
| 55 to 64 Years | 3 (5.1%) | 15 (15.8%) |
| 65 to 74 Years | 0 (0.0%) | 10 (9.9%) |
| 75 Years and over | 0 (0.0%) | 8 (20.0%) |
| Total | 119 (9.5%) | 170 (12.9%) |
Income Above Poverty by Sex and Age in Albion
According to the poverty statistics in Albion, males aged 5 years and females aged 5 years are the age groups that are most secure financially, with 100.0% of males and 100.0% of females in these age groups living above the poverty line.
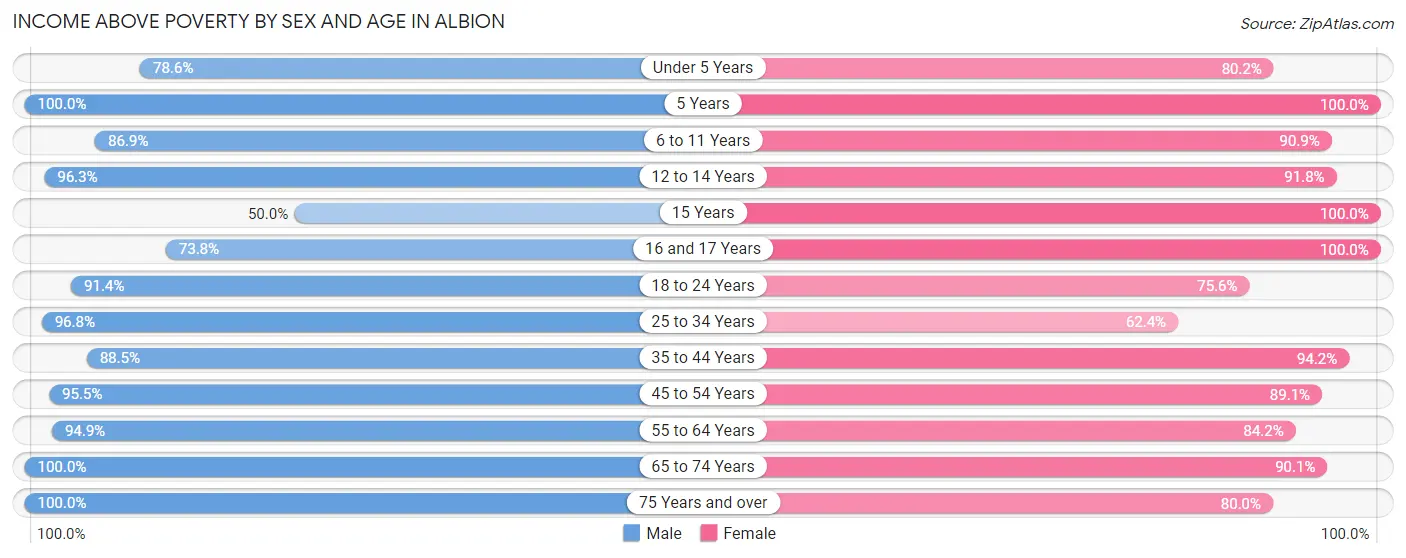
| Age Bracket | Male | Female |
| Under 5 Years | 88 (78.6%) | 101 (80.2%) |
| 5 Years | 7 (100.0%) | 60 (100.0%) |
| 6 to 11 Years | 113 (86.9%) | 100 (90.9%) |
| 12 to 14 Years | 79 (96.3%) | 56 (91.8%) |
| 15 Years | 16 (50.0%) | 83 (100.0%) |
| 16 and 17 Years | 45 (73.8%) | 37 (100.0%) |
| 18 to 24 Years | 74 (91.4%) | 59 (75.6%) |
| 25 to 34 Years | 273 (96.8%) | 73 (62.4%) |
| 35 to 44 Years | 138 (88.5%) | 193 (94.2%) |
| 45 to 54 Years | 126 (95.5%) | 180 (89.1%) |
| 55 to 64 Years | 56 (94.9%) | 80 (84.2%) |
| 65 to 74 Years | 76 (100.0%) | 91 (90.1%) |
| 75 Years and over | 42 (100.0%) | 32 (80.0%) |
| Total | 1,133 (90.5%) | 1,145 (87.1%) |
Income Below Poverty Among Married-Couple Families in Albion
The poverty statistics for married-couple families in Albion show that 5.4% or 21 of the total 389 families live below the poverty line. Families with 1 or 2 children have the highest poverty rate of 9.9%, comprising of 16 families. On the other hand, families with 3 or 4 children have the lowest poverty rate of 0.0%, which includes 0 families.
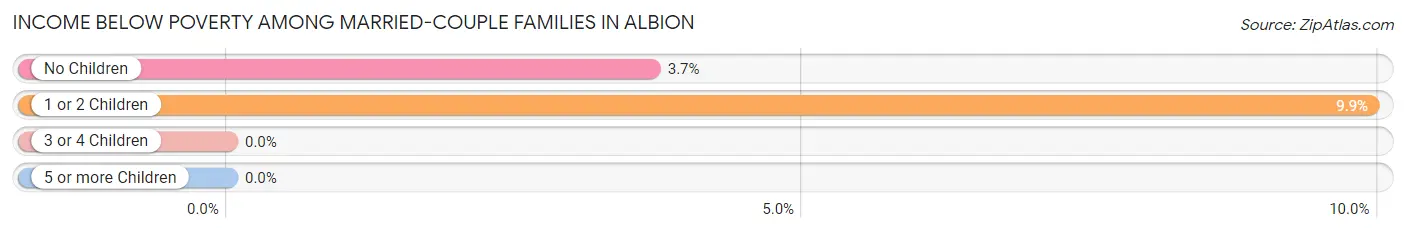
| Children | Above Poverty | Below Poverty |
| No Children | 131 (96.3%) | 5 (3.7%) |
| 1 or 2 Children | 145 (90.1%) | 16 (9.9%) |
| 3 or 4 Children | 47 (100.0%) | 0 (0.0%) |
| 5 or more Children | 45 (100.0%) | 0 (0.0%) |
| Total | 368 (94.6%) | 21 (5.4%) |
Income Below Poverty Among Single-Parent Households in Albion
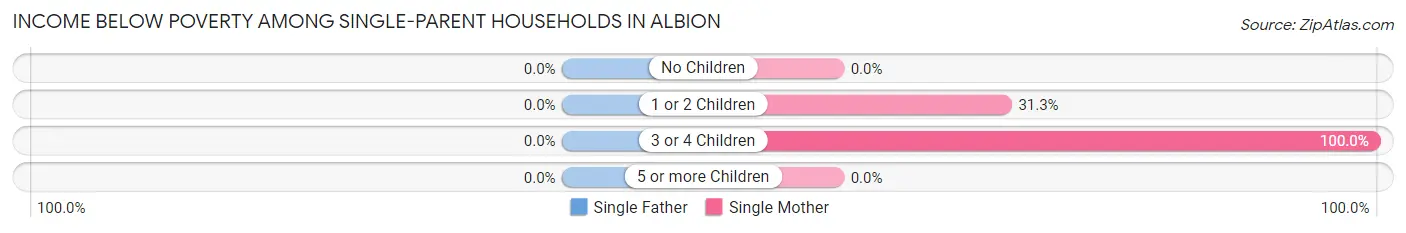
| Children | Single Father | Single Mother |
| No Children | 0 (0.0%) | 0 (0.0%) |
| 1 or 2 Children | 0 (0.0%) | 25 (31.2%) |
| 3 or 4 Children | 0 (0.0%) | 9 (100.0%) |
| 5 or more Children | 0 (0.0%) | 0 (0.0%) |
| Total | 0 (0.0%) | 34 (31.5%) |
Income Below Poverty Among Married-Couple vs Single-Parent Households in Albion
The poverty data for Albion shows that 21 of the married-couple family households (5.4%) and 34 of the single-parent households (18.1%) are living below the poverty level. Within the married-couple family households, those with 1 or 2 children have the highest poverty rate, with 16 households (9.9%) falling below the poverty line. Among the single-parent households, those with 3 or 4 children have the highest poverty rate, with 9 household (64.3%) living below poverty.
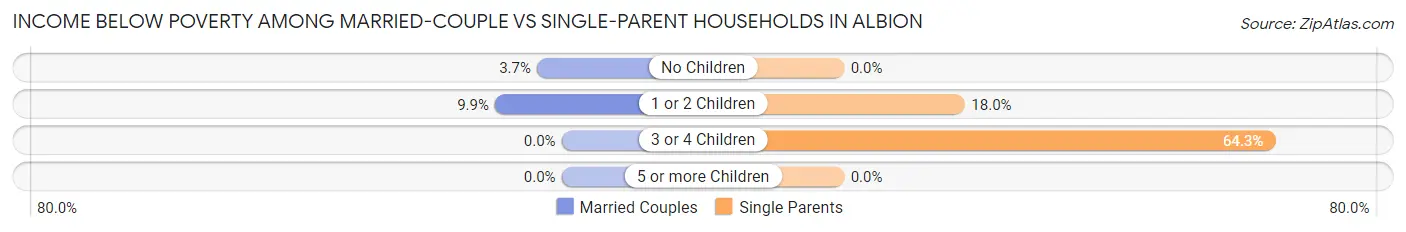
| Children | Married-Couple Families | Single-Parent Households |
| No Children | 5 (3.7%) | 0 (0.0%) |
| 1 or 2 Children | 16 (9.9%) | 25 (18.0%) |
| 3 or 4 Children | 0 (0.0%) | 9 (64.3%) |
| 5 or more Children | 0 (0.0%) | 0 (0.0%) |
| Total | 21 (5.4%) | 34 (18.1%) |
Race in Albion
The most populous races in Albion are White / Caucasian (2,662 | 93.9%), Hispanic or Latino (124 | 4.4%), and Two or more Races (121 | 4.3%).
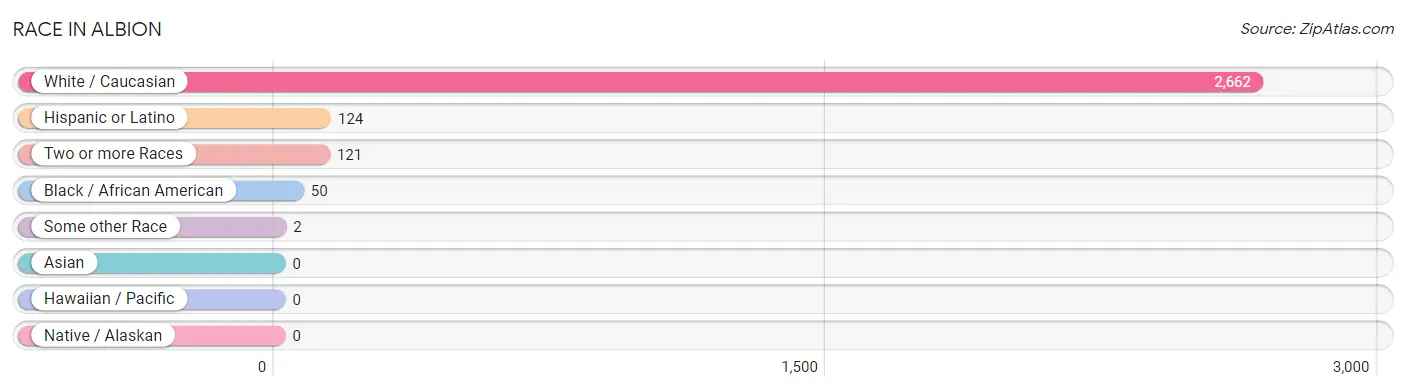
| Race | # Population | % Population |
| Asian | 0 | 0.0% |
| Black / African American | 50 | 1.8% |
| Hawaiian / Pacific | 0 | 0.0% |
| Hispanic or Latino | 124 | 4.4% |
| Native / Alaskan | 0 | 0.0% |
| White / Caucasian | 2,662 | 93.9% |
| Two or more Races | 121 | 4.3% |
| Some other Race | 2 | 0.1% |
| Total | 2,835 | 100.0% |
Ancestry in Albion
The most populous ancestries reported in Albion are German (593 | 20.9%), European (519 | 18.3%), American (411 | 14.5%), English (337 | 11.9%), and Irish (311 | 11.0%), together accounting for 76.6% of all Albion residents.
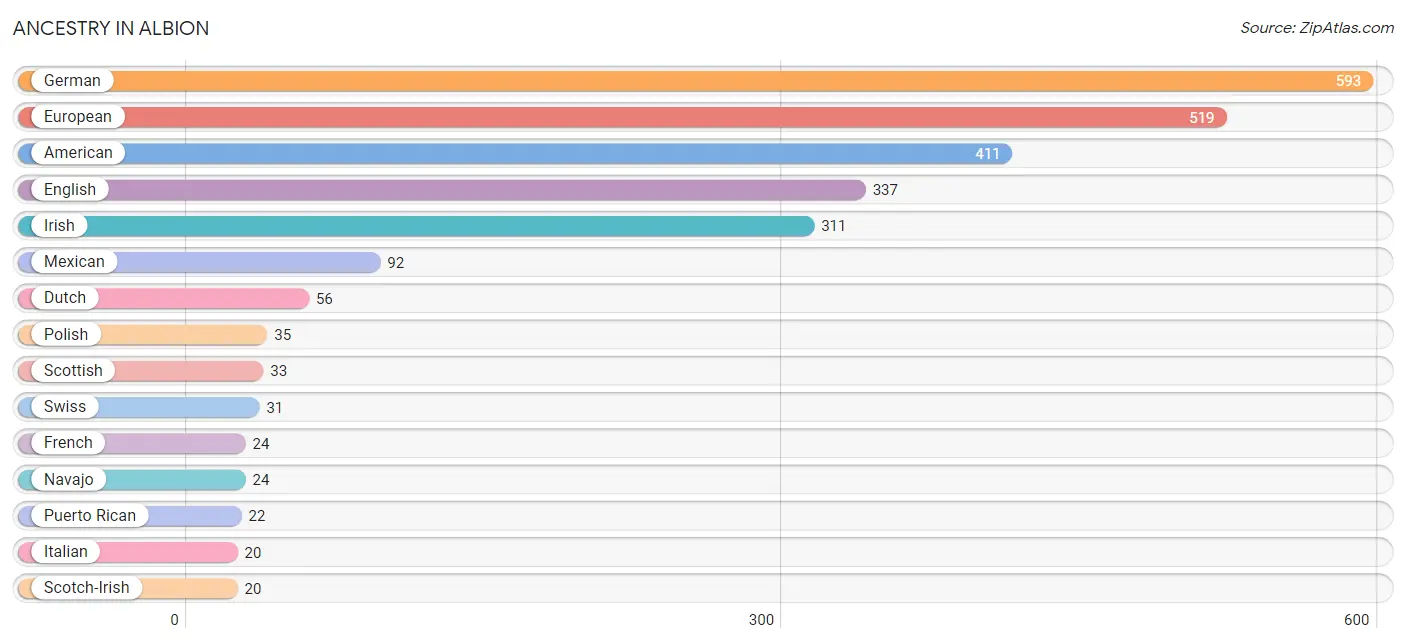
| Ancestry | # Population | % Population |
| American | 411 | 14.5% |
| Argentinean | 4 | 0.1% |
| Blackfeet | 1 | 0.0% |
| British | 6 | 0.2% |
| Burmese | 18 | 0.6% |
| Canadian | 8 | 0.3% |
| Cherokee | 6 | 0.2% |
| Chippewa | 6 | 0.2% |
| Cuban | 6 | 0.2% |
| Danish | 7 | 0.3% |
| Dutch | 56 | 2.0% |
| Eastern European | 5 | 0.2% |
| English | 337 | 11.9% |
| European | 519 | 18.3% |
| French | 24 | 0.9% |
| German | 593 | 20.9% |
| Greek | 5 | 0.2% |
| Hungarian | 9 | 0.3% |
| Irish | 311 | 11.0% |
| Italian | 20 | 0.7% |
| Lithuanian | 4 | 0.1% |
| Mexican | 92 | 3.3% |
| Navajo | 24 | 0.9% |
| Norwegian | 9 | 0.3% |
| Polish | 35 | 1.2% |
| Puerto Rican | 22 | 0.8% |
| Scotch-Irish | 20 | 0.7% |
| Scottish | 33 | 1.2% |
| South American | 4 | 0.1% |
| Swedish | 12 | 0.4% |
| Swiss | 31 | 1.1% | View All 31 Rows |
Immigrants in Albion
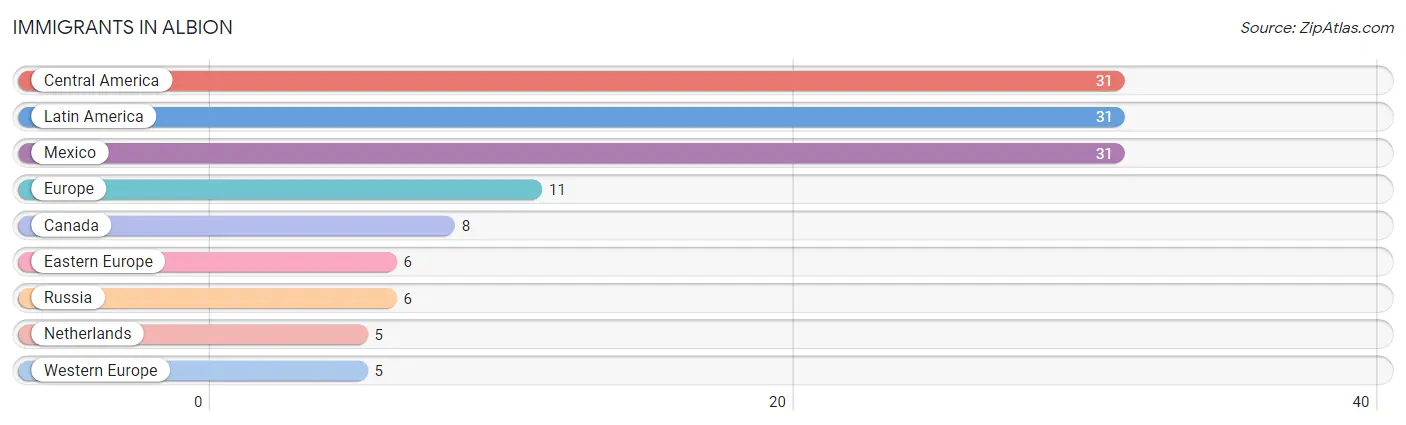
The most numerous immigrant groups reported in Albion came from Central America (31 | 1.1%), Latin America (31 | 1.1%), Mexico (31 | 1.1%), Europe (11 | 0.4%), and Canada (8 | 0.3%), together accounting for 3.9% of all Albion residents.
| Immigration Origin | # Population | % Population |
| Canada | 8 | 0.3% |
| Central America | 31 | 1.1% |
| Eastern Europe | 6 | 0.2% |
| Europe | 11 | 0.4% |
| Latin America | 31 | 1.1% |
| Mexico | 31 | 1.1% |
| Netherlands | 5 | 0.2% |
| Russia | 6 | 0.2% |
| Western Europe | 5 | 0.2% | View All 9 Rows |
Sex and Age in Albion
Sex and Age in Albion
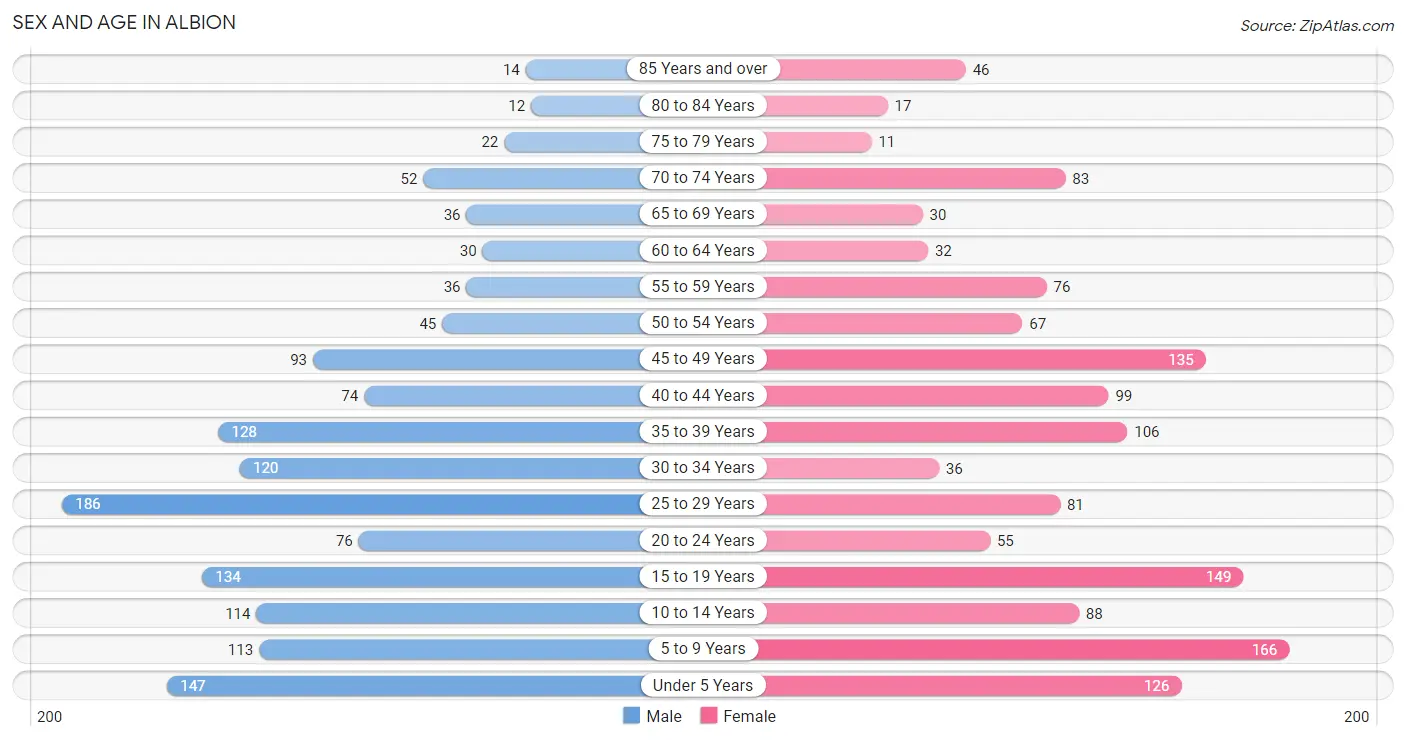
The most populous age groups in Albion are 25 to 29 Years (186 | 13.0%) for men and 5 to 9 Years (166 | 11.8%) for women.
| Age Bracket | Male | Female |
| Under 5 Years | 147 (10.3%) | 126 (9.0%) |
| 5 to 9 Years | 113 (7.9%) | 166 (11.8%) |
| 10 to 14 Years | 114 (8.0%) | 88 (6.3%) |
| 15 to 19 Years | 134 (9.4%) | 149 (10.6%) |
| 20 to 24 Years | 76 (5.3%) | 55 (3.9%) |
| 25 to 29 Years | 186 (13.0%) | 81 (5.8%) |
| 30 to 34 Years | 120 (8.4%) | 36 (2.6%) |
| 35 to 39 Years | 128 (8.9%) | 106 (7.6%) |
| 40 to 44 Years | 74 (5.2%) | 99 (7.1%) |
| 45 to 49 Years | 93 (6.5%) | 135 (9.6%) |
| 50 to 54 Years | 45 (3.1%) | 67 (4.8%) |
| 55 to 59 Years | 36 (2.5%) | 76 (5.4%) |
| 60 to 64 Years | 30 (2.1%) | 32 (2.3%) |
| 65 to 69 Years | 36 (2.5%) | 30 (2.1%) |
| 70 to 74 Years | 52 (3.6%) | 83 (5.9%) |
| 75 to 79 Years | 22 (1.5%) | 11 (0.8%) |
| 80 to 84 Years | 12 (0.8%) | 17 (1.2%) |
| 85 Years and over | 14 (1.0%) | 46 (3.3%) |
| Total | 1,432 (100.0%) | 1,403 (100.0%) |
Families and Households in Albion
Median Family Size in Albion
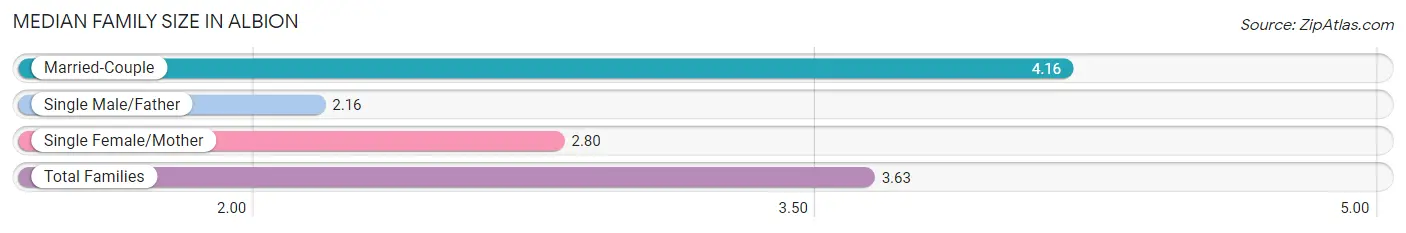
The median family size in Albion is 3.63 persons per family, with married-couple families (389 | 67.4%) accounting for the largest median family size of 4.16 persons per family. On the other hand, single male/father families (80 | 13.9%) represent the smallest median family size with 2.16 persons per family.
| Family Type | # Families | Family Size |
| Married-Couple | 389 (67.4%) | 4.16 |
| Single Male/Father | 80 (13.9%) | 2.16 |
| Single Female/Mother | 108 (18.7%) | 2.80 |
| Total Families | 577 (100.0%) | 3.63 |
Median Household Size in Albion
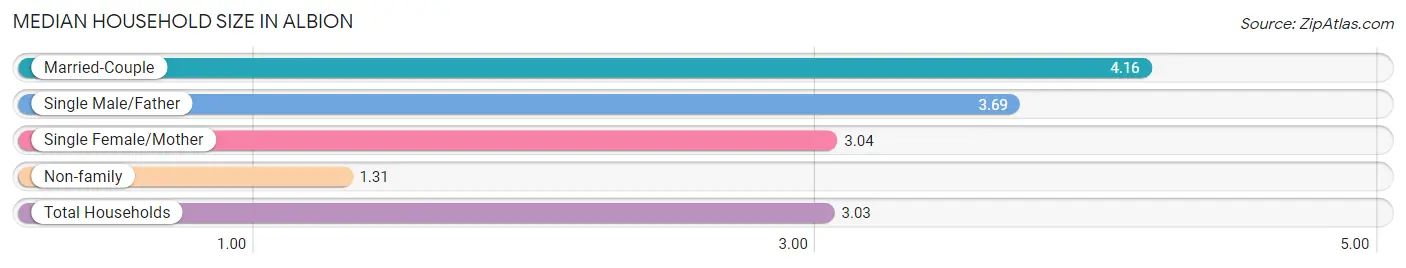
The median household size in Albion is 3.03 persons per household, with married-couple households (389 | 45.0%) accounting for the largest median household size of 4.16 persons per household. non-family households (288 | 33.3%) represent the smallest median household size with 1.31 persons per household.
| Household Type | # Households | Household Size |
| Married-Couple | 389 (45.0%) | 4.16 |
| Single Male/Father | 80 (9.2%) | 3.69 |
| Single Female/Mother | 108 (12.5%) | 3.04 |
| Non-family | 288 (33.3%) | 1.31 |
| Total Households | 865 (100.0%) | 3.03 |
Household Size by Marriage Status in Albion
Out of a total of 865 households in Albion, 577 (66.7%) are family households, while 288 (33.3%) are nonfamily households. The most numerous type of family households are 2-person households, comprising 187, and the most common type of nonfamily households are 1-person households, comprising 218.
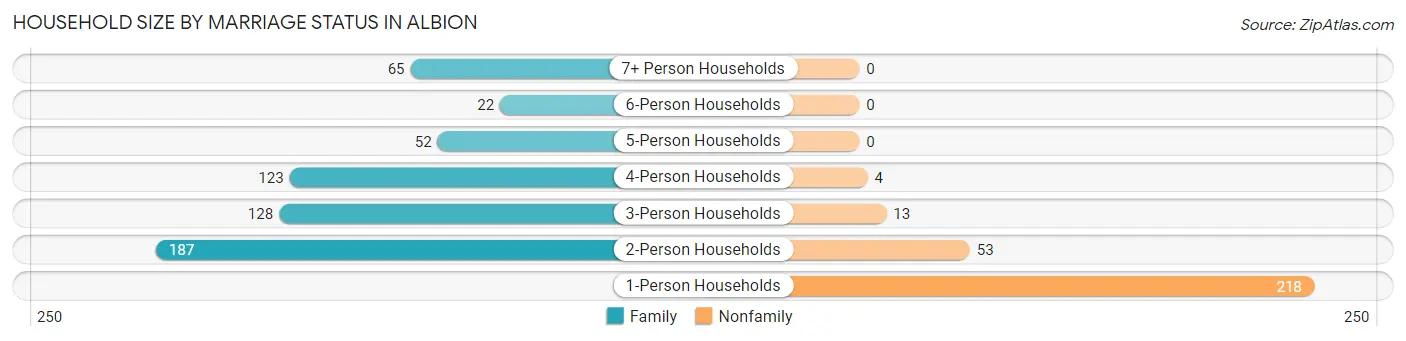
| Household Size | Family Households | Nonfamily Households |
| 1-Person Households | - | 218 (25.2%) |
| 2-Person Households | 187 (21.6%) | 53 (6.1%) |
| 3-Person Households | 128 (14.8%) | 13 (1.5%) |
| 4-Person Households | 123 (14.2%) | 4 (0.5%) |
| 5-Person Households | 52 (6.0%) | 0 (0.0%) |
| 6-Person Households | 22 (2.5%) | 0 (0.0%) |
| 7+ Person Households | 65 (7.5%) | 0 (0.0%) |
| Total | 577 (66.7%) | 288 (33.3%) |
Female Fertility in Albion
Fertility by Age in Albion
Average fertility rate in Albion is 53.0 births per 1,000 women. Women in the age bracket of 20 to 34 years have the highest fertility rate with 105.0 births per 1,000 women. Women in the age bracket of 20 to 34 years acount for 51.4% of all women with births.
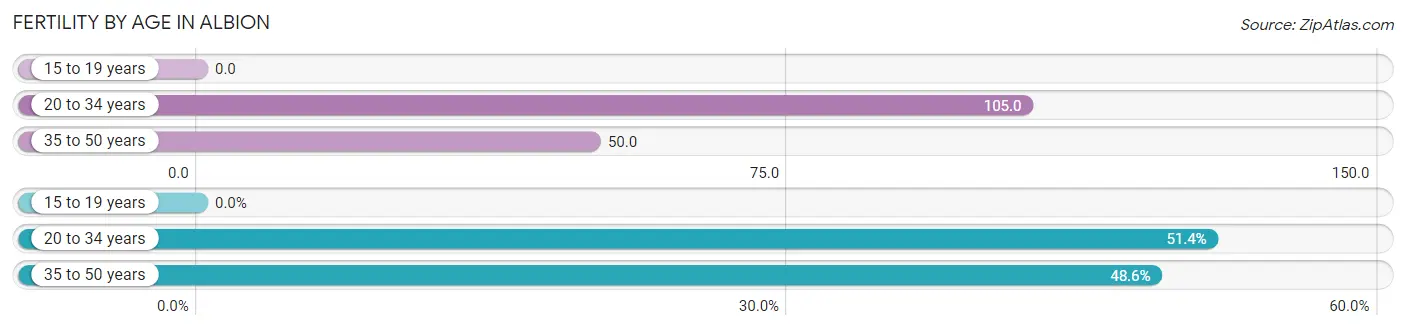
| Age Bracket | Women with Births | Births / 1,000 Women |
| 15 to 19 years | 0 (0.0%) | 0.0 |
| 20 to 34 years | 18 (51.4%) | 105.0 |
| 35 to 50 years | 17 (48.6%) | 50.0 |
| Total | 35 (100.0%) | 53.0 |
Fertility by Age by Marriage Status in Albion
40.0% of women with births (35) in Albion are married. The highest percentage of unmarried women with births falls into 35 to 50 years age bracket with 100.0% of them unmarried at the time of birth, while the lowest percentage of unmarried women with births belong to 20 to 34 years age bracket with 22.2% of them unmarried.
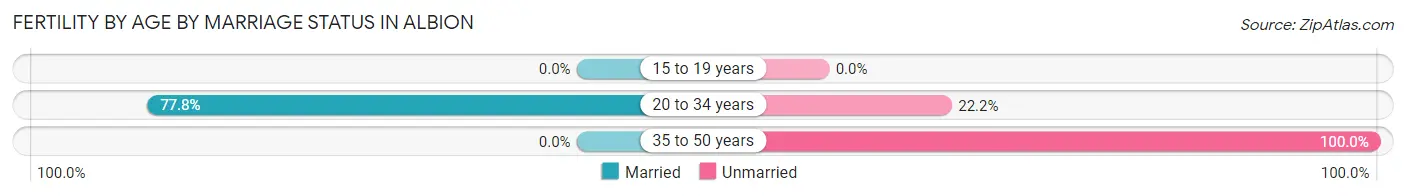
| Age Bracket | Married | Unmarried |
| 15 to 19 years | 0 (0.0%) | 0 (0.0%) |
| 20 to 34 years | 14 (77.8%) | 4 (22.2%) |
| 35 to 50 years | 0 (0.0%) | 17 (100.0%) |
| Total | 14 (40.0%) | 21 (60.0%) |
Fertility by Education in Albion
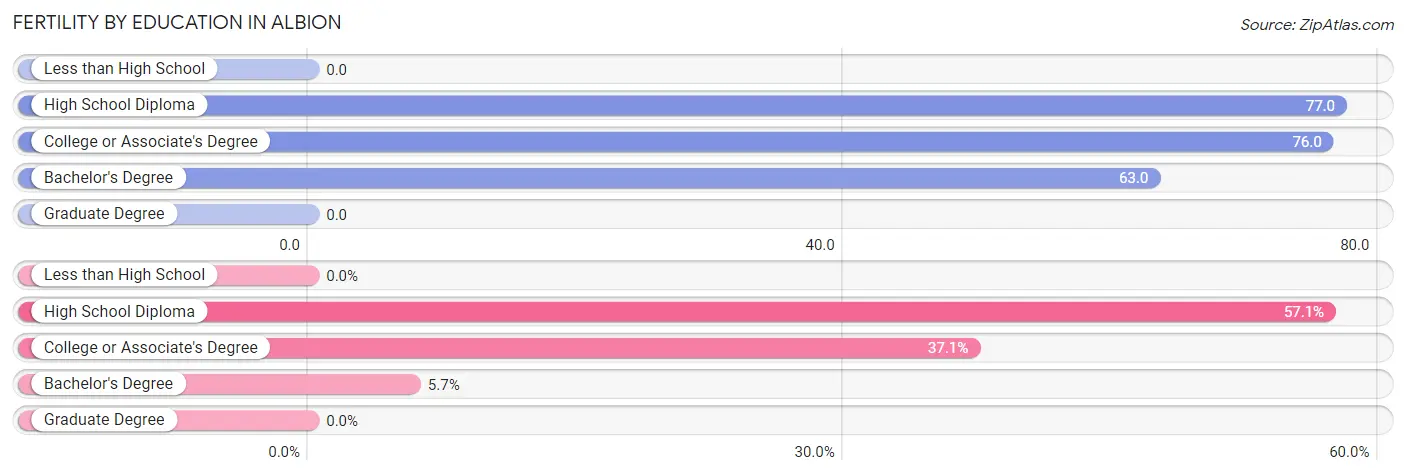
| Educational Attainment | Women with Births | Births / 1,000 Women |
| Less than High School | 0 (0.0%) | 0.0 |
| High School Diploma | 20 (57.1%) | 77.0 |
| College or Associate's Degree | 13 (37.1%) | 76.0 |
| Bachelor's Degree | 2 (5.7%) | 63.0 |
| Graduate Degree | 0 (0.0%) | 0.0 |
| Total | 35 (100.0%) | 53.0 |
Fertility by Education by Marriage Status in Albion
60.0% of women with births in Albion are unmarried. Women with the educational attainment of bachelor's degree are most likely to be married with 100.0% of them married at childbirth, while women with the educational attainment of high school diploma are least likely to be married with 85.0% of them unmarried at childbirth.
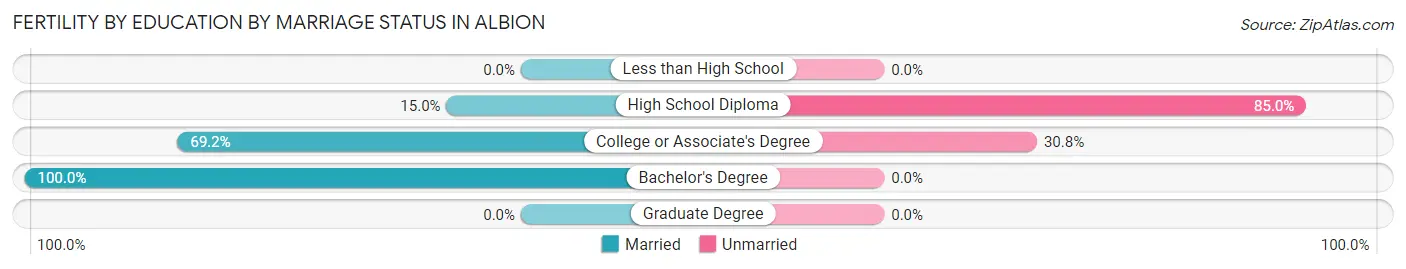
| Educational Attainment | Married | Unmarried |
| Less than High School | 0 (0.0%) | 0 (0.0%) |
| High School Diploma | 3 (15.0%) | 17 (85.0%) |
| College or Associate's Degree | 9 (69.2%) | 4 (30.8%) |
| Bachelor's Degree | 2 (100.0%) | 0 (0.0%) |
| Graduate Degree | 0 (0.0%) | 0 (0.0%) |
| Total | 14 (40.0%) | 21 (60.0%) |
Employment Characteristics in Albion
Employment by Class of Employer in Albion
Among the 1,241 employed individuals in Albion, private company employees (977 | 78.7%), local government employees (82 | 6.6%), and self-employed (not incorporated) (65 | 5.2%) make up the most common classes of employment.
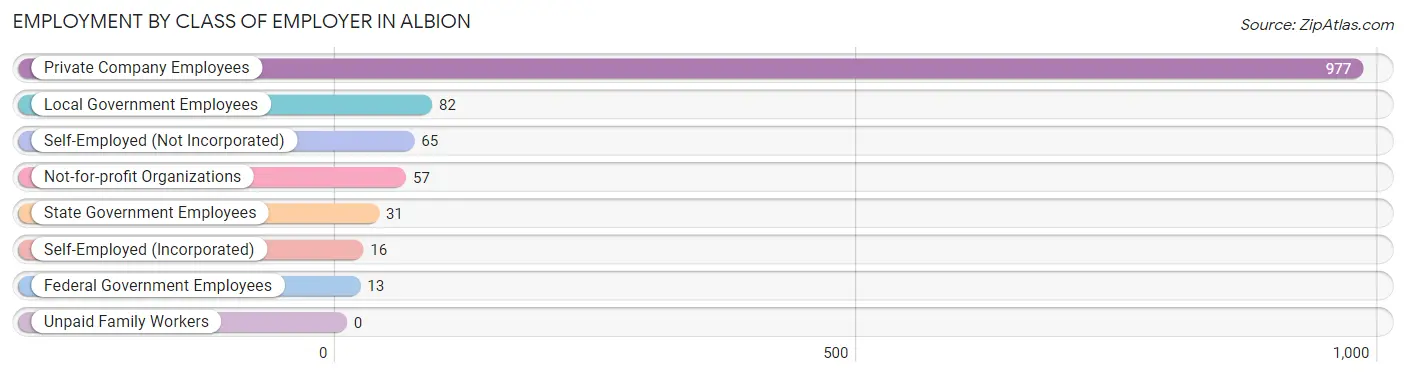
| Employer Class | # Employees | % Employees |
| Private Company Employees | 977 | 78.7% |
| Self-Employed (Incorporated) | 16 | 1.3% |
| Self-Employed (Not Incorporated) | 65 | 5.2% |
| Not-for-profit Organizations | 57 | 4.6% |
| Local Government Employees | 82 | 6.6% |
| State Government Employees | 31 | 2.5% |
| Federal Government Employees | 13 | 1.1% |
| Unpaid Family Workers | 0 | 0.0% |
| Total | 1,241 | 100.0% |
Employment Status by Age in Albion
According to the labor force statistics for Albion, out of the total population over 16 years of age (1,966), 66.1% or 1,300 individuals are in the labor force, with 1.2% or 16 of them unemployed. The age group with the highest labor force participation rate is 30 to 34 years, with 87.8% or 137 individuals in the labor force. Within the labor force, the 30 to 34 years age range has the highest percentage of unemployed individuals, with 4.5% or 6 of them being unemployed.
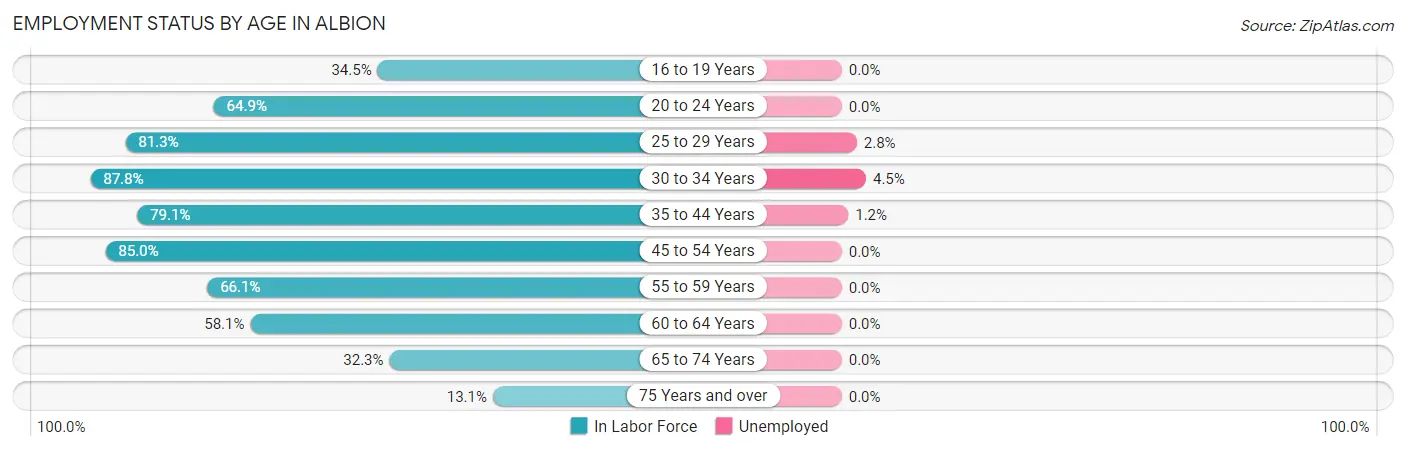
| Age Bracket | In Labor Force | Unemployed |
| 16 to 19 Years | 58 (34.5%) | 0 (0.0%) |
| 20 to 24 Years | 85 (64.9%) | 0 (0.0%) |
| 25 to 29 Years | 217 (81.3%) | 6 (2.8%) |
| 30 to 34 Years | 137 (87.8%) | 6 (4.5%) |
| 35 to 44 Years | 322 (79.1%) | 4 (1.2%) |
| 45 to 54 Years | 289 (85.0%) | 0 (0.0%) |
| 55 to 59 Years | 74 (66.1%) | 0 (0.0%) |
| 60 to 64 Years | 36 (58.1%) | 0 (0.0%) |
| 65 to 74 Years | 65 (32.3%) | 0 (0.0%) |
| 75 Years and over | 16 (13.1%) | 0 (0.0%) |
| Total | 1,300 (66.1%) | 16 (1.2%) |
Employment Status by Educational Attainment in Albion
According to labor force statistics for Albion, 80.0% of individuals (1,075) out of the total population between 25 and 64 years of age (1,344) are in the labor force, with 1.5% or 16 of them being unemployed. The group with the highest labor force participation rate are those with the educational attainment of bachelor's degree or higher, with 93.2% or 82 individuals in the labor force. Within the labor force, individuals with high school diploma education have the highest percentage of unemployment, with 1.9% or 10 of them being unemployed.
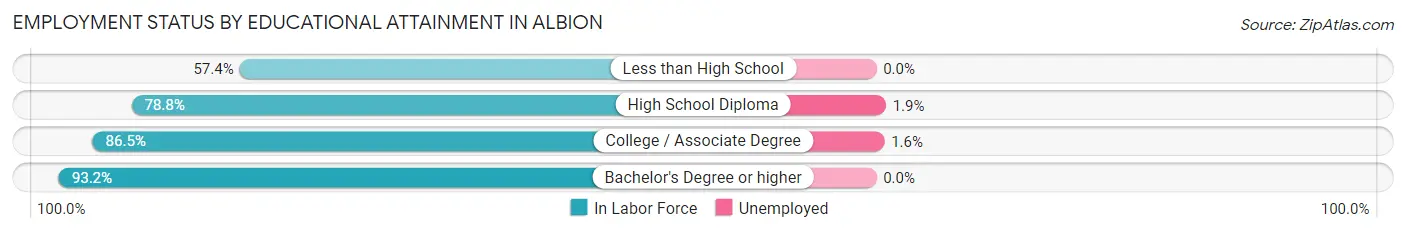
| Educational Attainment | In Labor Force | Unemployed |
| Less than High School | 81 (57.4%) | 0 (0.0%) |
| High School Diploma | 535 (78.8%) | 13 (1.9%) |
| College / Associate Degree | 377 (86.5%) | 7 (1.6%) |
| Bachelor's Degree or higher | 82 (93.2%) | 0 (0.0%) |
| Total | 1,075 (80.0%) | 20 (1.5%) |
Employment Occupations by Sex in Albion
Management, Business, Science and Arts Occupations
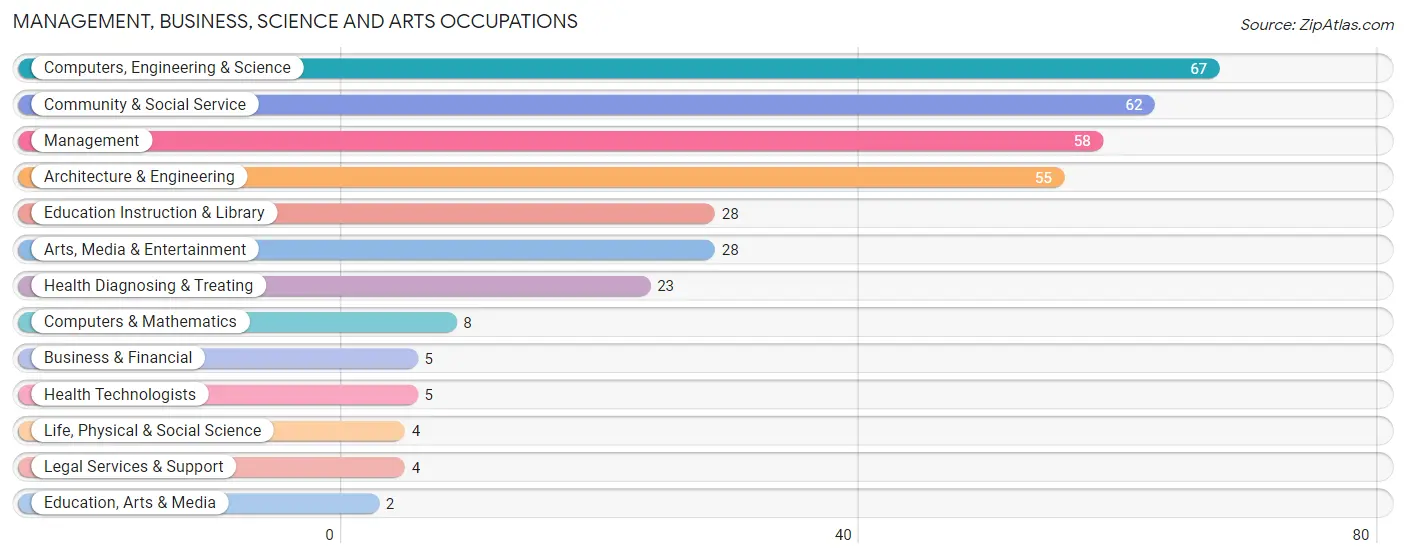
The most common Management, Business, Science and Arts occupations in Albion are Computers, Engineering & Science (67 | 5.2%), Community & Social Service (62 | 4.9%), Management (58 | 4.5%), Architecture & Engineering (55 | 4.3%), and Education Instruction & Library (28 | 2.2%).
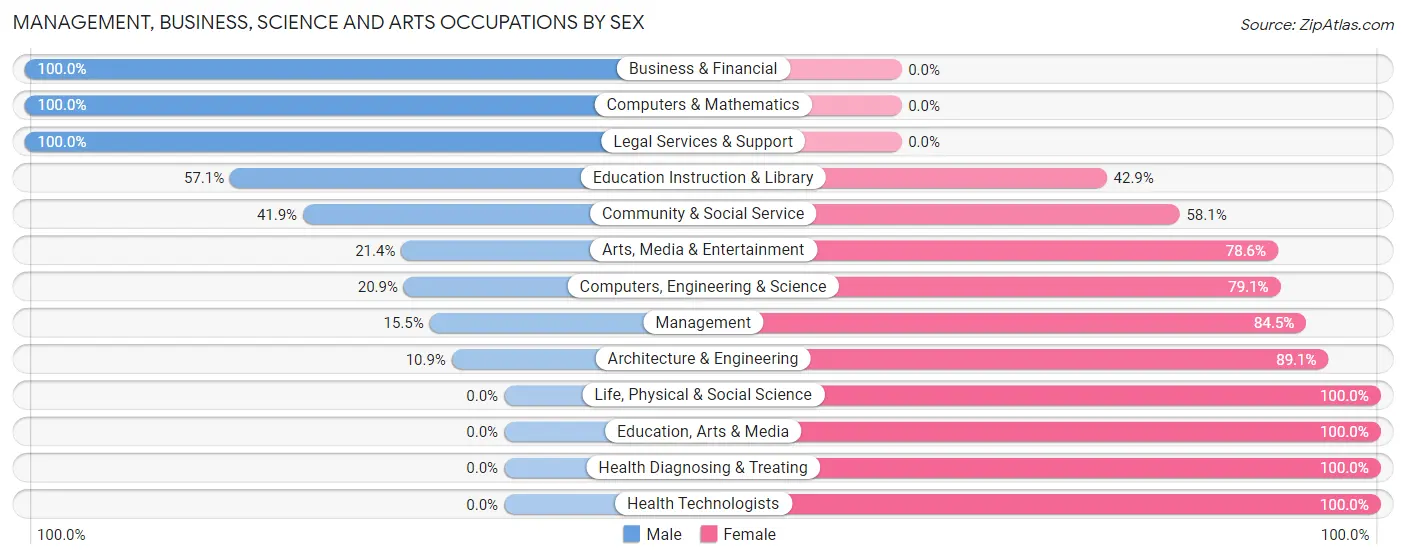
Management, Business, Science and Arts Occupations by Sex
Within the Management, Business, Science and Arts occupations in Albion, the most male-oriented occupations are Business & Financial (100.0%), Computers & Mathematics (100.0%), and Legal Services & Support (100.0%), while the most female-oriented occupations are Life, Physical & Social Science (100.0%), Education, Arts & Media (100.0%), and Health Diagnosing & Treating (100.0%).
| Occupation | Male | Female |
| Management | 9 (15.5%) | 49 (84.5%) |
| Business & Financial | 5 (100.0%) | 0 (0.0%) |
| Computers, Engineering & Science | 14 (20.9%) | 53 (79.1%) |
| Computers & Mathematics | 8 (100.0%) | 0 (0.0%) |
| Architecture & Engineering | 6 (10.9%) | 49 (89.1%) |
| Life, Physical & Social Science | 0 (0.0%) | 4 (100.0%) |
| Community & Social Service | 26 (41.9%) | 36 (58.1%) |
| Education, Arts & Media | 0 (0.0%) | 2 (100.0%) |
| Legal Services & Support | 4 (100.0%) | 0 (0.0%) |
| Education Instruction & Library | 16 (57.1%) | 12 (42.9%) |
| Arts, Media & Entertainment | 6 (21.4%) | 22 (78.6%) |
| Health Diagnosing & Treating | 0 (0.0%) | 23 (100.0%) |
| Health Technologists | 0 (0.0%) | 5 (100.0%) |
| Total (Category) | 54 (25.1%) | 161 (74.9%) |
| Total (Overall) | 692 (54.1%) | 586 (45.9%) |
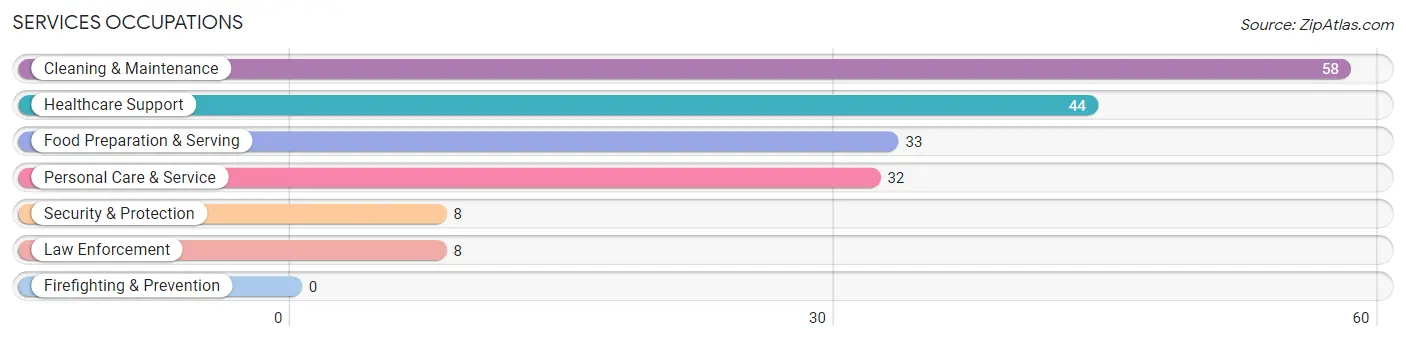
Services Occupations
The most common Services occupations in Albion are Cleaning & Maintenance (58 | 4.5%), Healthcare Support (44 | 3.4%), Food Preparation & Serving (33 | 2.6%), Personal Care & Service (32 | 2.5%), and Security & Protection (8 | 0.6%).
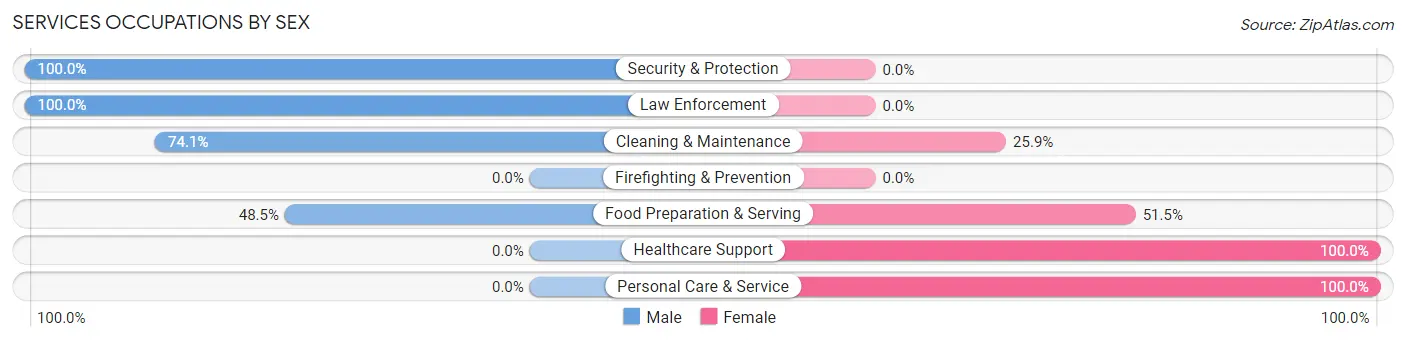
Services Occupations by Sex
Within the Services occupations in Albion, the most male-oriented occupations are Security & Protection (100.0%), Law Enforcement (100.0%), and Cleaning & Maintenance (74.1%), while the most female-oriented occupations are Healthcare Support (100.0%), Personal Care & Service (100.0%), and Food Preparation & Serving (51.5%).
| Occupation | Male | Female |
| Healthcare Support | 0 (0.0%) | 44 (100.0%) |
| Security & Protection | 8 (100.0%) | 0 (0.0%) |
| Firefighting & Prevention | 0 (0.0%) | 0 (0.0%) |
| Law Enforcement | 8 (100.0%) | 0 (0.0%) |
| Food Preparation & Serving | 16 (48.5%) | 17 (51.5%) |
| Cleaning & Maintenance | 43 (74.1%) | 15 (25.9%) |
| Personal Care & Service | 0 (0.0%) | 32 (100.0%) |
| Total (Category) | 67 (38.3%) | 108 (61.7%) |
| Total (Overall) | 692 (54.1%) | 586 (45.9%) |
Sales and Office Occupations
The most common Sales and Office occupations in Albion are Office & Administration (113 | 8.8%), and Sales & Related (80 | 6.3%).
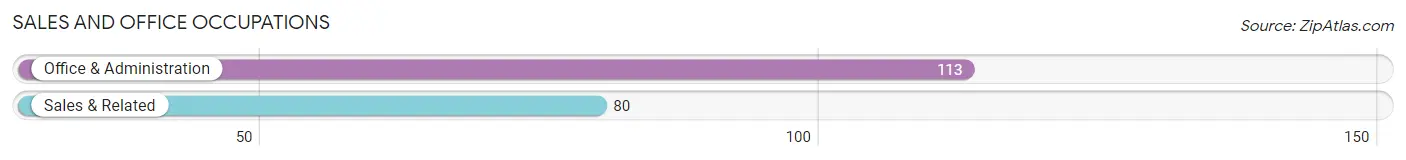
Sales and Office Occupations by Sex
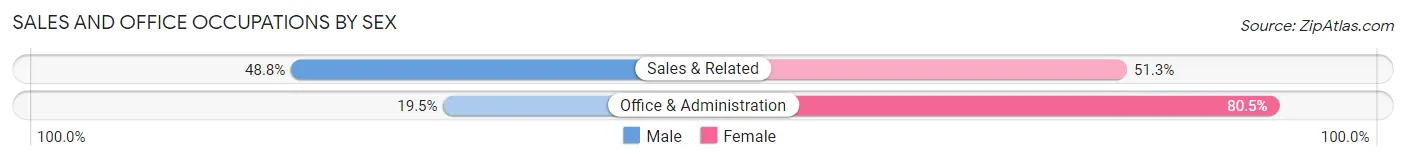
| Occupation | Male | Female |
| Sales & Related | 39 (48.7%) | 41 (51.2%) |
| Office & Administration | 22 (19.5%) | 91 (80.5%) |
| Total (Category) | 61 (31.6%) | 132 (68.4%) |
| Total (Overall) | 692 (54.1%) | 586 (45.9%) |
Natural Resources, Construction and Maintenance Occupations
The most common Natural Resources, Construction and Maintenance occupations in Albion are Construction & Extraction (82 | 6.4%), and Installation, Maintenance & Repair (14 | 1.1%).
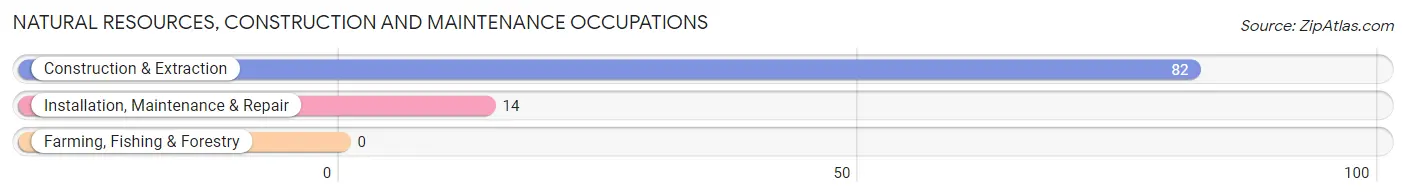
Natural Resources, Construction and Maintenance Occupations by Sex
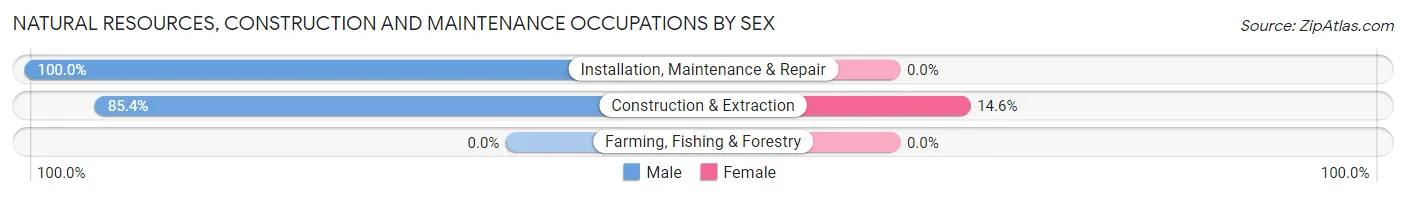
| Occupation | Male | Female |
| Farming, Fishing & Forestry | 0 (0.0%) | 0 (0.0%) |
| Construction & Extraction | 70 (85.4%) | 12 (14.6%) |
| Installation, Maintenance & Repair | 14 (100.0%) | 0 (0.0%) |
| Total (Category) | 84 (87.5%) | 12 (12.5%) |
| Total (Overall) | 692 (54.1%) | 586 (45.9%) |
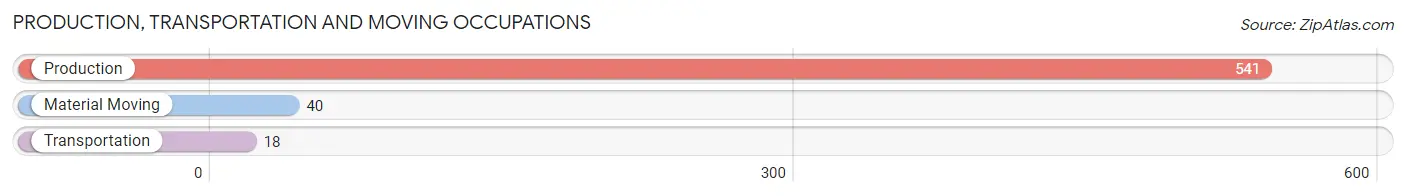
Production, Transportation and Moving Occupations
The most common Production, Transportation and Moving occupations in Albion are Production (541 | 42.3%), Material Moving (40 | 3.1%), and Transportation (18 | 1.4%).
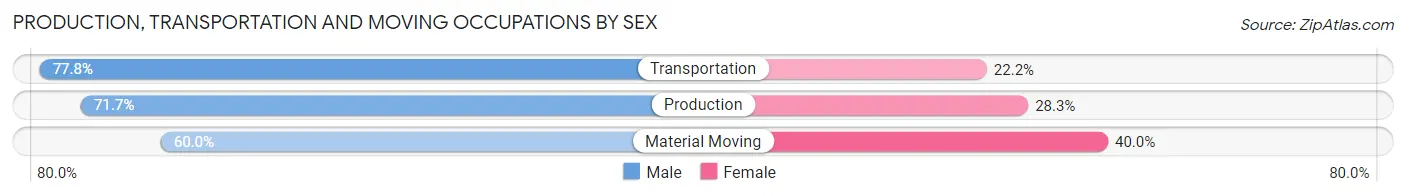
Production, Transportation and Moving Occupations by Sex
| Occupation | Male | Female |
| Production | 388 (71.7%) | 153 (28.3%) |
| Transportation | 14 (77.8%) | 4 (22.2%) |
| Material Moving | 24 (60.0%) | 16 (40.0%) |
| Total (Category) | 426 (71.1%) | 173 (28.9%) |
| Total (Overall) | 692 (54.1%) | 586 (45.9%) |
Employment Industries by Sex in Albion
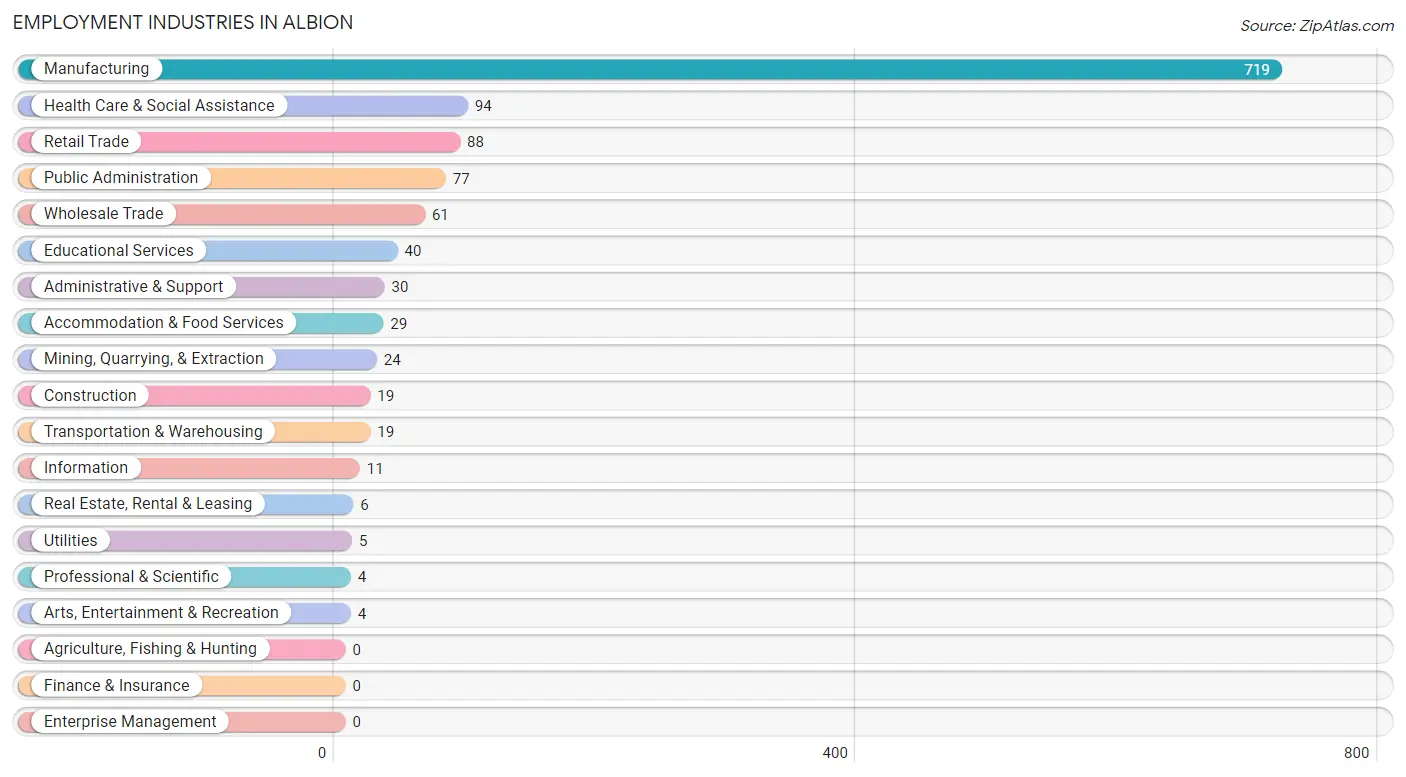
Employment Industries in Albion
The major employment industries in Albion include Manufacturing (719 | 56.3%), Health Care & Social Assistance (94 | 7.4%), Retail Trade (88 | 6.9%), Public Administration (77 | 6.0%), and Wholesale Trade (61 | 4.8%).
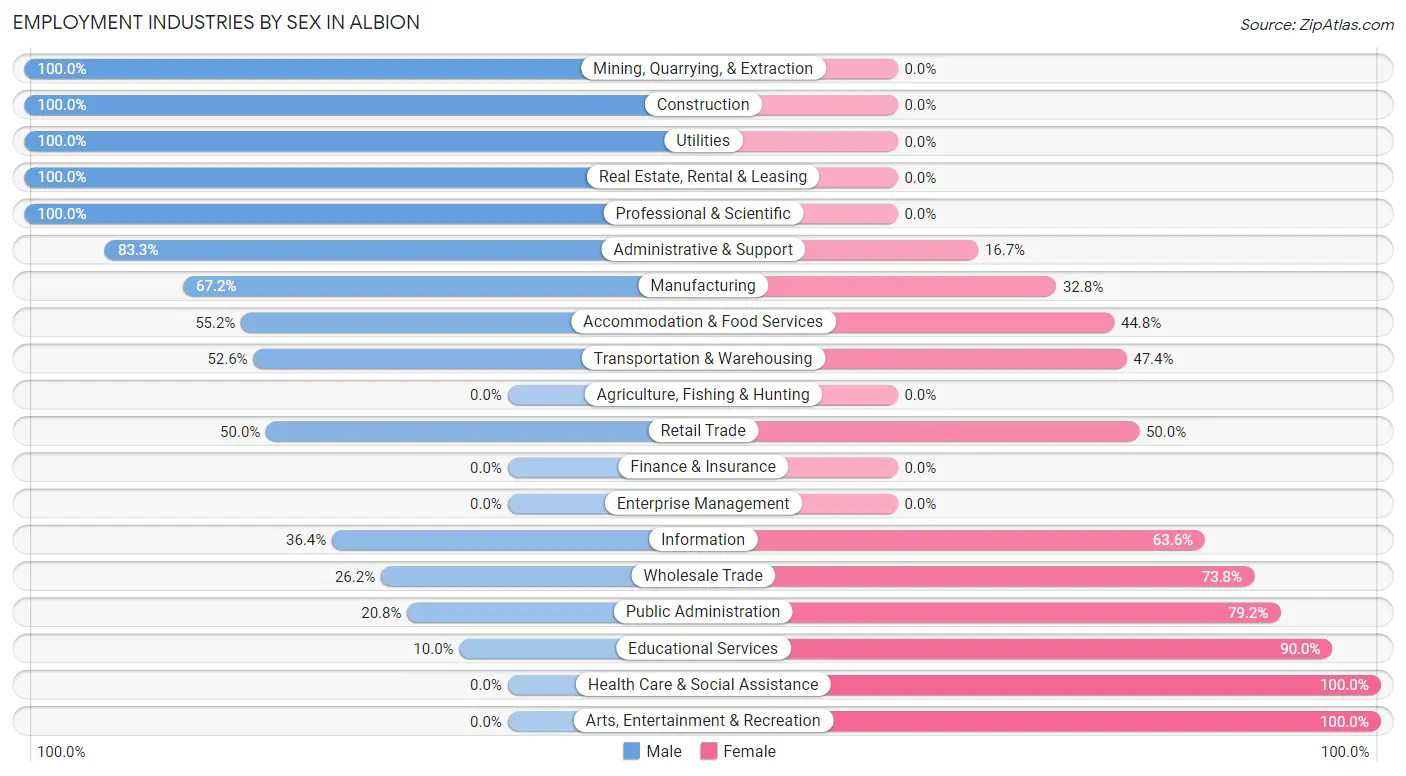
Employment Industries by Sex in Albion
The Albion industries that see more men than women are Mining, Quarrying, & Extraction (100.0%), Construction (100.0%), and Utilities (100.0%), whereas the industries that tend to have a higher number of women are Health Care & Social Assistance (100.0%), Arts, Entertainment & Recreation (100.0%), and Educational Services (90.0%).
| Industry | Male | Female |
| Agriculture, Fishing & Hunting | 0 (0.0%) | 0 (0.0%) |
| Mining, Quarrying, & Extraction | 24 (100.0%) | 0 (0.0%) |
| Construction | 19 (100.0%) | 0 (0.0%) |
| Manufacturing | 483 (67.2%) | 236 (32.8%) |
| Wholesale Trade | 16 (26.2%) | 45 (73.8%) |
| Retail Trade | 44 (50.0%) | 44 (50.0%) |
| Transportation & Warehousing | 10 (52.6%) | 9 (47.4%) |
| Utilities | 5 (100.0%) | 0 (0.0%) |
| Information | 4 (36.4%) | 7 (63.6%) |
| Finance & Insurance | 0 (0.0%) | 0 (0.0%) |
| Real Estate, Rental & Leasing | 6 (100.0%) | 0 (0.0%) |
| Professional & Scientific | 4 (100.0%) | 0 (0.0%) |
| Enterprise Management | 0 (0.0%) | 0 (0.0%) |
| Administrative & Support | 25 (83.3%) | 5 (16.7%) |
| Educational Services | 4 (10.0%) | 36 (90.0%) |
| Health Care & Social Assistance | 0 (0.0%) | 94 (100.0%) |
| Arts, Entertainment & Recreation | 0 (0.0%) | 4 (100.0%) |
| Accommodation & Food Services | 16 (55.2%) | 13 (44.8%) |
| Public Administration | 16 (20.8%) | 61 (79.2%) |
| Total | 692 (54.1%) | 586 (45.9%) |
Education in Albion
School Enrollment in Albion
The most common levels of schooling among the 855 students in Albion are high school (267 | 31.2%), elementary school (209 | 24.4%), and middle school (159 | 18.6%).
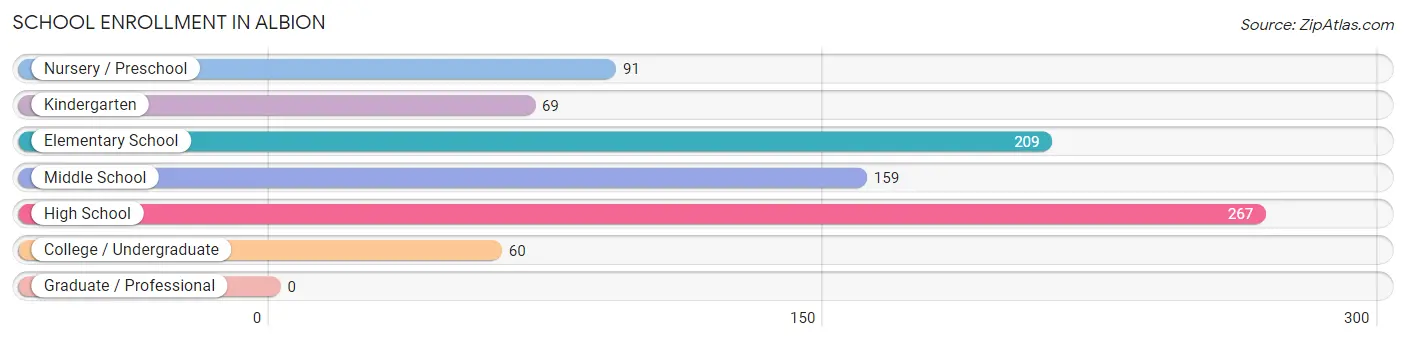
| School Level | # Students | % Students |
| Nursery / Preschool | 91 | 10.6% |
| Kindergarten | 69 | 8.1% |
| Elementary School | 209 | 24.4% |
| Middle School | 159 | 18.6% |
| High School | 267 | 31.2% |
| College / Undergraduate | 60 | 7.0% |
| Graduate / Professional | 0 | 0.0% |
| Total | 855 | 100.0% |
School Enrollment by Age by Funding Source in Albion
Out of a total of 855 students who are enrolled in schools in Albion, 67 (7.8%) attend a private institution, while the remaining 788 (92.2%) are enrolled in public schools. The age group of 3 to 4 year olds has the highest likelihood of being enrolled in private schools, with 53 (60.2% in the age bracket) enrolled. Conversely, the age group of 5 to 9 year old has the lowest likelihood of being enrolled in a private school, with 263 (100.0% in the age bracket) attending a public institution.
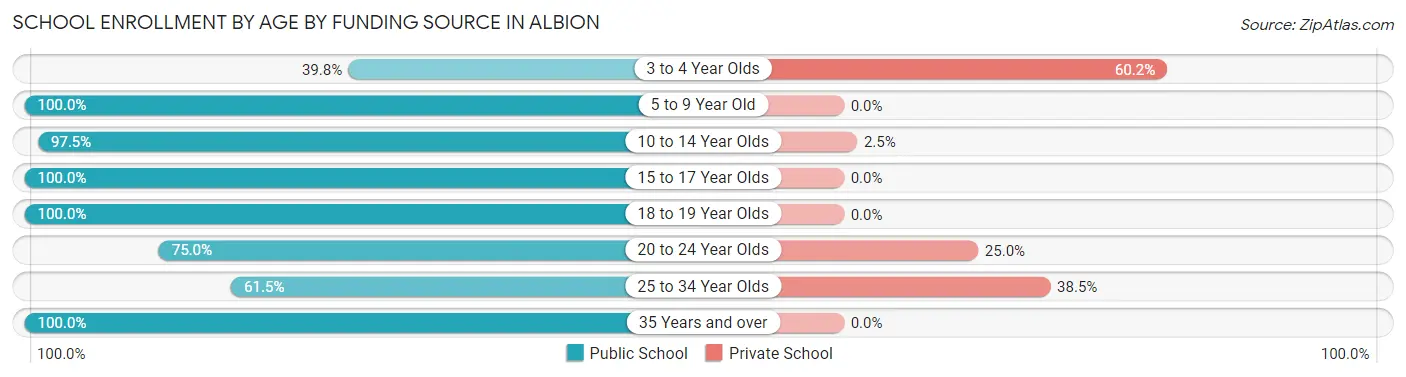
| Age Bracket | Public School | Private School |
| 3 to 4 Year Olds | 35 (39.8%) | 53 (60.2%) |
| 5 to 9 Year Old | 263 (100.0%) | 0 (0.0%) |
| 10 to 14 Year Olds | 197 (97.5%) | 5 (2.5%) |
| 15 to 17 Year Olds | 213 (100.0%) | 0 (0.0%) |
| 18 to 19 Year Olds | 33 (100.0%) | 0 (0.0%) |
| 20 to 24 Year Olds | 12 (75.0%) | 4 (25.0%) |
| 25 to 34 Year Olds | 8 (61.5%) | 5 (38.5%) |
| 35 Years and over | 27 (100.0%) | 0 (0.0%) |
| Total | 788 (92.2%) | 67 (7.8%) |
Educational Attainment by Field of Study in Albion
Business (22 | 21.1%), education (15 | 14.4%), visual & performing arts (15 | 14.4%), bio, nature & agricultural (13 | 12.5%), and liberal arts & history (9 | 8.6%) are the most common fields of study among 104 individuals in Albion who have obtained a bachelor's degree or higher.
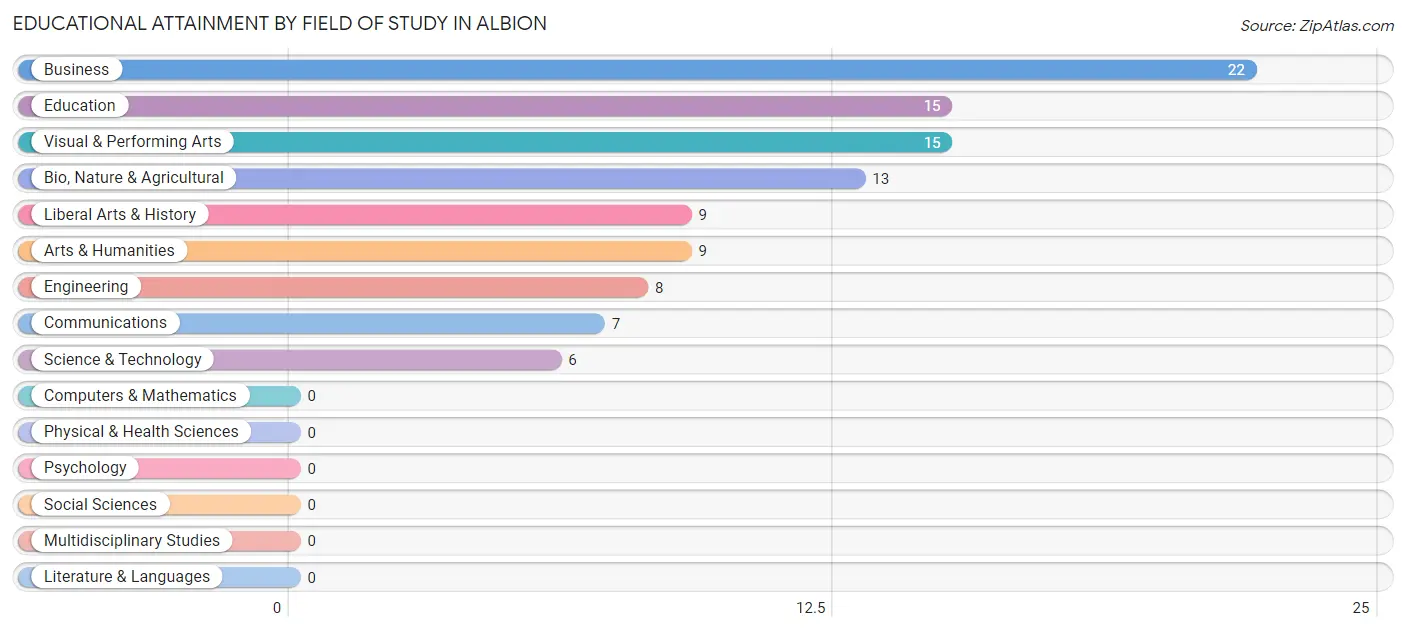
| Field of Study | # Graduates | % Graduates |
| Computers & Mathematics | 0 | 0.0% |
| Bio, Nature & Agricultural | 13 | 12.5% |
| Physical & Health Sciences | 0 | 0.0% |
| Psychology | 0 | 0.0% |
| Social Sciences | 0 | 0.0% |
| Engineering | 8 | 7.7% |
| Multidisciplinary Studies | 0 | 0.0% |
| Science & Technology | 6 | 5.8% |
| Business | 22 | 21.1% |
| Education | 15 | 14.4% |
| Literature & Languages | 0 | 0.0% |
| Liberal Arts & History | 9 | 8.6% |
| Visual & Performing Arts | 15 | 14.4% |
| Communications | 7 | 6.7% |
| Arts & Humanities | 9 | 8.6% |
| Total | 104 | 100.0% |
Transportation & Commute in Albion
Vehicle Availability by Sex in Albion
The most prevalent vehicle ownership categories in Albion are males with 2 vehicles (205, accounting for 29.6%) and females with 2 vehicles (172, making up 37.6%).
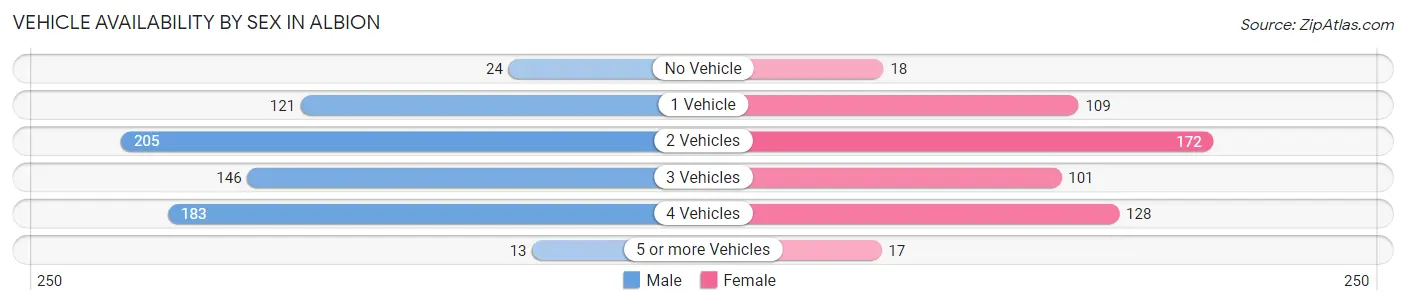
| Vehicles Available | Male | Female |
| No Vehicle | 24 (3.5%) | 18 (3.3%) |
| 1 Vehicle | 121 (17.5%) | 109 (20.0%) |
| 2 Vehicles | 205 (29.6%) | 172 (31.6%) |
| 3 Vehicles | 146 (21.1%) | 101 (18.5%) |
| 4 Vehicles | 183 (26.5%) | 128 (23.5%) |
| 5 or more Vehicles | 13 (1.9%) | 17 (3.1%) |
| Total | 692 (100.0%) | 545 (100.0%) |
Commute Time in Albion
The most frequently occuring commute durations in Albion are 5 to 9 minutes (271 commuters, 22.5%), 45 to 59 minutes (192 commuters, 15.9%), and 30 to 34 minutes (150 commuters, 12.4%).
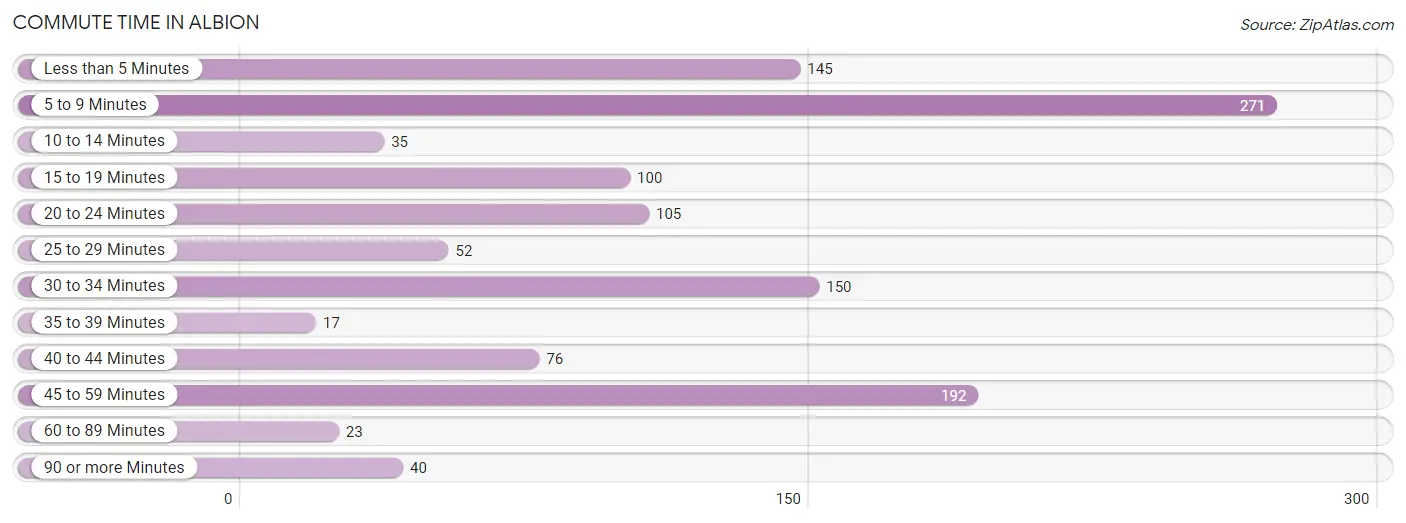
| Commute Time | # Commuters | % Commuters |
| Less than 5 Minutes | 145 | 12.0% |
| 5 to 9 Minutes | 271 | 22.5% |
| 10 to 14 Minutes | 35 | 2.9% |
| 15 to 19 Minutes | 100 | 8.3% |
| 20 to 24 Minutes | 105 | 8.7% |
| 25 to 29 Minutes | 52 | 4.3% |
| 30 to 34 Minutes | 150 | 12.4% |
| 35 to 39 Minutes | 17 | 1.4% |
| 40 to 44 Minutes | 76 | 6.3% |
| 45 to 59 Minutes | 192 | 15.9% |
| 60 to 89 Minutes | 23 | 1.9% |
| 90 or more Minutes | 40 | 3.3% |
Commute Time by Sex in Albion
The most common commute times in Albion are 45 to 59 minutes (163 commuters, 24.1%) for males and 5 to 9 minutes (140 commuters, 26.4%) for females.
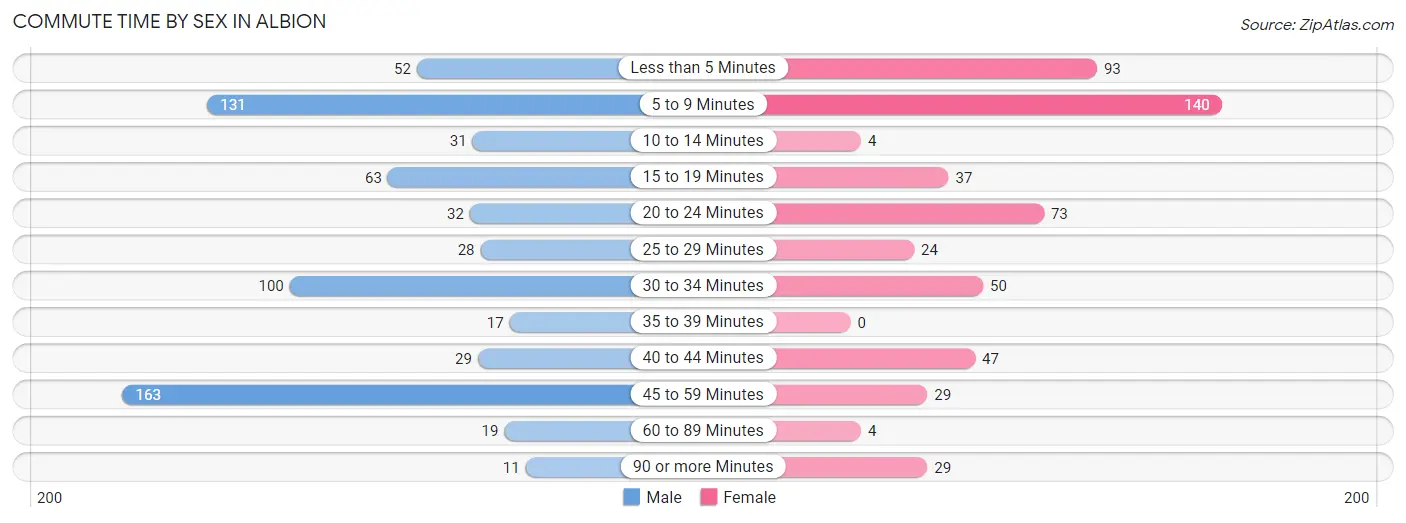
| Commute Time | Male | Female |
| Less than 5 Minutes | 52 (7.7%) | 93 (17.5%) |
| 5 to 9 Minutes | 131 (19.4%) | 140 (26.4%) |
| 10 to 14 Minutes | 31 (4.6%) | 4 (0.7%) |
| 15 to 19 Minutes | 63 (9.3%) | 37 (7.0%) |
| 20 to 24 Minutes | 32 (4.7%) | 73 (13.8%) |
| 25 to 29 Minutes | 28 (4.1%) | 24 (4.5%) |
| 30 to 34 Minutes | 100 (14.8%) | 50 (9.4%) |
| 35 to 39 Minutes | 17 (2.5%) | 0 (0.0%) |
| 40 to 44 Minutes | 29 (4.3%) | 47 (8.9%) |
| 45 to 59 Minutes | 163 (24.1%) | 29 (5.5%) |
| 60 to 89 Minutes | 19 (2.8%) | 4 (0.7%) |
| 90 or more Minutes | 11 (1.6%) | 29 (5.5%) |
Time of Departure to Work by Sex in Albion
The most frequent times of departure to work in Albion are 12:00 AM to 4:59 AM (220, 32.5%) for males and 12:00 AM to 4:59 AM (90, 17.0%) for females.
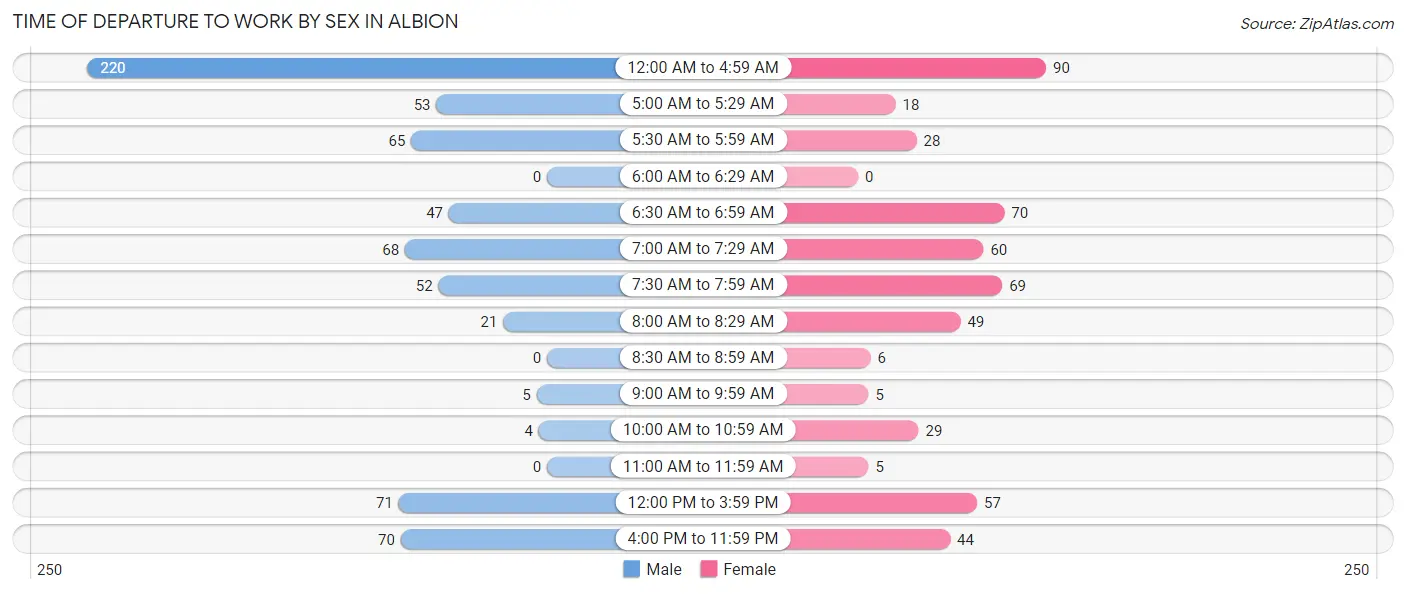
| Time of Departure | Male | Female |
| 12:00 AM to 4:59 AM | 220 (32.5%) | 90 (17.0%) |
| 5:00 AM to 5:29 AM | 53 (7.8%) | 18 (3.4%) |
| 5:30 AM to 5:59 AM | 65 (9.6%) | 28 (5.3%) |
| 6:00 AM to 6:29 AM | 0 (0.0%) | 0 (0.0%) |
| 6:30 AM to 6:59 AM | 47 (7.0%) | 70 (13.2%) |
| 7:00 AM to 7:29 AM | 68 (10.1%) | 60 (11.3%) |
| 7:30 AM to 7:59 AM | 52 (7.7%) | 69 (13.0%) |
| 8:00 AM to 8:29 AM | 21 (3.1%) | 49 (9.2%) |
| 8:30 AM to 8:59 AM | 0 (0.0%) | 6 (1.1%) |
| 9:00 AM to 9:59 AM | 5 (0.7%) | 5 (0.9%) |
| 10:00 AM to 10:59 AM | 4 (0.6%) | 29 (5.5%) |
| 11:00 AM to 11:59 AM | 0 (0.0%) | 5 (0.9%) |
| 12:00 PM to 3:59 PM | 71 (10.5%) | 57 (10.7%) |
| 4:00 PM to 11:59 PM | 70 (10.4%) | 44 (8.3%) |
| Total | 676 (100.0%) | 530 (100.0%) |
Housing Occupancy in Albion
Occupancy by Ownership in Albion
Of the total 865 dwellings in Albion, owner-occupied units account for 512 (59.2%), while renter-occupied units make up 353 (40.8%).
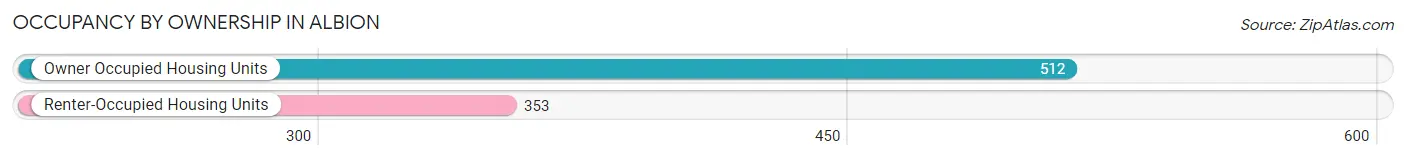
| Occupancy | # Housing Units | % Housing Units |
| Owner Occupied Housing Units | 512 | 59.2% |
| Renter-Occupied Housing Units | 353 | 40.8% |
| Total Occupied Housing Units | 865 | 100.0% |
Occupancy by Household Size in Albion
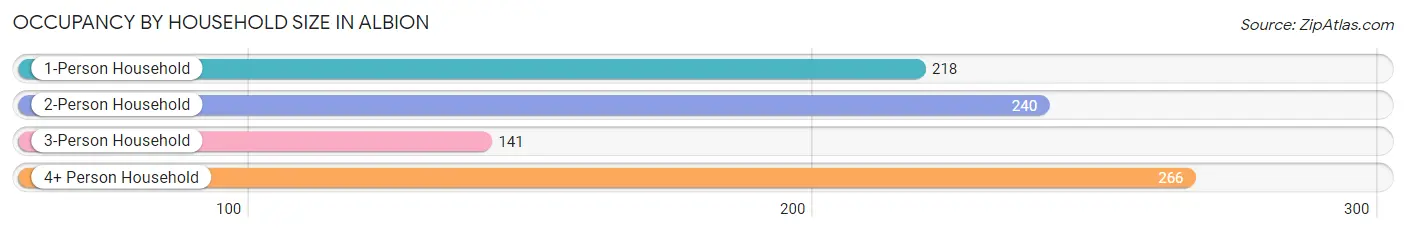
| Household Size | # Housing Units | % Housing Units |
| 1-Person Household | 218 | 25.2% |
| 2-Person Household | 240 | 27.8% |
| 3-Person Household | 141 | 16.3% |
| 4+ Person Household | 266 | 30.7% |
| Total Housing Units | 865 | 100.0% |
Occupancy by Ownership by Household Size in Albion
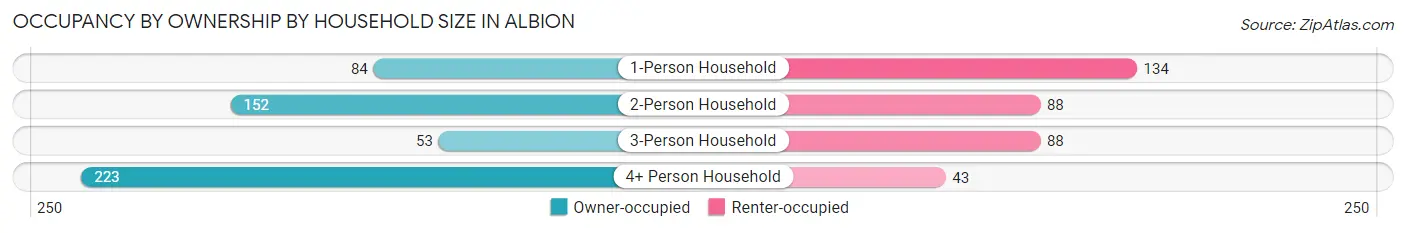
| Household Size | Owner-occupied | Renter-occupied |
| 1-Person Household | 84 (38.5%) | 134 (61.5%) |
| 2-Person Household | 152 (63.3%) | 88 (36.7%) |
| 3-Person Household | 53 (37.6%) | 88 (62.4%) |
| 4+ Person Household | 223 (83.8%) | 43 (16.2%) |
| Total Housing Units | 512 (59.2%) | 353 (40.8%) |
Occupancy by Educational Attainment in Albion
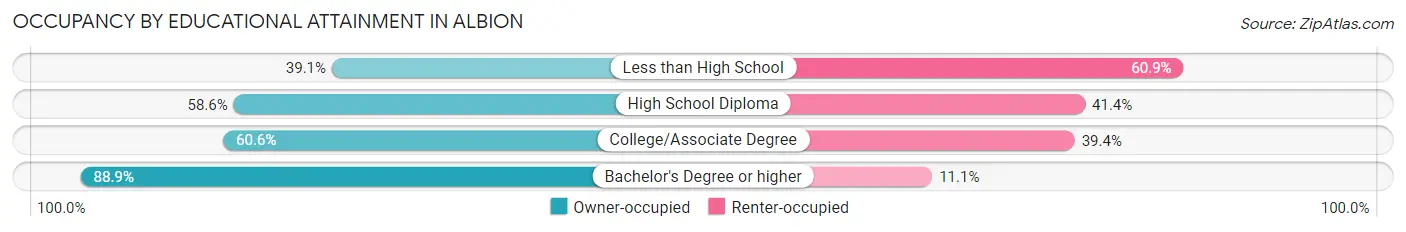
| Household Size | Owner-occupied | Renter-occupied |
| Less than High School | 34 (39.1%) | 53 (60.9%) |
| High School Diploma | 256 (58.6%) | 181 (41.4%) |
| College/Associate Degree | 174 (60.6%) | 113 (39.4%) |
| Bachelor's Degree or higher | 48 (88.9%) | 6 (11.1%) |
Occupancy by Age of Householder in Albion
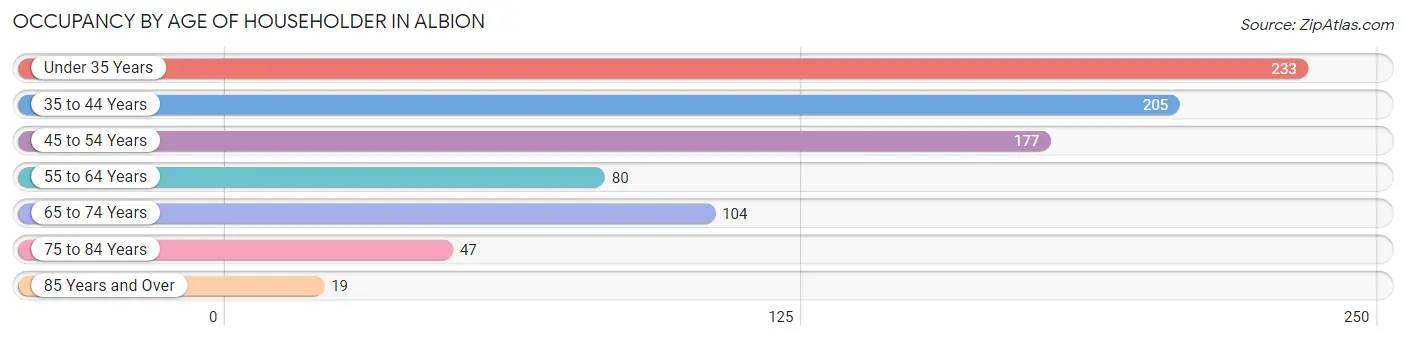
| Age Bracket | # Households | % Households |
| Under 35 Years | 233 | 26.9% |
| 35 to 44 Years | 205 | 23.7% |
| 45 to 54 Years | 177 | 20.5% |
| 55 to 64 Years | 80 | 9.2% |
| 65 to 74 Years | 104 | 12.0% |
| 75 to 84 Years | 47 | 5.4% |
| 85 Years and Over | 19 | 2.2% |
| Total | 865 | 100.0% |
Housing Finances in Albion
Median Income by Occupancy in Albion
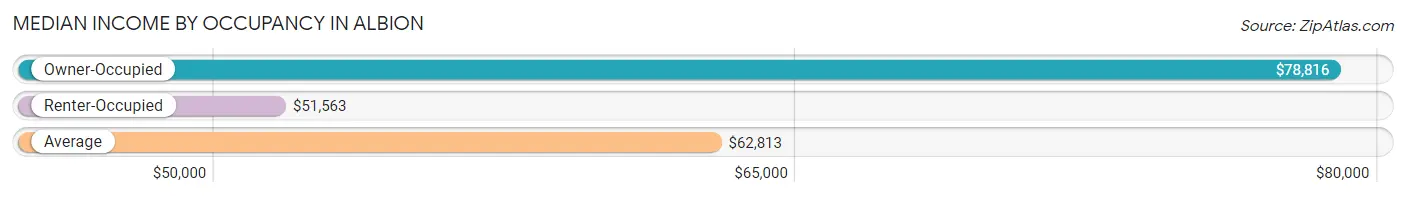
| Occupancy Type | # Households | Median Income |
| Owner-Occupied | 512 (59.2%) | $78,816 |
| Renter-Occupied | 353 (40.8%) | $51,563 |
| Average | 865 (100.0%) | $62,813 |
Occupancy by Householder Income Bracket in Albion
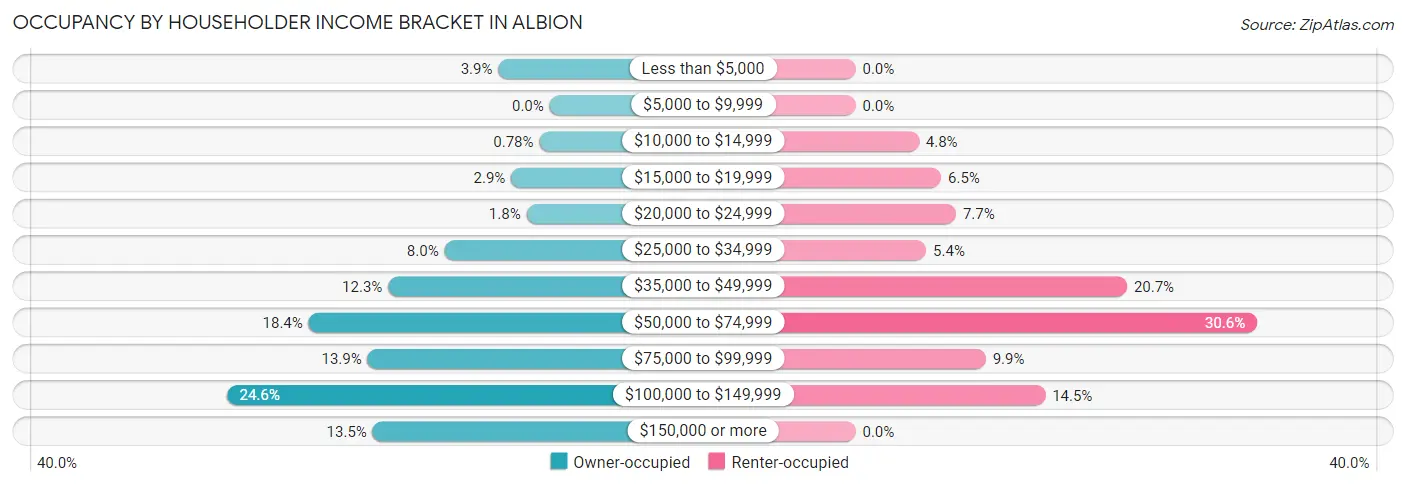
| Income Bracket | Owner-occupied | Renter-occupied |
| Less than $5,000 | 20 (3.9%) | 0 (0.0%) |
| $5,000 to $9,999 | 0 (0.0%) | 0 (0.0%) |
| $10,000 to $14,999 | 4 (0.8%) | 17 (4.8%) |
| $15,000 to $19,999 | 15 (2.9%) | 23 (6.5%) |
| $20,000 to $24,999 | 9 (1.8%) | 27 (7.6%) |
| $25,000 to $34,999 | 41 (8.0%) | 19 (5.4%) |
| $35,000 to $49,999 | 63 (12.3%) | 73 (20.7%) |
| $50,000 to $74,999 | 94 (18.4%) | 108 (30.6%) |
| $75,000 to $99,999 | 71 (13.9%) | 35 (9.9%) |
| $100,000 to $149,999 | 126 (24.6%) | 51 (14.4%) |
| $150,000 or more | 69 (13.5%) | 0 (0.0%) |
| Total | 512 (100.0%) | 353 (100.0%) |
Monthly Housing Cost Tiers in Albion
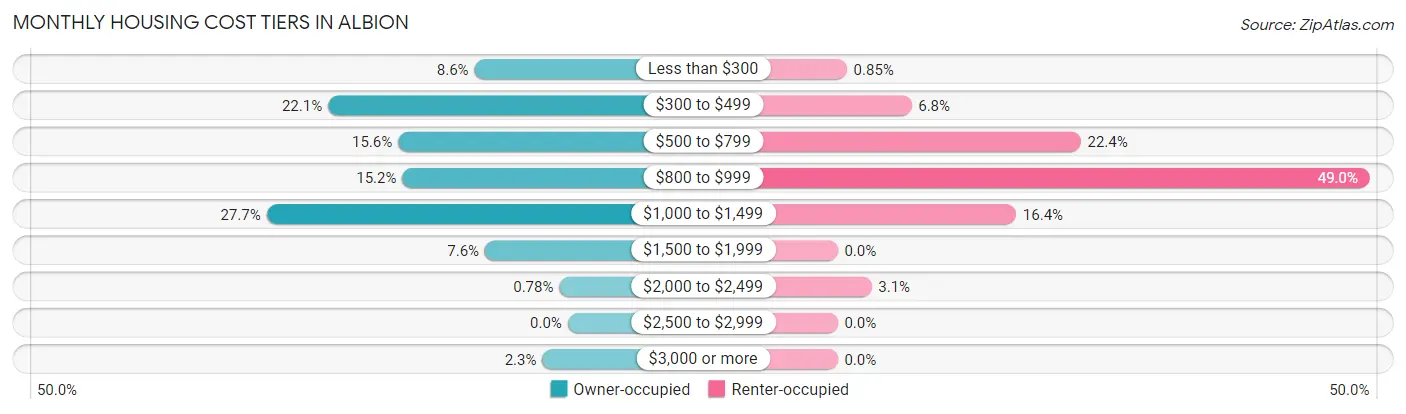
| Monthly Cost | Owner-occupied | Renter-occupied |
| Less than $300 | 44 (8.6%) | 3 (0.9%) |
| $300 to $499 | 113 (22.1%) | 24 (6.8%) |
| $500 to $799 | 80 (15.6%) | 79 (22.4%) |
| $800 to $999 | 78 (15.2%) | 173 (49.0%) |
| $1,000 to $1,499 | 142 (27.7%) | 58 (16.4%) |
| $1,500 to $1,999 | 39 (7.6%) | 0 (0.0%) |
| $2,000 to $2,499 | 4 (0.8%) | 11 (3.1%) |
| $2,500 to $2,999 | 0 (0.0%) | 0 (0.0%) |
| $3,000 or more | 12 (2.3%) | 0 (0.0%) |
| Total | 512 (100.0%) | 353 (100.0%) |
Physical Housing Characteristics in Albion
Housing Structures in Albion
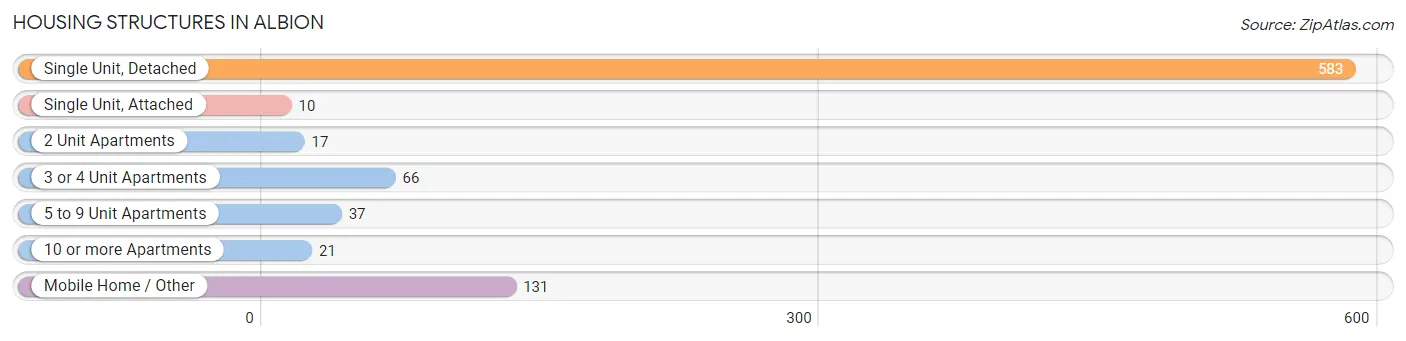
| Structure Type | # Housing Units | % Housing Units |
| Single Unit, Detached | 583 | 67.4% |
| Single Unit, Attached | 10 | 1.2% |
| 2 Unit Apartments | 17 | 2.0% |
| 3 or 4 Unit Apartments | 66 | 7.6% |
| 5 to 9 Unit Apartments | 37 | 4.3% |
| 10 or more Apartments | 21 | 2.4% |
| Mobile Home / Other | 131 | 15.1% |
| Total | 865 | 100.0% |
Housing Structures by Occupancy in Albion
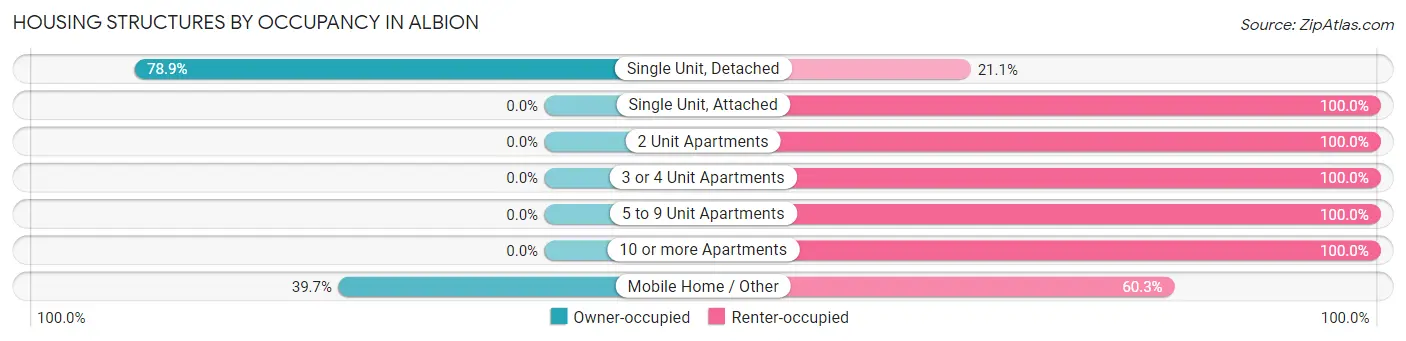
| Structure Type | Owner-occupied | Renter-occupied |
| Single Unit, Detached | 460 (78.9%) | 123 (21.1%) |
| Single Unit, Attached | 0 (0.0%) | 10 (100.0%) |
| 2 Unit Apartments | 0 (0.0%) | 17 (100.0%) |
| 3 or 4 Unit Apartments | 0 (0.0%) | 66 (100.0%) |
| 5 to 9 Unit Apartments | 0 (0.0%) | 37 (100.0%) |
| 10 or more Apartments | 0 (0.0%) | 21 (100.0%) |
| Mobile Home / Other | 52 (39.7%) | 79 (60.3%) |
| Total | 512 (59.2%) | 353 (40.8%) |
Housing Structures by Number of Rooms in Albion
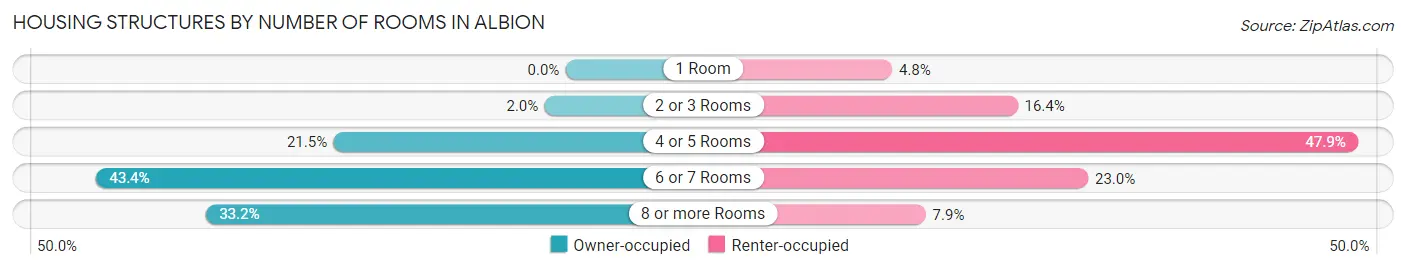
| Number of Rooms | Owner-occupied | Renter-occupied |
| 1 Room | 0 (0.0%) | 17 (4.8%) |
| 2 or 3 Rooms | 10 (1.9%) | 58 (16.4%) |
| 4 or 5 Rooms | 110 (21.5%) | 169 (47.9%) |
| 6 or 7 Rooms | 222 (43.4%) | 81 (23.0%) |
| 8 or more Rooms | 170 (33.2%) | 28 (7.9%) |
| Total | 512 (100.0%) | 353 (100.0%) |
Housing Structure by Heating Type in Albion
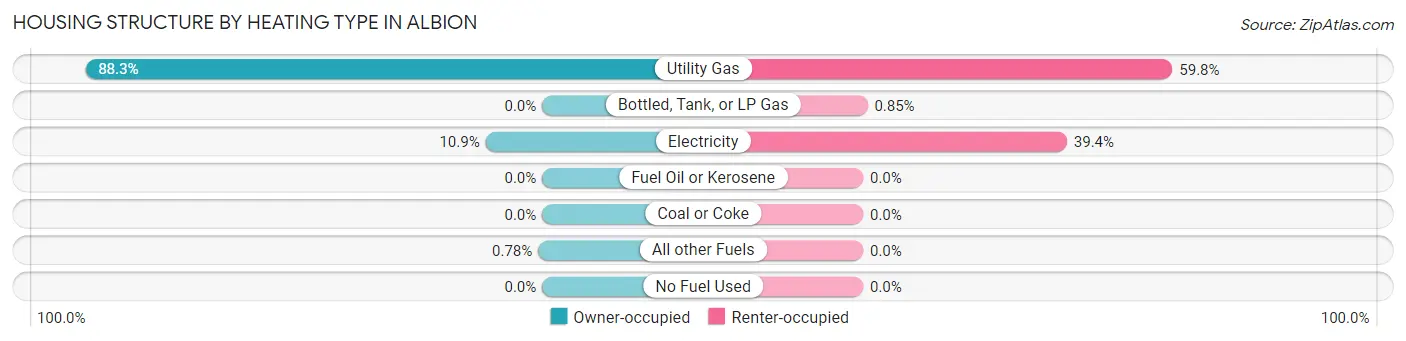
| Heating Type | Owner-occupied | Renter-occupied |
| Utility Gas | 452 (88.3%) | 211 (59.8%) |
| Bottled, Tank, or LP Gas | 0 (0.0%) | 3 (0.9%) |
| Electricity | 56 (10.9%) | 139 (39.4%) |
| Fuel Oil or Kerosene | 0 (0.0%) | 0 (0.0%) |
| Coal or Coke | 0 (0.0%) | 0 (0.0%) |
| All other Fuels | 4 (0.8%) | 0 (0.0%) |
| No Fuel Used | 0 (0.0%) | 0 (0.0%) |
| Total | 512 (100.0%) | 353 (100.0%) |
Household Vehicle Usage in Albion
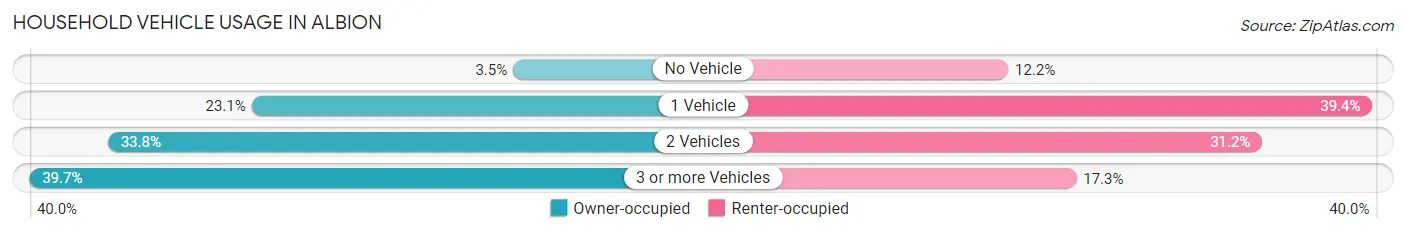
| Vehicles per Household | Owner-occupied | Renter-occupied |
| No Vehicle | 18 (3.5%) | 43 (12.2%) |
| 1 Vehicle | 118 (23.1%) | 139 (39.4%) |
| 2 Vehicles | 173 (33.8%) | 110 (31.2%) |
| 3 or more Vehicles | 203 (39.7%) | 61 (17.3%) |
| Total | 512 (100.0%) | 353 (100.0%) |
Real Estate & Mortgages in Albion
Real Estate and Mortgage Overview in Albion
| Characteristic | Without Mortgage | With Mortgage |
| Housing Units | 204 | 308 |
| Median Property Value | $123,600 | $113,500 |
| Median Household Income | $65,238 | $39 |
| Monthly Housing Costs | $428 | $8 |
| Real Estate Taxes | $584 | $0 |
Property Value by Mortgage Status in Albion
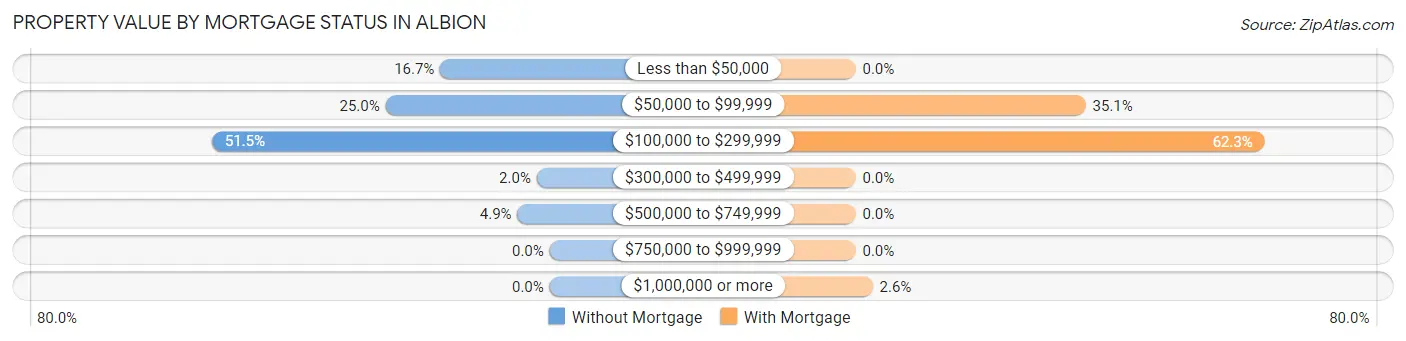
| Property Value | Without Mortgage | With Mortgage |
| Less than $50,000 | 34 (16.7%) | 0 (0.0%) |
| $50,000 to $99,999 | 51 (25.0%) | 108 (35.1%) |
| $100,000 to $299,999 | 105 (51.5%) | 192 (62.3%) |
| $300,000 to $499,999 | 4 (2.0%) | 0 (0.0%) |
| $500,000 to $749,999 | 10 (4.9%) | 0 (0.0%) |
| $750,000 to $999,999 | 0 (0.0%) | 0 (0.0%) |
| $1,000,000 or more | 0 (0.0%) | 8 (2.6%) |
| Total | 204 (100.0%) | 308 (100.0%) |
Household Income by Mortgage Status in Albion
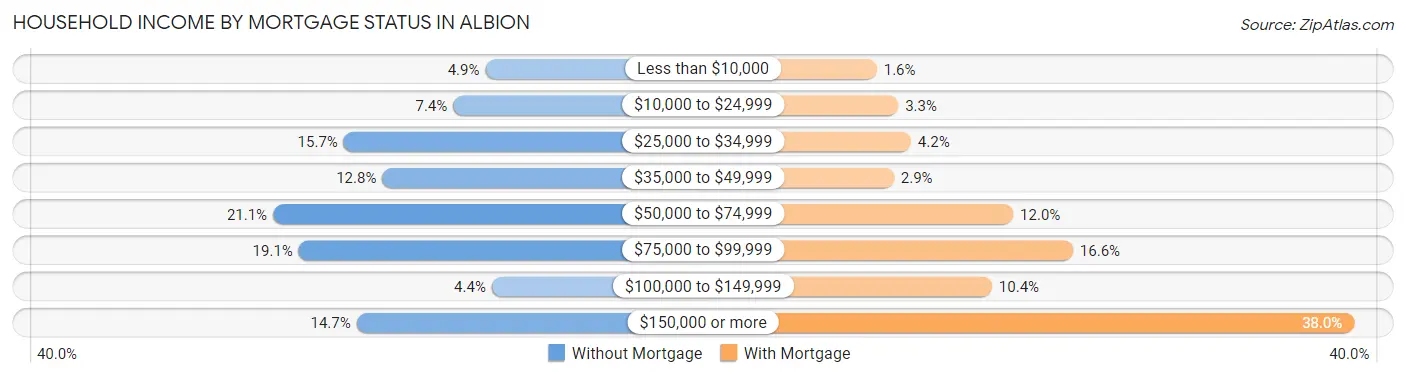
| Household Income | Without Mortgage | With Mortgage |
| Less than $10,000 | 10 (4.9%) | 5 (1.6%) |
| $10,000 to $24,999 | 15 (7.3%) | 10 (3.3%) |
| $25,000 to $34,999 | 32 (15.7%) | 13 (4.2%) |
| $35,000 to $49,999 | 26 (12.8%) | 9 (2.9%) |
| $50,000 to $74,999 | 43 (21.1%) | 37 (12.0%) |
| $75,000 to $99,999 | 39 (19.1%) | 51 (16.6%) |
| $100,000 to $149,999 | 9 (4.4%) | 32 (10.4%) |
| $150,000 or more | 30 (14.7%) | 117 (38.0%) |
| Total | 204 (100.0%) | 308 (100.0%) |
Property Value to Household Income Ratio in Albion
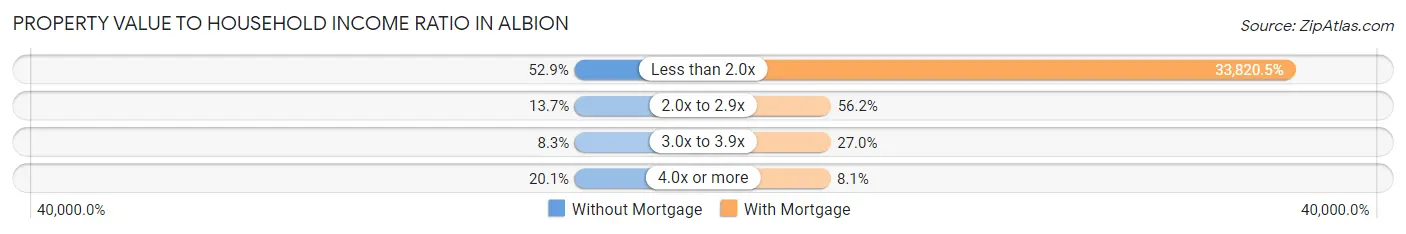
| Value-to-Income Ratio | Without Mortgage | With Mortgage |
| Less than 2.0x | 108 (52.9%) | 104,167 (33,820.4%) |
| 2.0x to 2.9x | 28 (13.7%) | 173 (56.2%) |
| 3.0x to 3.9x | 17 (8.3%) | 83 (27.0%) |
| 4.0x or more | 41 (20.1%) | 25 (8.1%) |
| Total | 204 (100.0%) | 308 (100.0%) |
Real Estate Taxes by Mortgage Status in Albion
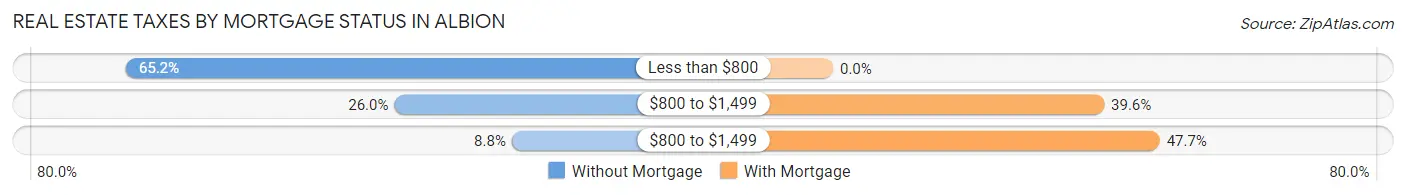
| Property Taxes | Without Mortgage | With Mortgage |
| Less than $800 | 133 (65.2%) | 0 (0.0%) |
| $800 to $1,499 | 53 (26.0%) | 122 (39.6%) |
| $800 to $1,499 | 18 (8.8%) | 147 (47.7%) |
| Total | 204 (100.0%) | 308 (100.0%) |
Health & Disability in Albion
Health Insurance Coverage by Age in Albion
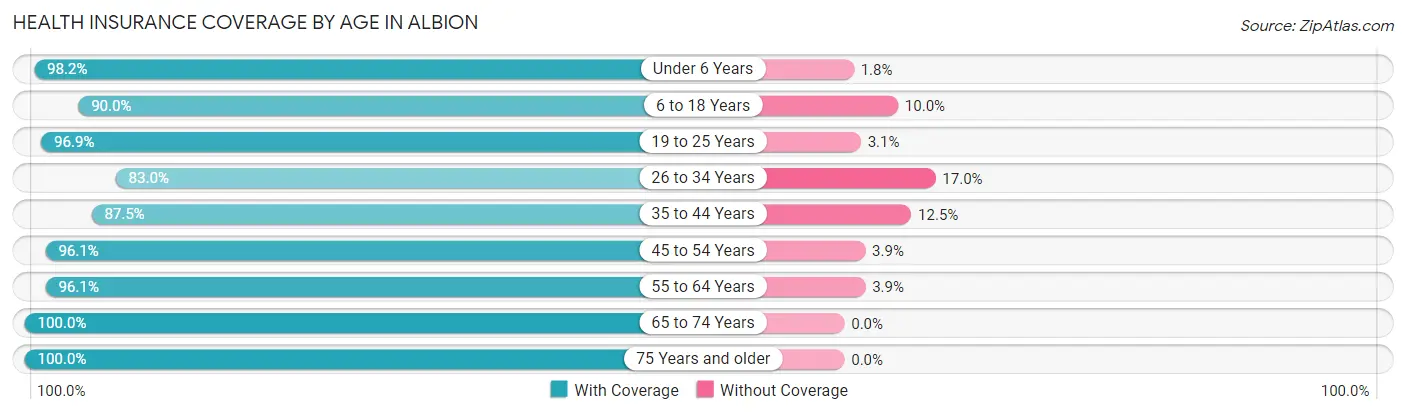
| Age Bracket | With Coverage | Without Coverage |
| Under 6 Years | 334 (98.2%) | 6 (1.8%) |
| 6 to 18 Years | 594 (90.0%) | 66 (10.0%) |
| 19 to 25 Years | 253 (96.9%) | 8 (3.1%) |
| 26 to 34 Years | 215 (83.0%) | 44 (17.0%) |
| 35 to 44 Years | 316 (87.5%) | 45 (12.5%) |
| 45 to 54 Years | 321 (96.1%) | 13 (3.9%) |
| 55 to 64 Years | 148 (96.1%) | 6 (3.9%) |
| 65 to 74 Years | 177 (100.0%) | 0 (0.0%) |
| 75 Years and older | 82 (100.0%) | 0 (0.0%) |
| Total | 2,440 (92.8%) | 188 (7.1%) |
Health Insurance Coverage by Citizenship Status in Albion
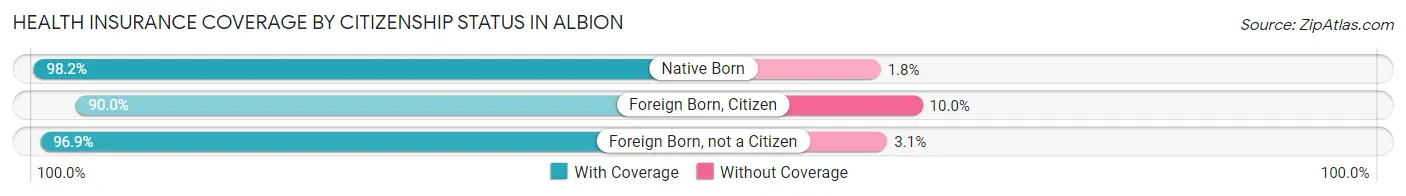
| Citizenship Status | With Coverage | Without Coverage |
| Native Born | 334 (98.2%) | 6 (1.8%) |
| Foreign Born, Citizen | 594 (90.0%) | 66 (10.0%) |
| Foreign Born, not a Citizen | 253 (96.9%) | 8 (3.1%) |
Health Insurance Coverage by Household Income in Albion
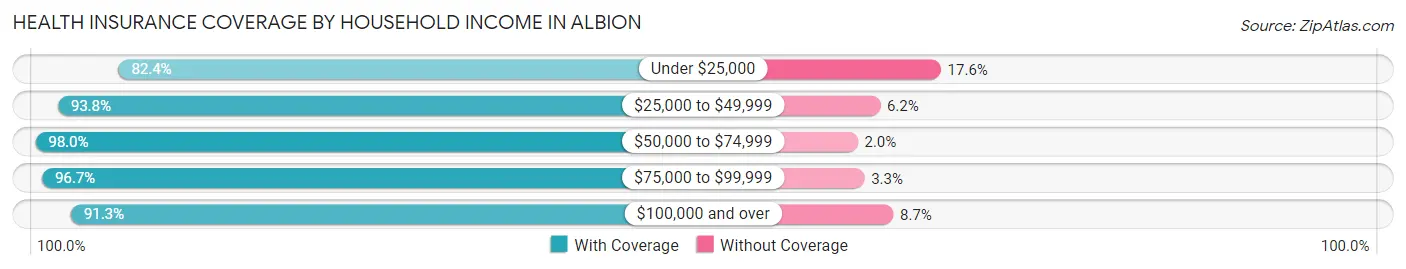
| Household Income | With Coverage | Without Coverage |
| Under $25,000 | 178 (82.4%) | 38 (17.6%) |
| $25,000 to $49,999 | 437 (93.8%) | 29 (6.2%) |
| $50,000 to $74,999 | 439 (98.0%) | 9 (2.0%) |
| $75,000 to $99,999 | 297 (96.7%) | 10 (3.3%) |
| $100,000 and over | 1,074 (91.3%) | 102 (8.7%) |
Public vs Private Health Insurance Coverage by Age in Albion
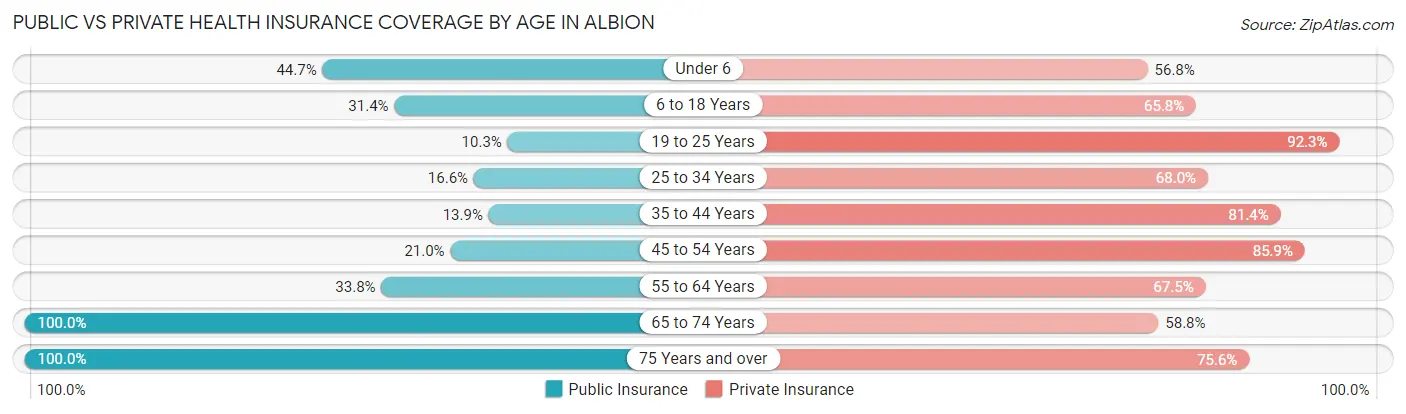
| Age Bracket | Public Insurance | Private Insurance |
| Under 6 | 152 (44.7%) | 193 (56.8%) |
| 6 to 18 Years | 207 (31.4%) | 434 (65.8%) |
| 19 to 25 Years | 27 (10.3%) | 241 (92.3%) |
| 25 to 34 Years | 43 (16.6%) | 176 (67.9%) |
| 35 to 44 Years | 50 (13.9%) | 294 (81.4%) |
| 45 to 54 Years | 70 (21.0%) | 287 (85.9%) |
| 55 to 64 Years | 52 (33.8%) | 104 (67.5%) |
| 65 to 74 Years | 177 (100.0%) | 104 (58.8%) |
| 75 Years and over | 82 (100.0%) | 62 (75.6%) |
| Total | 860 (32.7%) | 1,895 (72.1%) |
Disability Status by Sex by Age in Albion
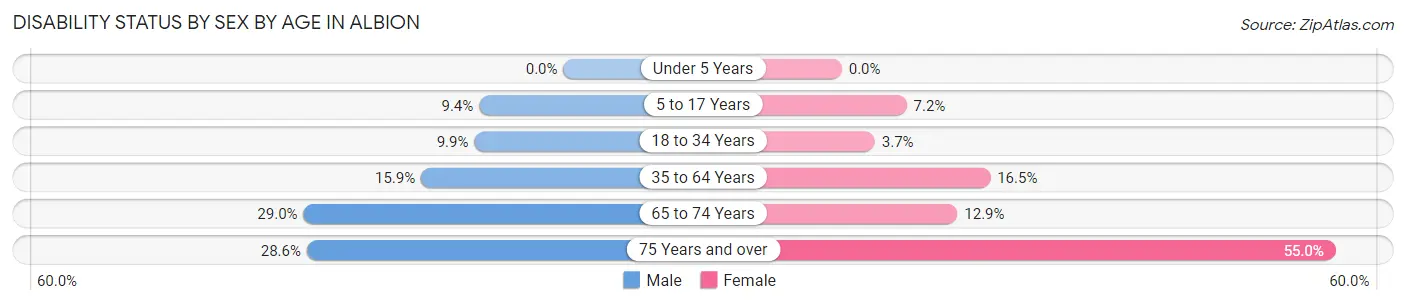
| Age Bracket | Male | Female |
| Under 5 Years | 0 (0.0%) | 0 (0.0%) |
| 5 to 17 Years | 30 (9.4%) | 27 (7.2%) |
| 18 to 34 Years | 36 (9.9%) | 7 (3.7%) |
| 35 to 64 Years | 55 (15.9%) | 83 (16.5%) |
| 65 to 74 Years | 22 (28.9%) | 13 (12.9%) |
| 75 Years and over | 12 (28.6%) | 22 (55.0%) |
Disability Class by Sex by Age in Albion
Disability Class: Hearing Difficulty
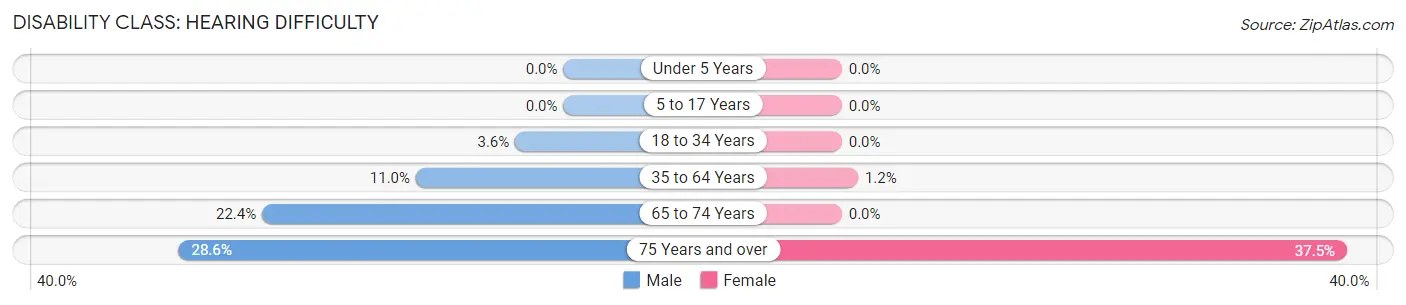
| Age Bracket | Male | Female |
| Under 5 Years | 0 (0.0%) | 0 (0.0%) |
| 5 to 17 Years | 0 (0.0%) | 0 (0.0%) |
| 18 to 34 Years | 13 (3.6%) | 0 (0.0%) |
| 35 to 64 Years | 38 (11.0%) | 6 (1.2%) |
| 65 to 74 Years | 17 (22.4%) | 0 (0.0%) |
| 75 Years and over | 12 (28.6%) | 15 (37.5%) |
Disability Class: Vision Difficulty
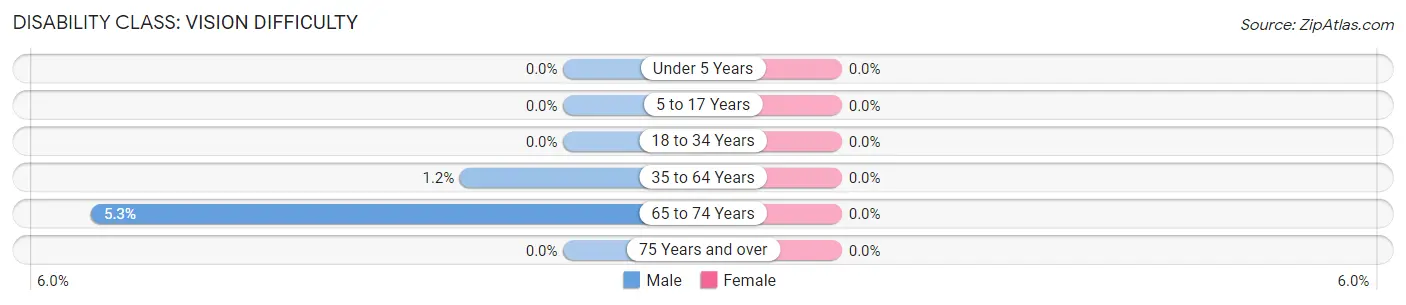
| Age Bracket | Male | Female |
| Under 5 Years | 0 (0.0%) | 0 (0.0%) |
| 5 to 17 Years | 0 (0.0%) | 0 (0.0%) |
| 18 to 34 Years | 0 (0.0%) | 0 (0.0%) |
| 35 to 64 Years | 4 (1.1%) | 0 (0.0%) |
| 65 to 74 Years | 4 (5.3%) | 0 (0.0%) |
| 75 Years and over | 0 (0.0%) | 0 (0.0%) |
Disability Class: Cognitive Difficulty
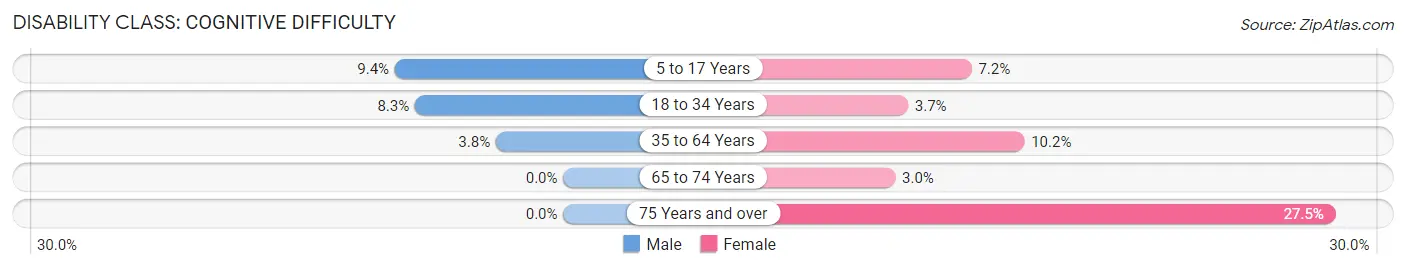
| Age Bracket | Male | Female |
| 5 to 17 Years | 30 (9.4%) | 27 (7.2%) |
| 18 to 34 Years | 30 (8.3%) | 7 (3.7%) |
| 35 to 64 Years | 13 (3.7%) | 51 (10.2%) |
| 65 to 74 Years | 0 (0.0%) | 3 (3.0%) |
| 75 Years and over | 0 (0.0%) | 11 (27.5%) |
Disability Class: Ambulatory Difficulty
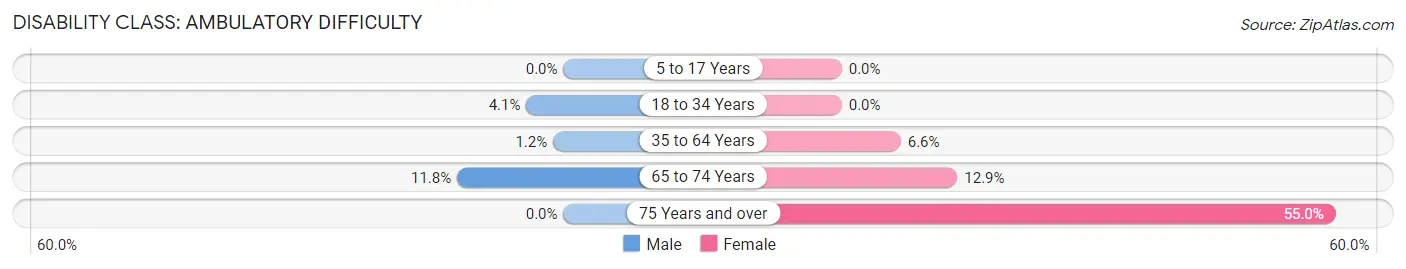
| Age Bracket | Male | Female |
| 5 to 17 Years | 0 (0.0%) | 0 (0.0%) |
| 18 to 34 Years | 15 (4.1%) | 0 (0.0%) |
| 35 to 64 Years | 4 (1.1%) | 33 (6.6%) |
| 65 to 74 Years | 9 (11.8%) | 13 (12.9%) |
| 75 Years and over | 0 (0.0%) | 22 (55.0%) |
Disability Class: Self-Care Difficulty
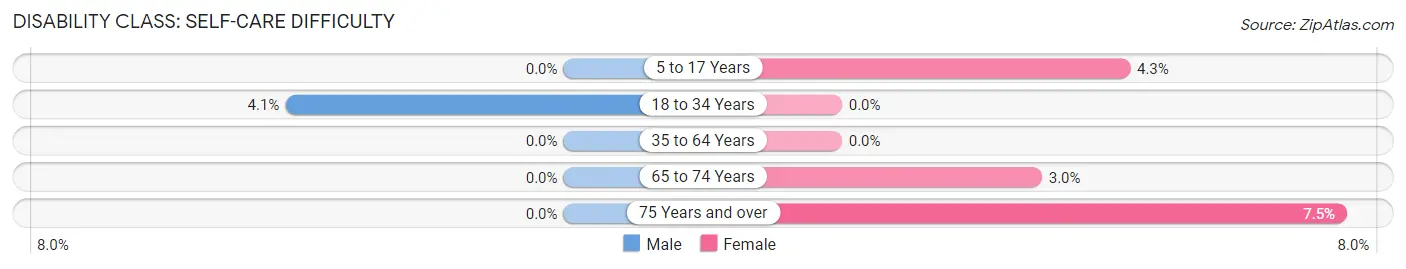
| Age Bracket | Male | Female |
| 5 to 17 Years | 0 (0.0%) | 16 (4.3%) |
| 18 to 34 Years | 15 (4.1%) | 0 (0.0%) |
| 35 to 64 Years | 0 (0.0%) | 0 (0.0%) |
| 65 to 74 Years | 0 (0.0%) | 3 (3.0%) |
| 75 Years and over | 0 (0.0%) | 3 (7.5%) |
Technology Access in Albion
Computing Device Access in Albion
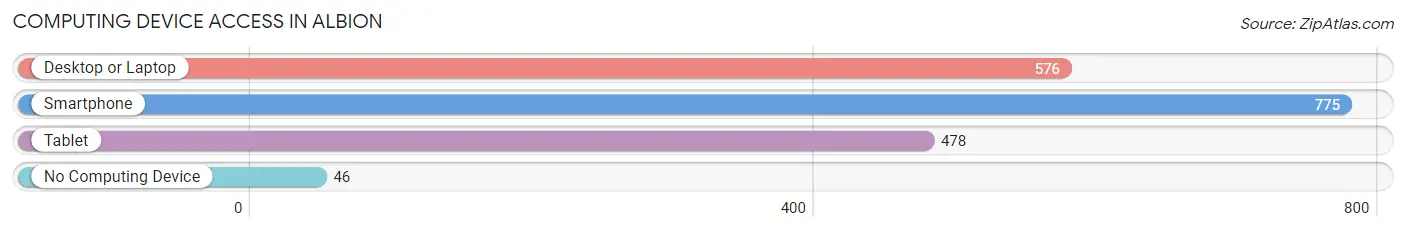
| Device Type | # Households | % Households |
| Desktop or Laptop | 576 | 66.6% |
| Smartphone | 775 | 89.6% |
| Tablet | 478 | 55.3% |
| No Computing Device | 46 | 5.3% |
| Total | 865 | 100.0% |
Internet Access in Albion
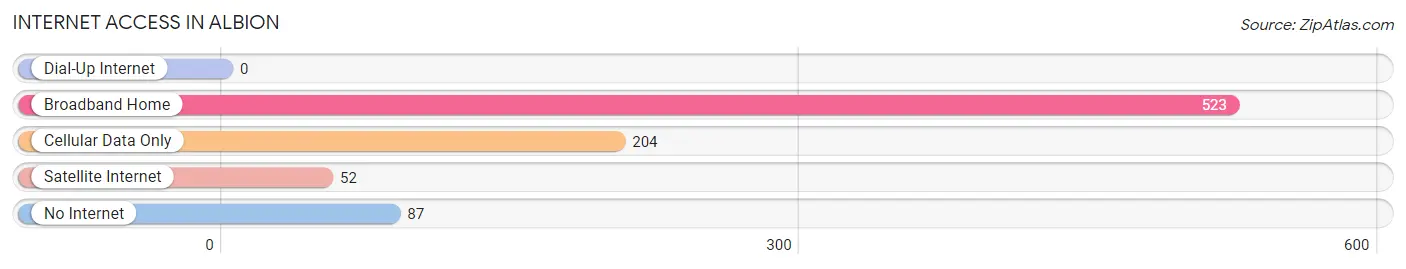
| Internet Type | # Households | % Households |
| Dial-Up Internet | 0 | 0.0% |
| Broadband Home | 523 | 60.5% |
| Cellular Data Only | 204 | 23.6% |
| Satellite Internet | 52 | 6.0% |
| No Internet | 87 | 10.1% |
| Total | 865 | 100.0% |
Albion Summary
Albion, Indiana is a small town located in Noble County in the northeastern part of the state. It is situated on the banks of the Elkhart River, about 20 miles south of Fort Wayne. The town was founded in 1836 and has a population of approximately 2,500 people.
Geography
Albion is located in the northern part of Noble County, Indiana. It is situated on the banks of the Elkhart River, about 20 miles south of Fort Wayne. The town is surrounded by rolling hills and farmland, and is located in the heart of Amish country. The town is also close to several lakes, including Lake Wawasee, Lake James, and Lake Tippecanoe.
The climate in Albion is typical of the Midwest, with hot summers and cold winters. The average temperature in the summer is around 75 degrees Fahrenheit, and the average temperature in the winter is around 25 degrees Fahrenheit. The town receives an average of 40 inches of precipitation each year.
Economy
Albion’s economy is largely based on agriculture and manufacturing. The town is home to several large agricultural businesses, including a dairy farm, a hog farm, and a grain elevator. The town also has several small businesses, including a hardware store, a grocery store, and a restaurant.
The town is also home to several manufacturing companies, including a furniture factory, a plastics factory, and a metal fabrication plant. These companies provide jobs for many of the town’s residents.
Demographics
As of the 2010 census, the population of Albion was 2,521. The racial makeup of the town was 97.3% White, 0.7% African American, 0.2% Native American, 0.3% Asian, 0.1% Pacific Islander, 0.4% from other races, and 1.0% from two or more races. Hispanic or Latino of any race were 1.3% of the population.
The median household income in Albion was $41,250, and the median family income was $50,000. The per capita income for the town was $20,845. About 11.2% of families and 14.2% of the population were below the poverty line, including 18.2% of those under age 18 and 8.2% of those age 65 or over.
History
Albion was founded in 1836 by a group of settlers from Ohio. The town was named after the ancient city of Albion, which was located in England. The town was originally a farming community, and the settlers grew corn, wheat, and other crops.
In the late 19th century, the town began to grow and develop. The railroad arrived in 1882, and the town became a hub for shipping and transportation. The town also became a center for manufacturing, with several factories opening in the area.
In the early 20th century, the town continued to grow and develop. The town was home to several schools, churches, and businesses. The town also had a movie theater, a library, and a hospital.
Albion has remained a small town throughout its history. The town has seen some growth in recent years, but it still retains its small-town charm. The town is home to several festivals and events throughout the year, including the Albion Summer Festival and the Albion Fall Festival.
Common Questions
What is Per Capita Income in Albion?
Per Capita income in Albion is $23,512.
What is the Median Family Income in Albion?
Median Family Income in Albion is $77,554.
What is the Median Household income in Albion?
Median Household Income in Albion is $62,813.
What is Income or Wage Gap in Albion?
Income or Wage Gap in Albion is 10.0%.
Women in Albion earn 90.0 cents for every dollar earned by a man.
What is Family Income Deficit in Albion?
Family Income Deficit in Albion is $11,016.
Families that are below poverty line in Albion earn $11,016 less on average than the poverty threshold level.
What is Inequality or Gini Index in Albion?
Inequality or Gini Index in Albion is 0.34.
What is the Total Population of Albion?
Total Population of Albion is 2,835.
What is the Total Male Population of Albion?
Total Male Population of Albion is 1,432.
What is the Total Female Population of Albion?
Total Female Population of Albion is 1,403.
What is the Ratio of Males per 100 Females in Albion?
There are 102.07 Males per 100 Females in Albion.
What is the Ratio of Females per 100 Males in Albion?
There are 97.97 Females per 100 Males in Albion.
What is the Median Population Age in Albion?
Median Population Age in Albion is 29.5 Years.
What is the Average Family Size in Albion
Average Family Size in Albion is 3.6 People.
What is the Average Household Size in Albion
Average Household Size in Albion is 3.0 People.
How Large is the Labor Force in Albion?
There are 1,300 People in the Labor Forcein in Albion.
What is the Percentage of People in the Labor Force in Albion?
66.1% of People are in the Labor Force in Albion.
What is the Unemployment Rate in Albion?
Unemployment Rate in Albion is 1.2%.