Albany, IN Map & Demographics
Albany Map
Albany Overview
$25,910
PER CAPITA INCOME
$57,132
AVG FAMILY INCOME
$53,246
AVG HOUSEHOLD INCOME
33.9%
WAGE / INCOME GAP [ % ]
66.1¢/ $1
WAGE / INCOME GAP [ $ ]
$10,540
FAMILY INCOME DEFICIT
0.34
INEQUALITY / GINI INDEX
2,854
TOTAL POPULATION
1,252
MALE POPULATION
1,602
FEMALE POPULATION
78.15
MALES / 100 FEMALES
127.96
FEMALES / 100 MALES
49.2
MEDIAN AGE
2.6
AVG FAMILY SIZE
2.3
AVG HOUSEHOLD SIZE
1,237
LABOR FORCE [ PEOPLE ]
51.4%
PERCENT IN LABOR FORCE
3.8%
UNEMPLOYMENT RATE
Albany Zip Codes
Albany Area Codes
Income in Albany
Income Overview in Albany
Per Capita Income in Albany is $25,910, while median incomes of families and households are $57,132 and $53,246 respectively.
| Characteristic | Number | Measure |
| Per Capita Income | 2,854 | $25,910 |
| Median Family Income | 853 | $57,132 |
| Mean Family Income | 853 | $67,146 |
| Median Household Income | 1,221 | $53,246 |
| Mean Household Income | 1,221 | $59,214 |
| Income Deficit | 853 | $10,540 |
| Wage / Income Gap (%) | 2,854 | 33.93% |
| Wage / Income Gap ($) | 2,854 | 66.07¢ per $1 |
| Gini / Inequality Index | 2,854 | 0.34 |
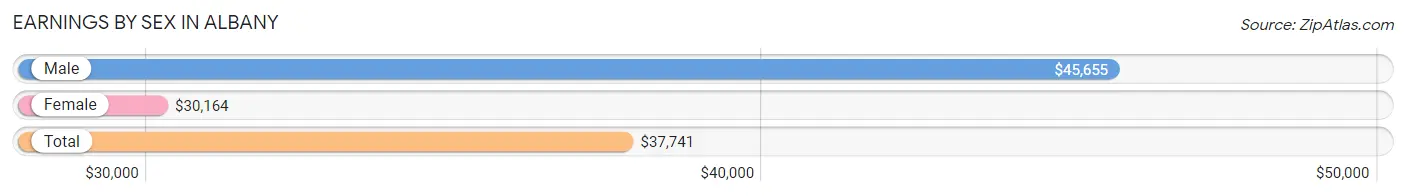
Earnings by Sex in Albany
Average Earnings in Albany are $37,741, $45,655 for men and $30,164 for women, a difference of 33.9%.
| Sex | Number | Average Earnings |
| Male | 570 (44.4%) | $45,655 |
| Female | 713 (55.6%) | $30,164 |
| Total | 1,283 (100.0%) | $37,741 |
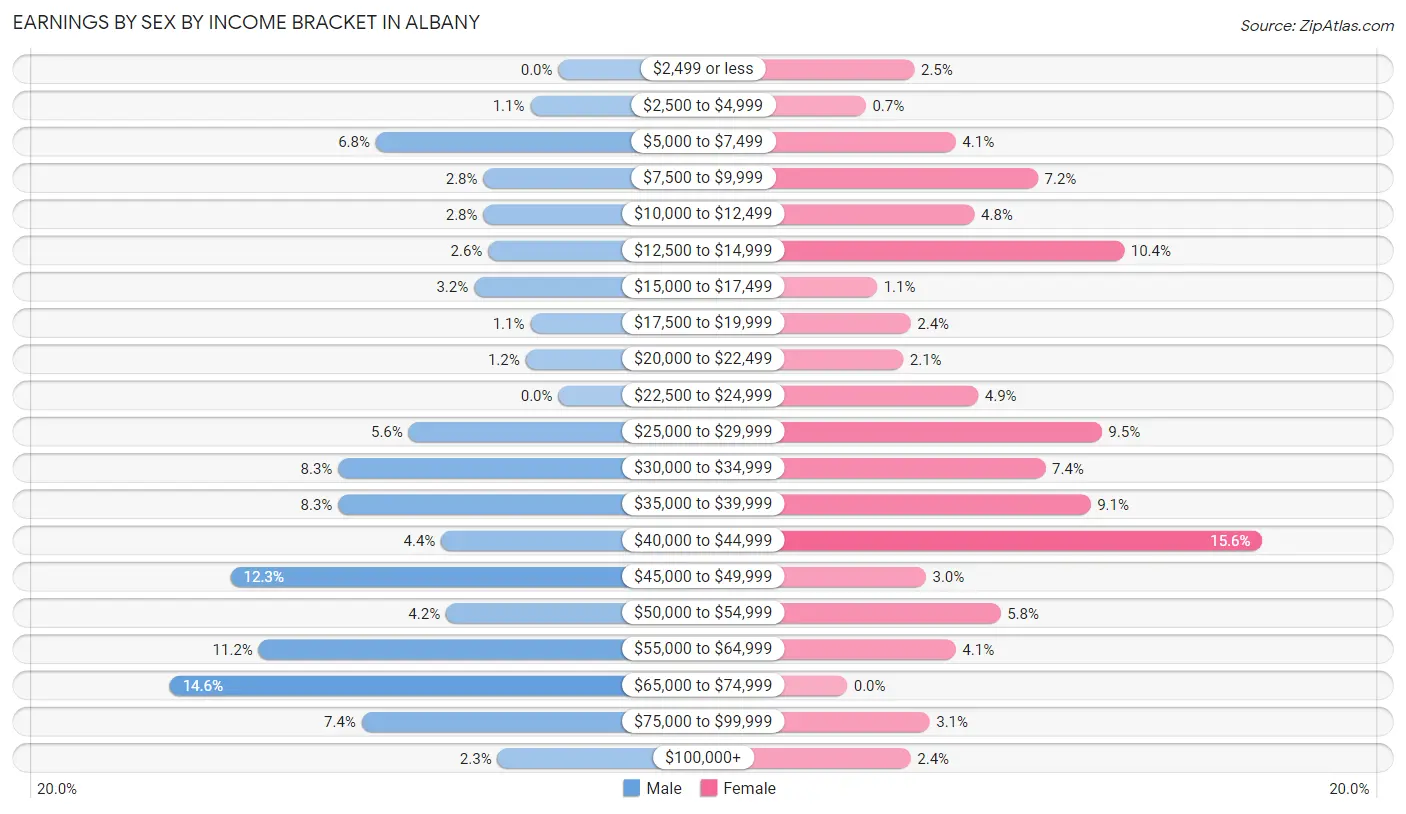
Earnings by Sex by Income Bracket in Albany
The most common earnings brackets in Albany are $65,000 to $74,999 for men (83 | 14.6%) and $40,000 to $44,999 for women (111 | 15.6%).
| Income | Male | Female |
| $2,499 or less | 0 (0.0%) | 18 (2.5%) |
| $2,500 to $4,999 | 6 (1.1%) | 5 (0.7%) |
| $5,000 to $7,499 | 39 (6.8%) | 29 (4.1%) |
| $7,500 to $9,999 | 16 (2.8%) | 51 (7.1%) |
| $10,000 to $12,499 | 16 (2.8%) | 34 (4.8%) |
| $12,500 to $14,999 | 15 (2.6%) | 74 (10.4%) |
| $15,000 to $17,499 | 18 (3.2%) | 8 (1.1%) |
| $17,500 to $19,999 | 6 (1.1%) | 17 (2.4%) |
| $20,000 to $22,499 | 7 (1.2%) | 15 (2.1%) |
| $22,500 to $24,999 | 0 (0.0%) | 35 (4.9%) |
| $25,000 to $29,999 | 32 (5.6%) | 68 (9.5%) |
| $30,000 to $34,999 | 47 (8.3%) | 53 (7.4%) |
| $35,000 to $39,999 | 47 (8.3%) | 65 (9.1%) |
| $40,000 to $44,999 | 25 (4.4%) | 111 (15.6%) |
| $45,000 to $49,999 | 70 (12.3%) | 21 (2.9%) |
| $50,000 to $54,999 | 24 (4.2%) | 41 (5.8%) |
| $55,000 to $64,999 | 64 (11.2%) | 29 (4.1%) |
| $65,000 to $74,999 | 83 (14.6%) | 0 (0.0%) |
| $75,000 to $99,999 | 42 (7.4%) | 22 (3.1%) |
| $100,000+ | 13 (2.3%) | 17 (2.4%) |
| Total | 570 (100.0%) | 713 (100.0%) |
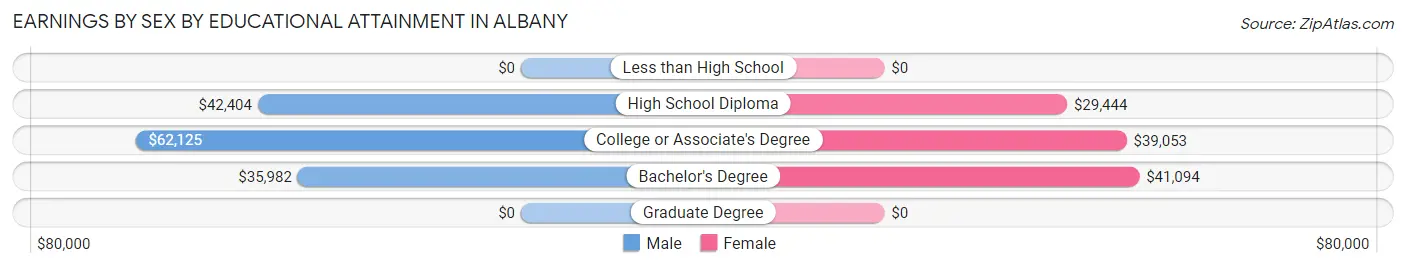
Earnings by Sex by Educational Attainment in Albany
Average earnings in Albany are $47,679 for men and $38,021 for women, a difference of 20.3%. Men with an educational attainment of college or associate's degree enjoy the highest average annual earnings of $62,125, while those with bachelor's degree education earn the least with $35,982. Women with an educational attainment of bachelor's degree earn the most with the average annual earnings of $41,094, while those with high school diploma education have the smallest earnings of $29,444.
| Educational Attainment | Male Income | Female Income |
| Less than High School | - | - |
| High School Diploma | $42,404 | $29,444 |
| College or Associate's Degree | $62,125 | $39,053 |
| Bachelor's Degree | $35,982 | $41,094 |
| Graduate Degree | - | - |
| Total | $47,679 | $38,021 |
Family Income in Albany
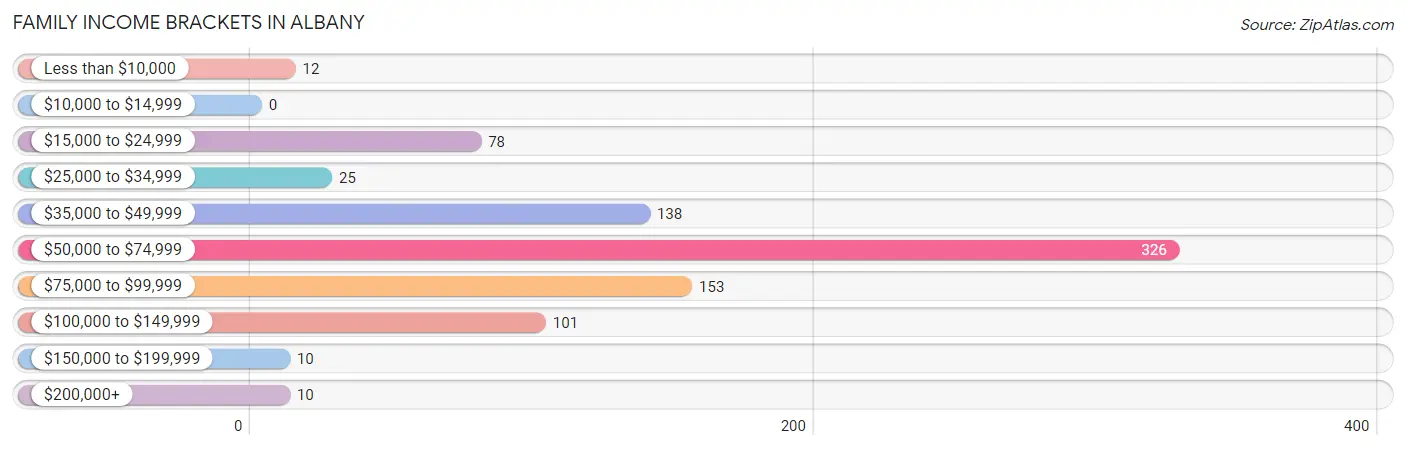
Family Income Brackets in Albany
According to the Albany family income data, there are 326 families falling into the $50,000 to $74,999 income range, which is the most common income bracket and makes up 38.2% of all families.
| Income Bracket | # Families | % Families |
| Less than $10,000 | 12 | 1.4% |
| $10,000 to $14,999 | 0 | 0.0% |
| $15,000 to $24,999 | 78 | 9.1% |
| $25,000 to $34,999 | 25 | 2.9% |
| $35,000 to $49,999 | 138 | 16.2% |
| $50,000 to $74,999 | 326 | 38.2% |
| $75,000 to $99,999 | 153 | 17.9% |
| $100,000 to $149,999 | 101 | 11.8% |
| $150,000 to $199,999 | 10 | 1.2% |
| $200,000+ | 10 | 1.2% |
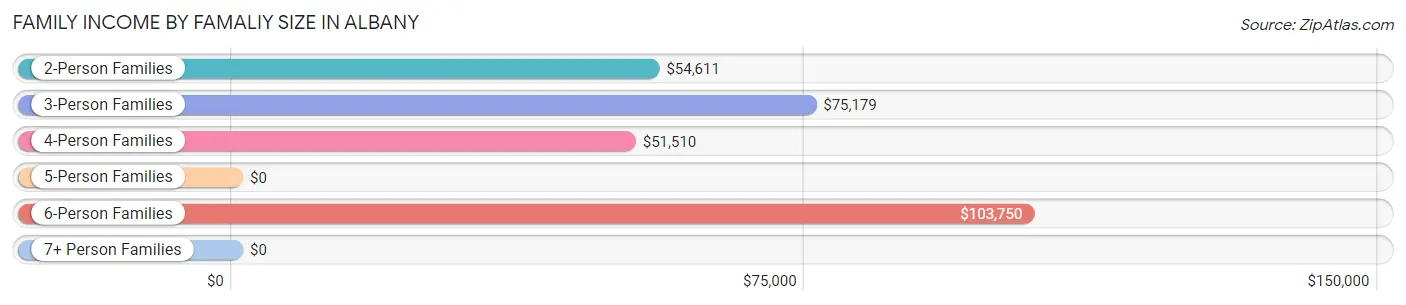
Family Income by Famaliy Size in Albany
6-person families (29 | 3.4%) account for the highest median family income in Albany with $103,750 per family, while 2-person families (553 | 64.8%) have the highest median income of $27,306 per family member.
| Income Bracket | # Families | Median Income |
| 2-Person Families | 553 (64.8%) | $54,611 |
| 3-Person Families | 117 (13.7%) | $75,179 |
| 4-Person Families | 145 (17.0%) | $51,510 |
| 5-Person Families | 4 (0.5%) | $0 |
| 6-Person Families | 29 (3.4%) | $103,750 |
| 7+ Person Families | 5 (0.6%) | $0 |
| Total | 853 (100.0%) | $57,132 |
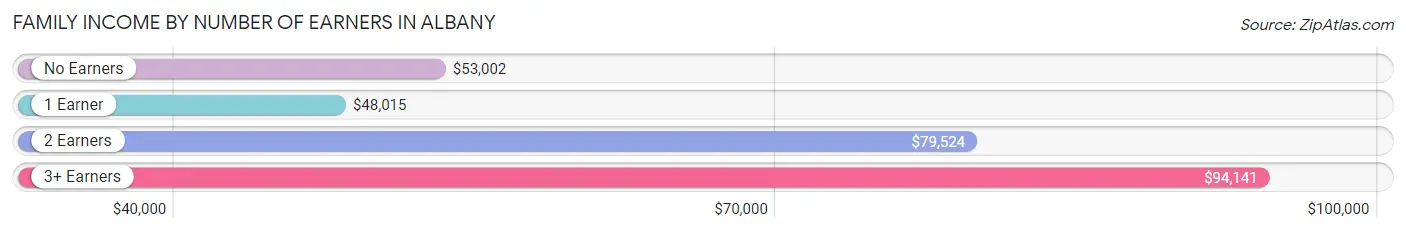
Family Income by Number of Earners in Albany
The median family income in Albany is $57,132, with families comprising 3+ earners (59) having the highest median family income of $94,141, while families with 1 earner (193) have the lowest median family income of $48,015, accounting for 6.9% and 22.6% of families, respectively.
| Number of Earners | # Families | Median Income |
| No Earners | 311 (36.5%) | $53,002 |
| 1 Earner | 193 (22.6%) | $48,015 |
| 2 Earners | 290 (34.0%) | $79,524 |
| 3+ Earners | 59 (6.9%) | $94,141 |
| Total | 853 (100.0%) | $57,132 |
Household Income in Albany
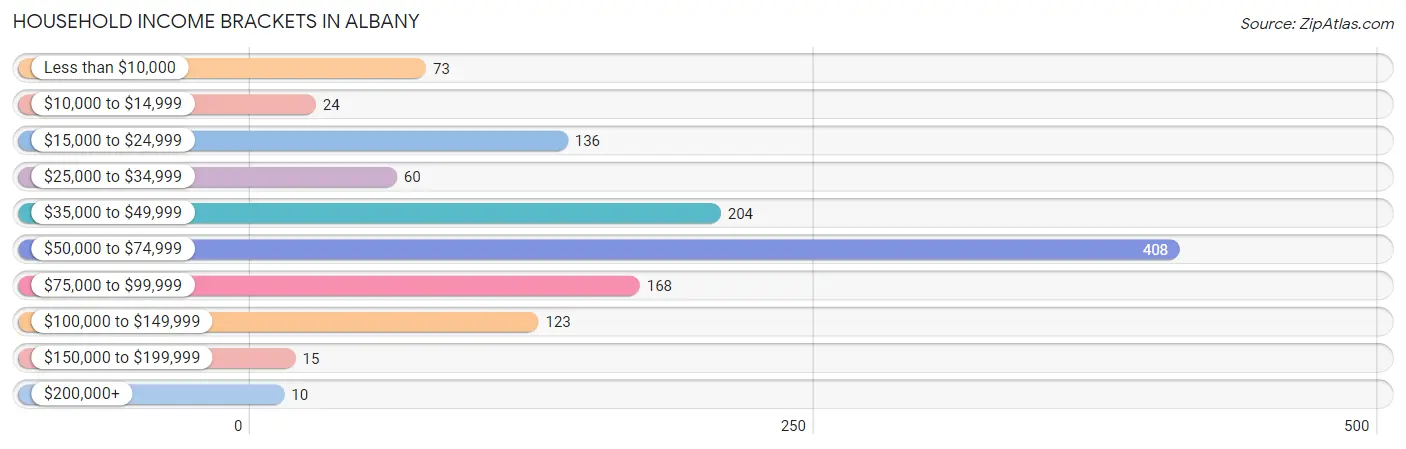
Household Income Brackets in Albany
With 408 households falling in the category, the $50,000 to $74,999 income range is the most frequent in Albany, accounting for 33.4% of all households. In contrast, only 10 households (0.8%) fall into the $200,000+ income bracket, making it the least populous group.
| Income Bracket | # Households | % Households |
| Less than $10,000 | 73 | 6.0% |
| $10,000 to $14,999 | 24 | 2.0% |
| $15,000 to $24,999 | 136 | 11.1% |
| $25,000 to $34,999 | 60 | 4.9% |
| $35,000 to $49,999 | 204 | 16.7% |
| $50,000 to $74,999 | 408 | 33.4% |
| $75,000 to $99,999 | 168 | 13.8% |
| $100,000 to $149,999 | 123 | 10.1% |
| $150,000 to $199,999 | 15 | 1.2% |
| $200,000+ | 10 | 0.8% |
Household Income by Householder Age in Albany
The median household income in Albany is $53,246, with the highest median household income of $62,813 found in the 25 to 44 years age bracket for the primary householder. A total of 237 households (19.4%) fall into this category. Meanwhile, the 15 to 24 years age bracket for the primary householder has the lowest median household income of $0, with 26 households (2.1%) in this group.
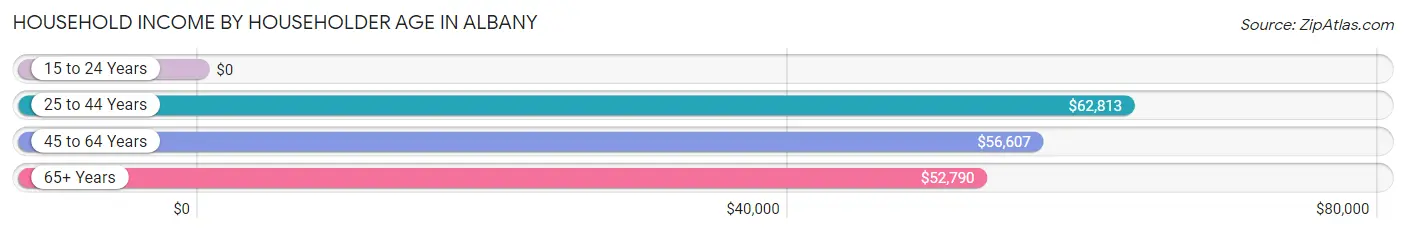
| Income Bracket | # Households | Median Income |
| 15 to 24 Years | 26 (2.1%) | $0 |
| 25 to 44 Years | 237 (19.4%) | $62,813 |
| 45 to 64 Years | 532 (43.6%) | $56,607 |
| 65+ Years | 426 (34.9%) | $52,790 |
| Total | 1,221 (100.0%) | $53,246 |
Poverty in Albany
Income Below Poverty by Sex and Age in Albany
With 9.1% poverty level for males and 8.0% for females among the residents of Albany, 18 to 24 year old males and 75 year old and over females are the most vulnerable to poverty, with 30 males (31.6%) and 33 females (22.9%) in their respective age groups living below the poverty level.
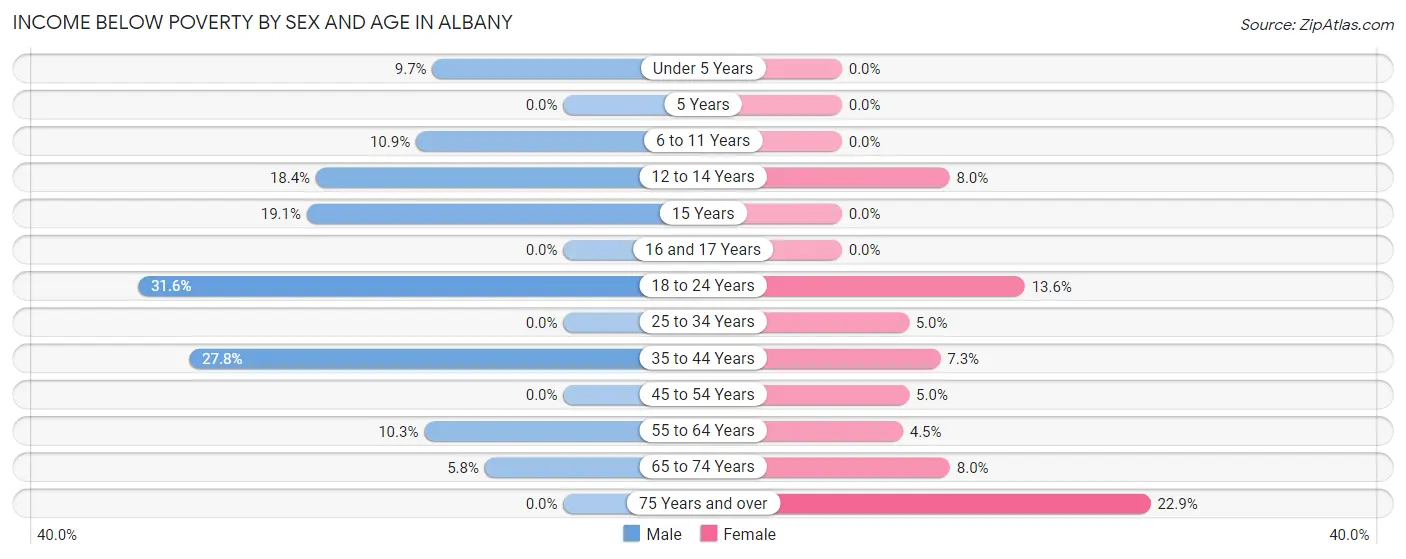
| Age Bracket | Male | Female |
| Under 5 Years | 7 (9.7%) | 0 (0.0%) |
| 5 Years | 0 (0.0%) | 0 (0.0%) |
| 6 to 11 Years | 7 (10.9%) | 0 (0.0%) |
| 12 to 14 Years | 9 (18.4%) | 10 (8.0%) |
| 15 Years | 4 (19.1%) | 0 (0.0%) |
| 16 and 17 Years | 0 (0.0%) | 0 (0.0%) |
| 18 to 24 Years | 30 (31.6%) | 22 (13.6%) |
| 25 to 34 Years | 0 (0.0%) | 8 (5.0%) |
| 35 to 44 Years | 30 (27.8%) | 9 (7.3%) |
| 45 to 54 Years | 0 (0.0%) | 8 (5.0%) |
| 55 to 64 Years | 19 (10.3%) | 14 (4.5%) |
| 65 to 74 Years | 6 (5.8%) | 19 (8.0%) |
| 75 Years and over | 0 (0.0%) | 33 (22.9%) |
| Total | 112 (9.1%) | 123 (8.0%) |
Income Above Poverty by Sex and Age in Albany
According to the poverty statistics in Albany, males aged 5 years and females aged under 5 years are the age groups that are most secure financially, with 100.0% of males and 100.0% of females in these age groups living above the poverty line.
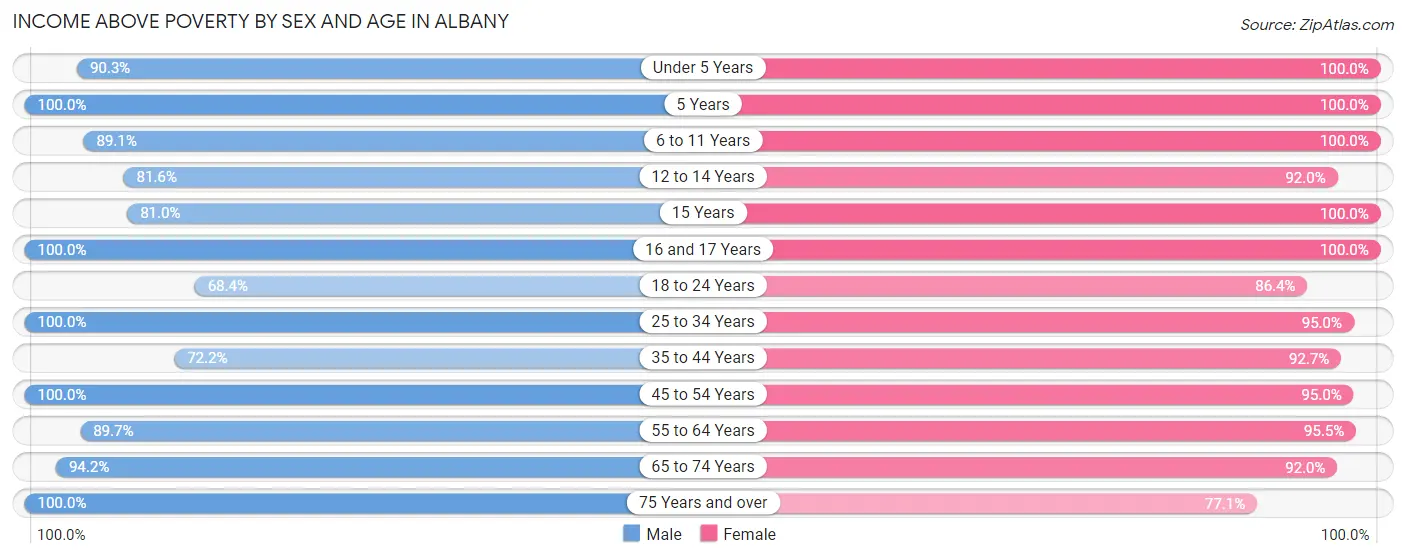
| Age Bracket | Male | Female |
| Under 5 Years | 65 (90.3%) | 15 (100.0%) |
| 5 Years | 5 (100.0%) | 7 (100.0%) |
| 6 to 11 Years | 57 (89.1%) | 56 (100.0%) |
| 12 to 14 Years | 40 (81.6%) | 115 (92.0%) |
| 15 Years | 17 (80.9%) | 31 (100.0%) |
| 16 and 17 Years | 16 (100.0%) | 4 (100.0%) |
| 18 to 24 Years | 65 (68.4%) | 140 (86.4%) |
| 25 to 34 Years | 154 (100.0%) | 153 (95.0%) |
| 35 to 44 Years | 78 (72.2%) | 114 (92.7%) |
| 45 to 54 Years | 163 (100.0%) | 152 (95.0%) |
| 55 to 64 Years | 165 (89.7%) | 295 (95.5%) |
| 65 to 74 Years | 97 (94.2%) | 218 (92.0%) |
| 75 Years and over | 195 (100.0%) | 111 (77.1%) |
| Total | 1,117 (90.9%) | 1,411 (92.0%) |
Income Below Poverty Among Married-Couple Families in Albany
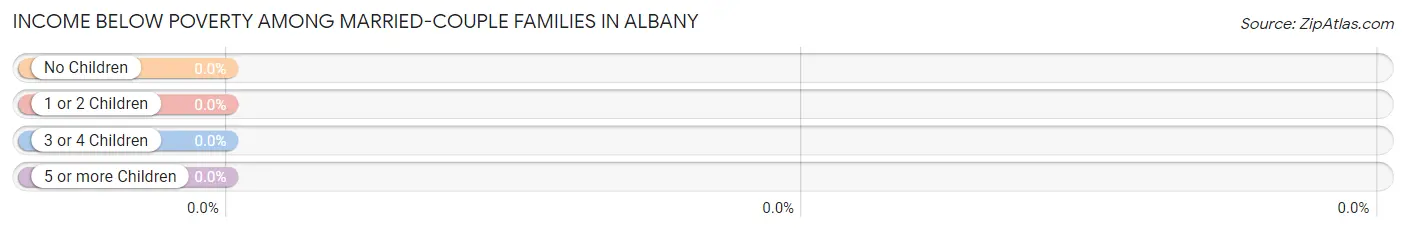
| Children | Above Poverty | Below Poverty |
| No Children | 473 (100.0%) | 0 (0.0%) |
| 1 or 2 Children | 112 (100.0%) | 0 (0.0%) |
| 3 or 4 Children | 23 (100.0%) | 0 (0.0%) |
| 5 or more Children | 5 (100.0%) | 0 (0.0%) |
| Total | 613 (100.0%) | 0 (0.0%) |
Income Below Poverty Among Single-Parent Households in Albany
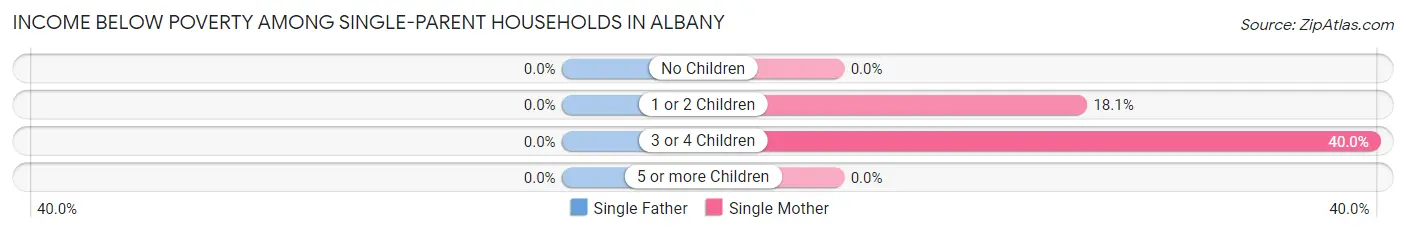
| Children | Single Father | Single Mother |
| No Children | 0 (0.0%) | 0 (0.0%) |
| 1 or 2 Children | 0 (0.0%) | 17 (18.1%) |
| 3 or 4 Children | 0 (0.0%) | 8 (40.0%) |
| 5 or more Children | 0 (0.0%) | 0 (0.0%) |
| Total | 0 (0.0%) | 25 (12.4%) |
Income Below Poverty Among Married-Couple vs Single-Parent Households in Albany
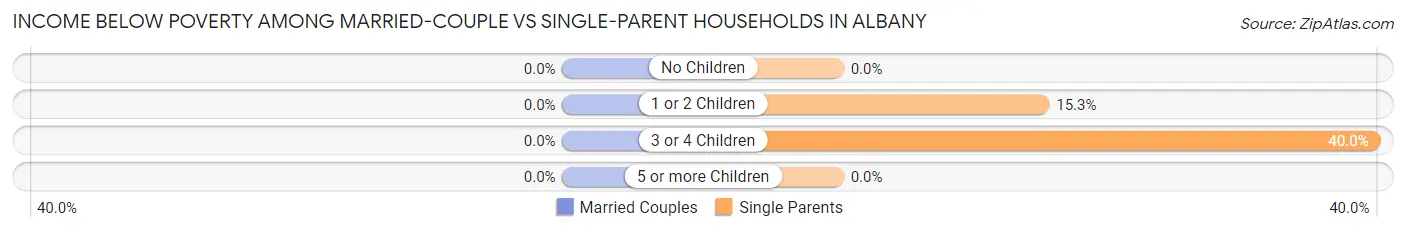
| Children | Married-Couple Families | Single-Parent Households |
| No Children | 0 (0.0%) | 0 (0.0%) |
| 1 or 2 Children | 0 (0.0%) | 17 (15.3%) |
| 3 or 4 Children | 0 (0.0%) | 8 (40.0%) |
| 5 or more Children | 0 (0.0%) | 0 (0.0%) |
| Total | 0 (0.0%) | 25 (10.4%) |
Race in Albany
The most populous races in Albany are White / Caucasian (2,727 | 95.6%), Two or more Races (75 | 2.6%), and Hispanic or Latino (64 | 2.2%).
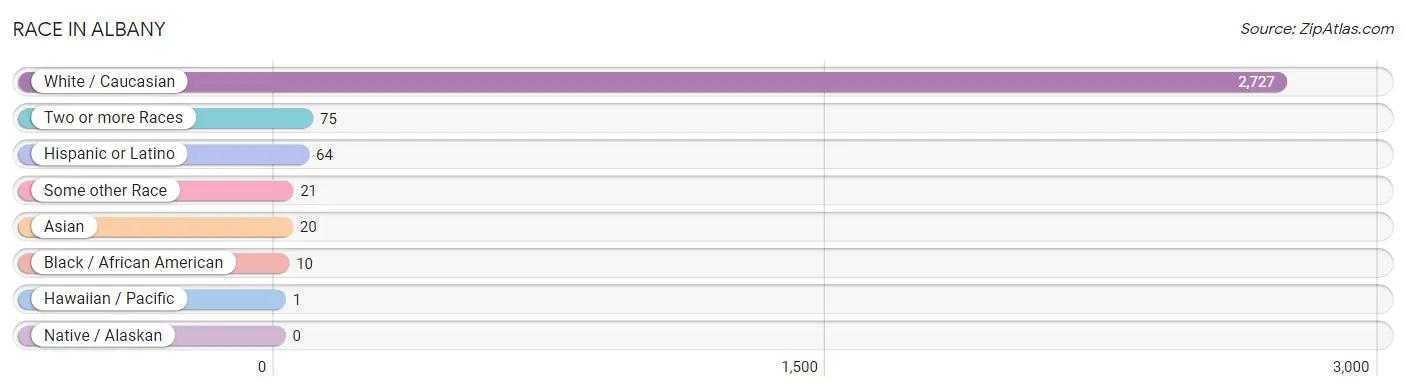
| Race | # Population | % Population |
| Asian | 20 | 0.7% |
| Black / African American | 10 | 0.4% |
| Hawaiian / Pacific | 1 | 0.0% |
| Hispanic or Latino | 64 | 2.2% |
| Native / Alaskan | 0 | 0.0% |
| White / Caucasian | 2,727 | 95.6% |
| Two or more Races | 75 | 2.6% |
| Some other Race | 21 | 0.7% |
| Total | 2,854 | 100.0% |
Ancestry in Albany
The most populous ancestries reported in Albany are German (707 | 24.8%), American (315 | 11.0%), English (282 | 9.9%), Irish (224 | 7.9%), and European (112 | 3.9%), together accounting for 57.5% of all Albany residents.
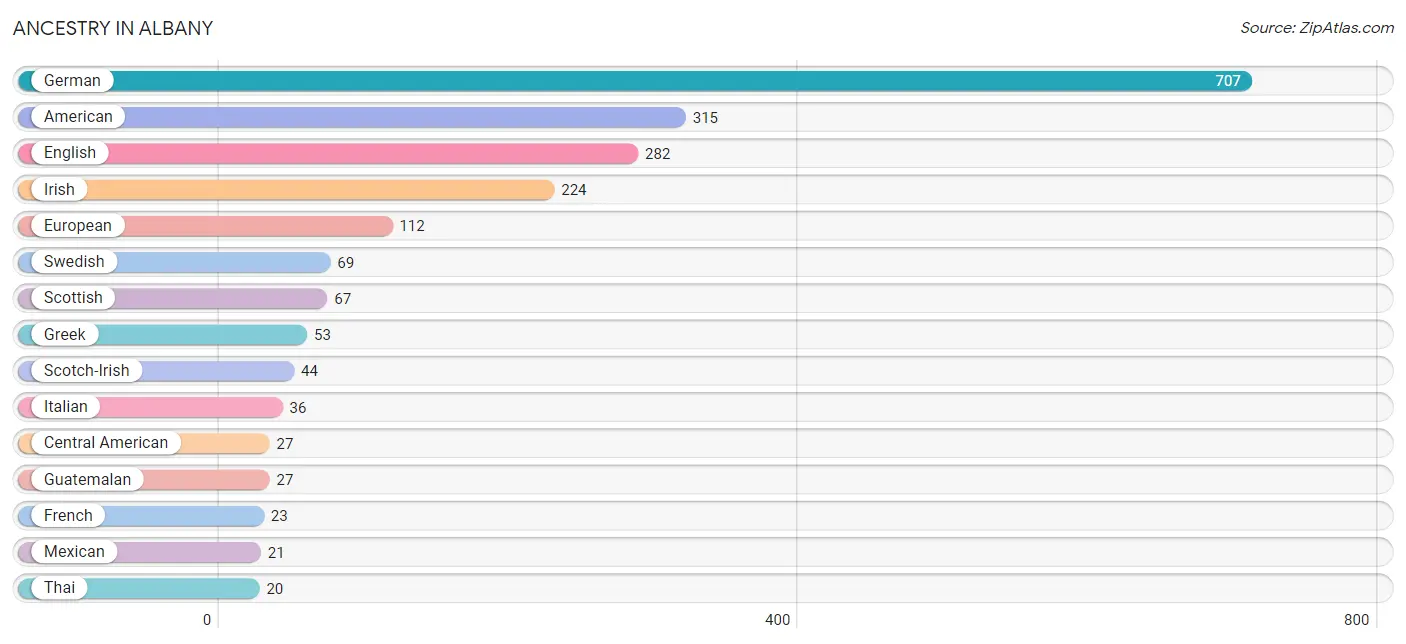
| Ancestry | # Population | % Population |
| American | 315 | 11.0% |
| British | 13 | 0.5% |
| Central American | 27 | 0.9% |
| Cherokee | 3 | 0.1% |
| Dutch | 11 | 0.4% |
| English | 282 | 9.9% |
| European | 112 | 3.9% |
| French | 23 | 0.8% |
| German | 707 | 24.8% |
| Greek | 53 | 1.9% |
| Guatemalan | 27 | 0.9% |
| Irish | 224 | 7.9% |
| Italian | 36 | 1.3% |
| Mexican | 21 | 0.7% |
| Native Hawaiian | 1 | 0.0% |
| Puerto Rican | 16 | 0.6% |
| Samoan | 5 | 0.2% |
| Scandinavian | 16 | 0.6% |
| Scotch-Irish | 44 | 1.5% |
| Scottish | 67 | 2.4% |
| Swedish | 69 | 2.4% |
| Thai | 20 | 0.7% |
| Welsh | 5 | 0.2% | View All 23 Rows |
Immigrants in Albany
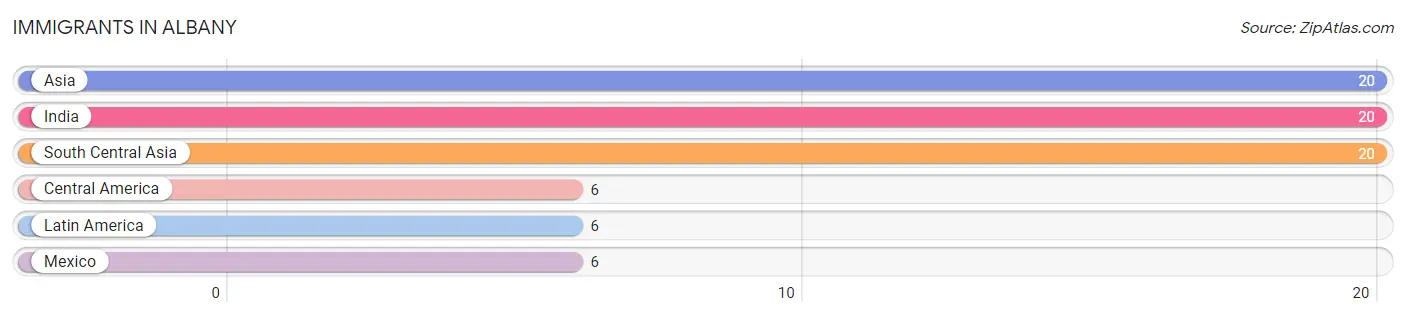
The most numerous immigrant groups reported in Albany came from Asia (20 | 0.7%), India (20 | 0.7%), South Central Asia (20 | 0.7%), Central America (6 | 0.2%), and Latin America (6 | 0.2%), together accounting for 2.5% of all Albany residents.
| Immigration Origin | # Population | % Population |
| Asia | 20 | 0.7% |
| Central America | 6 | 0.2% |
| India | 20 | 0.7% |
| Latin America | 6 | 0.2% |
| Mexico | 6 | 0.2% |
| South Central Asia | 20 | 0.7% | View All 6 Rows |
Sex and Age in Albany
Sex and Age in Albany
The most populous age groups in Albany are 75 to 79 Years (135 | 10.8%) for men and 70 to 74 Years (200 | 12.5%) for women.
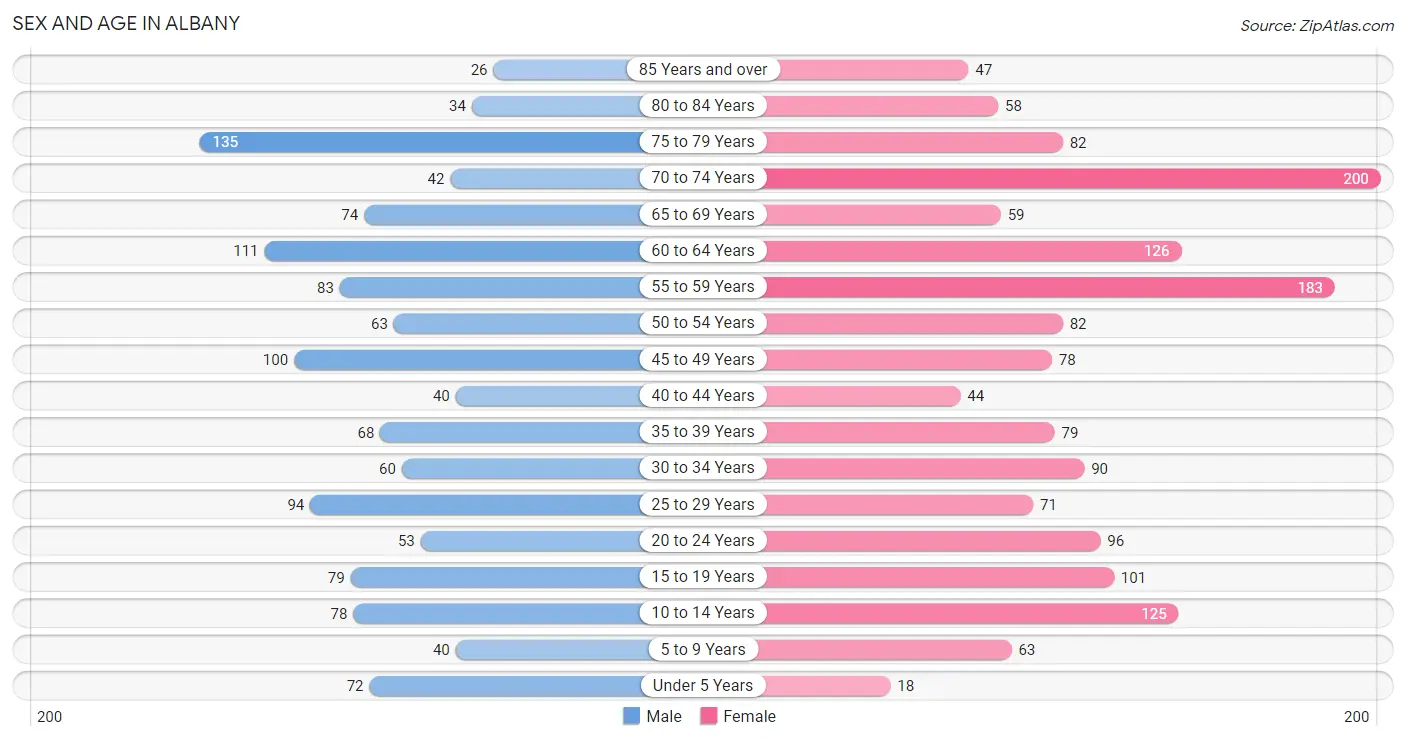
| Age Bracket | Male | Female |
| Under 5 Years | 72 (5.8%) | 18 (1.1%) |
| 5 to 9 Years | 40 (3.2%) | 63 (3.9%) |
| 10 to 14 Years | 78 (6.2%) | 125 (7.8%) |
| 15 to 19 Years | 79 (6.3%) | 101 (6.3%) |
| 20 to 24 Years | 53 (4.2%) | 96 (6.0%) |
| 25 to 29 Years | 94 (7.5%) | 71 (4.4%) |
| 30 to 34 Years | 60 (4.8%) | 90 (5.6%) |
| 35 to 39 Years | 68 (5.4%) | 79 (4.9%) |
| 40 to 44 Years | 40 (3.2%) | 44 (2.8%) |
| 45 to 49 Years | 100 (8.0%) | 78 (4.9%) |
| 50 to 54 Years | 63 (5.0%) | 82 (5.1%) |
| 55 to 59 Years | 83 (6.6%) | 183 (11.4%) |
| 60 to 64 Years | 111 (8.9%) | 126 (7.9%) |
| 65 to 69 Years | 74 (5.9%) | 59 (3.7%) |
| 70 to 74 Years | 42 (3.4%) | 200 (12.5%) |
| 75 to 79 Years | 135 (10.8%) | 82 (5.1%) |
| 80 to 84 Years | 34 (2.7%) | 58 (3.6%) |
| 85 Years and over | 26 (2.1%) | 47 (2.9%) |
| Total | 1,252 (100.0%) | 1,602 (100.0%) |
Families and Households in Albany
Median Family Size in Albany
The median family size in Albany is 2.62 persons per family, with single female/mother families (202 | 23.7%) accounting for the largest median family size of 2.86 persons per family. On the other hand, single male/father families (38 | 4.4%) represent the smallest median family size with 2.05 persons per family.
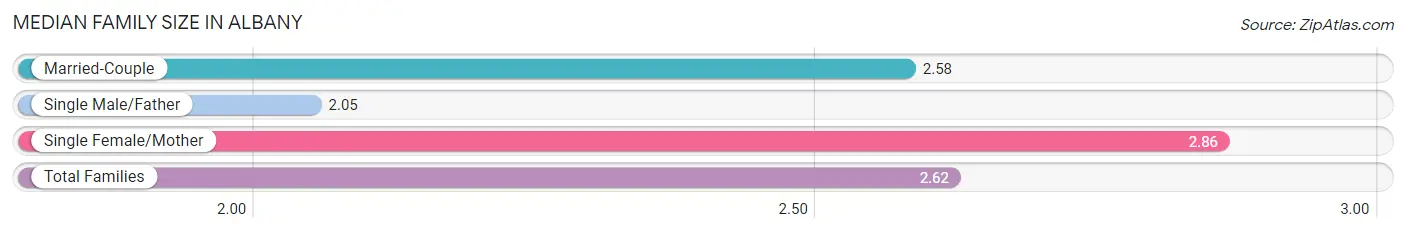
| Family Type | # Families | Family Size |
| Married-Couple | 613 (71.9%) | 2.58 |
| Single Male/Father | 38 (4.4%) | 2.05 |
| Single Female/Mother | 202 (23.7%) | 2.86 |
| Total Families | 853 (100.0%) | 2.62 |
Median Household Size in Albany
The median household size in Albany is 2.27 persons per household, with single female/mother households (202 | 16.5%) accounting for the largest median household size of 3.14 persons per household. non-family households (368 | 30.1%) represent the smallest median household size with 1.26 persons per household.
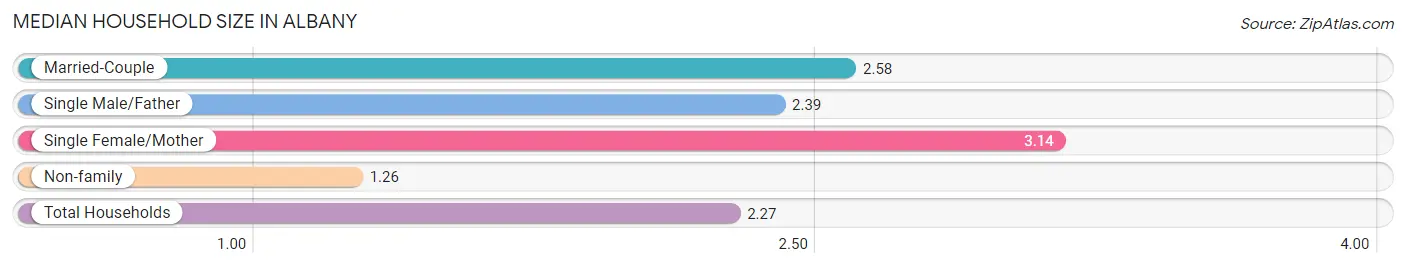
| Household Type | # Households | Household Size |
| Married-Couple | 613 (50.2%) | 2.58 |
| Single Male/Father | 38 (3.1%) | 2.39 |
| Single Female/Mother | 202 (16.5%) | 3.14 |
| Non-family | 368 (30.1%) | 1.26 |
| Total Households | 1,221 (100.0%) | 2.27 |
Household Size by Marriage Status in Albany
Out of a total of 1,221 households in Albany, 853 (69.9%) are family households, while 368 (30.1%) are nonfamily households. The most numerous type of family households are 2-person households, comprising 524, and the most common type of nonfamily households are 1-person households, comprising 291.
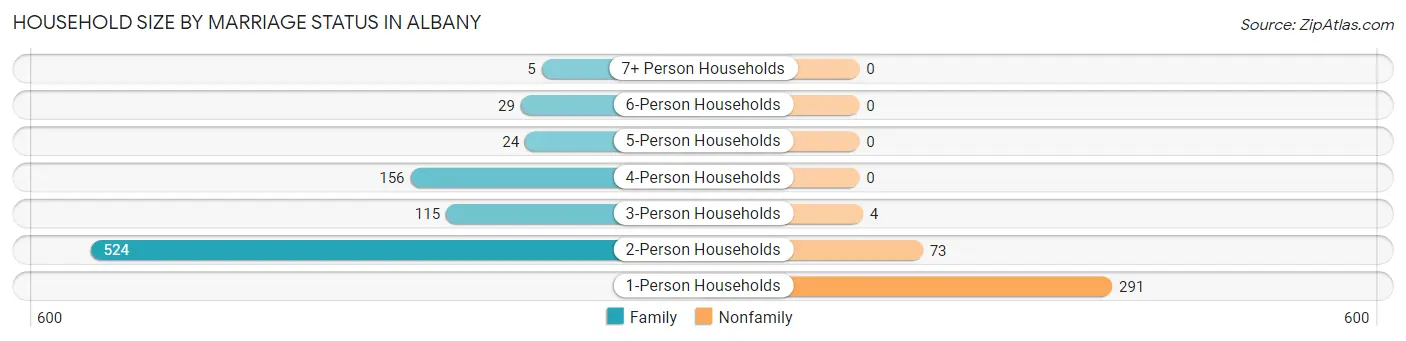
| Household Size | Family Households | Nonfamily Households |
| 1-Person Households | - | 291 (23.8%) |
| 2-Person Households | 524 (42.9%) | 73 (6.0%) |
| 3-Person Households | 115 (9.4%) | 4 (0.3%) |
| 4-Person Households | 156 (12.8%) | 0 (0.0%) |
| 5-Person Households | 24 (2.0%) | 0 (0.0%) |
| 6-Person Households | 29 (2.4%) | 0 (0.0%) |
| 7+ Person Households | 5 (0.4%) | 0 (0.0%) |
| Total | 853 (69.9%) | 368 (30.1%) |
Female Fertility in Albany
Fertility by Age in Albany
Average fertility rate in Albany is 78.0 births per 1,000 women. Women in the age bracket of 20 to 34 years have the highest fertility rate with 148.0 births per 1,000 women. Women in the age bracket of 20 to 34 years acount for 80.8% of all women with births.
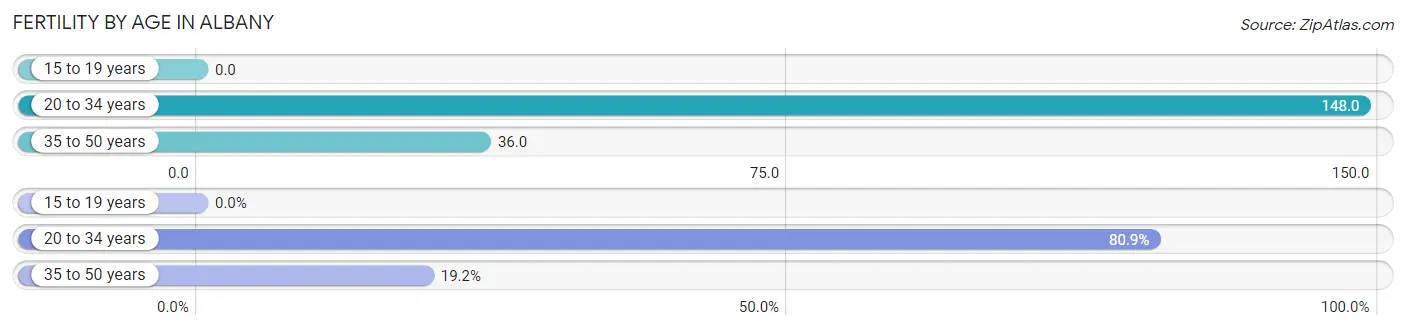
| Age Bracket | Women with Births | Births / 1,000 Women |
| 15 to 19 years | 0 (0.0%) | 0.0 |
| 20 to 34 years | 38 (80.8%) | 148.0 |
| 35 to 50 years | 9 (19.2%) | 36.0 |
| Total | 47 (100.0%) | 78.0 |
Fertility by Age by Marriage Status in Albany
68.1% of women with births (47) in Albany are married. The highest percentage of unmarried women with births falls into 35 to 50 years age bracket with 100.0% of them unmarried at the time of birth, while the lowest percentage of unmarried women with births belong to 20 to 34 years age bracket with 15.8% of them unmarried.
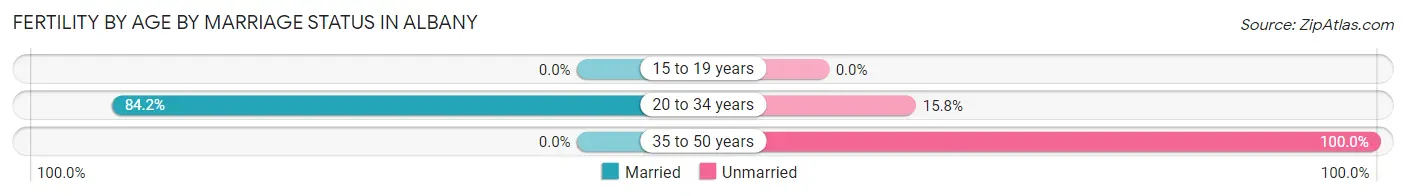
| Age Bracket | Married | Unmarried |
| 15 to 19 years | 0 (0.0%) | 0 (0.0%) |
| 20 to 34 years | 32 (84.2%) | 6 (15.8%) |
| 35 to 50 years | 0 (0.0%) | 9 (100.0%) |
| Total | 32 (68.1%) | 15 (31.9%) |
Fertility by Education in Albany
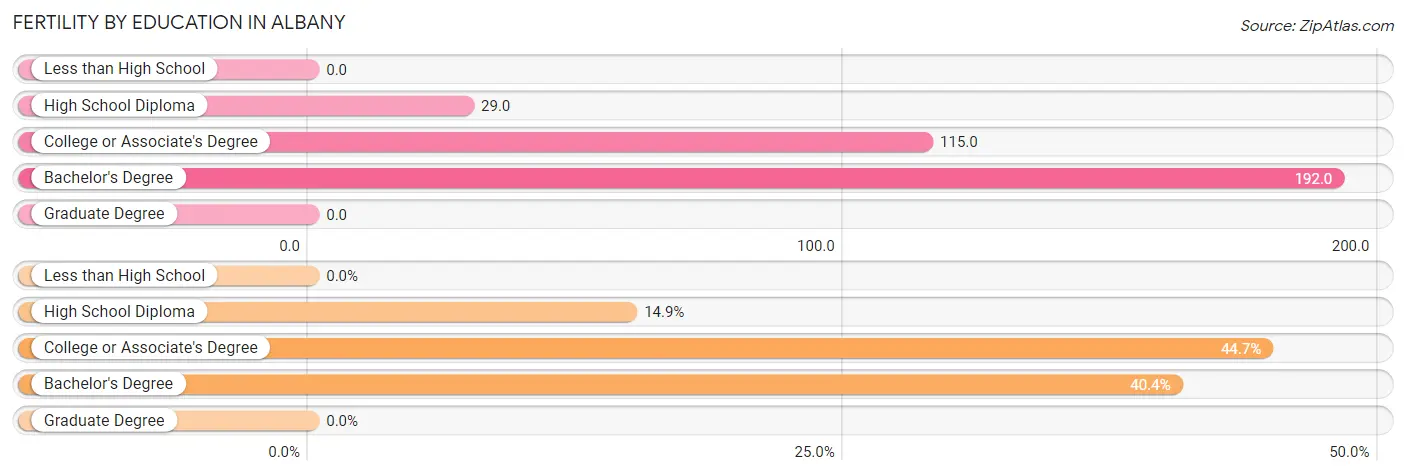
| Educational Attainment | Women with Births | Births / 1,000 Women |
| Less than High School | 0 (0.0%) | 0.0 |
| High School Diploma | 7 (14.9%) | 29.0 |
| College or Associate's Degree | 21 (44.7%) | 115.0 |
| Bachelor's Degree | 19 (40.4%) | 192.0 |
| Graduate Degree | 0 (0.0%) | 0.0 |
| Total | 47 (100.0%) | 78.0 |
Fertility by Education by Marriage Status in Albany
31.9% of women with births in Albany are unmarried. Women with the educational attainment of high school diploma are most likely to be married with 100.0% of them married at childbirth, while women with the educational attainment of college or associate's degree are least likely to be married with 71.4% of them unmarried at childbirth.
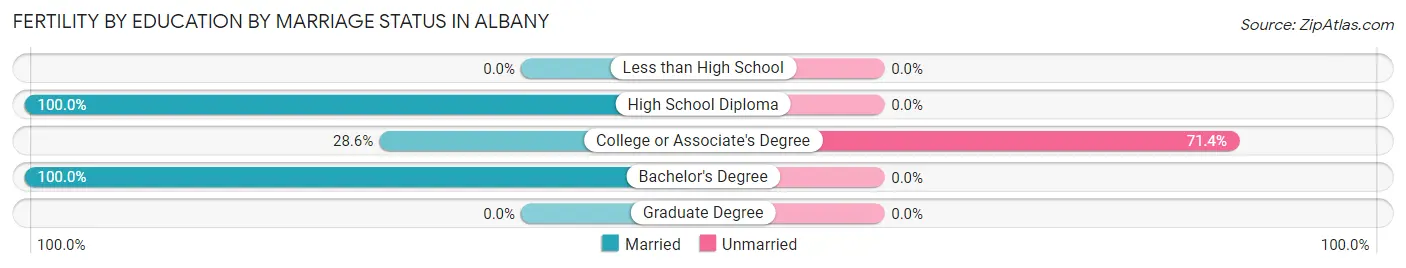
| Educational Attainment | Married | Unmarried |
| Less than High School | 0 (0.0%) | 0 (0.0%) |
| High School Diploma | 7 (100.0%) | 0 (0.0%) |
| College or Associate's Degree | 6 (28.6%) | 15 (71.4%) |
| Bachelor's Degree | 19 (100.0%) | 0 (0.0%) |
| Graduate Degree | 0 (0.0%) | 0 (0.0%) |
| Total | 32 (68.1%) | 15 (31.9%) |
Employment Characteristics in Albany
Employment by Class of Employer in Albany
Among the 1,166 employed individuals in Albany, private company employees (920 | 78.9%), not-for-profit organizations (107 | 9.2%), and state government employees (74 | 6.4%) make up the most common classes of employment.
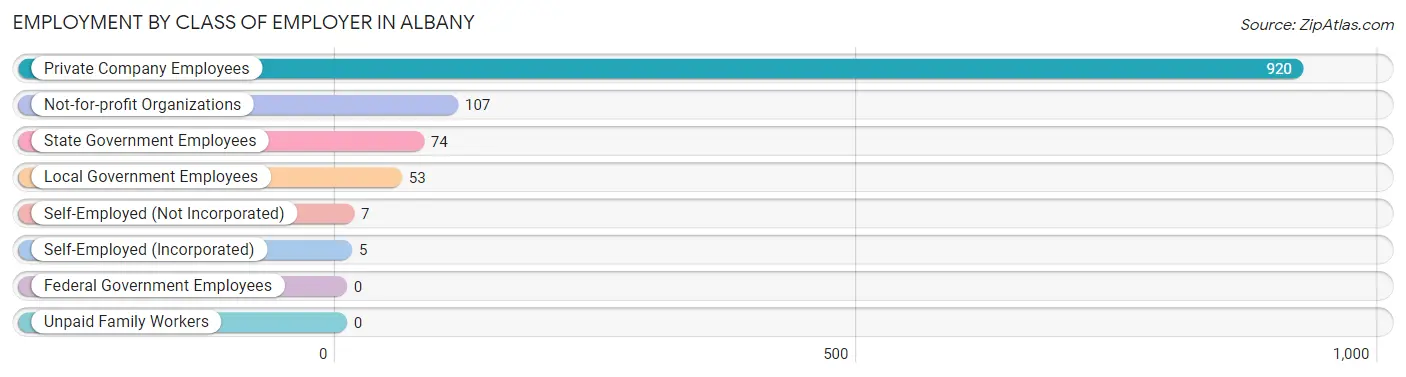
| Employer Class | # Employees | % Employees |
| Private Company Employees | 920 | 78.9% |
| Self-Employed (Incorporated) | 5 | 0.4% |
| Self-Employed (Not Incorporated) | 7 | 0.6% |
| Not-for-profit Organizations | 107 | 9.2% |
| Local Government Employees | 53 | 4.5% |
| State Government Employees | 74 | 6.4% |
| Federal Government Employees | 0 | 0.0% |
| Unpaid Family Workers | 0 | 0.0% |
| Total | 1,166 | 100.0% |
Employment Status by Age in Albany
According to the labor force statistics for Albany, out of the total population over 16 years of age (2,406), 51.4% or 1,237 individuals are in the labor force, with 3.8% or 47 of them unemployed. The age group with the highest labor force participation rate is 30 to 34 years, with 86.0% or 129 individuals in the labor force. Within the labor force, the 65 to 74 years age range has the highest percentage of unemployed individuals, with 25.0% or 17 of them being unemployed.
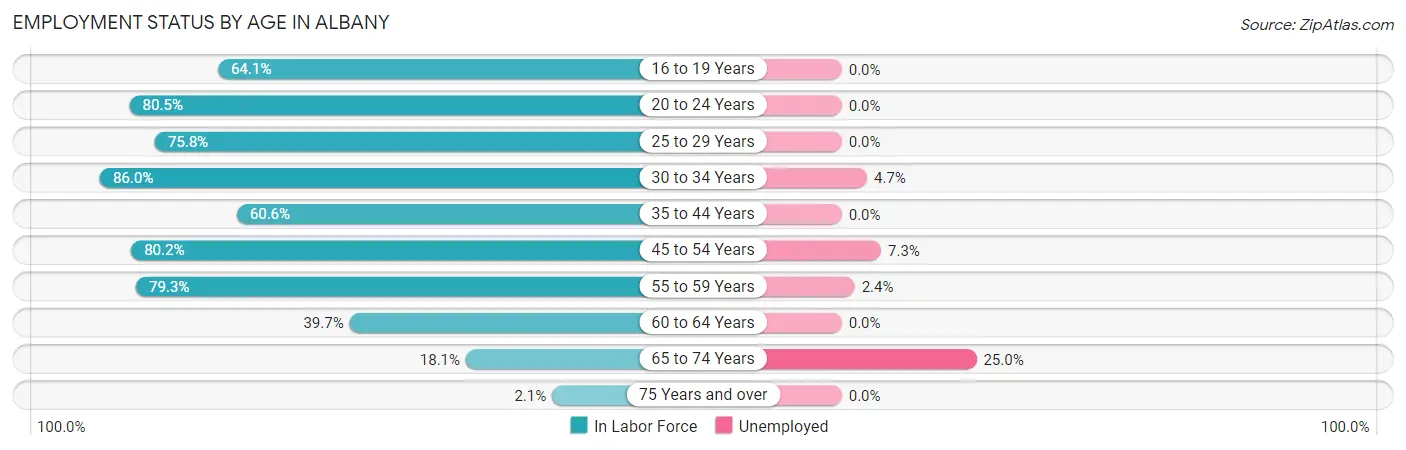
| Age Bracket | In Labor Force | Unemployed |
| 16 to 19 Years | 82 (64.1%) | 0 (0.0%) |
| 20 to 24 Years | 120 (80.5%) | 0 (0.0%) |
| 25 to 29 Years | 125 (75.8%) | 0 (0.0%) |
| 30 to 34 Years | 129 (86.0%) | 6 (4.7%) |
| 35 to 44 Years | 140 (60.6%) | 0 (0.0%) |
| 45 to 54 Years | 259 (80.2%) | 19 (7.3%) |
| 55 to 59 Years | 211 (79.3%) | 5 (2.4%) |
| 60 to 64 Years | 94 (39.7%) | 0 (0.0%) |
| 65 to 74 Years | 68 (18.1%) | 17 (25.0%) |
| 75 Years and over | 8 (2.1%) | 0 (0.0%) |
| Total | 1,237 (51.4%) | 47 (3.8%) |
Employment Status by Educational Attainment in Albany
According to labor force statistics for Albany, 69.8% of individuals (958) out of the total population between 25 and 64 years of age (1,372) are in the labor force, with 3.1% or 30 of them being unemployed. The group with the highest labor force participation rate are those with the educational attainment of bachelor's degree or higher, with 74.7% or 171 individuals in the labor force. Within the labor force, individuals with college / associate degree education have the highest percentage of unemployment, with 6.9% or 25 of them being unemployed.
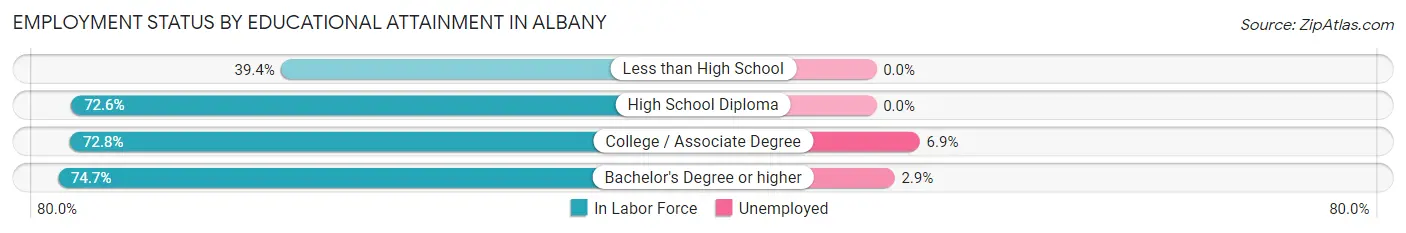
| Educational Attainment | In Labor Force | Unemployed |
| Less than High School | 52 (39.4%) | 0 (0.0%) |
| High School Diploma | 371 (72.6%) | 0 (0.0%) |
| College / Associate Degree | 364 (72.8%) | 34 (6.9%) |
| Bachelor's Degree or higher | 171 (74.7%) | 7 (2.9%) |
| Total | 958 (69.8%) | 43 (3.1%) |
Employment Occupations by Sex in Albany
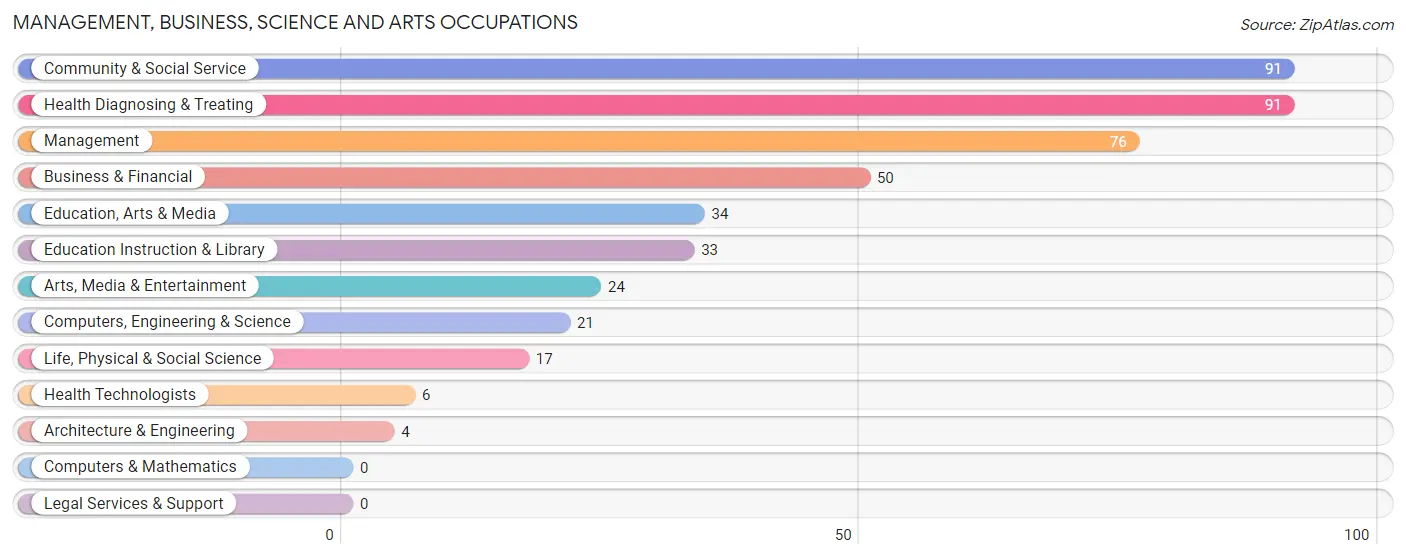
Management, Business, Science and Arts Occupations
The most common Management, Business, Science and Arts occupations in Albany are Community & Social Service (91 | 7.6%), Health Diagnosing & Treating (91 | 7.6%), Management (76 | 6.4%), Business & Financial (50 | 4.2%), and Education, Arts & Media (34 | 2.9%).
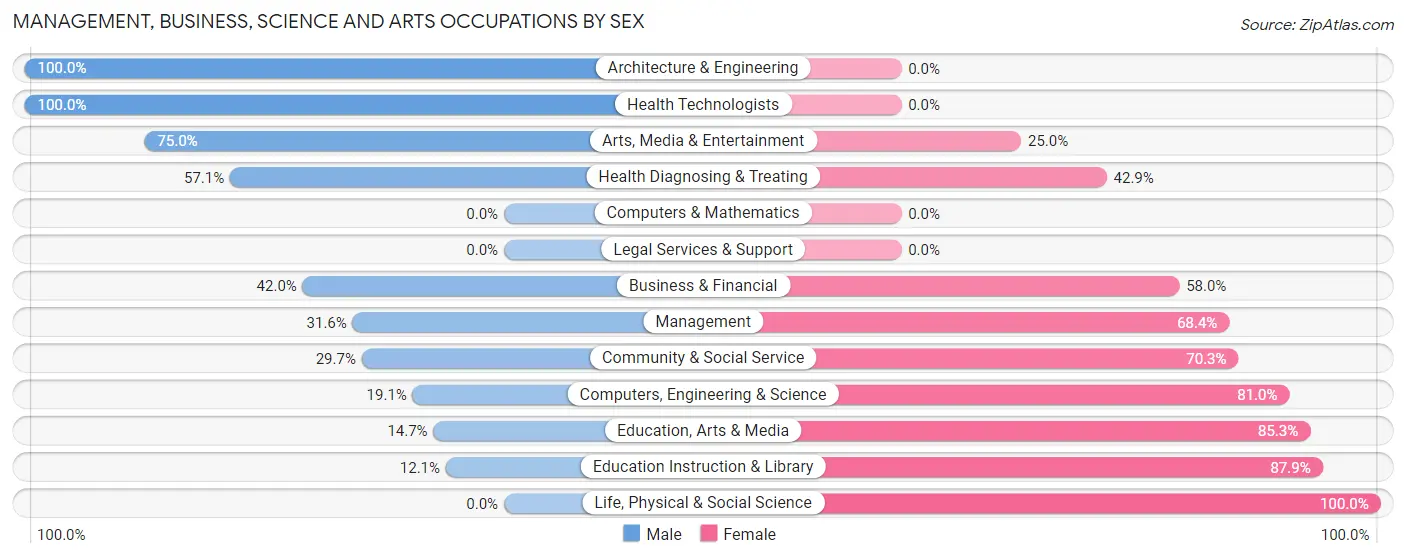
Management, Business, Science and Arts Occupations by Sex
Within the Management, Business, Science and Arts occupations in Albany, the most male-oriented occupations are Architecture & Engineering (100.0%), Health Technologists (100.0%), and Arts, Media & Entertainment (75.0%), while the most female-oriented occupations are Life, Physical & Social Science (100.0%), Education Instruction & Library (87.9%), and Education, Arts & Media (85.3%).
| Occupation | Male | Female |
| Management | 24 (31.6%) | 52 (68.4%) |
| Business & Financial | 21 (42.0%) | 29 (58.0%) |
| Computers, Engineering & Science | 4 (19.1%) | 17 (80.9%) |
| Computers & Mathematics | 0 (0.0%) | 0 (0.0%) |
| Architecture & Engineering | 4 (100.0%) | 0 (0.0%) |
| Life, Physical & Social Science | 0 (0.0%) | 17 (100.0%) |
| Community & Social Service | 27 (29.7%) | 64 (70.3%) |
| Education, Arts & Media | 5 (14.7%) | 29 (85.3%) |
| Legal Services & Support | 0 (0.0%) | 0 (0.0%) |
| Education Instruction & Library | 4 (12.1%) | 29 (87.9%) |
| Arts, Media & Entertainment | 18 (75.0%) | 6 (25.0%) |
| Health Diagnosing & Treating | 52 (57.1%) | 39 (42.9%) |
| Health Technologists | 6 (100.0%) | 0 (0.0%) |
| Total (Category) | 128 (38.9%) | 201 (61.1%) |
| Total (Overall) | 545 (45.8%) | 644 (54.2%) |
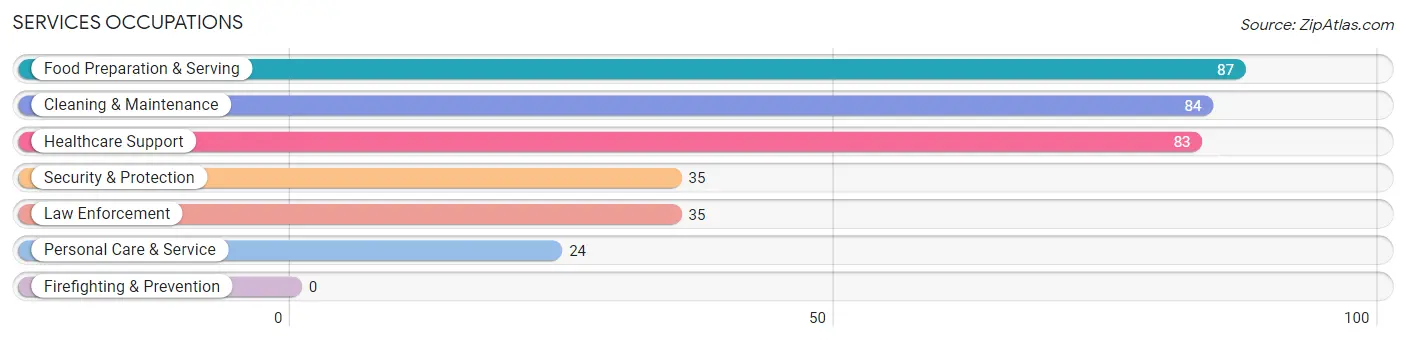
Services Occupations
The most common Services occupations in Albany are Food Preparation & Serving (87 | 7.3%), Cleaning & Maintenance (84 | 7.1%), Healthcare Support (83 | 7.0%), Security & Protection (35 | 2.9%), and Law Enforcement (35 | 2.9%).
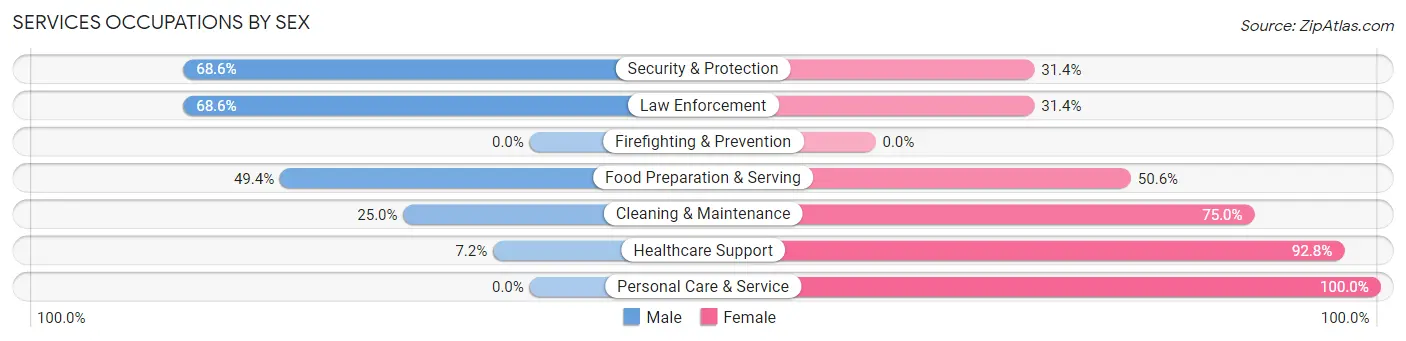
Services Occupations by Sex
Within the Services occupations in Albany, the most male-oriented occupations are Security & Protection (68.6%), Law Enforcement (68.6%), and Food Preparation & Serving (49.4%), while the most female-oriented occupations are Personal Care & Service (100.0%), Healthcare Support (92.8%), and Cleaning & Maintenance (75.0%).
| Occupation | Male | Female |
| Healthcare Support | 6 (7.2%) | 77 (92.8%) |
| Security & Protection | 24 (68.6%) | 11 (31.4%) |
| Firefighting & Prevention | 0 (0.0%) | 0 (0.0%) |
| Law Enforcement | 24 (68.6%) | 11 (31.4%) |
| Food Preparation & Serving | 43 (49.4%) | 44 (50.6%) |
| Cleaning & Maintenance | 21 (25.0%) | 63 (75.0%) |
| Personal Care & Service | 0 (0.0%) | 24 (100.0%) |
| Total (Category) | 94 (30.0%) | 219 (70.0%) |
| Total (Overall) | 545 (45.8%) | 644 (54.2%) |
Sales and Office Occupations
The most common Sales and Office occupations in Albany are Office & Administration (142 | 11.9%), and Sales & Related (76 | 6.4%).
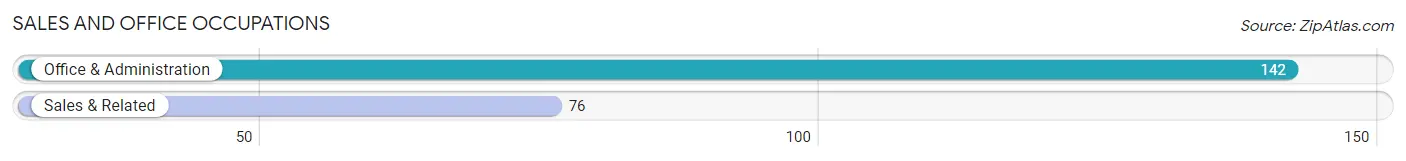
Sales and Office Occupations by Sex
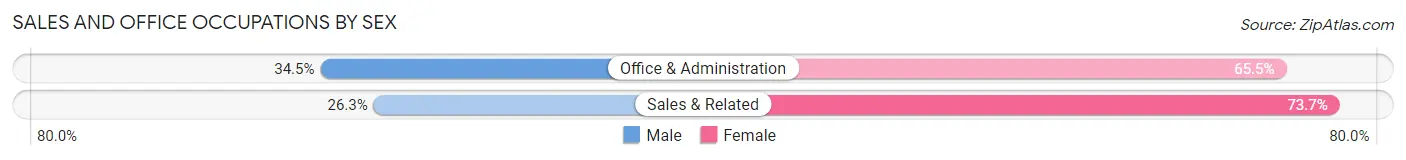
| Occupation | Male | Female |
| Sales & Related | 20 (26.3%) | 56 (73.7%) |
| Office & Administration | 49 (34.5%) | 93 (65.5%) |
| Total (Category) | 69 (31.7%) | 149 (68.3%) |
| Total (Overall) | 545 (45.8%) | 644 (54.2%) |
Natural Resources, Construction and Maintenance Occupations
The most common Natural Resources, Construction and Maintenance occupations in Albany are Installation, Maintenance & Repair (55 | 4.6%), Farming, Fishing & Forestry (25 | 2.1%), and Construction & Extraction (11 | 0.9%).
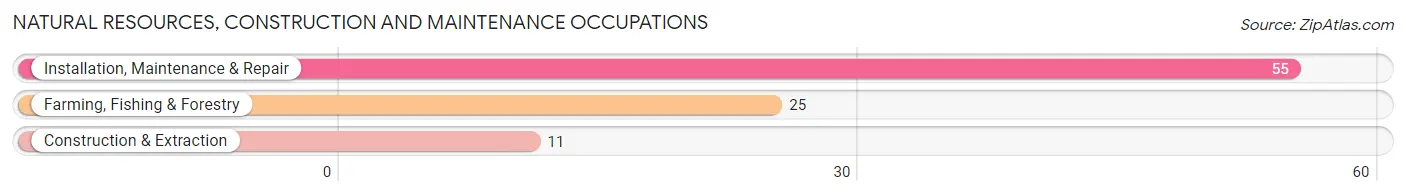
Natural Resources, Construction and Maintenance Occupations by Sex
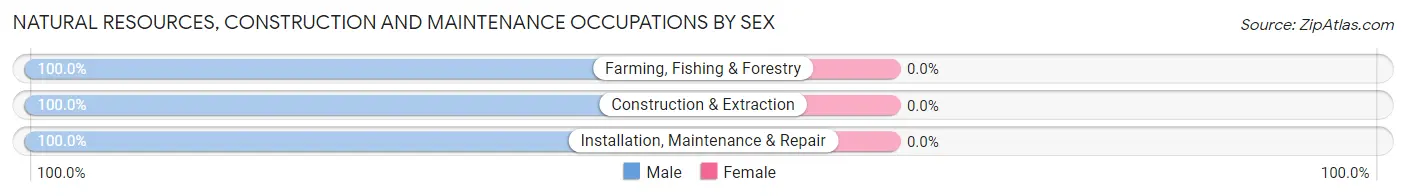
| Occupation | Male | Female |
| Farming, Fishing & Forestry | 25 (100.0%) | 0 (0.0%) |
| Construction & Extraction | 11 (100.0%) | 0 (0.0%) |
| Installation, Maintenance & Repair | 55 (100.0%) | 0 (0.0%) |
| Total (Category) | 91 (100.0%) | 0 (0.0%) |
| Total (Overall) | 545 (45.8%) | 644 (54.2%) |
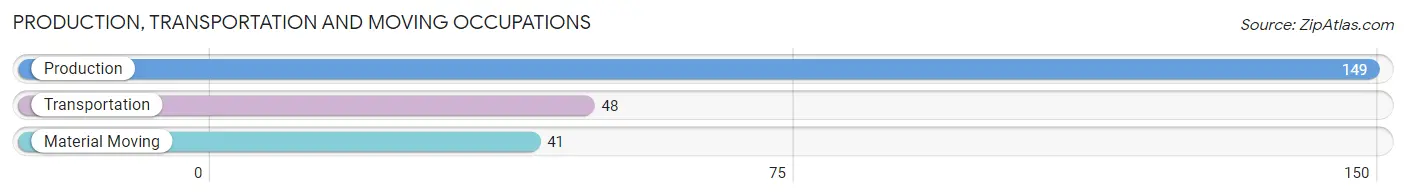
Production, Transportation and Moving Occupations
The most common Production, Transportation and Moving occupations in Albany are Production (149 | 12.5%), Transportation (48 | 4.0%), and Material Moving (41 | 3.5%).
Production, Transportation and Moving Occupations by Sex
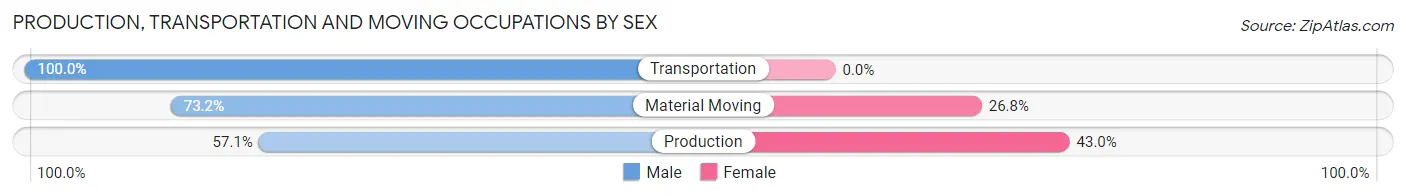
| Occupation | Male | Female |
| Production | 85 (57.1%) | 64 (42.9%) |
| Transportation | 48 (100.0%) | 0 (0.0%) |
| Material Moving | 30 (73.2%) | 11 (26.8%) |
| Total (Category) | 163 (68.5%) | 75 (31.5%) |
| Total (Overall) | 545 (45.8%) | 644 (54.2%) |
Employment Industries by Sex in Albany
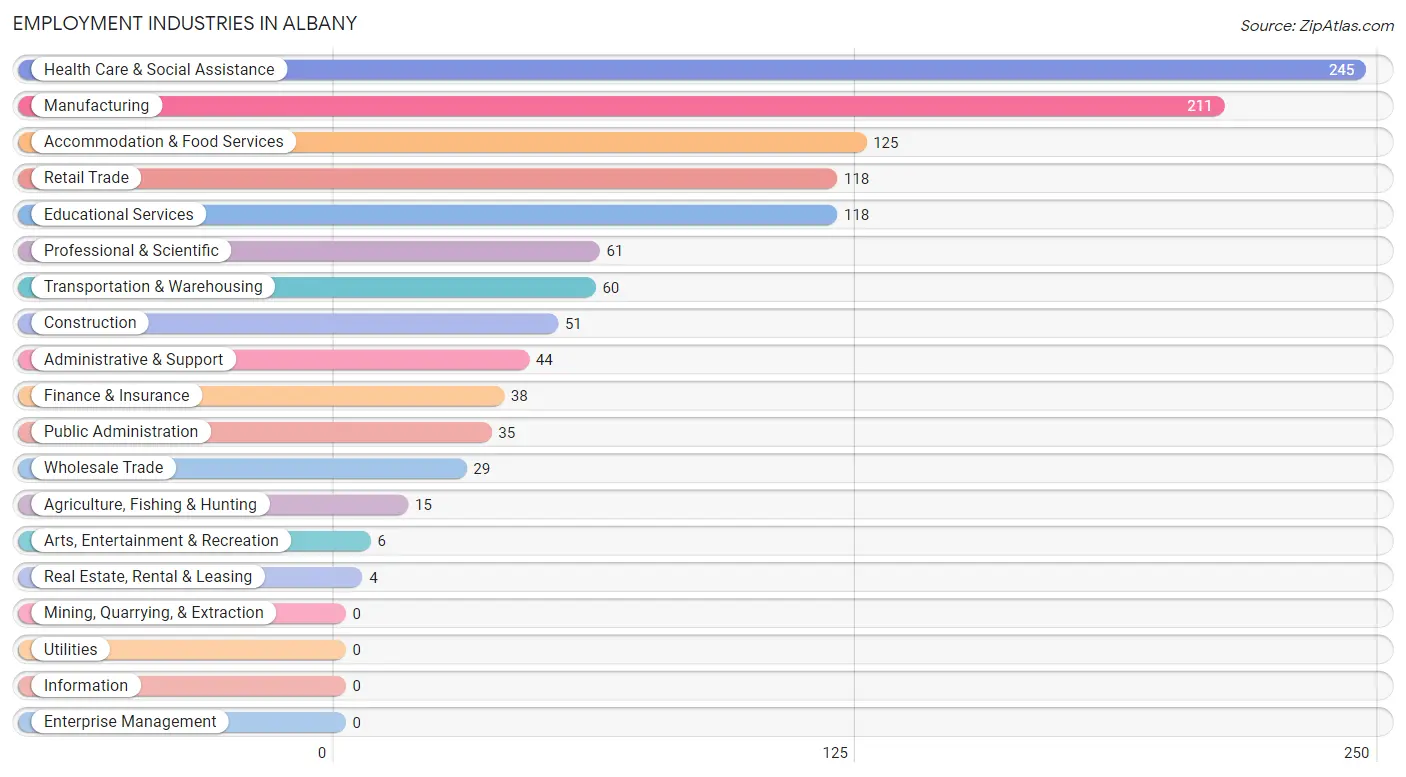
Employment Industries in Albany
The major employment industries in Albany include Health Care & Social Assistance (245 | 20.6%), Manufacturing (211 | 17.7%), Accommodation & Food Services (125 | 10.5%), Retail Trade (118 | 9.9%), and Educational Services (118 | 9.9%).
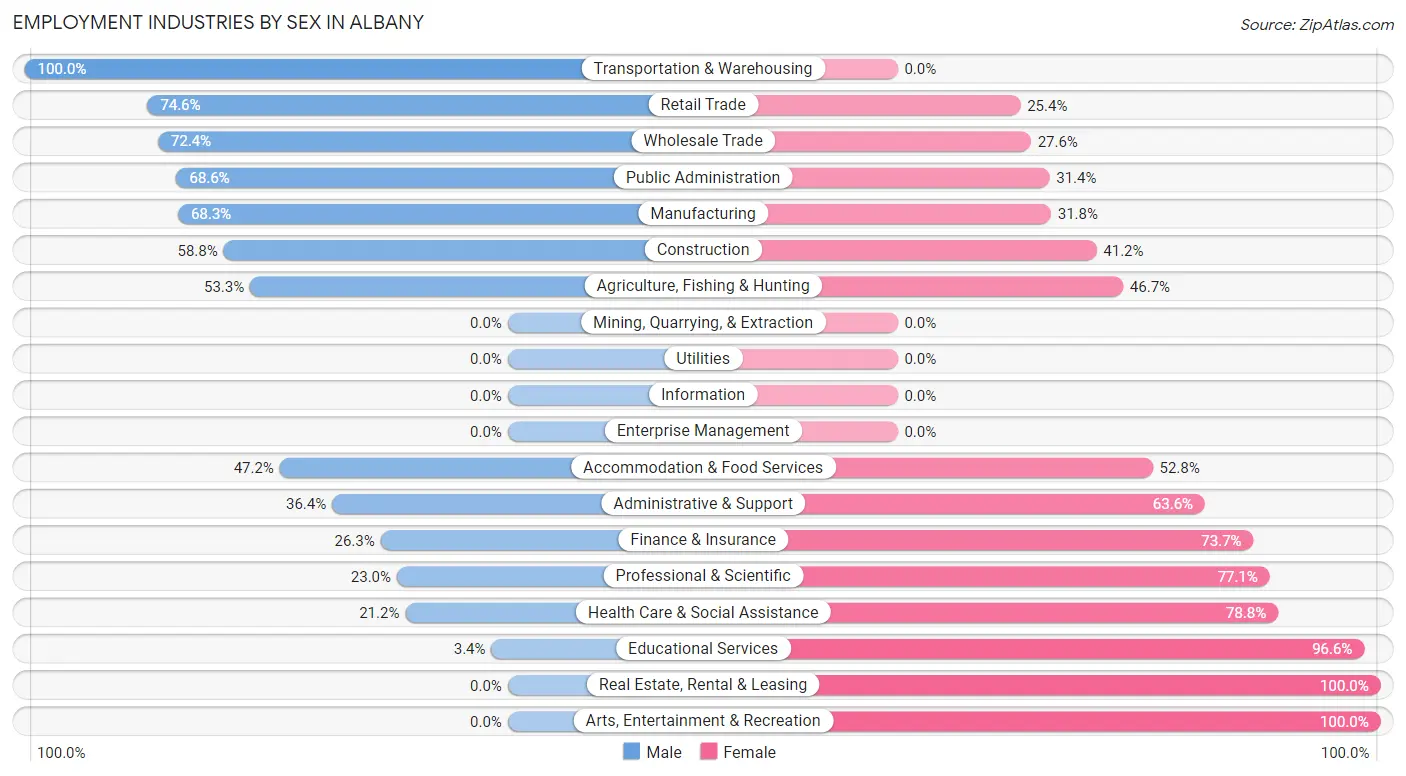
Employment Industries by Sex in Albany
The Albany industries that see more men than women are Transportation & Warehousing (100.0%), Retail Trade (74.6%), and Wholesale Trade (72.4%), whereas the industries that tend to have a higher number of women are Real Estate, Rental & Leasing (100.0%), Arts, Entertainment & Recreation (100.0%), and Educational Services (96.6%).
| Industry | Male | Female |
| Agriculture, Fishing & Hunting | 8 (53.3%) | 7 (46.7%) |
| Mining, Quarrying, & Extraction | 0 (0.0%) | 0 (0.0%) |
| Construction | 30 (58.8%) | 21 (41.2%) |
| Manufacturing | 144 (68.2%) | 67 (31.8%) |
| Wholesale Trade | 21 (72.4%) | 8 (27.6%) |
| Retail Trade | 88 (74.6%) | 30 (25.4%) |
| Transportation & Warehousing | 60 (100.0%) | 0 (0.0%) |
| Utilities | 0 (0.0%) | 0 (0.0%) |
| Information | 0 (0.0%) | 0 (0.0%) |
| Finance & Insurance | 10 (26.3%) | 28 (73.7%) |
| Real Estate, Rental & Leasing | 0 (0.0%) | 4 (100.0%) |
| Professional & Scientific | 14 (23.0%) | 47 (77.0%) |
| Enterprise Management | 0 (0.0%) | 0 (0.0%) |
| Administrative & Support | 16 (36.4%) | 28 (63.6%) |
| Educational Services | 4 (3.4%) | 114 (96.6%) |
| Health Care & Social Assistance | 52 (21.2%) | 193 (78.8%) |
| Arts, Entertainment & Recreation | 0 (0.0%) | 6 (100.0%) |
| Accommodation & Food Services | 59 (47.2%) | 66 (52.8%) |
| Public Administration | 24 (68.6%) | 11 (31.4%) |
| Total | 545 (45.8%) | 644 (54.2%) |
Education in Albany
School Enrollment in Albany
The most common levels of schooling among the 482 students in Albany are middle school (165 | 34.2%), high school (115 | 23.9%), and elementary school (99 | 20.5%).
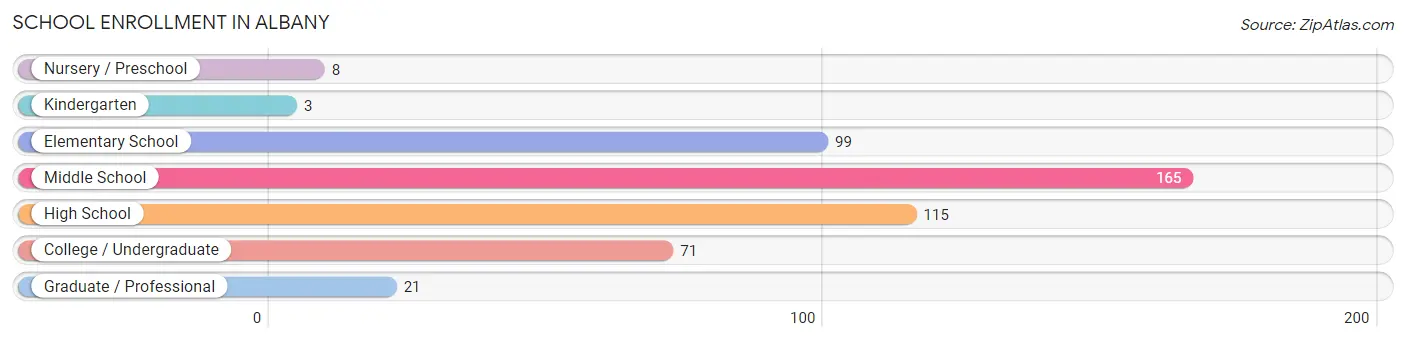
| School Level | # Students | % Students |
| Nursery / Preschool | 8 | 1.7% |
| Kindergarten | 3 | 0.6% |
| Elementary School | 99 | 20.5% |
| Middle School | 165 | 34.2% |
| High School | 115 | 23.9% |
| College / Undergraduate | 71 | 14.7% |
| Graduate / Professional | 21 | 4.4% |
| Total | 482 | 100.0% |
School Enrollment by Age by Funding Source in Albany
Out of a total of 482 students who are enrolled in schools in Albany, 32 (6.6%) attend a private institution, while the remaining 450 (93.4%) are enrolled in public schools. The age group of 3 to 4 year olds has the highest likelihood of being enrolled in private schools, with 3 (100.0% in the age bracket) enrolled. Conversely, the age group of 10 to 14 year olds has the lowest likelihood of being enrolled in a private school, with 188 (100.0% in the age bracket) attending a public institution.
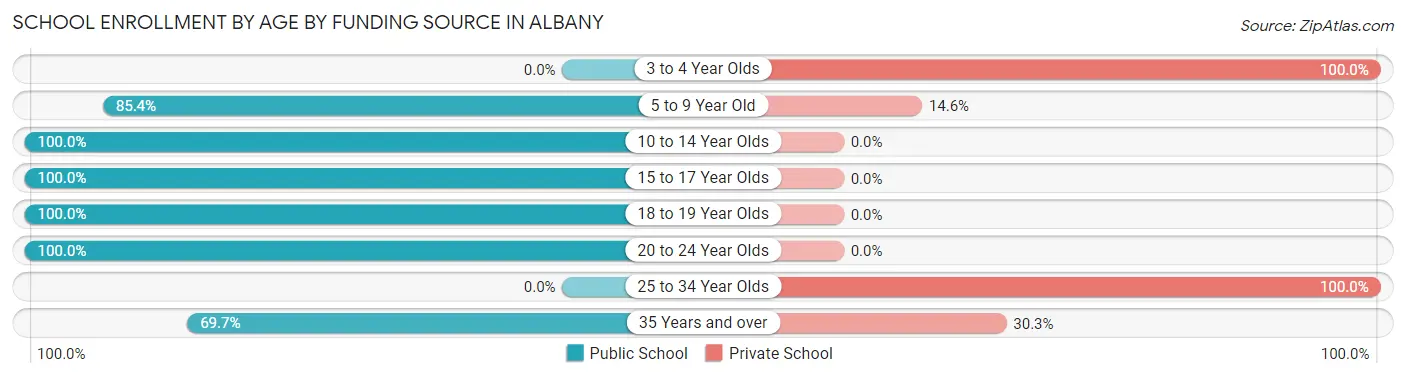
| Age Bracket | Public School | Private School |
| 3 to 4 Year Olds | 0 (0.0%) | 3 (100.0%) |
| 5 to 9 Year Old | 82 (85.4%) | 14 (14.6%) |
| 10 to 14 Year Olds | 188 (100.0%) | 0 (0.0%) |
| 15 to 17 Year Olds | 72 (100.0%) | 0 (0.0%) |
| 18 to 19 Year Olds | 57 (100.0%) | 0 (0.0%) |
| 20 to 24 Year Olds | 28 (100.0%) | 0 (0.0%) |
| 25 to 34 Year Olds | 0 (0.0%) | 5 (100.0%) |
| 35 Years and over | 23 (69.7%) | 10 (30.3%) |
| Total | 450 (93.4%) | 32 (6.6%) |
Educational Attainment by Field of Study in Albany
Education (67 | 20.5%), physical & health sciences (66 | 20.2%), business (40 | 12.2%), liberal arts & history (39 | 11.9%), and psychology (26 | 8.0%) are the most common fields of study among 327 individuals in Albany who have obtained a bachelor's degree or higher.
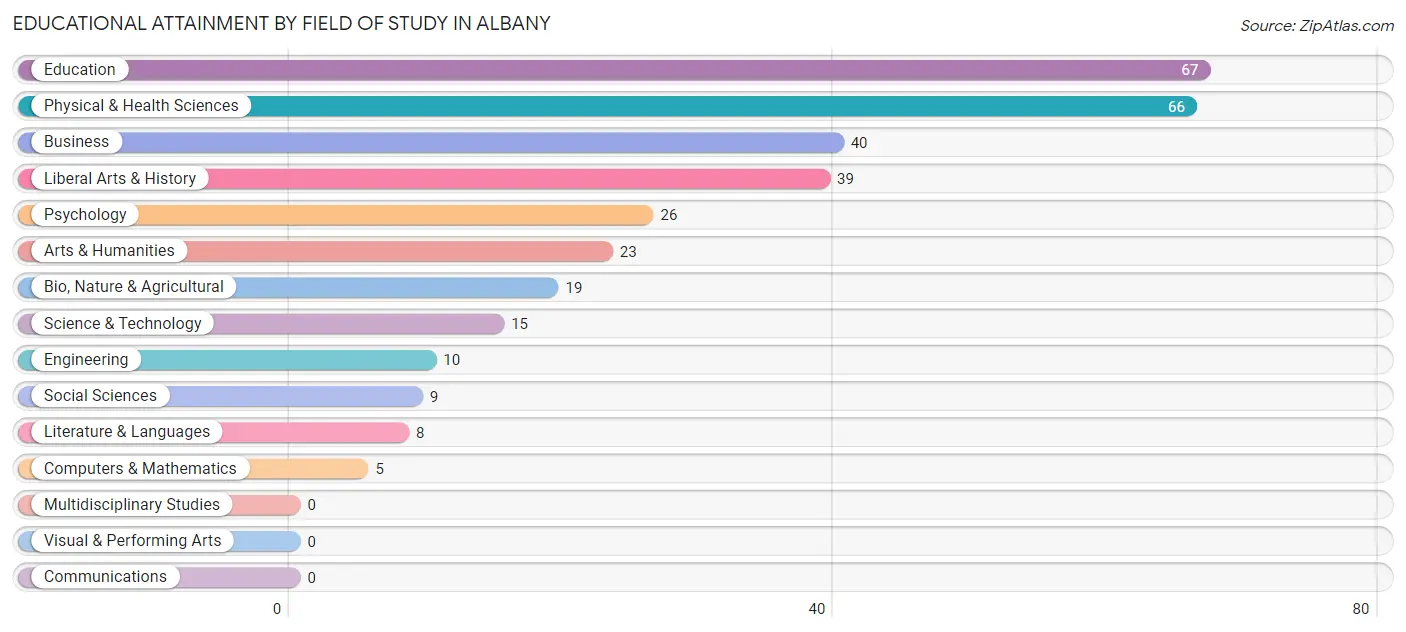
| Field of Study | # Graduates | % Graduates |
| Computers & Mathematics | 5 | 1.5% |
| Bio, Nature & Agricultural | 19 | 5.8% |
| Physical & Health Sciences | 66 | 20.2% |
| Psychology | 26 | 8.0% |
| Social Sciences | 9 | 2.8% |
| Engineering | 10 | 3.1% |
| Multidisciplinary Studies | 0 | 0.0% |
| Science & Technology | 15 | 4.6% |
| Business | 40 | 12.2% |
| Education | 67 | 20.5% |
| Literature & Languages | 8 | 2.5% |
| Liberal Arts & History | 39 | 11.9% |
| Visual & Performing Arts | 0 | 0.0% |
| Communications | 0 | 0.0% |
| Arts & Humanities | 23 | 7.0% |
| Total | 327 | 100.0% |
Transportation & Commute in Albany
Vehicle Availability by Sex in Albany
The most prevalent vehicle ownership categories in Albany are males with 2 vehicles (281, accounting for 52.3%) and females with 2 vehicles (288, making up 44.7%).
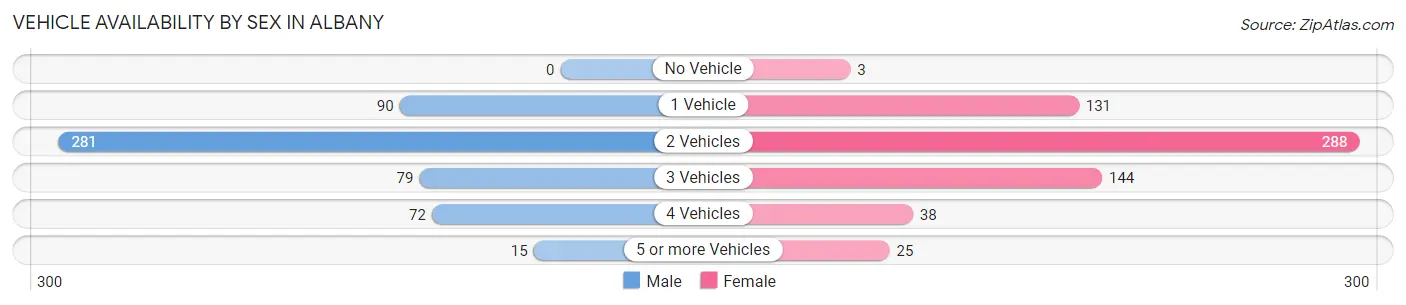
| Vehicles Available | Male | Female |
| No Vehicle | 0 (0.0%) | 3 (0.5%) |
| 1 Vehicle | 90 (16.8%) | 131 (20.8%) |
| 2 Vehicles | 281 (52.3%) | 288 (45.8%) |
| 3 Vehicles | 79 (14.7%) | 144 (22.9%) |
| 4 Vehicles | 72 (13.4%) | 38 (6.0%) |
| 5 or more Vehicles | 15 (2.8%) | 25 (4.0%) |
| Total | 537 (100.0%) | 629 (100.0%) |
Commute Time in Albany
The most frequently occuring commute durations in Albany are 30 to 34 minutes (213 commuters, 19.9%), 25 to 29 minutes (173 commuters, 16.1%), and 20 to 24 minutes (168 commuters, 15.7%).
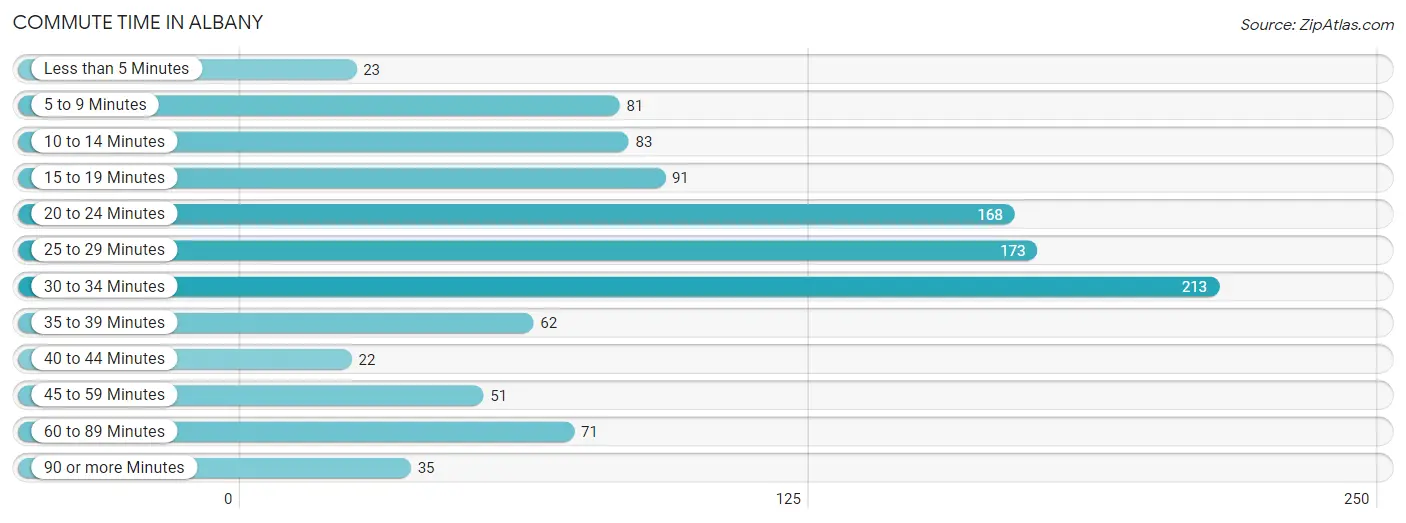
| Commute Time | # Commuters | % Commuters |
| Less than 5 Minutes | 23 | 2.1% |
| 5 to 9 Minutes | 81 | 7.5% |
| 10 to 14 Minutes | 83 | 7.7% |
| 15 to 19 Minutes | 91 | 8.5% |
| 20 to 24 Minutes | 168 | 15.7% |
| 25 to 29 Minutes | 173 | 16.1% |
| 30 to 34 Minutes | 213 | 19.9% |
| 35 to 39 Minutes | 62 | 5.8% |
| 40 to 44 Minutes | 22 | 2.1% |
| 45 to 59 Minutes | 51 | 4.8% |
| 60 to 89 Minutes | 71 | 6.6% |
| 90 or more Minutes | 35 | 3.3% |
Commute Time by Sex in Albany
The most common commute times in Albany are 25 to 29 minutes (91 commuters, 17.1%) for males and 30 to 34 minutes (142 commuters, 26.2%) for females.
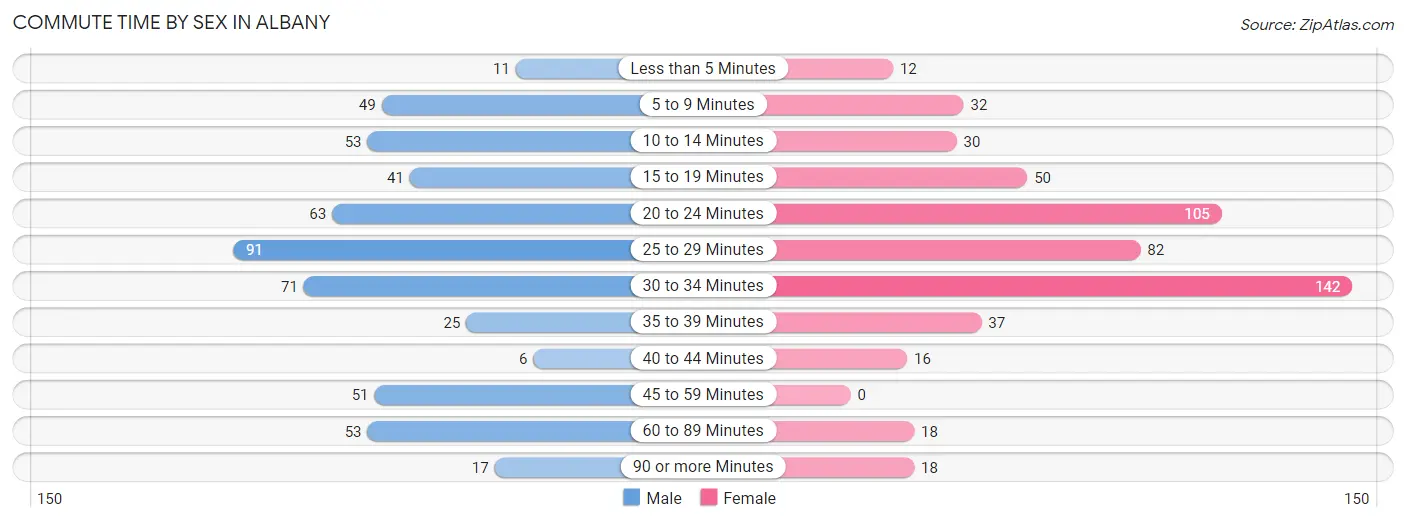
| Commute Time | Male | Female |
| Less than 5 Minutes | 11 (2.1%) | 12 (2.2%) |
| 5 to 9 Minutes | 49 (9.2%) | 32 (5.9%) |
| 10 to 14 Minutes | 53 (10.0%) | 30 (5.5%) |
| 15 to 19 Minutes | 41 (7.7%) | 50 (9.2%) |
| 20 to 24 Minutes | 63 (11.9%) | 105 (19.4%) |
| 25 to 29 Minutes | 91 (17.1%) | 82 (15.1%) |
| 30 to 34 Minutes | 71 (13.4%) | 142 (26.2%) |
| 35 to 39 Minutes | 25 (4.7%) | 37 (6.8%) |
| 40 to 44 Minutes | 6 (1.1%) | 16 (2.9%) |
| 45 to 59 Minutes | 51 (9.6%) | 0 (0.0%) |
| 60 to 89 Minutes | 53 (10.0%) | 18 (3.3%) |
| 90 or more Minutes | 17 (3.2%) | 18 (3.3%) |
Time of Departure to Work by Sex in Albany
The most frequent times of departure to work in Albany are 6:00 AM to 6:29 AM (129, 24.3%) for males and 7:00 AM to 7:29 AM (157, 29.0%) for females.
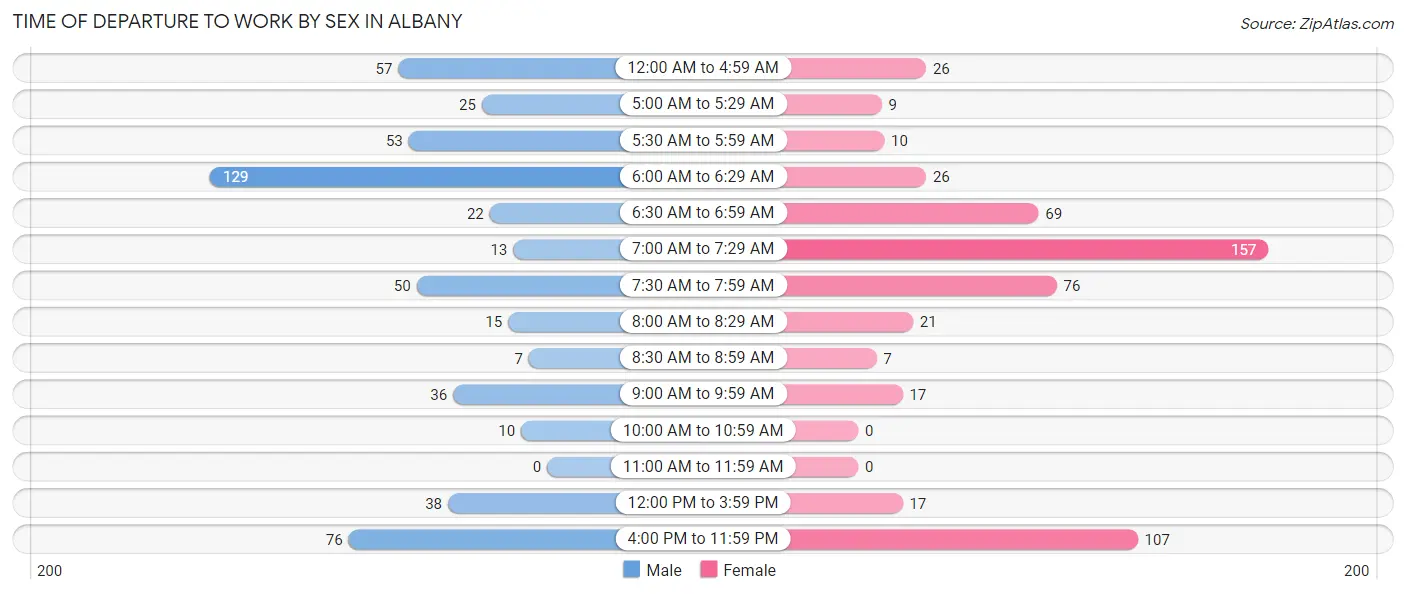
| Time of Departure | Male | Female |
| 12:00 AM to 4:59 AM | 57 (10.7%) | 26 (4.8%) |
| 5:00 AM to 5:29 AM | 25 (4.7%) | 9 (1.7%) |
| 5:30 AM to 5:59 AM | 53 (10.0%) | 10 (1.8%) |
| 6:00 AM to 6:29 AM | 129 (24.3%) | 26 (4.8%) |
| 6:30 AM to 6:59 AM | 22 (4.1%) | 69 (12.7%) |
| 7:00 AM to 7:29 AM | 13 (2.5%) | 157 (29.0%) |
| 7:30 AM to 7:59 AM | 50 (9.4%) | 76 (14.0%) |
| 8:00 AM to 8:29 AM | 15 (2.8%) | 21 (3.9%) |
| 8:30 AM to 8:59 AM | 7 (1.3%) | 7 (1.3%) |
| 9:00 AM to 9:59 AM | 36 (6.8%) | 17 (3.1%) |
| 10:00 AM to 10:59 AM | 10 (1.9%) | 0 (0.0%) |
| 11:00 AM to 11:59 AM | 0 (0.0%) | 0 (0.0%) |
| 12:00 PM to 3:59 PM | 38 (7.2%) | 17 (3.1%) |
| 4:00 PM to 11:59 PM | 76 (14.3%) | 107 (19.7%) |
| Total | 531 (100.0%) | 542 (100.0%) |
Housing Occupancy in Albany
Occupancy by Ownership in Albany
Of the total 1,221 dwellings in Albany, owner-occupied units account for 966 (79.1%), while renter-occupied units make up 255 (20.9%).
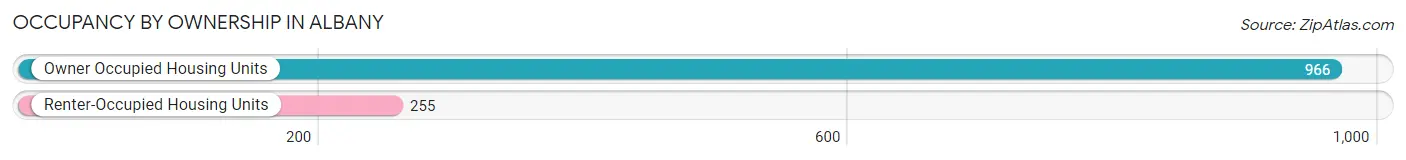
| Occupancy | # Housing Units | % Housing Units |
| Owner Occupied Housing Units | 966 | 79.1% |
| Renter-Occupied Housing Units | 255 | 20.9% |
| Total Occupied Housing Units | 1,221 | 100.0% |
Occupancy by Household Size in Albany
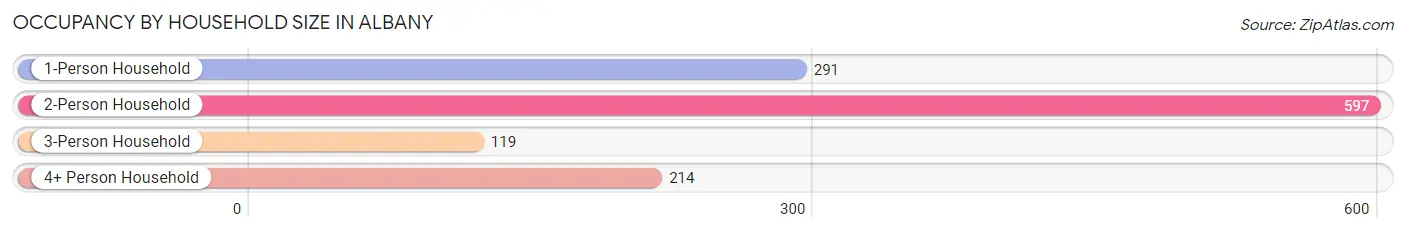
| Household Size | # Housing Units | % Housing Units |
| 1-Person Household | 291 | 23.8% |
| 2-Person Household | 597 | 48.9% |
| 3-Person Household | 119 | 9.8% |
| 4+ Person Household | 214 | 17.5% |
| Total Housing Units | 1,221 | 100.0% |
Occupancy by Ownership by Household Size in Albany
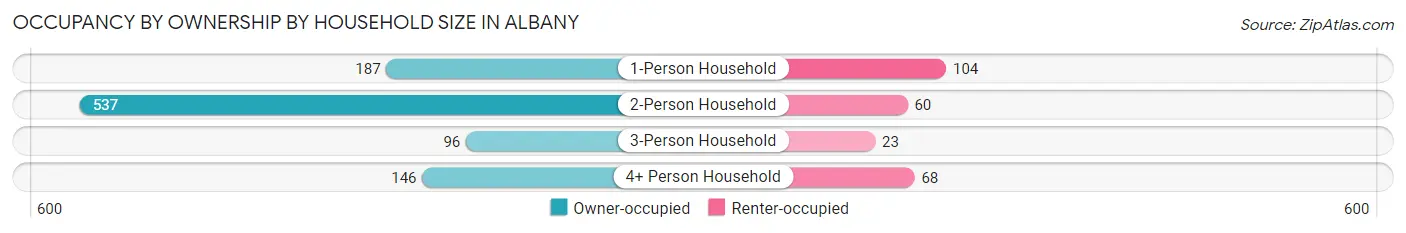
| Household Size | Owner-occupied | Renter-occupied |
| 1-Person Household | 187 (64.3%) | 104 (35.7%) |
| 2-Person Household | 537 (89.9%) | 60 (10.1%) |
| 3-Person Household | 96 (80.7%) | 23 (19.3%) |
| 4+ Person Household | 146 (68.2%) | 68 (31.8%) |
| Total Housing Units | 966 (79.1%) | 255 (20.9%) |
Occupancy by Educational Attainment in Albany
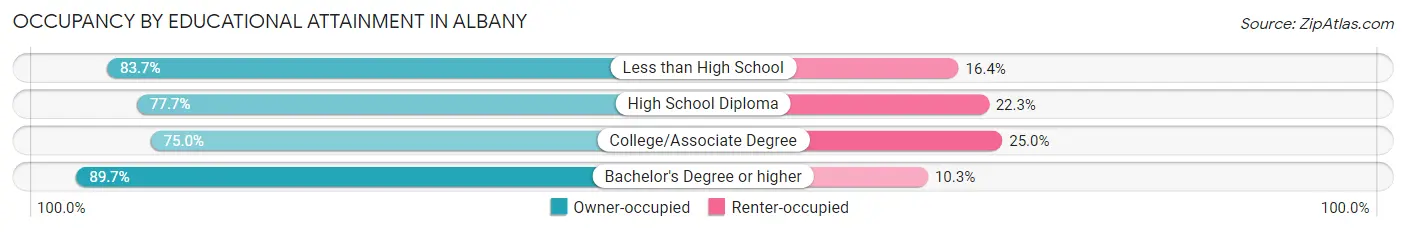
| Household Size | Owner-occupied | Renter-occupied |
| Less than High School | 87 (83.7%) | 17 (16.4%) |
| High School Diploma | 404 (77.7%) | 116 (22.3%) |
| College/Associate Degree | 309 (75.0%) | 103 (25.0%) |
| Bachelor's Degree or higher | 166 (89.7%) | 19 (10.3%) |
Occupancy by Age of Householder in Albany
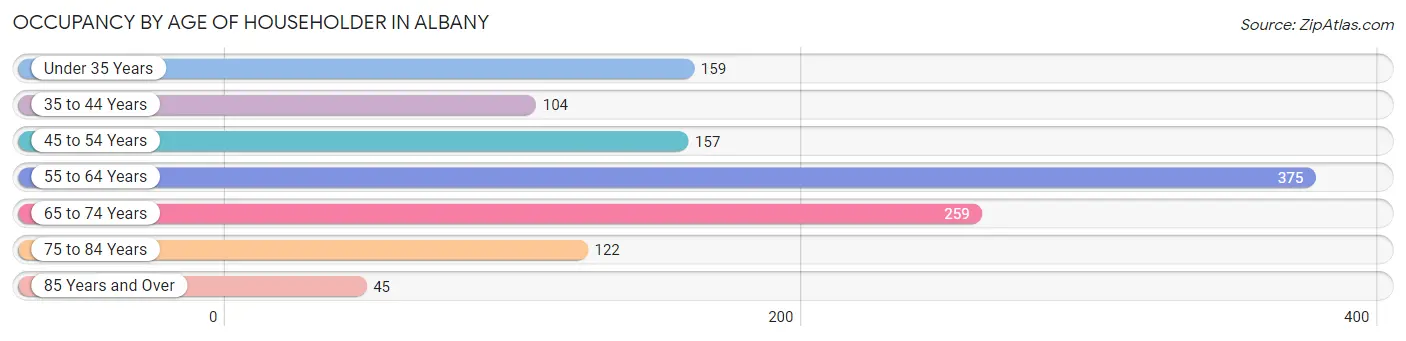
| Age Bracket | # Households | % Households |
| Under 35 Years | 159 | 13.0% |
| 35 to 44 Years | 104 | 8.5% |
| 45 to 54 Years | 157 | 12.9% |
| 55 to 64 Years | 375 | 30.7% |
| 65 to 74 Years | 259 | 21.2% |
| 75 to 84 Years | 122 | 10.0% |
| 85 Years and Over | 45 | 3.7% |
| Total | 1,221 | 100.0% |
Housing Finances in Albany
Median Income by Occupancy in Albany
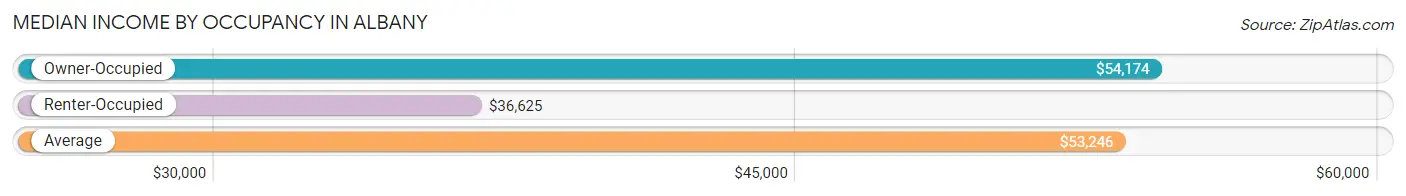
| Occupancy Type | # Households | Median Income |
| Owner-Occupied | 966 (79.1%) | $54,174 |
| Renter-Occupied | 255 (20.9%) | $36,625 |
| Average | 1,221 (100.0%) | $53,246 |
Occupancy by Householder Income Bracket in Albany
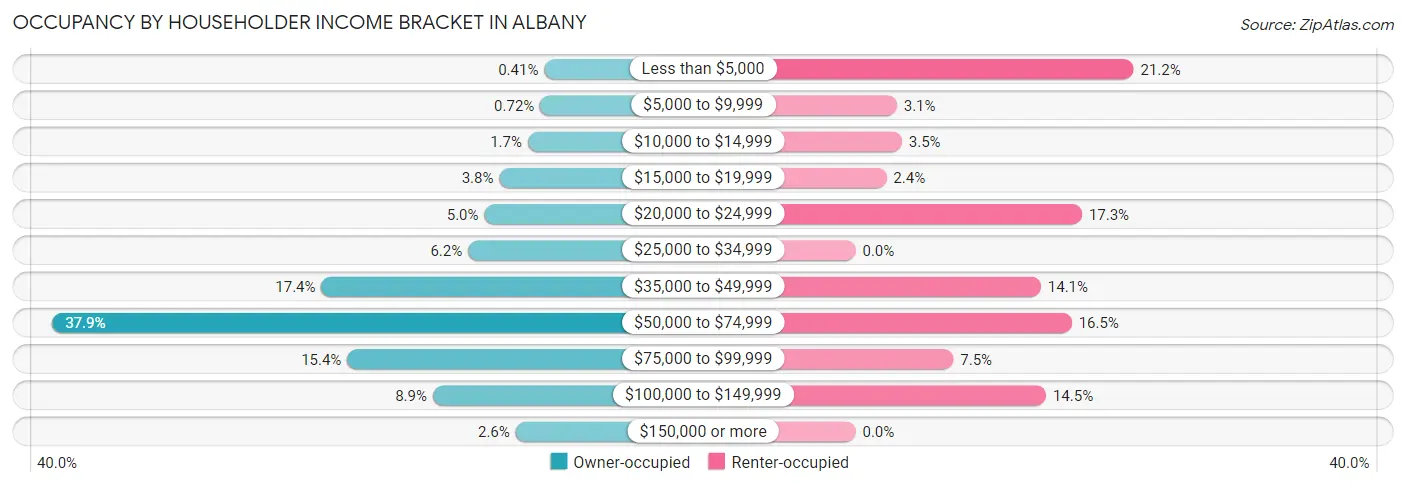
| Income Bracket | Owner-occupied | Renter-occupied |
| Less than $5,000 | 4 (0.4%) | 54 (21.2%) |
| $5,000 to $9,999 | 7 (0.7%) | 8 (3.1%) |
| $10,000 to $14,999 | 16 (1.7%) | 9 (3.5%) |
| $15,000 to $19,999 | 37 (3.8%) | 6 (2.4%) |
| $20,000 to $24,999 | 48 (5.0%) | 44 (17.2%) |
| $25,000 to $34,999 | 60 (6.2%) | 0 (0.0%) |
| $35,000 to $49,999 | 168 (17.4%) | 36 (14.1%) |
| $50,000 to $74,999 | 366 (37.9%) | 42 (16.5%) |
| $75,000 to $99,999 | 149 (15.4%) | 19 (7.4%) |
| $100,000 to $149,999 | 86 (8.9%) | 37 (14.5%) |
| $150,000 or more | 25 (2.6%) | 0 (0.0%) |
| Total | 966 (100.0%) | 255 (100.0%) |
Monthly Housing Cost Tiers in Albany
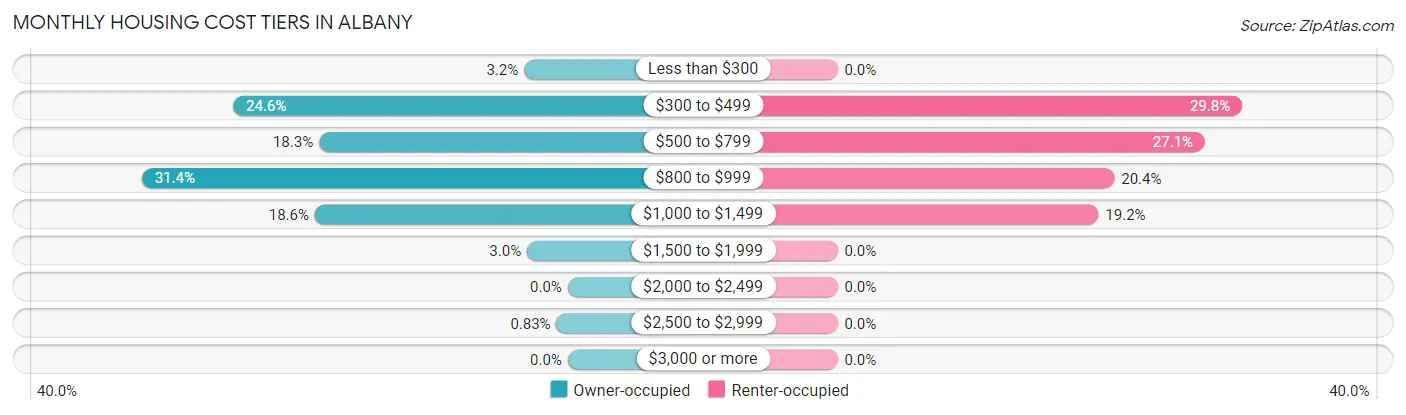
| Monthly Cost | Owner-occupied | Renter-occupied |
| Less than $300 | 31 (3.2%) | 0 (0.0%) |
| $300 to $499 | 238 (24.6%) | 76 (29.8%) |
| $500 to $799 | 177 (18.3%) | 69 (27.1%) |
| $800 to $999 | 303 (31.4%) | 52 (20.4%) |
| $1,000 to $1,499 | 180 (18.6%) | 49 (19.2%) |
| $1,500 to $1,999 | 29 (3.0%) | 0 (0.0%) |
| $2,000 to $2,499 | 0 (0.0%) | 0 (0.0%) |
| $2,500 to $2,999 | 8 (0.8%) | 0 (0.0%) |
| $3,000 or more | 0 (0.0%) | 0 (0.0%) |
| Total | 966 (100.0%) | 255 (100.0%) |
Physical Housing Characteristics in Albany
Housing Structures in Albany
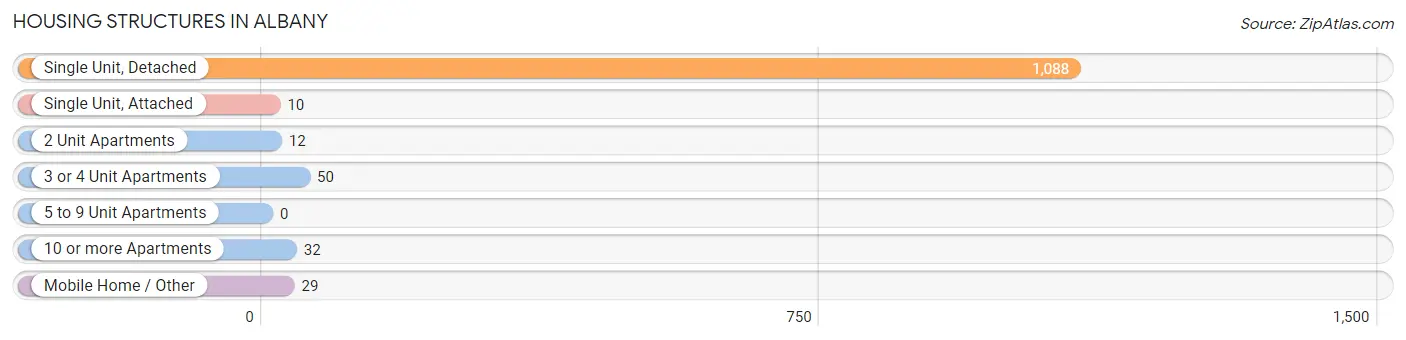
| Structure Type | # Housing Units | % Housing Units |
| Single Unit, Detached | 1,088 | 89.1% |
| Single Unit, Attached | 10 | 0.8% |
| 2 Unit Apartments | 12 | 1.0% |
| 3 or 4 Unit Apartments | 50 | 4.1% |
| 5 to 9 Unit Apartments | 0 | 0.0% |
| 10 or more Apartments | 32 | 2.6% |
| Mobile Home / Other | 29 | 2.4% |
| Total | 1,221 | 100.0% |
Housing Structures by Occupancy in Albany
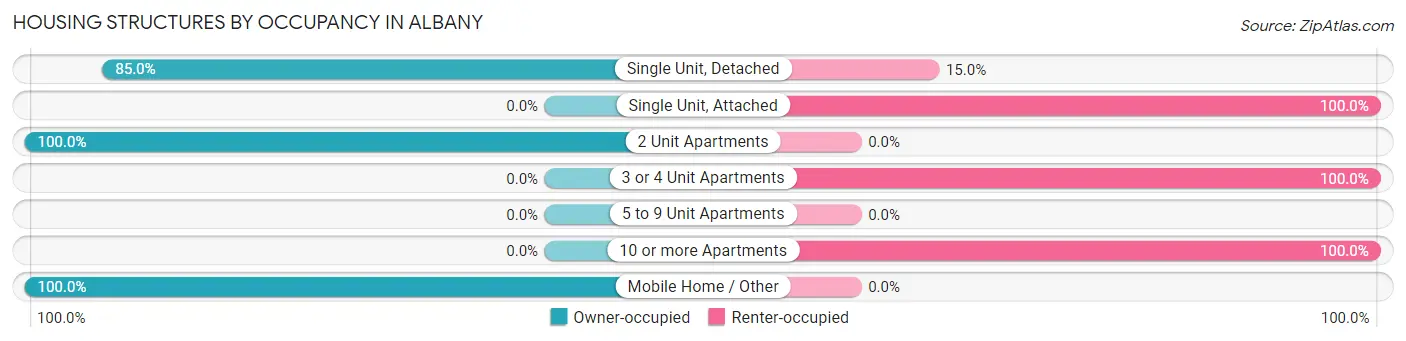
| Structure Type | Owner-occupied | Renter-occupied |
| Single Unit, Detached | 925 (85.0%) | 163 (15.0%) |
| Single Unit, Attached | 0 (0.0%) | 10 (100.0%) |
| 2 Unit Apartments | 12 (100.0%) | 0 (0.0%) |
| 3 or 4 Unit Apartments | 0 (0.0%) | 50 (100.0%) |
| 5 to 9 Unit Apartments | 0 (0.0%) | 0 (0.0%) |
| 10 or more Apartments | 0 (0.0%) | 32 (100.0%) |
| Mobile Home / Other | 29 (100.0%) | 0 (0.0%) |
| Total | 966 (79.1%) | 255 (20.9%) |
Housing Structures by Number of Rooms in Albany
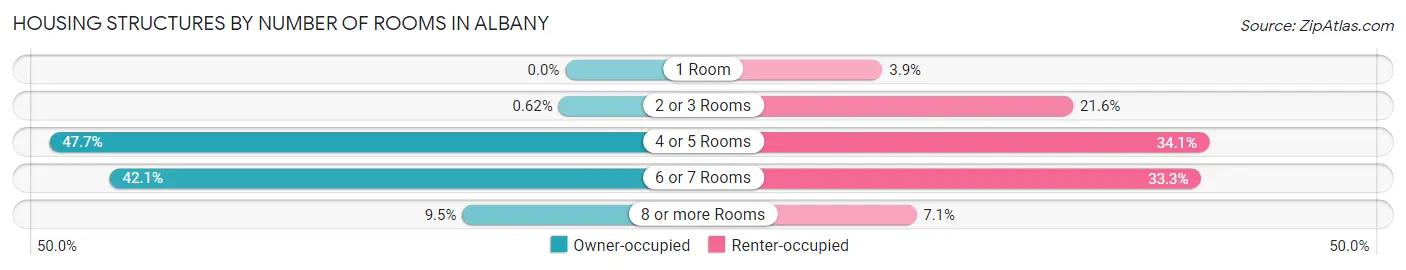
| Number of Rooms | Owner-occupied | Renter-occupied |
| 1 Room | 0 (0.0%) | 10 (3.9%) |
| 2 or 3 Rooms | 6 (0.6%) | 55 (21.6%) |
| 4 or 5 Rooms | 461 (47.7%) | 87 (34.1%) |
| 6 or 7 Rooms | 407 (42.1%) | 85 (33.3%) |
| 8 or more Rooms | 92 (9.5%) | 18 (7.1%) |
| Total | 966 (100.0%) | 255 (100.0%) |
Housing Structure by Heating Type in Albany
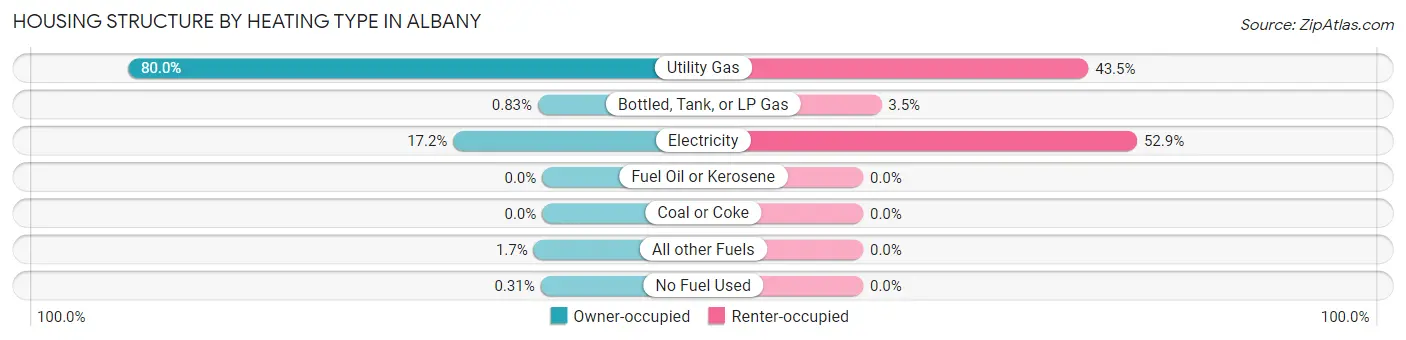
| Heating Type | Owner-occupied | Renter-occupied |
| Utility Gas | 773 (80.0%) | 111 (43.5%) |
| Bottled, Tank, or LP Gas | 8 (0.8%) | 9 (3.5%) |
| Electricity | 166 (17.2%) | 135 (52.9%) |
| Fuel Oil or Kerosene | 0 (0.0%) | 0 (0.0%) |
| Coal or Coke | 0 (0.0%) | 0 (0.0%) |
| All other Fuels | 16 (1.7%) | 0 (0.0%) |
| No Fuel Used | 3 (0.3%) | 0 (0.0%) |
| Total | 966 (100.0%) | 255 (100.0%) |
Household Vehicle Usage in Albany
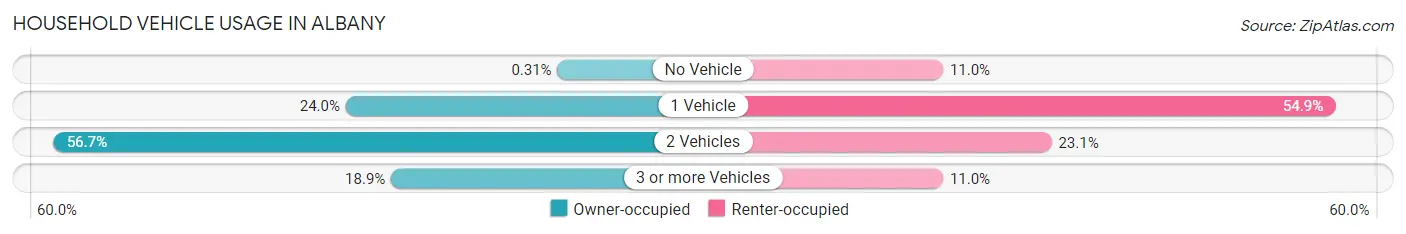
| Vehicles per Household | Owner-occupied | Renter-occupied |
| No Vehicle | 3 (0.3%) | 28 (11.0%) |
| 1 Vehicle | 232 (24.0%) | 140 (54.9%) |
| 2 Vehicles | 548 (56.7%) | 59 (23.1%) |
| 3 or more Vehicles | 183 (18.9%) | 28 (11.0%) |
| Total | 966 (100.0%) | 255 (100.0%) |
Real Estate & Mortgages in Albany
Real Estate and Mortgage Overview in Albany
| Characteristic | Without Mortgage | With Mortgage |
| Housing Units | 372 | 594 |
| Median Property Value | $121,900 | $88,500 |
| Median Household Income | $53,214 | $15 |
| Monthly Housing Costs | $391 | $0 |
| Real Estate Taxes | $1,175 | $61 |
Property Value by Mortgage Status in Albany
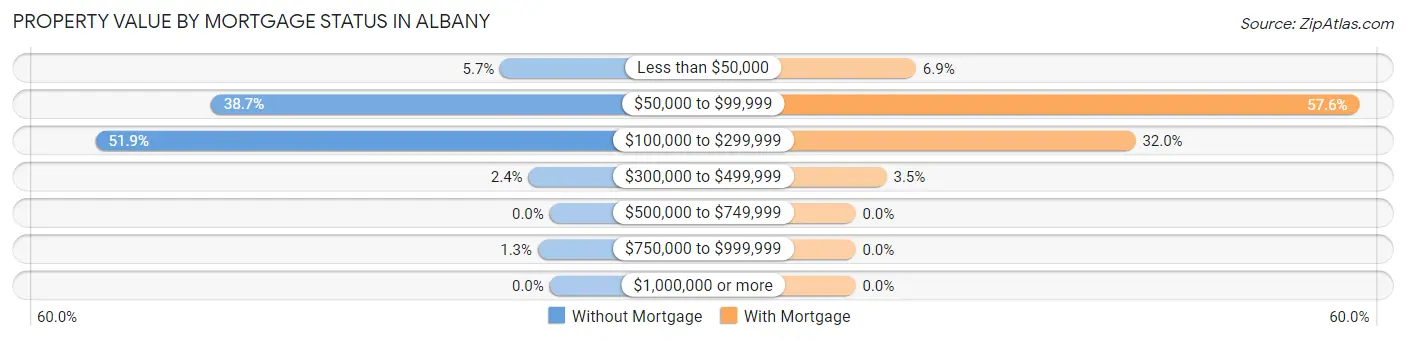
| Property Value | Without Mortgage | With Mortgage |
| Less than $50,000 | 21 (5.7%) | 41 (6.9%) |
| $50,000 to $99,999 | 144 (38.7%) | 342 (57.6%) |
| $100,000 to $299,999 | 193 (51.9%) | 190 (32.0%) |
| $300,000 to $499,999 | 9 (2.4%) | 21 (3.5%) |
| $500,000 to $749,999 | 0 (0.0%) | 0 (0.0%) |
| $750,000 to $999,999 | 5 (1.3%) | 0 (0.0%) |
| $1,000,000 or more | 0 (0.0%) | 0 (0.0%) |
| Total | 372 (100.0%) | 594 (100.0%) |
Household Income by Mortgage Status in Albany
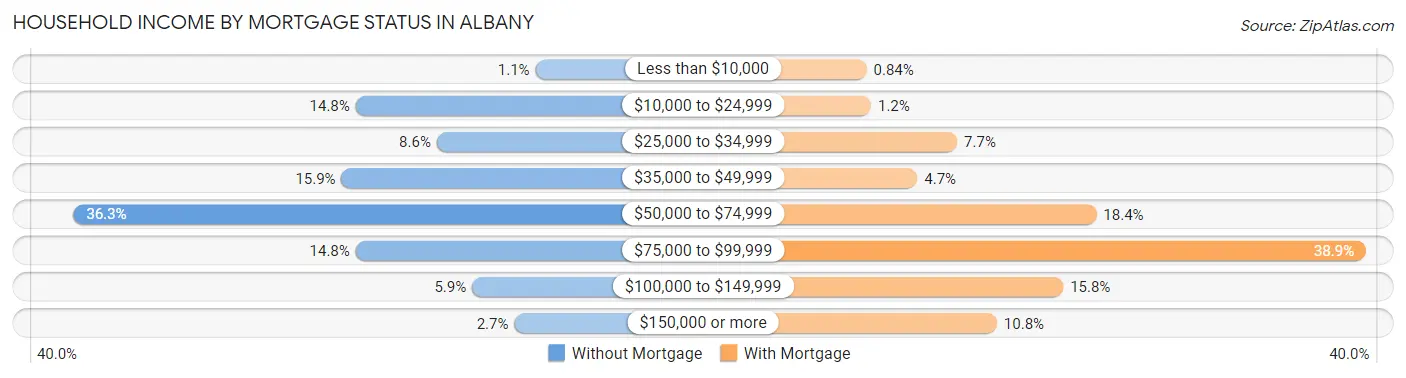
| Household Income | Without Mortgage | With Mortgage |
| Less than $10,000 | 4 (1.1%) | 5 (0.8%) |
| $10,000 to $24,999 | 55 (14.8%) | 7 (1.2%) |
| $25,000 to $34,999 | 32 (8.6%) | 46 (7.7%) |
| $35,000 to $49,999 | 59 (15.9%) | 28 (4.7%) |
| $50,000 to $74,999 | 135 (36.3%) | 109 (18.3%) |
| $75,000 to $99,999 | 55 (14.8%) | 231 (38.9%) |
| $100,000 to $149,999 | 22 (5.9%) | 94 (15.8%) |
| $150,000 or more | 10 (2.7%) | 64 (10.8%) |
| Total | 372 (100.0%) | 594 (100.0%) |
Property Value to Household Income Ratio in Albany
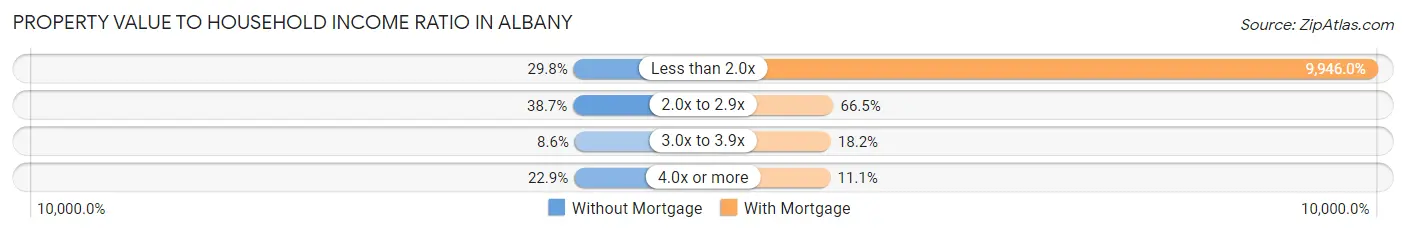
| Value-to-Income Ratio | Without Mortgage | With Mortgage |
| Less than 2.0x | 111 (29.8%) | 59,079 (9,946.0%) |
| 2.0x to 2.9x | 144 (38.7%) | 395 (66.5%) |
| 3.0x to 3.9x | 32 (8.6%) | 108 (18.2%) |
| 4.0x or more | 85 (22.9%) | 66 (11.1%) |
| Total | 372 (100.0%) | 594 (100.0%) |
Real Estate Taxes by Mortgage Status in Albany
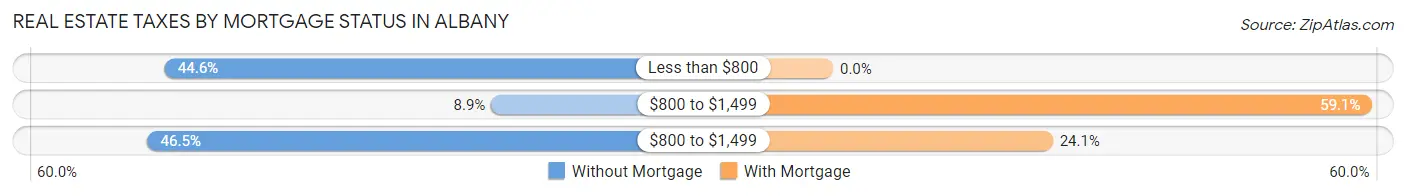
| Property Taxes | Without Mortgage | With Mortgage |
| Less than $800 | 166 (44.6%) | 0 (0.0%) |
| $800 to $1,499 | 33 (8.9%) | 351 (59.1%) |
| $800 to $1,499 | 173 (46.5%) | 143 (24.1%) |
| Total | 372 (100.0%) | 594 (100.0%) |
Health & Disability in Albany
Health Insurance Coverage by Age in Albany
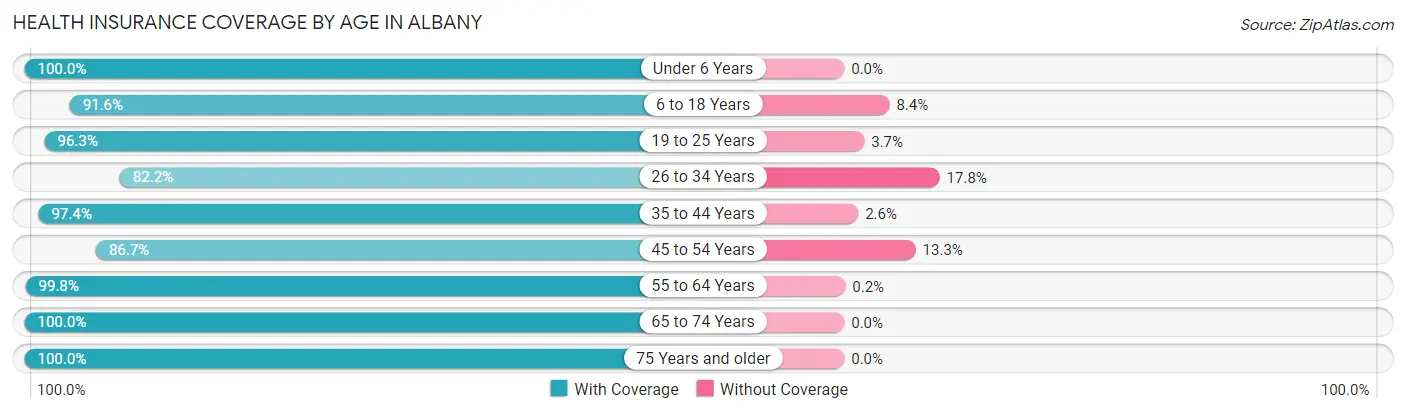
| Age Bracket | With Coverage | Without Coverage |
| Under 6 Years | 102 (100.0%) | 0 (0.0%) |
| 6 to 18 Years | 391 (91.6%) | 36 (8.4%) |
| 19 to 25 Years | 232 (96.3%) | 9 (3.7%) |
| 26 to 34 Years | 222 (82.2%) | 48 (17.8%) |
| 35 to 44 Years | 225 (97.4%) | 6 (2.6%) |
| 45 to 54 Years | 280 (86.7%) | 43 (13.3%) |
| 55 to 64 Years | 492 (99.8%) | 1 (0.2%) |
| 65 to 74 Years | 340 (100.0%) | 0 (0.0%) |
| 75 Years and older | 339 (100.0%) | 0 (0.0%) |
| Total | 2,623 (94.8%) | 143 (5.2%) |
Health Insurance Coverage by Citizenship Status in Albany
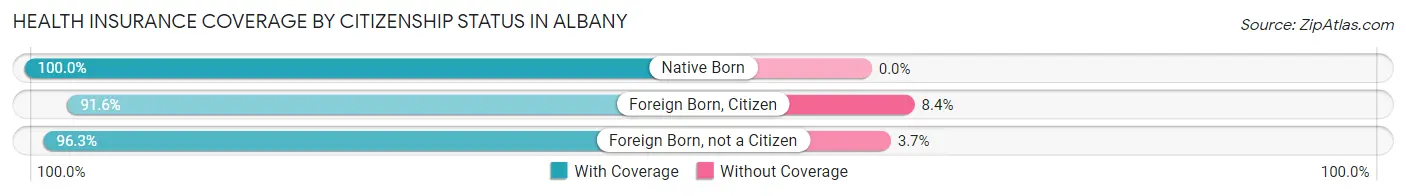
| Citizenship Status | With Coverage | Without Coverage |
| Native Born | 102 (100.0%) | 0 (0.0%) |
| Foreign Born, Citizen | 391 (91.6%) | 36 (8.4%) |
| Foreign Born, not a Citizen | 232 (96.3%) | 9 (3.7%) |
Health Insurance Coverage by Household Income in Albany
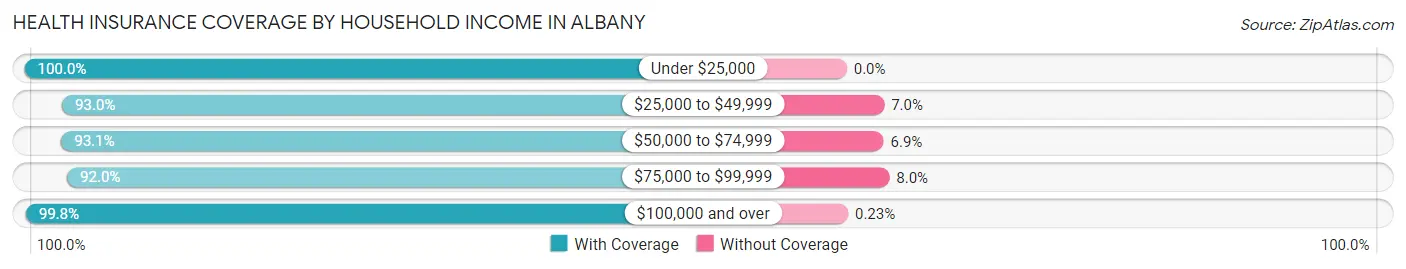
| Household Income | With Coverage | Without Coverage |
| Under $25,000 | 342 (100.0%) | 0 (0.0%) |
| $25,000 to $49,999 | 531 (93.0%) | 40 (7.0%) |
| $50,000 to $74,999 | 919 (93.1%) | 68 (6.9%) |
| $75,000 to $99,999 | 392 (92.0%) | 34 (8.0%) |
| $100,000 and over | 439 (99.8%) | 1 (0.2%) |
Public vs Private Health Insurance Coverage by Age in Albany
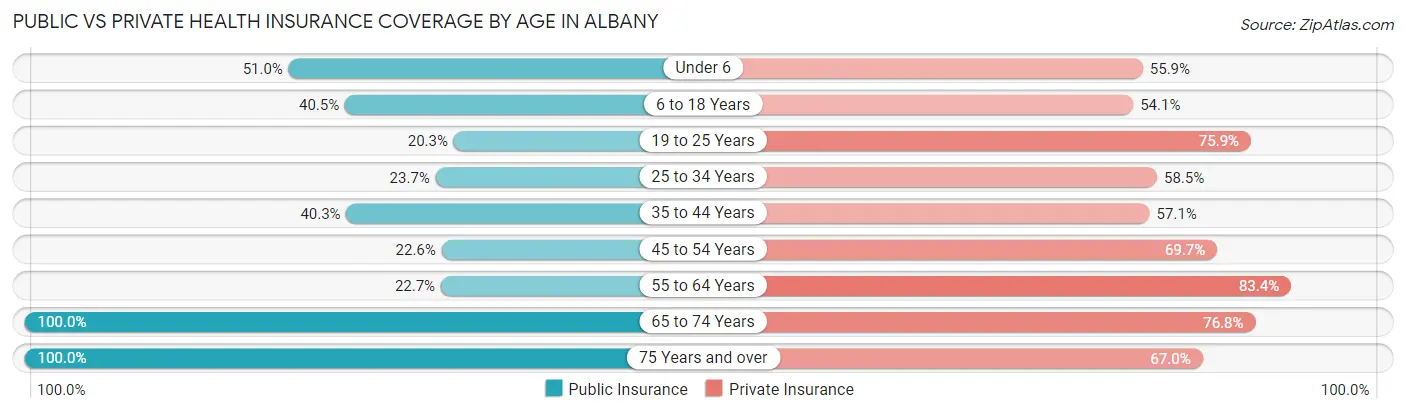
| Age Bracket | Public Insurance | Private Insurance |
| Under 6 | 52 (51.0%) | 57 (55.9%) |
| 6 to 18 Years | 173 (40.5%) | 231 (54.1%) |
| 19 to 25 Years | 49 (20.3%) | 183 (75.9%) |
| 25 to 34 Years | 64 (23.7%) | 158 (58.5%) |
| 35 to 44 Years | 93 (40.3%) | 132 (57.1%) |
| 45 to 54 Years | 73 (22.6%) | 225 (69.7%) |
| 55 to 64 Years | 112 (22.7%) | 411 (83.4%) |
| 65 to 74 Years | 340 (100.0%) | 261 (76.8%) |
| 75 Years and over | 339 (100.0%) | 227 (67.0%) |
| Total | 1,295 (46.8%) | 1,885 (68.1%) |
Disability Status by Sex by Age in Albany
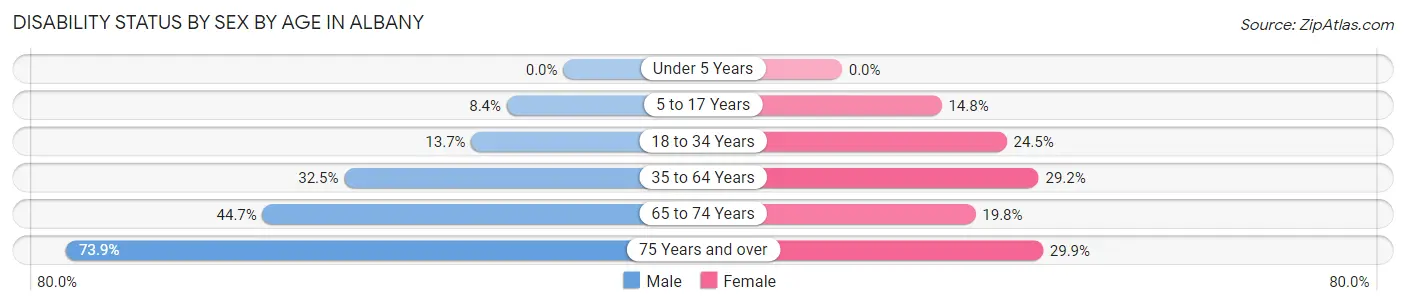
| Age Bracket | Male | Female |
| Under 5 Years | 0 (0.0%) | 0 (0.0%) |
| 5 to 17 Years | 13 (8.4%) | 33 (14.8%) |
| 18 to 34 Years | 34 (13.7%) | 79 (24.5%) |
| 35 to 64 Years | 148 (32.5%) | 173 (29.2%) |
| 65 to 74 Years | 46 (44.7%) | 47 (19.8%) |
| 75 Years and over | 144 (73.9%) | 43 (29.9%) |
Disability Class by Sex by Age in Albany
Disability Class: Hearing Difficulty
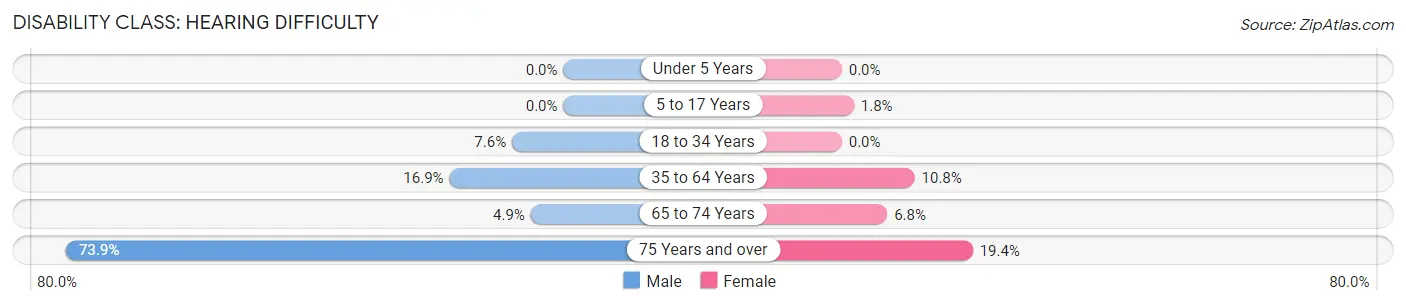
| Age Bracket | Male | Female |
| Under 5 Years | 0 (0.0%) | 0 (0.0%) |
| 5 to 17 Years | 0 (0.0%) | 4 (1.8%) |
| 18 to 34 Years | 19 (7.6%) | 0 (0.0%) |
| 35 to 64 Years | 77 (16.9%) | 64 (10.8%) |
| 65 to 74 Years | 5 (4.9%) | 16 (6.8%) |
| 75 Years and over | 144 (73.9%) | 28 (19.4%) |
Disability Class: Vision Difficulty
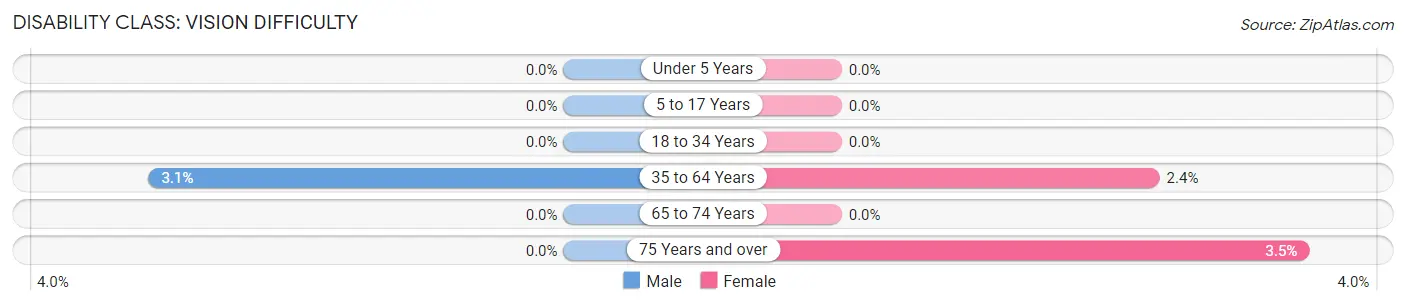
| Age Bracket | Male | Female |
| Under 5 Years | 0 (0.0%) | 0 (0.0%) |
| 5 to 17 Years | 0 (0.0%) | 0 (0.0%) |
| 18 to 34 Years | 0 (0.0%) | 0 (0.0%) |
| 35 to 64 Years | 14 (3.1%) | 14 (2.4%) |
| 65 to 74 Years | 0 (0.0%) | 0 (0.0%) |
| 75 Years and over | 0 (0.0%) | 5 (3.5%) |
Disability Class: Cognitive Difficulty
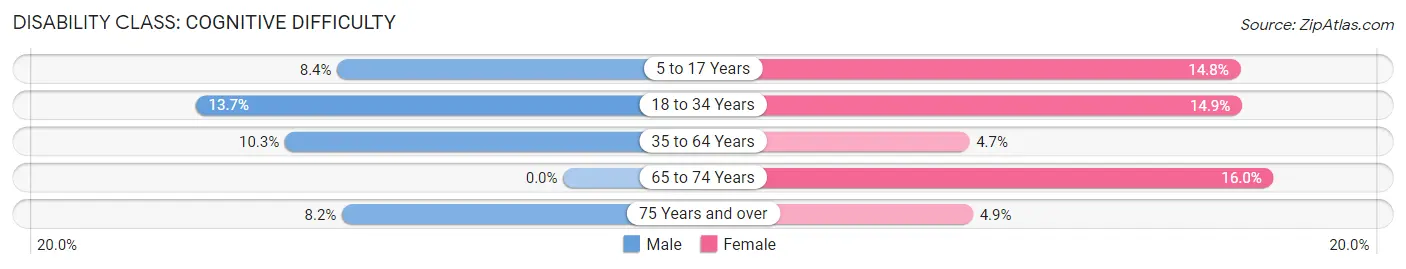
| Age Bracket | Male | Female |
| 5 to 17 Years | 13 (8.4%) | 33 (14.8%) |
| 18 to 34 Years | 34 (13.7%) | 48 (14.9%) |
| 35 to 64 Years | 47 (10.3%) | 28 (4.7%) |
| 65 to 74 Years | 0 (0.0%) | 38 (16.0%) |
| 75 Years and over | 16 (8.2%) | 7 (4.9%) |
Disability Class: Ambulatory Difficulty
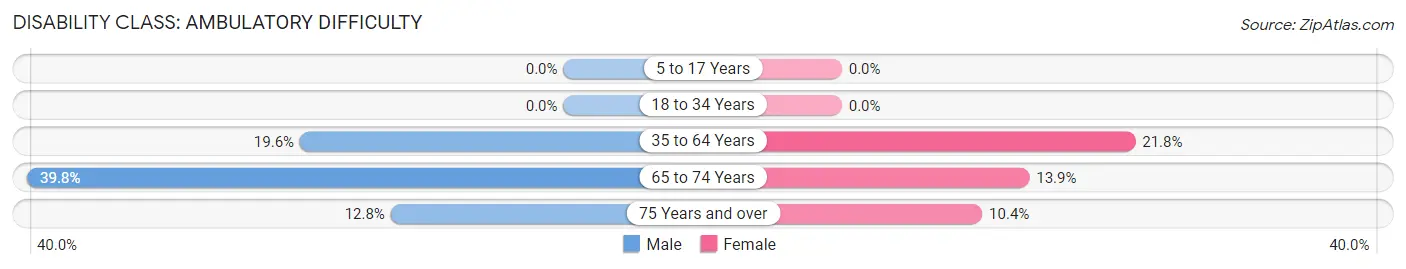
| Age Bracket | Male | Female |
| 5 to 17 Years | 0 (0.0%) | 0 (0.0%) |
| 18 to 34 Years | 0 (0.0%) | 0 (0.0%) |
| 35 to 64 Years | 89 (19.6%) | 129 (21.8%) |
| 65 to 74 Years | 41 (39.8%) | 33 (13.9%) |
| 75 Years and over | 25 (12.8%) | 15 (10.4%) |
Disability Class: Self-Care Difficulty
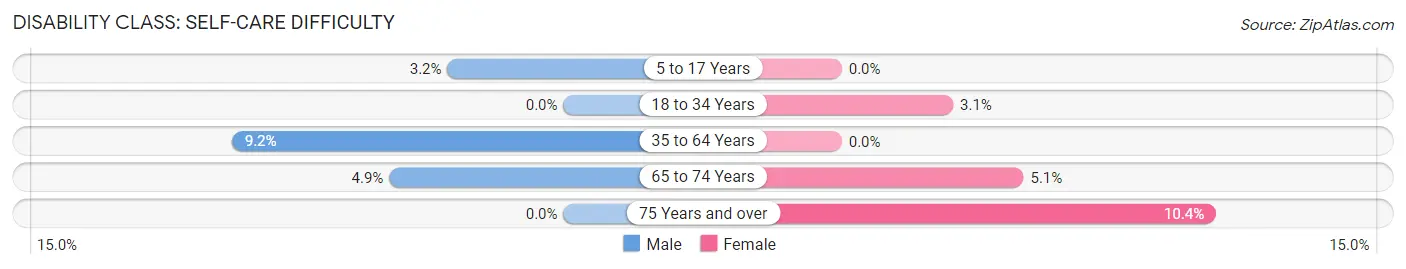
| Age Bracket | Male | Female |
| 5 to 17 Years | 5 (3.2%) | 0 (0.0%) |
| 18 to 34 Years | 0 (0.0%) | 10 (3.1%) |
| 35 to 64 Years | 42 (9.2%) | 0 (0.0%) |
| 65 to 74 Years | 5 (4.9%) | 12 (5.1%) |
| 75 Years and over | 0 (0.0%) | 15 (10.4%) |
Technology Access in Albany
Computing Device Access in Albany
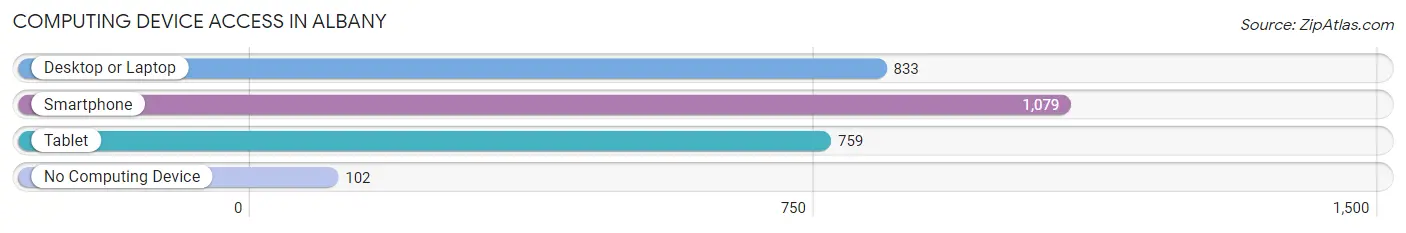
| Device Type | # Households | % Households |
| Desktop or Laptop | 833 | 68.2% |
| Smartphone | 1,079 | 88.4% |
| Tablet | 759 | 62.2% |
| No Computing Device | 102 | 8.4% |
| Total | 1,221 | 100.0% |
Internet Access in Albany
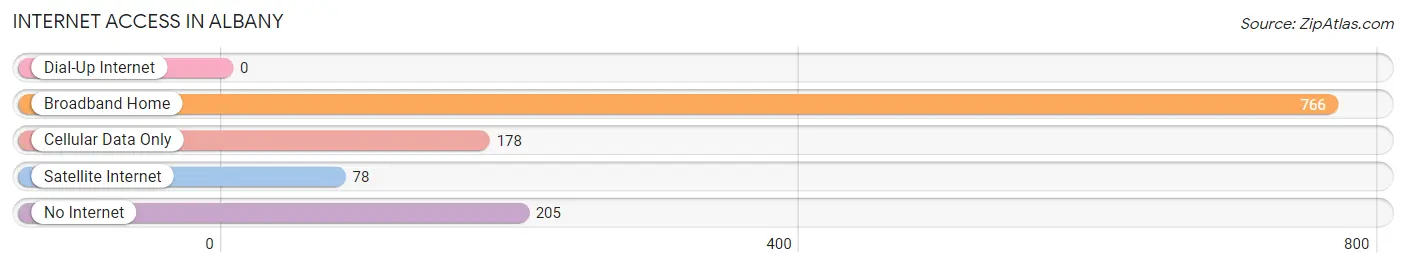
| Internet Type | # Households | % Households |
| Dial-Up Internet | 0 | 0.0% |
| Broadband Home | 766 | 62.7% |
| Cellular Data Only | 178 | 14.6% |
| Satellite Internet | 78 | 6.4% |
| No Internet | 205 | 16.8% |
| Total | 1,221 | 100.0% |
Albany Summary
Albany is a small town located in Delaware County, Indiana, United States. It is situated on the banks of the White River, approximately 20 miles northeast of Muncie. The population of Albany was 1,845 at the 2010 census.
History
Albany was founded in 1837 by a group of settlers from Albany, New York. The town was named after the New York city, and the settlers brought with them many of the same customs and traditions. The first post office was established in 1838, and the first school was built in 1841.
The town grew slowly but steadily, and by the late 19th century, it had become a thriving agricultural center. The town was also home to several small businesses, including a sawmill, a grist mill, and a blacksmith shop.
In the early 20th century, Albany experienced a period of growth and prosperity. The town was home to several factories, including a canning factory, a furniture factory, and a brickyard. The town also had a thriving business district, with several stores, restaurants, and other businesses.
Geography
Albany is located at 40°25'25"N 85°30'45"W (40.423, -85.512). According to the United States Census Bureau, the town has a total area of 0.9 square miles (2.3 km2), all of it land.
The town is situated on the banks of the White River, and is surrounded by rolling hills and farmland. The town is located approximately 20 miles northeast of Muncie, and is accessible via State Road 28.
Economy
Albany's economy is largely based on agriculture. The town is home to several farms, and the surrounding area is known for its production of corn, soybeans, and wheat.
The town is also home to several small businesses, including a grocery store, a hardware store, and a restaurant. The town also has a post office, a bank, and a library.
Demographics
As of the 2010 census, there were 1,845 people, 745 households, and 486 families residing in the town. The population density was 2,037.2 people per square mile (788.3/km2). There were 817 housing units at an average density of 899.2 per square mile (347.3/km2). The racial makeup of the town was 97.2% White, 0.7% African American, 0.2% Native American, 0.2% Asian, 0.2% from other races, and 1.7% from two or more races. Hispanic or Latino of any race were 1.2% of the population.
There were 745 households, out of which 28.2% had children under the age of 18 living with them, 48.2% were married couples living together, 11.7% had a female householder with no husband present, and 35.7% were non-families. 30.7% of all households were made up of individuals, and 14.2% had someone living alone who was 65 years of age or older. The average household size was 2.45 and the average family size was 3.04.
In the town, the population was spread out, with 25.2% under the age of 18, 8.2% from 18 to 24, 27.2% from 25 to 44, 22.7% from 45 to 64, and 16.7% who were 65 years of age or older. The median age was 37 years. For every 100 females, there were 91.2 males. For every 100 females age 18 and over, there were 87.2 males.
The median income for a household in the town was $35,000, and the median income for a family was $41,250. Males had a median income of $31,250 versus $21,250 for females. The per capita income for the town was $17,845. About 8.2% of families and 10.2% of the population were below the poverty line, including 14.2% of those under age 18 and 8.2% of those age 65 or over.
Common Questions
What is Per Capita Income in Albany?
Per Capita income in Albany is $25,910.
What is the Median Family Income in Albany?
Median Family Income in Albany is $57,132.
What is the Median Household income in Albany?
Median Household Income in Albany is $53,246.
What is Income or Wage Gap in Albany?
Income or Wage Gap in Albany is 33.9%.
Women in Albany earn 66.1 cents for every dollar earned by a man.
What is Family Income Deficit in Albany?
Family Income Deficit in Albany is $10,540.
Families that are below poverty line in Albany earn $10,540 less on average than the poverty threshold level.
What is Inequality or Gini Index in Albany?
Inequality or Gini Index in Albany is 0.34.
What is the Total Population of Albany?
Total Population of Albany is 2,854.
What is the Total Male Population of Albany?
Total Male Population of Albany is 1,252.
What is the Total Female Population of Albany?
Total Female Population of Albany is 1,602.
What is the Ratio of Males per 100 Females in Albany?
There are 78.15 Males per 100 Females in Albany.
What is the Ratio of Females per 100 Males in Albany?
There are 127.96 Females per 100 Males in Albany.
What is the Median Population Age in Albany?
Median Population Age in Albany is 49.2 Years.
What is the Average Family Size in Albany
Average Family Size in Albany is 2.6 People.
What is the Average Household Size in Albany
Average Household Size in Albany is 2.3 People.
How Large is the Labor Force in Albany?
There are 1,237 People in the Labor Forcein in Albany.
What is the Percentage of People in the Labor Force in Albany?
51.4% of People are in the Labor Force in Albany.
What is the Unemployment Rate in Albany?
Unemployment Rate in Albany is 3.8%.