Alamo, IN Map & Demographics
Alamo Map
Alamo Overview
$15,813
PER CAPITA INCOME
25.8%
WAGE / INCOME GAP [ % ]
74.2¢/ $1
WAGE / INCOME GAP [ $ ]
0.26
INEQUALITY / GINI INDEX
56
TOTAL POPULATION
27
MALE POPULATION
29
FEMALE POPULATION
93.10
MALES / 100 FEMALES
107.41
FEMALES / 100 MALES
28.8
MEDIAN AGE
2.9
AVG FAMILY SIZE
3.0
AVG HOUSEHOLD SIZE
25
LABOR FORCE [ PEOPLE ]
62.5%
PERCENT IN LABOR FORCE
8.0%
UNEMPLOYMENT RATE
Alamo Zip Codes
Alamo Area Codes
Income in Alamo
Income Overview in Alamo
| Characteristic | Number | Measure |
| Per Capita Income | 56 | $15,813 |
| Median Family Income | 15 | $0 |
| Mean Family Income | 15 | $33,967 |
| Median Household Income | 19 | $0 |
| Mean Household Income | 19 | $38,521 |
| Income Deficit | 15 | $0 |
| Wage / Income Gap (%) | 56 | 25.79% |
| Wage / Income Gap ($) | 56 | 74.21¢ per $1 |
| Gini / Inequality Index | 56 | 0.26 |
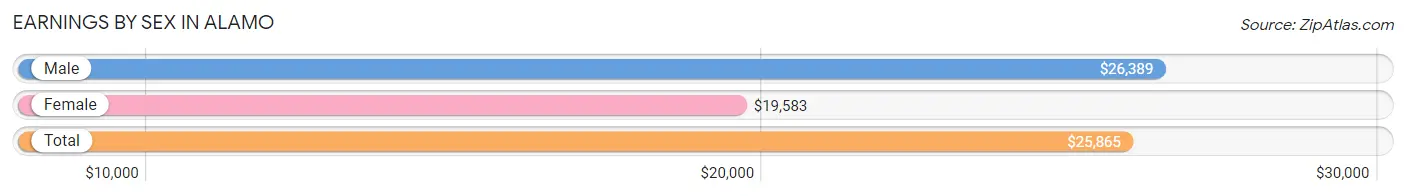
Earnings by Sex in Alamo
Average Earnings in Alamo are $25,865, $26,389 for men and $19,583 for women, a difference of 25.8%.
| Sex | Number | Average Earnings |
| Male | 14 (56.0%) | $26,389 |
| Female | 11 (44.0%) | $19,583 |
| Total | 25 (100.0%) | $25,865 |
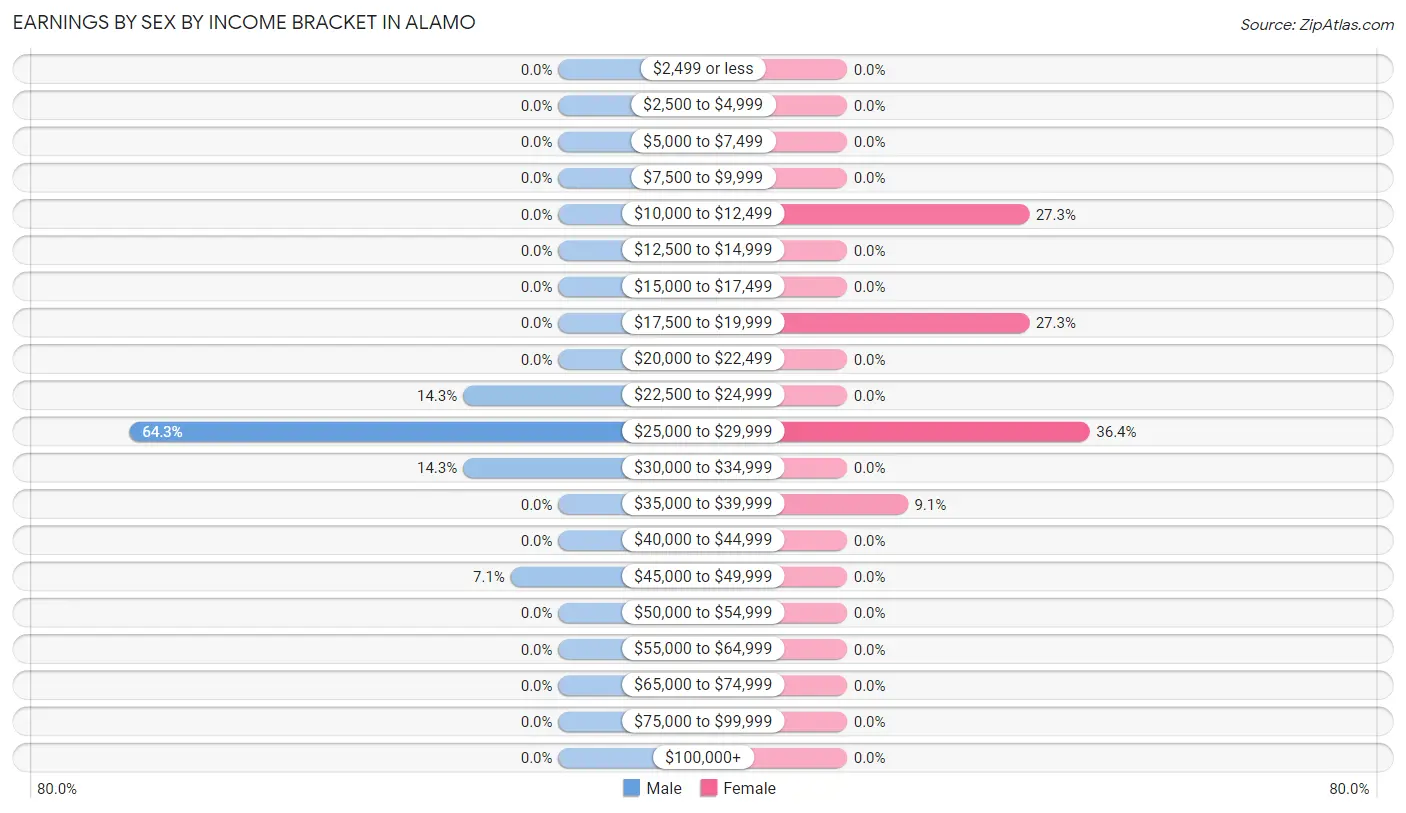
Earnings by Sex by Income Bracket in Alamo
The most common earnings brackets in Alamo are $25,000 to $29,999 for men (9 | 64.3%) and $25,000 to $29,999 for women (4 | 36.4%).
| Income | Male | Female |
| $2,499 or less | 0 (0.0%) | 0 (0.0%) |
| $2,500 to $4,999 | 0 (0.0%) | 0 (0.0%) |
| $5,000 to $7,499 | 0 (0.0%) | 0 (0.0%) |
| $7,500 to $9,999 | 0 (0.0%) | 0 (0.0%) |
| $10,000 to $12,499 | 0 (0.0%) | 3 (27.3%) |
| $12,500 to $14,999 | 0 (0.0%) | 0 (0.0%) |
| $15,000 to $17,499 | 0 (0.0%) | 0 (0.0%) |
| $17,500 to $19,999 | 0 (0.0%) | 3 (27.3%) |
| $20,000 to $22,499 | 0 (0.0%) | 0 (0.0%) |
| $22,500 to $24,999 | 2 (14.3%) | 0 (0.0%) |
| $25,000 to $29,999 | 9 (64.3%) | 4 (36.4%) |
| $30,000 to $34,999 | 2 (14.3%) | 0 (0.0%) |
| $35,000 to $39,999 | 0 (0.0%) | 1 (9.1%) |
| $40,000 to $44,999 | 0 (0.0%) | 0 (0.0%) |
| $45,000 to $49,999 | 1 (7.1%) | 0 (0.0%) |
| $50,000 to $54,999 | 0 (0.0%) | 0 (0.0%) |
| $55,000 to $64,999 | 0 (0.0%) | 0 (0.0%) |
| $65,000 to $74,999 | 0 (0.0%) | 0 (0.0%) |
| $75,000 to $99,999 | 0 (0.0%) | 0 (0.0%) |
| $100,000+ | 0 (0.0%) | 0 (0.0%) |
| Total | 14 (100.0%) | 11 (100.0%) |
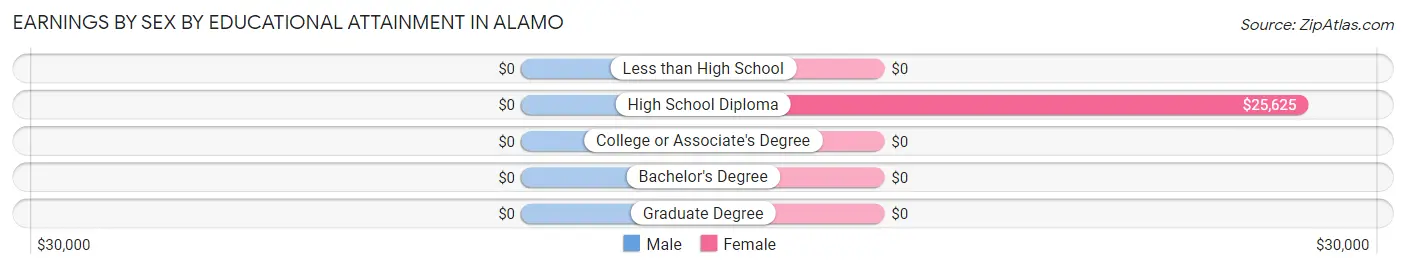
Earnings by Sex by Educational Attainment in Alamo
| Educational Attainment | Male Income | Female Income |
| Less than High School | - | - |
| High School Diploma | - | - |
| College or Associate's Degree | - | - |
| Bachelor's Degree | - | - |
| Graduate Degree | - | - |
| Total | $26,667 | $19,583 |
Family Income in Alamo
Family Income Brackets in Alamo
According to the Alamo family income data, there are 6 families falling into the $15,000 to $24,999 income range, which is the most common income bracket and makes up 40.0% of all families.
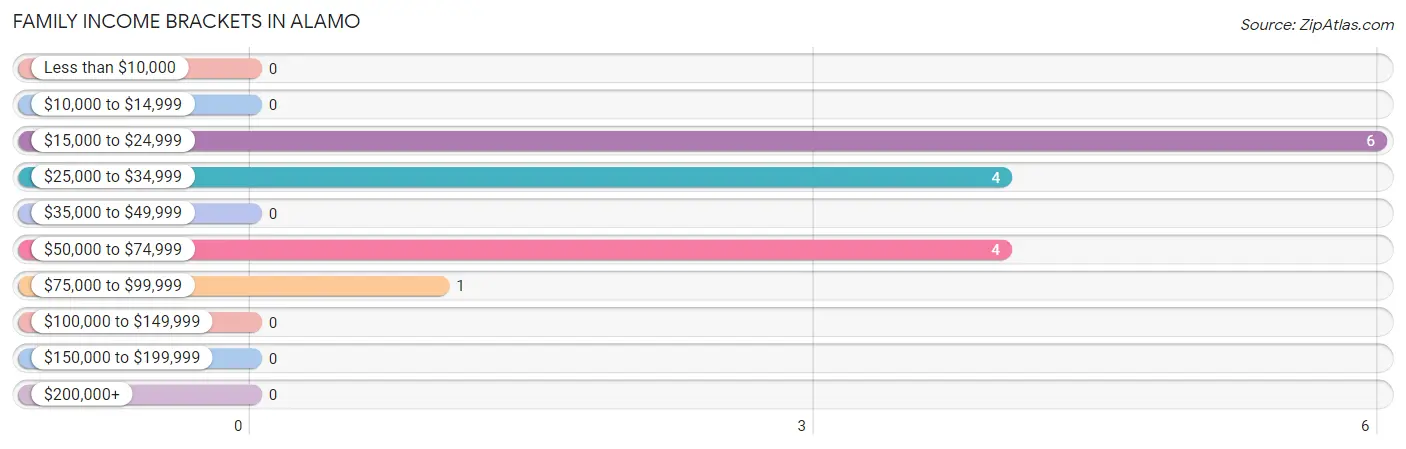
| Income Bracket | # Families | % Families |
| Less than $10,000 | 0 | 0.0% |
| $10,000 to $14,999 | 0 | 0.0% |
| $15,000 to $24,999 | 6 | 40.0% |
| $25,000 to $34,999 | 4 | 26.7% |
| $35,000 to $49,999 | 0 | 0.0% |
| $50,000 to $74,999 | 4 | 26.7% |
| $75,000 to $99,999 | 1 | 6.7% |
| $100,000 to $149,999 | 0 | 0.0% |
| $150,000 to $199,999 | 0 | 0.0% |
| $200,000+ | 0 | 0.0% |
Family Income by Famaliy Size in Alamo
| Income Bracket | # Families | Median Income |
| 2-Person Families | 4 (26.7%) | $0 |
| 3-Person Families | 6 (40.0%) | $0 |
| 4-Person Families | 5 (33.3%) | $0 |
| 5-Person Families | 0 (0.0%) | $0 |
| 6-Person Families | 0 (0.0%) | $0 |
| 7+ Person Families | 0 (0.0%) | $0 |
| Total | 15 (100.0%) | $0 |
Family Income by Number of Earners in Alamo
| Number of Earners | # Families | Median Income |
| No Earners | 6 (40.0%) | $0 |
| 1 Earner | 6 (40.0%) | $0 |
| 2 Earners | 3 (20.0%) | $0 |
| 3+ Earners | 0 (0.0%) | $0 |
| Total | 15 (100.0%) | $0 |
Household Income in Alamo
Household Income Brackets in Alamo
With 8 households falling in the category, the $50,000 to $74,999 income range is the most frequent in Alamo, accounting for 42.1% of all households.
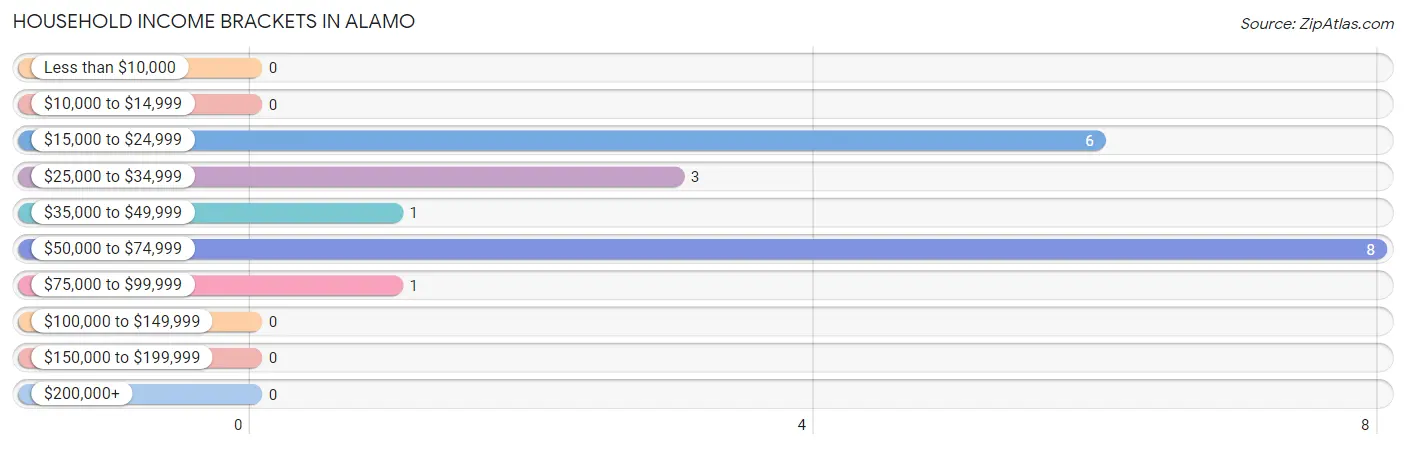
| Income Bracket | # Households | % Households |
| Less than $10,000 | 0 | 0.0% |
| $10,000 to $14,999 | 0 | 0.0% |
| $15,000 to $24,999 | 6 | 31.6% |
| $25,000 to $34,999 | 3 | 15.8% |
| $35,000 to $49,999 | 1 | 5.3% |
| $50,000 to $74,999 | 8 | 42.1% |
| $75,000 to $99,999 | 1 | 5.3% |
| $100,000 to $149,999 | 0 | 0.0% |
| $150,000 to $199,999 | 0 | 0.0% |
| $200,000+ | 0 | 0.0% |
Household Income by Householder Age in Alamo
| Income Bracket | # Households | Median Income |
| 15 to 24 Years | 0 (0.0%) | $0 |
| 25 to 44 Years | 9 (47.4%) | $0 |
| 45 to 64 Years | 4 (21.0%) | $0 |
| 65+ Years | 6 (31.6%) | $0 |
| Total | 19 (100.0%) | $0 |
Poverty in Alamo
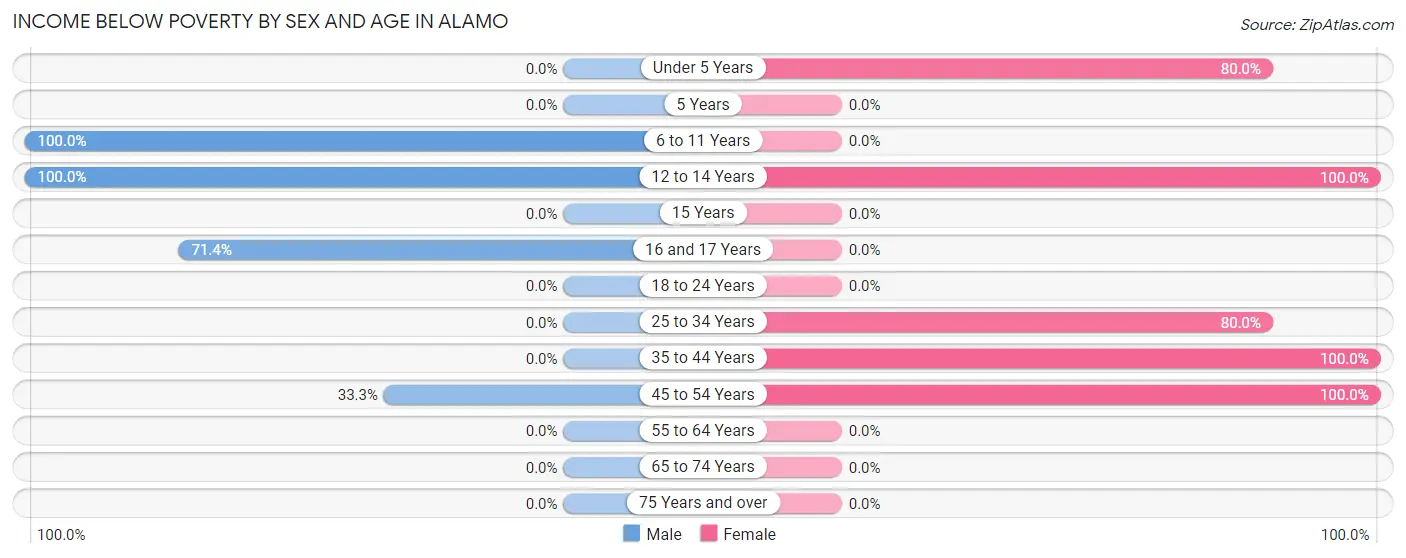
Income Below Poverty by Sex and Age in Alamo
With 33.3% poverty level for males and 72.4% for females among the residents of Alamo, 6 to 11 year old males and 12 to 14 year old females are the most vulnerable to poverty, with 2 males (100.0%) and 7 females (100.0%) in their respective age groups living below the poverty level.
| Age Bracket | Male | Female |
| Under 5 Years | 0 (0.0%) | 4 (80.0%) |
| 5 Years | 0 (0.0%) | 0 (0.0%) |
| 6 to 11 Years | 2 (100.0%) | 0 (0.0%) |
| 12 to 14 Years | 1 (100.0%) | 7 (100.0%) |
| 15 Years | 0 (0.0%) | 0 (0.0%) |
| 16 and 17 Years | 5 (71.4%) | 0 (0.0%) |
| 18 to 24 Years | 0 (0.0%) | 0 (0.0%) |
| 25 to 34 Years | 0 (0.0%) | 4 (80.0%) |
| 35 to 44 Years | 0 (0.0%) | 4 (100.0%) |
| 45 to 54 Years | 1 (33.3%) | 2 (100.0%) |
| 55 to 64 Years | 0 (0.0%) | 0 (0.0%) |
| 65 to 74 Years | 0 (0.0%) | 0 (0.0%) |
| 75 Years and over | 0 (0.0%) | 0 (0.0%) |
| Total | 9 (33.3%) | 21 (72.4%) |
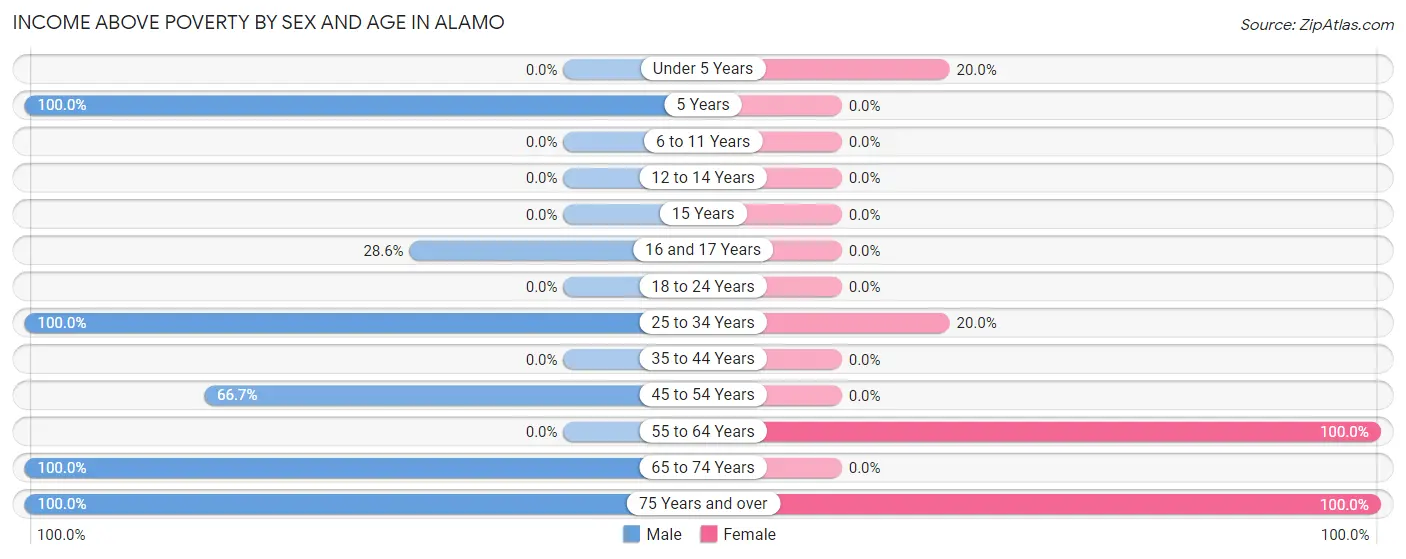
Income Above Poverty by Sex and Age in Alamo
According to the poverty statistics in Alamo, males aged 5 years and females aged 55 to 64 years are the age groups that are most secure financially, with 100.0% of males and 100.0% of females in these age groups living above the poverty line.
| Age Bracket | Male | Female |
| Under 5 Years | 0 (0.0%) | 1 (20.0%) |
| 5 Years | 1 (100.0%) | 0 (0.0%) |
| 6 to 11 Years | 0 (0.0%) | 0 (0.0%) |
| 12 to 14 Years | 0 (0.0%) | 0 (0.0%) |
| 15 Years | 0 (0.0%) | 0 (0.0%) |
| 16 and 17 Years | 2 (28.6%) | 0 (0.0%) |
| 18 to 24 Years | 0 (0.0%) | 0 (0.0%) |
| 25 to 34 Years | 10 (100.0%) | 1 (20.0%) |
| 35 to 44 Years | 0 (0.0%) | 0 (0.0%) |
| 45 to 54 Years | 2 (66.7%) | 0 (0.0%) |
| 55 to 64 Years | 0 (0.0%) | 3 (100.0%) |
| 65 to 74 Years | 2 (100.0%) | 0 (0.0%) |
| 75 Years and over | 1 (100.0%) | 3 (100.0%) |
| Total | 18 (66.7%) | 8 (27.6%) |
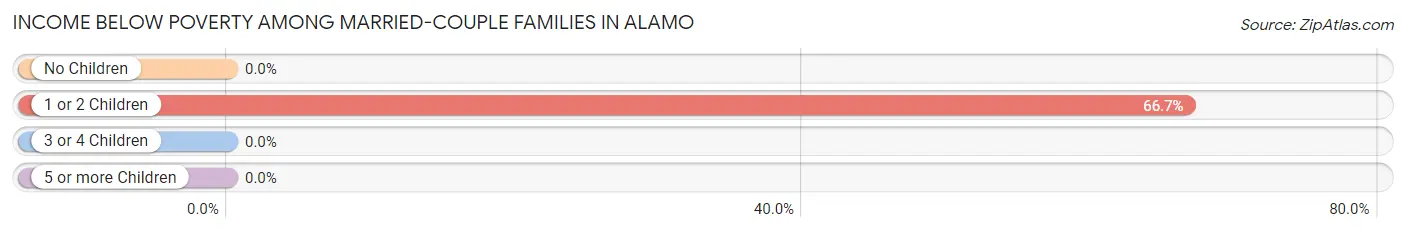
Income Below Poverty Among Married-Couple Families in Alamo
The poverty statistics for married-couple families in Alamo show that 66.7% or 2 of the total 3 families live below the poverty line. Families with 1 or 2 children have the highest poverty rate of 66.7%, comprising of 2 families. On the other hand, families with 1 or 2 children have the lowest poverty rate of 66.7%, which includes 2 families.
| Children | Above Poverty | Below Poverty |
| No Children | 0 (0.0%) | 0 (0.0%) |
| 1 or 2 Children | 1 (33.3%) | 2 (66.7%) |
| 3 or 4 Children | 0 (0.0%) | 0 (0.0%) |
| 5 or more Children | 0 (0.0%) | 0 (0.0%) |
| Total | 1 (33.3%) | 2 (66.7%) |
Income Below Poverty Among Single-Parent Households in Alamo
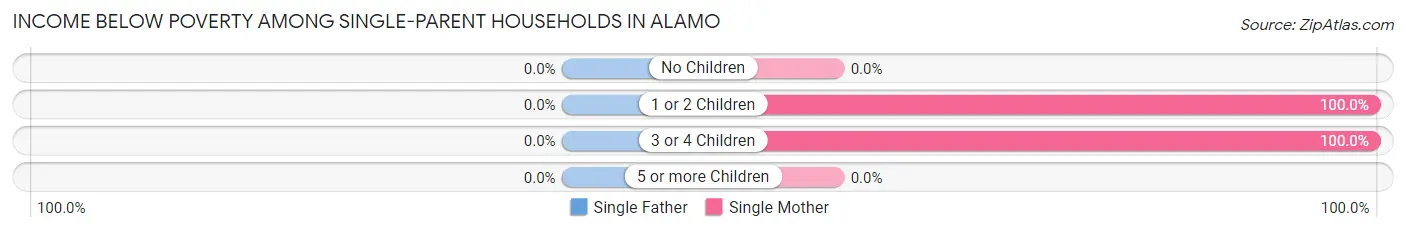
| Children | Single Father | Single Mother |
| No Children | 0 (0.0%) | 0 (0.0%) |
| 1 or 2 Children | 0 (0.0%) | 4 (100.0%) |
| 3 or 4 Children | 0 (0.0%) | 4 (100.0%) |
| 5 or more Children | 0 (0.0%) | 0 (0.0%) |
| Total | 0 (0.0%) | 8 (100.0%) |
Income Below Poverty Among Married-Couple vs Single-Parent Households in Alamo
The poverty data for Alamo shows that 2 of the married-couple family households (66.7%) and 8 of the single-parent households (66.7%) are living below the poverty level. Within the married-couple family households, those with 1 or 2 children have the highest poverty rate, with 2 households (66.7%) falling below the poverty line. Among the single-parent households, those with 3 or 4 children have the highest poverty rate, with 4 household (100.0%) living below poverty.
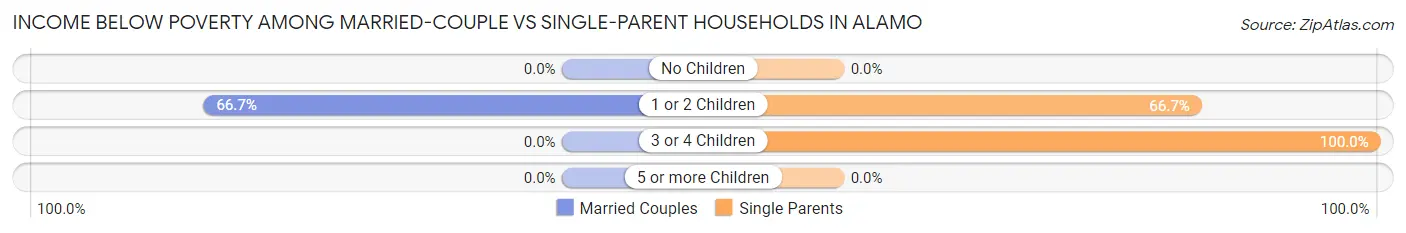
| Children | Married-Couple Families | Single-Parent Households |
| No Children | 0 (0.0%) | 0 (0.0%) |
| 1 or 2 Children | 2 (66.7%) | 4 (66.7%) |
| 3 or 4 Children | 0 (0.0%) | 4 (100.0%) |
| 5 or more Children | 0 (0.0%) | 0 (0.0%) |
| Total | 2 (66.7%) | 8 (66.7%) |
Race in Alamo
The most populous races in Alamo are , and White / Caucasian (56 | 100.0%).
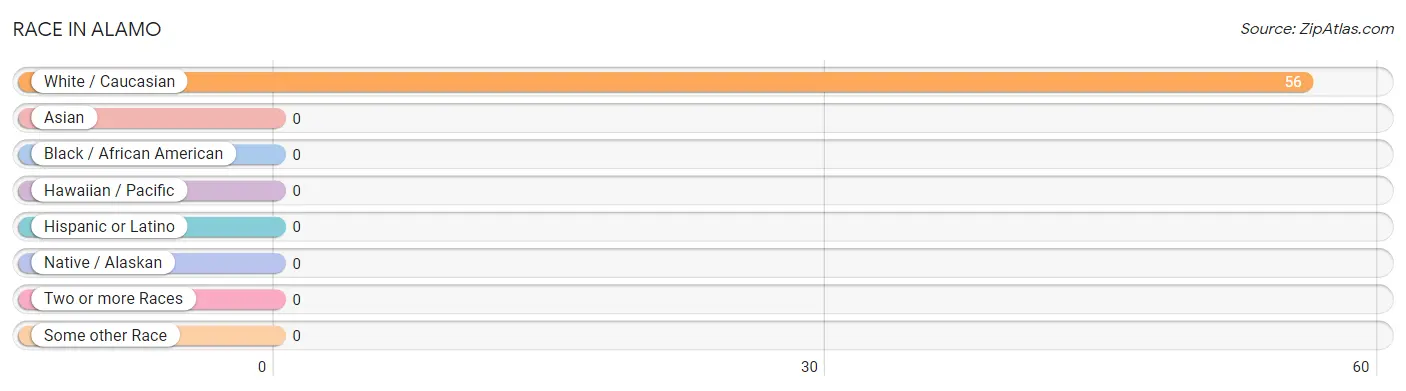
| Race | # Population | % Population |
| Asian | 0 | 0.0% |
| Black / African American | 0 | 0.0% |
| Hawaiian / Pacific | 0 | 0.0% |
| Hispanic or Latino | 0 | 0.0% |
| Native / Alaskan | 0 | 0.0% |
| White / Caucasian | 56 | 100.0% |
| Two or more Races | 0 | 0.0% |
| Some other Race | 0 | 0.0% |
| Total | 56 | 100.0% |
Ancestry in Alamo
The most populous ancestries reported in Alamo are German (12 | 21.4%), European (4 | 7.1%), and Irish (3 | 5.4%), together accounting for 33.9% of all Alamo residents.
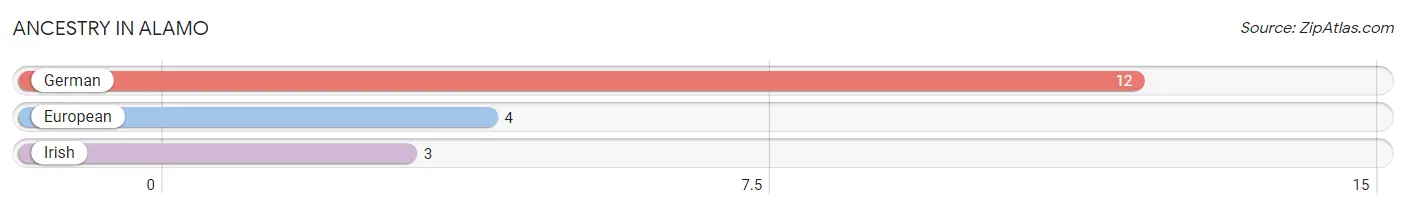
| Ancestry | # Population | % Population |
| European | 4 | 7.1% |
| German | 12 | 21.4% |
| Irish | 3 | 5.4% | View All 3 Rows |
Immigrants in Alamo

| Immigration Origin | # Population | % Population | View All 0 Rows |
Sex and Age in Alamo
Sex and Age in Alamo
The most populous age groups in Alamo are 30 to 34 Years (9 | 33.3%) for men and 10 to 14 Years (7 | 24.1%) for women.
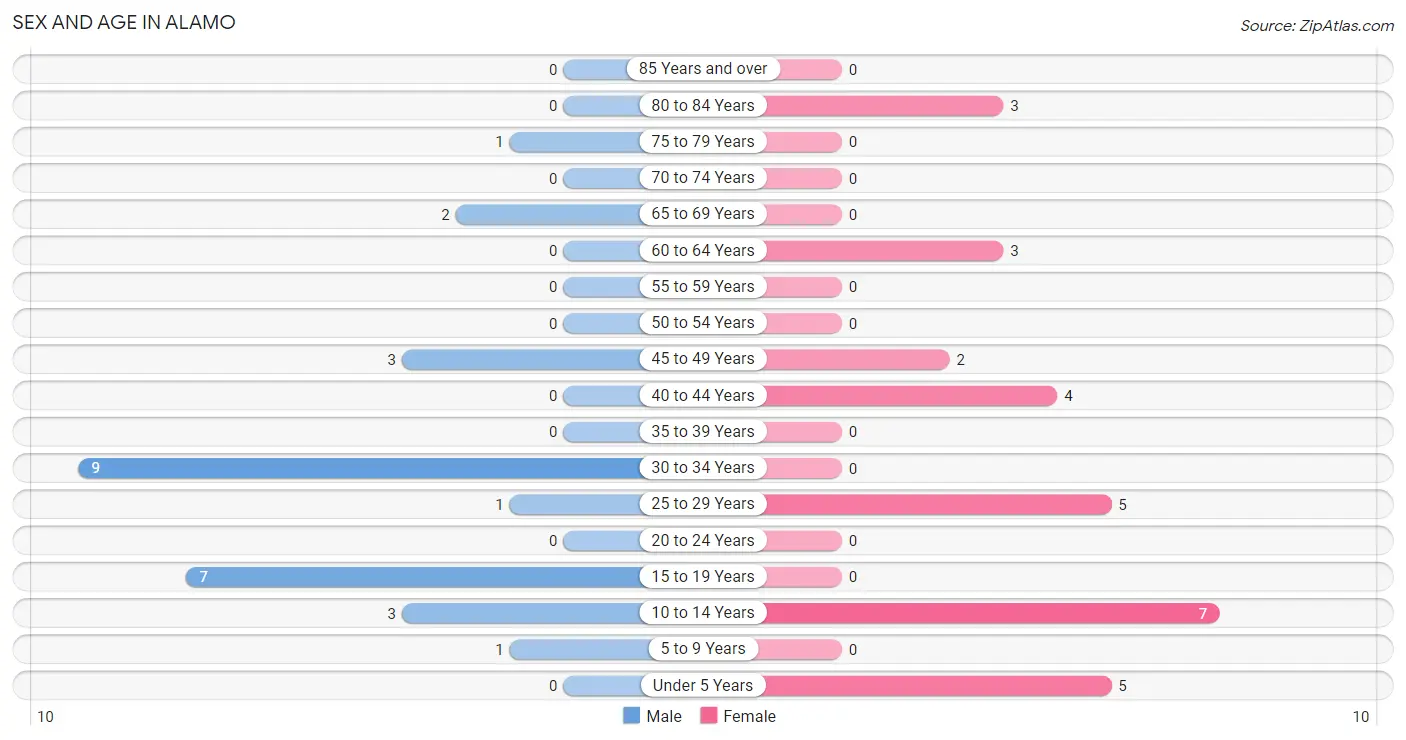
| Age Bracket | Male | Female |
| Under 5 Years | 0 (0.0%) | 5 (17.2%) |
| 5 to 9 Years | 1 (3.7%) | 0 (0.0%) |
| 10 to 14 Years | 3 (11.1%) | 7 (24.1%) |
| 15 to 19 Years | 7 (25.9%) | 0 (0.0%) |
| 20 to 24 Years | 0 (0.0%) | 0 (0.0%) |
| 25 to 29 Years | 1 (3.7%) | 5 (17.2%) |
| 30 to 34 Years | 9 (33.3%) | 0 (0.0%) |
| 35 to 39 Years | 0 (0.0%) | 0 (0.0%) |
| 40 to 44 Years | 0 (0.0%) | 4 (13.8%) |
| 45 to 49 Years | 3 (11.1%) | 2 (6.9%) |
| 50 to 54 Years | 0 (0.0%) | 0 (0.0%) |
| 55 to 59 Years | 0 (0.0%) | 0 (0.0%) |
| 60 to 64 Years | 0 (0.0%) | 3 (10.3%) |
| 65 to 69 Years | 2 (7.4%) | 0 (0.0%) |
| 70 to 74 Years | 0 (0.0%) | 0 (0.0%) |
| 75 to 79 Years | 1 (3.7%) | 0 (0.0%) |
| 80 to 84 Years | 0 (0.0%) | 3 (10.3%) |
| 85 Years and over | 0 (0.0%) | 0 (0.0%) |
| Total | 27 (100.0%) | 29 (100.0%) |
Families and Households in Alamo
Median Family Size in Alamo
The median family size in Alamo is 2.87 persons per family, with single female/mother families (8 | 53.3%) accounting for the largest median family size of 3.25 persons per family. On the other hand, single male/father families (4 | 26.7%) represent the smallest median family size with 2.25 persons per family.
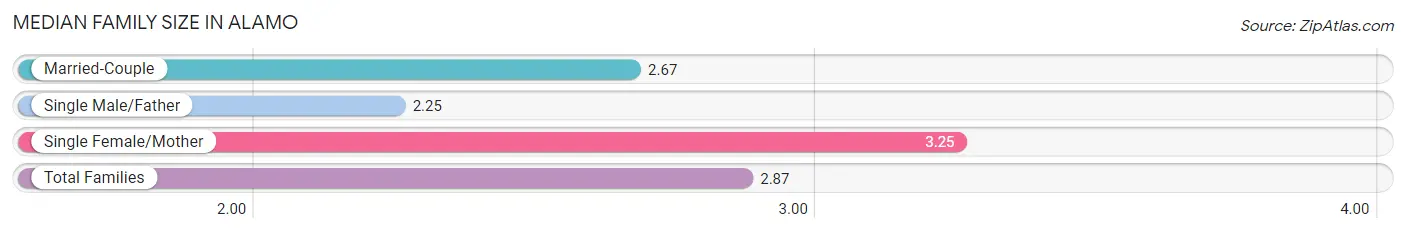
| Family Type | # Families | Family Size |
| Married-Couple | 3 (20.0%) | 2.67 |
| Single Male/Father | 4 (26.7%) | 2.25 |
| Single Female/Mother | 8 (53.3%) | 3.25 |
| Total Families | 15 (100.0%) | 2.87 |
Median Household Size in Alamo
The median household size in Alamo is 2.95 persons per household, with single female/mother households (8 | 42.1%) accounting for the largest median household size of 4.38 persons per household. non-family households (4 | 21.0%) represent the smallest median household size with 1.00 persons per household.
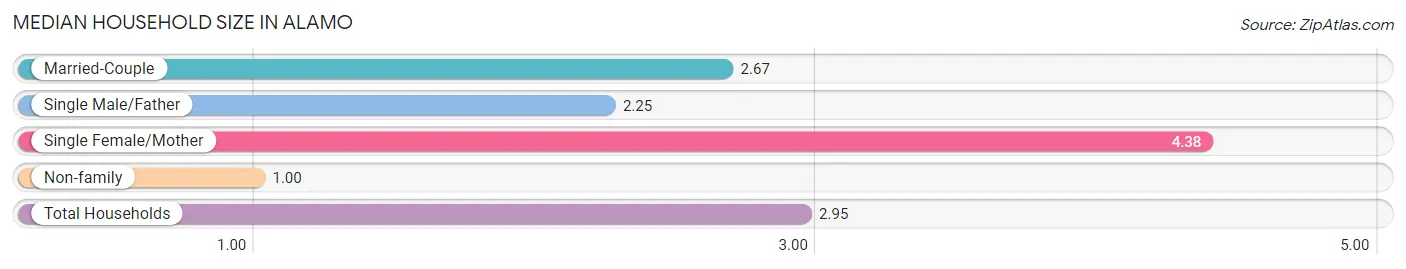
| Household Type | # Households | Household Size |
| Married-Couple | 3 (15.8%) | 2.67 |
| Single Male/Father | 4 (21.0%) | 2.25 |
| Single Female/Mother | 8 (42.1%) | 4.38 |
| Non-family | 4 (21.0%) | 1.00 |
| Total Households | 19 (100.0%) | 2.95 |
Household Size by Marriage Status in Alamo
Out of a total of 19 households in Alamo, 15 (78.9%) are family households, while 4 (21.0%) are nonfamily households. The most numerous type of family households are 3-person households, comprising 6, and the most common type of nonfamily households are 1-person households, comprising 4.
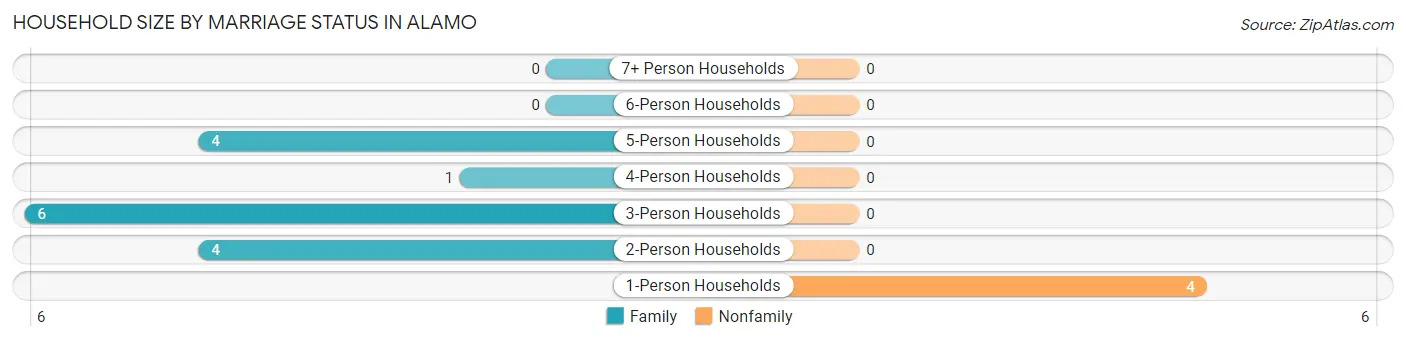
| Household Size | Family Households | Nonfamily Households |
| 1-Person Households | - | 4 (21.0%) |
| 2-Person Households | 4 (21.0%) | 0 (0.0%) |
| 3-Person Households | 6 (31.6%) | 0 (0.0%) |
| 4-Person Households | 1 (5.3%) | 0 (0.0%) |
| 5-Person Households | 4 (21.0%) | 0 (0.0%) |
| 6-Person Households | 0 (0.0%) | 0 (0.0%) |
| 7+ Person Households | 0 (0.0%) | 0 (0.0%) |
| Total | 15 (78.9%) | 4 (21.0%) |
Female Fertility in Alamo
Fertility by Age in Alamo
| Age Bracket | Women with Births | Births / 1,000 Women |
| 15 to 19 years | 0 (0.0%) | 0.0 |
| 20 to 34 years | 0 (0.0%) | 0.0 |
| 35 to 50 years | 0 (0.0%) | 0.0 |
| Total | 0 (0.0%) | 0.0 |
Fertility by Age by Marriage Status in Alamo
| Age Bracket | Married | Unmarried |
| 15 to 19 years | 0 (0.0%) | 0 (0.0%) |
| 20 to 34 years | 0 (0.0%) | 0 (0.0%) |
| 35 to 50 years | 0 (0.0%) | 0 (0.0%) |
| Total | 0 (0.0%) | 0 (0.0%) |
Fertility by Education in Alamo
| Educational Attainment | Women with Births | Births / 1,000 Women |
| Less than High School | 0 (0.0%) | 0.0 |
| High School Diploma | 0 (0.0%) | 0.0 |
| College or Associate's Degree | 0 (0.0%) | 0.0 |
| Bachelor's Degree | 0 (0.0%) | 0.0 |
| Graduate Degree | 0 (0.0%) | 0.0 |
| Total | 0 (0.0%) | 0.0 |
Fertility by Education by Marriage Status in Alamo
| Educational Attainment | Married | Unmarried |
| Less than High School | 0 (0.0%) | 0 (0.0%) |
| High School Diploma | 0 (0.0%) | 0 (0.0%) |
| College or Associate's Degree | 0 (0.0%) | 0 (0.0%) |
| Bachelor's Degree | 0 (0.0%) | 0 (0.0%) |
| Graduate Degree | 0 (0.0%) | 0 (0.0%) |
| Total | 0 (0.0%) | 0 (0.0%) |
Employment Characteristics in Alamo
Employment by Class of Employer in Alamo
Among the 20 employed individuals in Alamo, private company employees (16 | 80.0%), self-employed (not incorporated) (3 | 15.0%), and self-employed (incorporated) (1 | 5.0%) make up the most common classes of employment.
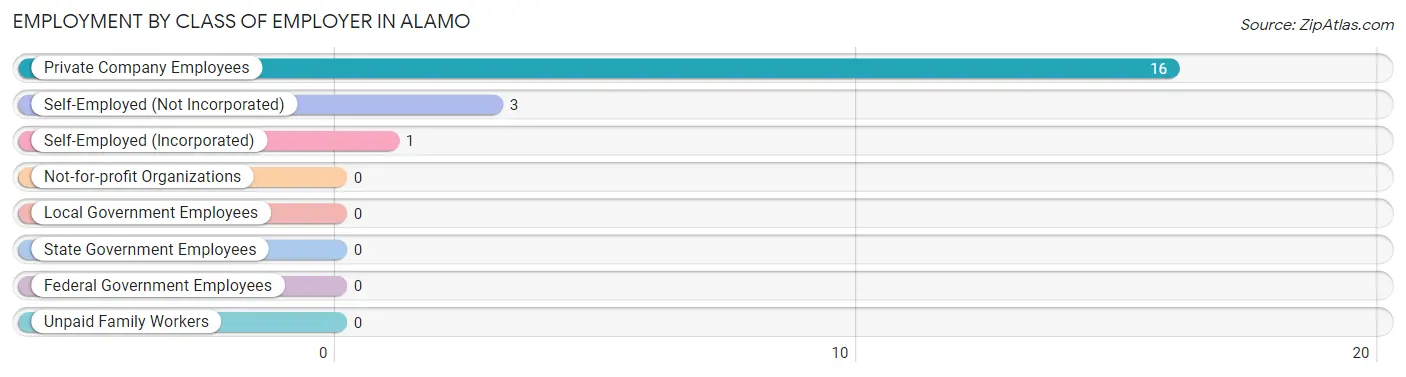
| Employer Class | # Employees | % Employees |
| Private Company Employees | 16 | 80.0% |
| Self-Employed (Incorporated) | 1 | 5.0% |
| Self-Employed (Not Incorporated) | 3 | 15.0% |
| Not-for-profit Organizations | 0 | 0.0% |
| Local Government Employees | 0 | 0.0% |
| State Government Employees | 0 | 0.0% |
| Federal Government Employees | 0 | 0.0% |
| Unpaid Family Workers | 0 | 0.0% |
| Total | 20 | 100.0% |
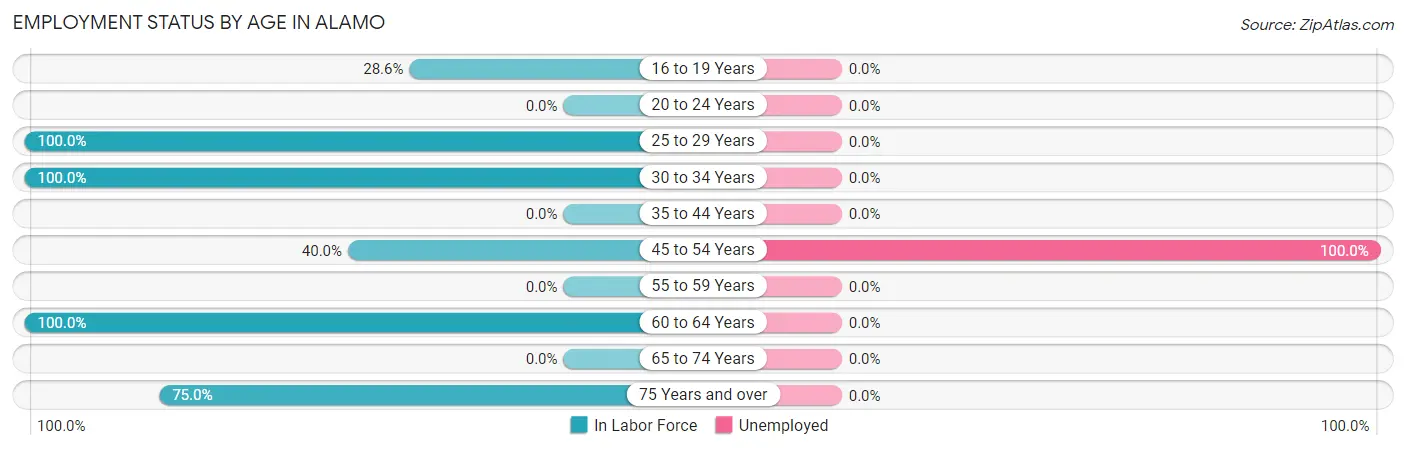
Employment Status by Age in Alamo
According to the labor force statistics for Alamo, out of the total population over 16 years of age (40), 62.5% or 25 individuals are in the labor force, with 8.0% or 2 of them unemployed. The age group with the highest labor force participation rate is 25 to 29 years, with 100.0% or 6 individuals in the labor force. Within the labor force, the 45 to 54 years age range has the highest percentage of unemployed individuals, with 100.0% or 2 of them being unemployed.
| Age Bracket | In Labor Force | Unemployed |
| 16 to 19 Years | 2 (28.6%) | 0 (0.0%) |
| 20 to 24 Years | 0 (0.0%) | 0 (0.0%) |
| 25 to 29 Years | 6 (100.0%) | 0 (0.0%) |
| 30 to 34 Years | 9 (100.0%) | 0 (0.0%) |
| 35 to 44 Years | 0 (0.0%) | 0 (0.0%) |
| 45 to 54 Years | 2 (40.0%) | 2 (100.0%) |
| 55 to 59 Years | 0 (0.0%) | 0 (0.0%) |
| 60 to 64 Years | 3 (100.0%) | 0 (0.0%) |
| 65 to 74 Years | 0 (0.0%) | 0 (0.0%) |
| 75 Years and over | 3 (75.0%) | 0 (0.0%) |
| Total | 25 (62.5%) | 2 (8.0%) |
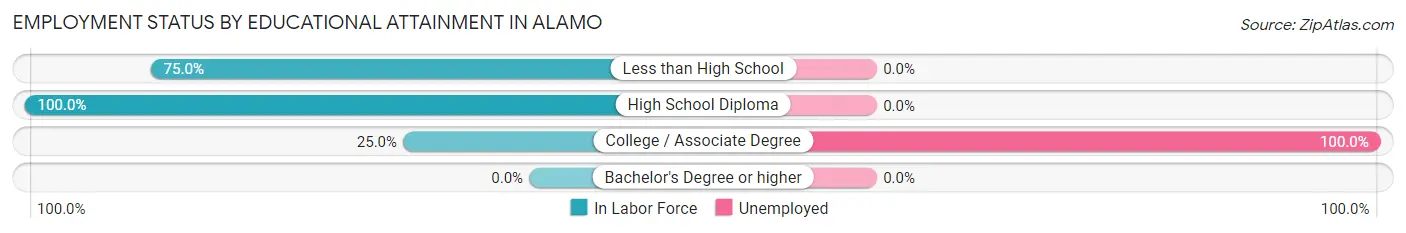
Employment Status by Educational Attainment in Alamo
According to labor force statistics for Alamo, 74.1% of individuals (20) out of the total population between 25 and 64 years of age (27) are in the labor force, with 10.0% or 2 of them being unemployed. The group with the highest labor force participation rate are those with the educational attainment of high school diploma, with 100.0% or 15 individuals in the labor force. Within the labor force, individuals with college / associate degree education have the highest percentage of unemployment, with 100.0% or 2 of them being unemployed.
| Educational Attainment | In Labor Force | Unemployed |
| Less than High School | 3 (75.0%) | 0 (0.0%) |
| High School Diploma | 15 (100.0%) | 0 (0.0%) |
| College / Associate Degree | 2 (25.0%) | 8 (100.0%) |
| Bachelor's Degree or higher | 0 (0.0%) | 0 (0.0%) |
| Total | 20 (74.1%) | 3 (10.0%) |
Employment Occupations by Sex in Alamo
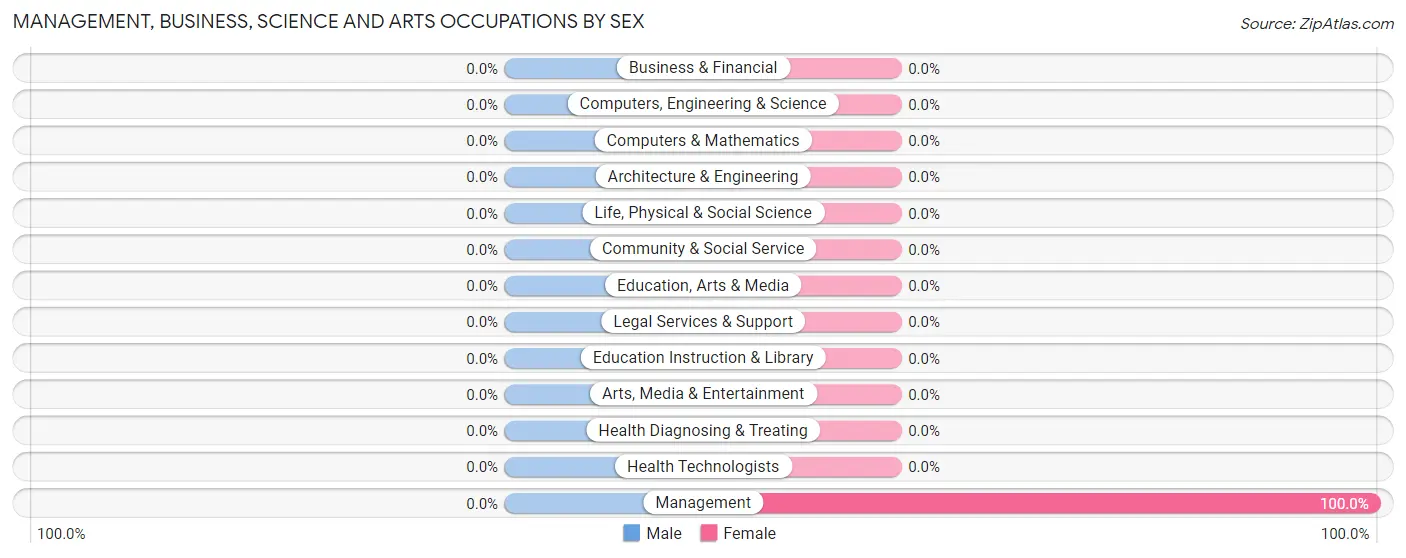
Management, Business, Science and Arts Occupations
The most common Management, Business, Science and Arts occupations in Alamo are , and Management (3 | 13.0%).
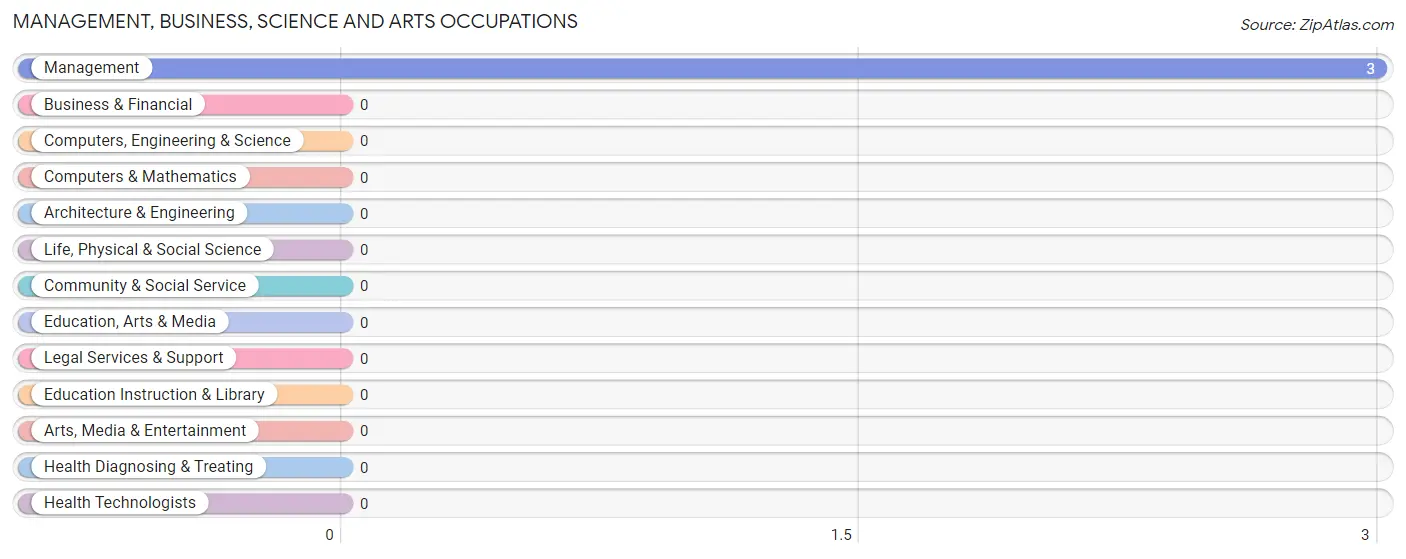
Management, Business, Science and Arts Occupations by Sex
| Occupation | Male | Female |
| Management | 0 (0.0%) | 3 (100.0%) |
| Business & Financial | 0 (0.0%) | 0 (0.0%) |
| Computers, Engineering & Science | 0 (0.0%) | 0 (0.0%) |
| Computers & Mathematics | 0 (0.0%) | 0 (0.0%) |
| Architecture & Engineering | 0 (0.0%) | 0 (0.0%) |
| Life, Physical & Social Science | 0 (0.0%) | 0 (0.0%) |
| Community & Social Service | 0 (0.0%) | 0 (0.0%) |
| Education, Arts & Media | 0 (0.0%) | 0 (0.0%) |
| Legal Services & Support | 0 (0.0%) | 0 (0.0%) |
| Education Instruction & Library | 0 (0.0%) | 0 (0.0%) |
| Arts, Media & Entertainment | 0 (0.0%) | 0 (0.0%) |
| Health Diagnosing & Treating | 0 (0.0%) | 0 (0.0%) |
| Health Technologists | 0 (0.0%) | 0 (0.0%) |
| Total (Category) | 0 (0.0%) | 3 (100.0%) |
| Total (Overall) | 12 (52.2%) | 11 (47.8%) |
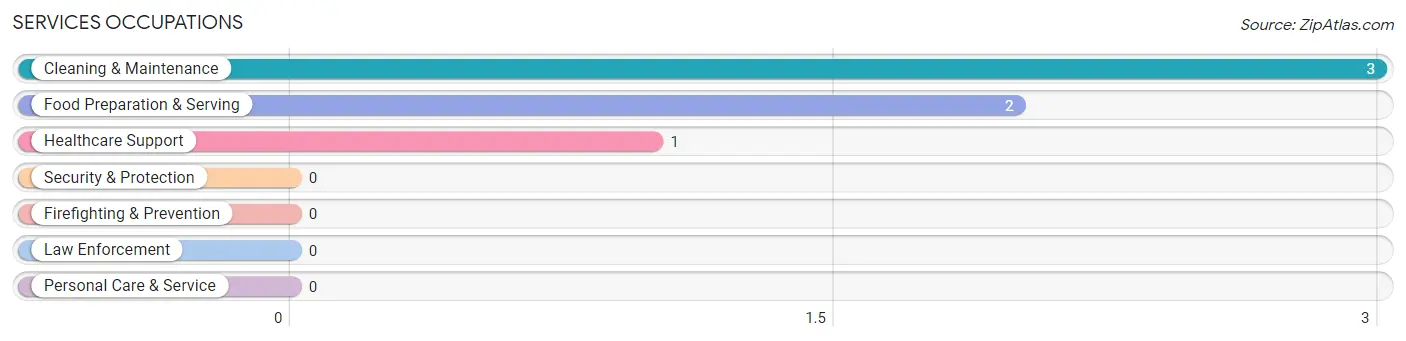
Services Occupations
The most common Services occupations in Alamo are Cleaning & Maintenance (3 | 13.0%), Food Preparation & Serving (2 | 8.7%), and Healthcare Support (1 | 4.3%).
Services Occupations by Sex
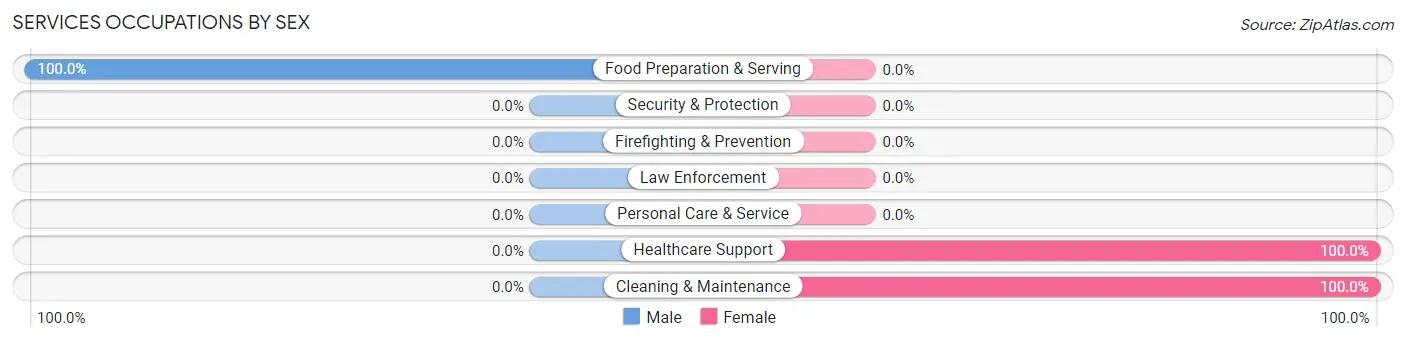
| Occupation | Male | Female |
| Healthcare Support | 0 (0.0%) | 1 (100.0%) |
| Security & Protection | 0 (0.0%) | 0 (0.0%) |
| Firefighting & Prevention | 0 (0.0%) | 0 (0.0%) |
| Law Enforcement | 0 (0.0%) | 0 (0.0%) |
| Food Preparation & Serving | 2 (100.0%) | 0 (0.0%) |
| Cleaning & Maintenance | 0 (0.0%) | 3 (100.0%) |
| Personal Care & Service | 0 (0.0%) | 0 (0.0%) |
| Total (Category) | 2 (33.3%) | 4 (66.7%) |
| Total (Overall) | 12 (52.2%) | 11 (47.8%) |
Sales and Office Occupations

Sales and Office Occupations by Sex
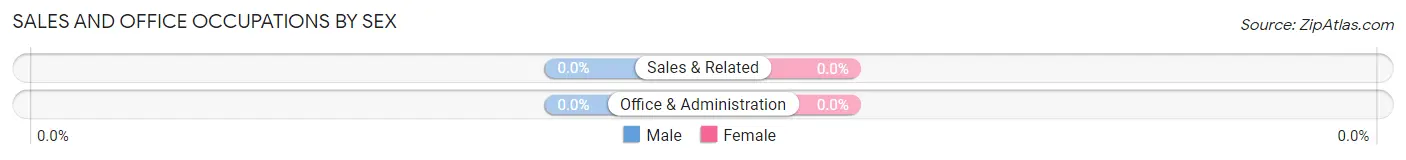
| Occupation | Male | Female |
| Sales & Related | 0 (0.0%) | 0 (0.0%) |
| Office & Administration | 0 (0.0%) | 0 (0.0%) |
| Total (Category) | 0 (0.0%) | 0 (0.0%) |
| Total (Overall) | 12 (52.2%) | 11 (47.8%) |
Natural Resources, Construction and Maintenance Occupations
The most common Natural Resources, Construction and Maintenance occupations in Alamo are , and Construction & Extraction (1 | 4.3%).
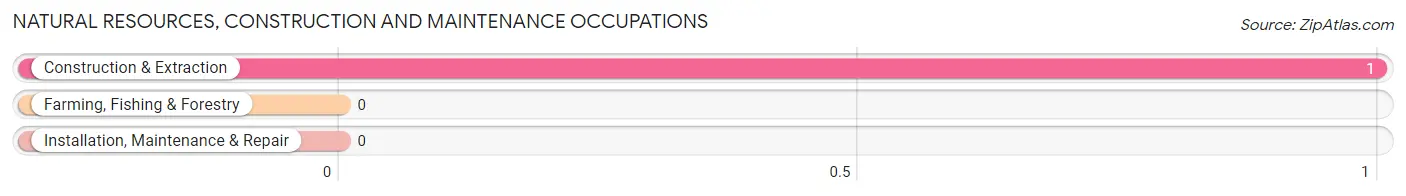
Natural Resources, Construction and Maintenance Occupations by Sex
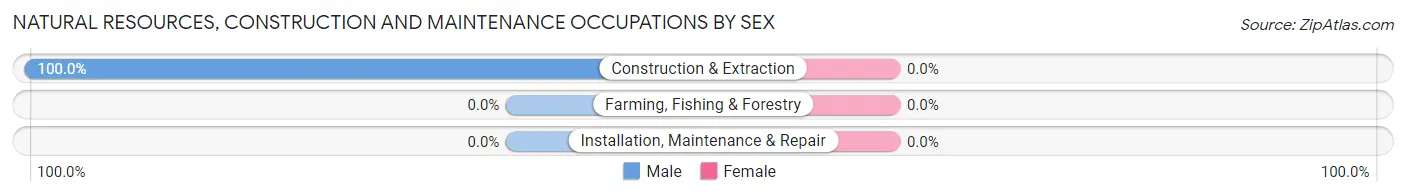
| Occupation | Male | Female |
| Farming, Fishing & Forestry | 0 (0.0%) | 0 (0.0%) |
| Construction & Extraction | 1 (100.0%) | 0 (0.0%) |
| Installation, Maintenance & Repair | 0 (0.0%) | 0 (0.0%) |
| Total (Category) | 1 (100.0%) | 0 (0.0%) |
| Total (Overall) | 12 (52.2%) | 11 (47.8%) |
Production, Transportation and Moving Occupations
The most common Production, Transportation and Moving occupations in Alamo are Material Moving (9 | 39.1%), and Production (4 | 17.4%).
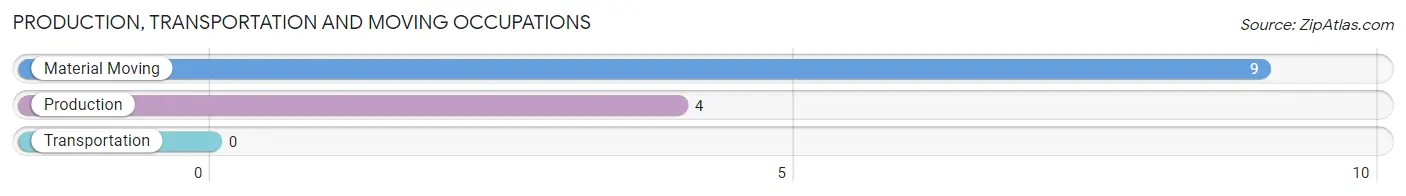
Production, Transportation and Moving Occupations by Sex
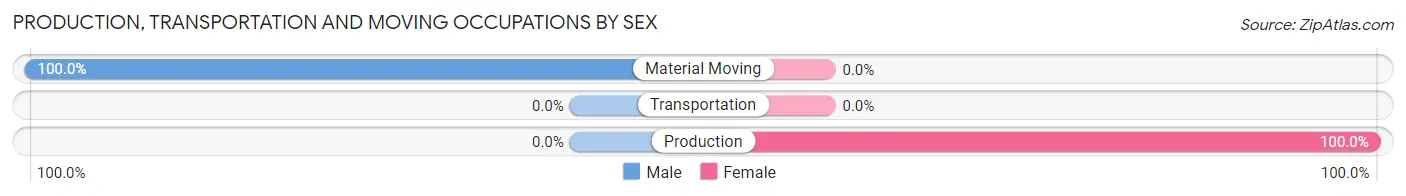
| Occupation | Male | Female |
| Production | 0 (0.0%) | 4 (100.0%) |
| Transportation | 0 (0.0%) | 0 (0.0%) |
| Material Moving | 9 (100.0%) | 0 (0.0%) |
| Total (Category) | 9 (69.2%) | 4 (30.8%) |
| Total (Overall) | 12 (52.2%) | 11 (47.8%) |
Employment Industries by Sex in Alamo
Employment Industries in Alamo
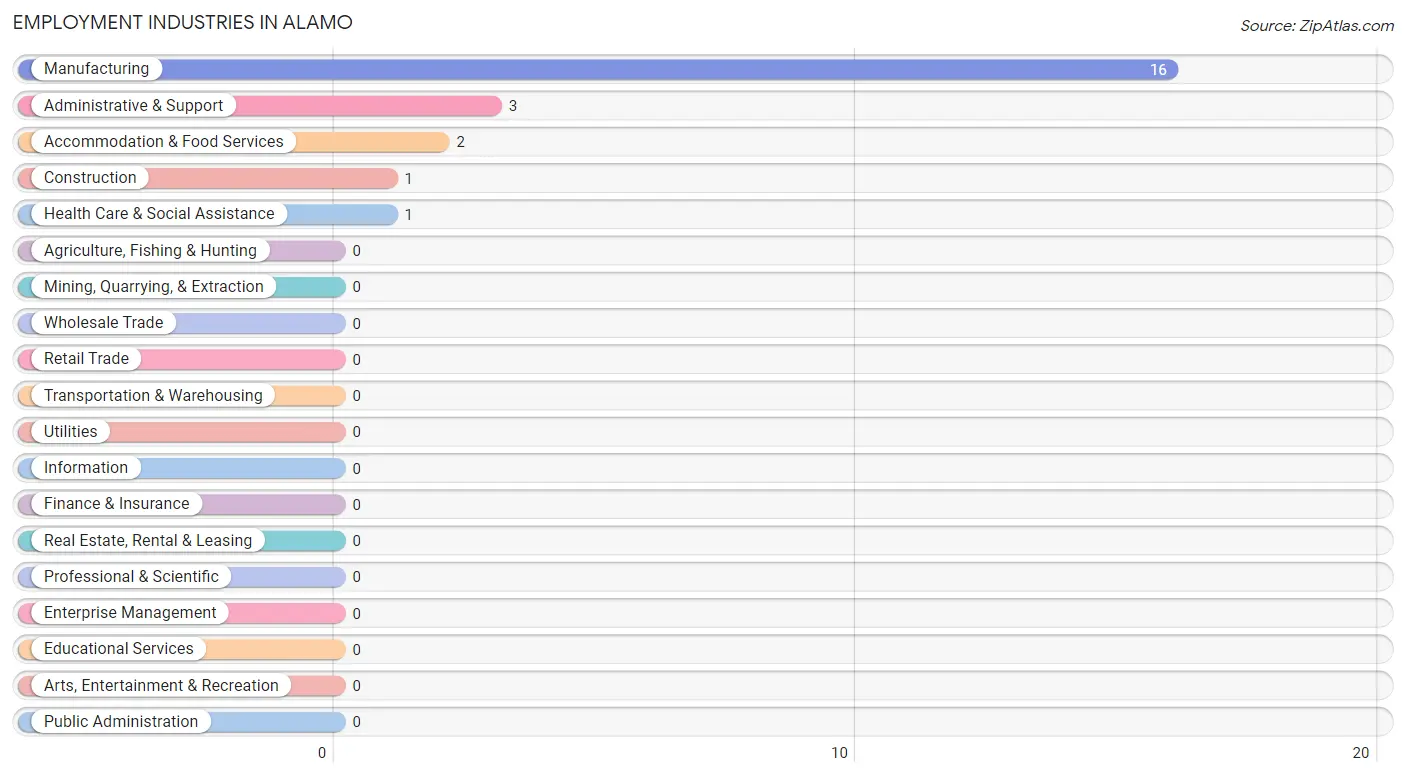
The major employment industries in Alamo include Manufacturing (16 | 69.6%), Administrative & Support (3 | 13.0%), Accommodation & Food Services (2 | 8.7%), Construction (1 | 4.3%), and Health Care & Social Assistance (1 | 4.3%).
Employment Industries by Sex in Alamo
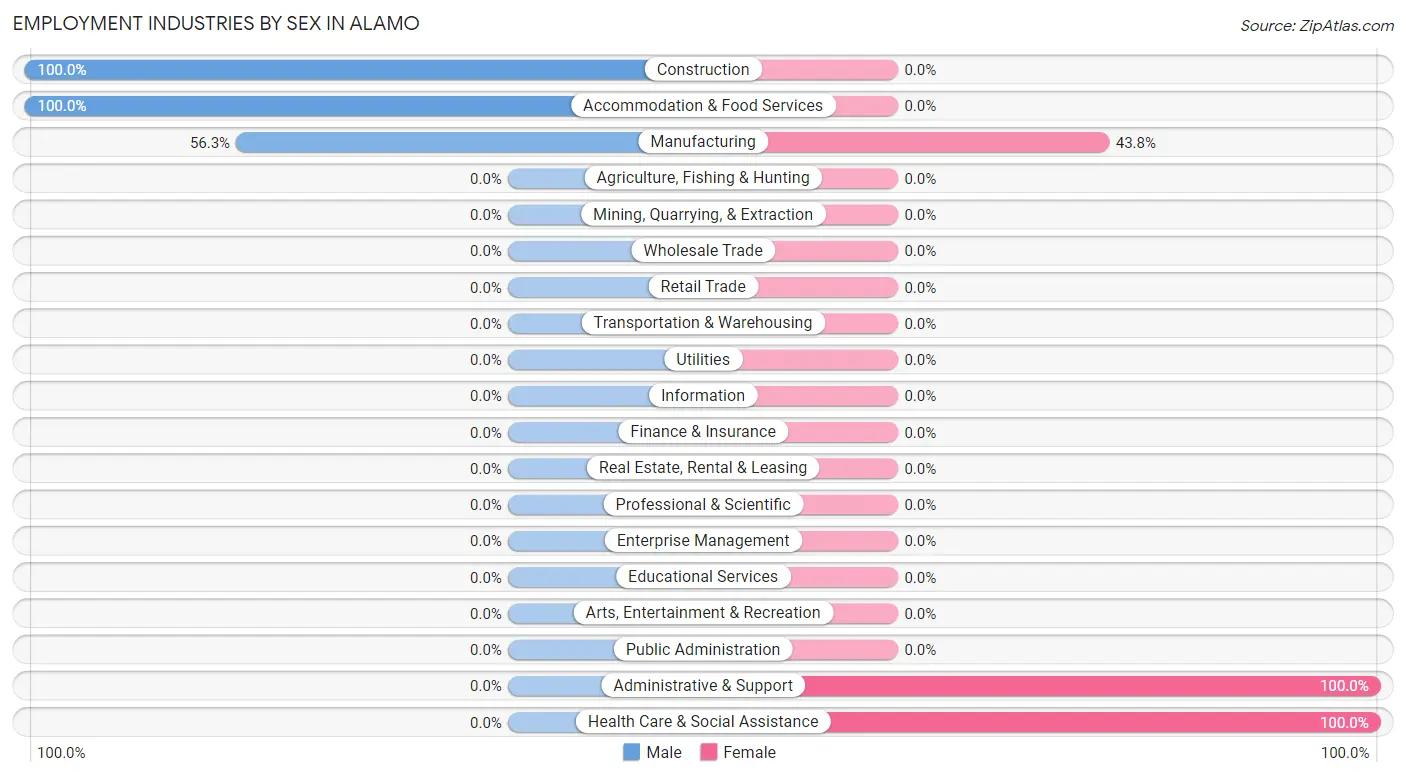
The Alamo industries that see more men than women are Construction (100.0%), Accommodation & Food Services (100.0%), and Manufacturing (56.2%), whereas the industries that tend to have a higher number of women are Administrative & Support (100.0%), Health Care & Social Assistance (100.0%), and Manufacturing (43.8%).
| Industry | Male | Female |
| Agriculture, Fishing & Hunting | 0 (0.0%) | 0 (0.0%) |
| Mining, Quarrying, & Extraction | 0 (0.0%) | 0 (0.0%) |
| Construction | 1 (100.0%) | 0 (0.0%) |
| Manufacturing | 9 (56.2%) | 7 (43.8%) |
| Wholesale Trade | 0 (0.0%) | 0 (0.0%) |
| Retail Trade | 0 (0.0%) | 0 (0.0%) |
| Transportation & Warehousing | 0 (0.0%) | 0 (0.0%) |
| Utilities | 0 (0.0%) | 0 (0.0%) |
| Information | 0 (0.0%) | 0 (0.0%) |
| Finance & Insurance | 0 (0.0%) | 0 (0.0%) |
| Real Estate, Rental & Leasing | 0 (0.0%) | 0 (0.0%) |
| Professional & Scientific | 0 (0.0%) | 0 (0.0%) |
| Enterprise Management | 0 (0.0%) | 0 (0.0%) |
| Administrative & Support | 0 (0.0%) | 3 (100.0%) |
| Educational Services | 0 (0.0%) | 0 (0.0%) |
| Health Care & Social Assistance | 0 (0.0%) | 1 (100.0%) |
| Arts, Entertainment & Recreation | 0 (0.0%) | 0 (0.0%) |
| Accommodation & Food Services | 2 (100.0%) | 0 (0.0%) |
| Public Administration | 0 (0.0%) | 0 (0.0%) |
| Total | 12 (52.2%) | 11 (47.8%) |
Education in Alamo
School Enrollment in Alamo
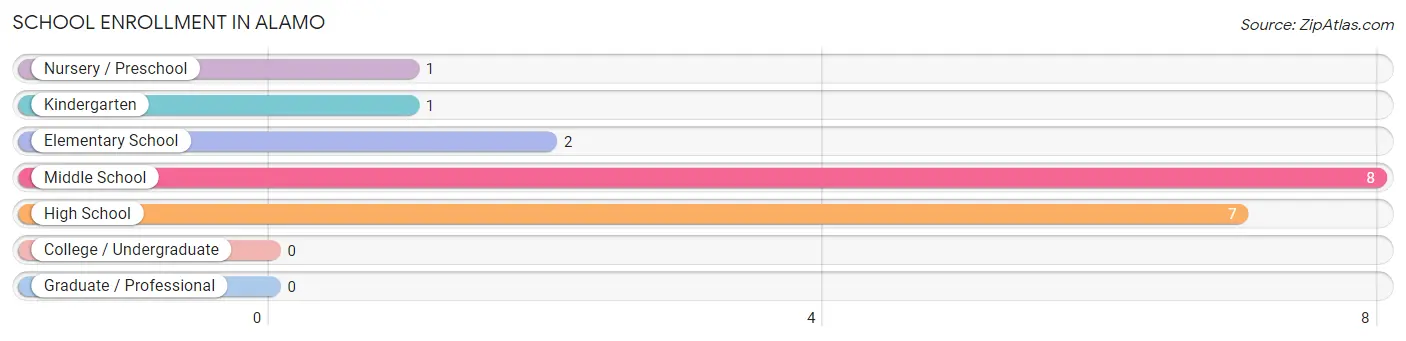
The most common levels of schooling among the 19 students in Alamo are middle school (8 | 42.1%), high school (7 | 36.8%), and elementary school (2 | 10.5%).
| School Level | # Students | % Students |
| Nursery / Preschool | 1 | 5.3% |
| Kindergarten | 1 | 5.3% |
| Elementary School | 2 | 10.5% |
| Middle School | 8 | 42.1% |
| High School | 7 | 36.8% |
| College / Undergraduate | 0 | 0.0% |
| Graduate / Professional | 0 | 0.0% |
| Total | 19 | 100.0% |
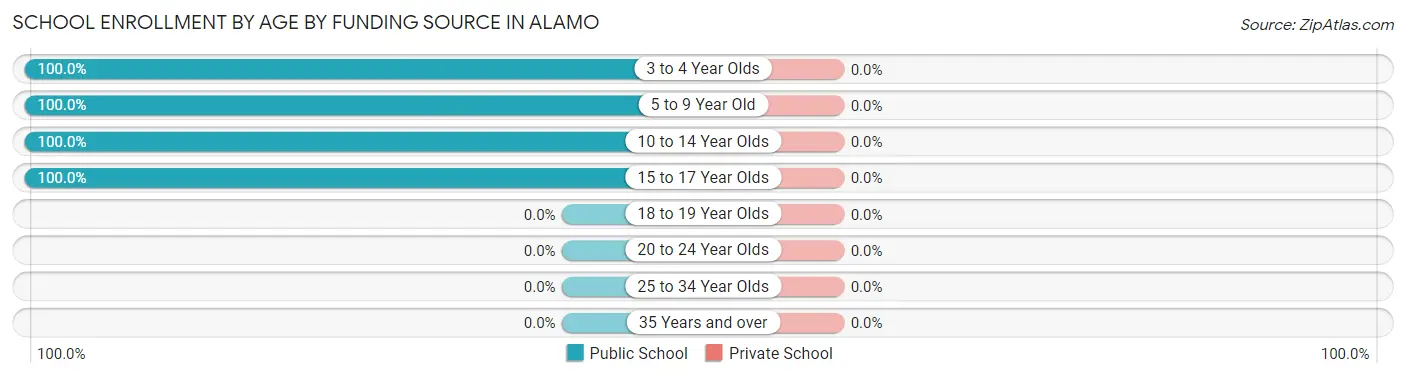
School Enrollment by Age by Funding Source in Alamo
| Age Bracket | Public School | Private School |
| 3 to 4 Year Olds | 1 (100.0%) | 0 (0.0%) |
| 5 to 9 Year Old | 1 (100.0%) | 0 (0.0%) |
| 10 to 14 Year Olds | 10 (100.0%) | 0 (0.0%) |
| 15 to 17 Year Olds | 7 (100.0%) | 0 (0.0%) |
| 18 to 19 Year Olds | 0 (0.0%) | 0 (0.0%) |
| 20 to 24 Year Olds | 0 (0.0%) | 0 (0.0%) |
| 25 to 34 Year Olds | 0 (0.0%) | 0 (0.0%) |
| 35 Years and over | 0 (0.0%) | 0 (0.0%) |
| Total | 19 (100.0%) | 0 (0.0%) |
Educational Attainment by Field of Study in Alamo
| Field of Study | # Graduates | % Graduates |
| Computers & Mathematics | 0 | 0.0% |
| Bio, Nature & Agricultural | 0 | 0.0% |
| Physical & Health Sciences | 0 | 0.0% |
| Psychology | 0 | 0.0% |
| Social Sciences | 0 | 0.0% |
| Engineering | 0 | 0.0% |
| Multidisciplinary Studies | 0 | 0.0% |
| Science & Technology | 0 | 0.0% |
| Business | 0 | 0.0% |
| Education | 0 | 0.0% |
| Literature & Languages | 0 | 0.0% |
| Liberal Arts & History | 0 | 0.0% |
| Visual & Performing Arts | 0 | 0.0% |
| Communications | 0 | 0.0% |
| Arts & Humanities | 0 | 0.0% |
| Total | 0 | 0.0% |
Transportation & Commute in Alamo
Vehicle Availability by Sex in Alamo
The most prevalent vehicle ownership categories in Alamo are males with 2 vehicles (12, accounting for 100.0%) and females with 2 vehicles (5, making up 150.0%).
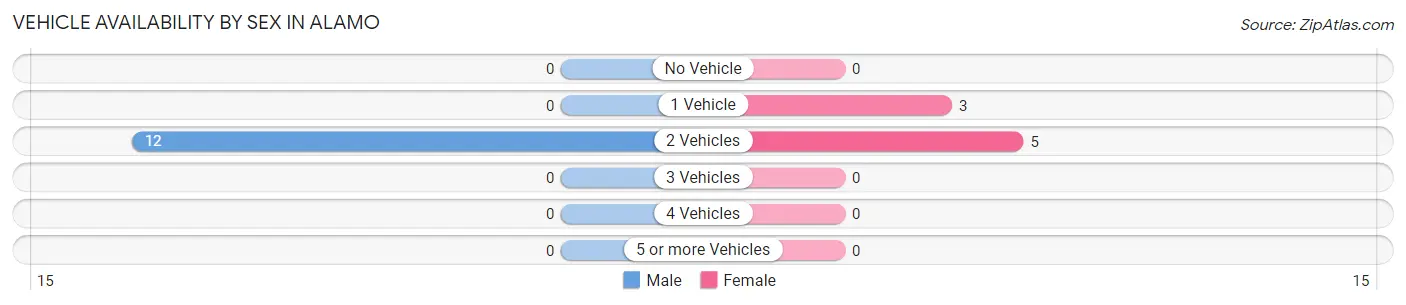
| Vehicles Available | Male | Female |
| No Vehicle | 0 (0.0%) | 0 (0.0%) |
| 1 Vehicle | 0 (0.0%) | 3 (37.5%) |
| 2 Vehicles | 12 (100.0%) | 5 (62.5%) |
| 3 Vehicles | 0 (0.0%) | 0 (0.0%) |
| 4 Vehicles | 0 (0.0%) | 0 (0.0%) |
| 5 or more Vehicles | 0 (0.0%) | 0 (0.0%) |
| Total | 12 (100.0%) | 8 (100.0%) |
Commute Time in Alamo
The most frequently occuring commute durations in Alamo are 45 to 59 minutes (10 commuters, 50.0%), 60 to 89 minutes (4 commuters, 20.0%), and 20 to 24 minutes (3 commuters, 15.0%).
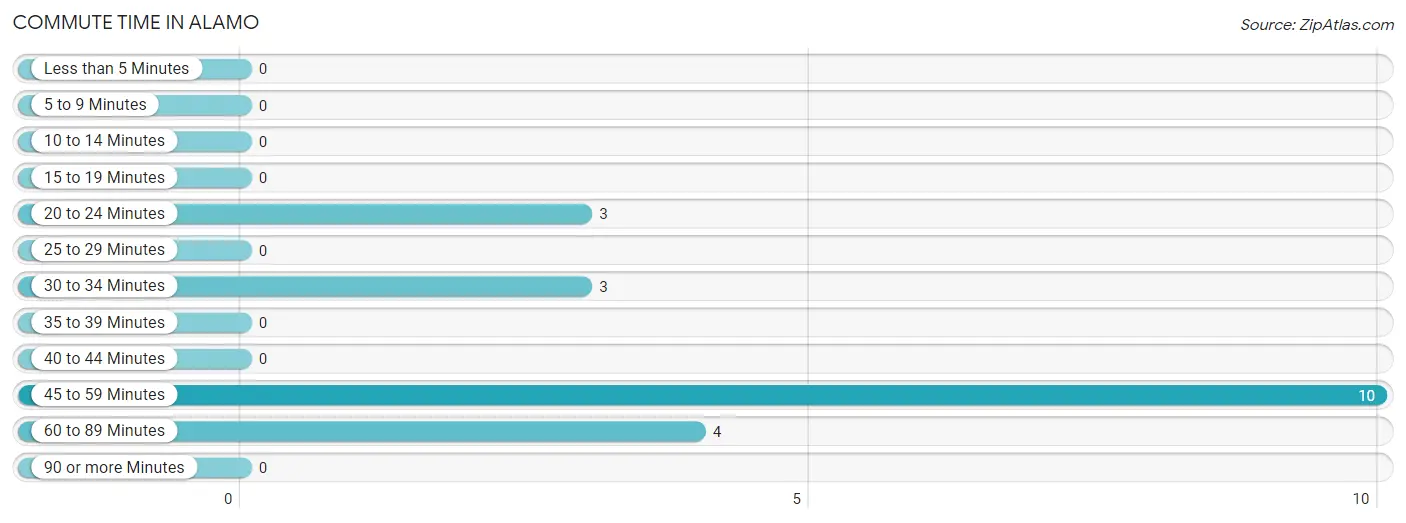
| Commute Time | # Commuters | % Commuters |
| Less than 5 Minutes | 0 | 0.0% |
| 5 to 9 Minutes | 0 | 0.0% |
| 10 to 14 Minutes | 0 | 0.0% |
| 15 to 19 Minutes | 0 | 0.0% |
| 20 to 24 Minutes | 3 | 15.0% |
| 25 to 29 Minutes | 0 | 0.0% |
| 30 to 34 Minutes | 3 | 15.0% |
| 35 to 39 Minutes | 0 | 0.0% |
| 40 to 44 Minutes | 0 | 0.0% |
| 45 to 59 Minutes | 10 | 50.0% |
| 60 to 89 Minutes | 4 | 20.0% |
| 90 or more Minutes | 0 | 0.0% |
Commute Time by Sex in Alamo
The most common commute times in Alamo are 45 to 59 minutes (10 commuters, 83.3%) for males and 60 to 89 minutes (4 commuters, 50.0%) for females.
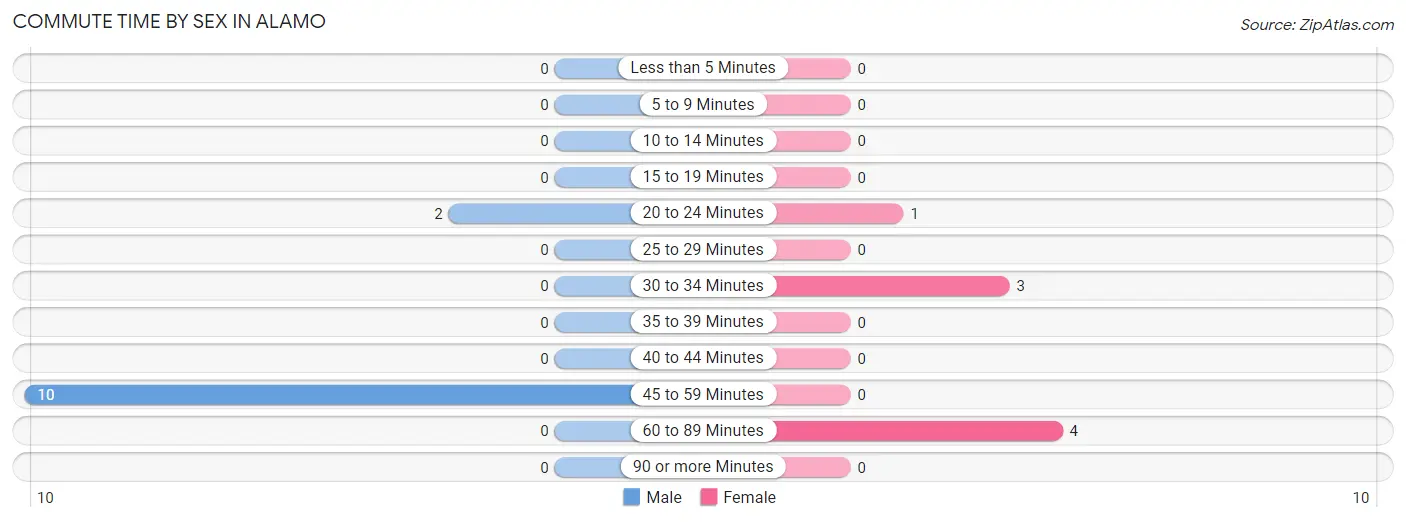
| Commute Time | Male | Female |
| Less than 5 Minutes | 0 (0.0%) | 0 (0.0%) |
| 5 to 9 Minutes | 0 (0.0%) | 0 (0.0%) |
| 10 to 14 Minutes | 0 (0.0%) | 0 (0.0%) |
| 15 to 19 Minutes | 0 (0.0%) | 0 (0.0%) |
| 20 to 24 Minutes | 2 (16.7%) | 1 (12.5%) |
| 25 to 29 Minutes | 0 (0.0%) | 0 (0.0%) |
| 30 to 34 Minutes | 0 (0.0%) | 3 (37.5%) |
| 35 to 39 Minutes | 0 (0.0%) | 0 (0.0%) |
| 40 to 44 Minutes | 0 (0.0%) | 0 (0.0%) |
| 45 to 59 Minutes | 10 (83.3%) | 0 (0.0%) |
| 60 to 89 Minutes | 0 (0.0%) | 4 (50.0%) |
| 90 or more Minutes | 0 (0.0%) | 0 (0.0%) |
Time of Departure to Work by Sex in Alamo
The most frequent times of departure to work in Alamo are 10:00 AM to 10:59 AM (9, 75.0%) for males and 7:30 AM to 7:59 AM (5, 62.5%) for females.
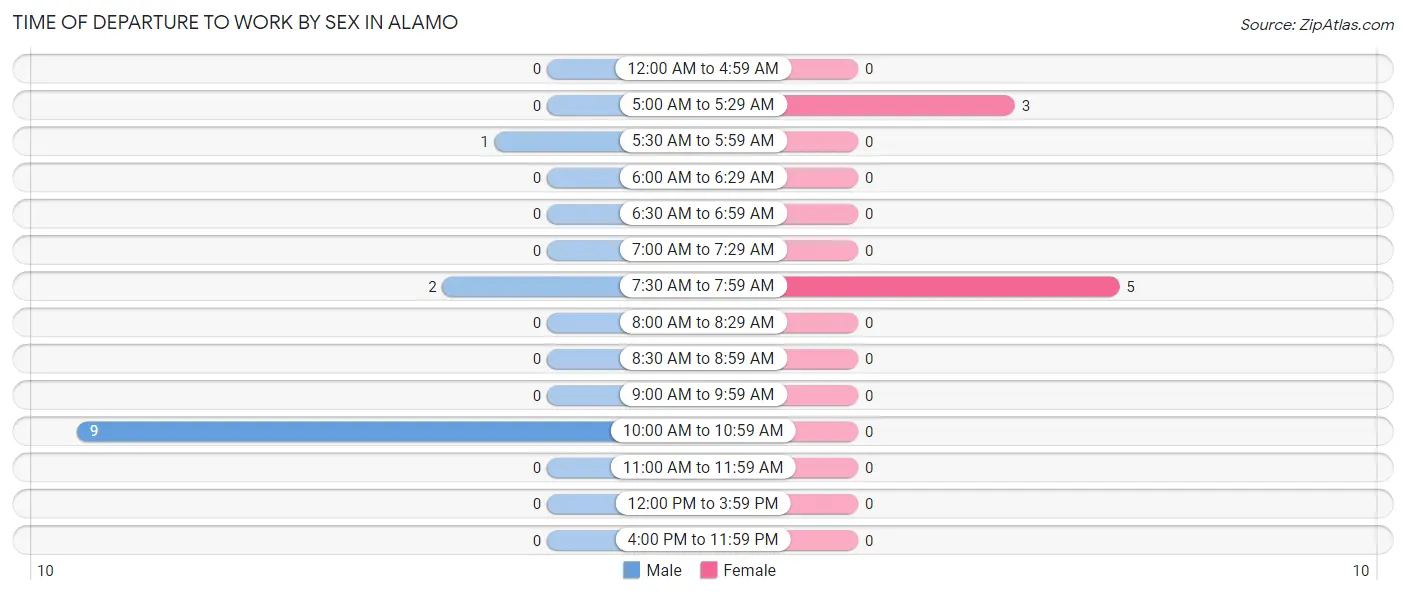
| Time of Departure | Male | Female |
| 12:00 AM to 4:59 AM | 0 (0.0%) | 0 (0.0%) |
| 5:00 AM to 5:29 AM | 0 (0.0%) | 3 (37.5%) |
| 5:30 AM to 5:59 AM | 1 (8.3%) | 0 (0.0%) |
| 6:00 AM to 6:29 AM | 0 (0.0%) | 0 (0.0%) |
| 6:30 AM to 6:59 AM | 0 (0.0%) | 0 (0.0%) |
| 7:00 AM to 7:29 AM | 0 (0.0%) | 0 (0.0%) |
| 7:30 AM to 7:59 AM | 2 (16.7%) | 5 (62.5%) |
| 8:00 AM to 8:29 AM | 0 (0.0%) | 0 (0.0%) |
| 8:30 AM to 8:59 AM | 0 (0.0%) | 0 (0.0%) |
| 9:00 AM to 9:59 AM | 0 (0.0%) | 0 (0.0%) |
| 10:00 AM to 10:59 AM | 9 (75.0%) | 0 (0.0%) |
| 11:00 AM to 11:59 AM | 0 (0.0%) | 0 (0.0%) |
| 12:00 PM to 3:59 PM | 0 (0.0%) | 0 (0.0%) |
| 4:00 PM to 11:59 PM | 0 (0.0%) | 0 (0.0%) |
| Total | 12 (100.0%) | 8 (100.0%) |
Housing Occupancy in Alamo
Occupancy by Ownership in Alamo
Of the total 19 dwellings in Alamo, owner-occupied units account for 12 (63.2%), while renter-occupied units make up 7 (36.8%).
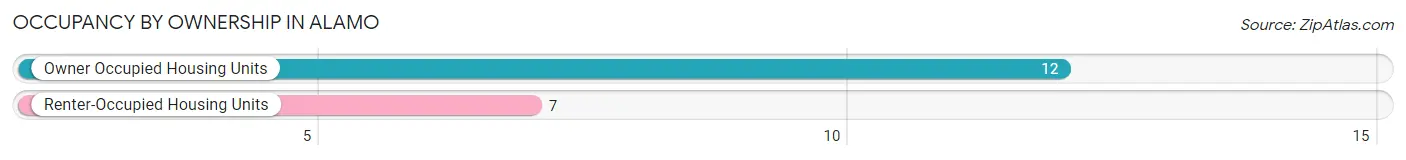
| Occupancy | # Housing Units | % Housing Units |
| Owner Occupied Housing Units | 12 | 63.2% |
| Renter-Occupied Housing Units | 7 | 36.8% |
| Total Occupied Housing Units | 19 | 100.0% |
Occupancy by Household Size in Alamo
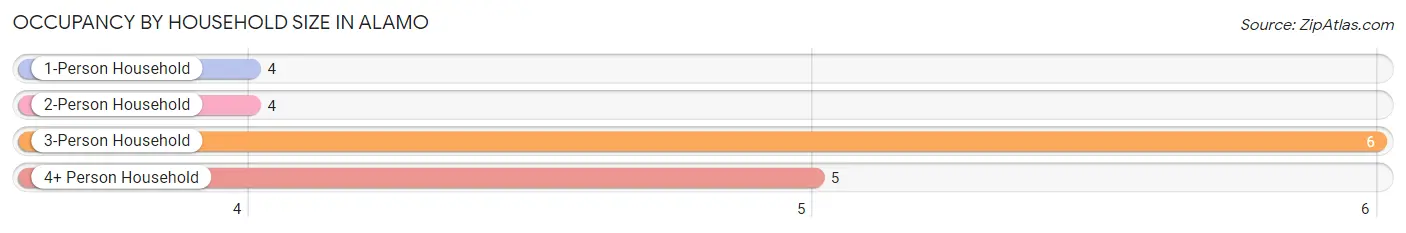
| Household Size | # Housing Units | % Housing Units |
| 1-Person Household | 4 | 21.0% |
| 2-Person Household | 4 | 21.0% |
| 3-Person Household | 6 | 31.6% |
| 4+ Person Household | 5 | 26.3% |
| Total Housing Units | 19 | 100.0% |
Occupancy by Ownership by Household Size in Alamo
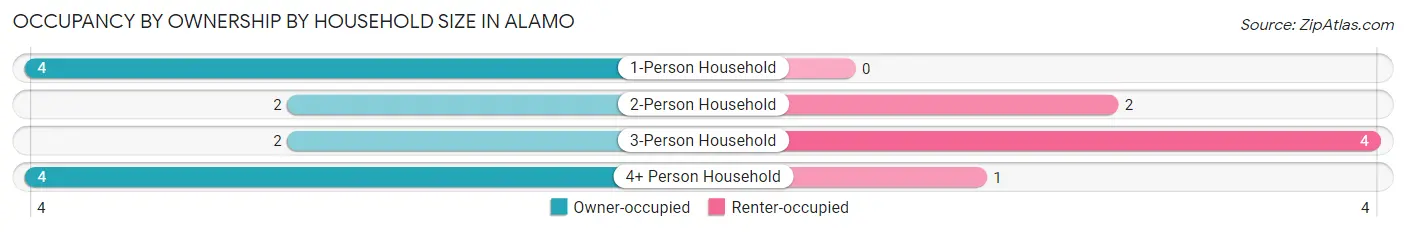
| Household Size | Owner-occupied | Renter-occupied |
| 1-Person Household | 4 (100.0%) | 0 (0.0%) |
| 2-Person Household | 2 (50.0%) | 2 (50.0%) |
| 3-Person Household | 2 (33.3%) | 4 (66.7%) |
| 4+ Person Household | 4 (80.0%) | 1 (20.0%) |
| Total Housing Units | 12 (63.2%) | 7 (36.8%) |
Occupancy by Educational Attainment in Alamo
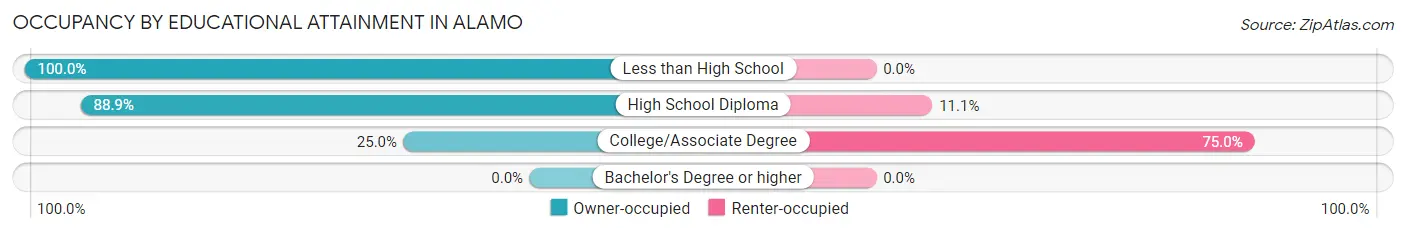
| Household Size | Owner-occupied | Renter-occupied |
| Less than High School | 2 (100.0%) | 0 (0.0%) |
| High School Diploma | 8 (88.9%) | 1 (11.1%) |
| College/Associate Degree | 2 (25.0%) | 6 (75.0%) |
| Bachelor's Degree or higher | 0 (0.0%) | 0 (0.0%) |
Occupancy by Age of Householder in Alamo
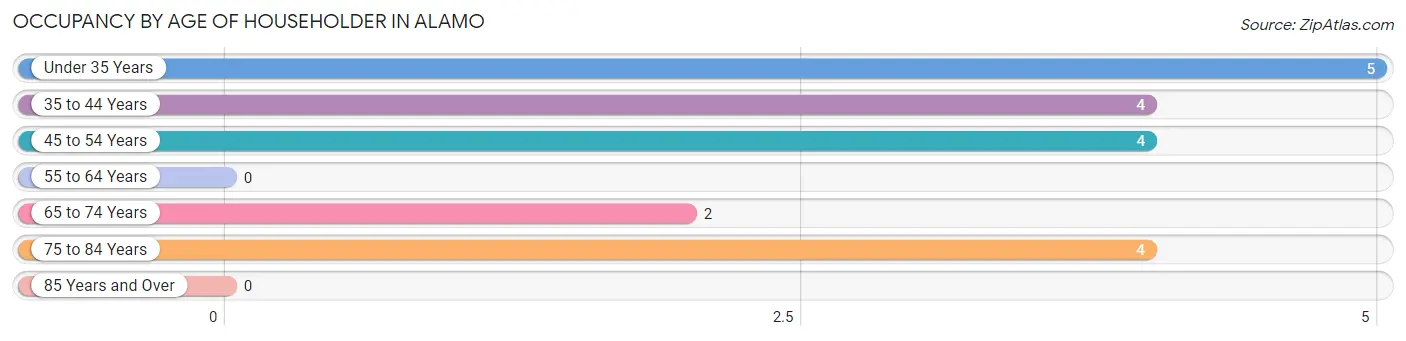
| Age Bracket | # Households | % Households |
| Under 35 Years | 5 | 26.3% |
| 35 to 44 Years | 4 | 21.0% |
| 45 to 54 Years | 4 | 21.0% |
| 55 to 64 Years | 0 | 0.0% |
| 65 to 74 Years | 2 | 10.5% |
| 75 to 84 Years | 4 | 21.0% |
| 85 Years and Over | 0 | 0.0% |
| Total | 19 | 100.0% |
Housing Finances in Alamo
Median Income by Occupancy in Alamo
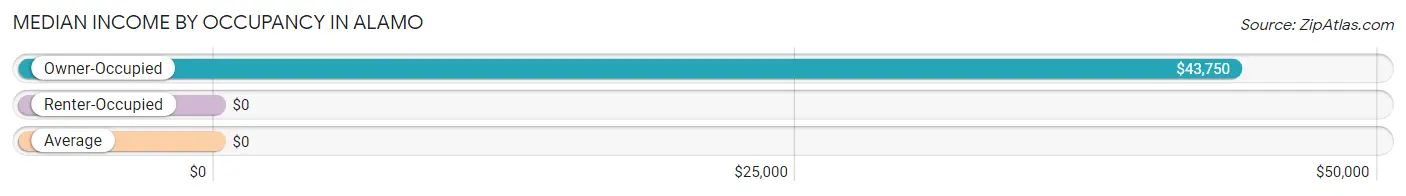
| Occupancy Type | # Households | Median Income |
| Owner-Occupied | 12 (63.2%) | $43,750 |
| Renter-Occupied | 7 (36.8%) | $0 |
| Average | 19 (100.0%) | $0 |
Occupancy by Householder Income Bracket in Alamo
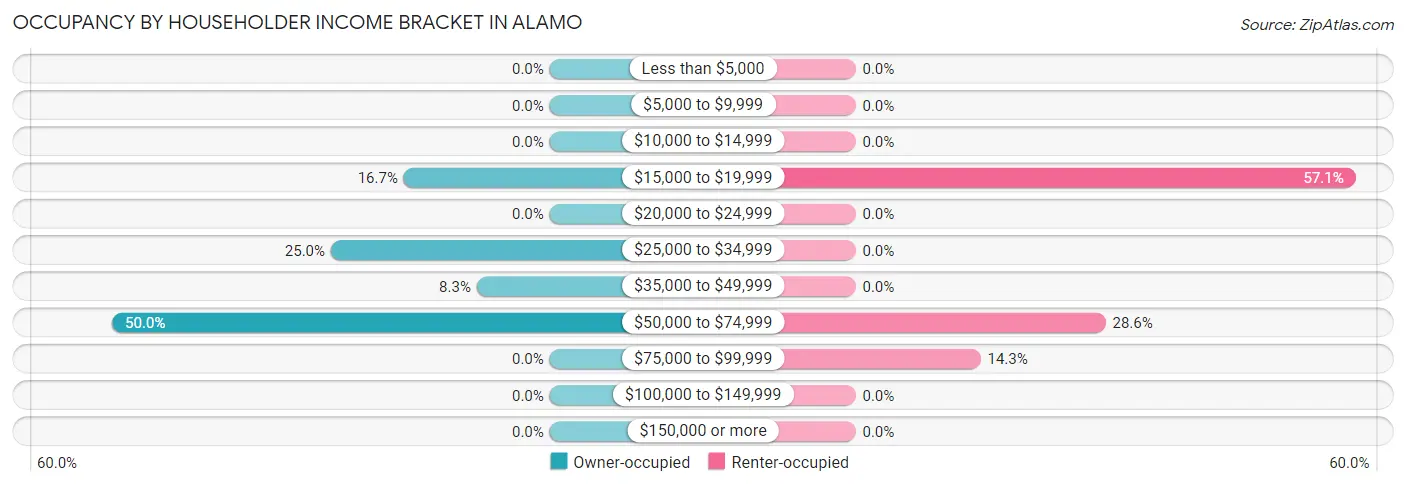
| Income Bracket | Owner-occupied | Renter-occupied |
| Less than $5,000 | 0 (0.0%) | 0 (0.0%) |
| $5,000 to $9,999 | 0 (0.0%) | 0 (0.0%) |
| $10,000 to $14,999 | 0 (0.0%) | 0 (0.0%) |
| $15,000 to $19,999 | 2 (16.7%) | 4 (57.1%) |
| $20,000 to $24,999 | 0 (0.0%) | 0 (0.0%) |
| $25,000 to $34,999 | 3 (25.0%) | 0 (0.0%) |
| $35,000 to $49,999 | 1 (8.3%) | 0 (0.0%) |
| $50,000 to $74,999 | 6 (50.0%) | 2 (28.6%) |
| $75,000 to $99,999 | 0 (0.0%) | 1 (14.3%) |
| $100,000 to $149,999 | 0 (0.0%) | 0 (0.0%) |
| $150,000 or more | 0 (0.0%) | 0 (0.0%) |
| Total | 12 (100.0%) | 7 (100.0%) |
Monthly Housing Cost Tiers in Alamo
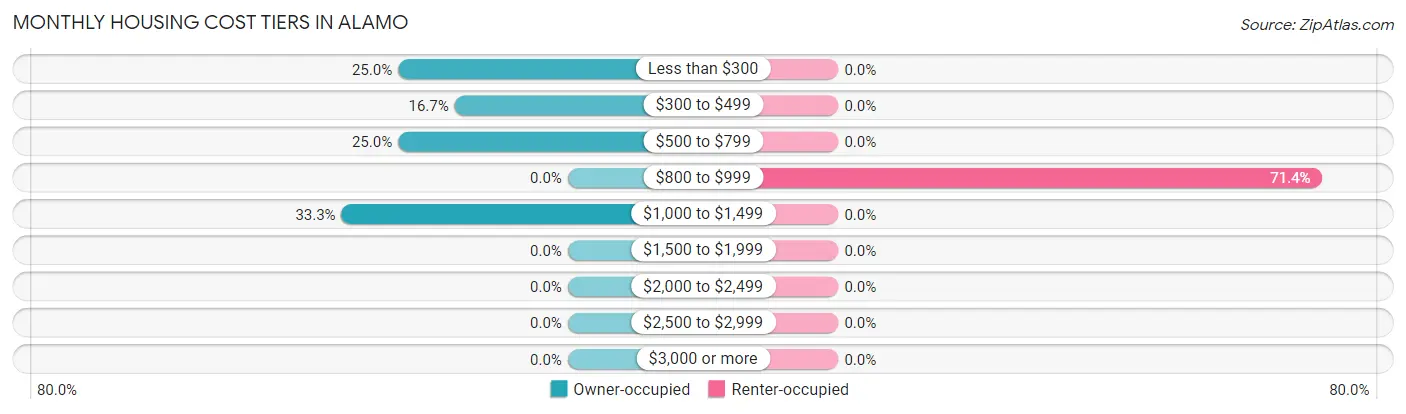
| Monthly Cost | Owner-occupied | Renter-occupied |
| Less than $300 | 3 (25.0%) | 0 (0.0%) |
| $300 to $499 | 2 (16.7%) | 0 (0.0%) |
| $500 to $799 | 3 (25.0%) | 0 (0.0%) |
| $800 to $999 | 0 (0.0%) | 5 (71.4%) |
| $1,000 to $1,499 | 4 (33.3%) | 0 (0.0%) |
| $1,500 to $1,999 | 0 (0.0%) | 0 (0.0%) |
| $2,000 to $2,499 | 0 (0.0%) | 0 (0.0%) |
| $2,500 to $2,999 | 0 (0.0%) | 0 (0.0%) |
| $3,000 or more | 0 (0.0%) | 0 (0.0%) |
| Total | 12 (100.0%) | 7 (100.0%) |
Physical Housing Characteristics in Alamo
Housing Structures in Alamo
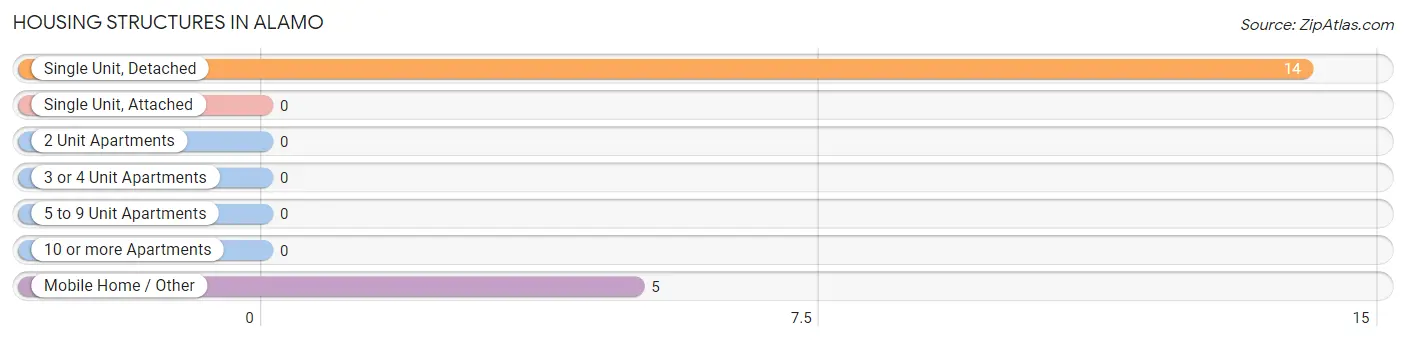
| Structure Type | # Housing Units | % Housing Units |
| Single Unit, Detached | 14 | 73.7% |
| Single Unit, Attached | 0 | 0.0% |
| 2 Unit Apartments | 0 | 0.0% |
| 3 or 4 Unit Apartments | 0 | 0.0% |
| 5 to 9 Unit Apartments | 0 | 0.0% |
| 10 or more Apartments | 0 | 0.0% |
| Mobile Home / Other | 5 | 26.3% |
| Total | 19 | 100.0% |
Housing Structures by Occupancy in Alamo
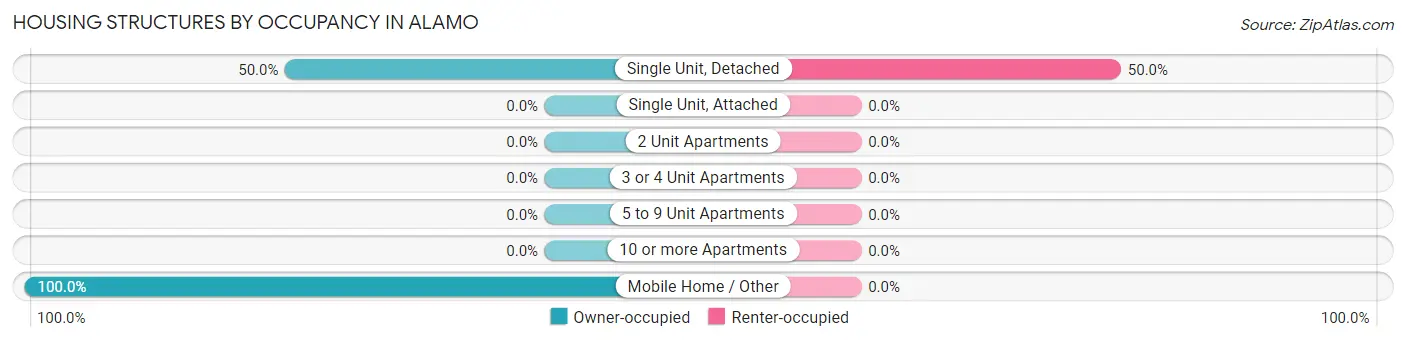
| Structure Type | Owner-occupied | Renter-occupied |
| Single Unit, Detached | 7 (50.0%) | 7 (50.0%) |
| Single Unit, Attached | 0 (0.0%) | 0 (0.0%) |
| 2 Unit Apartments | 0 (0.0%) | 0 (0.0%) |
| 3 or 4 Unit Apartments | 0 (0.0%) | 0 (0.0%) |
| 5 to 9 Unit Apartments | 0 (0.0%) | 0 (0.0%) |
| 10 or more Apartments | 0 (0.0%) | 0 (0.0%) |
| Mobile Home / Other | 5 (100.0%) | 0 (0.0%) |
| Total | 12 (63.2%) | 7 (36.8%) |
Housing Structures by Number of Rooms in Alamo
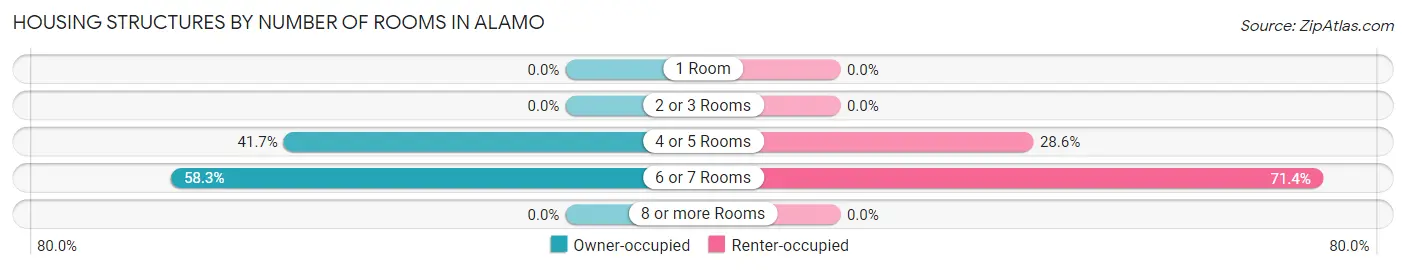
| Number of Rooms | Owner-occupied | Renter-occupied |
| 1 Room | 0 (0.0%) | 0 (0.0%) |
| 2 or 3 Rooms | 0 (0.0%) | 0 (0.0%) |
| 4 or 5 Rooms | 5 (41.7%) | 2 (28.6%) |
| 6 or 7 Rooms | 7 (58.3%) | 5 (71.4%) |
| 8 or more Rooms | 0 (0.0%) | 0 (0.0%) |
| Total | 12 (100.0%) | 7 (100.0%) |
Housing Structure by Heating Type in Alamo
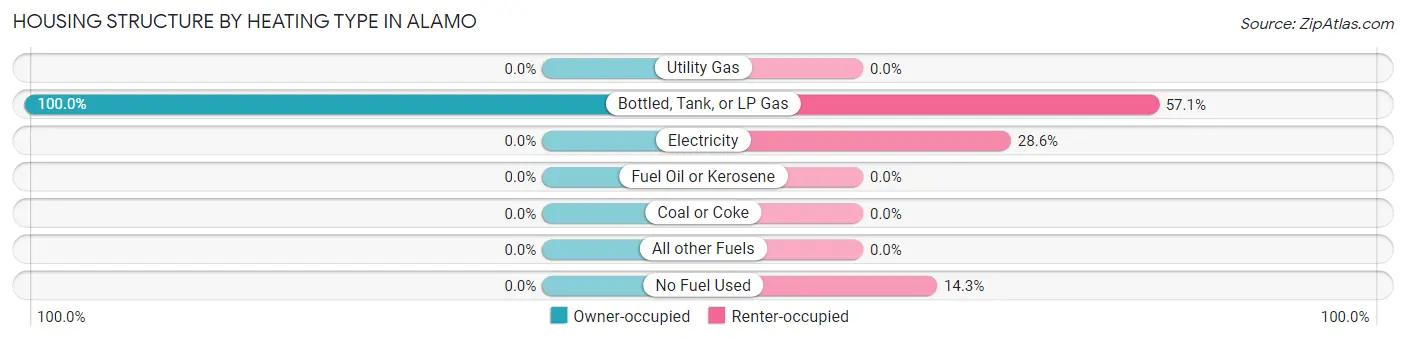
| Heating Type | Owner-occupied | Renter-occupied |
| Utility Gas | 0 (0.0%) | 0 (0.0%) |
| Bottled, Tank, or LP Gas | 12 (100.0%) | 4 (57.1%) |
| Electricity | 0 (0.0%) | 2 (28.6%) |
| Fuel Oil or Kerosene | 0 (0.0%) | 0 (0.0%) |
| Coal or Coke | 0 (0.0%) | 0 (0.0%) |
| All other Fuels | 0 (0.0%) | 0 (0.0%) |
| No Fuel Used | 0 (0.0%) | 1 (14.3%) |
| Total | 12 (100.0%) | 7 (100.0%) |
Household Vehicle Usage in Alamo
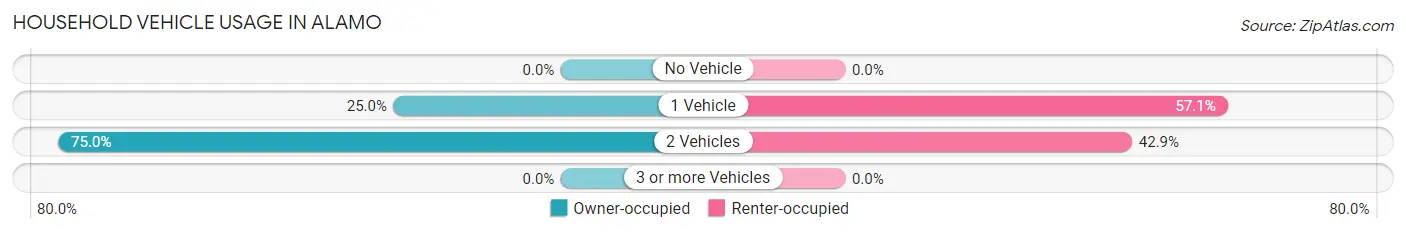
| Vehicles per Household | Owner-occupied | Renter-occupied |
| No Vehicle | 0 (0.0%) | 0 (0.0%) |
| 1 Vehicle | 3 (25.0%) | 4 (57.1%) |
| 2 Vehicles | 9 (75.0%) | 3 (42.9%) |
| 3 or more Vehicles | 0 (0.0%) | 0 (0.0%) |
| Total | 12 (100.0%) | 7 (100.0%) |
Real Estate & Mortgages in Alamo
Real Estate and Mortgage Overview in Alamo
| Characteristic | Without Mortgage | With Mortgage |
| Housing Units | 6 | 6 |
| Median Property Value | - | - |
| Median Household Income | - | - |
| Monthly Housing Costs | $350 | $0 |
| Real Estate Taxes | - | - |
Property Value by Mortgage Status in Alamo
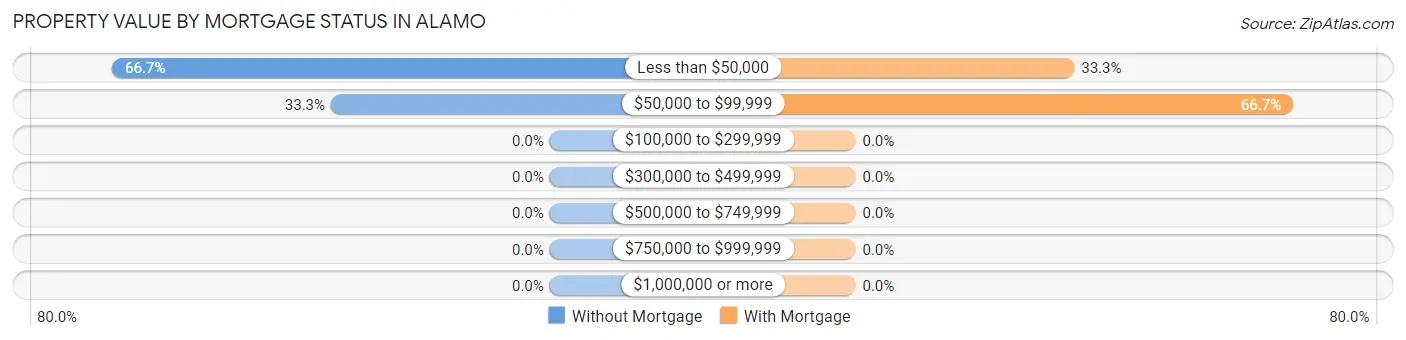
| Property Value | Without Mortgage | With Mortgage |
| Less than $50,000 | 4 (66.7%) | 2 (33.3%) |
| $50,000 to $99,999 | 2 (33.3%) | 4 (66.7%) |
| $100,000 to $299,999 | 0 (0.0%) | 0 (0.0%) |
| $300,000 to $499,999 | 0 (0.0%) | 0 (0.0%) |
| $500,000 to $749,999 | 0 (0.0%) | 0 (0.0%) |
| $750,000 to $999,999 | 0 (0.0%) | 0 (0.0%) |
| $1,000,000 or more | 0 (0.0%) | 0 (0.0%) |
| Total | 6 (100.0%) | 6 (100.0%) |
Household Income by Mortgage Status in Alamo
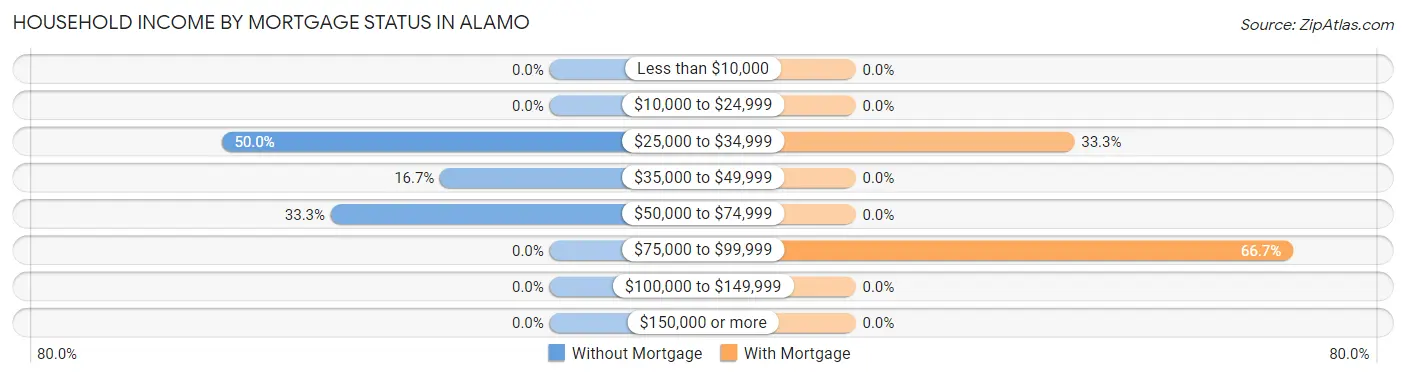
| Household Income | Without Mortgage | With Mortgage |
| Less than $10,000 | 0 (0.0%) | 0 (0.0%) |
| $10,000 to $24,999 | 0 (0.0%) | 0 (0.0%) |
| $25,000 to $34,999 | 3 (50.0%) | 2 (33.3%) |
| $35,000 to $49,999 | 1 (16.7%) | 0 (0.0%) |
| $50,000 to $74,999 | 2 (33.3%) | 0 (0.0%) |
| $75,000 to $99,999 | 0 (0.0%) | 4 (66.7%) |
| $100,000 to $149,999 | 0 (0.0%) | 0 (0.0%) |
| $150,000 or more | 0 (0.0%) | 0 (0.0%) |
| Total | 6 (100.0%) | 6 (100.0%) |
Property Value to Household Income Ratio in Alamo
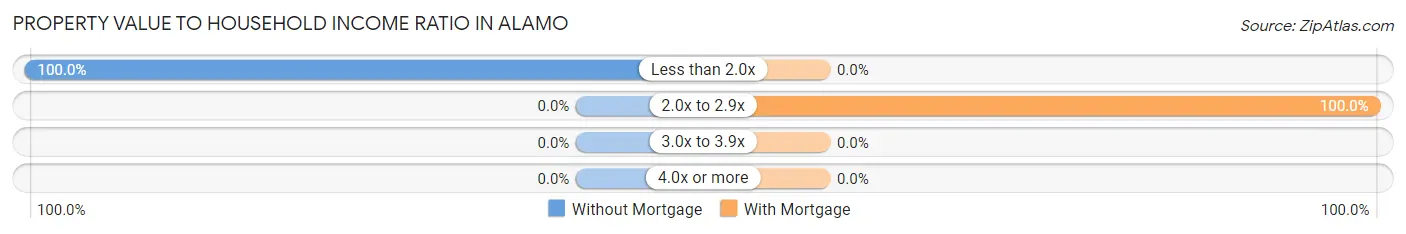
| Value-to-Income Ratio | Without Mortgage | With Mortgage |
| Less than 2.0x | 6 (100.0%) | 0 (0.0%) |
| 2.0x to 2.9x | 0 (0.0%) | 6 (100.0%) |
| 3.0x to 3.9x | 0 (0.0%) | 0 (0.0%) |
| 4.0x or more | 0 (0.0%) | 0 (0.0%) |
| Total | 6 (100.0%) | 6 (100.0%) |
Real Estate Taxes by Mortgage Status in Alamo
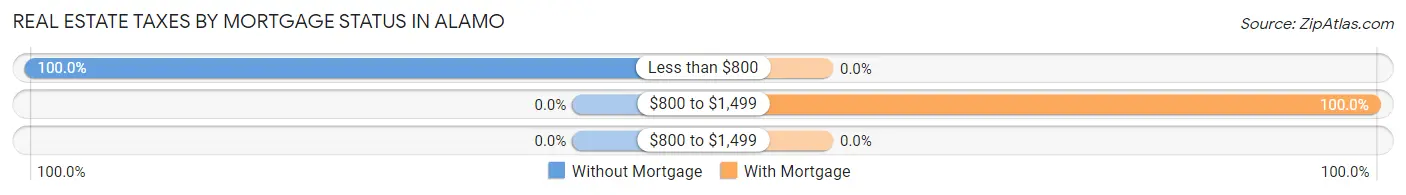
| Property Taxes | Without Mortgage | With Mortgage |
| Less than $800 | 6 (100.0%) | 0 (0.0%) |
| $800 to $1,499 | 0 (0.0%) | 6 (100.0%) |
| $800 to $1,499 | 0 (0.0%) | 0 (0.0%) |
| Total | 6 (100.0%) | 6 (100.0%) |
Health & Disability in Alamo
Health Insurance Coverage by Age in Alamo
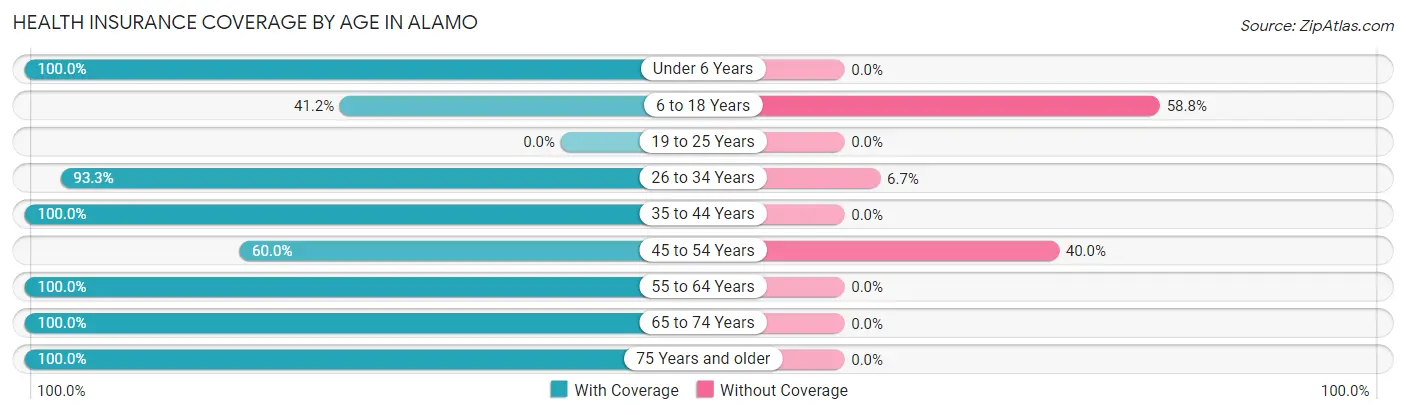
| Age Bracket | With Coverage | Without Coverage |
| Under 6 Years | 6 (100.0%) | 0 (0.0%) |
| 6 to 18 Years | 7 (41.2%) | 10 (58.8%) |
| 19 to 25 Years | 0 (0.0%) | 0 (0.0%) |
| 26 to 34 Years | 14 (93.3%) | 1 (6.7%) |
| 35 to 44 Years | 4 (100.0%) | 0 (0.0%) |
| 45 to 54 Years | 3 (60.0%) | 2 (40.0%) |
| 55 to 64 Years | 3 (100.0%) | 0 (0.0%) |
| 65 to 74 Years | 2 (100.0%) | 0 (0.0%) |
| 75 Years and older | 4 (100.0%) | 0 (0.0%) |
| Total | 43 (76.8%) | 13 (23.2%) |
Health Insurance Coverage by Citizenship Status in Alamo
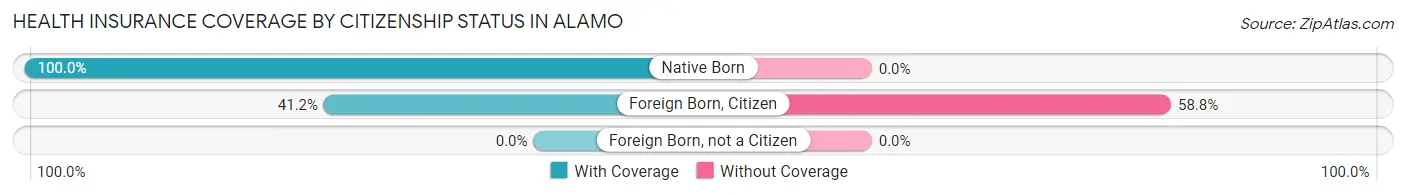
| Citizenship Status | With Coverage | Without Coverage |
| Native Born | 6 (100.0%) | 0 (0.0%) |
| Foreign Born, Citizen | 7 (41.2%) | 10 (58.8%) |
| Foreign Born, not a Citizen | 0 (0.0%) | 0 (0.0%) |
Health Insurance Coverage by Household Income in Alamo
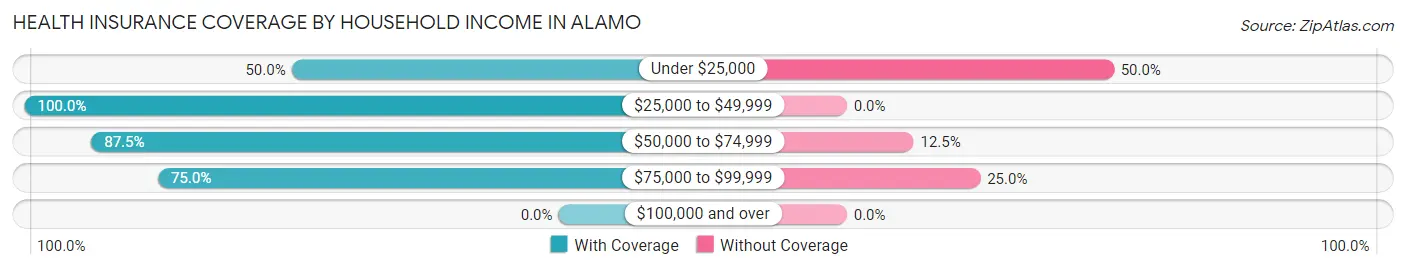
| Household Income | With Coverage | Without Coverage |
| Under $25,000 | 8 (50.0%) | 8 (50.0%) |
| $25,000 to $49,999 | 4 (100.0%) | 0 (0.0%) |
| $50,000 to $74,999 | 28 (87.5%) | 4 (12.5%) |
| $75,000 to $99,999 | 3 (75.0%) | 1 (25.0%) |
| $100,000 and over | 0 (0.0%) | 0 (0.0%) |
Public vs Private Health Insurance Coverage by Age in Alamo
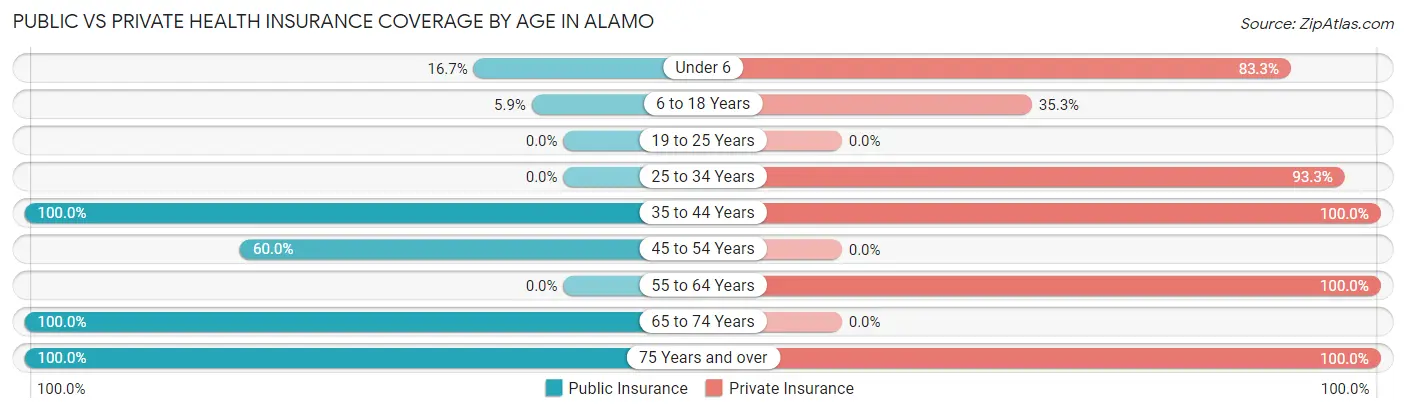
| Age Bracket | Public Insurance | Private Insurance |
| Under 6 | 1 (16.7%) | 5 (83.3%) |
| 6 to 18 Years | 1 (5.9%) | 6 (35.3%) |
| 19 to 25 Years | 0 (0.0%) | 0 (0.0%) |
| 25 to 34 Years | 0 (0.0%) | 14 (93.3%) |
| 35 to 44 Years | 4 (100.0%) | 4 (100.0%) |
| 45 to 54 Years | 3 (60.0%) | 0 (0.0%) |
| 55 to 64 Years | 0 (0.0%) | 3 (100.0%) |
| 65 to 74 Years | 2 (100.0%) | 0 (0.0%) |
| 75 Years and over | 4 (100.0%) | 4 (100.0%) |
| Total | 15 (26.8%) | 36 (64.3%) |
Disability Status by Sex by Age in Alamo
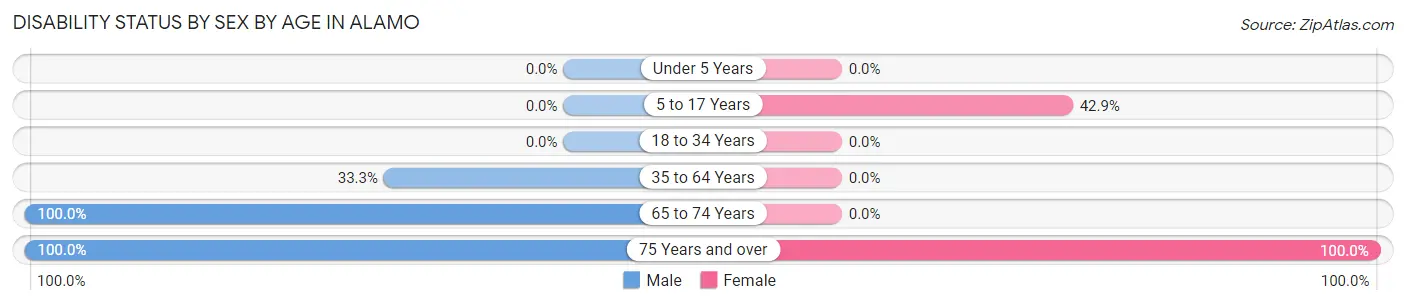
| Age Bracket | Male | Female |
| Under 5 Years | 0 (0.0%) | 0 (0.0%) |
| 5 to 17 Years | 0 (0.0%) | 3 (42.9%) |
| 18 to 34 Years | 0 (0.0%) | 0 (0.0%) |
| 35 to 64 Years | 1 (33.3%) | 0 (0.0%) |
| 65 to 74 Years | 2 (100.0%) | 0 (0.0%) |
| 75 Years and over | 1 (100.0%) | 3 (100.0%) |
Disability Class by Sex by Age in Alamo
Disability Class: Hearing Difficulty
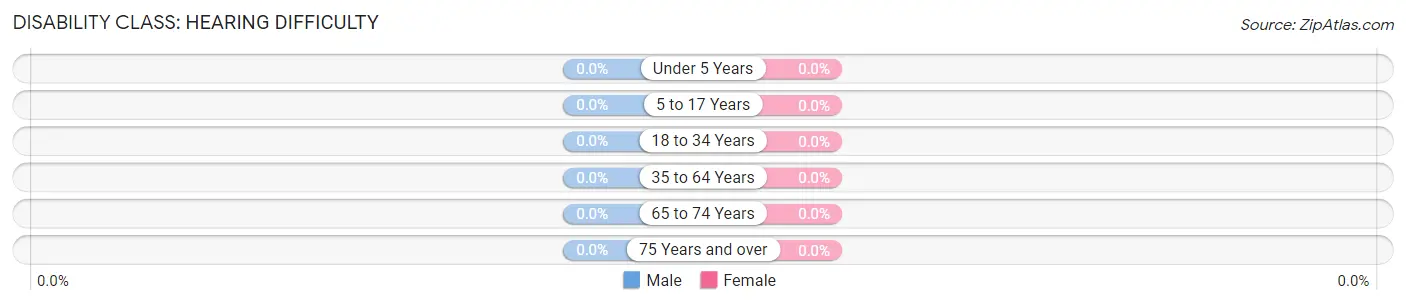
| Age Bracket | Male | Female |
| Under 5 Years | 0 (0.0%) | 0 (0.0%) |
| 5 to 17 Years | 0 (0.0%) | 0 (0.0%) |
| 18 to 34 Years | 0 (0.0%) | 0 (0.0%) |
| 35 to 64 Years | 0 (0.0%) | 0 (0.0%) |
| 65 to 74 Years | 0 (0.0%) | 0 (0.0%) |
| 75 Years and over | 0 (0.0%) | 0 (0.0%) |
Disability Class: Vision Difficulty
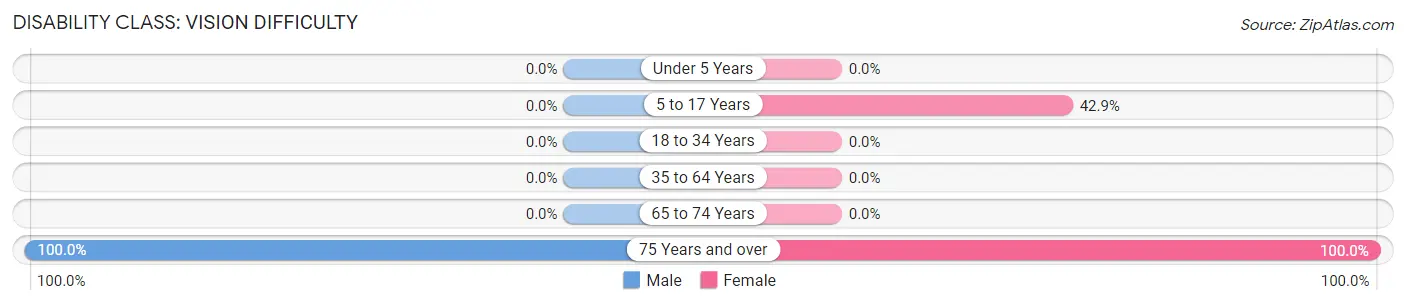
| Age Bracket | Male | Female |
| Under 5 Years | 0 (0.0%) | 0 (0.0%) |
| 5 to 17 Years | 0 (0.0%) | 3 (42.9%) |
| 18 to 34 Years | 0 (0.0%) | 0 (0.0%) |
| 35 to 64 Years | 0 (0.0%) | 0 (0.0%) |
| 65 to 74 Years | 0 (0.0%) | 0 (0.0%) |
| 75 Years and over | 1 (100.0%) | 3 (100.0%) |
Disability Class: Cognitive Difficulty
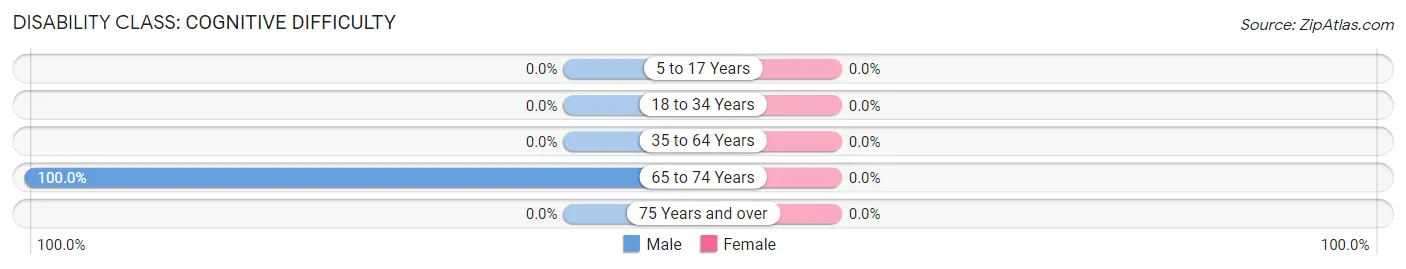
| Age Bracket | Male | Female |
| 5 to 17 Years | 0 (0.0%) | 0 (0.0%) |
| 18 to 34 Years | 0 (0.0%) | 0 (0.0%) |
| 35 to 64 Years | 0 (0.0%) | 0 (0.0%) |
| 65 to 74 Years | 2 (100.0%) | 0 (0.0%) |
| 75 Years and over | 0 (0.0%) | 0 (0.0%) |
Disability Class: Ambulatory Difficulty
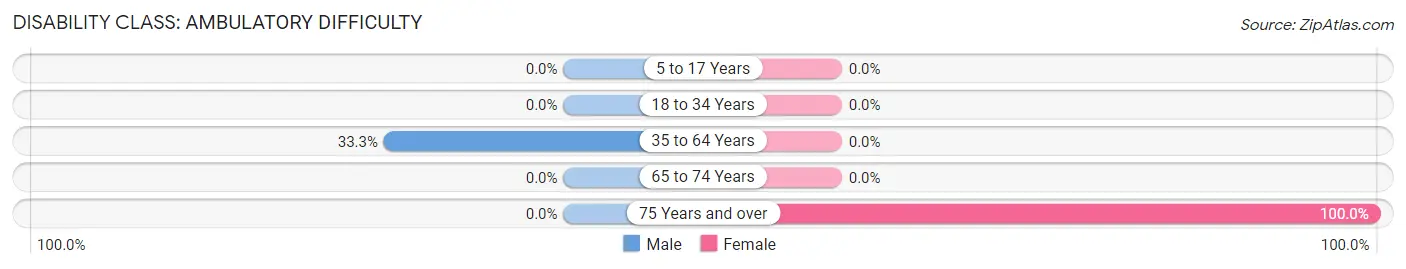
| Age Bracket | Male | Female |
| 5 to 17 Years | 0 (0.0%) | 0 (0.0%) |
| 18 to 34 Years | 0 (0.0%) | 0 (0.0%) |
| 35 to 64 Years | 1 (33.3%) | 0 (0.0%) |
| 65 to 74 Years | 0 (0.0%) | 0 (0.0%) |
| 75 Years and over | 0 (0.0%) | 3 (100.0%) |
Disability Class: Self-Care Difficulty
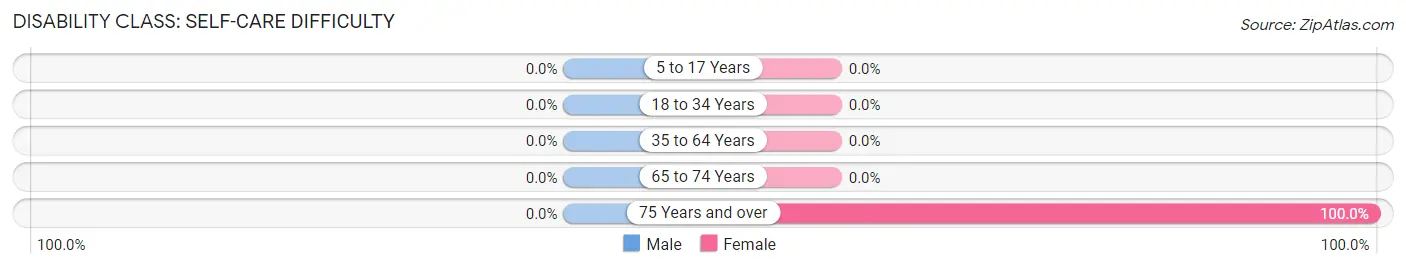
| Age Bracket | Male | Female |
| 5 to 17 Years | 0 (0.0%) | 0 (0.0%) |
| 18 to 34 Years | 0 (0.0%) | 0 (0.0%) |
| 35 to 64 Years | 0 (0.0%) | 0 (0.0%) |
| 65 to 74 Years | 0 (0.0%) | 0 (0.0%) |
| 75 Years and over | 0 (0.0%) | 3 (100.0%) |
Technology Access in Alamo
Computing Device Access in Alamo
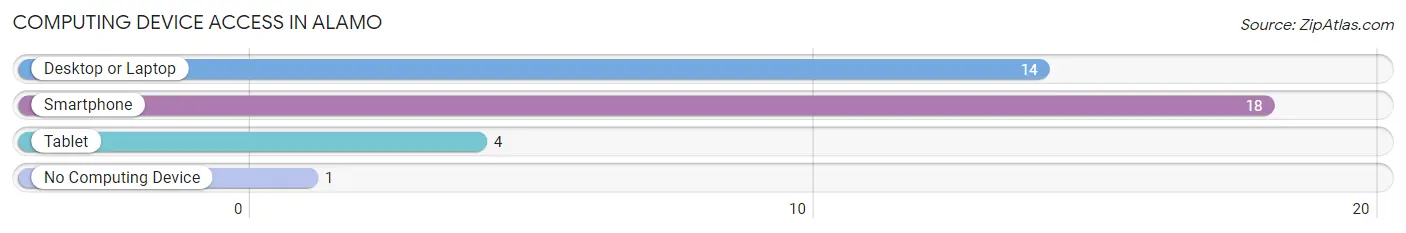
| Device Type | # Households | % Households |
| Desktop or Laptop | 14 | 73.7% |
| Smartphone | 18 | 94.7% |
| Tablet | 4 | 21.0% |
| No Computing Device | 1 | 5.3% |
| Total | 19 | 100.0% |
Internet Access in Alamo
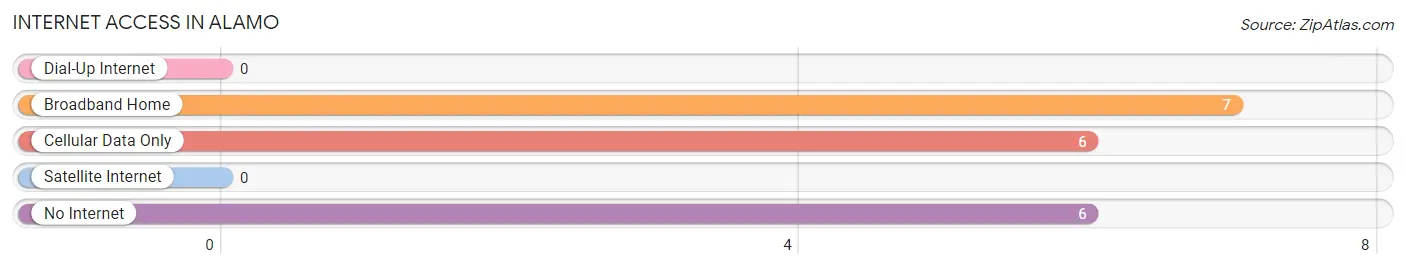
| Internet Type | # Households | % Households |
| Dial-Up Internet | 0 | 0.0% |
| Broadband Home | 7 | 36.8% |
| Cellular Data Only | 6 | 31.6% |
| Satellite Internet | 0 | 0.0% |
| No Internet | 6 | 31.6% |
| Total | 19 | 100.0% |
Alamo Summary
Alamo, Indiana is a small town located in the southwestern corner of the state, in the county of Montgomery. It is situated on the banks of the Wabash River, and is home to a population of just over 1,000 people. The town was founded in 1837, and has a rich history of industry, agriculture, and culture.
Geography
Alamo is located in the southwestern corner of Indiana, in the county of Montgomery. It is situated on the banks of the Wabash River, and is surrounded by rolling hills and farmland. The town is located approximately 30 miles from the state capital of Indianapolis, and is within easy driving distance of several major cities, including Chicago, Cincinnati, and Louisville.
The town is divided into two distinct sections, the north side and the south side. The north side is home to the majority of the town’s businesses, while the south side is primarily residential. The town is served by two major highways, US Route 41 and State Route 32.
Economy
Alamo’s economy is largely based on agriculture and manufacturing. The town is home to several large farms, which produce a variety of crops, including corn, soybeans, and wheat. The town is also home to several manufacturing companies, which produce a variety of products, including furniture, automotive parts, and medical supplies.
In addition to agriculture and manufacturing, Alamo is home to several small businesses, including restaurants, retail stores, and service providers. The town is also home to a number of tourist attractions, including the Wabash River Museum and the Alamo Historical Society.
Demographics
As of the 2010 census, Alamo had a population of 1,072 people. The town is predominantly white, with a small African American population. The median household income is $41,250, and the median age is 40.
The town is served by the Alamo-Montgomery Community School Corporation, which consists of two elementary schools, one middle school, and one high school. The town is also home to a branch of the Montgomery County Public Library.
Conclusion
Alamo, Indiana is a small town with a rich history and a vibrant economy. The town is home to a diverse population, and is served by a number of businesses, schools, and tourist attractions. Alamo is a great place to live, work, and visit, and is sure to remain a vibrant part of the Indiana landscape for many years to come.
Common Questions
What is Per Capita Income in Alamo?
Per Capita income in Alamo is $15,813.
What is Income or Wage Gap in Alamo?
Income or Wage Gap in Alamo is 25.8%.
Women in Alamo earn 74.2 cents for every dollar earned by a man.
What is Inequality or Gini Index in Alamo?
Inequality or Gini Index in Alamo is 0.26.
What is the Total Population of Alamo?
Total Population of Alamo is 56.
What is the Total Male Population of Alamo?
Total Male Population of Alamo is 27.
What is the Total Female Population of Alamo?
Total Female Population of Alamo is 29.
What is the Ratio of Males per 100 Females in Alamo?
There are 93.10 Males per 100 Females in Alamo.
What is the Ratio of Females per 100 Males in Alamo?
There are 107.41 Females per 100 Males in Alamo.
What is the Median Population Age in Alamo?
Median Population Age in Alamo is 28.8 Years.
What is the Average Family Size in Alamo
Average Family Size in Alamo is 2.9 People.
What is the Average Household Size in Alamo
Average Household Size in Alamo is 3.0 People.
How Large is the Labor Force in Alamo?
There are 25 People in the Labor Forcein in Alamo.
What is the Percentage of People in the Labor Force in Alamo?
62.5% of People are in the Labor Force in Alamo.
What is the Unemployment Rate in Alamo?
Unemployment Rate in Alamo is 8.0%.