Zip Codes with the Highest Percentage of Population Working from Home in Rockford, IL

RELATED REPORTS & OPTIONS

Work from Home
Population
Families and Households
Female Fertility
Female Fertility (Unmarried)
Race (Community Size)
Race (Percentage)
Ancestry (Community Size)
AfricanAlbanianAlsatianAmericanApacheArabArgentineanArmenianAustralianAustrianBarbadianBelgianBelizeanBhutaneseBlackfeetBrazilianBritishBulgarianBurmeseCambodianCanadianCelticCentral AmericanCherokeeCheyenneChippewaChoctawColombianCroatianCubanCzechCzechoslovakianDanishDominicanDutchEastern EuropeanEcuadorianEgyptianEnglishEuropeanFinnishFrenchFrench CanadianGermanGhanaianGreekGuamanian / ChamorroGuatemalanHaitianHonduranHungarianIndian (Asian)IndonesianIraqiIrishItalianJamaicanJordanianKenyanKoreanLatvianLebaneseLithuanianLuxembourgerMalaysianMexicanMexican American IndianMoroccanNigerianNorthern EuropeanNorwegianPakistaniPennsylvania GermanPeruvianPolishPortuguesePotawatomiPuerto RicanRomanianRussianSalvadoranScandinavianScotch-IrishScottishSerbianSiouxSlovakSloveneSouth AmericanSpaniardSpanishSri LankanSubsaharan AfricanSwedishSwissThaiUkrainianWelshYugoslavian
Ancestry (Percentage)
AfricanAlbanianAlsatianAmericanApacheArabArgentineanArmenianAustralianAustrianBarbadianBelgianBelizeanBhutaneseBlackfeetBrazilianBritishBulgarianBurmeseCambodianCanadianCelticCentral AmericanCherokeeCheyenneChippewaChoctawColombianCroatianCubanCzechCzechoslovakianDanishDominicanDutchEastern EuropeanEcuadorianEgyptianEnglishEuropeanFinnishFrenchFrench CanadianGermanGhanaianGreekGuamanian / ChamorroGuatemalanHaitianHonduranHungarianIndian (Asian)IndonesianIraqiIrishItalianJamaicanJordanianKenyanKoreanLatvianLebaneseLithuanianLuxembourgerMalaysianMexicanMexican American IndianMoroccanNigerianNorthern EuropeanNorwegianPakistaniPennsylvania GermanPeruvianPolishPortuguesePotawatomiPuerto RicanRomanianRussianSalvadoranScandinavianScotch-IrishScottishSerbianSiouxSlovakSloveneSouth AmericanSpaniardSpanishSri LankanSubsaharan AfricanSwedishSwissThaiUkrainianWelshYugoslavian
Immigrant Origin (Total)
Immigrant Origin (Percentage)
Income
Income (Families)
Income (Households)
Poverty
Poverty (Families)
Unemployment
Employment Occupations
Employment Industries
Employer Class
Commute Time
Commute Means
School Enrollment
Education by Degree Field
Occupancy
Finances
Physical Characteristics
Rockford
Compare Zip Codes
Comparison Subject

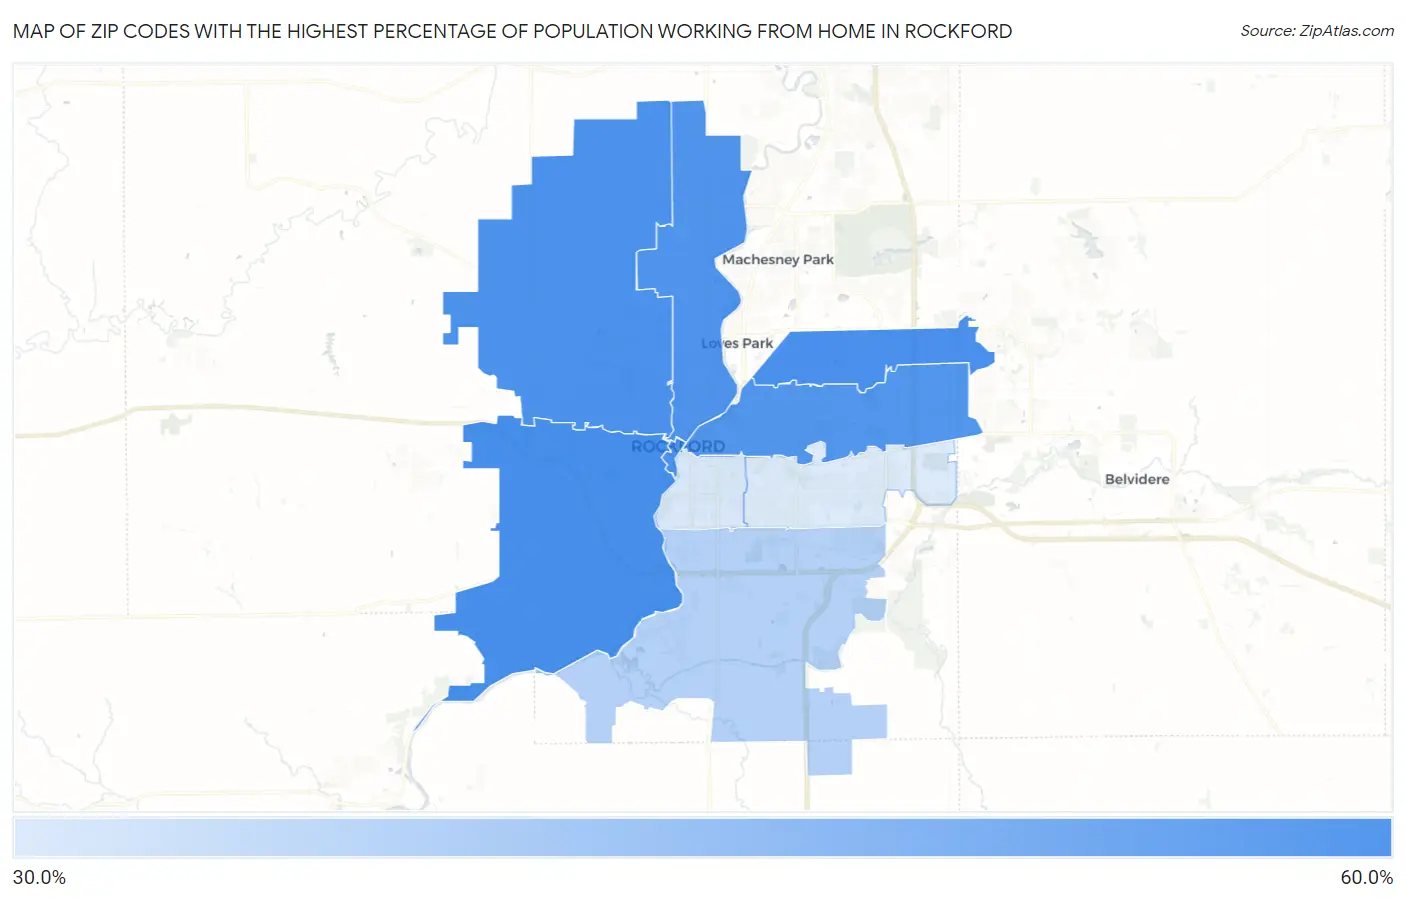
Map of Zip Codes with the Highest Percentage of Population Working from Home in Rockford

0.0%
60.0%
Zip Codes with the Highest Percentage of Population Working from Home in Rockford Map

Zip Codes with the Highest Percentage of Population Working from Home in Rockford, IL

Zip Code % Work from Home vs State vs National
1.6110253.7%43.1%(+10.6)#20844.0%(+9.70)#5,333
2.6111453.4%43.1%(+10.3)#21744.0%(+9.40)#5,560
3.6110153.3%43.1%(+10.2)#22144.0%(+9.30)#5,628
4.6110353.0%43.1%(+9.90)#23244.0%(+9.00)#5,866
5.6110752.5%43.1%(+9.40)#24444.0%(+8.50)#6,223
6.6110943.6%43.1%(+0.500)#69744.0%(-0.400)#15,979
7.6110440.3%43.1%(-2.80)#83844.0%(-3.70)#19,364
8.6110839.9%43.1%(-3.20)#85244.0%(-4.10)#19,665

Common Questions

What are the Top 5 Zip Codes with the Highest Percentage of Population Working from Home in Rockford, IL?
Top 5 Zip Codes with the Highest Percentage of Population Working from Home in Rockford, IL are:
#1
53.7%
#2
53.4%
#3
53.3%
#4
53.0%
#5
52.5%
What zip code has the Highest Percentage of Population Working from Home in Rockford, IL?
61102 has the Highest Percentage of Population Working from Home in Rockford, IL with 53.7%.
What is the Percentage of Population Working from Home in Rockford, IL?
Percentage of Population Working from Home in Rockford is 45.9%.
What is the Percentage of Population Working from Home in Illinois?
Percentage of Population Working from Home in Illinois is 43.1%.
What is the Percentage of Population Working from Home in the United States?
Percentage of Population Working from Home in the United States is 44.0%.