Zip Codes with the Highest Percentage of Population Walking to Work in Crystal Lake, IL
RELATED REPORTS & OPTIONS
Walk to Work
Crystal Lake
Compare Zip Codes
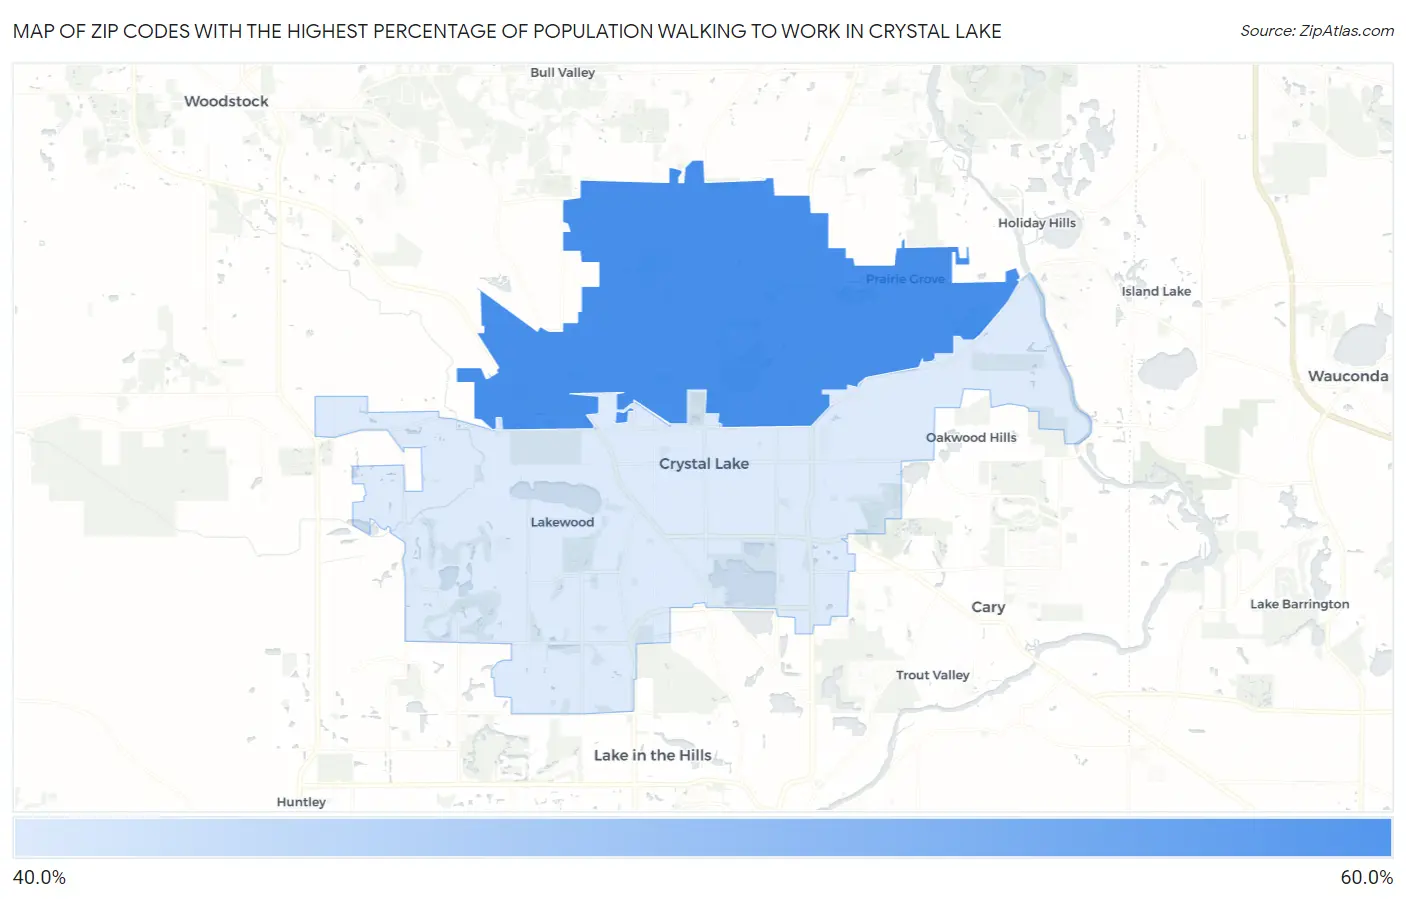
Map of Zip Codes with the Highest Percentage of Population Walking to Work in Crystal Lake
0.0%
60.0%
Zip Codes with the Highest Percentage of Population Walking to Work in Crystal Lake, IL
| Zip Code | % Walk to Work | vs State | vs National | |
| 1. | 60012 | 50.6% | 32.8%(+17.8)#173 | 33.4%(+17.2)#4,320 |
| 2. | 60014 | 43.0% | 32.8%(+10.2)#310 | 33.4%(+9.60)#7,152 |
1
Common Questions
What are the Top Zip Codes with the Highest Percentage of Population Walking to Work in Crystal Lake, IL?
Top Zip Codes with the Highest Percentage of Population Walking to Work in Crystal Lake, IL are:
What zip code has the Highest Percentage of Population Walking to Work in Crystal Lake, IL?
60012 has the Highest Percentage of Population Walking to Work in Crystal Lake, IL with 50.6%.
What is the Percentage of Population Walking to Work in Crystal Lake, IL?
Percentage of Population Walking to Work in Crystal Lake is 45.4%.
What is the Percentage of Population Walking to Work in Illinois?
Percentage of Population Walking to Work in Illinois is 32.8%.
What is the Percentage of Population Walking to Work in the United States?
Percentage of Population Walking to Work in the United States is 33.4%.