Zip Codes with the Highest Percentage of Population Employed in Farming, Fishing & Forestry in Dubuque, IA
RELATED REPORTS & OPTIONS
Farming, Fishing & Forestry
Dubuque
Compare Zip Codes
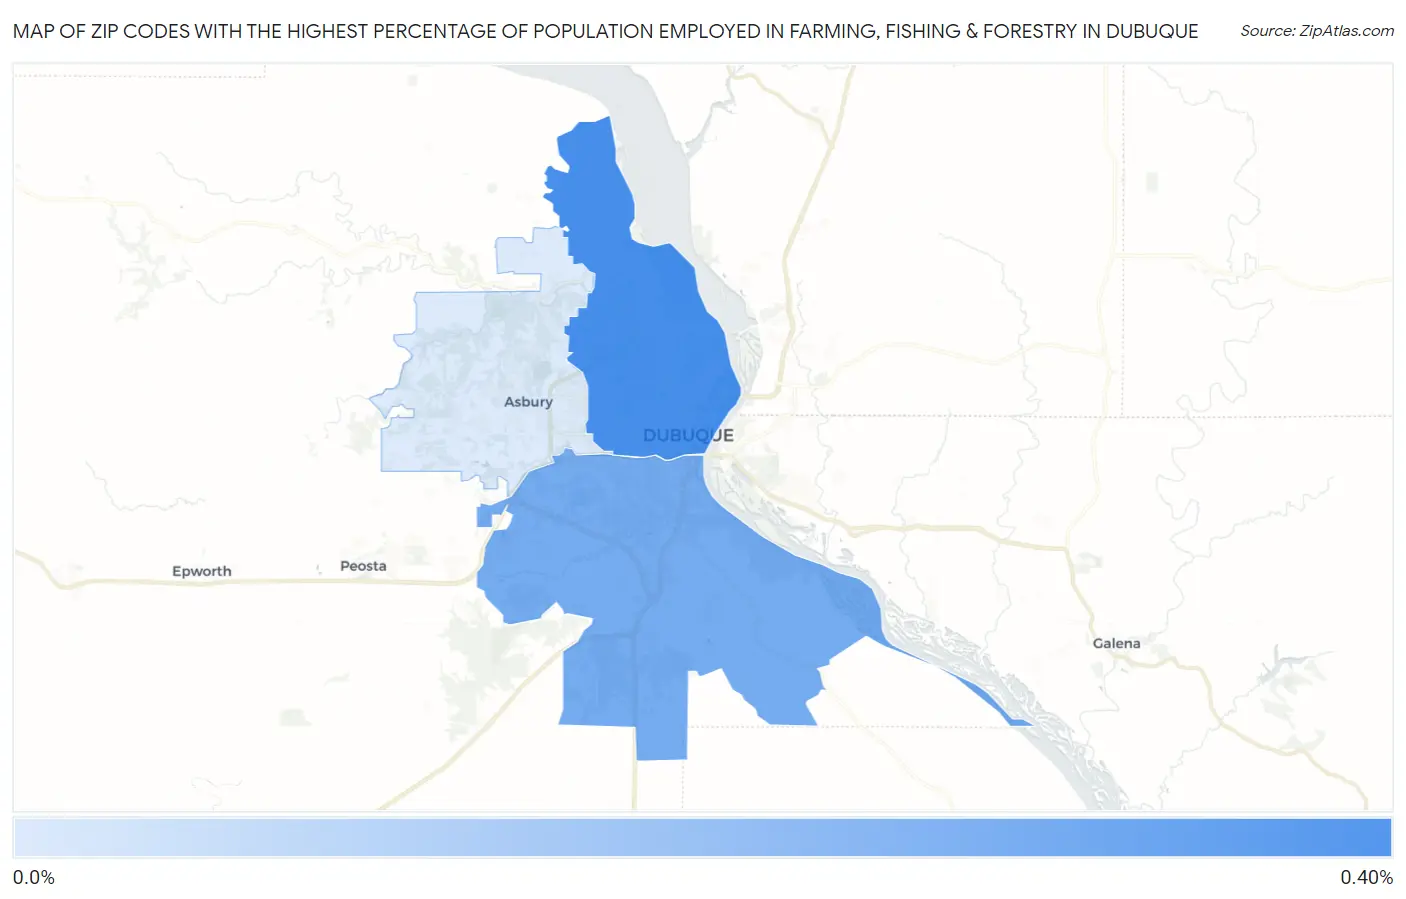
Map of Zip Codes with the Highest Percentage of Population Employed in Farming, Fishing & Forestry in Dubuque
0.0%
0.40%
Zip Codes with the Highest Percentage of Population Employed in Farming, Fishing & Forestry in Dubuque, IA
| Zip Code | % Employed | vs State | vs National | |
| 1. | 52001 | 0.33% | 1.1%(-0.757)#655 | 0.61%(-0.274)#14,468 |
| 2. | 52003 | 0.25% | 1.1%(-0.841)#678 | 0.61%(-0.357)#15,448 |
| 3. | 52002 | 0.067% | 1.1%(-1.02)#709 | 0.61%(-0.539)#18,356 |
1
Common Questions
What are the Top Zip Codes with the Highest Percentage of Population Employed in Farming, Fishing & Forestry in Dubuque, IA?
Top Zip Codes with the Highest Percentage of Population Employed in Farming, Fishing & Forestry in Dubuque, IA are:
What zip code has the Highest Percentage of Population Employed in Farming, Fishing & Forestry in Dubuque, IA?
52001 has the Highest Percentage of Population Employed in Farming, Fishing & Forestry in Dubuque, IA with 0.33%.
What is the Percentage of Population Employed in Farming, Fishing & Forestry in Dubuque, IA?
Percentage of Population Employed in Farming, Fishing & Forestry in Dubuque is 0.26%.
What is the Percentage of Population Employed in Farming, Fishing & Forestry in Iowa?
Percentage of Population Employed in Farming, Fishing & Forestry in Iowa is 1.1%.
What is the Percentage of Population Employed in Farming, Fishing & Forestry in the United States?
Percentage of Population Employed in Farming, Fishing & Forestry in the United States is 0.61%.