Zip Codes with the Highest Percentage of Households Heated by Bottled Gas / Liquid Propane in Warner Robins, GA
RELATED REPORTS & OPTIONS
Bottled Gas / LP Heating
Warner Robins
Compare Zip Codes
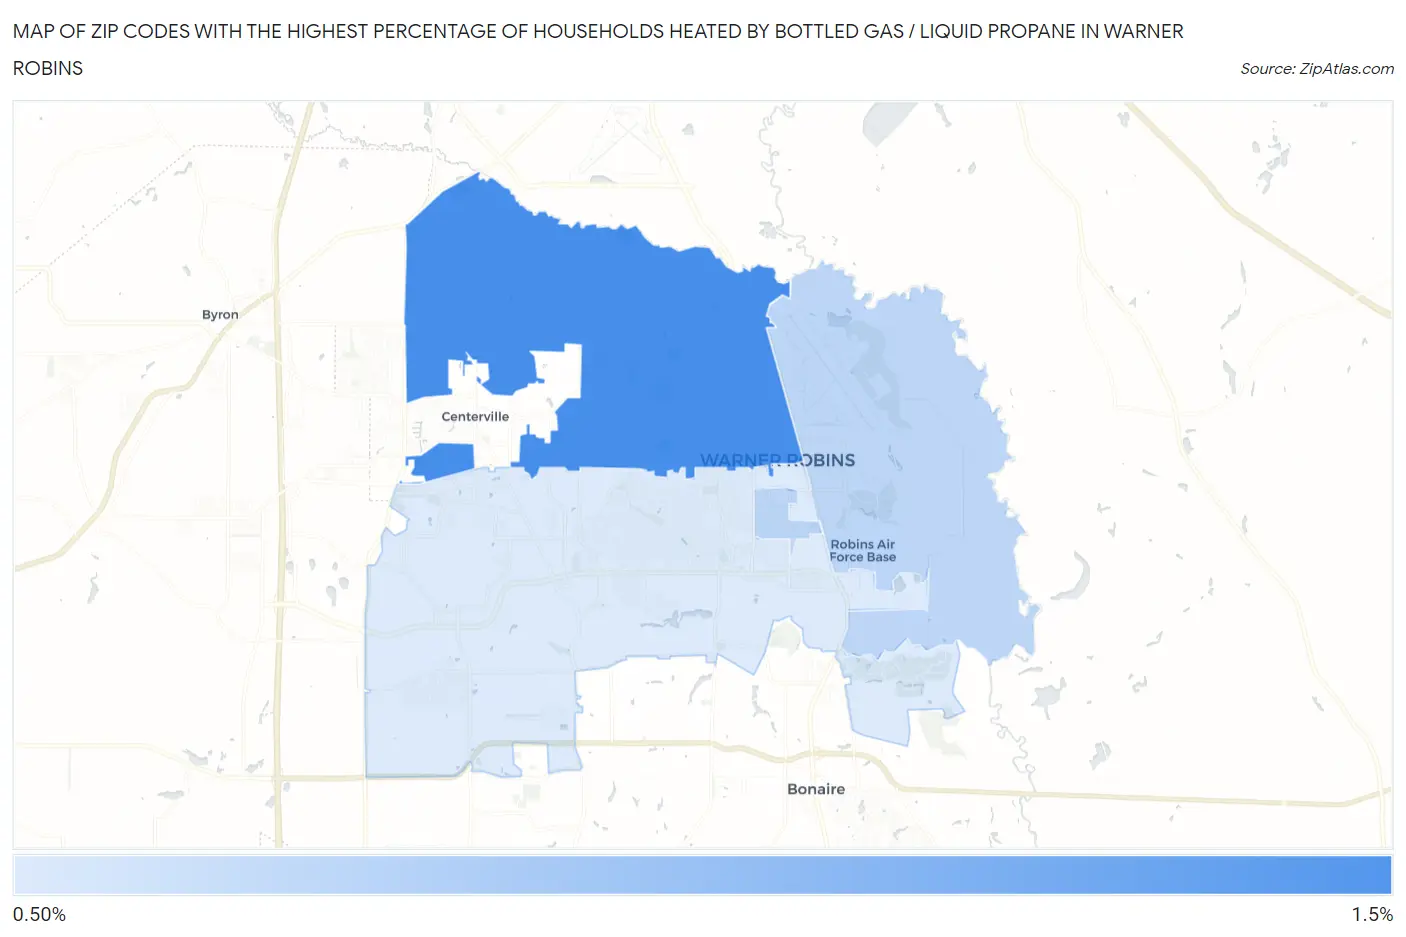
Map of Zip Codes with the Highest Percentage of Households Heated by Bottled Gas / Liquid Propane in Warner Robins
0.0%
1.5%
Zip Codes with the Highest Percentage of Households Heated by Bottled Gas / Liquid Propane in Warner Robins, GA
| Zip Code | Bottled Gas / LP Heating | vs State | vs National | |
| 1. | 31093 | 1.5% | 4.4%(-2.90)#566 | 4.9%(-3.40)#24,761 |
| 2. | 31098 | 0.80% | 4.4%(-3.60)#652 | 4.9%(-4.10)#27,698 |
| 3. | 31088 | 0.60% | 4.4%(-3.80)#658 | 4.9%(-4.30)#28,110 |
1
Common Questions
What are the Top Zip Codes with the Highest Percentage of Households Heated by Bottled Gas / Liquid Propane in Warner Robins, GA?
Top Zip Codes with the Highest Percentage of Households Heated by Bottled Gas / Liquid Propane in Warner Robins, GA are:
What zip code has the Highest Percentage of Households Heated by Bottled Gas / Liquid Propane in Warner Robins, GA?
31093 has the Highest Percentage of Households Heated by Bottled Gas / Liquid Propane in Warner Robins, GA with 1.5%.
What is the Percentage of Households Heated by Bottled Gas / Liquid Propane in Warner Robins, GA?
Percentage of Households Heated by Bottled Gas / Liquid Propane in Warner Robins is 0.50%.
What is the Percentage of Households Heated by Bottled Gas / Liquid Propane in Georgia?
Percentage of Households Heated by Bottled Gas / Liquid Propane in Georgia is 4.4%.
What is the Percentage of Households Heated by Bottled Gas / Liquid Propane in the United States?
Percentage of Households Heated by Bottled Gas / Liquid Propane in the United States is 4.9%.