Zip Codes with the Highest Percentage of Population Employed in Farming, Fishing & Forestry in Newnan, GA
RELATED REPORTS & OPTIONS
Farming, Fishing & Forestry
Newnan
Compare Zip Codes
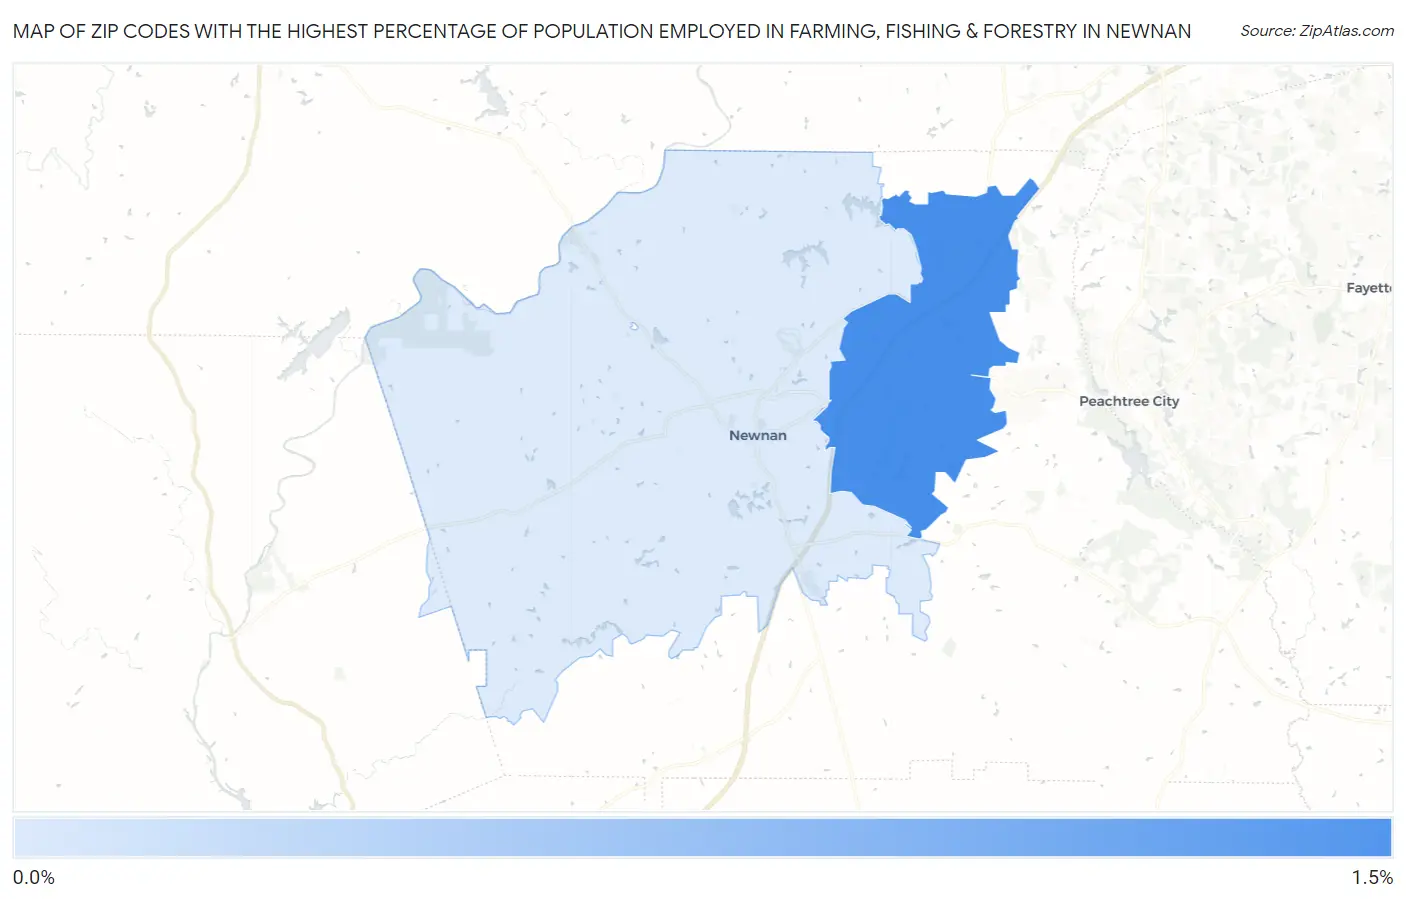
Map of Zip Codes with the Highest Percentage of Population Employed in Farming, Fishing & Forestry in Newnan
0.0%
1.5%
Zip Codes with the Highest Percentage of Population Employed in Farming, Fishing & Forestry in Newnan, GA
| Zip Code | % Employed | vs State | vs National | |
| 1. | 30265 | 1.5% | 0.45%(+1.04)#153 | 0.61%(+0.881)#7,921 |
| 2. | 30263 | 0.16% | 0.45%(-0.288)#374 | 0.61%(-0.442)#16,683 |
1
Common Questions
What are the Top Zip Codes with the Highest Percentage of Population Employed in Farming, Fishing & Forestry in Newnan, GA?
Top Zip Codes with the Highest Percentage of Population Employed in Farming, Fishing & Forestry in Newnan, GA are:
What zip code has the Highest Percentage of Population Employed in Farming, Fishing & Forestry in Newnan, GA?
30265 has the Highest Percentage of Population Employed in Farming, Fishing & Forestry in Newnan, GA with 1.5%.
What is the Percentage of Population Employed in Farming, Fishing & Forestry in Newnan, GA?
Percentage of Population Employed in Farming, Fishing & Forestry in Newnan is 0.39%.
What is the Percentage of Population Employed in Farming, Fishing & Forestry in Georgia?
Percentage of Population Employed in Farming, Fishing & Forestry in Georgia is 0.45%.
What is the Percentage of Population Employed in Farming, Fishing & Forestry in the United States?
Percentage of Population Employed in Farming, Fishing & Forestry in the United States is 0.61%.