Zip Codes with the Highest Percentage of Households Heated by Bottled Gas / Liquid Propane in Marietta, GA
RELATED REPORTS & OPTIONS
Bottled Gas / LP Heating
Marietta
Compare Zip Codes
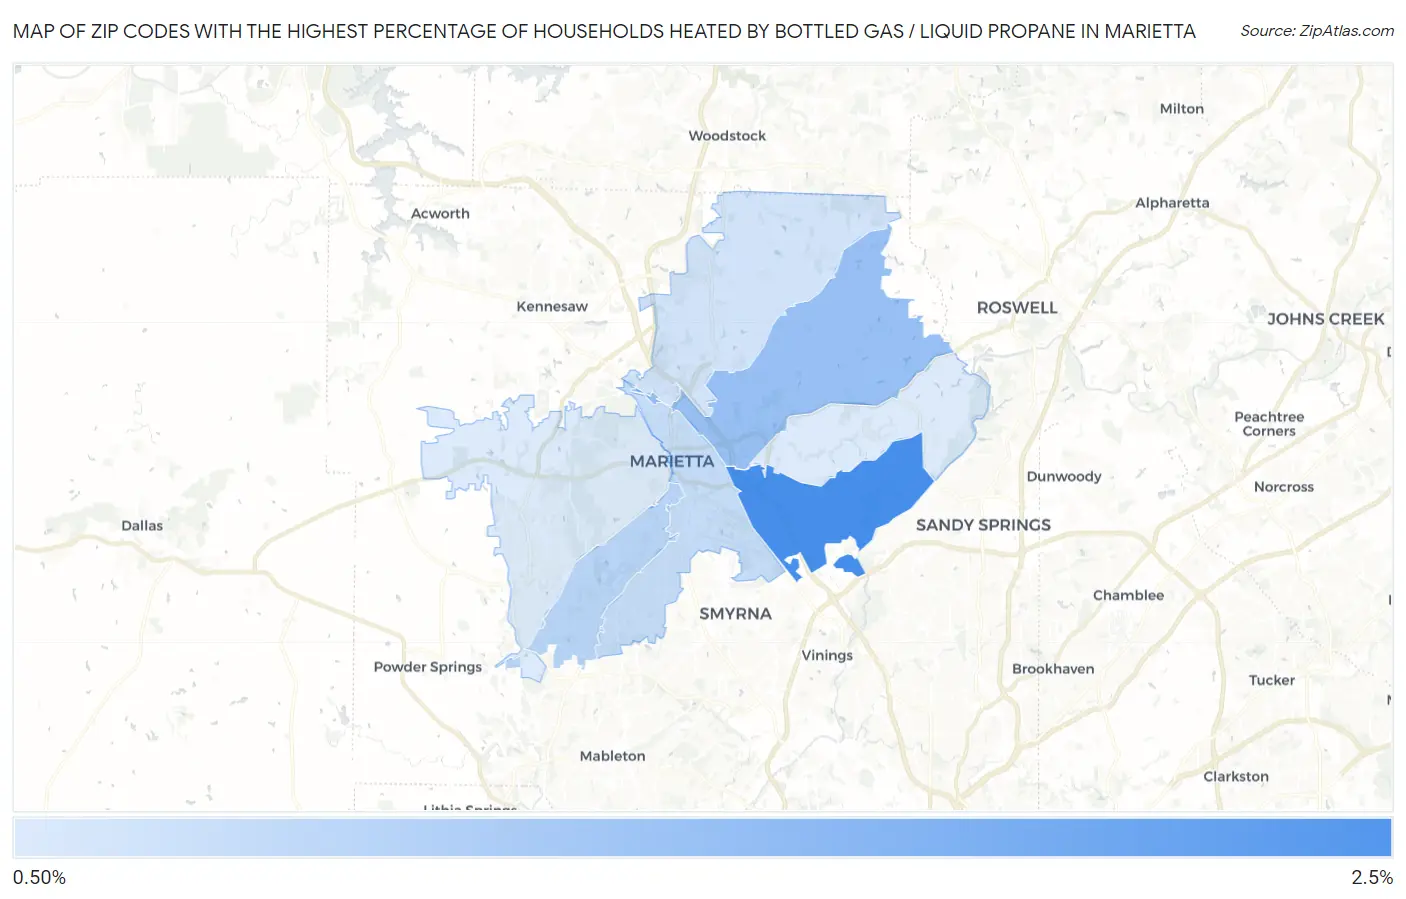
Map of Zip Codes with the Highest Percentage of Households Heated by Bottled Gas / Liquid Propane in Marietta
0.0%
2.5%
Zip Codes with the Highest Percentage of Households Heated by Bottled Gas / Liquid Propane in Marietta, GA
| Zip Code | Bottled Gas / LP Heating | vs State | vs National | |
| 1. | 30067 | 2.1% | 4.4%(-2.30)#507 | 4.9%(-2.80)#22,822 |
| 2. | 30062 | 1.4% | 4.4%(-3.00)#574 | 4.9%(-3.50)#24,966 |
| 3. | 30008 | 1.1% | 4.4%(-3.30)#610 | 4.9%(-3.80)#26,223 |
| 4. | 30060 | 1.0% | 4.4%(-3.40)#618 | 4.9%(-3.90)#26,587 |
| 5. | 30066 | 0.90% | 4.4%(-3.50)#628 | 4.9%(-4.00)#26,941 |
| 6. | 30064 | 0.80% | 4.4%(-3.60)#640 | 4.9%(-4.10)#27,369 |
| 7. | 30068 | 0.80% | 4.4%(-3.60)#645 | 4.9%(-4.10)#27,453 |
1
Common Questions
What are the Top 5 Zip Codes with the Highest Percentage of Households Heated by Bottled Gas / Liquid Propane in Marietta, GA?
Top 5 Zip Codes with the Highest Percentage of Households Heated by Bottled Gas / Liquid Propane in Marietta, GA are:
What zip code has the Highest Percentage of Households Heated by Bottled Gas / Liquid Propane in Marietta, GA?
30067 has the Highest Percentage of Households Heated by Bottled Gas / Liquid Propane in Marietta, GA with 2.1%.
What is the Percentage of Households Heated by Bottled Gas / Liquid Propane in Marietta, GA?
Percentage of Households Heated by Bottled Gas / Liquid Propane in Marietta is 2.0%.
What is the Percentage of Households Heated by Bottled Gas / Liquid Propane in Georgia?
Percentage of Households Heated by Bottled Gas / Liquid Propane in Georgia is 4.4%.
What is the Percentage of Households Heated by Bottled Gas / Liquid Propane in the United States?
Percentage of Households Heated by Bottled Gas / Liquid Propane in the United States is 4.9%.