Pomona Park, FL Map & Demographics
Pomona Park Map
Pomona Park Overview
$16,681
PER CAPITA INCOME
$63,333
AVG FAMILY INCOME
$35,000
AVG HOUSEHOLD INCOME
16.0%
WAGE / INCOME GAP [ % ]
84.0¢/ $1
WAGE / INCOME GAP [ $ ]
0.44
INEQUALITY / GINI INDEX
1,408
TOTAL POPULATION
717
MALE POPULATION
691
FEMALE POPULATION
103.76
MALES / 100 FEMALES
96.37
FEMALES / 100 MALES
23.9
MEDIAN AGE
4.3
AVG FAMILY SIZE
3.2
AVG HOUSEHOLD SIZE
583
LABOR FORCE [ PEOPLE ]
60.4%
PERCENT IN LABOR FORCE
11.7%
UNEMPLOYMENT RATE
Pomona Park Zip Codes
Income in Pomona Park
Income Overview in Pomona Park
Per Capita Income in Pomona Park is $16,681, while median incomes of families and households are $63,333 and $35,000 respectively.
| Characteristic | Number | Measure |
| Per Capita Income | 1,408 | $16,681 |
| Median Family Income | 268 | $63,333 |
| Mean Family Income | 268 | $58,584 |
| Median Household Income | 442 | $35,000 |
| Mean Household Income | 442 | $48,667 |
| Income Deficit | 268 | $0 |
| Wage / Income Gap (%) | 1,408 | 16.01% |
| Wage / Income Gap ($) | 1,408 | 83.99¢ per $1 |
| Gini / Inequality Index | 1,408 | 0.44 |
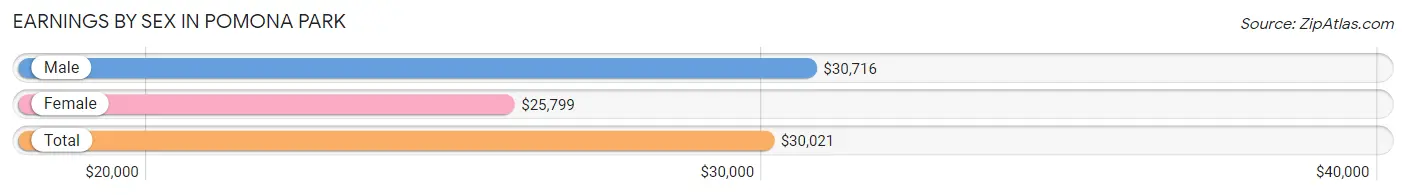
Earnings by Sex in Pomona Park
Average Earnings in Pomona Park are $30,021, $30,716 for men and $25,799 for women, a difference of 16.0%.
| Sex | Number | Average Earnings |
| Male | 337 (56.9%) | $30,716 |
| Female | 255 (43.1%) | $25,799 |
| Total | 592 (100.0%) | $30,021 |
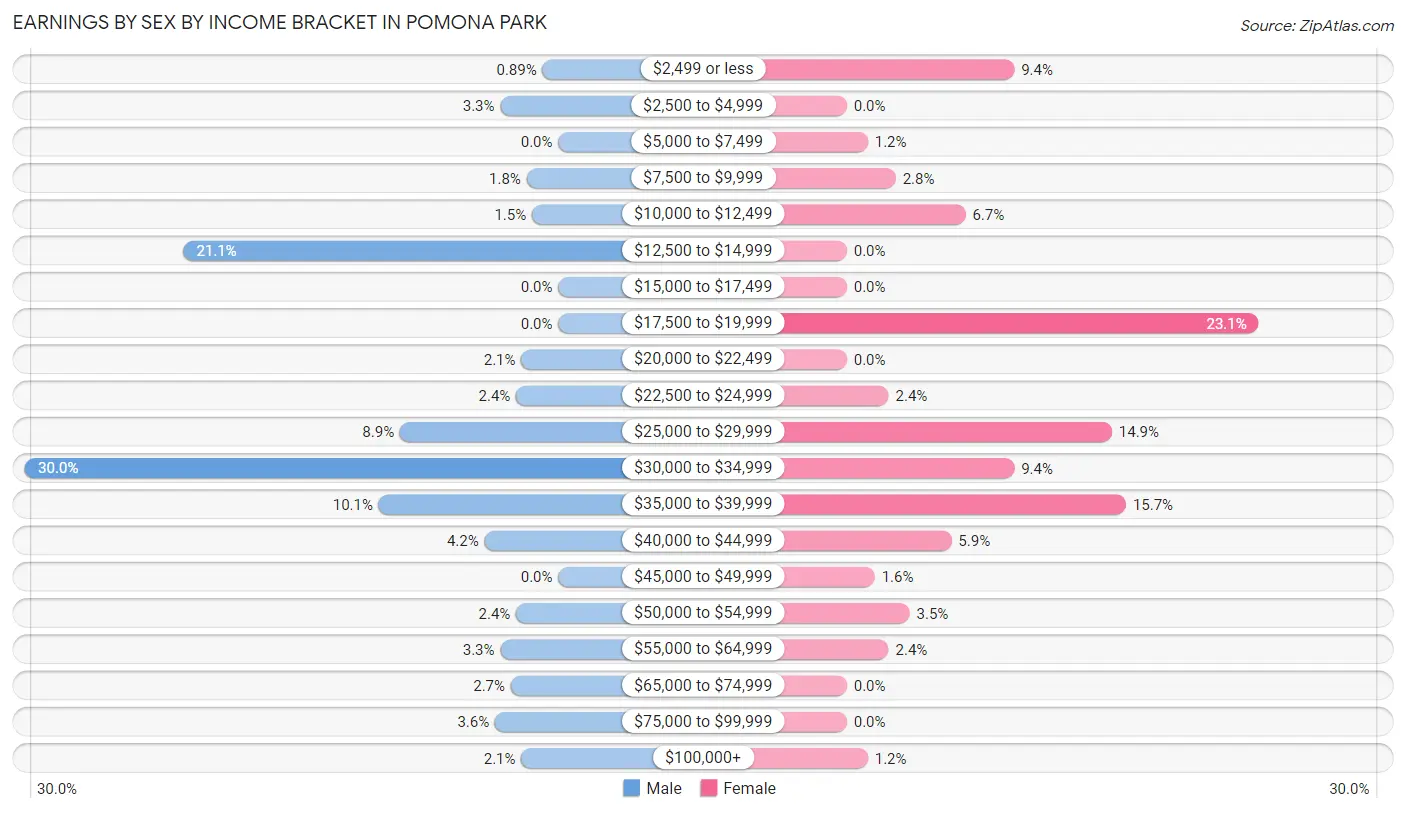
Earnings by Sex by Income Bracket in Pomona Park
The most common earnings brackets in Pomona Park are $30,000 to $34,999 for men (101 | 30.0%) and $17,500 to $19,999 for women (59 | 23.1%).
| Income | Male | Female |
| $2,499 or less | 3 (0.9%) | 24 (9.4%) |
| $2,500 to $4,999 | 11 (3.3%) | 0 (0.0%) |
| $5,000 to $7,499 | 0 (0.0%) | 3 (1.2%) |
| $7,500 to $9,999 | 6 (1.8%) | 7 (2.8%) |
| $10,000 to $12,499 | 5 (1.5%) | 17 (6.7%) |
| $12,500 to $14,999 | 71 (21.1%) | 0 (0.0%) |
| $15,000 to $17,499 | 0 (0.0%) | 0 (0.0%) |
| $17,500 to $19,999 | 0 (0.0%) | 59 (23.1%) |
| $20,000 to $22,499 | 7 (2.1%) | 0 (0.0%) |
| $22,500 to $24,999 | 8 (2.4%) | 6 (2.4%) |
| $25,000 to $29,999 | 30 (8.9%) | 38 (14.9%) |
| $30,000 to $34,999 | 101 (30.0%) | 24 (9.4%) |
| $35,000 to $39,999 | 34 (10.1%) | 40 (15.7%) |
| $40,000 to $44,999 | 14 (4.2%) | 15 (5.9%) |
| $45,000 to $49,999 | 0 (0.0%) | 4 (1.6%) |
| $50,000 to $54,999 | 8 (2.4%) | 9 (3.5%) |
| $55,000 to $64,999 | 11 (3.3%) | 6 (2.4%) |
| $65,000 to $74,999 | 9 (2.7%) | 0 (0.0%) |
| $75,000 to $99,999 | 12 (3.6%) | 0 (0.0%) |
| $100,000+ | 7 (2.1%) | 3 (1.2%) |
| Total | 337 (100.0%) | 255 (100.0%) |
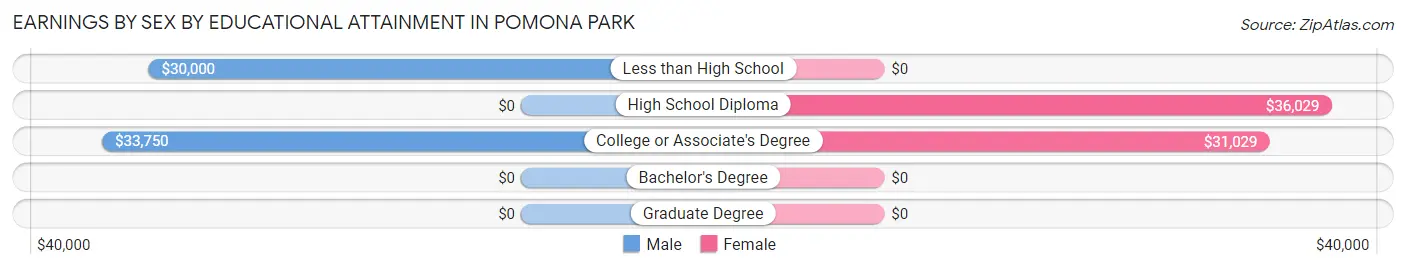
Earnings by Sex by Educational Attainment in Pomona Park
Average earnings in Pomona Park are $28,750 for men and $31,364 for women, a difference of 8.3%. Men with an educational attainment of college or associate's degree enjoy the highest average annual earnings of $33,750, while those with less than high school education earn the least with $30,000. Women with an educational attainment of high school diploma earn the most with the average annual earnings of $36,029, while those with college or associate's degree education have the smallest earnings of $31,029.
| Educational Attainment | Male Income | Female Income |
| Less than High School | $30,000 | $0 |
| High School Diploma | - | - |
| College or Associate's Degree | $33,750 | $31,029 |
| Bachelor's Degree | - | - |
| Graduate Degree | - | - |
| Total | $28,750 | $31,364 |
Family Income in Pomona Park
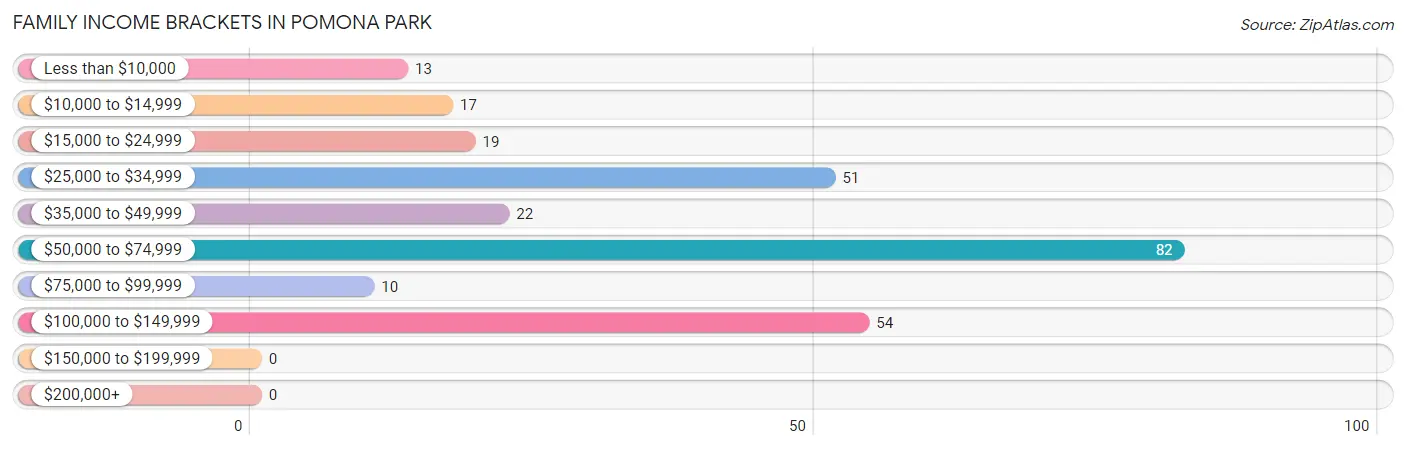
Family Income Brackets in Pomona Park
According to the Pomona Park family income data, there are 82 families falling into the $50,000 to $74,999 income range, which is the most common income bracket and makes up 30.6% of all families.
| Income Bracket | # Families | % Families |
| Less than $10,000 | 13 | 4.9% |
| $10,000 to $14,999 | 17 | 6.3% |
| $15,000 to $24,999 | 19 | 7.1% |
| $25,000 to $34,999 | 51 | 19.0% |
| $35,000 to $49,999 | 22 | 8.2% |
| $50,000 to $74,999 | 82 | 30.6% |
| $75,000 to $99,999 | 10 | 3.7% |
| $100,000 to $149,999 | 54 | 20.1% |
| $150,000 to $199,999 | 0 | 0.0% |
| $200,000+ | 0 | 0.0% |
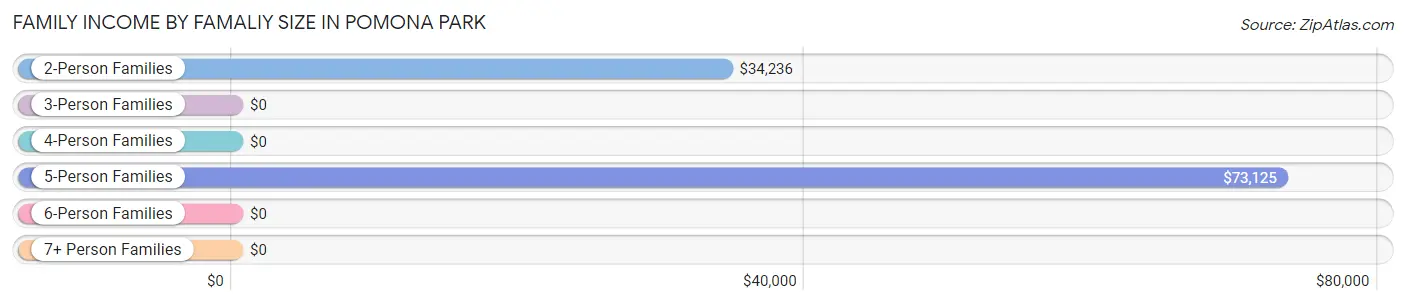
Family Income by Famaliy Size in Pomona Park
5-person families (51 | 19.0%) account for the highest median family income in Pomona Park with $73,125 per family, while 2-person families (107 | 39.9%) have the highest median income of $17,118 per family member.
| Income Bracket | # Families | Median Income |
| 2-Person Families | 107 (39.9%) | $34,236 |
| 3-Person Families | 46 (17.2%) | $0 |
| 4-Person Families | 26 (9.7%) | $0 |
| 5-Person Families | 51 (19.0%) | $73,125 |
| 6-Person Families | 11 (4.1%) | $0 |
| 7+ Person Families | 27 (10.1%) | $0 |
| Total | 268 (100.0%) | $63,333 |
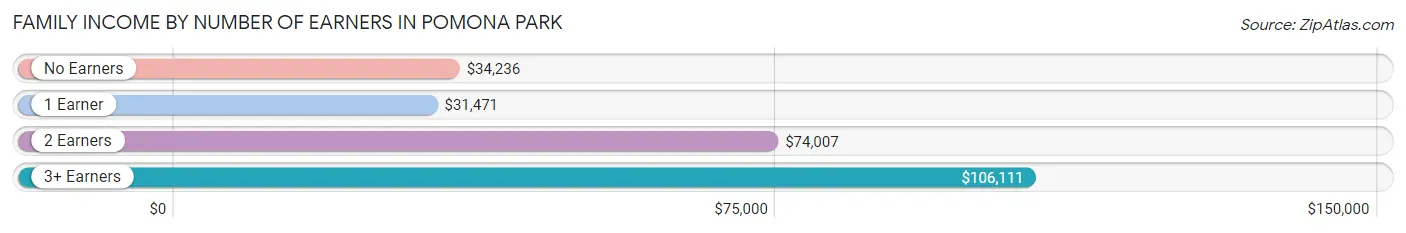
Family Income by Number of Earners in Pomona Park
The median family income in Pomona Park is $63,333, with families comprising 3+ earners (34) having the highest median family income of $106,111, while families with 1 earner (94) have the lowest median family income of $31,471, accounting for 12.7% and 35.1% of families, respectively.
| Number of Earners | # Families | Median Income |
| No Earners | 77 (28.7%) | $34,236 |
| 1 Earner | 94 (35.1%) | $31,471 |
| 2 Earners | 63 (23.5%) | $74,007 |
| 3+ Earners | 34 (12.7%) | $106,111 |
| Total | 268 (100.0%) | $63,333 |
Household Income in Pomona Park
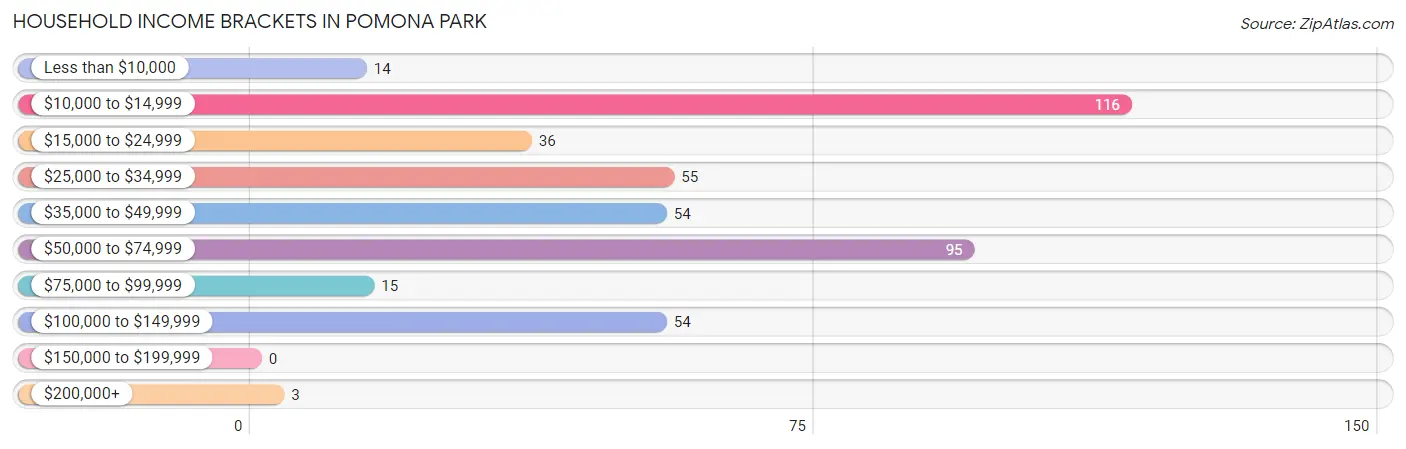
Household Income Brackets in Pomona Park
With 116 households falling in the category, the $10,000 to $14,999 income range is the most frequent in Pomona Park, accounting for 26.2% of all households.
| Income Bracket | # Households | % Households |
| Less than $10,000 | 14 | 3.2% |
| $10,000 to $14,999 | 116 | 26.2% |
| $15,000 to $24,999 | 36 | 8.1% |
| $25,000 to $34,999 | 55 | 12.4% |
| $35,000 to $49,999 | 54 | 12.2% |
| $50,000 to $74,999 | 95 | 21.5% |
| $75,000 to $99,999 | 15 | 3.4% |
| $100,000 to $149,999 | 54 | 12.2% |
| $150,000 to $199,999 | 0 | 0.0% |
| $200,000+ | 3 | 0.7% |
Household Income by Householder Age in Pomona Park
The median household income in Pomona Park is $35,000, with the highest median household income of $47,500 found in the 65+ years age bracket for the primary householder. A total of 84 households (19.0%) fall into this category. Meanwhile, the 15 to 24 years age bracket for the primary householder has the lowest median household income of $0, with 29 households (6.6%) in this group.
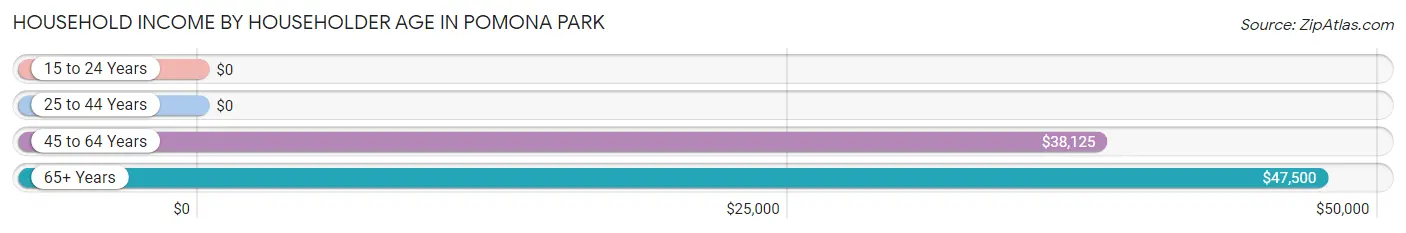
| Income Bracket | # Households | Median Income |
| 15 to 24 Years | 29 (6.6%) | $0 |
| 25 to 44 Years | 194 (43.9%) | $0 |
| 45 to 64 Years | 135 (30.5%) | $38,125 |
| 65+ Years | 84 (19.0%) | $47,500 |
| Total | 442 (100.0%) | $35,000 |
Poverty in Pomona Park
Income Below Poverty by Sex and Age in Pomona Park
With 22.9% poverty level for males and 15.6% for females among the residents of Pomona Park, 25 to 34 year old males and under 5 year old females are the most vulnerable to poverty, with 67 males (89.3%) and 7 females (100.0%) in their respective age groups living below the poverty level.
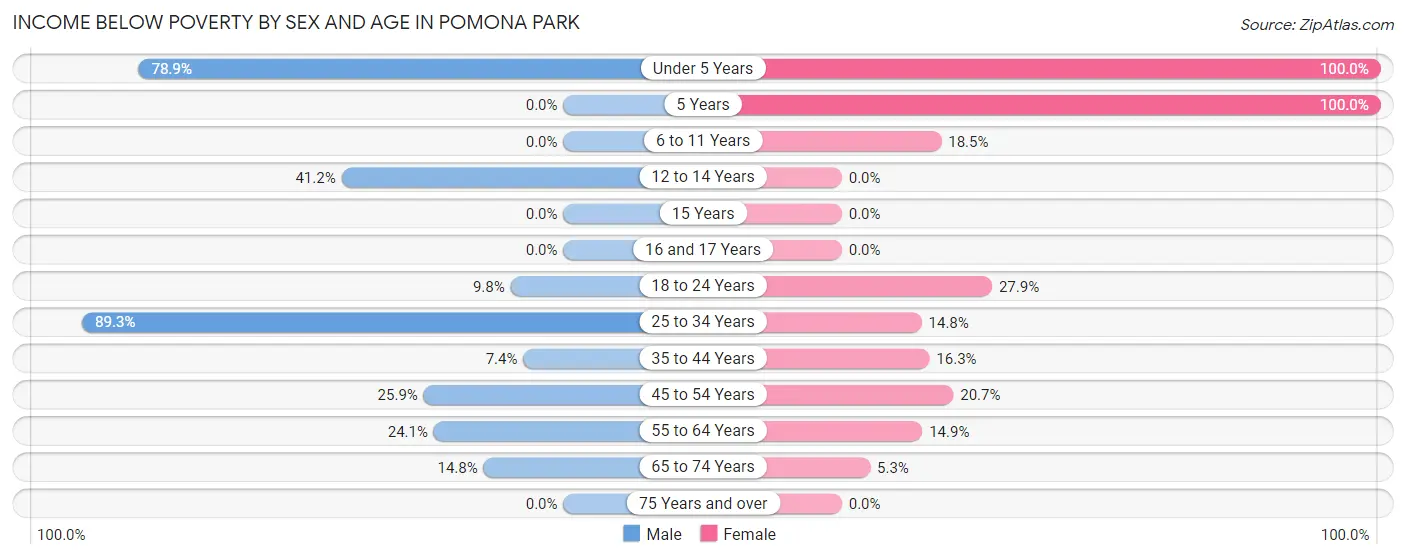
| Age Bracket | Male | Female |
| Under 5 Years | 41 (78.8%) | 7 (100.0%) |
| 5 Years | 0 (0.0%) | 4 (100.0%) |
| 6 to 11 Years | 0 (0.0%) | 24 (18.5%) |
| 12 to 14 Years | 7 (41.2%) | 0 (0.0%) |
| 15 Years | 0 (0.0%) | 0 (0.0%) |
| 16 and 17 Years | 0 (0.0%) | 0 (0.0%) |
| 18 to 24 Years | 10 (9.8%) | 29 (27.9%) |
| 25 to 34 Years | 67 (89.3%) | 4 (14.8%) |
| 35 to 44 Years | 9 (7.4%) | 20 (16.3%) |
| 45 to 54 Years | 7 (25.9%) | 6 (20.7%) |
| 55 to 64 Years | 19 (24.0%) | 10 (14.9%) |
| 65 to 74 Years | 4 (14.8%) | 3 (5.3%) |
| 75 Years and over | 0 (0.0%) | 0 (0.0%) |
| Total | 164 (22.9%) | 107 (15.6%) |
Income Above Poverty by Sex and Age in Pomona Park
According to the poverty statistics in Pomona Park, males aged 6 to 11 years and females aged 12 to 14 years are the age groups that are most secure financially, with 100.0% of males and 100.0% of females in these age groups living above the poverty line.
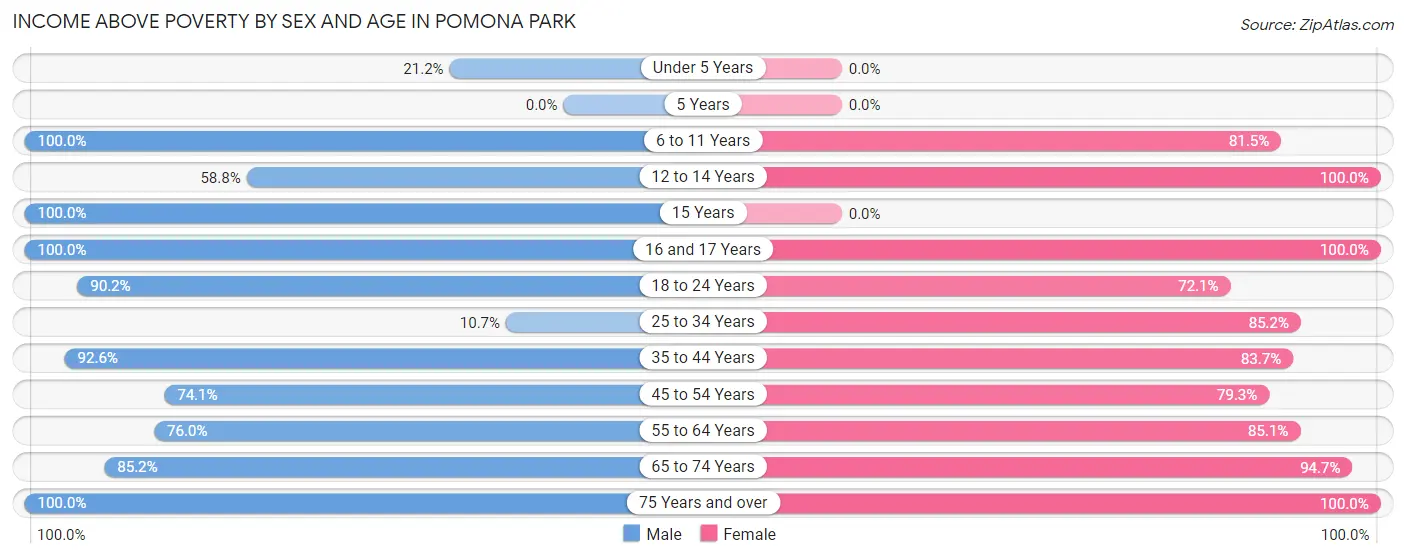
| Age Bracket | Male | Female |
| Under 5 Years | 11 (21.1%) | 0 (0.0%) |
| 5 Years | 0 (0.0%) | 0 (0.0%) |
| 6 to 11 Years | 39 (100.0%) | 106 (81.5%) |
| 12 to 14 Years | 10 (58.8%) | 117 (100.0%) |
| 15 Years | 70 (100.0%) | 0 (0.0%) |
| 16 and 17 Years | 62 (100.0%) | 4 (100.0%) |
| 18 to 24 Years | 92 (90.2%) | 75 (72.1%) |
| 25 to 34 Years | 8 (10.7%) | 23 (85.2%) |
| 35 to 44 Years | 112 (92.6%) | 103 (83.7%) |
| 45 to 54 Years | 20 (74.1%) | 23 (79.3%) |
| 55 to 64 Years | 60 (75.9%) | 57 (85.1%) |
| 65 to 74 Years | 23 (85.2%) | 54 (94.7%) |
| 75 Years and over | 46 (100.0%) | 16 (100.0%) |
| Total | 553 (77.1%) | 578 (84.4%) |
Income Below Poverty Among Married-Couple Families in Pomona Park
The poverty statistics for married-couple families in Pomona Park show that 2.3% or 4 of the total 175 families live below the poverty line. Families with no children have the highest poverty rate of 4.2%, comprising of 4 families. On the other hand, families with 1 or 2 children have the lowest poverty rate of 0.0%, which includes 0 families.
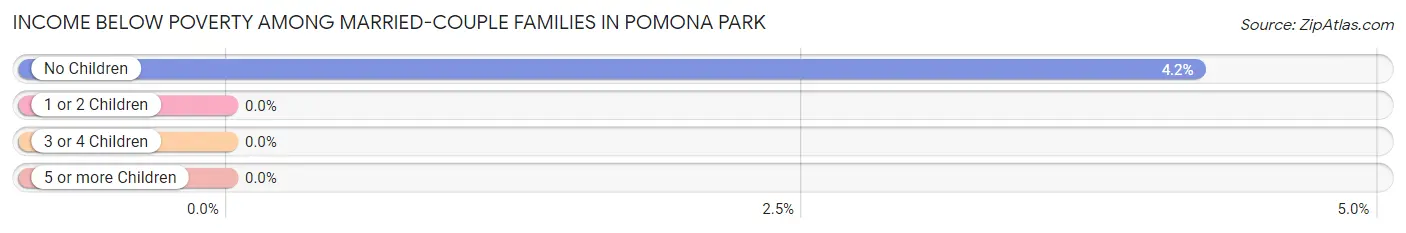
| Children | Above Poverty | Below Poverty |
| No Children | 91 (95.8%) | 4 (4.2%) |
| 1 or 2 Children | 8 (100.0%) | 0 (0.0%) |
| 3 or 4 Children | 72 (100.0%) | 0 (0.0%) |
| 5 or more Children | 0 (0.0%) | 0 (0.0%) |
| Total | 171 (97.7%) | 4 (2.3%) |
Income Below Poverty Among Single-Parent Households in Pomona Park
According to the poverty data in Pomona Park, 36.0% or 9 single-father households and 44.1% or 30 single-mother households are living below the poverty line. Among single-father households, those with 1 or 2 children have the highest poverty rate, with 2 households (100.0%) experiencing poverty. Likewise, among single-mother households, those with 3 or 4 children have the highest poverty rate, with 11 households (64.7%) falling below the poverty line.
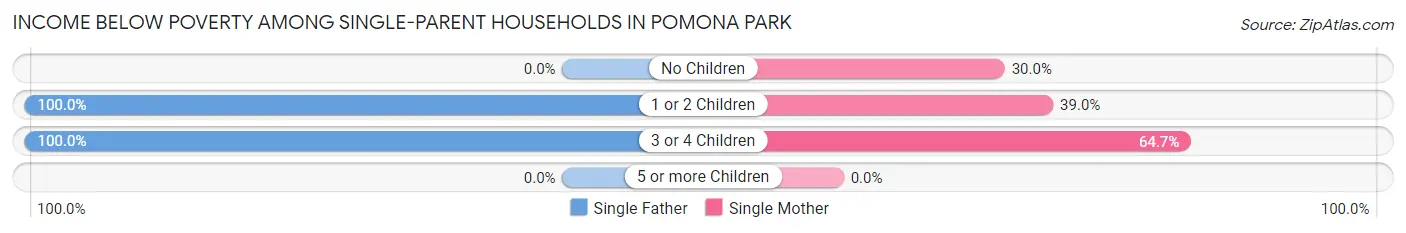
| Children | Single Father | Single Mother |
| No Children | 0 (0.0%) | 3 (30.0%) |
| 1 or 2 Children | 2 (100.0%) | 16 (39.0%) |
| 3 or 4 Children | 7 (100.0%) | 11 (64.7%) |
| 5 or more Children | 0 (0.0%) | 0 (0.0%) |
| Total | 9 (36.0%) | 30 (44.1%) |
Income Below Poverty Among Married-Couple vs Single-Parent Households in Pomona Park
The poverty data for Pomona Park shows that 4 of the married-couple family households (2.3%) and 39 of the single-parent households (41.9%) are living below the poverty level. Within the married-couple family households, those with no children have the highest poverty rate, with 4 households (4.2%) falling below the poverty line. Among the single-parent households, those with 3 or 4 children have the highest poverty rate, with 18 household (75.0%) living below poverty.
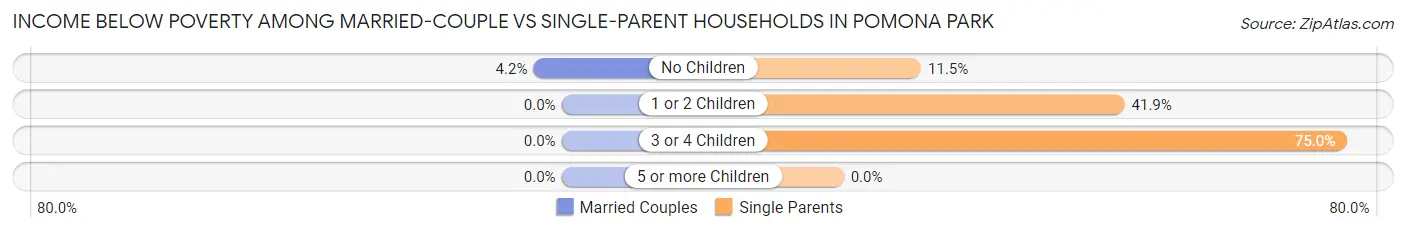
| Children | Married-Couple Families | Single-Parent Households |
| No Children | 4 (4.2%) | 3 (11.5%) |
| 1 or 2 Children | 0 (0.0%) | 18 (41.9%) |
| 3 or 4 Children | 0 (0.0%) | 18 (75.0%) |
| 5 or more Children | 0 (0.0%) | 0 (0.0%) |
| Total | 4 (2.3%) | 39 (41.9%) |
Race in Pomona Park
The most populous races in Pomona Park are White / Caucasian (698 | 49.6%), Two or more Races (495 | 35.2%), and Hispanic or Latino (467 | 33.2%).
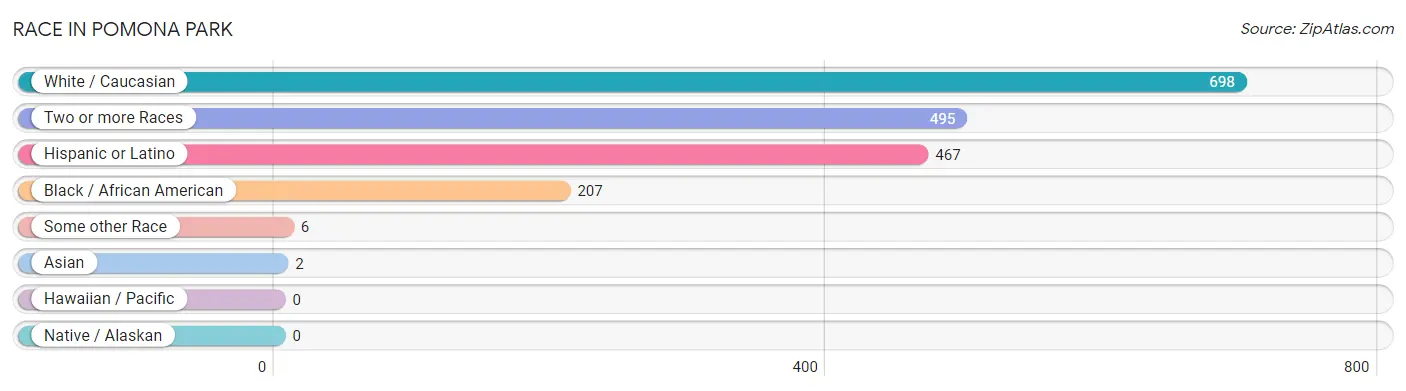
| Race | # Population | % Population |
| Asian | 2 | 0.1% |
| Black / African American | 207 | 14.7% |
| Hawaiian / Pacific | 0 | 0.0% |
| Hispanic or Latino | 467 | 33.2% |
| Native / Alaskan | 0 | 0.0% |
| White / Caucasian | 698 | 49.6% |
| Two or more Races | 495 | 35.2% |
| Some other Race | 6 | 0.4% |
| Total | 1,408 | 100.0% |
Ancestry in Pomona Park
The most populous ancestries reported in Pomona Park are Mexican (452 | 32.1%), English (291 | 20.7%), Irish (134 | 9.5%), German (107 | 7.6%), and French (93 | 6.6%), together accounting for 76.5% of all Pomona Park residents.
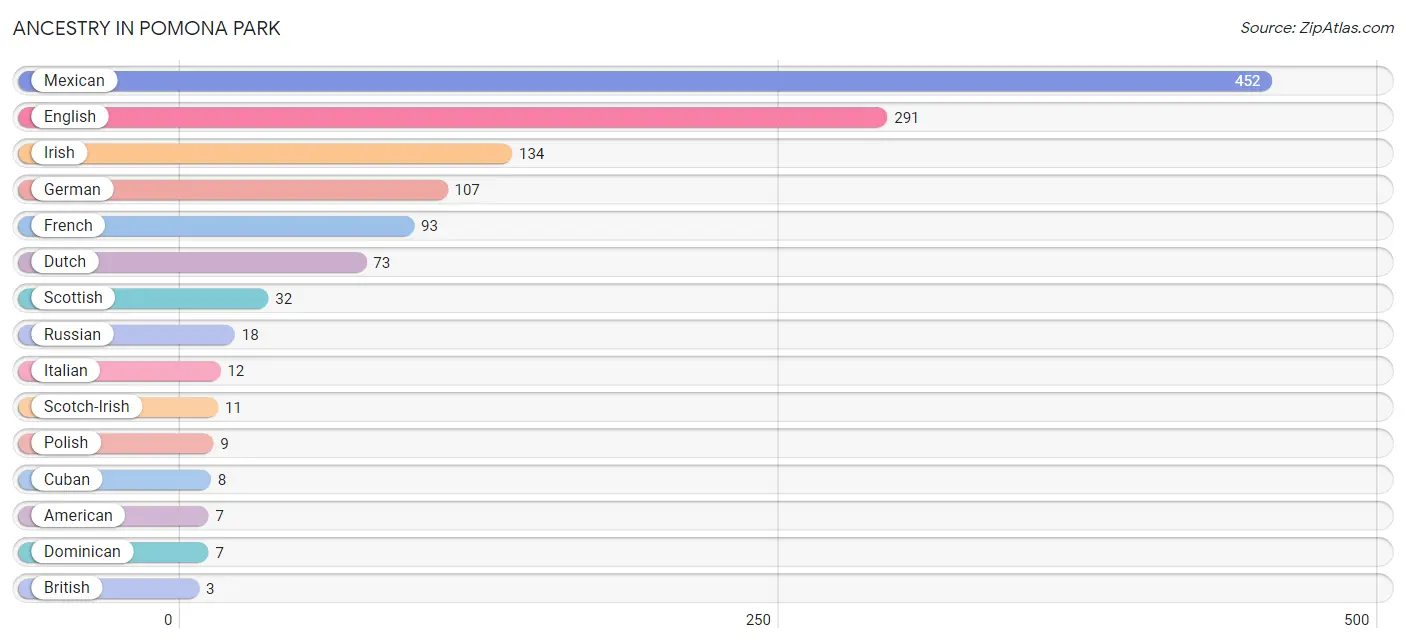
| Ancestry | # Population | % Population |
| American | 7 | 0.5% |
| British | 3 | 0.2% |
| Cuban | 8 | 0.6% |
| Dominican | 7 | 0.5% |
| Dutch | 73 | 5.2% |
| English | 291 | 20.7% |
| French | 93 | 6.6% |
| German | 107 | 7.6% |
| Irish | 134 | 9.5% |
| Italian | 12 | 0.9% |
| Korean | 2 | 0.1% |
| Mexican | 452 | 32.1% |
| Northern European | 1 | 0.1% |
| Polish | 9 | 0.6% |
| Romanian | 3 | 0.2% |
| Russian | 18 | 1.3% |
| Scotch-Irish | 11 | 0.8% |
| Scottish | 32 | 2.3% |
| Swedish | 2 | 0.1% |
| Thai | 2 | 0.1% |
| Welsh | 2 | 0.1% | View All 21 Rows |
Immigrants in Pomona Park
The most numerous immigrant groups reported in Pomona Park came from Latin America (170 | 12.1%), Central America (163 | 11.6%), Mexico (163 | 11.6%), Caribbean (7 | 0.5%), and Dominican Republic (7 | 0.5%), together accounting for 36.2% of all Pomona Park residents.
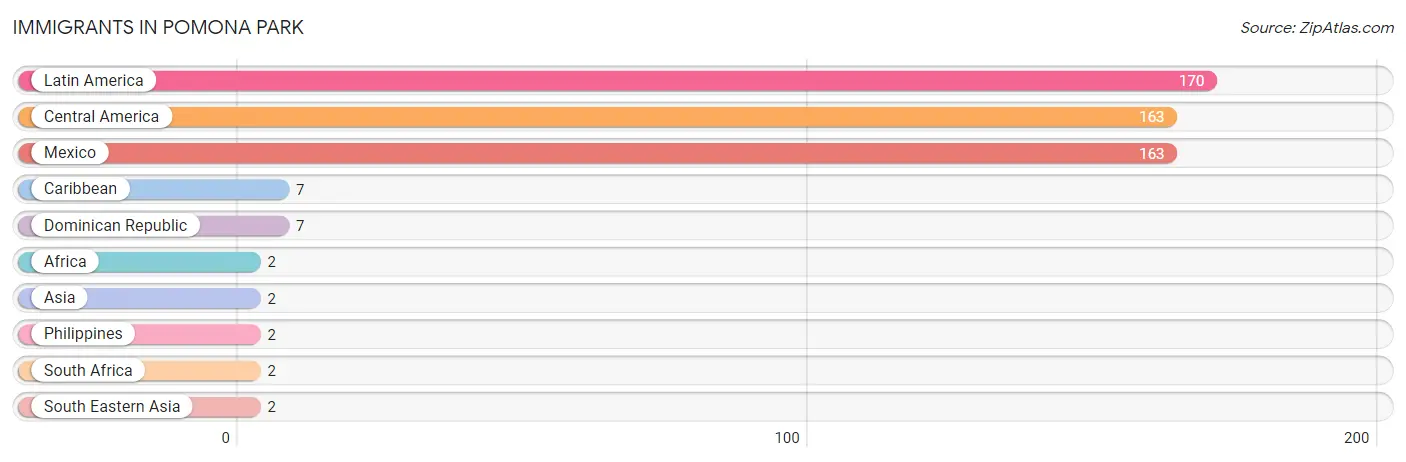
| Immigration Origin | # Population | % Population |
| Africa | 2 | 0.1% |
| Asia | 2 | 0.1% |
| Caribbean | 7 | 0.5% |
| Central America | 163 | 11.6% |
| Dominican Republic | 7 | 0.5% |
| Latin America | 170 | 12.1% |
| Mexico | 163 | 11.6% |
| Philippines | 2 | 0.1% |
| South Africa | 2 | 0.1% |
| South Eastern Asia | 2 | 0.1% | View All 10 Rows |
Sex and Age in Pomona Park
Sex and Age in Pomona Park
The most populous age groups in Pomona Park are 15 to 19 Years (221 | 30.8%) for men and 10 to 14 Years (176 | 25.5%) for women.
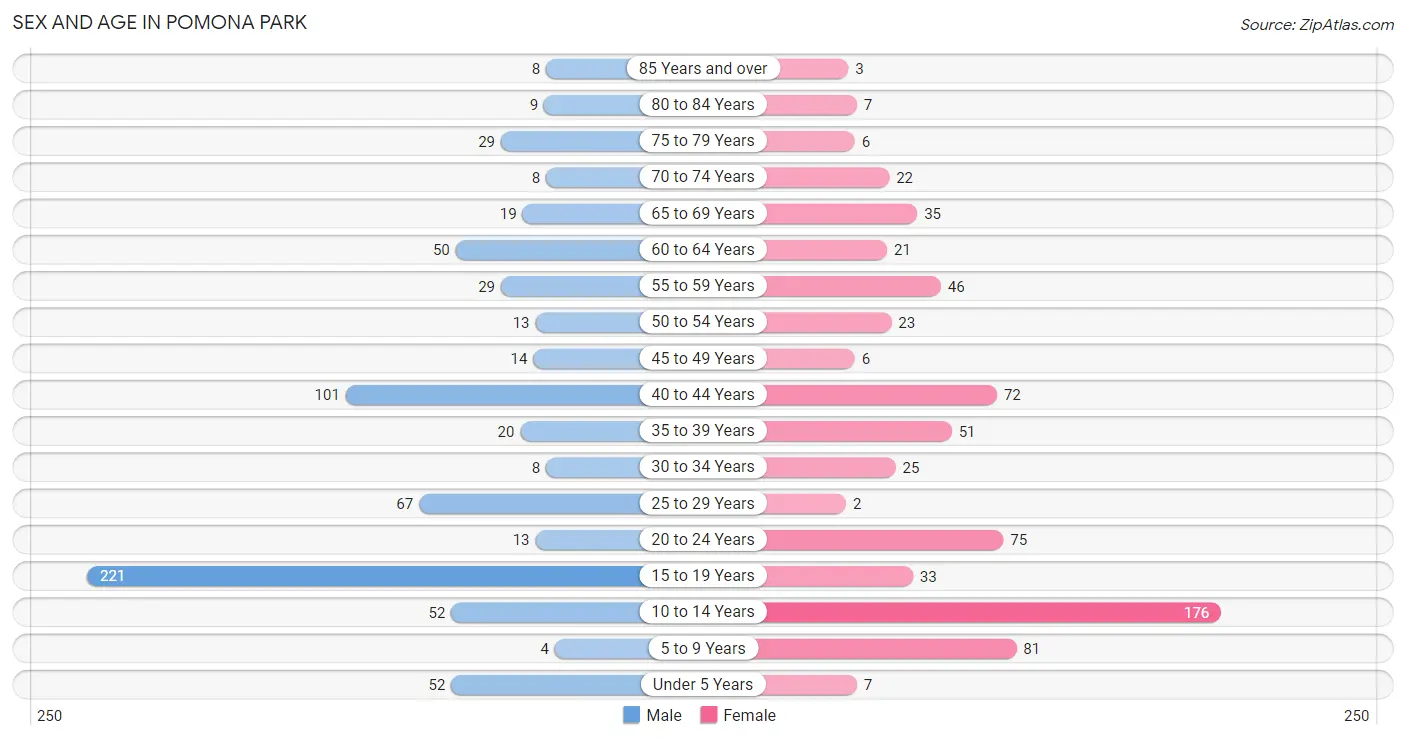
| Age Bracket | Male | Female |
| Under 5 Years | 52 (7.2%) | 7 (1.0%) |
| 5 to 9 Years | 4 (0.6%) | 81 (11.7%) |
| 10 to 14 Years | 52 (7.2%) | 176 (25.5%) |
| 15 to 19 Years | 221 (30.8%) | 33 (4.8%) |
| 20 to 24 Years | 13 (1.8%) | 75 (10.8%) |
| 25 to 29 Years | 67 (9.3%) | 2 (0.3%) |
| 30 to 34 Years | 8 (1.1%) | 25 (3.6%) |
| 35 to 39 Years | 20 (2.8%) | 51 (7.4%) |
| 40 to 44 Years | 101 (14.1%) | 72 (10.4%) |
| 45 to 49 Years | 14 (1.9%) | 6 (0.9%) |
| 50 to 54 Years | 13 (1.8%) | 23 (3.3%) |
| 55 to 59 Years | 29 (4.0%) | 46 (6.7%) |
| 60 to 64 Years | 50 (7.0%) | 21 (3.0%) |
| 65 to 69 Years | 19 (2.6%) | 35 (5.1%) |
| 70 to 74 Years | 8 (1.1%) | 22 (3.2%) |
| 75 to 79 Years | 29 (4.0%) | 6 (0.9%) |
| 80 to 84 Years | 9 (1.3%) | 7 (1.0%) |
| 85 Years and over | 8 (1.1%) | 3 (0.4%) |
| Total | 717 (100.0%) | 691 (100.0%) |
Families and Households in Pomona Park
Median Family Size in Pomona Park
The median family size in Pomona Park is 4.31 persons per family, with married-couple families (175 | 65.3%) accounting for the largest median family size of 4.86 persons per family. On the other hand, single male/father families (25 | 9.3%) represent the smallest median family size with 2.76 persons per family.
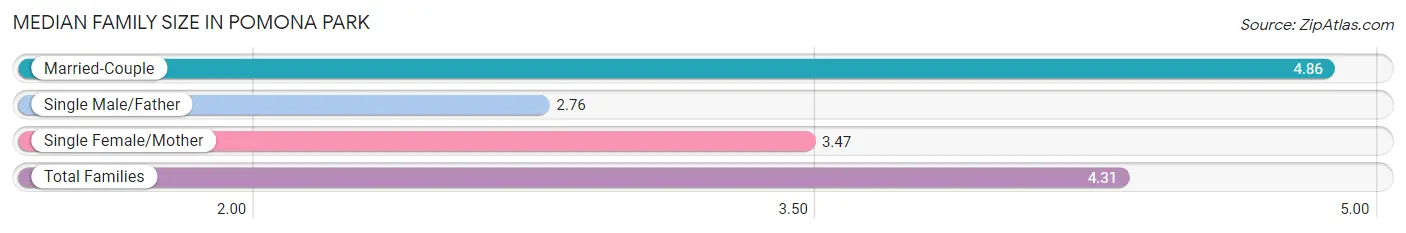
| Family Type | # Families | Family Size |
| Married-Couple | 175 (65.3%) | 4.86 |
| Single Male/Father | 25 (9.3%) | 2.76 |
| Single Female/Mother | 68 (25.4%) | 3.47 |
| Total Families | 268 (100.0%) | 4.31 |
Median Household Size in Pomona Park
The median household size in Pomona Park is 3.17 persons per household, with married-couple households (175 | 39.6%) accounting for the largest median household size of 5.06 persons per household. non-family households (174 | 39.4%) represent the smallest median household size with 1.16 persons per household.
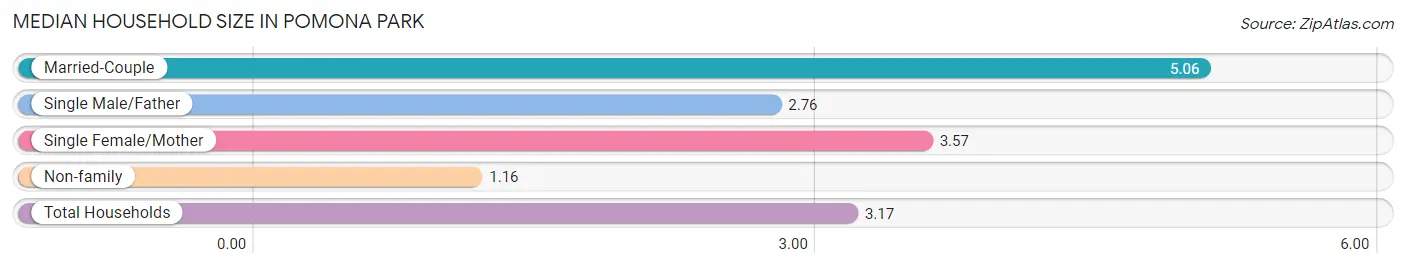
| Household Type | # Households | Household Size |
| Married-Couple | 175 (39.6%) | 5.06 |
| Single Male/Father | 25 (5.7%) | 2.76 |
| Single Female/Mother | 68 (15.4%) | 3.57 |
| Non-family | 174 (39.4%) | 1.16 |
| Total Households | 442 (100.0%) | 3.17 |
Household Size by Marriage Status in Pomona Park
Out of a total of 442 households in Pomona Park, 268 (60.6%) are family households, while 174 (39.4%) are nonfamily households. The most numerous type of family households are 2-person households, comprising 101, and the most common type of nonfamily households are 1-person households, comprising 138.
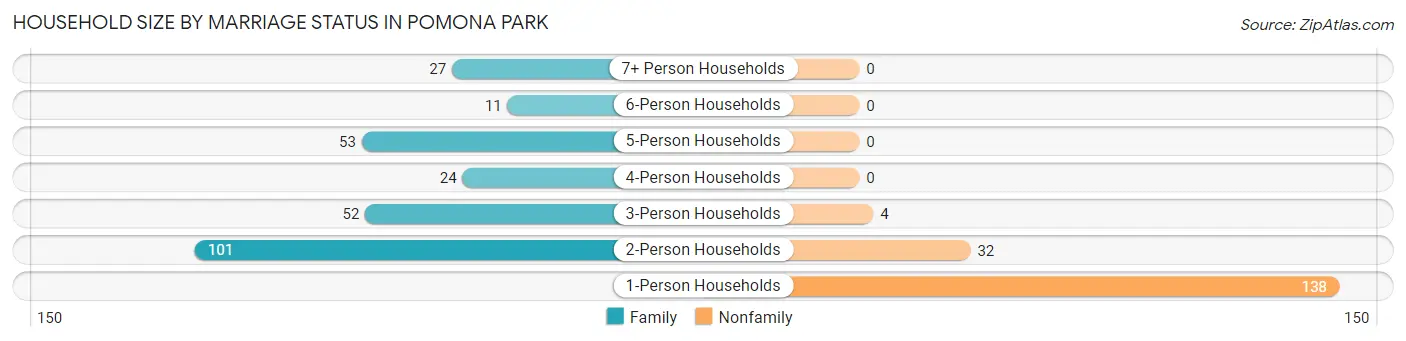
| Household Size | Family Households | Nonfamily Households |
| 1-Person Households | - | 138 (31.2%) |
| 2-Person Households | 101 (22.9%) | 32 (7.2%) |
| 3-Person Households | 52 (11.8%) | 4 (0.9%) |
| 4-Person Households | 24 (5.4%) | 0 (0.0%) |
| 5-Person Households | 53 (12.0%) | 0 (0.0%) |
| 6-Person Households | 11 (2.5%) | 0 (0.0%) |
| 7+ Person Households | 27 (6.1%) | 0 (0.0%) |
| Total | 268 (60.6%) | 174 (39.4%) |
Female Fertility in Pomona Park
Fertility by Age in Pomona Park
Average fertility rate in Pomona Park is 64.0 births per 1,000 women. Women in the age bracket of 35 to 50 years have the highest fertility rate with 84.0 births per 1,000 women. Women in the age bracket of 35 to 50 years acount for 64.7% of all women with births.
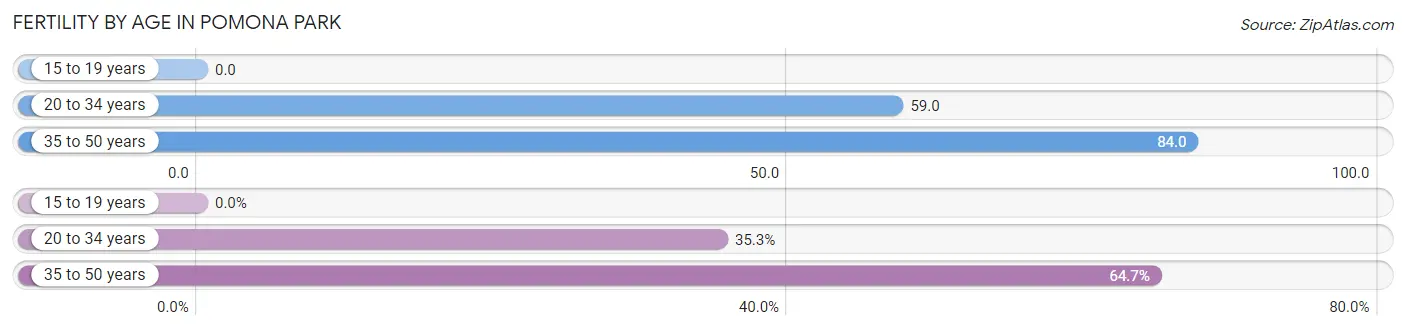
| Age Bracket | Women with Births | Births / 1,000 Women |
| 15 to 19 years | 0 (0.0%) | 0.0 |
| 20 to 34 years | 6 (35.3%) | 59.0 |
| 35 to 50 years | 11 (64.7%) | 84.0 |
| Total | 17 (100.0%) | 64.0 |
Fertility by Age by Marriage Status in Pomona Park
35.3% of women with births (17) in Pomona Park are married. The highest percentage of unmarried women with births falls into 35 to 50 years age bracket with 100.0% of them unmarried at the time of birth, while the lowest percentage of unmarried women with births belong to 20 to 34 years age bracket with 0.0% of them unmarried.
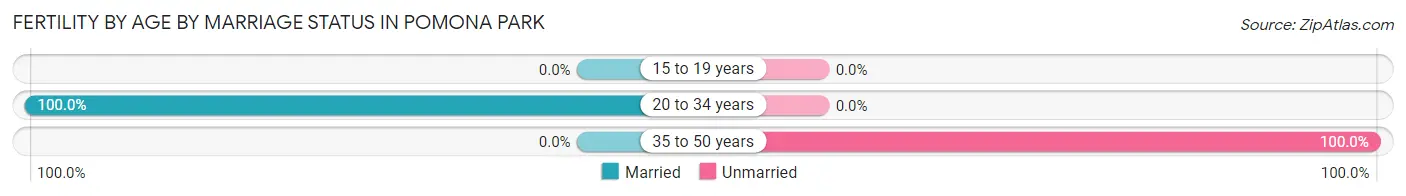
| Age Bracket | Married | Unmarried |
| 15 to 19 years | 0 (0.0%) | 0 (0.0%) |
| 20 to 34 years | 6 (100.0%) | 0 (0.0%) |
| 35 to 50 years | 0 (0.0%) | 11 (100.0%) |
| Total | 6 (35.3%) | 11 (64.7%) |
Fertility by Education in Pomona Park
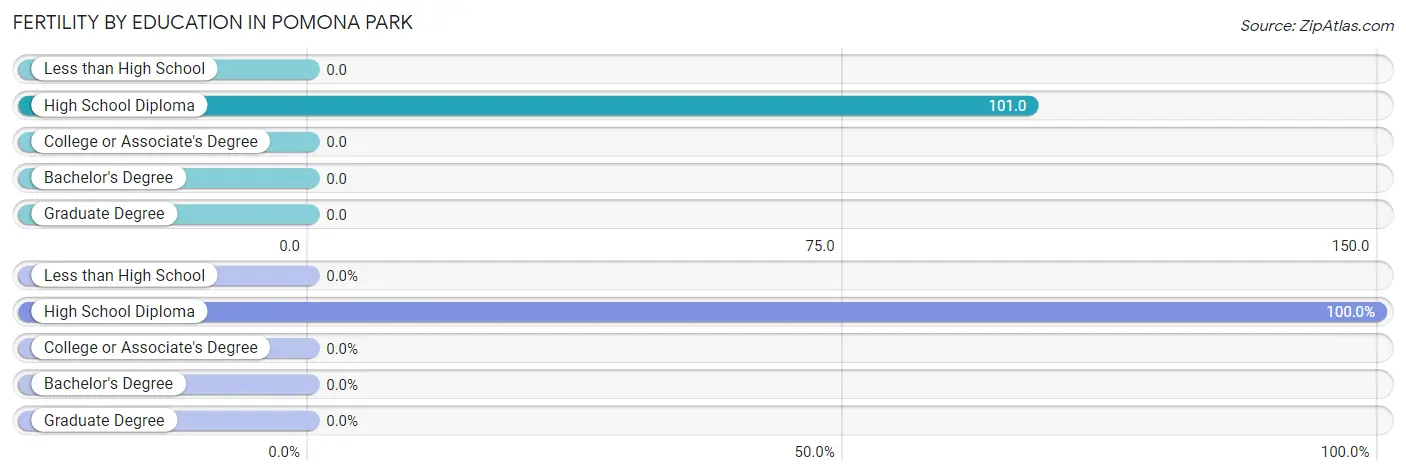
| Educational Attainment | Women with Births | Births / 1,000 Women |
| Less than High School | 0 (0.0%) | 0.0 |
| High School Diploma | 17 (100.0%) | 101.0 |
| College or Associate's Degree | 0 (0.0%) | 0.0 |
| Bachelor's Degree | 0 (0.0%) | 0.0 |
| Graduate Degree | 0 (0.0%) | 0.0 |
| Total | 17 (100.0%) | 64.0 |
Fertility by Education by Marriage Status in Pomona Park
64.7% of women with births in Pomona Park are unmarried. Women with the educational attainment of high school diploma are most likely to be married with 35.3% of them married at childbirth, while women with the educational attainment of high school diploma are least likely to be married with 64.7% of them unmarried at childbirth.
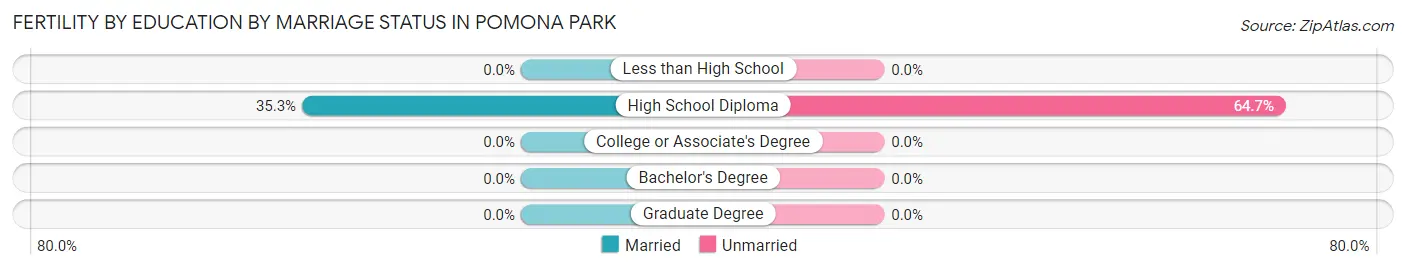
| Educational Attainment | Married | Unmarried |
| Less than High School | 0 (0.0%) | 0 (0.0%) |
| High School Diploma | 6 (35.3%) | 11 (64.7%) |
| College or Associate's Degree | 0 (0.0%) | 0 (0.0%) |
| Bachelor's Degree | 0 (0.0%) | 0 (0.0%) |
| Graduate Degree | 0 (0.0%) | 0 (0.0%) |
| Total | 6 (35.3%) | 11 (64.7%) |
Employment Characteristics in Pomona Park
Employment by Class of Employer in Pomona Park
Among the 509 employed individuals in Pomona Park, private company employees (359 | 70.5%), not-for-profit organizations (40 | 7.9%), and local government employees (40 | 7.9%) make up the most common classes of employment.
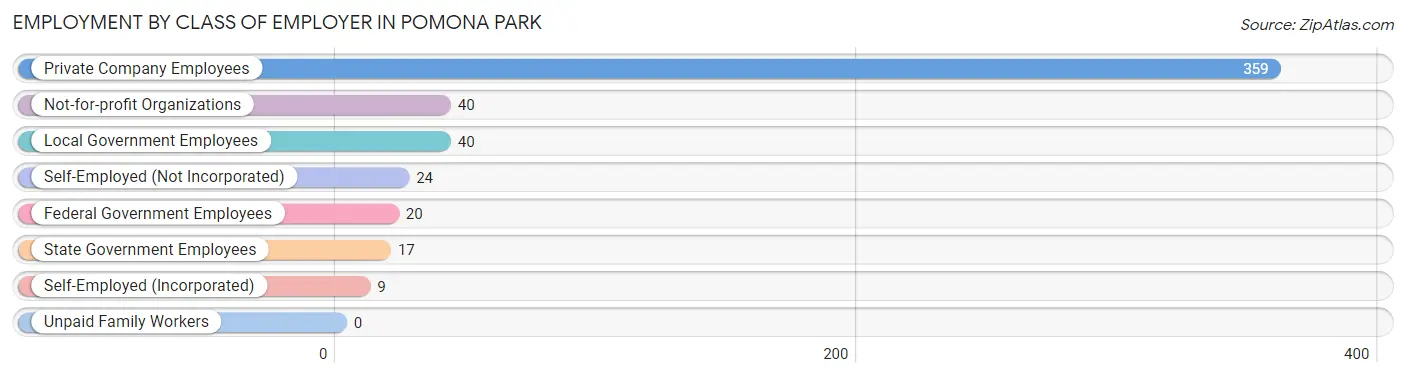
| Employer Class | # Employees | % Employees |
| Private Company Employees | 359 | 70.5% |
| Self-Employed (Incorporated) | 9 | 1.8% |
| Self-Employed (Not Incorporated) | 24 | 4.7% |
| Not-for-profit Organizations | 40 | 7.9% |
| Local Government Employees | 40 | 7.9% |
| State Government Employees | 17 | 3.3% |
| Federal Government Employees | 20 | 3.9% |
| Unpaid Family Workers | 0 | 0.0% |
| Total | 509 | 100.0% |
Employment Status by Age in Pomona Park
According to the labor force statistics for Pomona Park, out of the total population over 16 years of age (966), 60.4% or 583 individuals are in the labor force, with 11.7% or 68 of them unemployed. The age group with the highest labor force participation rate is 25 to 29 years, with 100.0% or 69 individuals in the labor force. Within the labor force, the 25 to 29 years age range has the highest percentage of unemployed individuals, with 88.4% or 61 of them being unemployed.
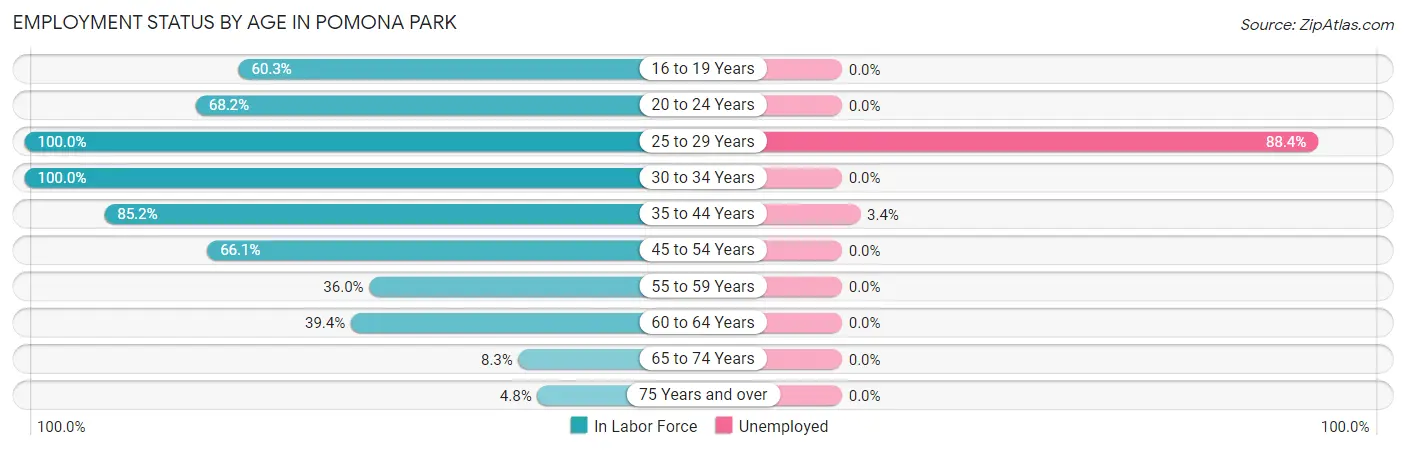
| Age Bracket | In Labor Force | Unemployed |
| 16 to 19 Years | 111 (60.3%) | 0 (0.0%) |
| 20 to 24 Years | 60 (68.2%) | 0 (0.0%) |
| 25 to 29 Years | 69 (100.0%) | 61 (88.4%) |
| 30 to 34 Years | 33 (100.0%) | 0 (0.0%) |
| 35 to 44 Years | 208 (85.2%) | 7 (3.4%) |
| 45 to 54 Years | 37 (66.1%) | 0 (0.0%) |
| 55 to 59 Years | 27 (36.0%) | 0 (0.0%) |
| 60 to 64 Years | 28 (39.4%) | 0 (0.0%) |
| 65 to 74 Years | 7 (8.3%) | 0 (0.0%) |
| 75 Years and over | 3 (4.8%) | 0 (0.0%) |
| Total | 583 (60.4%) | 68 (11.7%) |
Employment Status by Educational Attainment in Pomona Park
According to labor force statistics for Pomona Park, 73.4% of individuals (402) out of the total population between 25 and 64 years of age (548) are in the labor force, with 16.9% or 68 of them being unemployed. The group with the highest labor force participation rate are those with the educational attainment of bachelor's degree or higher, with 80.6% or 25 individuals in the labor force. Within the labor force, individuals with high school diploma education have the highest percentage of unemployment, with 35.8% or 68 of them being unemployed.
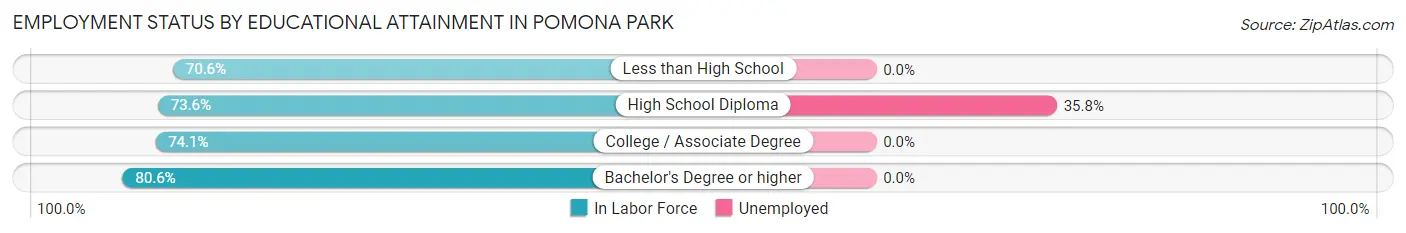
| Educational Attainment | In Labor Force | Unemployed |
| Less than High School | 101 (70.6%) | 0 (0.0%) |
| High School Diploma | 190 (73.6%) | 92 (35.8%) |
| College / Associate Degree | 86 (74.1%) | 0 (0.0%) |
| Bachelor's Degree or higher | 25 (80.6%) | 0 (0.0%) |
| Total | 402 (73.4%) | 93 (16.9%) |
Employment Occupations by Sex in Pomona Park
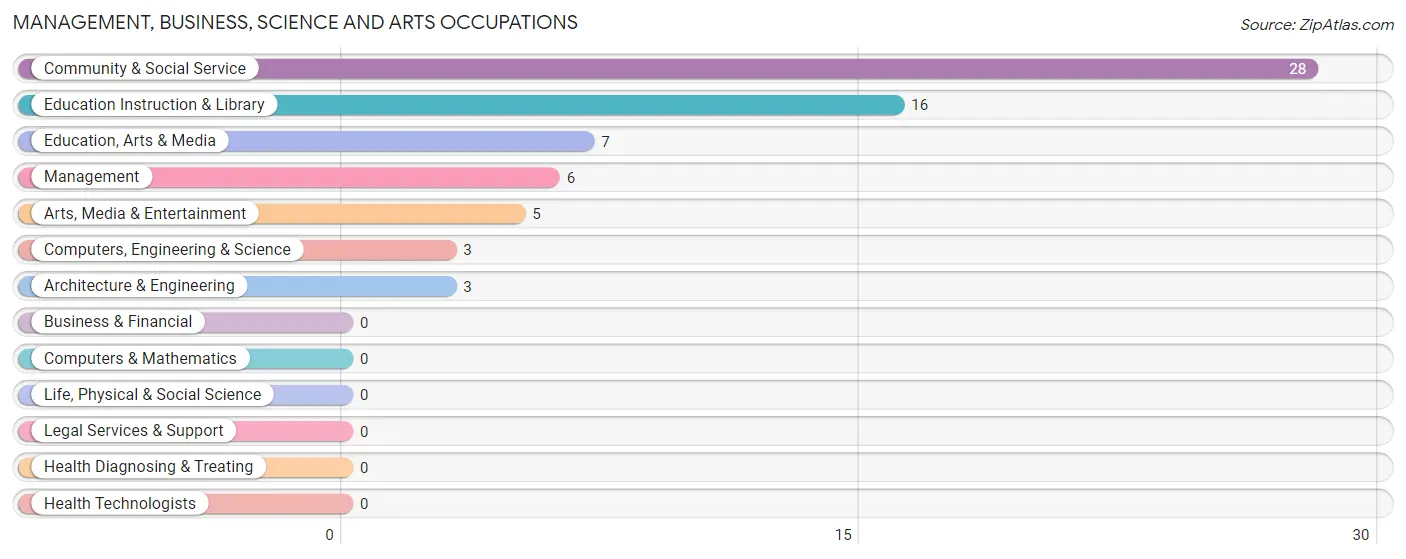
Management, Business, Science and Arts Occupations
The most common Management, Business, Science and Arts occupations in Pomona Park are Community & Social Service (28 | 5.4%), Education Instruction & Library (16 | 3.1%), Education, Arts & Media (7 | 1.4%), Management (6 | 1.2%), and Arts, Media & Entertainment (5 | 1.0%).
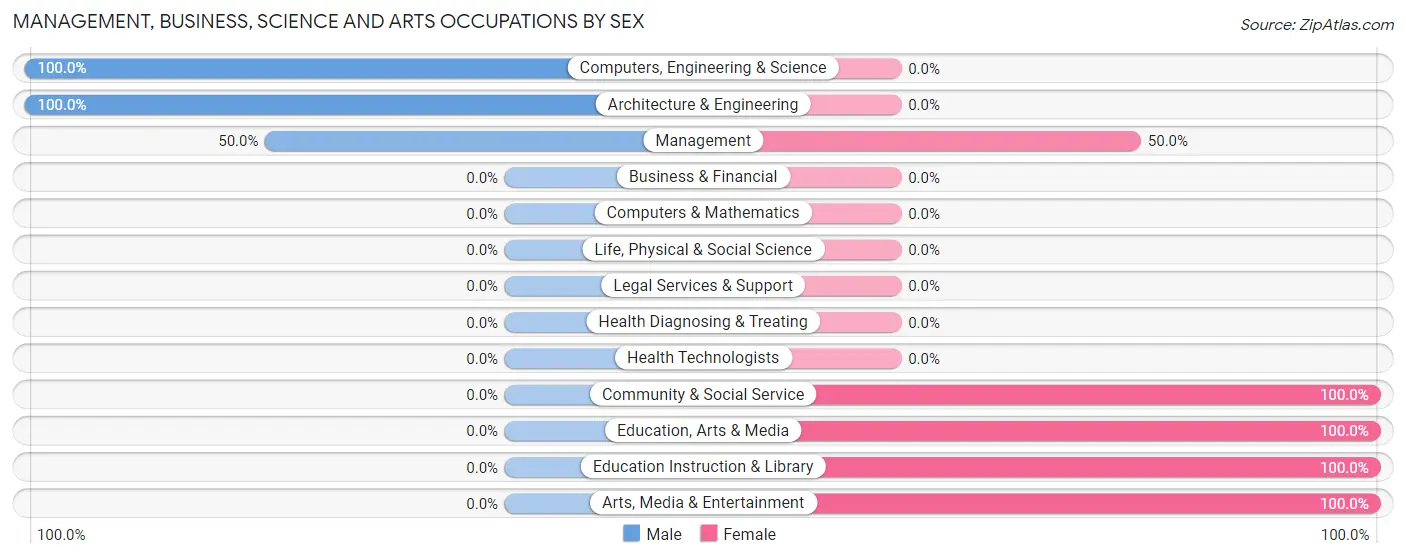
Management, Business, Science and Arts Occupations by Sex
Within the Management, Business, Science and Arts occupations in Pomona Park, the most male-oriented occupations are Computers, Engineering & Science (100.0%), Architecture & Engineering (100.0%), and Management (50.0%), while the most female-oriented occupations are Community & Social Service (100.0%), Education, Arts & Media (100.0%), and Education Instruction & Library (100.0%).
| Occupation | Male | Female |
| Management | 3 (50.0%) | 3 (50.0%) |
| Business & Financial | 0 (0.0%) | 0 (0.0%) |
| Computers, Engineering & Science | 3 (100.0%) | 0 (0.0%) |
| Computers & Mathematics | 0 (0.0%) | 0 (0.0%) |
| Architecture & Engineering | 3 (100.0%) | 0 (0.0%) |
| Life, Physical & Social Science | 0 (0.0%) | 0 (0.0%) |
| Community & Social Service | 0 (0.0%) | 28 (100.0%) |
| Education, Arts & Media | 0 (0.0%) | 7 (100.0%) |
| Legal Services & Support | 0 (0.0%) | 0 (0.0%) |
| Education Instruction & Library | 0 (0.0%) | 16 (100.0%) |
| Arts, Media & Entertainment | 0 (0.0%) | 5 (100.0%) |
| Health Diagnosing & Treating | 0 (0.0%) | 0 (0.0%) |
| Health Technologists | 0 (0.0%) | 0 (0.0%) |
| Total (Category) | 6 (16.2%) | 31 (83.8%) |
| Total (Overall) | 271 (52.6%) | 244 (47.4%) |
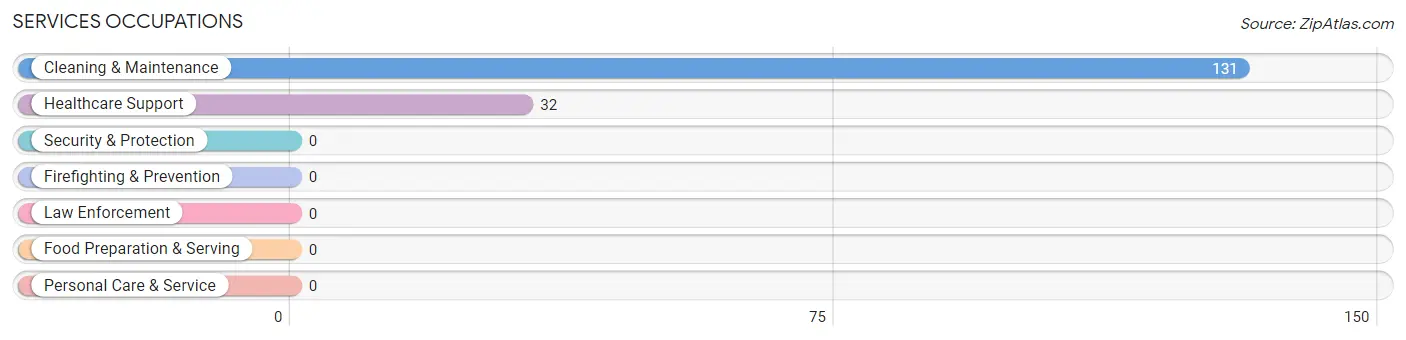
Services Occupations
The most common Services occupations in Pomona Park are Cleaning & Maintenance (131 | 25.4%), and Healthcare Support (32 | 6.2%).
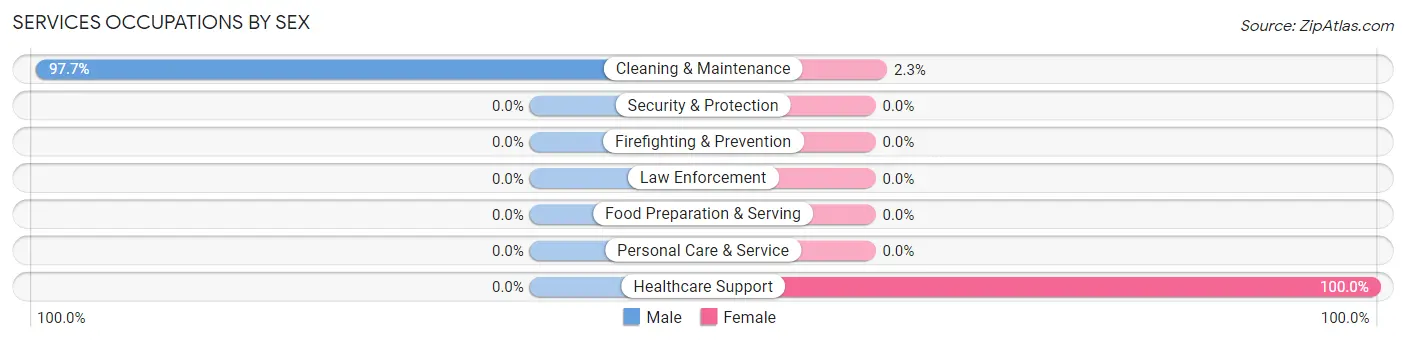
Services Occupations by Sex
| Occupation | Male | Female |
| Healthcare Support | 0 (0.0%) | 32 (100.0%) |
| Security & Protection | 0 (0.0%) | 0 (0.0%) |
| Firefighting & Prevention | 0 (0.0%) | 0 (0.0%) |
| Law Enforcement | 0 (0.0%) | 0 (0.0%) |
| Food Preparation & Serving | 0 (0.0%) | 0 (0.0%) |
| Cleaning & Maintenance | 128 (97.7%) | 3 (2.3%) |
| Personal Care & Service | 0 (0.0%) | 0 (0.0%) |
| Total (Category) | 128 (78.5%) | 35 (21.5%) |
| Total (Overall) | 271 (52.6%) | 244 (47.4%) |
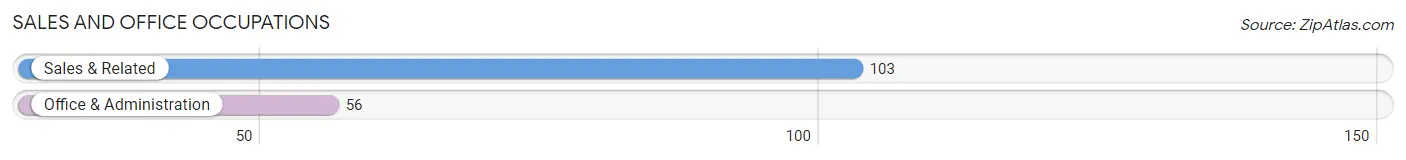
Sales and Office Occupations
The most common Sales and Office occupations in Pomona Park are Sales & Related (103 | 20.0%), and Office & Administration (56 | 10.9%).
Sales and Office Occupations by Sex
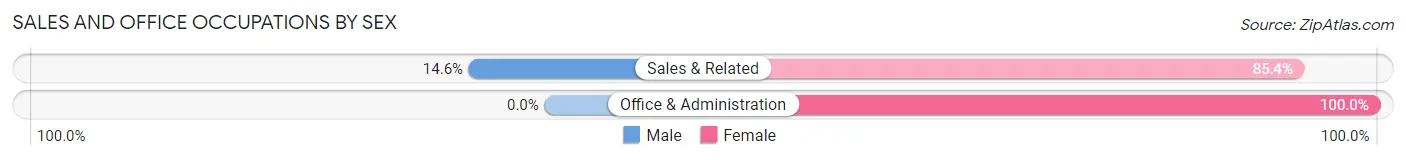
| Occupation | Male | Female |
| Sales & Related | 15 (14.6%) | 88 (85.4%) |
| Office & Administration | 0 (0.0%) | 56 (100.0%) |
| Total (Category) | 15 (9.4%) | 144 (90.6%) |
| Total (Overall) | 271 (52.6%) | 244 (47.4%) |
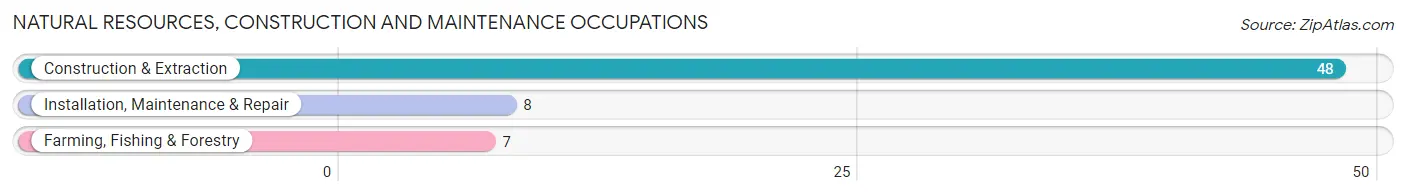
Natural Resources, Construction and Maintenance Occupations
The most common Natural Resources, Construction and Maintenance occupations in Pomona Park are Construction & Extraction (48 | 9.3%), Installation, Maintenance & Repair (8 | 1.5%), and Farming, Fishing & Forestry (7 | 1.4%).
Natural Resources, Construction and Maintenance Occupations by Sex
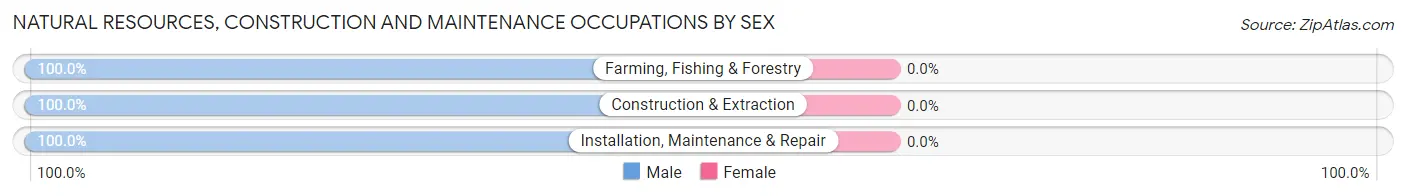
| Occupation | Male | Female |
| Farming, Fishing & Forestry | 7 (100.0%) | 0 (0.0%) |
| Construction & Extraction | 48 (100.0%) | 0 (0.0%) |
| Installation, Maintenance & Repair | 8 (100.0%) | 0 (0.0%) |
| Total (Category) | 63 (100.0%) | 0 (0.0%) |
| Total (Overall) | 271 (52.6%) | 244 (47.4%) |
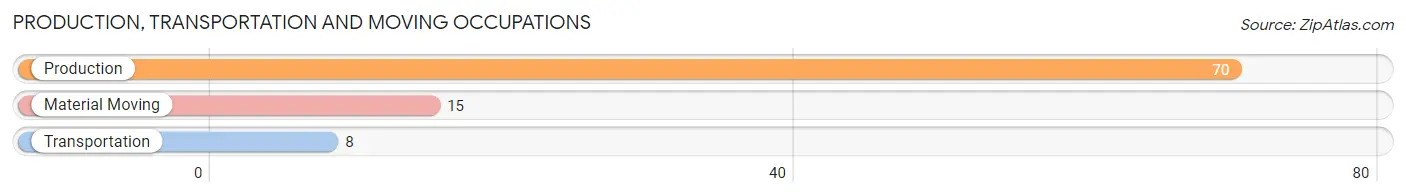
Production, Transportation and Moving Occupations
The most common Production, Transportation and Moving occupations in Pomona Park are Production (70 | 13.6%), Material Moving (15 | 2.9%), and Transportation (8 | 1.5%).
Production, Transportation and Moving Occupations by Sex
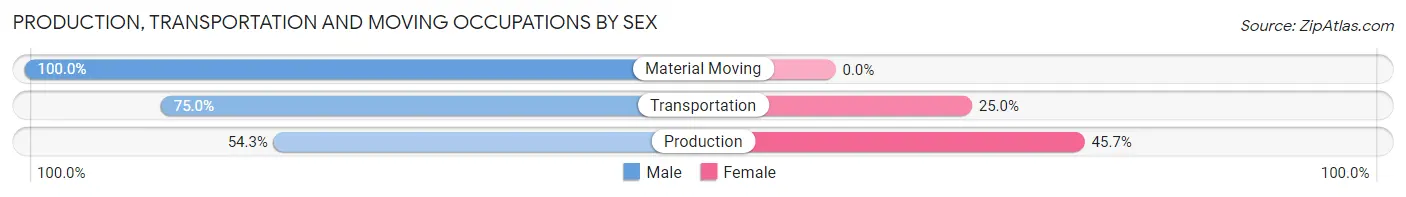
| Occupation | Male | Female |
| Production | 38 (54.3%) | 32 (45.7%) |
| Transportation | 6 (75.0%) | 2 (25.0%) |
| Material Moving | 15 (100.0%) | 0 (0.0%) |
| Total (Category) | 59 (63.4%) | 34 (36.6%) |
| Total (Overall) | 271 (52.6%) | 244 (47.4%) |
Employment Industries by Sex in Pomona Park
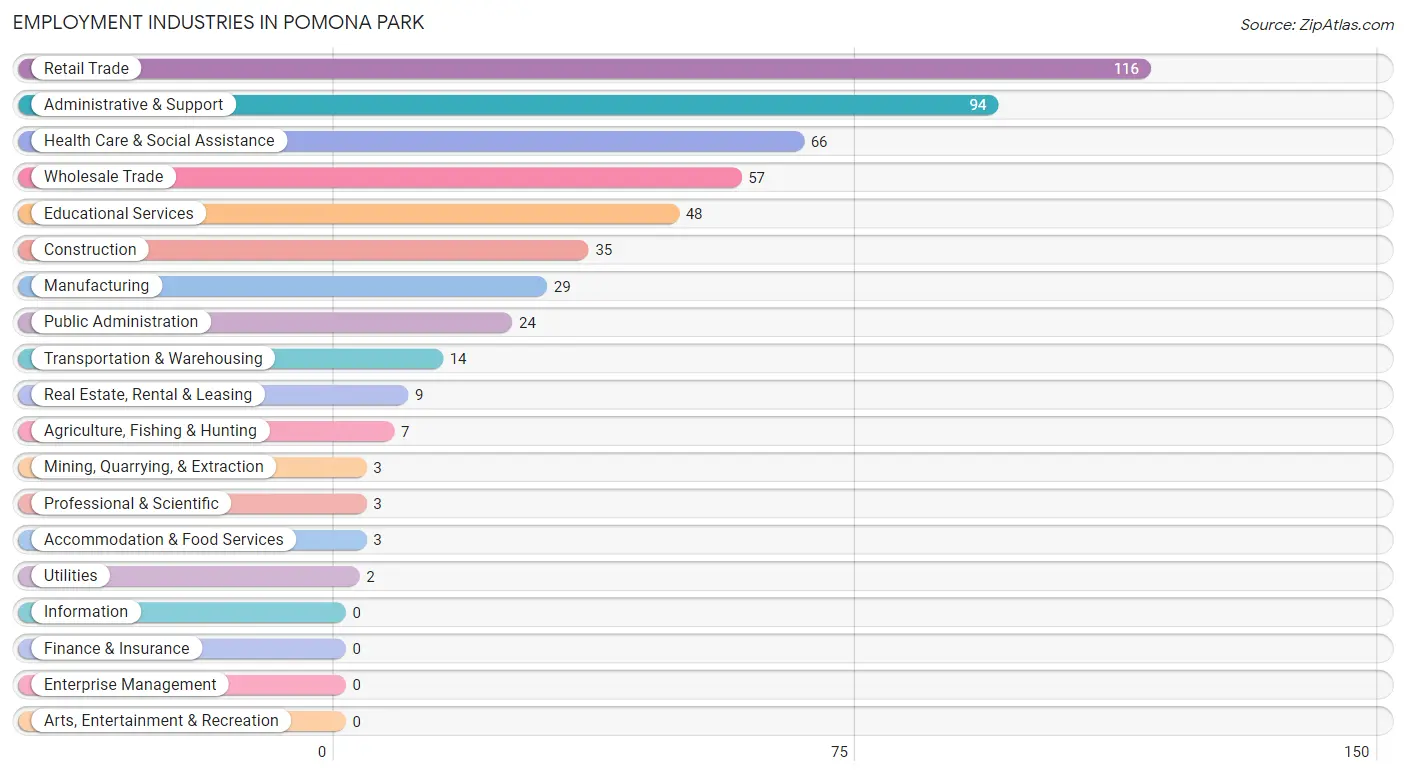
Employment Industries in Pomona Park
The major employment industries in Pomona Park include Retail Trade (116 | 22.5%), Administrative & Support (94 | 18.2%), Health Care & Social Assistance (66 | 12.8%), Wholesale Trade (57 | 11.1%), and Educational Services (48 | 9.3%).
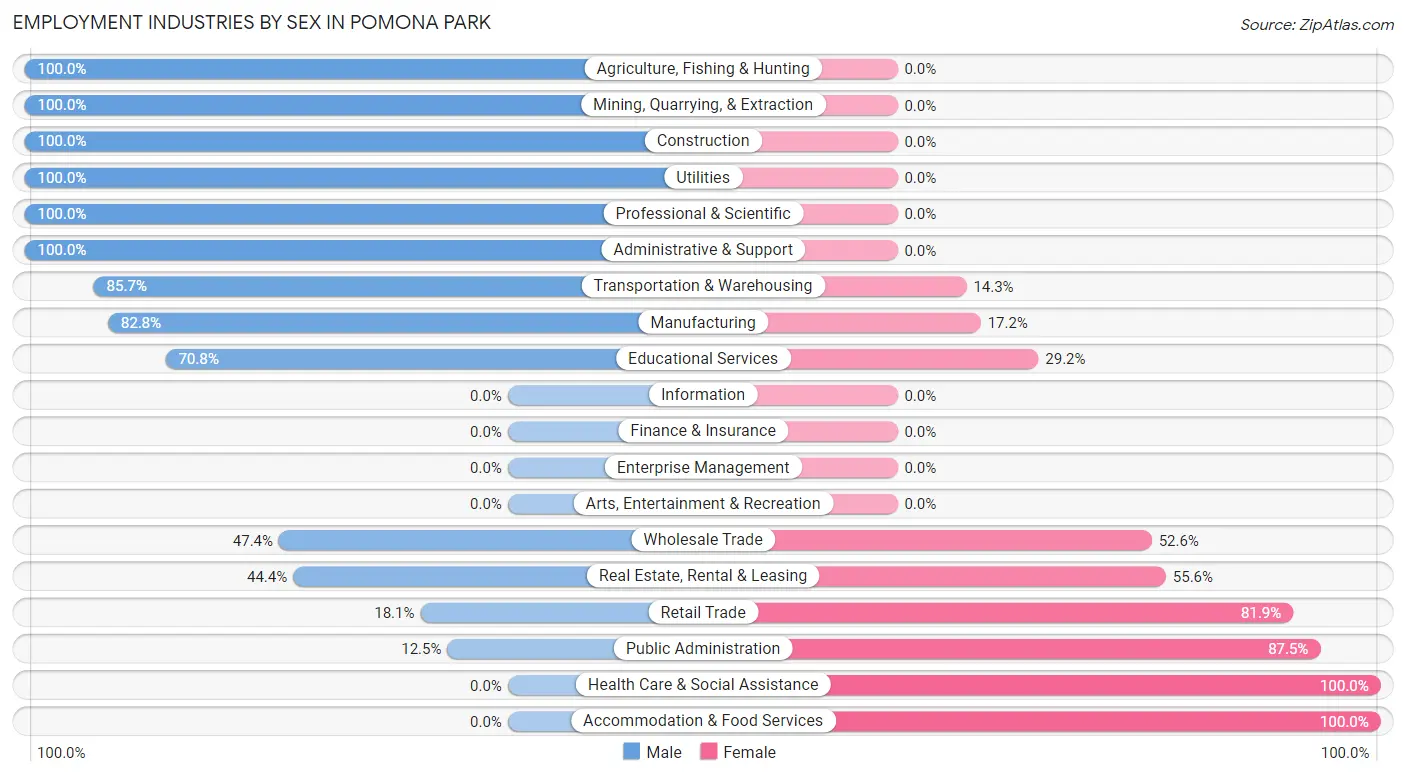
Employment Industries by Sex in Pomona Park
The Pomona Park industries that see more men than women are Agriculture, Fishing & Hunting (100.0%), Mining, Quarrying, & Extraction (100.0%), and Construction (100.0%), whereas the industries that tend to have a higher number of women are Health Care & Social Assistance (100.0%), Accommodation & Food Services (100.0%), and Public Administration (87.5%).
| Industry | Male | Female |
| Agriculture, Fishing & Hunting | 7 (100.0%) | 0 (0.0%) |
| Mining, Quarrying, & Extraction | 3 (100.0%) | 0 (0.0%) |
| Construction | 35 (100.0%) | 0 (0.0%) |
| Manufacturing | 24 (82.8%) | 5 (17.2%) |
| Wholesale Trade | 27 (47.4%) | 30 (52.6%) |
| Retail Trade | 21 (18.1%) | 95 (81.9%) |
| Transportation & Warehousing | 12 (85.7%) | 2 (14.3%) |
| Utilities | 2 (100.0%) | 0 (0.0%) |
| Information | 0 (0.0%) | 0 (0.0%) |
| Finance & Insurance | 0 (0.0%) | 0 (0.0%) |
| Real Estate, Rental & Leasing | 4 (44.4%) | 5 (55.6%) |
| Professional & Scientific | 3 (100.0%) | 0 (0.0%) |
| Enterprise Management | 0 (0.0%) | 0 (0.0%) |
| Administrative & Support | 94 (100.0%) | 0 (0.0%) |
| Educational Services | 34 (70.8%) | 14 (29.2%) |
| Health Care & Social Assistance | 0 (0.0%) | 66 (100.0%) |
| Arts, Entertainment & Recreation | 0 (0.0%) | 0 (0.0%) |
| Accommodation & Food Services | 0 (0.0%) | 3 (100.0%) |
| Public Administration | 3 (12.5%) | 21 (87.5%) |
| Total | 271 (52.6%) | 244 (47.4%) |
Education in Pomona Park
School Enrollment in Pomona Park
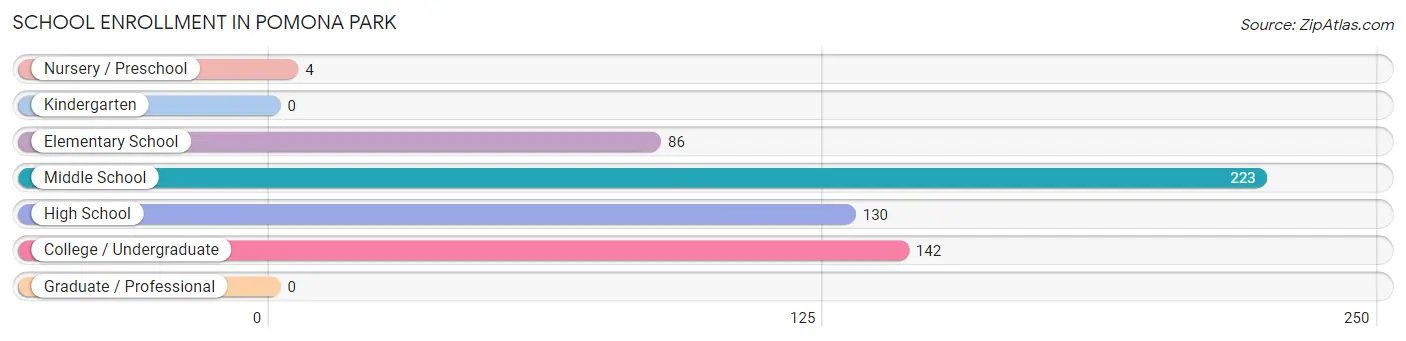
The most common levels of schooling among the 585 students in Pomona Park are middle school (223 | 38.1%), college / undergraduate (142 | 24.3%), and high school (130 | 22.2%).
| School Level | # Students | % Students |
| Nursery / Preschool | 4 | 0.7% |
| Kindergarten | 0 | 0.0% |
| Elementary School | 86 | 14.7% |
| Middle School | 223 | 38.1% |
| High School | 130 | 22.2% |
| College / Undergraduate | 142 | 24.3% |
| Graduate / Professional | 0 | 0.0% |
| Total | 585 | 100.0% |
School Enrollment by Age by Funding Source in Pomona Park
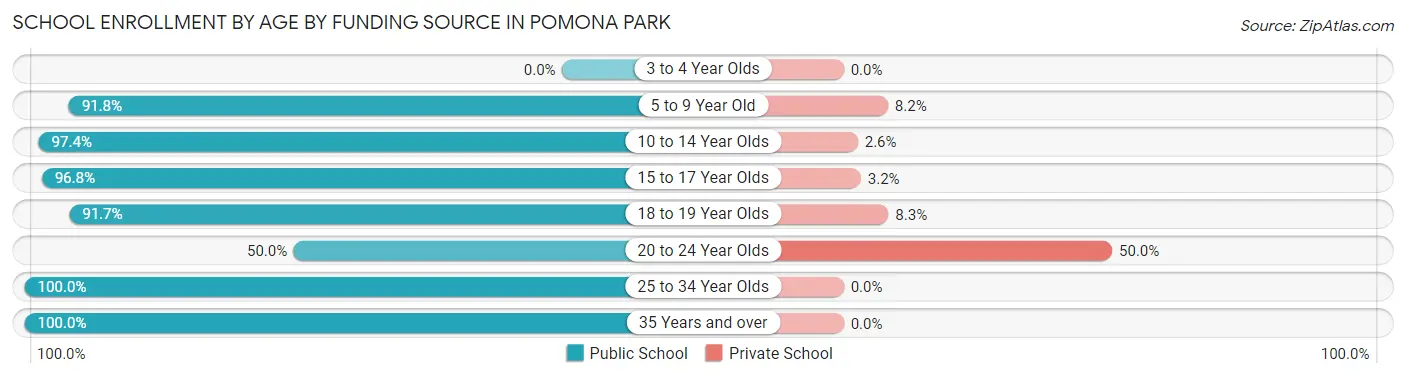
Out of a total of 585 students who are enrolled in schools in Pomona Park, 29 (5.0%) attend a private institution, while the remaining 556 (95.0%) are enrolled in public schools. The age group of 20 to 24 year olds has the highest likelihood of being enrolled in private schools, with 6 (50.0% in the age bracket) enrolled. Conversely, the age group of 25 to 34 year olds has the lowest likelihood of being enrolled in a private school, with 61 (100.0% in the age bracket) attending a public institution.
| Age Bracket | Public School | Private School |
| 3 to 4 Year Olds | 0 (0.0%) | 0 (0.0%) |
| 5 to 9 Year Old | 78 (91.8%) | 7 (8.2%) |
| 10 to 14 Year Olds | 222 (97.4%) | 6 (2.6%) |
| 15 to 17 Year Olds | 121 (96.8%) | 4 (3.2%) |
| 18 to 19 Year Olds | 66 (91.7%) | 6 (8.3%) |
| 20 to 24 Year Olds | 6 (50.0%) | 6 (50.0%) |
| 25 to 34 Year Olds | 61 (100.0%) | 0 (0.0%) |
| 35 Years and over | 2 (100.0%) | 0 (0.0%) |
| Total | 556 (95.0%) | 29 (5.0%) |
Educational Attainment by Field of Study in Pomona Park
Education (22 | 39.3%), science & technology (12 | 21.4%), social sciences (5 | 8.9%), engineering (5 | 8.9%), and liberal arts & history (5 | 8.9%) are the most common fields of study among 56 individuals in Pomona Park who have obtained a bachelor's degree or higher.
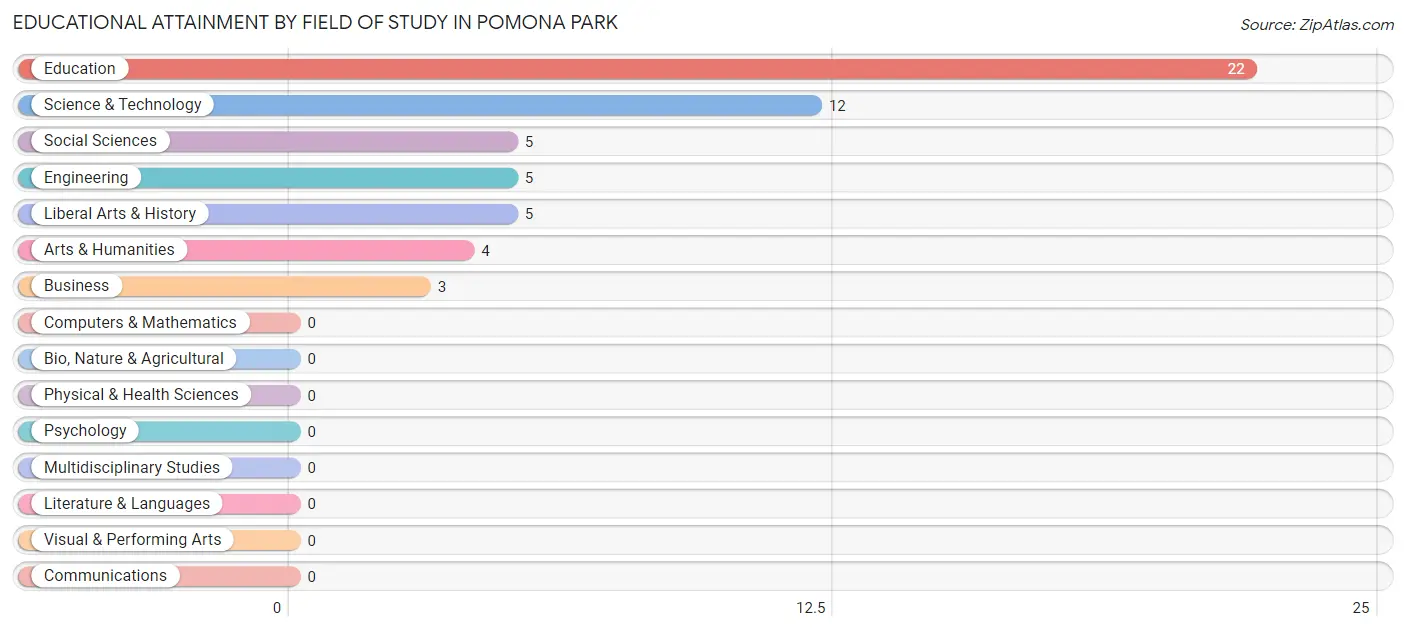
| Field of Study | # Graduates | % Graduates |
| Computers & Mathematics | 0 | 0.0% |
| Bio, Nature & Agricultural | 0 | 0.0% |
| Physical & Health Sciences | 0 | 0.0% |
| Psychology | 0 | 0.0% |
| Social Sciences | 5 | 8.9% |
| Engineering | 5 | 8.9% |
| Multidisciplinary Studies | 0 | 0.0% |
| Science & Technology | 12 | 21.4% |
| Business | 3 | 5.4% |
| Education | 22 | 39.3% |
| Literature & Languages | 0 | 0.0% |
| Liberal Arts & History | 5 | 8.9% |
| Visual & Performing Arts | 0 | 0.0% |
| Communications | 0 | 0.0% |
| Arts & Humanities | 4 | 7.1% |
| Total | 56 | 100.0% |
Transportation & Commute in Pomona Park
Vehicle Availability by Sex in Pomona Park
The most prevalent vehicle ownership categories in Pomona Park are males with 4 vehicles (135, accounting for 50.9%) and females with 4 vehicles (93, making up 56.7%).
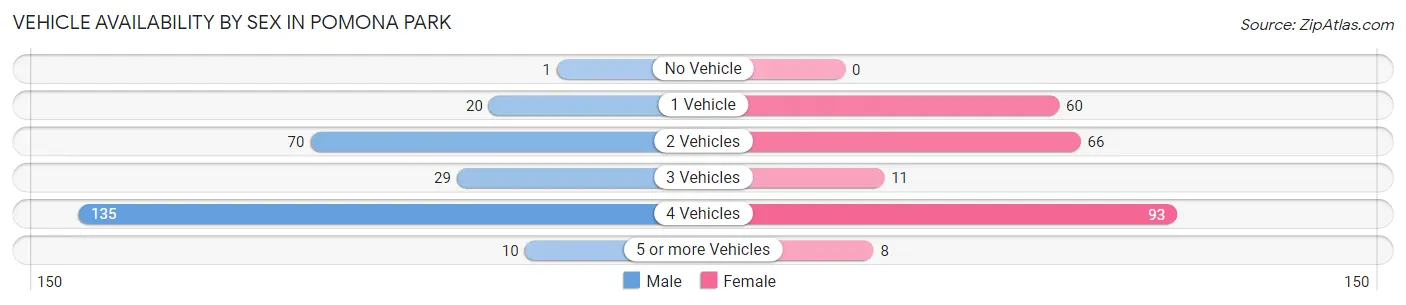
| Vehicles Available | Male | Female |
| No Vehicle | 1 (0.4%) | 0 (0.0%) |
| 1 Vehicle | 20 (7.5%) | 60 (25.2%) |
| 2 Vehicles | 70 (26.4%) | 66 (27.7%) |
| 3 Vehicles | 29 (10.9%) | 11 (4.6%) |
| 4 Vehicles | 135 (50.9%) | 93 (39.1%) |
| 5 or more Vehicles | 10 (3.8%) | 8 (3.4%) |
| Total | 265 (100.0%) | 238 (100.0%) |
Commute Time in Pomona Park
The most frequently occuring commute durations in Pomona Park are 45 to 59 minutes (145 commuters, 29.6%), 40 to 44 minutes (101 commuters, 20.6%), and 30 to 34 minutes (74 commuters, 15.1%).
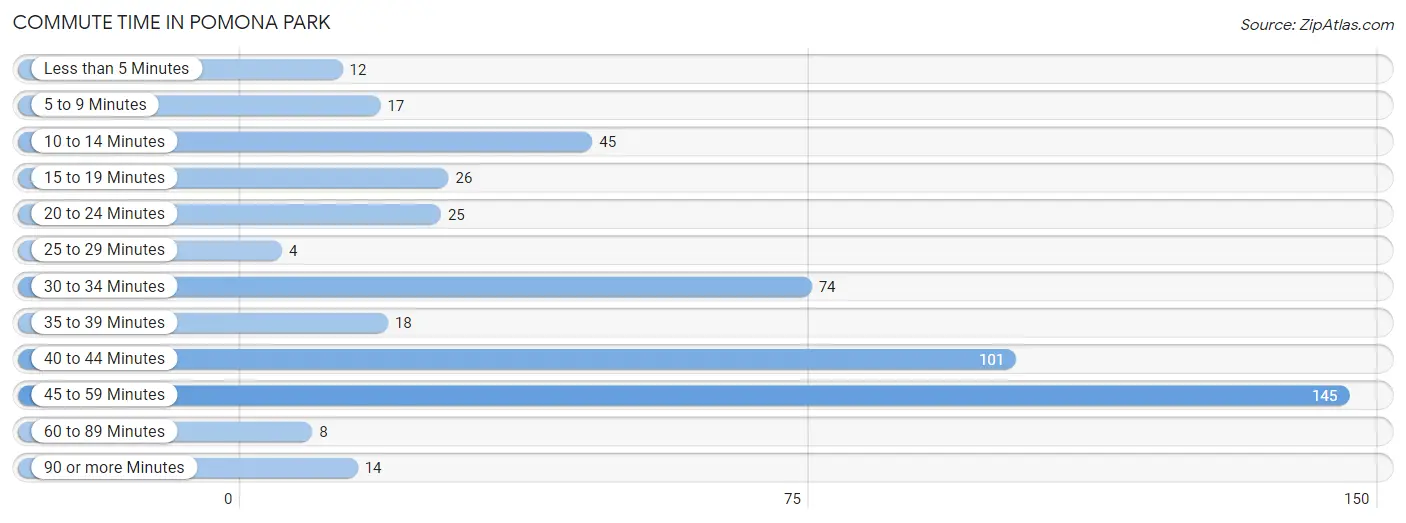
| Commute Time | # Commuters | % Commuters |
| Less than 5 Minutes | 12 | 2.5% |
| 5 to 9 Minutes | 17 | 3.5% |
| 10 to 14 Minutes | 45 | 9.2% |
| 15 to 19 Minutes | 26 | 5.3% |
| 20 to 24 Minutes | 25 | 5.1% |
| 25 to 29 Minutes | 4 | 0.8% |
| 30 to 34 Minutes | 74 | 15.1% |
| 35 to 39 Minutes | 18 | 3.7% |
| 40 to 44 Minutes | 101 | 20.6% |
| 45 to 59 Minutes | 145 | 29.6% |
| 60 to 89 Minutes | 8 | 1.6% |
| 90 or more Minutes | 14 | 2.9% |
Commute Time by Sex in Pomona Park
The most common commute times in Pomona Park are 40 to 44 minutes (98 commuters, 38.0%) for males and 45 to 59 minutes (125 commuters, 54.1%) for females.
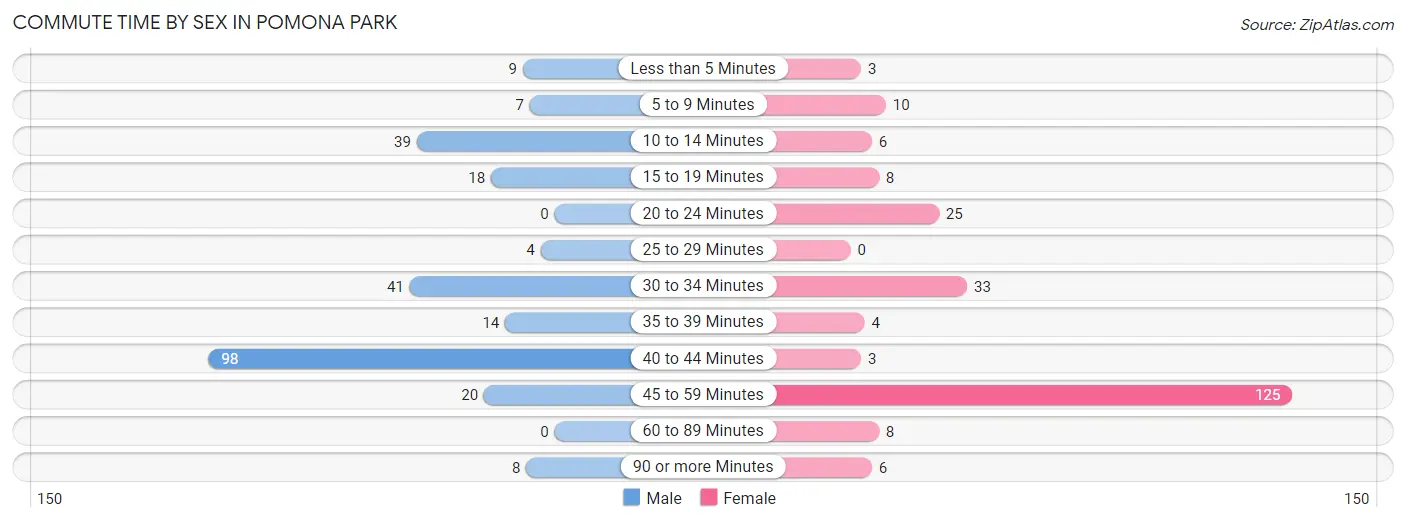
| Commute Time | Male | Female |
| Less than 5 Minutes | 9 (3.5%) | 3 (1.3%) |
| 5 to 9 Minutes | 7 (2.7%) | 10 (4.3%) |
| 10 to 14 Minutes | 39 (15.1%) | 6 (2.6%) |
| 15 to 19 Minutes | 18 (7.0%) | 8 (3.5%) |
| 20 to 24 Minutes | 0 (0.0%) | 25 (10.8%) |
| 25 to 29 Minutes | 4 (1.5%) | 0 (0.0%) |
| 30 to 34 Minutes | 41 (15.9%) | 33 (14.3%) |
| 35 to 39 Minutes | 14 (5.4%) | 4 (1.7%) |
| 40 to 44 Minutes | 98 (38.0%) | 3 (1.3%) |
| 45 to 59 Minutes | 20 (7.7%) | 125 (54.1%) |
| 60 to 89 Minutes | 0 (0.0%) | 8 (3.5%) |
| 90 or more Minutes | 8 (3.1%) | 6 (2.6%) |
Time of Departure to Work by Sex in Pomona Park
The most frequent times of departure to work in Pomona Park are 5:00 AM to 5:29 AM (101, 39.2%) for males and 7:00 AM to 7:29 AM (72, 31.2%) for females.
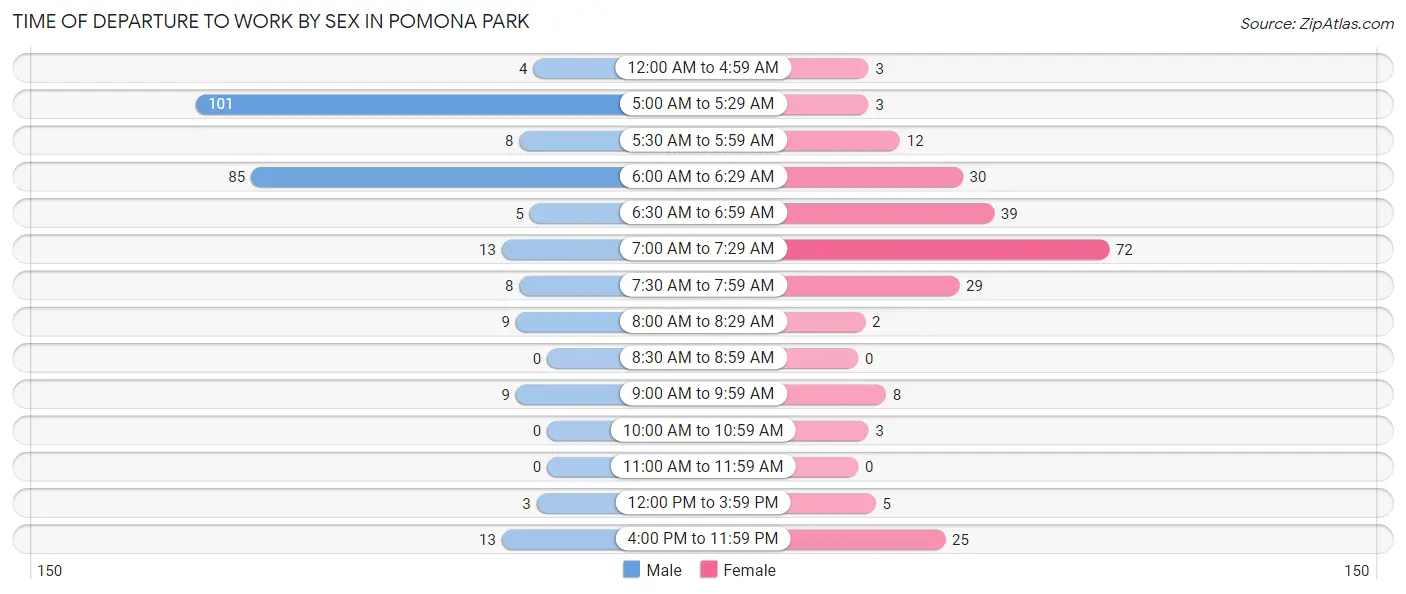
| Time of Departure | Male | Female |
| 12:00 AM to 4:59 AM | 4 (1.5%) | 3 (1.3%) |
| 5:00 AM to 5:29 AM | 101 (39.2%) | 3 (1.3%) |
| 5:30 AM to 5:59 AM | 8 (3.1%) | 12 (5.2%) |
| 6:00 AM to 6:29 AM | 85 (33.0%) | 30 (13.0%) |
| 6:30 AM to 6:59 AM | 5 (1.9%) | 39 (16.9%) |
| 7:00 AM to 7:29 AM | 13 (5.0%) | 72 (31.2%) |
| 7:30 AM to 7:59 AM | 8 (3.1%) | 29 (12.6%) |
| 8:00 AM to 8:29 AM | 9 (3.5%) | 2 (0.9%) |
| 8:30 AM to 8:59 AM | 0 (0.0%) | 0 (0.0%) |
| 9:00 AM to 9:59 AM | 9 (3.5%) | 8 (3.5%) |
| 10:00 AM to 10:59 AM | 0 (0.0%) | 3 (1.3%) |
| 11:00 AM to 11:59 AM | 0 (0.0%) | 0 (0.0%) |
| 12:00 PM to 3:59 PM | 3 (1.2%) | 5 (2.2%) |
| 4:00 PM to 11:59 PM | 13 (5.0%) | 25 (10.8%) |
| Total | 258 (100.0%) | 231 (100.0%) |
Housing Occupancy in Pomona Park
Occupancy by Ownership in Pomona Park
Of the total 442 dwellings in Pomona Park, owner-occupied units account for 216 (48.9%), while renter-occupied units make up 226 (51.1%).
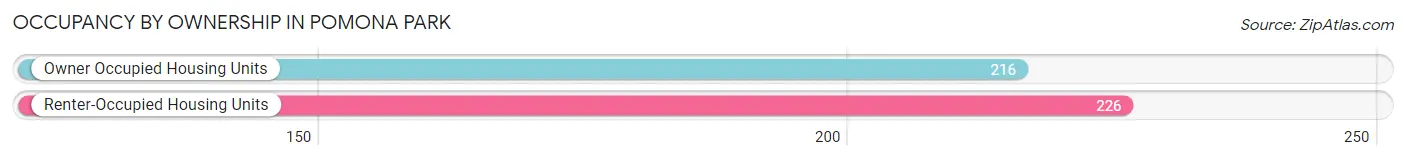
| Occupancy | # Housing Units | % Housing Units |
| Owner Occupied Housing Units | 216 | 48.9% |
| Renter-Occupied Housing Units | 226 | 51.1% |
| Total Occupied Housing Units | 442 | 100.0% |
Occupancy by Household Size in Pomona Park
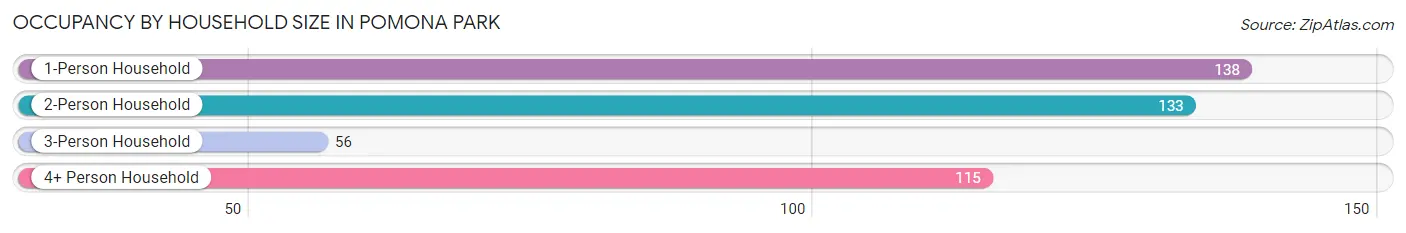
| Household Size | # Housing Units | % Housing Units |
| 1-Person Household | 138 | 31.2% |
| 2-Person Household | 133 | 30.1% |
| 3-Person Household | 56 | 12.7% |
| 4+ Person Household | 115 | 26.0% |
| Total Housing Units | 442 | 100.0% |
Occupancy by Ownership by Household Size in Pomona Park
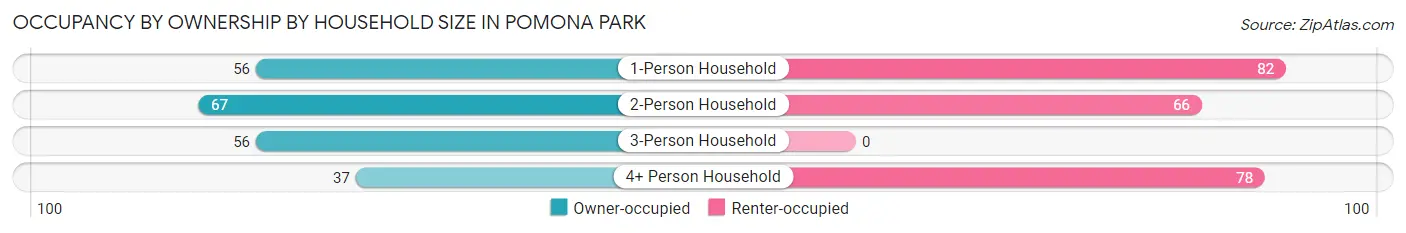
| Household Size | Owner-occupied | Renter-occupied |
| 1-Person Household | 56 (40.6%) | 82 (59.4%) |
| 2-Person Household | 67 (50.4%) | 66 (49.6%) |
| 3-Person Household | 56 (100.0%) | 0 (0.0%) |
| 4+ Person Household | 37 (32.2%) | 78 (67.8%) |
| Total Housing Units | 216 (48.9%) | 226 (51.1%) |
Occupancy by Educational Attainment in Pomona Park
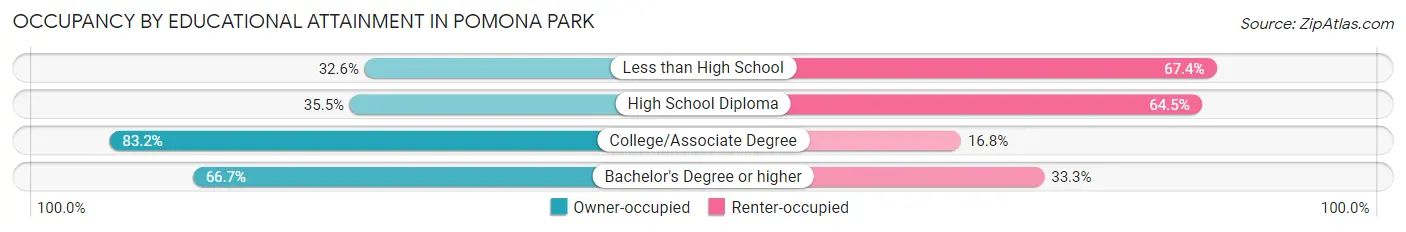
| Household Size | Owner-occupied | Renter-occupied |
| Less than High School | 14 (32.6%) | 29 (67.4%) |
| High School Diploma | 93 (35.5%) | 169 (64.5%) |
| College/Associate Degree | 89 (83.2%) | 18 (16.8%) |
| Bachelor's Degree or higher | 20 (66.7%) | 10 (33.3%) |
Occupancy by Age of Householder in Pomona Park
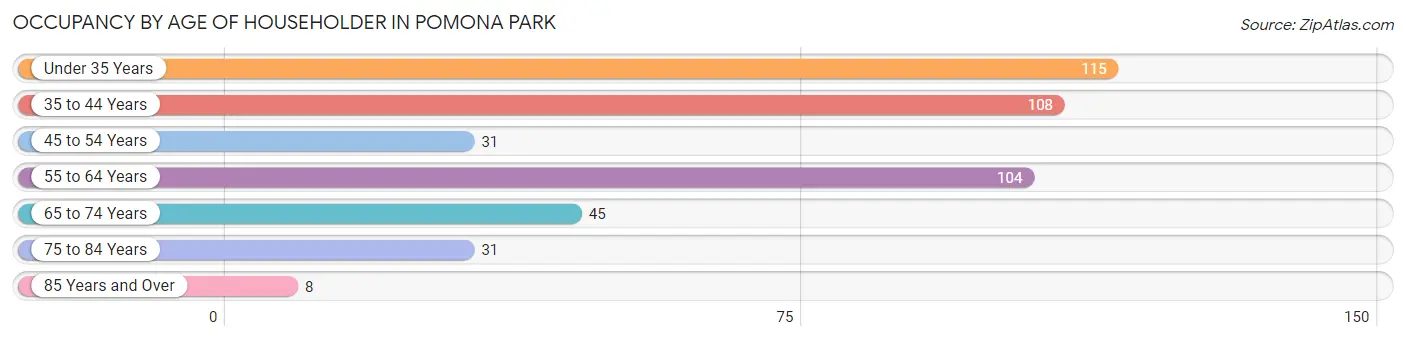
| Age Bracket | # Households | % Households |
| Under 35 Years | 115 | 26.0% |
| 35 to 44 Years | 108 | 24.4% |
| 45 to 54 Years | 31 | 7.0% |
| 55 to 64 Years | 104 | 23.5% |
| 65 to 74 Years | 45 | 10.2% |
| 75 to 84 Years | 31 | 7.0% |
| 85 Years and Over | 8 | 1.8% |
| Total | 442 | 100.0% |
Housing Finances in Pomona Park
Median Income by Occupancy in Pomona Park
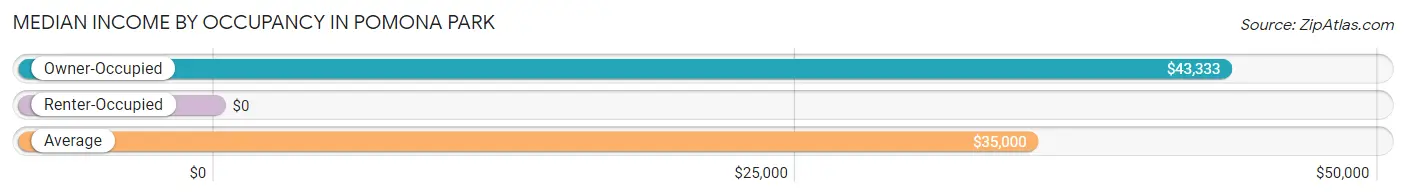
| Occupancy Type | # Households | Median Income |
| Owner-Occupied | 216 (48.9%) | $43,333 |
| Renter-Occupied | 226 (51.1%) | $0 |
| Average | 442 (100.0%) | $35,000 |
Occupancy by Householder Income Bracket in Pomona Park
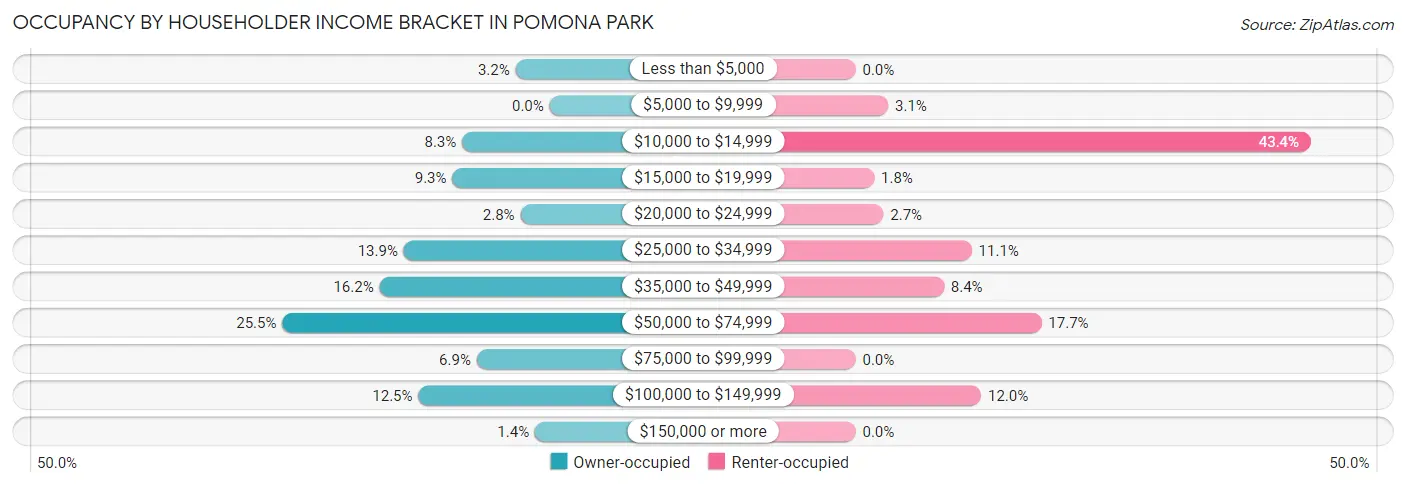
| Income Bracket | Owner-occupied | Renter-occupied |
| Less than $5,000 | 7 (3.2%) | 0 (0.0%) |
| $5,000 to $9,999 | 0 (0.0%) | 7 (3.1%) |
| $10,000 to $14,999 | 18 (8.3%) | 98 (43.4%) |
| $15,000 to $19,999 | 20 (9.3%) | 4 (1.8%) |
| $20,000 to $24,999 | 6 (2.8%) | 6 (2.6%) |
| $25,000 to $34,999 | 30 (13.9%) | 25 (11.1%) |
| $35,000 to $49,999 | 35 (16.2%) | 19 (8.4%) |
| $50,000 to $74,999 | 55 (25.5%) | 40 (17.7%) |
| $75,000 to $99,999 | 15 (6.9%) | 0 (0.0%) |
| $100,000 to $149,999 | 27 (12.5%) | 27 (11.9%) |
| $150,000 or more | 3 (1.4%) | 0 (0.0%) |
| Total | 216 (100.0%) | 226 (100.0%) |
Monthly Housing Cost Tiers in Pomona Park
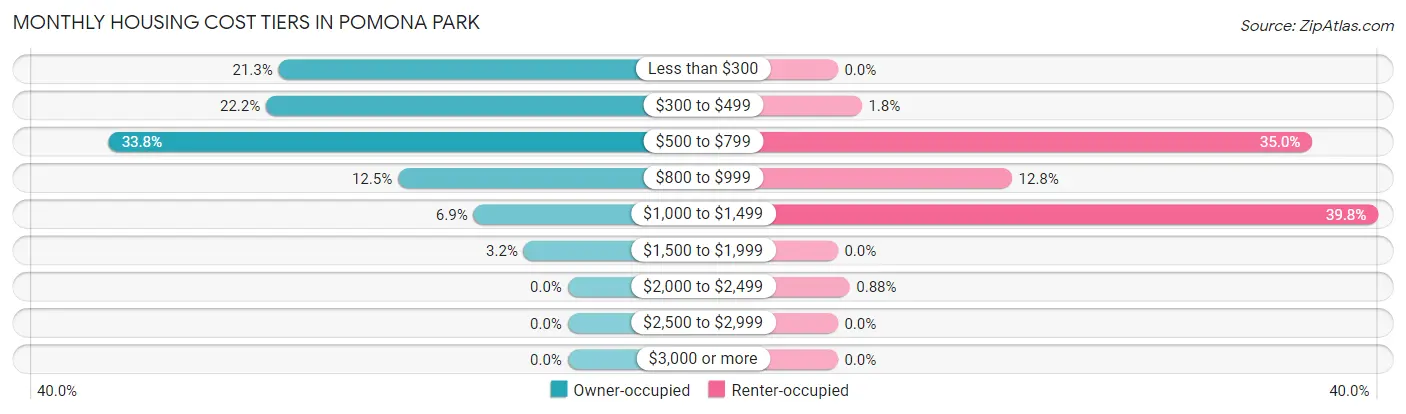
| Monthly Cost | Owner-occupied | Renter-occupied |
| Less than $300 | 46 (21.3%) | 0 (0.0%) |
| $300 to $499 | 48 (22.2%) | 4 (1.8%) |
| $500 to $799 | 73 (33.8%) | 79 (35.0%) |
| $800 to $999 | 27 (12.5%) | 29 (12.8%) |
| $1,000 to $1,499 | 15 (6.9%) | 90 (39.8%) |
| $1,500 to $1,999 | 7 (3.2%) | 0 (0.0%) |
| $2,000 to $2,499 | 0 (0.0%) | 2 (0.9%) |
| $2,500 to $2,999 | 0 (0.0%) | 0 (0.0%) |
| $3,000 or more | 0 (0.0%) | 0 (0.0%) |
| Total | 216 (100.0%) | 226 (100.0%) |
Physical Housing Characteristics in Pomona Park
Housing Structures in Pomona Park
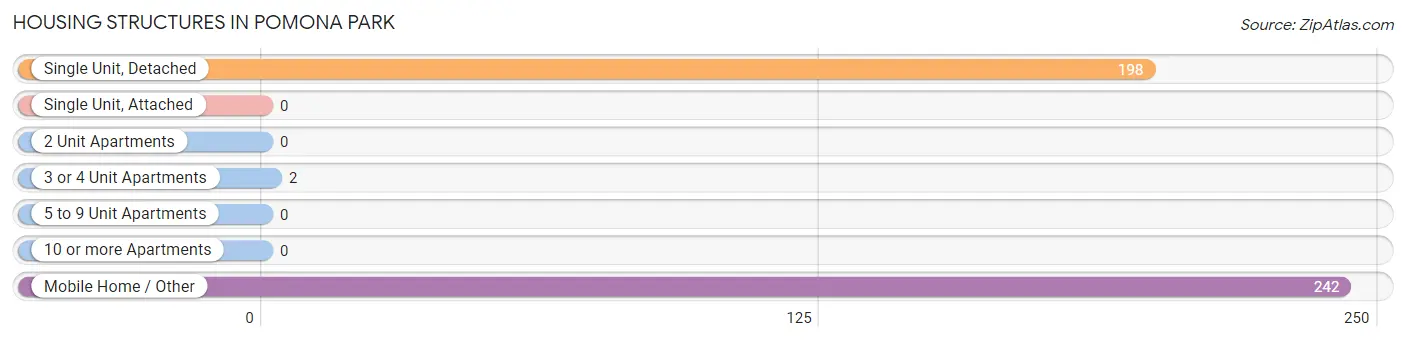
| Structure Type | # Housing Units | % Housing Units |
| Single Unit, Detached | 198 | 44.8% |
| Single Unit, Attached | 0 | 0.0% |
| 2 Unit Apartments | 0 | 0.0% |
| 3 or 4 Unit Apartments | 2 | 0.4% |
| 5 to 9 Unit Apartments | 0 | 0.0% |
| 10 or more Apartments | 0 | 0.0% |
| Mobile Home / Other | 242 | 54.7% |
| Total | 442 | 100.0% |
Housing Structures by Occupancy in Pomona Park
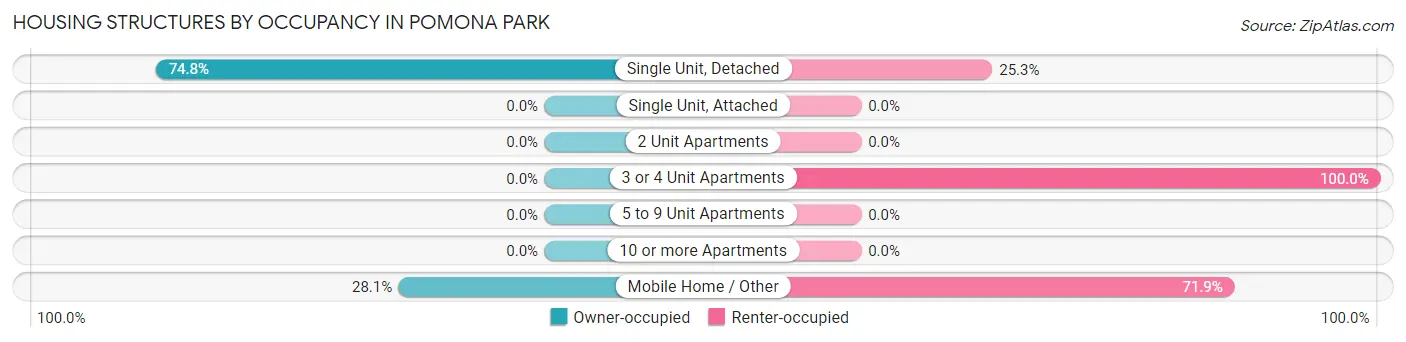
| Structure Type | Owner-occupied | Renter-occupied |
| Single Unit, Detached | 148 (74.8%) | 50 (25.3%) |
| Single Unit, Attached | 0 (0.0%) | 0 (0.0%) |
| 2 Unit Apartments | 0 (0.0%) | 0 (0.0%) |
| 3 or 4 Unit Apartments | 0 (0.0%) | 2 (100.0%) |
| 5 to 9 Unit Apartments | 0 (0.0%) | 0 (0.0%) |
| 10 or more Apartments | 0 (0.0%) | 0 (0.0%) |
| Mobile Home / Other | 68 (28.1%) | 174 (71.9%) |
| Total | 216 (48.9%) | 226 (51.1%) |
Housing Structures by Number of Rooms in Pomona Park
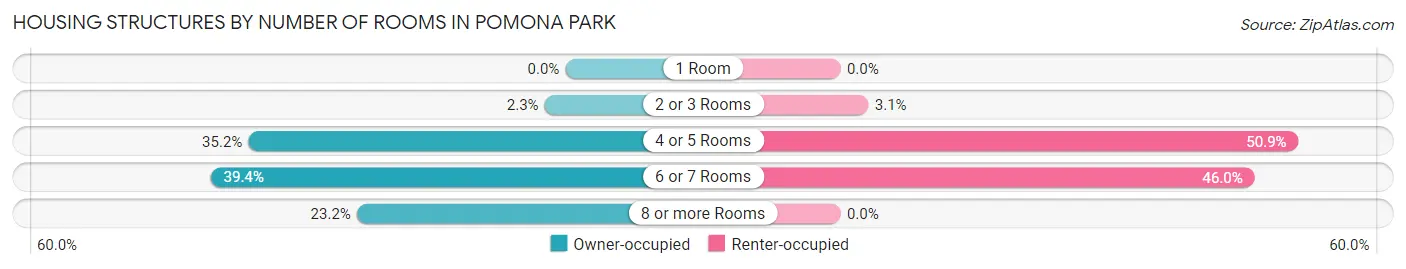
| Number of Rooms | Owner-occupied | Renter-occupied |
| 1 Room | 0 (0.0%) | 0 (0.0%) |
| 2 or 3 Rooms | 5 (2.3%) | 7 (3.1%) |
| 4 or 5 Rooms | 76 (35.2%) | 115 (50.9%) |
| 6 or 7 Rooms | 85 (39.4%) | 104 (46.0%) |
| 8 or more Rooms | 50 (23.2%) | 0 (0.0%) |
| Total | 216 (100.0%) | 226 (100.0%) |
Housing Structure by Heating Type in Pomona Park
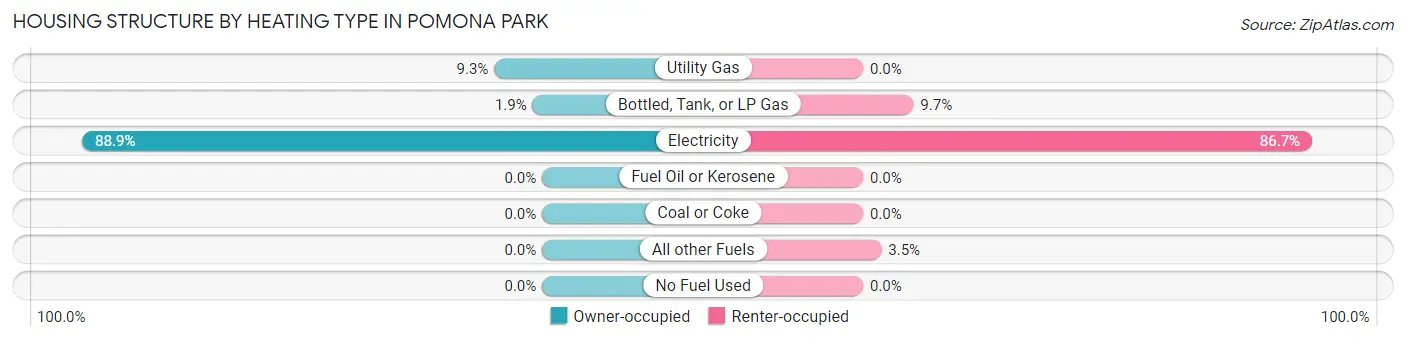
| Heating Type | Owner-occupied | Renter-occupied |
| Utility Gas | 20 (9.3%) | 0 (0.0%) |
| Bottled, Tank, or LP Gas | 4 (1.8%) | 22 (9.7%) |
| Electricity | 192 (88.9%) | 196 (86.7%) |
| Fuel Oil or Kerosene | 0 (0.0%) | 0 (0.0%) |
| Coal or Coke | 0 (0.0%) | 0 (0.0%) |
| All other Fuels | 0 (0.0%) | 8 (3.5%) |
| No Fuel Used | 0 (0.0%) | 0 (0.0%) |
| Total | 216 (100.0%) | 226 (100.0%) |
Household Vehicle Usage in Pomona Park
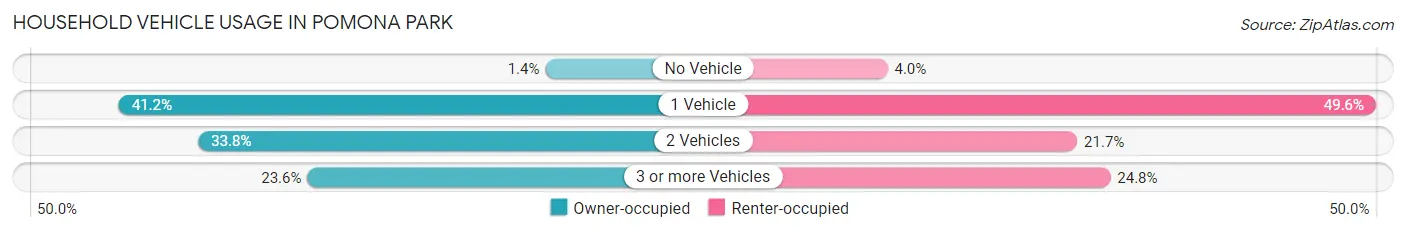
| Vehicles per Household | Owner-occupied | Renter-occupied |
| No Vehicle | 3 (1.4%) | 9 (4.0%) |
| 1 Vehicle | 89 (41.2%) | 112 (49.6%) |
| 2 Vehicles | 73 (33.8%) | 49 (21.7%) |
| 3 or more Vehicles | 51 (23.6%) | 56 (24.8%) |
| Total | 216 (100.0%) | 226 (100.0%) |
Real Estate & Mortgages in Pomona Park
Real Estate and Mortgage Overview in Pomona Park
| Characteristic | Without Mortgage | With Mortgage |
| Housing Units | 130 | 86 |
| Median Property Value | $120,800 | $83,600 |
| Median Household Income | $41,111 | $3 |
| Monthly Housing Costs | $348 | $0 |
| Real Estate Taxes | $1,269 | $17 |
Property Value by Mortgage Status in Pomona Park
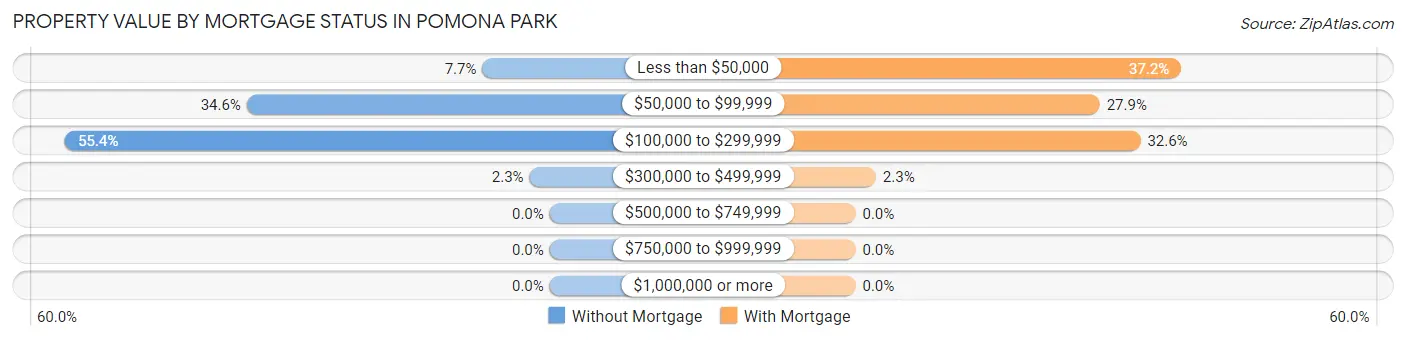
| Property Value | Without Mortgage | With Mortgage |
| Less than $50,000 | 10 (7.7%) | 32 (37.2%) |
| $50,000 to $99,999 | 45 (34.6%) | 24 (27.9%) |
| $100,000 to $299,999 | 72 (55.4%) | 28 (32.6%) |
| $300,000 to $499,999 | 3 (2.3%) | 2 (2.3%) |
| $500,000 to $749,999 | 0 (0.0%) | 0 (0.0%) |
| $750,000 to $999,999 | 0 (0.0%) | 0 (0.0%) |
| $1,000,000 or more | 0 (0.0%) | 0 (0.0%) |
| Total | 130 (100.0%) | 86 (100.0%) |
Household Income by Mortgage Status in Pomona Park
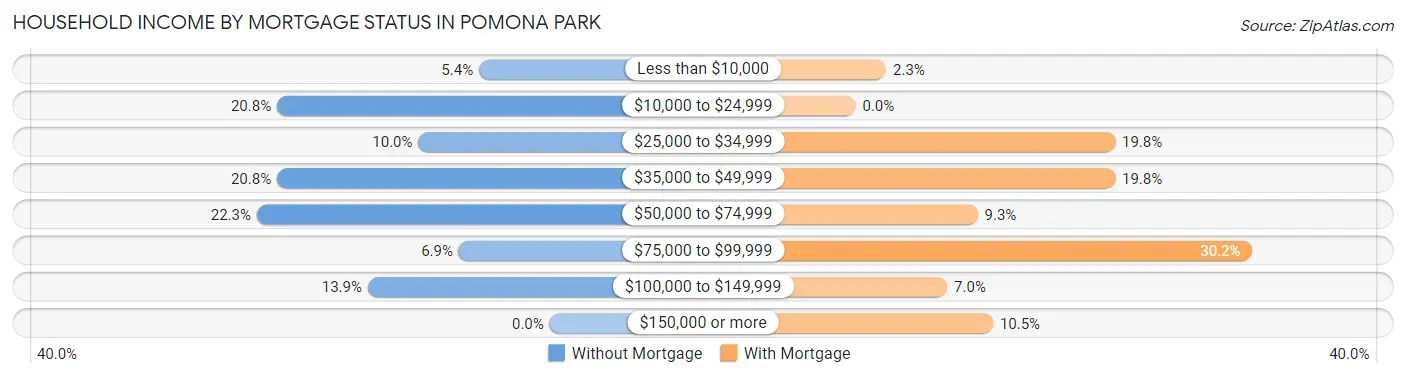
| Household Income | Without Mortgage | With Mortgage |
| Less than $10,000 | 7 (5.4%) | 2 (2.3%) |
| $10,000 to $24,999 | 27 (20.8%) | 0 (0.0%) |
| $25,000 to $34,999 | 13 (10.0%) | 17 (19.8%) |
| $35,000 to $49,999 | 27 (20.8%) | 17 (19.8%) |
| $50,000 to $74,999 | 29 (22.3%) | 8 (9.3%) |
| $75,000 to $99,999 | 9 (6.9%) | 26 (30.2%) |
| $100,000 to $149,999 | 18 (13.9%) | 6 (7.0%) |
| $150,000 or more | 0 (0.0%) | 9 (10.5%) |
| Total | 130 (100.0%) | 86 (100.0%) |
Property Value to Household Income Ratio in Pomona Park
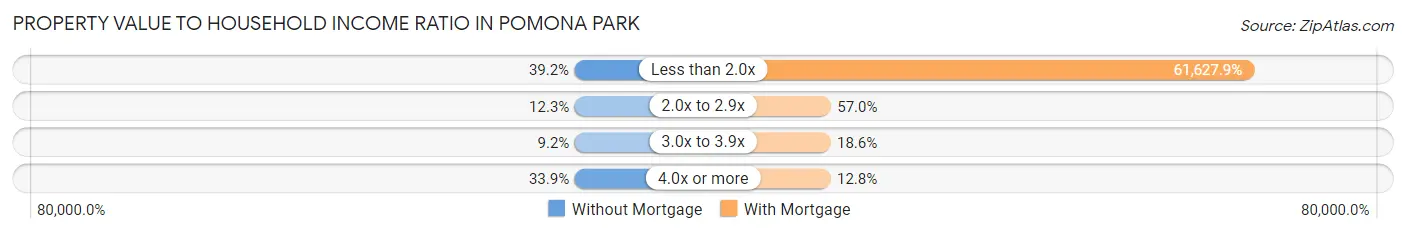
| Value-to-Income Ratio | Without Mortgage | With Mortgage |
| Less than 2.0x | 51 (39.2%) | 53,000 (61,627.9%) |
| 2.0x to 2.9x | 16 (12.3%) | 49 (57.0%) |
| 3.0x to 3.9x | 12 (9.2%) | 16 (18.6%) |
| 4.0x or more | 44 (33.9%) | 11 (12.8%) |
| Total | 130 (100.0%) | 86 (100.0%) |
Real Estate Taxes by Mortgage Status in Pomona Park
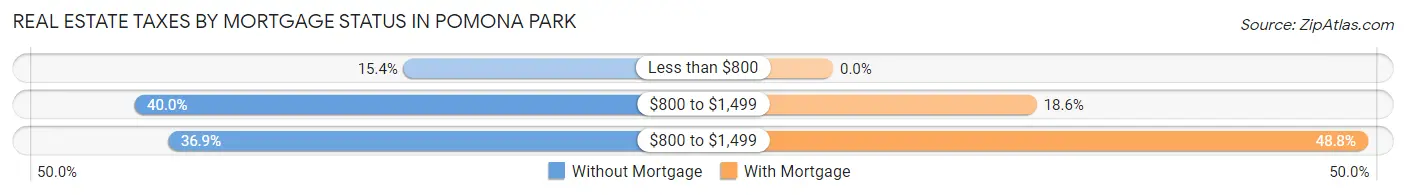
| Property Taxes | Without Mortgage | With Mortgage |
| Less than $800 | 20 (15.4%) | 0 (0.0%) |
| $800 to $1,499 | 52 (40.0%) | 16 (18.6%) |
| $800 to $1,499 | 48 (36.9%) | 42 (48.8%) |
| Total | 130 (100.0%) | 86 (100.0%) |
Health & Disability in Pomona Park
Health Insurance Coverage by Age in Pomona Park
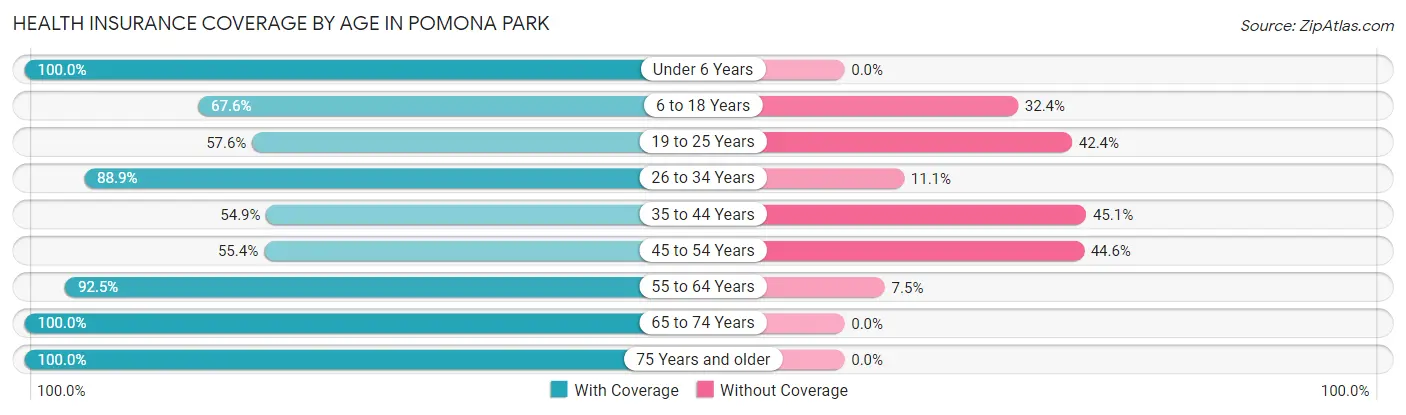
| Age Bracket | With Coverage | Without Coverage |
| Under 6 Years | 63 (100.0%) | 0 (0.0%) |
| 6 to 18 Years | 326 (67.6%) | 156 (32.4%) |
| 19 to 25 Years | 99 (57.6%) | 73 (42.4%) |
| 26 to 34 Years | 88 (88.9%) | 11 (11.1%) |
| 35 to 44 Years | 134 (54.9%) | 110 (45.1%) |
| 45 to 54 Years | 31 (55.4%) | 25 (44.6%) |
| 55 to 64 Years | 135 (92.5%) | 11 (7.5%) |
| 65 to 74 Years | 84 (100.0%) | 0 (0.0%) |
| 75 Years and older | 62 (100.0%) | 0 (0.0%) |
| Total | 1,022 (72.6%) | 386 (27.4%) |
Health Insurance Coverage by Citizenship Status in Pomona Park
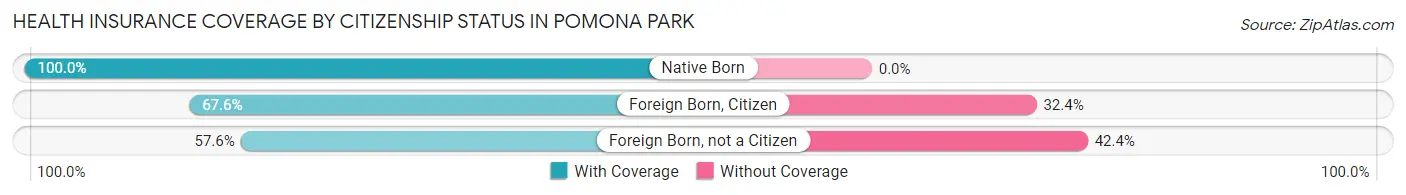
| Citizenship Status | With Coverage | Without Coverage |
| Native Born | 63 (100.0%) | 0 (0.0%) |
| Foreign Born, Citizen | 326 (67.6%) | 156 (32.4%) |
| Foreign Born, not a Citizen | 99 (57.6%) | 73 (42.4%) |
Health Insurance Coverage by Household Income in Pomona Park
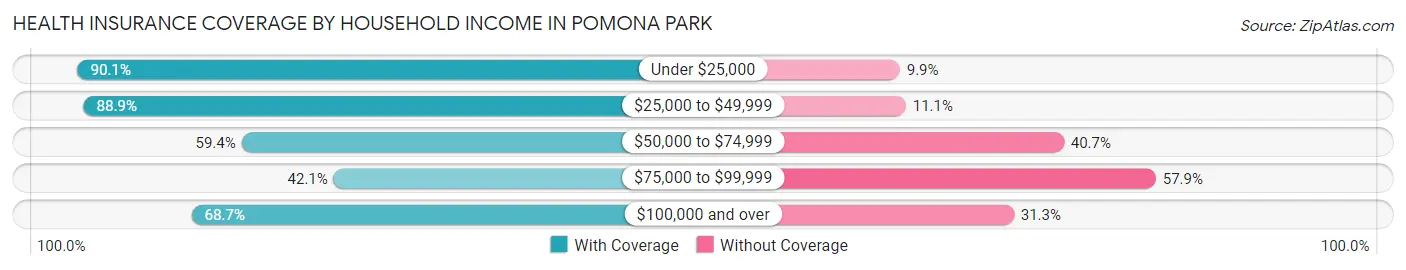
| Household Income | With Coverage | Without Coverage |
| Under $25,000 | 254 (90.1%) | 28 (9.9%) |
| $25,000 to $49,999 | 209 (88.9%) | 26 (11.1%) |
| $50,000 to $74,999 | 219 (59.4%) | 150 (40.6%) |
| $75,000 to $99,999 | 24 (42.1%) | 33 (57.9%) |
| $100,000 and over | 314 (68.7%) | 143 (31.3%) |
Public vs Private Health Insurance Coverage by Age in Pomona Park
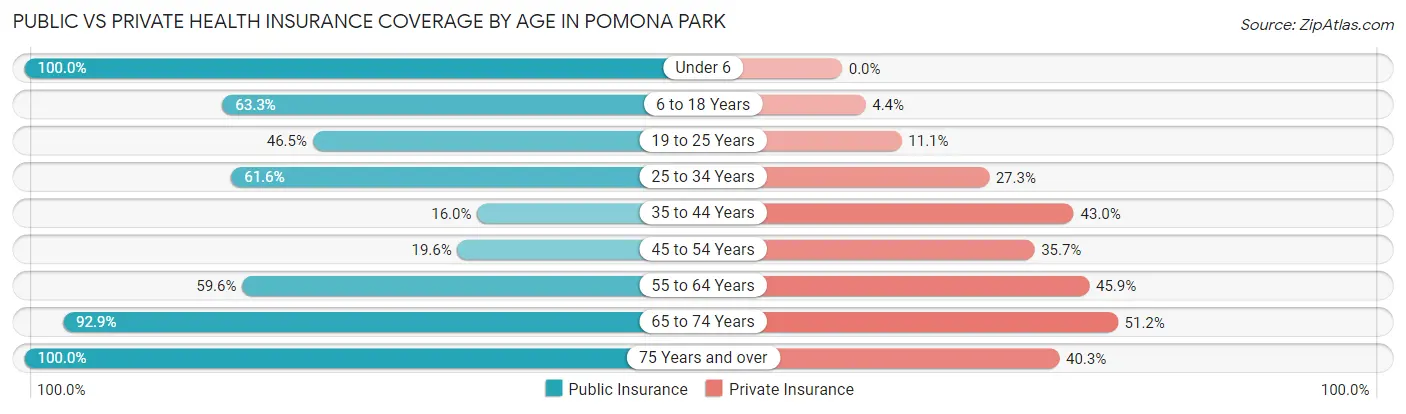
| Age Bracket | Public Insurance | Private Insurance |
| Under 6 | 63 (100.0%) | 0 (0.0%) |
| 6 to 18 Years | 305 (63.3%) | 21 (4.4%) |
| 19 to 25 Years | 80 (46.5%) | 19 (11.1%) |
| 25 to 34 Years | 61 (61.6%) | 27 (27.3%) |
| 35 to 44 Years | 39 (16.0%) | 105 (43.0%) |
| 45 to 54 Years | 11 (19.6%) | 20 (35.7%) |
| 55 to 64 Years | 87 (59.6%) | 67 (45.9%) |
| 65 to 74 Years | 78 (92.9%) | 43 (51.2%) |
| 75 Years and over | 62 (100.0%) | 25 (40.3%) |
| Total | 786 (55.8%) | 327 (23.2%) |
Disability Status by Sex by Age in Pomona Park
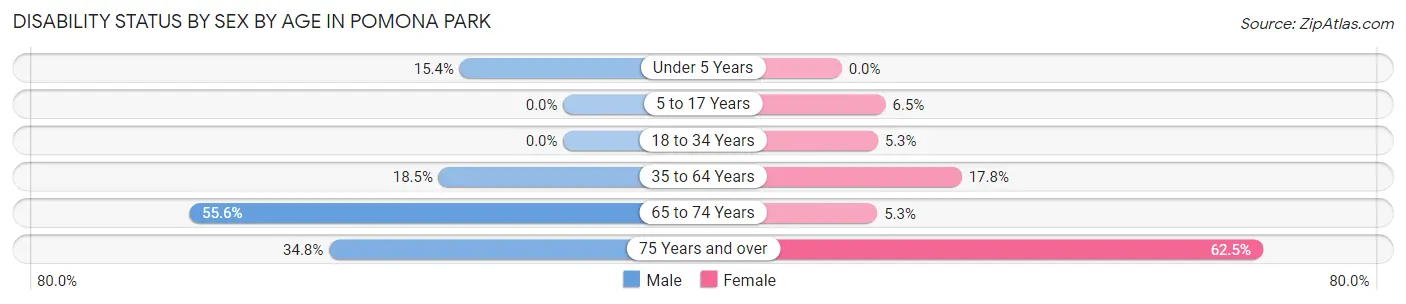
| Age Bracket | Male | Female |
| Under 5 Years | 8 (15.4%) | 0 (0.0%) |
| 5 to 17 Years | 0 (0.0%) | 17 (6.5%) |
| 18 to 34 Years | 0 (0.0%) | 7 (5.3%) |
| 35 to 64 Years | 42 (18.5%) | 39 (17.8%) |
| 65 to 74 Years | 15 (55.6%) | 3 (5.3%) |
| 75 Years and over | 16 (34.8%) | 10 (62.5%) |
Disability Class by Sex by Age in Pomona Park
Disability Class: Hearing Difficulty
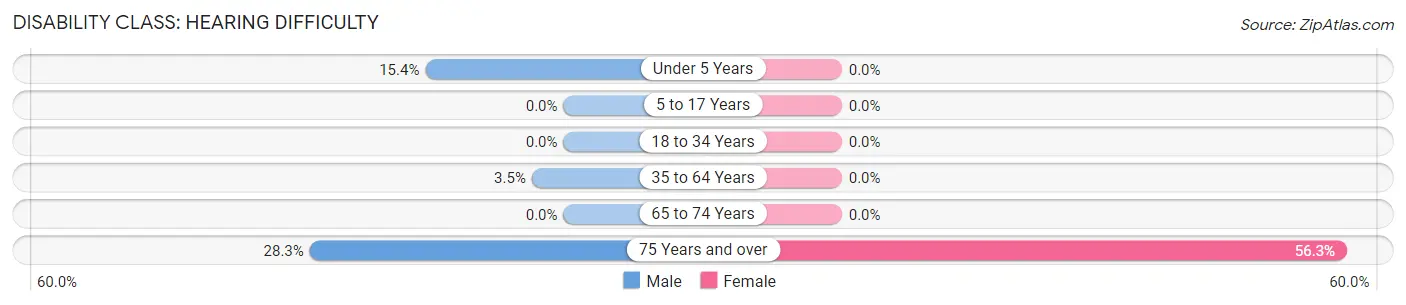
| Age Bracket | Male | Female |
| Under 5 Years | 8 (15.4%) | 0 (0.0%) |
| 5 to 17 Years | 0 (0.0%) | 0 (0.0%) |
| 18 to 34 Years | 0 (0.0%) | 0 (0.0%) |
| 35 to 64 Years | 8 (3.5%) | 0 (0.0%) |
| 65 to 74 Years | 0 (0.0%) | 0 (0.0%) |
| 75 Years and over | 13 (28.3%) | 9 (56.2%) |
Disability Class: Vision Difficulty
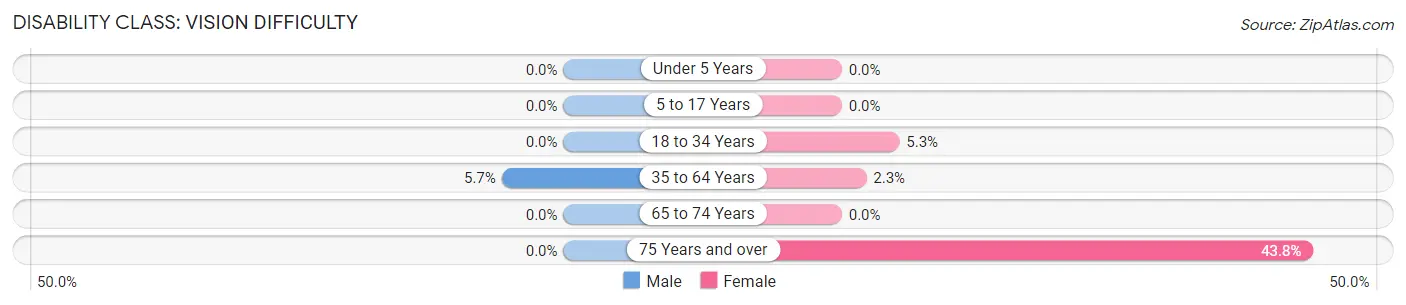
| Age Bracket | Male | Female |
| Under 5 Years | 0 (0.0%) | 0 (0.0%) |
| 5 to 17 Years | 0 (0.0%) | 0 (0.0%) |
| 18 to 34 Years | 0 (0.0%) | 7 (5.3%) |
| 35 to 64 Years | 13 (5.7%) | 5 (2.3%) |
| 65 to 74 Years | 0 (0.0%) | 0 (0.0%) |
| 75 Years and over | 0 (0.0%) | 7 (43.8%) |
Disability Class: Cognitive Difficulty
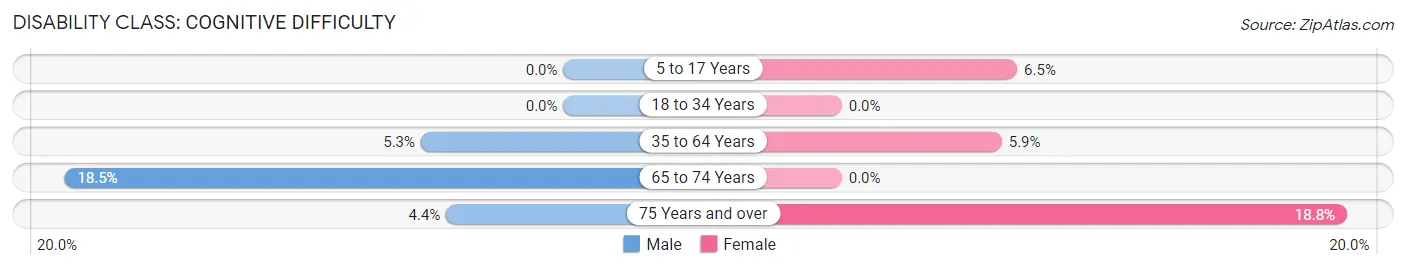
| Age Bracket | Male | Female |
| 5 to 17 Years | 0 (0.0%) | 17 (6.5%) |
| 18 to 34 Years | 0 (0.0%) | 0 (0.0%) |
| 35 to 64 Years | 12 (5.3%) | 13 (5.9%) |
| 65 to 74 Years | 5 (18.5%) | 0 (0.0%) |
| 75 Years and over | 2 (4.3%) | 3 (18.8%) |
Disability Class: Ambulatory Difficulty
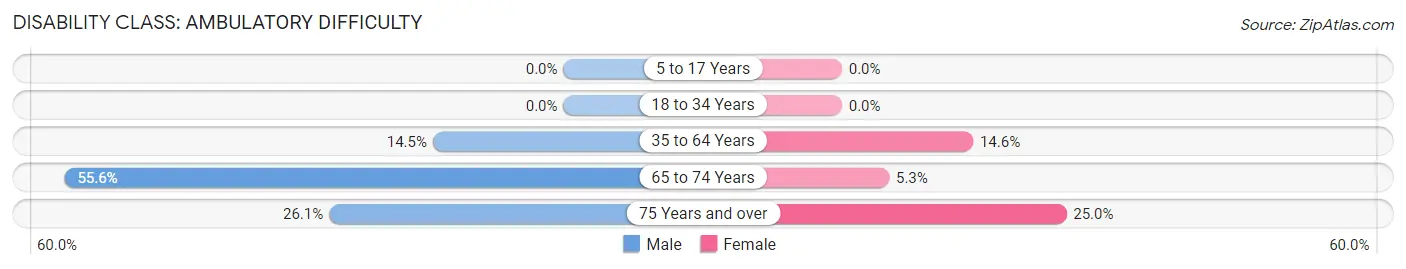
| Age Bracket | Male | Female |
| 5 to 17 Years | 0 (0.0%) | 0 (0.0%) |
| 18 to 34 Years | 0 (0.0%) | 0 (0.0%) |
| 35 to 64 Years | 33 (14.5%) | 32 (14.6%) |
| 65 to 74 Years | 15 (55.6%) | 3 (5.3%) |
| 75 Years and over | 12 (26.1%) | 4 (25.0%) |
Disability Class: Self-Care Difficulty
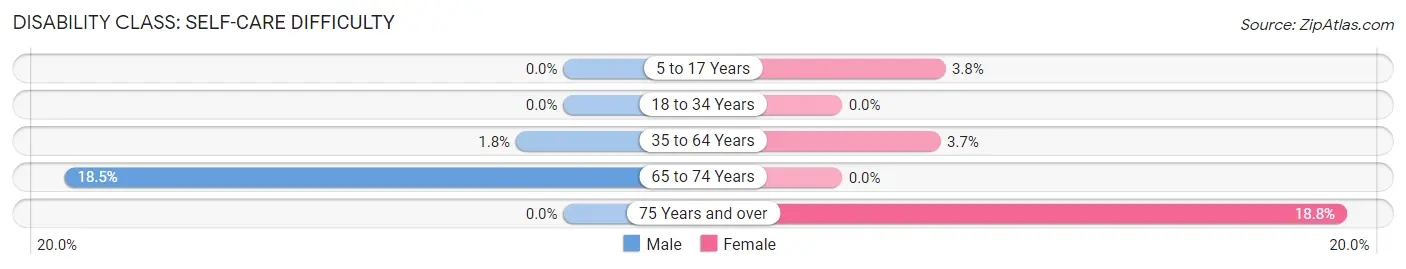
| Age Bracket | Male | Female |
| 5 to 17 Years | 0 (0.0%) | 10 (3.8%) |
| 18 to 34 Years | 0 (0.0%) | 0 (0.0%) |
| 35 to 64 Years | 4 (1.8%) | 8 (3.6%) |
| 65 to 74 Years | 5 (18.5%) | 0 (0.0%) |
| 75 Years and over | 0 (0.0%) | 3 (18.8%) |
Technology Access in Pomona Park
Computing Device Access in Pomona Park

| Device Type | # Households | % Households |
| Desktop or Laptop | 358 | 81.0% |
| Smartphone | 380 | 86.0% |
| Tablet | 236 | 53.4% |
| No Computing Device | 11 | 2.5% |
| Total | 442 | 100.0% |
Internet Access in Pomona Park
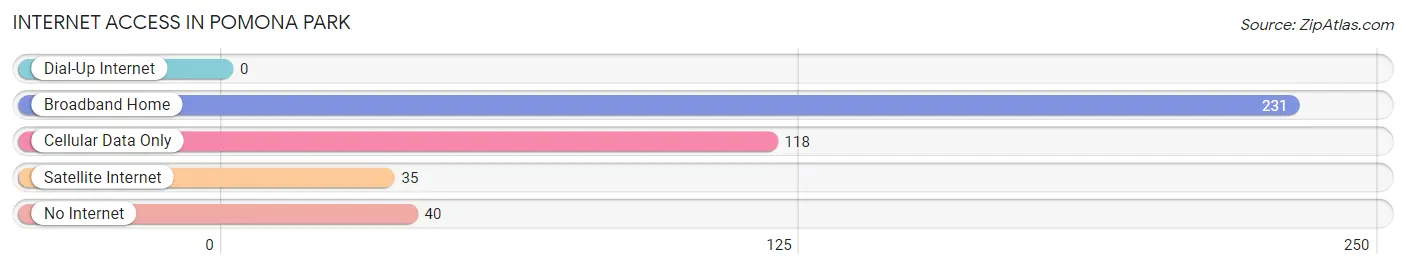
| Internet Type | # Households | % Households |
| Dial-Up Internet | 0 | 0.0% |
| Broadband Home | 231 | 52.3% |
| Cellular Data Only | 118 | 26.7% |
| Satellite Internet | 35 | 7.9% |
| No Internet | 40 | 9.0% |
| Total | 442 | 100.0% |
Pomona Park Summary
Pomona Park is a small unincorporated community located in Putnam County, Florida, United States. It is situated on the banks of the St. Johns River, approximately 20 miles south of Palatka and 25 miles north of Daytona Beach. The population was estimated to be 1,093 in 2019.
History
Pomona Park was founded in 1884 by a group of settlers from the North. The town was named after the Roman goddess of fruit, Pomona. The settlers were attracted to the area by the abundance of citrus groves and the potential for a thriving agricultural industry. The town was incorporated in 1887 and the first post office was established in 1888.
The town grew rapidly in the late 19th century and early 20th century, becoming a popular tourist destination. The town was home to several hotels, a casino, and a racetrack. The town also had a thriving citrus industry, with several packing houses and a cannery.
In the 1920s, the town began to decline as the citrus industry moved elsewhere and the tourist industry declined. The town was hit hard by the Great Depression and many of the businesses closed. The town was further impacted by the construction of the Cross Florida Barge Canal in the 1960s, which diverted the flow of the St. Johns River away from Pomona Park.
Geography
Pomona Park is located in Putnam County, Florida, approximately 20 miles south of Palatka and 25 miles north of Daytona Beach. The town is situated on the banks of the St. Johns River, which flows southward through the town. The town is located in a flat, low-lying area, with an elevation of just 10 feet above sea level.
The town is located in a humid subtropical climate, with hot, humid summers and mild winters. The average annual temperature is 73°F, with an average high of 87°F in the summer and an average low of 59°F in the winter. The average annual precipitation is 51 inches, with most of the rain falling in the summer months.
Economy
Pomona Park’s economy is largely based on agriculture and tourism. The town is home to several citrus groves, as well as a number of small businesses. The town is also home to a number of tourist attractions, including the Pomona Park Speedway, the Pomona Park Marina, and the Pomona Park Golf Course.
Demographics
As of the 2019 census, the population of Pomona Park was estimated to be 1,093. The racial makeup of the town was 79.3% White, 15.2% African American, 0.7% Native American, 0.7% Asian, 0.1% Pacific Islander, and 3.8% from other races. The median household income was $37,917, and the median family income was $45,938. The per capita income was $19,945.
Conclusion
Pomona Park is a small unincorporated community located in Putnam County, Florida. It was founded in 1884 by a group of settlers from the North and was named after the Roman goddess of fruit, Pomona. The town grew rapidly in the late 19th century and early 20th century, becoming a popular tourist destination. The town’s economy is largely based on agriculture and tourism, and the population was estimated to be 1,093 in 2019.
Common Questions
What is Per Capita Income in Pomona Park?
Per Capita income in Pomona Park is $16,681.
What is the Median Family Income in Pomona Park?
Median Family Income in Pomona Park is $63,333.
What is the Median Household income in Pomona Park?
Median Household Income in Pomona Park is $35,000.
What is Income or Wage Gap in Pomona Park?
Income or Wage Gap in Pomona Park is 16.0%.
Women in Pomona Park earn 84.0 cents for every dollar earned by a man.
What is Inequality or Gini Index in Pomona Park?
Inequality or Gini Index in Pomona Park is 0.44.
What is the Total Population of Pomona Park?
Total Population of Pomona Park is 1,408.
What is the Total Male Population of Pomona Park?
Total Male Population of Pomona Park is 717.
What is the Total Female Population of Pomona Park?
Total Female Population of Pomona Park is 691.
What is the Ratio of Males per 100 Females in Pomona Park?
There are 103.76 Males per 100 Females in Pomona Park.
What is the Ratio of Females per 100 Males in Pomona Park?
There are 96.37 Females per 100 Males in Pomona Park.
What is the Median Population Age in Pomona Park?
Median Population Age in Pomona Park is 23.9 Years.
What is the Average Family Size in Pomona Park
Average Family Size in Pomona Park is 4.3 People.
What is the Average Household Size in Pomona Park
Average Household Size in Pomona Park is 3.2 People.
How Large is the Labor Force in Pomona Park?
There are 583 People in the Labor Forcein in Pomona Park.
What is the Percentage of People in the Labor Force in Pomona Park?
60.4% of People are in the Labor Force in Pomona Park.
What is the Unemployment Rate in Pomona Park?
Unemployment Rate in Pomona Park is 11.7%.